Florida KIDS COUNT Data Book,...
192
Florida KIDS COUNT Data Book, 2004 Center for the Study of Children’s Futures Louis de la Parte Florida Mental Health Institute • University of South Florida
Transcript of Florida KIDS COUNT Data Book,...

Florida KIDS COUNT Data Book, 2004
Center for the Study of Children’s FuturesLouis de la Parte Florida Mental Health Institute • University of South Florida

Center for the Study of Children’s Futures,is located at the University of South Florida’s Louis de laParte Florida Mental Health Institute. The mission of theCenter is to promote the health and well-being ofFlorida’s children and their families through datacollection, research, policy development, and communityinvolvement. The Center is dedicated to maintaining arepository of statistical data and program activities,developing informative products for dissemination, andproviding technical assistance, education andconsultation services to our communities across Floridaand the nation. The Center efforts continue to focus onchild, family and community indicator development,issues of special interest, and state, local and nationaltrends. One of the Center’s major efforts isFlorida KIDS COUNT , currently in its thirteenth year atthe University of South Florida in Tampa. The Annie E.Casey Foundation supports a network of KIDS COUNTprojects in 50 states, the District of Columbia, PuertoRico, and the U.S. Virgin Islands. The KC Networkstrives to raise public awareness, accountability, andpromote policy to improve the lives of children andfamilies.
Susan L. Weitzel, DirectorCindi C. Shockley, CoordinatorCindy S. McCann, Assistant
Department of Child and Family Studies,one of three academic departments at the Louis de la ParteFlorida Mental Health Institute, is currently host to threefederally-funded national centers. The Department strivesto enhance the well-being of children and families througha variety of knowledge development and knowledge baseddissemination activities. The primary focus of theDepartment is on children with emotional disturbances andtheir families, children with autism and otherdevelopmental disabilities, preschool children, andchildren who have been abused and/or neglected.
Louis de la Parte Florida Mental Health Institute,at the University of South Florida, is a multidisciplinaryresearch and training institute dedicated to improvingbehavioral health services through research, evaluation,consultation, policy analysis and professional education.The Institute continues its mission to strengthen mentalhealth services throughout the state and seeks to increaseAmericans’ awareness of issues in mental health andimprove the formulation and implimentation of publicpolicy.
University of South Florida,established in 1956, is a multi-campus national researchuniversity that supports the development of themetropolitan Tampa Bay Region, Florida, the UnitedStates and the world. Building on unique strengthsinherent in Florida’s population, location, and naturalresources, the university is dedicated to excellence inteaching and lifelong learning in a student-centeredenvironment; research to advance knowledge and promotesocial, cultural, economic, health and technologicaldevelopment; service based on academic excellence andthe ethic of community responsibility; and communityengagement to build university-community partnershipsand collaborations.
Center for the Study of Children’s FuturesDepartment of Child and Family StudiesLouis de la Parte Florida Mental Health InstituteUniversity of South Florida
13301 Bruce B. Downs Blvd., MHC 2502Tampa, Florida 33612
(813) 974-7411FAX (813) [email protected]

Florida KIDS COUNT Data Book, 2004
The Annie E. Casey Foundation provides partial fundingfor the Florida KIDS COUNT efforts through a grant tothe University of South Florida. We thank them for theirsupport and acknowledge that the content of this reportdoes not necessarily reflect the opinions of the Foundation.

About this Publication
This data book has been designed to provide a baseline of informationdescribing the lives of children and their families in Florida. Our purposewas to provide a general profile of the conditions facing families withineach county and create a comprehensive reference tool. National andspecific state demographic data are displayed to aid in understanding thecontext of Florida to our nation, and projections are included to assist inproviding a glimpse into our future. Topics include population, livingarrangements, race and Hispanic origin, income factors, and multi-yeartrend data using traditional indicators of well-being for each of 67counties in Florida. Other represented data consists of educational,behavioral health, juvenile justice and child care services and programs.
These identified factors contribute to the overall productivity and successof our citizens. Understanding that these are the circumstances thatcharacterize our neighborhoods, cities, and townships can provide insightto targeting our policy and data driven efforts for our state as a whole andwithin the auspices of each geographic area. The decennial Census hashistorically provided a unique vehicle for exploring our surroundings, theenvironment affecting our strengths and weaknesses. The statisticsderived from Census 2000 are the primary source of data for thispublication.
The importance of figures obtained from state level sources withinFlorida is equally significant. We encourage and support statewide effortsto continue to improve essential collection of information that aids inprogram decision-making, system development and providesmechanisms to measure targeted goals and outcomes. We hope that youwill benefit from our activities and encourage you to contact us withquestions or comments to assist us in understanding and improving thestatus of children and families in our communities.
Data Sources and ContactsMary Lou CarothersChoice Office - Home EducationFlorida Department of Education
Tim CenterOffice of Prevention and Victims ServicesFlorida Department of Juvenile Justice
Cathy CrossEducation Information and Accountability ServicesFlorida Department of Education
Kathleen DaileyPolicy and Services Research Data CenterLouis de la Parte Florida Mental Health InstituteUniversity of South Florida
David DouglassOffice of Residential and Correctional FacilitiesFlorida Department of Juvenile Justice
Nathan EppsBureau of Data and ResearchFlorida Department of Juvenile Justice
Virginia FreemanOffice of Detention ServicesFlorida Department of Juvenile Justice
Paul HatcherOffice of Probation and Community CorrectionsFlorida Department of Juvenile Justice
Gina KinchlowFlorida Children’s Forum
Felipe LuacesOffice of Vital StatisticsFlorida Department of Health
Kathy McCharenOffice of Economic and Demographic ResearchThe Florida Legislature
Brenda ParksChoice Office - Non-Public SchoolsFlorida Department of Education
Kerri RiversPopulation Reference BureauWashington, D.C.
U.S. Census BureauDepartment of CommerceWashington, D.C.

About the Census
The first annual census was in 1790 and 3.9 million people were identified. Census 2000, taken April 1, 2000, counted 281.4 millionpeople in the 50 states and the District of Columbia. Two instruments were utilized. The short form questionnaire included sevenquestions for each household; these were name, sex, age, relationship, Hispanic or Latino origin, race, and whether or not a housingunit was owned or rented. In addition, about 17 percent of the households (one in every six) received a longer questionnaire thatfocused on social and economic population characteristics and physical and financial housing characteristics. Examples of sample datafrom the long form are ancestry, income, housing, labor force, education, and language. Census 2000 sampled the socio-economicstatus of the population, providing a tool for government, educators, business owners, and others to get a snapshot of the state of thenation. Race categories were defined differently in Census 1990 and 2000 and therefore cannot be compared.
The summary files utilized in this publication are defined in the Glossary. However, there are some important features that need claritywhen interpreting this data and other findings. Summary Files 1 and 2 were based on full counts and the data contained in SummaryFiles 3 and 4 were derived from sample data. Data are weighted to reflect a close estimate of the full count and base populations differacross summary files and variables. Census geography provides the framework for interpreting, analyzing and understanding censusdata. The Census Bureau classifies all geographic entities into two broad categories: legal and administrative entities and statisticalentities. For more information about Census 2000 visit their website at www.census.gov.
Notes About Responsible Data Use
• analyzing data trends - definitions, formulae, and methodology often change while the name of thevariable does not
• determine size of universe or sample - rates and ratios based on small numbers can be misleading
• note the time frame of data - calendar year, fiscal year, or specific point in time
• recognize content relationships between variables
• stating outcomes and conclusions - claiming credit, casting blame, or identifying program success canbe misleading without experimental evidence
• utilize precise definitions - variables may appear similar but have distinct differences
• clearly label all graphic presentation
• determine effects of unusual or historical events
• note sources of data - original reporting source, secondary source
• remember, this data represents our children and families and may affect decisions about their lives


Table of Contents
Census 2000: A Closer Look At Florida 9Population 10Race and Hispanic Origin 20Living Arrangements 26
Florida and County Profiles 33Florida Profile 34County Profiles (in alphabetical order) 36
Glossary 173


“Not everything thatcounts can be counted,and not everything thatcan be counted counts.”
-Albert Einstein

8Center for the Study of Children’s Futures 2004

9 Center for the Study of Children’s Futures 2004
SantaSantaRosaRosa
WaltonWalton
HendryHendry
GladesGlades
CollierCollier
LeeLee
CharlotteCharlotte
HolmesoHolmesHolmessHolmes
GulfGulf
JacksonJackson
BakerBaker DuvalDuval
ClayClay
HamiltonHamilton
SuwaneeSuwanee
LafayetteLafayette
DixieDixie PutnamttuutnaPutnammPutnamAlachuaAlachua
LevyLevy
GadsdenGadsden
LeonLeon
LibertyLiberty
FranklinFranklin
WakullaWakullaTaylorTaylor
MadisonMadison
Palm BeachPalm Beach
BrowardBroward
PascoPasco
PinellasPinellas
IndianIndianRiverRiver
St. LucieSt. Lucie
MartinMartin
PolkPolk
HighlandsHighlands
HardeeHardee
VolusiaVolusiaMarionMarion
LakeLakeCitrusCitrus
HernandoHernando
SeminoleSeminole
OsceolaOsceola
OrangeOrange
DeSotoDeSotoSarasotaSarasota
Miami-DadeMiami-Dade
HillsboroughHillsborough
ManateeManatee
MonroeMonroe
BrevardBrevard
OkeechobeeOkeechobee
SumterSumter
FlaglerFlagler
UnionUnion
Colum
bia
Colum
bia
NassauNassau
St.St.JohnsJohns
Jeffe
rson
Jeffe
rson
Escam
bia
Escam
bia
OkaloosaOkaloosa
CalhounCalhoualhounnCalhoun
Census 2000: A Closer Look At Florida
PopulationRace and Hispanic OriginLiving Arrangements

10Center for the Study of Children’s Futures 2004
Population
Florida Population by County, 2000
500,000 to 2,253,362
250,000 to 499,999
100,000 to 249,999
25,000 to 99,999
7,021 to 24,999
U.S. Population by State, 2000
10,000,000 to 33,871,648
5,000,000 to 9,999,999
1,000,000 to 4,999,999
493,782 to 999,999
Number ofCounties
Florida County DistributionTotal Population, 2000
1,000,000 to 2,253,362 3
500,000 to 999,999 4
250,000 to 499,999 11
100,000 to 249,999 15
50,000 to 99,999 6
25,000 to 49,999 11
10,000 to 24,999 15
7,021 to 9,999 2
Population
Source: U.S. Census Bureau,Census 2000 SF1, Table P1
Source: U.S. Census BureauCensus 2000 SF1, Table P1
Source: U.S. Census Bureau, Census 2000 SF1, Table P1

11 Center for the Study of Children’s Futures 2004
Population
Florida Population, 1950 to 2000and Projections, 2010 and 2020
1950 1960 1970 1980 1990 2000 2010 2020
25,000,000
20,000,000
15,000,000
10,000,000
5,000,000
0
United States 13.2 281,421,906 32,712,033
Nevada 66.3 1,998,275 796,424 13
Arizona 40.0 5,130,632 1,465,404 5
Colorado 30.6 4,301,261 1,006,867 8
Utah 29.6 2,233,169 510,319 21
Idaho 28.5 1,293,953 287,204 32
Georgia 26.4 8,186,453 1,708,237 4
Florida 23.5 15,982,378 3,044,452 3
Texas 22.8 20,851,820 3,865,310 2
North Carolina 21.4 8,049,313 1,420,676 6
Washington 21.1 5,894,121 1,027,429 7
Growth for the Ten States with the GreatestPercent Change in Population, 1990 to 2000
Percent Total Difference Rank ofChange Population in Number Numerical
1990 to 2000 2000 1990 to 2000 Change
Source: Office of Economic and Demographic Research, The Florida LegislatureFlorida Demographic Estimating Conference Database, updated September 2003
Source: U.S. Census Bureau, Census 2000 SF1,Table P1 and Census 1990 STF1, Table P001

12Center for the Study of Children’s Futures 2004
Lafayette 25.9 1,444 67Martin 25.6 25,831 30Indian River 25.2 22,739 32Manatee 24.7 52,295 18Leon 24.4 46,959 20Washington 24.0 4,054 50Franklin 23.3 2,090 61Pasco 22.6 63,634 16Hamilton 21.9 2,397 58Okeechobee 21.2 6,283 46Baker 20.4 3,773 52Alachua 20.0 36,359 23Hillsborough 19.8 164,894 5Volusia 19.6 72,631 12Polk 19.4 78,542 9Brevard 19.4 77,252 11Okaloosa 18.6 26,722 29Calhoun 18.2 2,006 62Holmes 17.7 2,786 57Sarasota 17.3 48,181 19Bay 16.7 21,223 34Miami-Dade 16.3 316,268 2Gulf 15.9 1,828 63Bradford 15.9 3,573 53Duval 15.7 105,908 6Jefferson 14.2 1,606 64Madison 13.1 2,164 59Jackson 13.0 5,380 47Taylor 12.5 2,145 60Escambia 12.0 31,612 26Gadsden 9.7 3,982 51Putnam 8.2 5,353 48Pinellas 8.2 69,823 13Monroe 2.0 1,565 65
Population Growth for each Florida County, 1990 to 2000
Florida 23.5 3,044,452Flagler 73.6 21,131 35Sumter 68.9 21,768 33Collier 65.3 99,278 8Wakulla 61.0 8,661 41Osceola 60.1 64,765 14Gilchrist 49.3 4,770 49St. Johns 46.9 39,306 22Walton 46.3 12,841 39Santa Rosa 44.3 36,135 24Hendry 40.5 10,437 40Glades 39.3 2,985 56Lake 38.4 58,424 17Hardee 38.2 7,439 45DeSoto 35.0 8,344 43Levy 32.9 8,527 42Marion 32.9 64,083 15Clay 32.9 34,828 25Columbia 32.6 13,900 37Orange 32.3 218,853 4Lee 31.6 105,775 7Nassau 31.2 13,722 38Union 31.1 3,190 55Palm Beach 31.0 267,666 3Dixie 30.6 3,242 54Suwannee 30.1 8,064 44Hernando 29.4 29,687 28Broward 29.3 367,530 1St. Lucie 28.3 42,524 21Highlands 27.7 18,934 36Charlotte 27.6 30,652 27Seminole 27.0 77,667 10Citrus 26.3 24,570 31Liberty 26.1 1,452 66
Differencein Number
Rank ofNumerical
ChangePercentChange
Differencein Number
Rank ofNumerical
ChangePercentChange
Percent Change in Florida Population by County, 1990 to 2000
50.0 to 73.6
25.0 to 49.9
15.0 to 24.9
2.0 to 14.9
Source: U.S. Census Bureau,Census 2000 SF1, Table P1and Census 1990 STF1, Table P001
Source: U.S. Census Bureau, Census 2000 SF1, Table P1 and Census 1990 STF1, Table P001
Population

13 Center for the Study of Children’s Futures 2004
Florida 3,646,340Alachua 43,938Baker 6,118Bay 35,642Bradford 5,725Brevard 104,699Broward 382,929Calhoun 3,021Charlotte 22,186Citrus 20,330Clay 39,385Collier 49,941Columbia 14,337Miami-Dade 559,213DeSoto 7,310Dixie 3,055Duval 204,991Escambia 69,271Flagler 8,925Franklin 1,989Gadsden 11,919Gilchrist 3,529Glades 2,337Gulf 2,895Hamilton 3,137Hardee 7,435Hendry 10,874Hernando 24,726Highlands 16,744Hillsborough 253,138Holmes 4,285Indian River 21,694Jackson 10,449Jefferson 2,930
Lafayette 1,523Lake 42,719Lee 86,388Leon 51,007Levy 8,131Liberty 1,531Madison 4,736Manatee 54,647Marion 55,425Martin 23,623Monroe 13,605Nassau 14,439Okaloosa 42,133Okeechobee 9,051Orange 226,340Osceola 46,214Palm Beach 240,458Pasco 69,514Pinellas 177,533Polk 118,205Putnam 17,304St. Johns 28,399St. Lucie 43,583Santa Rosa 31,269Sarasota 52,827Seminole 92,606Sumter 8,570Suwannee 8,369Taylor 4,731Union 2,937Volusia 89,862Wakulla 5,864Walton 8,795Washington 4,905
Florida Children Under Age 18 by County, 2000
Under Age 18 22.8%
3,646,340
Age 5 - 91,031,718
Age 10 - 141,057,024
Age 15 - 17611,775
Age 18 - 445,899,949
Age 65 and Over2,807,597
Age 45 - 643,628,492
Age 0 - 4945,823
N = 15,982,378
Florida Population by Age Group, 2000
36.9%
22.7%
17.6% 5.9%
6.5%
6.6%
3.8%
Under Age 18 25.7%
72,293,812
Age 5 - 920,549,505
Age 10 - 1420,528,072
Age 15 - 1712,040,437
Age 18 - 44112,183,705
Age 65 and Over34,991,753
Age 45 - 6461,952,636
Age 0 - 419,175,798
N = 281,421,906
U.S. Population by Age Group, 2000
12.4%
22.0%
39.9%
6.8% 7.3%
7.3%
4.3%
Source: U.S. Census Bureau,Census 2000 SF1, Tables QT-P1 and QT-P2
Source: U.S. Census Bureau,Census 2000 SF1, Tables QT-P1 and QT-P2
Source: U.S. Census Bureau, Census 2000 SF1, Table QT-P1
Population

14Center for the Study of Children’s Futures 2004
Percent Child Population Under Age 18within each Florida County, 2000
Population Number of Under Age 18 Counties
Florida County DistributionChild Population, 2000
Source: U.S. Census Bureau, Census 2000 SF1, Table QT-P1
Source: U.S. Census Bureau,Census 2000 SF1, Table QT-P1
Source: U.S. Census Bureau, Census 2000 SF1, Table QT-P1 and Census 1990 STF1, Table QT-P1A
Growth for the Ten States with the Greatest PercentChange in Child Population Under Age 18, 1990 to 2000
Percent Total Child Difference Rank ofChange Population in Number Numerical
1990 to 2000 2000 1990 to 2000 Change
United States 13.7 72,293,812 8,689,380
Nevada 72.4 511,799 214,851 13
Arizona 39.3 1,366,947 385,828 6
Colorado 27.8 1,100,795 239,529 11
Florida 27.2 3,646,340 780,103 3
Georgia 25.6 2,169,234 441,931 4
North Carolina 22.3 1,964,047 357,898 7
Texas 21.7 5,886,759 1,050,920 2
Washington 20.0 1,513,843 252,456 10
Idaho 19.7 369,030 60,625 30
California 19.3 9,249,829 1,499,104 1
Population
25.0 to 30.0
20.0 to 24.9
15.7 to 19.9
250,000 to 559,213 3
100,000 to 249,999 6
50,000 to 99,999 9
25,000 to 49,999 10
10,000 to 24,999 13
5,000 to 9,999 11
1,523 to 4,999 15

15 Center for the Study of Children’s Futures 2004
Population
Percent Change in Florida Child PopulationUnder Age 18, 1990 to 2000
50.0 to 70.2
25.0 to 49.9
0.4 to 24.9
Decrease
Florida 27.2 780,103Osceola 70.2 19,065 13Collier 64.6 19,601 11Flagler 62.9 3,446 33St. Johns 52.4 9,766 19Broward 49.2 126,311 1Wakulla 45.9 1,844 41Gilchrist 45.7 1,107 46Palm Beach 41.8 70,905 3Lake 41.2 12,456 17Santa Rosa 41.0 9,095 21Orange 40.2 64,854 4Pasco 38.4 19,291 12Hendry 34.6 2,796 36Manatee 34.5 14,031 16Walton 33.4 2,201 39Martin 33.2 5,885 26Hernando 32.6 6,078 25Lee 31.7 20,818 8Hardee 30.7 1,747 42Highlands 30.6 3,926 31Levy 29.5 1,852 40DeSoto 29.0 1,644 43Clay 29.0 8,851 23Marion 28.6 12,333 18Charlotte 28.3 4,898 27Seminole 27.0 19,699 10Glades 25.9 481 51St. Lucie 25.9 8,961 22Hillsborough 25.1 50,864 5Indian River 24.1 4,208 30Citrus 23.5 3,864 32Volusia 23.1 16,839 15Sumter 22.3 1,565 44
Child Population Change for each Florida County, 1990 to 2000
Nassau 21.3 2,535 37Polk 20.9 20,463 9Sarasota 20.9 9,116 20Columbia 20.5 2,436 38Brevard 19.7 17,245 14Miami-Dade 19.5 91,203 2Leon 18.3 7,882 24Dixie 18.0 467 52Suwannee 17.9 1,271 45Duval 17.6 30,645 6Pinellas 17.2 26,077 7Washington 14.9 635 49Liberty 13.6 183 56Okaloosa 12.9 4,818 28Okeechobee 12.4 1,001 47Union 11.5 302 55Alachua 11.2 4,423 29Bay 10.5 3,393 34Lafayette 10.4 143 60Holmes 9.3 364 53Baker 8.6 487 50Bradford 5.9 319 54Calhoun 5.2 150 59Putnam 4.6 762 48Escambia 4.4 2,891 35Madison 3.9 176 57Gulf 2.6 72 61Jackson 1.7 170 58Monroe 0.4 50 62Hamilton -0.6 -19 63Taylor -1.9 -92 64Gadsden -2.0 -245 66Franklin -7.6 -164 65Jefferson -10.3 -338 67
Differencein Number
Rank ofNumerical
ChangePercentChange
Differencein Number
Rank ofNumerical
ChangePercentChange
Source: U.S. Census Bureau, Census 2000 SF1, Table QT-P1 and Census 1990 STF1, Table QT-P1A
Source: U.S. Census Bureau,Census 2000 SF1, Table QT-P1and Census 1990 STF1, Table QT-P1A

16Center for the Study of Children’s Futures 2004
Source: Office of Economic and Demographic Research, The Florida LegislatureFlorida Demographic Estimating Conference Database, updated September 2003
Age 0 - 4 16,348,254 18,757,647 14.7 19,175,798 2.2
Age 5 - 9 16,699,956 18,034,778 8.0 20,549,505 13.9
Age 10 - 14 18,242,129 17,060,469 -6.5 20,528,072 20.3
Age 15 - 17 12,464,621 10,070,823 -19.2 12,040,437 19.6
Age 18 - 19 8,703,503 7,810,888 -10.3 8,179,453 4.7
Age 20 - 24 21,318,704 19,131,578 -10.3 18,964,001 -0.9
U.S. Population by Young Age Group, 1980, 1990 and 2000
1980 1990 2000Number Number NumberPercent Percent
Change Change
Source: U.S. Census Bureau, Census 2000 SF1, Table QT-P2U.S. Census Bureau 1980 and 1990 population estimates
Population
Percent Percent Percent PercentChange Change Change Change
Number Number Number Number Number1980 1990 2000 2010 2020
Age 0 - 4 570,247 873,033 53.1 945,823 8.3 1,111,782 17.5 1,240,341 11.6
Age 5 - 9 621,565 809,316 30.2 1,031,718 27.5 1,100,732 6.7 1,238,414 12.5
Age 10 - 14 685,048 746,353 8.9 1,057,024 41.6 1,089,474 3.1 1,219,709 12.0
Age 15 - 17 482,909 455,165 -5.7 612,206 34.5 721,483 17.8 742,363 2.9
Age 18 - 19 328,473 348,626 6.1 401,861 15.3 471,976 17.4 486,653 3.1
Age 20 - 24 811,469 878,855 8.3 928,310 5.6 1,225,903 32.1 1,253,984 2.3
Florida Population by Young Age Group, 1980, 1990 and 2000with Population Projections for 2010 and 2020

17 Center for the Study of Children’s Futures 2004
Child Population for each Florida County by Young Age Group, 2000
Florida 945,823 1,031,718 1,057,024 611,775Alachua 11,161 12,089 12,937 7,751Baker 1,561 1,615 1,834 1,108Bay 8,979 10,103 10,331 6,229Bradford 1,444 1,540 1,664 1,077Brevard 24,707 29,546 31,999 18,447Broward 103,041 110,142 109,132 60,614Calhoun 767 772 914 568Charlotte 5,254 6,119 6,761 4,052Citrus 4,469 5,540 6,477 3,844Clay 9,229 10,993 12,079 7,084Collier 13,441 14,444 13,677 8,379Columbia 3,628 3,928 4,152 2,629Miami-Dade 145,752 157,871 160,754 94,836DeSoto 1,873 1,944 2,115 1,378Dixie 770 819 871 595Duval 56,247 57,959 57,826 32,959Escambia 17,913 19,513 20,020 11,825Flagler 2,058 2,381 2,819 1,667Franklin 509 516 619 345Gadsden 3,018 3,323 3,440 2,138Gilchrist 827 975 1,077 650Glades 618 655 653 411Gulf 674 807 870 544Hamilton 840 821 888 588Hardee 2,065 2,009 2,073 1,288Hendry 2,826 3,026 3,103 1,919Hernando 5,905 6,811 7,532 4,478Highlands 4,210 4,610 4,814 3,110Hillsborough 68,444 72,849 71,261 40,584Holmes 1,028 1,191 1,269 797Indian River 5,259 6,020 6,398 4,017Jackson 2,558 2,852 2,909 2,130Jefferson 682 805 874 569
Lafayette 389 431 420 283Lake 10,993 12,277 12,484 6,965Lee 22,970 24,224 25,034 14,160Leon 13,727 14,158 14,407 8,715Levy 1,975 2,228 2,392 1,536Liberty 384 414 437 296Madison 1,074 1,217 1,465 980Manatee 14,902 15,411 15,625 8,709Marion 13,488 15,313 16,756 9,868Martin 5,599 6,804 7,188 4,032Monroe 3,462 3,802 4,003 2,338Nassau 3,565 3,908 4,435 2,531Okaloosa 10,843 11,599 12,223 7,468Okeechobee 2,255 2,460 2,584 1,752Orange 61,375 65,241 63,672 36,052Osceola 11,720 13,213 13,442 7,839Palm Beach 62,913 68,647 70,155 38,743Pasco 18,134 19,713 20,371 11,296Pinellas 45,354 50,785 51,675 29,719Polk 31,186 33,184 33,853 19,982Putnam 4,326 4,890 5,123 2,965St. Johns 6,606 8,055 8,811 4,927St. Lucie 10,750 12,420 13,142 7,271Santa Rosa 7,700 8,389 9,592 5,588Sarasota 12,797 14,867 16,021 9,142Seminole 23,062 26,208 27,571 15,765Sumter 2,108 2,423 2,463 1,576Suwannee 2,099 2,315 2,358 1,597Taylor 1,139 1,289 1,437 866Union 737 757 875 568Volusia 21,657 25,068 27,076 16,061Wakulla 1,352 1,561 1,851 1,100Walton 2,158 2,520 2,560 1,557Washington 1,267 1,339 1,381 918
Age 0 - 4 Age 5 - 9 Age 10 - 14 Age 15 - 17 Age 0 - 4 Age 5 - 9 Age 10 - 14 Age 15 - 17
Source: U.S. Census Bureau, Census 2000 SF1, Table QT-P2
Population

18Center for the Study of Children’s Futures 2004
Percent Change in Florida Child PopulationAge 0 - 4 by County, 1990 to 2000
25.0 to 48.2
0.0 to 24.9
-22.6 to -0.1Percent Change in Florida Child Population
Age 5 - 9 by County, 1990 to 2000
50.0 to 71.7
25.0 to 49.9
0.0 to 24.9
-15.4 to -0.1
1990 2000
Age 0 - 4 849,596 945,823 11.3
Age 5 - 9 814,118 1,031,718 26.7
Age 0 - 9 1,663,714 1,977,541 18.9
Age 10 - 14 748,355 1,057,024 41.2
Age 15 - 17 454,168 611,775 34.7
Age 5 - 17 2,016,641 2,700,517 33.9
Age 10 - 17 1,202,523 1,668,799 38.8
Percent Change in Florida’s ChildPopulation by Age Group, 1990 to 2000
PercentChange
Source: U.S. Census Bureau, Census 2000 SF1,Table QT-P2 and Census 1990 STF1, Table QT-P1A
Source: U.S. Census Bureau, Census 2000, SF1Table QT-P2 and Census 1990, STF1 Table QT-P1A
Source: U.S. Census Bureau, Census 2000 SF1,Table QT-P2 and Census 1990 STF1, Table QT-P1A
Population

19 Center for the Study of Children’s Futures 2004
Percent Change in Florida Child PopulationAge 10 - 14 by County, 1990 to 2000
50.0 to 83.5
25.0 to 49.9
0.0 to 24.9
-9.6 to -0.1
Florida County DistributionPercent Change in Child Populationfor Young Age Group, 1990 to 2000
Percent Change Number of CountiesAge Age Age Age0 - 4 5 - 9 10 - 14 15 - 17
50.0 and Greater 0 5 14 9
25.0 to 49.9 10 17 27 34
0.0 to 24.9 42 34 23 22
Decrease 15 11 3 2
Source: U.S. Census Bureau, Census 2000 SF1,Table QT-P2 and Census 1990 STF1, Table QT-P1A
Source: U.S. Census Bureau, Census 2000 SF1,Table QT-P2 and Census 1990 STF1, Table QT-P1A
Percent Change in Florida Child PopulationAge 15 - 17 by County, 1990 to 2000
50.0 to 85.8
25.0 to 49.9
0.0 to 24.9
-8.7 to -0.1*cohort size less than other age groups
Source: U.S. Census Bureau, Census 2000 SF1,Table QT-P2 and Census 1990 STF1, Table QT-P1A
Population
*

20Center for the Study of Children’s Futures 2004
Percent of United States Populationby Race, 2000
Total Under Age 18(N=281,421,906) (N=72,293,812)
White Alone
Black Alone
Asian Alone
Some Other Race Alone
Two or More Races
American Indian or Alaska Native Alone
Native Hawaiian or Other Pacific Islander Alone
Percent of Hispanic Populationto Total Population, 2000
25
20
15
10
5
0
16.8 17.1
12.6
19.3
Per
cent
TotalPopulation
UnderAge 18
FLUS
Florida Population by Race Category, 2000
Amer
ican
India
n
or A
laska
Nat
ive
Hawaii
an o
r Oth
er
Pacific
Islan
der
Percent of Florida Child Population withinRace and within Hispanic Origin, 2000
Whit
e
Black o
r
Africa
n Am
erica
nAsia
n
Some
Other
Rac
e
Two
or M
ore
Races
Hispan
ic or
Latin
o Any
Rac
e
Per
cent
50
25
0
26.2
34.933.1
26.423.3
26.1
20.1
33.2
Two or More Races (2.4%)
TotalPopulation
N=15,982,378
White(78.0%)
Black or African American (14.6%)
American Indian or Alaska Native (0.3%)Asian (1.7%)Native Hawaiian or Other Pacific Islander (0.1%)Some Other Race (3.0%)
PopulationUnder Age 18
N=3,646,340
White(68.7%)
Two or More Races (3.6%)
Black or African American (21.2%)
American Indian or Alaska Native (0.4%)Asian (1.7%)Native Hawaiian or Other Pacific Islander (0.1%)
Some Other Race (4.3%)
Source: U.S. Census Bureau,Census 2000 SF1, Table P7
Source: U.S. Census Bureau,Census 2000 SF1, Tables P12A - P12G
Source: U.S. Census Bureau,Census 2000 SF1, Table P12H
Source: U.S. Census Bureau, Census 2000 SF1,Tables P7 and P12A - P12G
Source: U.S. Census Bureau, Census 2000 SF1, Tables P12A - P12H
75.1 68.6
12.3 15.1
3.6 3.4
0.1 0.2
0.9 1.2
5.5 7.6
2.4 4.0
Race and Hispanic Origin

21 Center for the Study of Children’s Futures 2004
Florida Hispanic or Latino Population by Race Category, 2000
TotalPopulation
N=2,682,715
PopulationUnder Age 18
N=702,539Two or More Races (6.4%)
White(74.8%)
White(69.1%)
Black or African American (3.1%)American Indian or Alaska Native (0.5%)
Native Hawaiian or Other Pacific Islander (0.1%)Asian (0.2%)
Some Other Race (20.7%)
Two or More Races (5.2%)
Black or African American (2.7%)American Indian or Alaska Native (0.4%)
Native Hawaiian or Other Pacific Islander (0.1%)Asian (0.2%)
Some Other Race (16.7%)
Percent of United States HispanicPopulation by Race, 2000
Total Under Age 18(N=35,305,818) (N=12,342,259)
White Alone
Black Alone
Asian Alone
Some Other Race Alone
Two or More Races
American Indian or Alaska Native Alone
Native Hawaiian or Other Pacific Islander Alone
Mexican
Puerto Rican
Cuban
Dominican Republic
Central American
South American
All Other Hispanic or Latino
Hispanic Population by Type, 2000
Florida
0 100
United States
Under Age 18
Total
Under Age 18
Total
Source: U.S. Census Bureau,Census 2000 SF1, Table P8
Source: U.S. Census Bureau,Census 2000 SF1, Tables PCT12A - PCT12O
Source: U.S. Census Bureau, Census 2000 SF1,Table P8 and Tables PCT12A - PCT12O
Source: U.S. Census Bureau,Census 2000 SF1, Table QT - P9 and SF2, Table PCT3
47.9 45.1
2.0 2.2
0.3 0.4
0.1 0.1
1.2 1.3
42.2 43.2
6.3 7.7
Race and Hispanic Origin

22Center for the Study of Children’s Futures 2004
Children Age 0 - 4 for each Florida County by Racial Categories and Hispanic Origin, 2000
Florida 643,330 196,128 3,360 16,520 579 44,154 41,752 193,571Alachua 6,776 3,310 28 343 1 165 538 678Baker 1,342 185 2 3 0 8 21 30Bay 6,892 1,358 66 143 6 94 420 312Bradford 1,126 257 1 10 0 11 39 32Brevard 19,479 3,128 84 359 16 457 1,184 1,802Broward 60,770 29,711 344 2,480 54 4,100 5,582 20,760Calhoun 619 118 9 3 0 9 9 31Charlotte 4,555 328 5 58 1 129 178 372Citrus 4,034 208 21 50 1 24 131 196Clay 7,689 770 29 162 14 169 396 555Collier 9,840 1,089 72 121 12 1,725 582 4,918Columbia 2,753 710 22 16 0 25 102 136Miami-Dade 92,651 37,413 364 1,810 53 7,283 6,178 71,173DeSoto 1,259 258 24 5 2 270 55 715Dixie 669 80 3 1 0 3 14 18Duval 31,914 19,248 157 1,404 39 1,107 2,378 3,126Escambia 10,983 5,358 138 327 15 208 884 661Flagler 1,682 237 7 29 0 37 66 156Franklin 434 62 0 0 0 6 7 10Gadsden 867 1,917 2 7 0 171 54 371Gilchrist 759 40 5 0 0 14 9 33Glades 393 55 81 0 0 67 22 168Gulf 531 112 3 6 1 3 18 5Hamilton 474 323 3 2 0 21 17 76Hardee 1,283 113 18 1 2 583 65 1,179Hendry 1,708 441 20 11 0 544 102 1,500Hernando 5,112 376 23 53 1 137 203 517Highlands 2,795 802 28 71 1 324 189 901Hillsborough 45,109 13,404 231 1,453 44 4,997 3,206 15,946Holmes 957 40 6 1 0 9 15 20Indian River 4,008 742 20 55 1 278 155 754Jackson 1,748 673 10 9 2 40 76 75Jefferson 387 271 2 2 0 6 14 21
Lafayette 327 29 3 0 0 29 1 57Lake 8,556 1,500 42 129 9 438 319 1,236Lee 17,352 2,954 85 208 13 1,423 935 4,408Leon 7,721 5,030 39 314 6 129 488 479Levy 1,563 305 7 10 0 41 49 145Liberty 306 44 6 1 0 20 7 23Madison 514 527 0 3 1 12 17 38Manatee 11,067 2,114 54 132 7 918 610 3,066Marion 10,005 2,344 56 119 6 488 470 1,473Martin 4,465 485 40 31 8 390 180 1,078Monroe 2,943 240 9 40 0 85 145 815Nassau 3,138 295 5 21 2 24 80 79Okaloosa 8,306 1,302 44 161 14 207 809 712Okeechobee 1,582 157 25 18 3 377 93 722Orange 36,419 14,266 175 1,869 52 4,908 3,686 14,455Osceola 8,324 955 56 233 12 1,441 699 4,404Palm Beach 41,618 13,786 205 1,126 71 3,188 2,919 12,129Pasco 16,043 627 63 234 11 564 592 1,901Pinellas 33,691 7,155 135 1,280 36 1,052 2,005 3,744Polk 21,572 5,855 137 315 13 2,101 1,193 5,202Putnam 2,866 1,063 15 15 4 251 112 480St. Johns 5,717 575 14 71 3 59 167 284St. Lucie 7,155 2,517 37 115 6 500 420 1,514Santa Rosa 6,774 394 50 64 9 86 323 302Sarasota 10,652 1,126 44 144 5 410 416 1,352Seminole 17,757 2,645 52 586 7 999 1,016 3,263Sumter 1,636 338 5 12 2 51 64 183Suwannee 1,677 303 5 14 2 43 55 168Taylor 853 237 10 7 0 8 24 30Union 579 130 1 2 0 7 18 16Volusia 16,605 3,146 68 242 9 818 769 2,421Wakulla 1,131 175 6 2 1 8 29 25Walton 1,840 174 21 6 0 44 73 83Washington 978 198 18 1 1 11 60 37
Native
Haw
aiian
or O
ther
Pacific
Islan
der
Whit
eHisp
anic
Origin
Any R
ace
Two
or M
ore
Races
Some
Other
Rac
e
Asian
Amer
ican
India
n or
Alaska
Nat
ive
Black o
r Afri
can
Amer
ican
Native
Haw
aiian
or O
ther
Pacific
Islan
der
Whit
eHisp
anic
Origin
Any R
ace
Two
or M
ore
Races
Some
Other
Rac
e
Asian
Amer
ican
India
n or
Alaska
Nat
ive
Black o
r Afri
can
Amer
ican
Source: U.S. Census Bureau, Census 2000 SF1, Tables P12A - P12H
Race and Hispanic Origin

23 Center for the Study of Children’s Futures 2004
Children Age 5 - 9 for each Florida County by Racial Categories and Hispanic Origin, 2000
Florida 706,599 222,749 3,924 16,610 653 43,903 37,280 197,347Alachua 7,207 3,976 26 310 1 166 403 655Baker 1,341 246 4 4 0 4 16 23Bay 7,857 1,527 72 154 4 108 381 311Bradford 1,141 344 4 7 6 12 26 46Brevard 23,754 3,777 142 338 22 500 1,013 1,856Broward 65,319 32,518 347 2,535 69 4,352 5,002 21,577Calhoun 621 113 7 7 0 10 14 18Charlotte 5,350 406 15 63 0 111 174 350Citrus 5,055 230 25 52 3 40 135 238Clay 9,250 949 49 154 8 194 389 616Collier 10,936 1,233 76 96 13 1,536 554 4,502Columbia 2,975 802 22 12 0 35 82 134Miami-Dade 98,225 42,821 408 1,886 73 7,887 6,571 77,001DeSoto 1,319 315 26 7 1 234 42 603Dixie 730 71 3 0 0 3 12 15Duval 32,464 21,079 159 1,305 26 1,007 1,919 2,893Escambia 11,875 6,188 173 367 14 219 677 643Flagler 1,971 267 3 27 0 41 72 178Franklin 434 71 0 0 0 3 8 10Gadsden 882 2,245 10 7 1 124 54 300Gilchrist 888 58 5 0 0 7 17 30Glades 422 85 56 0 0 74 18 154Gulf 630 140 5 7 0 3 22 14Hamilton 420 364 3 2 0 22 10 66Hardee 1,304 111 15 6 4 516 53 1,030Hendry 1,826 544 29 21 0 507 99 1,367Hernando 5,993 468 21 48 2 120 159 545Highlands 3,161 879 23 76 2 349 120 936Hillsborough 48,040 15,491 320 1,375 61 4,677 2,885 15,742Holmes 1,099 31 14 7 1 14 25 32Indian River 4,678 872 20 55 4 233 158 701Jackson 1,928 802 19 7 0 29 67 79Jefferson 396 399 2 0 0 1 7 12
Lafayette 340 41 11 0 0 30 9 60Lake 9,648 1,770 54 111 7 419 268 1,153Lee 18,765 3,048 96 193 15 1,344 763 4,158Leon 8,331 5,083 40 239 8 103 354 470Levy 1,795 335 7 11 1 43 36 127Liberty 331 52 10 0 0 16 5 17Madison 564 622 1 4 0 10 16 32Manatee 11,529 2,391 70 141 18 831 431 2,577Marion 11,420 2,823 91 105 8 451 415 1,409Martin 5,520 604 43 46 25 404 162 1,022Monroe 3,252 293 16 20 1 90 130 850Nassau 3,425 369 19 18 0 16 61 85Okaloosa 9,128 1,335 72 173 15 210 666 615Okeechobee 1,832 200 18 14 1 312 83 634Orange 38,448 16,365 209 1,976 65 5,023 3,155 14,822Osceola 9,381 1,227 68 270 12 1,573 682 4,630Palm Beach 45,507 16,007 185 1,167 46 3,100 2,635 11,711Pasco 17,631 672 83 211 12 563 541 1,896Pinellas 38,247 8,371 144 1,324 33 986 1,680 3,402Polk 23,299 6,502 147 327 15 1,989 905 4,855Putnam 3,265 1,204 18 20 0 306 77 538St. Johns 6,968 759 23 99 11 72 123 260St. Lucie 8,457 2,945 30 128 12 453 395 1,447Santa Rosa 7,506 409 67 71 7 66 263 280Sarasota 12,728 1,288 39 106 5 348 353 1,155Seminole 20,391 3,197 78 595 8 1,019 920 3,402Sumter 1,831 481 5 9 1 52 44 169Suwannee 1,797 407 6 11 1 40 53 134Taylor 939 315 9 4 0 6 16 27Union 597 129 0 0 0 7 24 24Volusia 19,669 3,510 81 270 8 835 695 2,543Wakulla 1,345 167 10 1 0 7 31 43Walton 2,168 208 42 7 1 35 59 84Washington 1,054 198 29 4 2 6 46 39
Native
Haw
aiian
or O
ther
Pacific
Islan
der
Whit
eHisp
anic
Origin
Any R
ace
Two
or M
ore
Races
Some
Other
Rac
e
Asian
Amer
ican
India
n or
Alaska
Nat
ive
Black o
r Afri
can
Amer
ican
Native
Haw
aiian
or O
ther
Pacific
Islan
der
Whit
eHisp
anic
Origin
Any R
ace
Two
or M
ore
Races
Some
Other
Rac
e
Asian
Amer
ican
India
n or
Alaska
Nat
ive
Black o
r Afri
can
Amer
ican
Source: U.S. Census Bureau, Census 2000 SF1, Tables P12A - P12H
Race and Hispanic Origin

24Center for the Study of Children’s Futures 2004
Children Age 10 - 14 for each Florida County by Racial Categories and Hispanic Origin, 2000
Florida 732,453 226,128 4,187 17,540 604 42,650 33,462 194,528Alachua 8,071 4,047 26 287 5 158 343 711Baker 1,528 271 3 8 0 1 23 26Bay 8,202 1,397 85 200 9 105 333 310Bradford 1,253 348 4 15 6 13 25 40Brevard 26,121 3,898 139 408 18 520 895 1,900Broward 64,174 32,959 318 2,614 60 4,379 4,628 20,992Calhoun 765 111 11 9 0 2 16 17Charlotte 5,879 509 27 85 2 105 154 353Citrus 5,946 247 33 56 2 55 138 291Clay 10,217 1,053 57 204 6 202 340 635Collier 10,761 1,091 61 72 12 1,177 503 3,739Columbia 3,156 836 27 28 1 39 65 139Miami-Dade 98,766 44,540 378 1,914 66 8,604 6,486 81,005DeSoto 1,432 381 24 10 1 237 30 531Dixie 775 83 4 1 0 1 7 14Duval 32,464 21,372 173 1,369 32 900 1,516 2,667Escambia 12,453 6,096 196 427 13 160 675 518Flagler 2,353 296 12 47 2 40 69 189Franklin 502 107 0 0 0 0 10 13Gadsden 887 2,396 12 5 0 112 28 235Gilchrist 991 56 3 2 0 8 17 33Glades 453 86 32 2 0 62 18 147Gulf 704 143 0 1 0 3 19 9Hamilton 470 392 1 0 0 19 6 46Hardee 1,354 192 17 7 0 457 46 911Hendry 1,924 558 24 10 0 494 93 1,269Hernando 6,681 477 25 57 7 137 148 601Highlands 3,466 842 40 70 3 285 108 902Hillsborough 47,979 14,739 300 1,404 54 4,456 2,329 14,995Holmes 1,177 47 18 5 0 9 13 26Indian River 5,051 903 32 55 3 216 138 608Jackson 1,969 822 28 10 0 30 50 80Jefferson 457 400 5 1 0 2 9 8
Lafayette 339 48 4 0 0 25 4 43Lake 9,828 1,842 54 107 7 391 255 1,086Lee 19,634 3,228 99 205 13 1,203 652 3,545Leon 8,856 4,911 42 229 5 92 272 423Levy 1,973 332 21 5 0 25 36 118Liberty 345 63 12 0 0 14 3 18Madison 701 733 6 4 0 5 16 31Manatee 12,047 2,247 66 160 9 739 357 2,191Marion 12,682 3,015 113 121 4 462 359 1,426Martin 5,977 645 27 53 14 326 146 824Monroe 3,456 310 13 37 6 81 100 887Nassau 3,943 403 11 15 2 23 38 92Okaloosa 9,733 1,289 82 225 24 219 651 670Okeechobee 1,947 224 15 28 3 309 58 589Orange 37,806 15,877 247 2,031 58 4,923 2,730 13,997Osceola 9,637 1,261 60 290 6 1,597 591 4,694Palm Beach 46,729 16,678 199 1,210 35 2,940 2,364 10,969Pasco 18,435 671 98 234 8 479 446 1,758Pinellas 39,787 8,017 174 1,315 36 827 1,519 3,099Polk 24,147 6,696 166 322 16 1,745 761 4,145Putnam 3,517 1,223 28 33 3 236 83 438St. Johns 7,784 712 15 92 5 70 133 268St. Lucie 8,952 3,216 28 165 4 458 319 1,448Santa Rosa 8,556 436 110 94 10 87 299 299Sarasota 13,885 1,260 50 181 9 308 328 1,033Seminole 21,522 3,300 113 694 11 1,115 816 3,597Sumter 1,785 573 19 7 0 43 36 135Suwannee 1,865 404 14 9 1 27 38 104Taylor 1,071 323 17 6 1 5 14 24Union 716 143 3 3 0 2 8 10Volusia 21,474 3,766 92 267 7 856 614 2,479Wakulla 1,594 212 10 1 0 12 22 36Walton 2,235 176 39 7 5 16 82 59Washington 1,114 199 25 7 0 2 34 33
Native
Haw
aiian
or O
ther
Pacific
Islan
der
Whit
eHisp
anic
Origin
Any R
ace
Two
or M
ore
Races
Some
Other
Rac
e
Asian
Amer
ican
India
n or
Alaska
Nat
ive
Black o
r Afri
can
Amer
ican
Native
Haw
aiian
or O
ther
Pacific
Islan
der
Whit
eHisp
anic
Origin
Any R
ace
Two
or M
ore
Races
Some
Other
Rac
e
Asian
Amer
ican
India
n or
Alaska
Nat
ive
Black o
r Afri
can
Amer
ican
Source: U.S. Census Bureau, Census 2000 SF1, Tables P12A - P12H
Race and Hispanic Origin

25 Center for the Study of Children’s Futures 2004
Children Age 15 - 17 for each Florida County by Racial Categories and Hispanic Origin, 2000
Florida 421,663 129,572 2,506 11,392 444 27,323 18,875 117,093Alachua 5,057 2,229 27 147 1 104 186 464Baker 933 151 5 2 1 2 14 15Bay 4,975 830 60 117 10 48 189 162Bradford 851 200 5 4 0 9 8 20Brevard 14,884 2,301 84 321 13 331 513 1,183Broward 34,917 18,675 175 1,562 42 2,577 2,666 11,952Calhoun 471 71 13 1 0 4 8 22Charlotte 3,481 345 13 62 5 68 78 238Citrus 3,473 194 24 37 0 29 87 175Clay 5,998 575 30 144 7 125 205 388Collier 6,341 694 31 54 9 938 312 2,582Columbia 1,990 526 17 24 0 27 45 82Miami-Dade 56,778 26,575 209 1,249 50 5,988 3,987 49,164DeSoto 902 227 23 11 2 188 25 419Dixie 525 59 1 0 0 2 8 9Duval 18,714 11,845 119 941 36 499 805 1,516Escambia 7,472 3,449 124 325 21 83 351 300Flagler 1,364 199 9 23 1 32 39 137Franklin 289 49 0 0 0 4 3 9Gadsden 529 1,517 6 2 0 66 18 123Gilchrist 580 49 3 2 0 7 9 14Glades 291 54 27 3 0 32 4 80Gulf 431 99 3 0 0 4 7 11Hamilton 296 281 1 0 0 8 2 22Hardee 833 101 9 9 0 312 24 614Hendry 1,172 314 18 7 0 343 65 867Hernando 3,951 290 27 43 2 90 75 358Highlands 2,178 533 16 47 0 266 70 720Hillsborough 27,338 8,151 190 909 36 2,681 1,279 8,721Holmes 730 29 13 6 0 8 11 16Indian River 3,127 614 18 41 1 131 85 368Jackson 1,385 680 16 4 1 20 24 51Jefferson 313 245 3 0 0 4 4 8
Lafayette 247 19 1 1 0 11 4 25Lake 5,515 1,006 35 78 4 223 104 579Lee 11,231 1,623 59 141 10 751 345 2,102Leon 5,483 2,867 33 131 2 66 133 309Levy 1,225 261 7 4 0 17 22 79Liberty 241 47 2 0 0 5 1 7Madison 528 438 1 2 0 3 8 29Manatee 6,696 1,197 31 119 4 462 200 1,293Marion 7,493 1,757 56 76 1 267 218 818Martin 3,370 342 20 38 5 175 82 476Monroe 2,041 159 9 22 1 56 50 548Nassau 2,231 227 11 16 3 15 28 48Okaloosa 5,859 864 56 174 15 121 379 396Okeechobee 1,226 217 10 8 0 257 34 466Orange 21,181 8,844 145 1,359 42 2,968 1,513 8,203Osceola 5,591 793 35 161 13 913 333 2,732Palm Beach 25,684 8,935 111 712 30 2,015 1,256 6,613Pasco 10,130 388 51 150 6 333 238 1,015Pinellas 23,127 4,282 105 921 30 532 722 1,949Polk 14,057 4,019 93 180 13 1,158 462 2,626Putnam 2,099 645 12 18 0 138 53 257St. Johns 4,383 379 16 38 5 45 61 177St. Lucie 4,936 1,711 22 104 5 292 201 835Santa Rosa 4,977 271 75 77 2 41 145 173Sarasota 7,902 715 20 99 3 207 196 609Seminole 12,310 1,923 49 451 3 619 410 2,078Sumter 1,152 359 9 5 1 29 21 93Suwannee 1,264 261 7 17 0 24 24 94Taylor 655 182 8 5 0 2 14 14Union 462 99 1 0 0 4 2 11Volusia 12,784 2,211 51 174 5 516 320 1,541Wakulla 938 124 8 3 1 10 16 25Walton 1,346 119 18 5 0 15 54 41Washington 730 137 20 6 2 3 20 22
Native
Haw
aiian
or O
ther
Pacific
Islan
der
Whit
eHisp
anic
Origin
Any R
ace
Two
or M
ore
Races
Some
Other
Rac
e
Asian
Amer
ican
India
n or
Alaska
Nat
ive
Black o
r Afri
can
Amer
ican
Native
Haw
aiian
or O
ther
Pacific
Islan
der
Whit
eHisp
anic
Origin
Any R
ace
Two
or M
ore
Races
Some
Other
Rac
e
Asian
Amer
ican
India
n or
Alaska
Nat
ive
Black o
r Afri
can
Amer
ican
Source: U.S. Census Bureau, Census 2000 SF1, Tables P12A - P12H
Race and Hispanic Origin

26Center for the Study of Children’s Futures 2004
Data on this page reflects family households.
Householder with Own Child and Own GrandchildHouseholder with Parent or Parent-In-Law and Own ChildHouseholder with Parent or Parent-In-Law,
Florida Multigenerational Households by Type, 2000
N = 238,213 Households
59.7%
37.9%
2.3%
Own Child and Own Grandchild
0
25
50
75
100
Percent of Family Households with Related ChildrenUnder Age 18 within Family Household Type, 2000
Total FamilyHouseholds
MarriedCouple
FemaleHouseholder
MaleHouseholder
52.2
67.5
57.8
40.4
68.2
46.3
56.6
47.9
Per
cent
100
75
50
25
0
Total Households 5,134,869 6,337,929 91,947,410 105,480,101
Family Households 3,511,825 4,210,760 64,517,947 71,787,347
Married Couple 2,791,734 3,192,266 50,708,322 54,493,232
Female Householder 548,556 759,000 10,666,043 12,900,103
Male Householder 171,535 259,494 3,143,582 4,394,012
Nonfamily Households 1,623,044 2,127,169 27,429,463 33,692,754
Two or More People 313,090 439,866 4,849,043 6,462,679
Single Person 1,309,954 1,687,303 22,580,420 27,230,075
Florida United States1990 2000 1990 2000
Number of Households by Type, 1990 and 2000
Source: U.S. Census Bureau, Census 2000 SF2,Table PCT9 and Census 1990 STF1, Table DP1
Source: U.S. Census Bureau, Census 2000Special Tabulation, Table PHC-T-17
Source: U.S. Census Bureau, Census 2000 SF1, Tables P34 and P35
FL US
Family Households with Other Related Children (no own)Family Households with Own Children Only
Living Arrangements

27 Center for the Study of Children’s Futures 2004
Data on this page reflects family households.
Florida 4,210,760 3,192,266 40.4 759,000 67.5 259,494 56.6Alachua 47,819 33,967 44.0 10,768 69.0 3,084 47.3Baker 5,599 4,347 52.2 920 74.6 332 67.5Bay 40,480 30,968 42.5 7,152 71.4 2,360 62.6Bradford 6,196 4,708 43.1 1,133 70.4 355 59.2Brevard 132,480 104,964 37.0 20,215 67.1 7,301 59.9Broward 411,403 301,745 45.7 81,818 66.8 27,840 54.4Calhoun 3,130 2,335 46.3 602 66.3 193 62.7Charlotte 44,123 37,823 22.1 4,624 60.9 1,676 57.5Citrus 36,339 30,690 24.1 4,009 63.7 1,640 60.2Clay 39,389 32,032 50.1 5,380 72.3 1,977 67.3Collier 71,264 59,871 30.0 7,445 68.2 3,948 56.5Columbia 14,919 11,244 43.9 2,702 70.7 973 65.8Miami-Dade 548,493 370,898 51.4 133,671 64.1 43,924 48.6DeSoto 7,676 5,966 35.2 1,110 72.0 600 54.5Dixie 3,660 2,858 37.6 552 69.7 250 65.6Duval 201,678 141,177 48.8 47,503 72.3 12,998 59.9Escambia 74,163 53,096 42.5 16,815 70.0 4,252 59.4Flagler 15,683 13,378 26.4 1,729 63.2 576 54.3Franklin 2,727 2,149 34.8 403 65.0 175 60.6Gadsden 11,429 7,055 45.9 3,567 71.2 807 55.8Gilchrist 3,715 2,964 43.3 560 73.0 191 59.2Glades 2,764 2,244 34.0 333 73.0 187 66.3Gulf 3,537 2,737 39.5 585 65.8 215 62.3Hamilton 2,995 2,094 45.9 700 72.9 201 61.2Hardee 6,253 4,903 47.8 908 68.5 442 66.7Hendry 8,141 6,046 55.2 1,351 79.9 744 60.5Hernando 40,019 33,471 27.4 4,802 63.8 1,746 59.1Highlands 25,794 21,427 25.6 3,190 67.5 1,177 59.0Hillsborough 255,222 186,613 46.8 51,541 70.5 17,068 59.7Holmes 4,893 3,848 42.5 749 67.3 296 60.8Indian River 32,708 26,804 29.2 4,390 66.8 1,514 58.6Jackson 11,607 8,551 42.4 2,398 69.0 658 57.9Jefferson 3,307 2,395 42.4 711 65.3 201 53.2
Layfayette 1,591 1,269 45.4 198 73.7 124 62.9Lake 62,468 52,105 30.3 7,518 67.1 2,845 62.0Lee 127,611 104,693 29.4 16,327 67.9 6,591 59.5Leon 54,305 38,376 47.2 12,553 70.4 3,376 53.3Levy 9,674 7,406 36.5 1,636 71.7 632 62.8Liberty 1,554 1,150 46.5 293 76.1 111 56.8Madison 4,683 3,241 44.3 1,159 71.9 283 60.4Manatee 73,726 59,296 31.5 10,568 67.8 3,862 60.9Marion 74,637 59,339 31.8 11,426 68.5 3,872 60.8Martin 36,194 30,424 29.5 4,088 64.8 1,682 57.6Monroe 20,387 16,416 33.2 2,558 66.3 1,413 51.9Nassau 16,532 13,457 43.6 2,166 69.1 909 58.3Okaloosa 46,499 37,250 45.1 6,749 73.2 2,500 63.7Okeechobee 9,022 6,986 40.9 1,353 71.4 683 66.2Orange 220,258 157,937 49.3 45,981 70.2 16,340 57.5Osceola 45,077 34,207 49.3 7,798 71.9 3,072 62.9Palm Beach 303,772 240,646 36.1 45,939 67.1 17,187 55.3Pasco 99,073 80,642 32.4 13,135 63.1 5,296 59.8Pinellas 243,339 185,707 33.9 43,573 64.8 14,059 56.3Polk 132,305 101,862 38.9 22,528 70.4 7,915 62.0Putnam 19,464 14,689 37.5 3,590 70.8 1,185 62.4St. Johns 34,103 28,176 41.0 4,420 66.9 1,507 62.3St. Lucie 54,258 42,511 34.3 8,524 69.1 3,223 59.4Santa Rosa 33,321 27,225 47.0 4,479 72.2 1,617 66.3Sarasota 94,528 79,001 25.6 11,565 60.8 3,962 55.1Seminole 97,249 75,718 48.6 16,033 67.5 5,498 57.6Sumter 15,035 12,650 22.5 1,745 68.0 640 63.1Suwannee 9,687 7,606 40.4 1,509 68.9 572 58.9Taylor 5,129 3,768 42.2 1,035 73.4 326 64.4Union 2,606 1,943 53.0 504 77.6 159 69.8Volusia 120,064 93,161 34.2 20,098 64.7 6,805 57.4Wakulla 6,237 4,823 46.2 1,048 72.4 366 70.2Walton 11,119 8,763 36.7 1,667 68.3 689 66.3Washington 5,648 4,455 41.4 901 68.4 292 59.2
Number of Family Households by Family Household Type and Percent with Related ChildrenUnder Age 18 within each Family Household Type for each Florida County, 2000
Total FamilyHouseholds
Married Couple Female Householder Male HouseholderPercent
withChildren
Percentwith
Children
Percentwith
Children
Total FamilyHouseholds
Married Couple Female Householder Male HouseholderPercent
withChildren
Percentwith
Children
Percentwith
Children
Source: U.S. Census Bureau, Census 2000 SF1, Table P35
Living Arrangements

28Center for the Study of Children’s Futures 2004
0
500,000
1,000,000
1,500,000
2,000,000
2,500,000
3,646,340
0
1,000,000
2,000,000
3,000,000
4,000,000
0
50,000
100,000
150,000
200,000
250,000
300,000
345,949345,949
300,000
250,000
200,000
150,000
100,000
50,000
0
Data on this page reflects persons within households.
Florida United States
1990 2000 1990 2000
Total Population 12,937,926 15,982,378 248,709,873 281,421,906
In Households 12,630,465 15,593,433 242,012,129 273,643,273
In Family Households 10,612,468 12,903,319 208,100,820 231,374,718
In Nonfamily Households 2,017,997 2,690,114 33,911,309 42,268,555
In Group Quarters 307,461 388,945 6,697,744 7,778,633
Total Population by Household Type, 1990 and 2000
Florida Grandparents Living with OwnGrandchildren Under Age 18, 2000
By Responsibility of GrandparentBy Household Relationship
Num
ber
of G
rand
pare
nts
Livi
ng w
ith G
rand
child
ren
42.7%
57.3%
Responsible forGrandchildren
Not Responsiblefor Grandchildren
Householder
N = 345,949
25.4%
73.2%
Grandparent is HouseholderGrandparent is Parent or Parent-In-Law of HouseholderGrandparent is Other Relative or Nonrelative of Householder
4,000,000
3,000,000
2,000,000
1,000,000
0
Number of Children Under Age 18 by Household Type and Percent Change in Number, 1990 and 2000
Florida United States
Total Children 63,604,432 72,293,812 13.7Married Couple Family* 44,642,569 47,682,383 6.8Female Householder Family* 10,674,900 13,307,097 24.7Male Householder Family* 2,143,551 3,505,157 63.5Other Relative Household 4,666,052 6,042,435 29.5Other** 1,477,360 1,756,740 18.9
27.2%�
18.6%�
45.2%�
71.8%�
34.2%�
24.2%�
*own child**other includes householder or spouse households, nonrelative households, and group quarters
Total Children MarriedCouple*
FemaleHouseholder*
MaleHouseholder*
OtherRelative
Other**
3,646,340
2,500,000
2,000,000
1,500,000
1,000,000
500,000
0
Num
ber
of C
hild
ren
Und
er A
ge 1
8
Num
ber
of C
hild
ren
Und
er A
ge 1
8
1990
2000
PercentChange
1990 2000
Source: U.S. Census Bureau, Census 2000 SF1,Table P27 and Census 1990 STF1, Table P015
Source: U.S. Census Bureau,Census 2000 SF3, Table PCT9
Source: U.S. Census Bureau,Census 2000 SF3, Table PCT9
Source: U.S. Census Bureau, Census 2000 SF1, Table P28 and Census 1990 STF1, Table P021
Living Arrangements

29 Center for the Study of Children’s Futures 2004
Florida 61.3 21.0 5.5 9.5Alachua 58.4 26.4 4.5 7.9Baker 64.9 17.1 5.2 9.6Bay 62.6 21.2 5.8 7.7Bradford 60.1 20.9 5.0 10.7Brevard 64.6 19.2 5.6 7.4Broward 62.8 21.0 5.3 8.8Calhoun 62.2 18.8 5.7 10.6Charlotte 64.4 18.3 6.1 8.1Citrus 62.6 18.8 6.7 8.1Clay 71.7 14.6 4.7 6.8Collier 65.5 15.8 6.3 8.3Columbia 59.5 19.9 6.2 11.4Miami-Dade 57.1 22.4 4.9 13.2DeSoto 55.4 17.5 6.2 11.1Dixie 59.1 18.2 7.6 11.4Duval 57.7 25.2 5.1 9.6Escambia 56.1 26.3 4.8 10.2Flagler 66.6 17.5 4.6 9.1Franklin 60.3 19.3 7.5 10.4Gadsden 44.4 30.3 4.8 18.5Gilchrist 65.8 18.0 4.1 8.7Glades 58.6 17.1 8.2 12.8Gulf 60.2 18.2 5.9 12.1Hamilton 51.7 22.6 5.5 15.2Hardee 60.7 12.9 6.5 15.2Hendry 59.8 16.7 6.3 11.6Hernando 64.2 18.1 5.7 8.7Highlands 58.5 20.7 6.2 10.3Hillsborough 60.3 22.0 5.6 9.2Holmes 65.3 17.5 5.8 7.5Indian River 62.8 19.5 5.3 8.9Jackson 57.7 23.1 5.2 9.6Jefferson 56.0 21.2 5.1 14.7
Layfayette 66.0 13.5 6.8 9.6Lake 64.4 17.6 5.8 8.9Lee 62.7 19.8 6.5 8.1Leon 60.3 25.1 4.7 7.6Levy 57.0 21.2 6.7 11.7Liberty 59.0 22.1 6.6 8.5Madison 49.2 26.8 4.6 13.8Manatee 60.6 20.1 5.9 8.9Marion 59.6 21.4 6.1 9.4Martin 68.2 16.6 5.8 6.3Monroe 65.4 17.7 6.8 7.2Nassau 68.7 14.1 5.3 8.9Okaloosa 68.9 17.1 5.3 6.1Okeechobee 58.8 16.2 6.9 11.3Orange 60.3 21.6 5.8 9.7Osceola 63.7 18.2 5.9 9.8Palm Beach 64.3 19.9 5.4 8.0Pasco 65.3 17.8 6.5 7.5Pinellas 60.3 23.0 5.9 7.7Polk 58.9 20.5 5.9 11.1Putnam 56.3 23.2 6.0 11.9St. Johns 72.0 15.1 4.4 6.4St. Lucie 59.2 21.7 6.0 10.0Santa Rosa 71.4 15.1 4.9 6.2Sarasota 66.0 19.1 5.5 6.9Seminole 69.7 16.7 4.6 7.1Sumter 57.0 21.9 6.5 11.7Suwannee 62.0 17.7 5.3 11.7Taylor 55.7 23.1 6.1 11.7Union 61.3 21.0 5.2 8.4Volusia 60.7 21.0 5.8 9.0Wakulla 65.3 19.3 5.9 7.2Walton 62.2 19.1 6.8 8.9Washington 64.2 19.1 4.8 8.8
Percent of Children Under Age 18 Living inHouseholds by Type for each Florida County, 2000
Data on this page represents persons within households.
Percent of Florida Children Under Age 18 Living inSingle Parent Households by County, 2000
27.5 to 35.1
23.4 to 27.4
19.3 to 23.3
MarriedCoupleFamily
MaleHouseholder
Family
FemaleHouseholder
Family
Own Child
OtherRelative
Related Child
MarriedCoupleFamily
MaleHouseholder
Family
FemaleHouseholder
Family
Own Child
OtherRelative
Related Child
Source: U.S. Census Bureau, Census 2000 SF1, Table P28
Source: U.S. Census Bureau,Census 2000 SF1, Table P28
Living Arrangements


“Children are the livingmessages we send to atime we will never see.”
-John W. Whitehead


Multi-Year Trend Data
** method used for calculating changed in 1998Source: Florida Department of Health, Office of Vital Statistics;Florida Department of Education
1992 1993 1994 1995 1996 1997 1998 1999 2000
Children Under Age 6 Below 100% of PovertyGrandparents Responsible 3 or More Years
100
75
50
25
0
Child
ren
Age 3
& 4
Enrol
led
in S
choo
lO
wn Chi
ldre
n Und
er A
ge 6
with
All Par
ents
in th
e La
bor F
orce
Child
ren
Under
Age
6
Below
200
% o
f Pov
erty
Gra
ndpa
rent
s Res
pons
ible
for
and
Livin
g with
Own
Gra
ndch
ildre
n Und
er A
ge 1
8
Own
Child
ren
Under
Age
6
Livin
g in
Sin
gle
Paren
t Hom
es
Per
cent
Source: US Census Bureau, Census 2000, SF1 and SF3
Critical MeasuresCensus 2000
Birth Rate
Teen Birth Rate Age 15-17
Teen Birth Rate Age 15-19
Percent of Births Receiving Early Prenatal Care
Percent of Low Birthweight Births
Percent of Births to Unwed Mothers
Infant Mortality Rate
Teen Violent Death Rate Age 15-19
Percent of Students Eligible for Free/Reduced Lunch
Graduation Rate**
Source: Policy and Services Research Data Center, de la Parte Institute, USF, 2002
Beh
avio
ral H
ealth
and
Juv
enile
Jus
tice
Source: Florida Department of Juvenile Justice, 2003
Source: Florida Department of Juvenile Justice, 2000/01
Chi
ld C
are,
Hea
d S
tart
and
Edu
catio
n
Source: Florida Department of Education, 2001/02
Source: Florida Children’s Forum, 2001
33 Center for the Study of Children’s Futures 2004
AlachuaBakerBayBradfordBrevardBrowardCalhounCharlotteCitrusClayCollierColumbiaMiami-DadeDeSotoDixieDuvalEscambia
FlaglerFranklinGadsdenGilchristGladesGulfHamiltonHardeeHendryHernandoHighlandsHillsboroughHolmesIndian RiverJacksonJeffersonLafayette
LakeLeeLeonLevyLibertyMadisonManateeMarionMartinMonroeNassauOkaloosaOkeechobeeOrangeOsceolaPalm BeachPasco
PinellasPolkPutnamSt. JohnsSt. LucieSanta RosaSarasotaSeminoleSumterSuwanneeTaylorUnionVolusiaWakullaWaltonWashington
Florida and County Profiles
Florida ProfileCounty Profiles (in alphabetical order)

Number Percent Number Percent
Summary Profile for the Population Under Age 18, 1990 to 2000
1990 2000
Age & Sex
Population Under Age 18
Males Under Age 18
Females Under Age 18
Population Under Age 5
Population Age 5 - 17
Race
Children of One Race
White Children
Black or African American Children
American Indian or Alaska Native Children
Asian Children
Native Hawaiian or Other Pacific Islander Children
Children of Some Other Race
Children of Two or More Races
Hispanic Origin Status
Hispanic Children
Non-Hispanic Children
Non-Hispanic White Children
Non-Hispanic Racial Minorities
Living Arrangements
Children Living in Households
Children Living in Group Quarters
Own Children Living in Single Parent Households
Own Children Living in Married Couple Households
Source: Population Reference Bureau analysis of data from the US Census Bureau for the Annie E. Casey Foundation
1999 Income in Dollars as Reported in Census 2000
• •
•
•
Source: US Census Bureau, Census 2000, SF3 Tables P82, P53, P80 and PCT39
Number NumberPercent Percent
Source: US Census Bureau, Census 2000, SF1 and SF3;Florida Almanac, 2002/2003; Florida County Atlas, 1994
34Center for the Study of Children’s Futures 2004
2,866,237 100.0 3,646,340 100.0
1,468,433 51.2 1,870,986 51.3
1,397,804 48.8 1,775,354 48.7
849,596 29.6 945,823 25.9
2,016,641 70.4 2,700,517 74.1
N/A N/A 3,514,971 96.4
2,130,130 74.3 2,504,045 68.7
608,978 21.2 774,577 21.2
9,555 0.3 13,977 0.4
N/A N/A 62,062 1.7
N/A N/A 2,280 0.1
74,224 2.6 158,030 4.3
N/A N/A 131,369 3.6
392,689 13.7 702,539 19.3
2,473,548 86.3 2,943,801 80.7
1,828,566 63.8 2,018,766 55.4
644,982 22.5 925,035 25.4
2,851,781 99.5 3,629,381 99.5
14,456 0.5 16,959 0.5
643,338 22.4 964,863 26.5
1,884,554 65.8 2,235,598 61.3
Per Capita Income .................... 21,557 Median Family Income .............................. 45,625
Median Household Income ...... 38,819 with own children under age 18 ............. 43,654
Median Nonfamily Income....... 24,799 without own children under age 18 ........ 46,855
Florida comprises 53,927 square miles of land and waspopulated by 15,982,378 persons in 2000. There were 296persons per square mile and the general population increasedby 24 percent from 1990. Eleven percent of the populationlived in a rural area. The median age in 2000 was 39 years.
There were 7,302,947 housing units reported with ahomeownership rate of 70 percent. Thirty-one percent ofhouseholds included at least one person under the age of 18years. Annual income was less than $25,000 in 31 percent ofall 6,341,121 households and 26 percent of the 1,816,557family households with their own children. Ten percent of allhouseholds had earnings of $100,000 or greater.
Twenty percent of persons age 25 and over did not graduatefrom high school and 29 percent graduated with no furthereducation indicated. Twenty-two percent obtained a bachelor’sdegree or higher. Of 1,323,161 persons age 18 to 24 years, 72percent were high school graduates. Ten percent of persons 16to 19 years old were not in school and not working.
Children under age 18 represented 23 percent of thepopulation in Florida, and 18 percent of children lived inpoverty. Of the 1,952,629 persons of all ages living in poverty,32 percent were under the age of 18 years. Forty-one percentof children lived in low-income households and 20 percentlived in high poverty neighborhoods.
Florida became a United States Territory in 1821 andwas admitted as a state in 1845. The capital isTallahassee and it was established as a permanent
setting for the seats of government in 1823. The state has4,308 square miles of water and more than 820 miles of sandbeaches. Florida’s climate, usually pleasant and uniform, isreflected in the nickname “The Sunshine State”. Over thecenturies, Florida has belonged to five nations; these includeEngland, France, the Confederacy, Spain, and the UnitedStates. There are currently 67 counties. The longest river isSt. Johns and the largest lake is Lake Okeechobee. Agricultureis Florida’s primary economic resource, next to tourism.

Multi-Year Trend Data
** method used for calculating changed in 1998Source: Florida Department of Health, Office of Vital Statistics;Florida Department of Education
1992 1993 1994 1995 1996 1997 1998 1999 2000
Children Under Age 6 Below 100% of PovertyGrandparents Responsible 3 or More Years
100
75
50
25
0
Child
ren
Age 3
& 4
Enrol
led
in S
choo
lO
wn Chi
ldre
n Und
er A
ge 6
with
All Par
ents
in th
e La
bor F
orce
Child
ren
Under
Age
6
Below
200
% o
f Pov
erty
Gra
ndpa
rent
s Res
pons
ible
for
and
Livin
g with
Own
Gra
ndch
ildre
n Und
er A
ge 1
8
Own
Child
ren
Under
Age
6
Livin
g in
Sin
gle
Paren
t Hom
es
Per
cent
Source: US Census Bureau, Census 2000, SF1 and SF3
Critical MeasuresCensus 2000
Birth Rate
Teen Birth Rate Age 15-17
Teen Birth Rate Age 15-19
Percent of Births Receiving Early Prenatal Care
Percent of Low Birthweight Births
Percent of Births to Unwed Mothers
Infant Mortality Rate
Teen Violent Death Rate Age 15-19
Percent of Students Eligible for Free/Reduced Lunch
Graduation Rate**
Source: Policy and Services Research Data Center, de la Parte Institute, USF, 2002
Beh
avio
ral H
ealth
and
Juv
enile
Jus
tice
Source: Florida Department of Juvenile Justice, 2003
Source: Florida Department of Juvenile Justice, 2000/01
Chi
ld C
are,
Hea
d S
tart
and
Edu
catio
n
Source: Florida Department of Education, 2001/02
Source: Florida Children’s Forum, 2001
35 Center for the Study of Children’s Futures 2004
54.9
23.2
60.3
43.3 42.7
Florida
14.2 14.0 13.7 13.3 13.1 13.0 13.0 12.8 13.0
43.1 44.1 45.8 44.4 40.9 38.7 37.3 34.1 28.8
64.4 64.2 65.0 63.1 60.3 58.2 57.3 54.7 50.4
77.9 80.2 81.3 82.6 83.3 83.0 83.7 83.9 83.7
7.4 7.5 7.8 7.7 7.9 8.0 8.1 8.2 8.0
34.2 35.0 35.7 35.8 36.0 36.0 36.6 37.5 38.2
8.8 8.6 8.1 7.4 7.4 7.1 7.2 7.3 7.0
6.2 6.4 6.7 6.2 5.8 5.5 5.5 5.5 5.3
37.6 41.5 43.5 44.0 43.5 43.2 43.6 43.6 43.9
78.7 75.6 72.9 73.2 73.2 71.9 60.2 62.3 63.8
-
133,658 children received behavioral health services
1,610 behavioral health service providers served children
53 contracted delinquency prevention programs with 1,134 beds or slots
99 state grant funded delinquency prevention programs projected to serve 17,321 youths
117 probation and community corrections non-residential programs with 6,321 slots
167 residential and correctional programs with 7,311 beds
25 detention centers with 2,042 beds
99,774 youths were referred to the juvenile justice system
2,077 youths were transferred to adult court
2,504,517 children were enrolled in 3,695 public schools
486,283 children were enrolled in exceptional student education programs
205,792 children were referred to English for Speakers of Other Languages Programs
354,541 children were enrolled in 1,992 non-public schools
44,460 children and 29,417 families were registered in home education programs
5,703 licensed child care centers with a capacity for 499,673 children
4,889 licensed family child care homes with a capacity for 36,493 children
1,382 Head Start and Early Head Start programs with a capacity for 33,059 children
Source: Policy and Services Research Data Center, de la Parte Institute, USF, 2002
Beh
avio
ral H
ealth
and
Juv
enile
Jus
tice
Source: Florida Department of Juvenile Justice, 2003
Source: Florida Department of Juvenile Justice, 2000/01

Number Percent Number Percent
Summary Profile for the Population Under Age 18, 1990 to 2000
1990 2000
Age & Sex
Population Under Age 18
Males Under Age 18
Females Under Age 18
Population Under Age 5
Population Age 5 - 17
Race
Children of One Race
White Children
Black or African American Children
American Indian or Alaska Native Children
Asian Children
Native Hawaiian or Other Pacific Islander Children
Children of Some Other Race
Children of Two or More Races
Hispanic Origin Status
Hispanic Children
Non-Hispanic Children
Non-Hispanic White Children
Non-Hispanic Racial Minorities
Living Arrangements
Children Living in Households
Children Living in Group Quarters
Own Children Living in Single Parent Households
Own Children Living in Married Couple Households
Source: Population Reference Bureau analysis of data from the US Census Bureau for the Annie E. Casey Foundation
1999 Income in Dollars as Reported in Census 2000
• •
•
•
Source: US Census Bureau, Census 2000, SF3 Tables P82, P53, P80 and PCT39
Number NumberPercent Percent
Source: US Census Bureau, Census 2000, SF1 and SF3;Florida Almanac, 2002/2003; Florida County Atlas, 1994
36Center for the Study of Children’s Futures 2004
39,515 100.0 43,938 100.0
20,059 50.8 22,474 51.1
19,456 49.2 21,464 48.9
11,772 29.8 11,161 25.4
27,743 70.2 32,777 74.6
N/A N/A 42,468 96.7
26,592 67.3 27,111 61.7
11,682 29.6 13,562 30.9
85 0.2 107 0.2
N/A N/A 1,087 2.5
N/A N/A 8 0.0
331 0.8 593 1.3
N/A N/A 1,470 3.3
1,370 3.5 2,508 5.7
38,145 96.5 41,430 94.3
25,563 64.7 25,513 58.1
12,582 31.8 15,917 36.2
39,274 99.4 43,646 99.3
241 0.6 292 0.7
10,515 26.6 13,560 30.9
24,930 63.1 25,646 58.4
Per Capita Income .................... 18,465 Median Family Income .............................. 46,587
Median Household Income ...... 31,426 with own children under age 18 ............. 42,480
Median Nonfamily Income....... 18,982 without own children under age 18 ........ 49,887
A lachua County was established in 1824 from aportion of St. Johns County and was named fora Spanish ranch existing in the vicinity in 1680.
The county seat is Gainesville. The county is noted forthe University of Florida, with education as theforemost industry. Private sector employers arehospitals and technology firms. There are an abundanceof springs, rivers, nature walks, botanical gardens,prairie, and archeological sites.
The county comprises 874 square miles of land and waspopulated by 217,955 persons in 2000. There were 249persons per square mile and the general populationincreased by 20 percent from 1990. Twenty-five percent ofthe population lived in a rural area. The median age in 2000was 29 years.
There were 95,113 housing units reported with ahomeownership rate of 55 percent. Twenty-eight percent ofhouseholds included at least one person under the age of 18years. Annual income was less than $25,000 in 41 percentof all 87,536 households and 30 percent of the 22,612family households with their own children. Nine percent ofall households had earnings of $100,000 or greater.
Twelve percent of persons age 25 and over did not graduatefrom high school and 20 percent graduated with no furthereducation indicated. Thirty-nine percent obtained abachelor’s degree or higher. Of 50,669 persons age 18 to 24years, 93 percent were high school graduates. Four percentof persons 16 to 19 years old were not in school and notworking.
Children under age 18 represented 20 percent of thepopulation in Alachua County, and 20 percent of childrenlived in poverty. Of the 46,939 persons of all ages living inpoverty, 18 percent were under the age of 18 years. Forty-two percent of children lived in low-income householdsand 38 percent lived in high poverty neighborhoods.

Multi-Year Trend Data
** method used for calculating changed in 1998Source: Florida Department of Health, Office of Vital Statistics;Florida Department of Education
1992 1993 1994 1995 1996 1997 1998 1999 2000
Children Under Age 6 Below 100% of PovertyGrandparents Responsible 3 or More Years
100
75
50
25
0
Child
ren
Age 3
& 4
Enrol
led
in S
choo
lO
wn Chi
ldre
n Und
er A
ge 6
with
All Par
ents
in th
e La
bor F
orce
Child
ren
Under
Age
6
Below
200
% o
f Pov
erty
Gra
ndpa
rent
s Res
pons
ible
for
and
Livin
g with
Own
Gra
ndch
ildre
n Und
er A
ge 1
8
Own
Child
ren
Under
Age
6
Livin
g in
Sin
gle
Paren
t Hom
es
Per
cent
Source: US Census Bureau, Census 2000, SF1 and SF3
Critical MeasuresCensus 2000
Birth Rate
Teen Birth Rate Age 15-17
Teen Birth Rate Age 15-19
Percent of Births Receiving Early Prenatal Care
Percent of Low Birthweight Births
Percent of Births to Unwed Mothers
Infant Mortality Rate
Teen Violent Death Rate Age 15-19
Percent of Students Eligible for Free/Reduced Lunch
Graduation Rate**
Source: Policy and Services Research Data Center, de la Parte Institute, USF, 2002
Beh
avio
ral H
ealth
and
Juv
enile
Jus
tice
Source: Florida Department of Juvenile Justice, 2003
Source: Florida Department of Juvenile Justice, 2000/01
Chi
ld C
are,
Hea
d S
tart
and
Edu
catio
n
Source: Florida Department of Education, 2001/02
Source: Florida Children’s Forum, 2001
37 Center for the Study of Children’s Futures 2004
64.9
29.0
60.7
47.252.6
13.7 14.6 12.8 12.3 12.3 11.9 11.4 11.0 11.8
37.6 45.9 39.6 37.3 34.9 28.7 31.3 24.4 27.4
36.4 42.6 36.1 35.2 32.4 27.8 29.5 27.2 27.1
74.4 76.1 79.5 82.3 81.3 82.6 80.8 83.7 84.3
7.6 9.2 8.3 9.1 8.5 8.0 8.2 9.0 8.1
35.7 37.9 35.4 37.1 34.4 35.5 36.5 37.6 38.0
11.0 13.1 12.1 6.5 10.9 8.0 13.6 8.4 10.8
5.5 3.8 3.8 4.4 2.6 4.4 3.4 3.3 3.1
43.3 44.3 44.3 44.3 45.5 46.2 45.4 44.7 43.5
81.3 79.8 75.2 76.0 78.4 78.9 63.3 63.7 61.2
Alachua County
87 licensed child care centers with a capacity for 6,774 children
171 licensed family child care homes with a capacity for 1,710 children
54 Head Start and Early Head Start programs with a capacity for 665 children
29,662 children were enrolled in 66 public schools
7,960 children were enrolled in exceptional student education programs
492 children were referred to English for Speakers of Other Languages Programs
3,345 children were enrolled in 30 non-public schools
747 children and families were registered in 432 home education programs
1,613 children received behavioral health services
28 behavioral health service providers served children
1,441 youths were referred to the juvenile justice system
29 youths were transferred to adult court
2 contracted delinquency prevention programs with 43 beds or slots
1 state grant funded delinquency prevention program projected to serve 120 youths
5 probation and community corrections non-residential programs with 221 slots
1 residential and correctional program with 22 beds
1 detention center with 72 beds

Number Percent Number Percent
Summary Profile for the Population Under Age 18, 1990 to 2000
1990 2000
Age & Sex
Population Under Age 18
Males Under Age 18
Females Under Age 18
Population Under Age 5
Population Age 5 - 17
Race
Children of One Race
White Children
Black or African American Children
American Indian or Alaska Native Children
Asian Children
Native Hawaiian or Other Pacific Islander Children
Children of Some Other Race
Children of Two or More Races
Hispanic Origin Status
Hispanic Children
Non-Hispanic Children
Non-Hispanic White Children
Non-Hispanic Racial Minorities
Living Arrangements
Children Living in Households
Children Living in Group Quarters
Own Children Living in Single Parent Households
Own Children Living in Married Couple Households
Source: Population Reference Bureau analysis of data from the US Census Bureau for the Annie E. Casey Foundation
1999 Income in Dollars as Reported in Census 2000
• •
•
•
Source: US Census Bureau, Census 2000, SF3 Tables P82, P53, P80 and PCT39
Number NumberPercent Percent
Source: US Census Bureau, Census 2000, SF1 and SF3;Florida Almanac, 2002/2003; Florida County Atlas, 1994
38Center for the Study of Children’s Futures 2004
5,631 100.0 6,118 100.0
2,885 51.2 3,148 51.5
2,746 48.8 2,970 48.5
1,439 25.6 1,561 25.5
4,192 74.4 4,557 74.5
N/A N/A 6,044 98.8
4,777 84.8 5,144 84.1
834 14.8 853 13.9
9 0.2 14 0.2
N/A N/A 17 0.3
N/A N/A 1 0.0
0 0.0 15 0.2
N/A N/A 74 1.2
35 0.6 94 1.5
5,596 99.4 6,024 98.5
4,747 84.3 5,071 82.9
849 15.1 953 15.6
5,586 99.2 6,102 99.7
45 0.8 16 0.3
972 17.3 1,365 22.3
4,019 71.4 3,970 64.9
Per Capita Income .................... 15,164 Median Family Income .............................. 43,503
Median Household Income ...... 40,035 with own children under age 18 ............. 41,921
Median Nonfamily Income....... 19,031 without own children under age 18 ........ 45,114
Baker County was established in 1861 from NewRiver County and was named for James McNairBaker. The county seat is Macclenny. The
Battle of Olustee, one of the state’s most importantbattles during the War Between the States, was foughthere. The county is primarily an agricultural countyknown for the Osceola National Forest, fishing andvaluable wetlands.
The county comprises 585 square miles of land and waspopulated by 22,259 persons in 2000. There were 38persons per square mile and the general populationincreased by 20 percent from 1990. Sixty-four percent ofthe population lived in a rural area. The median age in2000 was 34 years.
There were 7,592 housing units reported with ahomeownership rate of 81 percent. Forty-six percent ofhouseholds included at least one person under the age of18 years. Annual income was less than $25,000 in 31percent of all 7,075 households and 27 percent of the 2,987family households with their own children. Five percent ofall households had earnings of $100,000 or greater.
Twenty-eight percent of persons age 25 and over did notgraduate from high school and 41 percent graduated withno further education indicated. Eight percent obtained abachelor’s degree or higher. Of 2,192 persons age 18 to 24years, 61 percent were high school graduates. Eighteenpercent of persons 16 to 19 years old were not in schooland not working.
Children under age 18 represented 27 percent of thepopulation in Baker County, and 23 percent of childrenlived in poverty. Of the 2,961 persons of all ages living inpoverty, 47 percent were under the age of 18 years. Forty-five percent of children lived in low-income householdsand no children lived in high poverty neighborhoods.

Multi-Year Trend Data
** method used for calculating changed in 1998Source: Florida Department of Health, Office of Vital Statistics;Florida Department of Education
1992 1993 1994 1995 1996 1997 1998 1999 2000
Children Under Age 6 Below 100% of PovertyGrandparents Responsible 3 or More Years
100
75
50
25
0
Child
ren
Age 3
& 4
Enrol
led
in S
choo
lO
wn Chi
ldre
n Und
er A
ge 6
with
All Par
ents
in th
e La
bor F
orce
Child
ren
Under
Age
6
Below
200
% o
f Pov
erty
Gra
ndpa
rent
s Res
pons
ible
for
and
Livin
g with
Own
Gra
ndch
ildre
n Und
er A
ge 1
8
Own
Child
ren
Under
Age
6
Livin
g in
Sin
gle
Paren
t Hom
es
Per
cent
Source: US Census Bureau, Census 2000, SF1 and SF3
Critical MeasuresCensus 2000
Birth Rate
Teen Birth Rate Age 15-17
Teen Birth Rate Age 15-19
Percent of Births Receiving Early Prenatal Care
Percent of Low Birthweight Births
Percent of Births to Unwed Mothers
Infant Mortality Rate
Teen Violent Death Rate Age 15-19
Percent of Students Eligible for Free/Reduced Lunch
Graduation Rate**
Source: Policy and Services Research Data Center, de la Parte Institute, USF, 2002
Beh
avio
ral H
ealth
and
Juv
enile
Jus
tice
Source: Florida Department of Juvenile Justice, 2003
Source: Florida Department of Juvenile Justice, 2000/01
Chi
ld C
are,
Hea
d S
tart
and
Edu
catio
n
Source: Florida Department of Education, 2001/02
Source: Florida Children’s Forum, 2001
39 Center for the Study of Children’s Futures 2004
37.9
21.9
70.2
42.7
63.8
14.9 15.7 13.8 15.1 13.6 14.8 15.4 17.7 15.7
49.1 54.0 53.4 46.1 38.0 46.4 59.6 58.3 40.4
90.5 90.9 75.5 72.3 63.0 72.2 83.2 96.2 88.0
78.4 78.8 79.0 85.1 86.2 80.9 83.8 86.2 85.4
7.7 5.9 6.9 7.1 7.8 6.4 5.2 7.4 6.7
31.8 37.3 38.3 33.1 37.2 39.2 36.3 42.2 37.6
7.0 13.1 3.6 19.5 10.6 12.7 6.2 5.1 2.8
18.6 0.0 0.0 0.0 0.0 0.0 0.0 16.2 5.4
41.9 39.7 42.5 42.4 41.9 38.7 38.4 39.0 38.2
75.2 87.4 72.9 77.9 82.3 67.0 55.7 54.3 55.1
Baker County
11 licensed child care centers with a capacity for 221 children
4 licensed family child care homes with a capacity for 10 children
5 Head Start and Early Head Start programs with a capacity for 82 children
4,490 children were enrolled in 8 public schools
616 children were enrolled in exceptional student education programs
0 children were referred to English for Speakers of Other Languages Programs
53 children were enrolled in 2 non-public schools
59 children and families were registered in 39 home education programs
132 children received behavioral health services
16 behavioral health service providers served children
162 youths were referred to the juvenile justice system
2 youths were transferred to adult court
0 contracted delinquency prevention programs
1 state grant funded delinquency prevention program projected to serve 85 youths
0 probation and community corrections non-residential programs
0 residential and correctional programs
0 detention centers

Number Percent Number Percent
Summary Profile for the Population Under Age 18, 1990 to 2000
1990 2000
Age & Sex
Population Under Age 18
Males Under Age 18
Females Under Age 18
Population Under Age 5
Population Age 5 - 17
Race
Children of One Race
White Children
Black or African American Children
American Indian or Alaska Native Children
Asian Children
Native Hawaiian or Other Pacific Islander Children
Children of Some Other Race
Children of Two or More Races
Hispanic Origin Status
Hispanic Children
Non-Hispanic Children
Non-Hispanic White Children
Non-Hispanic Racial Minorities
Living Arrangements
Children Living in Households
Children Living in Group Quarters
Own Children Living in Single Parent Households
Own Children Living in Married Couple Households
Source: Population Reference Bureau analysis of data from the US Census Bureau for the Annie E. Casey Foundation
1999 Income in Dollars as Reported in Census 2000
• •
•
•
Source: US Census Bureau, Census 2000, SF3 Tables P82, P53, P80 and PCT39
Number NumberPercent Percent
Source: US Census Bureau, Census 2000, SF1 and SF3;Florida Almanac, 2002/2003; Florida County Atlas, 1994
40Center for the Study of Children’s Futures 2004
32,249 100.0 35,642 100.0
16,508 51.2 18,319 51.4
15,741 48.8 17,323 48.6
9,216 28.6 8,979 25.2
23,033 71.4 26,663 74.8
N/A N/A 34,319 96.3
26,141 81.1 27,926 78.4
4,885 15.1 5,112 14.3
301 0.9 283 0.8
N/A N/A 614 1.7
N/A N/A 29 0.1
192 0.6 355 1.0
N/A N/A 1,323 3.7
750 2.3 1,095 3.1
31,499 97.7 34,547 96.9
25,629 79.5 27,346 76.7
5,870 18.2 7,201 20.2
32,172 99.8 35,530 99.7
77 0.2 112 0.3
6,907 21.4 9,619 27.0
22,450 69.6 22,302 62.6
Per Capita Income .................... 18,700 Median Family Income .............................. 42,729
Median Household Income ...... 36,092 with own children under age 18 ............. 39,542
Median Nonfamily Income....... 21,747 without own children under age 18 ........ 46,104
Bay County was established in 1913 fromWashington County and was named for St.Andrews Bay. The county seat is Panama City.
Outstanding beaches are of note and the county is afavorite tourist site, particularly St. Andrew’s StateRecreation Area. Private employers include hospital,paper and chemical manufacturers, and Tyndall AirForce Base which adjoins the county seat.
The county comprises 764 square miles of land and waspopulated by 148,217 persons in 2000. There were 194persons per square mile and the general populationincreased by 17 percent from 1990. Eleven percent of thepopulation lived in a rural area. The median age in 2000was 37 years.
There were 78,435 housing units reported with ahomeownership rate of 69 percent. Thirty-four percent ofhouseholds included at least one person under the age of 18years. Annual income was less than $25,000 in 33 percentof all 59,594 households and 31 percent of the 18,356family households with their own children. Seven percentof all households had earnings of $100,000 or greater.
Nineteen percent of persons age 25 and over did notgraduate from high school and 31 percent graduated withno further education indicated. Eighteen percent obtained abachelor’s degree or higher. Of 12,802 persons age 18 to 24years, 72 percent were high school graduates. Eight percentof persons 16 to 19 years old were not in school and notworking.
Children under age 18 represented 24 percent of thepopulation in Bay County, and 19 percent of children livedin poverty. Of the 18,882 persons of all ages living inpoverty, 35 percent were under the age of 18 years. Forty-four percent of children lived in low-income householdsand 16 percent lived in high poverty neighborhoods.

Multi-Year Trend Data
** method used for calculating changed in 1998Source: Florida Department of Health, Office of Vital Statistics;Florida Department of Education
1992 1993 1994 1995 1996 1997 1998 1999 2000
Children Under Age 6 Below 100% of PovertyGrandparents Responsible 3 or More Years
100
75
50
25
0
Child
ren
Age 3
& 4
Enrol
led
in S
choo
lO
wn Chi
ldre
n Und
er A
ge 6
with
All Par
ents
in th
e La
bor F
orce
Child
ren
Under
Age
6
Below
200
% o
f Pov
erty
Gra
ndpa
rent
s Res
pons
ible
for
and
Livin
g with
Own
Gra
ndch
ildre
n Und
er A
ge 1
8
Own
Child
ren
Under
Age
6
Livin
g in
Sin
gle
Paren
t Hom
es
Per
cent
Source: US Census Bureau, Census 2000, SF1 and SF3
Critical MeasuresCensus 2000
Birth Rate
Teen Birth Rate Age 15-17
Teen Birth Rate Age 15-19
Percent of Births Receiving Early Prenatal Care
Percent of Low Birthweight Births
Percent of Births to Unwed Mothers
Infant Mortality Rate
Teen Violent Death Rate Age 15-19
Percent of Students Eligible for Free/Reduced Lunch
Graduation Rate**
Source: Policy and Services Research Data Center, de la Parte Institute, USF, 2002
Beh
avio
ral H
ealth
and
Juv
enile
Jus
tice
Source: Florida Department of Juvenile Justice, 2003
Source: Florida Department of Juvenile Justice, 2000/01
Chi
ld C
are,
Hea
d S
tart
and
Edu
catio
n
Source: Florida Department of Education, 2001/02
Source: Florida Children’s Forum, 2001
41 Center for the Study of Children’s Futures 2004
52.3
26.1
61.4
48.6
55.3
16.2 15.6 14.3 14.3 13.8 13.8 13.6 13.0 13.1
47.3 42.8 45.0 42.3 39.8 38.9 34.5 38.0 29.7
73.2 76.4 74.5 72.1 66.0 65.3 64.1 69.3 58.2
79.8 79.9 83.3 86.3 83.7 82.5 83.9 83.6 85.2
7.3 6.7 8.1 5.8 7.9 8.1 7.0 7.5 6.9
27.9 31.1 32.4 32.3 32.5 33.8 33.7 36.9 34.7
12.2 8.1 10.7 5.5 13.3 8.5 6.9 12.3 5.0
6.7 4.5 7.8 6.6 9.6 2.1 4.0 3.9 6.9
42.9 44.7 45.9 44.6 45.5 45.1 44.9 44.2 43.5
74.4 71.0 68.5 68.0 70.8 72.2 55.9 65.9 68.3
Bay County
53 licensed child care centers with a capacity for 4,526 children
18 licensed family child care homes with a capacity for 184 children
18 Head Start and Early Head Start programs with a capacity for 519 children
26,058 children were enrolled in 45 public schools
5,419 children were enrolled in exceptional student education programs
208 children were referred to English for Speakers of Other Languages Programs
1,594 children were enrolled in 10 non-public schools
568 children and families were registered in 399 home education programs
1,660 children received behavioral health services
18 behavioral health service providers served children
1,129 youths were referred to the juvenile justice system
38 youths were transferred to adult court
1 contracted delinquency prevention program with 4 beds or slots
1 state grant funded delinquency prevention program projected to serve 350 youths
3 probation and community corrections non-residential programs with 100 slots
2 residential and correctional programs with 62 beds
1 detention center with 52 beds

Number Percent Number Percent
Summary Profile for the Population Under Age 18, 1990 to 2000
1990 2000
Age & Sex
Population Under Age 18
Males Under Age 18
Females Under Age 18
Population Under Age 5
Population Age 5 - 17
Race
Children of One Race
White Children
Black or African American Children
American Indian or Alaska Native Children
Asian Children
Native Hawaiian or Other Pacific Islander Children
Children of Some Other Race
Children of Two or More Races
Hispanic Origin Status
Hispanic Children
Non-Hispanic Children
Non-Hispanic White Children
Non-Hispanic Racial Minorities
Living Arrangements
Children Living in Households
Children Living in Group Quarters
Own Children Living in Single Parent Households
Own Children Living in Married Couple Households
Source: Population Reference Bureau analysis of data from the US Census Bureau for the Annie E. Casey Foundation
1999 Income in Dollars as Reported in Census 2000
• •
•
•
Source: US Census Bureau, Census 2000, SF3 Tables P82, P53, P80 and PCT39
Number NumberPercent Percent
Source: US Census Bureau, Census 2000, SF1 and SF3;Florida Almanac, 2002/2003; Florida County Atlas, 1994
42Center for the Study of Children’s Futures 2004
5,406 100.0 5,725 100.0
2,811 52.0 2,993 52.3
2,595 48.0 2,732 47.7
1,419 26.2 1,444 25.2
3,987 73.8 4,281 74.8
N/A N/A 5,627 98.3
4,254 78.7 4,371 76.3
1,095 20.3 1,149 20.1
17 0.3 14 0.2
N/A N/A 36 0.6
N/A N/A 12 0.2
13 0.2 45 0.8
N/A N/A 98 1.7
69 1.3 138 2.4
5,337 98.7 5,587 97.6
4,201 77.7 4,298 75.1
1,136 21.0 1,289 22.5
5,387 99.6 5,707 99.7
19 0.4 18 0.3
1,107 20.5 1,483 25.9
3,655 67.6 3,442 60.1
Per Capita Income .................... 14,226 Median Family Income .............................. 39,123
Median Household Income ...... 33,140 with own children under age 18 ............. 39,286
Median Nonfamily Income....... 18,041 without own children under age 18 ........ 38,979
Bradford County was established in 1858 as NewRiver County and was renamed in 1861 inhonor of Captain Richard Bradford. The county
seat is Starke. Truck crops, tobacco, timber andlivestock play an important economic role andmanufacturers of mineral sand, work clothing andwood products are also present.
The county comprises 293 square miles of land and waspopulated by 26,088 persons in 2000. There were 89persons per square mile and the general populationincreased by 16 percent from 1990. Sixty-six percent of thepopulation lived in a rural area. The median age in 2000was 37 years.
There were 9,605 housing units reported with ahomeownership rate of 79 percent. Thirty-seven percent ofhouseholds included at least one person under the age of 18years. Annual income was less than $25,000 in 37 percentof all 8,525 households and 30 percent of the 2,778 familyhouseholds with their own children. Four percent of allhouseholds had earnings of $100,000 or greater.
Twenty-six percent of persons age 25 and over did notgraduate from high school and 40 percent graduated withno further education indicated. Eight percent obtained abachelor’s degree or higher. Of 2,525 persons age 18 to 24years, 59 percent were high school graduates. Thirteenpercent of persons 16 to 19 years old were not in schooland not working.
Children under age 18 represented 22 percent of thepopulation in Bradford County, and 19 percent of childrenlived in poverty. Of the 3,183 persons of all ages living inpoverty, 33 percent were under the age of 18 years. Forty-nine percent of children lived in low-income householdsand 26 percent lived in high poverty neighborhoods.

Multi-Year Trend Data
** method used for calculating changed in 1998Source: Florida Department of Health, Office of Vital Statistics;Florida Department of Education
1992 1993 1994 1995 1996 1997 1998 1999 2000
Children Under Age 6 Below 100% of PovertyGrandparents Responsible 3 or More Years
100
75
50
25
0
Child
ren
Age 3
& 4
Enrol
led
in S
choo
lO
wn Chi
ldre
n Und
er A
ge 6
with
All Par
ents
in th
e La
bor F
orce
Child
ren
Under
Age
6
Below
200
% o
f Pov
erty
Gra
ndpa
rent
s Res
pons
ible
for
and
Livin
g with
Own
Gra
ndch
ildre
n Und
er A
ge 1
8
Own
Child
ren
Under
Age
6
Livin
g in
Sin
gle
Paren
t Hom
es
Per
cent
Source: US Census Bureau, Census 2000, SF1 and SF3
Critical MeasuresCensus 2000
Birth Rate
Teen Birth Rate Age 15-17
Teen Birth Rate Age 15-19
Percent of Births Receiving Early Prenatal Care
Percent of Low Birthweight Births
Percent of Births to Unwed Mothers
Infant Mortality Rate
Teen Violent Death Rate Age 15-19
Percent of Students Eligible for Free/Reduced Lunch
Graduation Rate**
Source: Policy and Services Research Data Center, de la Parte Institute, USF, 2002
Beh
avio
ral H
ealth
and
Juv
enile
Jus
tice
Source: Florida Department of Juvenile Justice, 2003
Source: Florida Department of Juvenile Justice, 2000/01
Chi
ld C
are,
Hea
d S
tart
and
Edu
catio
n
Source: Florida Department of Education, 2001/02
Source: Florida Children’s Forum, 2001
43 Center for the Study of Children’s Futures 2004
54.6
25.3
67.0
47.9 48.5 13.2 13.5 13.0 11.1 13.1 12.9 12.1 13.3 12.4
82.2 81.1 65.9 49.3 63.2 67.2 36.6 38.6 35.2
98.6 102.1 118.5 88.9 92.3 92.9 77.2 99.9 73.7
78.7 81.1 77.3 81.4 80.4 83.4 81.7 82.7 81.4
9.8 4.5 9.3 7.8 7.1 8.0 8.8 8.3 7.2
36.1 37.6 39.0 39.3 35.0 38.0 36.0 43.7 44.4
3.3 3.2 6.4 0.0 15.5 18.4 13.0 5.9 12.5
6.6 6.5 12.7 0.0 0.0 0.0 24.4 6.1 0.0
39.3 43.1 48.7 48.2 53.5 54.5 46.8 45.3 54.1
79.3 75.6 75.8 50.3 61.2 69.7 60.4 67.4 70.8
Bradford County
18 licensed child care centers with a capacity for 189 children
3 licensed family child care homes with a capacity for 10 children
2 Head Start programs with a capacity for 90 children
4,097 children were enrolled in 13 public schools
1,037 children were enrolled in exceptional student education programs
23 children were referred to English for Speakers of Other Languages Programs
75 children were enrolled in 3 non-public schools
93 children and families were registered in 64 home education programs
228 children received behavioral health services
17 behavioral health service providers served children
144 youths were referred to the juvenile justice system
3 youths were transferred to adult court
0 contracted delinquency prevention programs
1 state grant funded delinquency prevention program projected to serve 50 youths
0 probation and community corrections non-residential programs
0 residential and correctional programs
0 detention centers

Number Percent Number Percent
Summary Profile for the Population Under Age 18, 1990 to 2000
1990 2000
Age & Sex
Population Under Age 18
Males Under Age 18
Females Under Age 18
Population Under Age 5
Population Age 5 - 17
Race
Children of One Race
White Children
Black or African American Children
American Indian or Alaska Native Children
Asian Children
Native Hawaiian or Other Pacific Islander Children
Children of Some Other Race
Children of Two or More Races
Hispanic Origin Status
Hispanic Children
Non-Hispanic Children
Non-Hispanic White Children
Non-Hispanic Racial Minorities
Living Arrangements
Children Living in Households
Children Living in Group Quarters
Own Children Living in Single Parent Households
Own Children Living in Married Couple Households
Source: Population Reference Bureau analysis of data from the US Census Bureau for the Annie E. Casey Foundation
1999 Income in Dollars as Reported in Census 2000
• •
•
•
Source: US Census Bureau, Census 2000, SF3 Tables P82, P53, P80 and PCT39
Number NumberPercent Percent
Source: US Census Bureau, Census 2000, SF1 and SF3;Florida Almanac, 2002/2003; Florida County Atlas, 1994
44Center for the Study of Children’s Futures 2004
87,454 100.0 104,699 100.0
44,765 51.2 53,839 51.4
42,689 48.8 50,860 48.6
26,380 30.2 24,707 23.6
61,074 69.8 79,992 76.4
N/A N/A 101,094 96.6
73,865 84.5 84,238 80.5
11,043 12.6 13,104 12.5
312 0.4 449 0.4
N/A N/A 1,426 1.4
N/A N/A 69 0.1
771 0.9 1,808 1.7
N/A N/A 3,605 3.4
3,485 4.0 6,741 6.4
83,969 96.0 97,958 93.6
71,351 81.6 80,044 76.5
12,618 14.4 17,914 17.1
86,877 99.3 103,897 99.2
577 0.7 802 0.8
16,931 19.4 25,994 24.8
61,553 70.4 67,634 64.6
Per Capita Income .................... 21,484 Median Family Income .............................. 47,571
Median Household Income ...... 40,099 with own children under age 18 ............. 46,482
Median Nonfamily Income....... 24,911 without own children under age 18 ........ 48,312
Brevard County was established in 1844 from aportion of Mosquito County and wasoriginally named St. Lucie. The county seat is
Titusville. The county stretches along the coast of theAtlantic Ocean and the U.S. space program is a focalpoint. The largest employers are electronics andaerospace manufacturers.
The county comprises 1,018 square miles of land and waspopulated by 476,230 persons in 2000. There were 468persons per square mile and the general populationincreased by 19 percent from 1990. Five percent of thepopulation lived in a rural area. The median age in 2000was 41 years.
There were 222,072 housing units reported with ahomeownership rate of 75 percent. Twenty-nine percent ofhouseholds included at least one person under the age of18 years. Annual income was less than $25,000 in 29percent of all 198,371 households and 23 percent of the53,525 family households with their own children. Ninepercent of all households had earnings of $100,000 orgreater.
Fourteen percent of persons age 25 and over did notgraduate from high school and 29 percent graduated withno further education indicated. Twenty-four percentobtained a bachelor’s degree or higher. Of 32,158 personsage 18 to 24 years, 71 percent were high school graduates.Nine percent of persons 16 to 19 years old were not inschool and not working.
Children under age 18 represented 22 percent of thepopulation in Brevard County, and 13 percent of childrenlived in poverty. Of the 44,218 persons of all ages living inpoverty, 31 percent were under the age of 18 years. Thirty-six percent of children lived in low-income households and10 percent lived in high poverty neighborhoods.

Multi-Year Trend Data
** method used for calculating changed in 1998Source: Florida Department of Health, Office of Vital Statistics;Florida Department of Education
1992 1993 1994 1995 1996 1997 1998 1999 2000
Children Under Age 6 Below 100% of PovertyGrandparents Responsible 3 or More Years
100
75
50
25
0
Child
ren
Age 3
& 4
Enrol
led
in S
choo
lO
wn Chi
ldre
n Und
er A
ge 6
with
All Par
ents
in th
e La
bor F
orce
Child
ren
Under
Age
6
Below
200
% o
f Pov
erty
Gra
ndpa
rent
s Res
pons
ible
for
and
Livin
g with
Own
Gra
ndch
ildre
n Und
er A
ge 1
8
Own
Child
ren
Under
Age
6
Livin
g in
Sin
gle
Paren
t Hom
es
Per
cent
Source: US Census Bureau, Census 2000, SF1 and SF3
Critical MeasuresCensus 2000
Birth Rate
Teen Birth Rate Age 15-17
Teen Birth Rate Age 15-19
Percent of Births Receiving Early Prenatal Care
Percent of Low Birthweight Births
Percent of Births to Unwed Mothers
Infant Mortality Rate
Teen Violent Death Rate Age 15-19
Percent of Students Eligible for Free/Reduced Lunch
Graduation Rate**
Source: Policy and Services Research Data Center, de la Parte Institute, USF, 2002
Beh
avio
ral H
ealth
and
Juv
enile
Jus
tice
Source: Florida Department of Juvenile Justice, 2003
Source: Florida Department of Juvenile Justice, 2000/01
Chi
ld C
are,
Hea
d S
tart
and
Edu
catio
n
Source: Florida Department of Education, 2001/02
Source: Florida Children’s Forum, 2001
45 Center for the Study of Children’s Futures 2004
55.3
22.0
59.1
39.0
50.513.2 12.4 11.9 11.0 11.0 10.4 10.3 9.9 10.3
33.3 34.4 33.9 32.9 25.7 26.7 24.4 23.5 18.4
54.7 49.3 51.0 49.8 42.4 41.4 41.1 41.7 40.3
85.4 86.3 85.8 88.2 87.1 86.4 86.9 86.2 86.2
6.2 6.8 6.8 7.3 6.7 6.8 7.2 7.5 7.4
27.6 27.5 27.7 29.0 29.1 30.6 30.3 34.6 34.8
6.9 6.2 8.0 5.3 5.8 5.2 3.9 4.9 5.2
4.6 6.6 4.0 5.3 3.4 4.0 3.6 5.5 6.1
26.9 29.1 29.6 30.0 29.8 29.3 23.4 19.3 29.7
81.5 79.0 76.2 73.0 72.4 69.3 64.0 80.4 86.8
Brevard County
224 licensed child care centers with a capacity for 17,954 children
69 licensed family child care homes with a capacity for 644 children
30 Head Start and Early Head Start programs with a capacity for 744 children
71,755 children were enrolled in 117 public schools
16,119 children were enrolled in exceptional student education programs
974 children were referred to English for Speakers of Other Languages Programs
9,914 children were enrolled in 60 non-public schools
1,737 children and families were registered in 1,180 home education programs
4,573 children received behavioral health services
38 behavioral health service providers served children
3,028 youths were referred to the juvenile justice system
23 youths were transferred to adult court
2 contracted delinquency prevention programs with 74 beds or slots
2 state grant funded delinquency prevention programs projected to serve 358 youths
3 probation and community corrections non-residential programs with 143 slots
4 residential and correctional programs with 89 beds
1 detention center with 52 beds

Number Percent Number Percent
Summary Profile for the Population Under Age 18, 1990 to 2000
1990 2000
Age & Sex
Population Under Age 18
Males Under Age 18
Females Under Age 18
Population Under Age 5
Population Age 5 - 17
Race
Children of One Race
White Children
Black or African American Children
American Indian or Alaska Native Children
Asian Children
Native Hawaiian or Other Pacific Islander Children
Children of Some Other Race
Children of Two or More Races
Hispanic Origin Status
Hispanic Children
Non-Hispanic Children
Non-Hispanic White Children
Non-Hispanic Racial Minorities
Living Arrangements
Children Living in Households
Children Living in Group Quarters
Own Children Living in Single Parent Households
Own Children Living in Married Couple Households
Source: Population Reference Bureau analysis of data from the US Census Bureau for the Annie E. Casey Foundation
1999 Income in Dollars as Reported in Census 2000
• •
•
•
Source: US Census Bureau, Census 2000, SF3 Tables P82, P53, P80 and PCT39
Number NumberPercent Percent
Source: US Census Bureau, Census 2000, SF1 and SF3;Florida Almanac, 2002/2003; Florida County Atlas, 1994
46Center for the Study of Children’s Futures 2004
256,618 100.0 382,929 100.0
131,298 51.2 196,425 51.3
125,320 48.8 186,504 48.7
78,980 30.8 103,041 26.9
177,638 69.2 279,888 73.1
N/A N/A 365,051 95.3
178,095 69.4 225,180 58.8
67,986 26.5 113,863 29.7
702 0.3 1,184 0.3
N/A N/A 9,191 2.4
N/A N/A 225 0.1
4,968 1.9 15,408 4.0
N/A N/A 17,878 4.7
28,626 11.2 75,281 19.7
227,992 88.8 307,648 80.3
156,278 60.9 171,377 44.8
71,714 27.9 136,271 35.6
255,982 99.8 382,001 99.8
636 0.2 928 0.2
58,213 22.7 100,923 26.4
170,700 66.5 240,332 62.8
Per Capita Income .................... 23,170 Median Family Income .............................. 50,531
Median Household Income ...... 41,691 with own children under age 18 ............. 50,054
Median Nonfamily Income....... 27,417 without own children under age 18 ........ 50,961
Broward County was established in 1915 from aportion of Dade County and was named forNapoleon B. Broward, governor from 1905 to 1909.
The county seat is Fort Lauderdale. The eastern portionof this county is metropolitan while the west has been theunpopulated Everglades. The county has denselypopulated areas and is also known for Ft. LauderdaleBeach. Major private employers are in financial services,computers, telecommunications, and radio products.
The county comprises 1,205 square miles of land and waspopulated by 1,623,018 persons in 2000. There were 1,347persons per square mile and the general population increasedby 29 percent from 1990. Less than one percent of thepopulation lived in a rural area. The median age in 2000 was38 years.
There were 741,043 housing units reported with ahomeownership rate of 69 percent. Thirty-two percent ofhouseholds included at least one person under the age of 18years. Annual income was less than $25,000 in 29 percent ofall 654,787 households and 22 percent of the 195,507 familyhouseholds with their own children. Thirteen percent of allhouseholds had earnings of $100,000 or greater.
Eighteen percent of persons age 25 and over did notgraduate from high school and 28 percent graduated with nofurther education indicated. Twenty-five percent obtained abachelor’s degree or higher. Of 115,055 persons age 18 to 24years, 71 percent were high school graduates. Nine percentof persons 16 to 19 years old were not in school and notworking.
Children under age 18 represented 24 percent of thepopulation in Broward County, and 16 percent of childrenlived in poverty. Of the 184,589 persons of all ages living inpoverty, 32 percent were under the age of 18 years. Thirty-six percent of children lived in low-income households and16 percent lived in high poverty neighborhoods.

Multi-Year Trend Data
** method used for calculating changed in 1998Source: Florida Department of Health, Office of Vital Statistics;Florida Department of Education
1992 1993 1994 1995 1996 1997 1998 1999 2000
Children Under Age 6 Below 100% of PovertyGrandparents Responsible 3 or More Years
100
75
50
25
0
Child
ren
Age 3
& 4
Enrol
led
in S
choo
lO
wn Chi
ldre
n Und
er A
ge 6
with
All Par
ents
in th
e La
bor F
orce
Child
ren
Under
Age
6
Below
200
% o
f Pov
erty
Gra
ndpa
rent
s Res
pons
ible
for
and
Livin
g with
Own
Gra
ndch
ildre
n Und
er A
ge 1
8
Own
Child
ren
Under
Age
6
Livin
g in
Sin
gle
Paren
t Hom
es
Per
cent
Source: US Census Bureau, Census 2000, SF1 and SF3
Critical MeasuresCensus 2000
Birth Rate
Teen Birth Rate Age 15-17
Teen Birth Rate Age 15-19
Percent of Births Receiving Early Prenatal Care
Percent of Low Birthweight Births
Percent of Births to Unwed Mothers
Infant Mortality Rate
Teen Violent Death Rate Age 15-19
Percent of Students Eligible for Free/Reduced Lunch
Graduation Rate**
Source: Policy and Services Research Data Center, de la Parte Institute, USF, 2002
Beh
avio
ral H
ealth
and
Juv
enile
Jus
tice
Source: Florida Department of Juvenile Justice, 2003
Source: Florida Department of Juvenile Justice, 2000/01
Chi
ld C
are,
Hea
d S
tart
and
Edu
catio
n
Source: Florida Department of Education, 2001/02
Source: Florida Children’s Forum, 2001
47 Center for the Study of Children’s Futures 2004
59.6
21.7
61.7
36.7 37.6
14.1 14.6 14.5 14.7 14.3 14.3 14.1 14.1 14.6
34.6 39.1 37.8 40.5 36.2 34.4 32.9 28.2 21.6
52.4 55.6 54.2 57.3 54.8 53.0 50.8 48.3 39.8
83.7 85.0 84.7 85.8 86.0 85.5 83.9 83.7 83.7
7.5 7.8 8.1 7.5 8.1 8.2 8.2 8.4 8.2
32.1 32.9 33.7 32.7 33.2 32.3 33.5 33.6 34.4
9.1 10.1 9.7 8.5 7.3 6.9 6.7 7.0 5.8
5.9 5.3 6.2 4.9 5.3 5.2 5.3 4.3 4.7
33.8 34.9 33.8 37.6 36.8 37.1 36.8 36.4 36.5
74.2 64.1 70.6 73.3 72.5 71.1 53.5 63.9 62.3
Broward County
466 licensed child care centers with a capacity for 63,116 children
256 licensed family child care homes with a capacity for 945 children
94 Head Start and Early Head Start programs with a capacity for 1,915 children
262,028 children were enrolled in 246 public schools
38,853 children were enrolled in exceptional student education programs
30,298 children were referred to English for Speakers of Other Languages Programs
43,543 children were enrolled in 163 non-public schools
3,211 children and families were registered in 2,140 home education programs
9,344 children received behavioral health services
75 behavioral health service providers served children
8,326 youths were referred to the juvenile justice system
145 youths were transferred to adult court
3 contracted delinquency prevention programs with 54 beds or slots
5 state grant funded delinquency prevention programs projected to serve 490 youths
6 probation and community corrections non-residential programs with 343 slots
8 residential and correctional programs with 322 beds
1 detention center with 109 beds

Number Percent Number Percent
Summary Profile for the Population Under Age 18, 1990 to 2000
1990 2000
Age & Sex
Population Under Age 18
Males Under Age 18
Females Under Age 18
Population Under Age 5
Population Age 5 - 17
Race
Children of One Race
White Children
Black or African American Children
American Indian or Alaska Native Children
Asian Children
Native Hawaiian or Other Pacific Islander Children
Children of Some Other Race
Children of Two or More Races
Hispanic Origin Status
Hispanic Children
Non-Hispanic Children
Non-Hispanic White Children
Non-Hispanic Racial Minorities
Living Arrangements
Children Living in Households
Children Living in Group Quarters
Own Children Living in Single Parent Households
Own Children Living in Married Couple Households
Source: Population Reference Bureau analysis of data from the US Census Bureau for the Annie E. Casey Foundation
1999 Income in Dollars as Reported in Census 2000
• •
•
•
Source: US Census Bureau, Census 2000, SF3 Tables P82, P53, P80 and PCT39
Number NumberPercent Percent
Source: US Census Bureau, Census 2000, SF1 and SF3;Florida Almanac, 2002/2003; Florida County Atlas, 1994
48Center for the Study of Children’s Futures 2004
2,871 100.0 3,021 100.0
1,483 51.7 1,555 51.5
1,388 48.3 1,466 48.5
781 27.2 767 25.4
2,090 72.8 2,254 74.6
N/A N/A 2,974 98.4
2,348 81.8 2,476 82.0
471 16.4 413 13.7
42 1.5 40 1.3
N/A N/A 20 0.7
N/A N/A 0 0.0
5 0.2 25 0.8
N/A N/A 47 1.6
33 1.1 88 2.9
2,838 98.9 2,933 97.1
2,322 80.9 2,419 80.1
516 18.0 514 17.0
2,862 99.7 3,019 99.9
9 0.3 2 0.1
690 24.0 740 24.5
1,829 63.7 1,879 62.2
Per Capita Income .................... 12,379 Median Family Income .............................. 32,848
Median Household Income ...... 26,575 with own children under age 18 ............. 31,806
Median Nonfamily Income....... 13,932 without own children under age 18 ........ 34,195
Calhoun County was established in 1838 and istucked in the Panhandle a short distance fromthe Gulf of Mexico and the Georgia and Alabama
state lines. The county seat is Blountstown. The area isprimarily wetlands and forests and is largely undeveloped.The Apalachicola River outlines the county’s easternborder and the Chipola River bisects the county; they bothprovide recreational activities. Small industries includetrucking, flowers, clothing and wood products.
The county comprises 567 square miles of land and waspopulated by 13,017 persons in 2000. There were 23persons per square mile and the general populationincreased by 18 percent from 1990. Sixty-six percent of thepopulation lived in a rural area. The median age in 2000was 36 years.
There were 5,250 housing units reported with ahomeownership rate of 80 percent. Thirty-seven percent ofhouseholds included at least one person under the age of 18years. Annual income was less than $25,000 in 47 percentof all 4,472 households and 35 percent of the 1,466 familyhouseholds with their own children. Three percent of allhouseholds had earnings of $100,000 or greater.
Thirty-one percent of persons age 25 and over did notgraduate from high school and 39 percent graduated withno further education indicated. Eight percent obtained abachelor’s degree or higher. Of 1,133 persons age 18 to 24years, 62 percent were high school graduates. Fourteenpercent of persons 16 to 19 years old were not in schooland not working.
Children under age 18 represented 23 percent of thepopulation in Calhoun County, and 24 percent of childrenlived in poverty. Of the 2,252 persons of all ages living inpoverty, 31 percent were under the age of 18 years. Sixty-one percent of children lived in low-income households and54 percent lived in high poverty neighborhoods.

Multi-Year Trend Data
** method used for calculating changed in 1998Source: Florida Department of Health, Office of Vital Statistics;Florida Department of Education
1992 1993 1994 1995 1996 1997 1998 1999 2000
Children Under Age 6 Below 100% of PovertyGrandparents Responsible 3 or More Years
100
75
50
25
0
Child
ren
Age 3
& 4
Enrol
led
in S
choo
lO
wn Chi
ldre
n Und
er A
ge 6
with
All Par
ents
in th
e La
bor F
orce
Child
ren
Under
Age
6
Below
200
% o
f Pov
erty
Gra
ndpa
rent
s Res
pons
ible
for
and
Livin
g with
Own
Gra
ndch
ildre
n Und
er A
ge 1
8
Own
Child
ren
Under
Age
6
Livin
g in
Sin
gle
Paren
t Hom
es
Per
cent
Source: US Census Bureau, Census 2000, SF1 and SF3
Critical MeasuresCensus 2000
Birth Rate
Teen Birth Rate Age 15-17
Teen Birth Rate Age 15-19
Percent of Births Receiving Early Prenatal Care
Percent of Low Birthweight Births
Percent of Births to Unwed Mothers
Infant Mortality Rate
Teen Violent Death Rate Age 15-19
Percent of Students Eligible for Free/Reduced Lunch
Graduation Rate**
Source: Policy and Services Research Data Center, de la Parte Institute, USF, 2002
Beh
avio
ral H
ealth
and
Juv
enile
Jus
tice
Source: Florida Department of Juvenile Justice, 2003
Source: Florida Department of Juvenile Justice, 2000/01
Chi
ld C
are,
Hea
d S
tart
and
Edu
catio
n
Source: Florida Department of Education, 2001/02
Source: Florida Children’s Forum, 2001
49 Center for the Study of Children’s Futures 2004
36.0
22.8
54.3
67.8
50.811.1 12.0 11.6 11.4 11.7 12.1 11.7 9.1 10.9
50.8 30.4 34.3 35.3 20.2 72.8 48.1 42.4 38.7
66.5 68.6 99.0 61.6 56.2 99.5 80.5 49.1 65.7
87.8 88.2 93.3 88.3 88.9 89.1 91.8 92.9 90.3
9.9 7.6 7.4 7.3 8.3 5.8 14.4 5.4 10.8
28.2 35.4 41.5 30.7 31.3 36.5 35.0 40.3 37.6
7.6 13.9 7.4 21.9 13.9 6.4 6.3 7.8 0.0
0.0 12.2 24.3 34.4 11.8 22.3 10.7 0.0 0.0
40.1 50.6 50.1 45.9 47.6 47.2 49.1 48.7 48.1
80.7 75.3 80.6 73.1 68.1 75.5 83.5 90.4 86.8
Calhoun County
4 licensed child care centers with a capacity for 147 children
1 licensed family child care home with a capacity for 10 children
1 Head Start program with a capacity for 20 children
2,212 children were enrolled in 7 public schools
503 children were enrolled in exceptional student education programs
8 children were referred to English for Speakers of Other Languages Programs
7 children were enrolled in 1 non-public school
78 children and families were registered in 52 home education programs
139 children received behavioral health services
12 behavioral health service providers served children
86 youths were referred to the juvenile justice system
1 youth was transferred to adult court
0 contracted delinquency prevention programs
1 state grant funded delinquency prevention program projected to serve 80 youths
0 probation and community corrections non-residential programs
0 residential and correctional programs
0 detention centers

Number Percent Number Percent
Summary Profile for the Population Under Age 18, 1990 to 2000
1990 2000
Age & Sex
Population Under Age 18
Males Under Age 18
Females Under Age 18
Population Under Age 5
Population Age 5 - 17
Race
Children of One Race
White Children
Black or African American Children
American Indian or Alaska Native Children
Asian Children
Native Hawaiian or Other Pacific Islander Children
Children of Some Other Race
Children of Two or More Races
Hispanic Origin Status
Hispanic Children
Non-Hispanic Children
Non-Hispanic White Children
Non-Hispanic Racial Minorities
Living Arrangements
Children Living in Households
Children Living in Group Quarters
Own Children Living in Single Parent Households
Own Children Living in Married Couple Households
Source: Population Reference Bureau analysis of data from the US Census Bureau for the Annie E. Casey Foundation
1999 Income in Dollars as Reported in Census 2000
• •
•
•
Source: US Census Bureau, Census 2000, SF3 Tables P82, P53, P80 and PCT39
Number NumberPercent Percent
Source: US Census Bureau, Census 2000, SF1 and SF3;Florida Almanac, 2002/2003; Florida County Atlas, 1994
50Center for the Study of Children’s Futures 2004
17,288 100.0 22,186 100.0
8,885 51.4 11,257 50.7
8,403 48.6 10,929 49.3
4,832 28.0 5,254 23.7
12,456 72.0 16,932 76.3
N/A N/A 21,602 97.4
15,813 91.5 19,265 86.8
1,118 6.5 1,588 7.2
51 0.3 60 0.3
N/A N/A 268 1.2
N/A N/A 8 0.0
113 0.7 413 1.9
N/A N/A 584 2.6
715 4.1 1,313 5.9
16,573 95.9 20,873 94.1
15,339 88.7 18,483 83.3
1,234 7.1 2,390 10.8
17,240 99.7 22,118 99.7
48 0.3 68 0.3
3,075 17.8 5,409 24.4
12,513 72.4 14,277 64.4
Per Capita Income .................... 21,806 Median Family Income .............................. 42,653
Median Household Income ...... 36,379 with own children under age 18 ............. 42,371
Median Nonfamily Income....... 21,627 without own children under age 18 ........ 42,742
Charlotte County was established in 1921 from aportion of DeSoto County and was named forCharlotte Harbor. This name is associated with
Calusa, an Indian group in southwest Florida at thetime of Spanish contact. The beautiful Myakka andPeace Rivers flow though this area leading to thecounty seat of Punta Gorda. Health care facilites areamong the largest private employers and the waterwaysprovide excellent fishing and vacationing grounds.
The county comprises 694 square miles of land and waspopulated by 141,627 persons in 2000. There were 204persons per square mile and the general populationincreased by 28 percent from 1990. Ten percent of thepopulation lived in a rural area. The median age in 2000was 54 years.
There were 79,758 housing units reported with ahomeownership rate of 84 percent. Nineteen percent ofhouseholds included at least one person under the age of 18years. Annual income was less than $25,000 in 32 percentof all 63,918 households and 24 percent of the 11,412family households with their own children. Seven percentof all households had earnings of $100,000 or greater.
Eighteen percent of persons age 25 and over did notgraduate from high school and 36 percent graduated with nofurther education indicated. Eighteen percent obtained abachelor’s degree or higher. Of 6,366 persons age 18 to 24years, 65 percent were high school graduates. Nine percentof persons 16 to 19 years old were not in school and notworking.
Children under age 18 represented 16 percent of thepopulation in Charlotte County, and 13 percent of childrenlived in poverty. Of the 11,419 persons of all ages living inpoverty, 25 percent were under the age of 18 years. Fortypercent of children lived in low-income households and nochildren lived in high poverty neighborhoods.

Multi-Year Trend Data
** method used for calculating changed in 1998Source: Florida Department of Health, Office of Vital Statistics;Florida Department of Education
1992 1993 1994 1995 1996 1997 1998 1999 2000
Children Under Age 6 Below 100% of PovertyGrandparents Responsible 3 or More Years
100
75
50
25
0
Child
ren
Age 3
& 4
Enrol
led
in S
choo
lO
wn Chi
ldre
n Und
er A
ge 6
with
All Par
ents
in th
e La
bor F
orce
Child
ren
Under
Age
6
Below
200
% o
f Pov
erty
Gra
ndpa
rent
s Res
pons
ible
for
and
Livin
g with
Own
Gra
ndch
ildre
n Und
er A
ge 1
8
Own
Child
ren
Under
Age
6
Livin
g in
Sin
gle
Paren
t Hom
es
Per
cent
Source: US Census Bureau, Census 2000, SF1 and SF3
Critical MeasuresCensus 2000
Birth Rate
Teen Birth Rate Age 15-17
Teen Birth Rate Age 15-19
Percent of Births Receiving Early Prenatal Care
Percent of Low Birthweight Births
Percent of Births to Unwed Mothers
Infant Mortality Rate
Teen Violent Death Rate Age 15-19
Percent of Students Eligible for Free/Reduced Lunch
Graduation Rate**
Source: Policy and Services Research Data Center, de la Parte Institute, USF, 2002
Beh
avio
ral H
ealth
and
Juv
enile
Jus
tice
Source: Florida Department of Juvenile Justice, 2003
Source: Florida Department of Juvenile Justice, 2000/01
Chi
ld C
are,
Hea
d S
tart
and
Edu
catio
n
Source: Florida Department of Education, 2001/02
Source: Florida Children’s Forum, 2001
51 Center for the Study of Children’s Futures 2004
60.5
21.3
63.1
46.442.2
8.2 7.7 8.0 7.2 7.5 7.4 7.7 6.9 7.3
28.8 22.0 32.1 22.9 24.4 23.1 22.7 21.3 17.6
45.1 44.7 53.0 40.0 39.9 38.2 46.5 39.0 44.6
74.9 78.4 79.3 82.5 79.9 76.9 75.7 72.2 73.6
5.2 7.2 7.0 5.4 6.5 7.7 9.0 7.3 5.8
26.0 26.4 31.1 30.3 31.4 30.8 34.7 32.6 31.8
13.2 5.2 4.0 10.7 3.0 6.1 5.8 0.0 7.7
2.1 4.1 2.0 8.8 1.7 4.9 6.4 9.3 6.4
31.8 38.1 41.4 42.0 42.0 42.8 42.2 41.5 39.4
84.2 82.5 76.2 76.5 74.5 71.0 68.4 71.7 74.7
Charlotte County
28 licensed child care centers with a capacity for 1,660 children
22 licensed family child care homes with a capacity for 190 children
10 Head Start programs with a capacity for 230 children
17,323 children were enrolled in 26 public schools
4,161 children were enrolled in exceptional student education programs
167 children were referred to English for Speakers of Other Languages Programs
1,370 children were enrolled in 13 non-public schools
363 children and families were registered in 266 home education programs
722 children received behavioral health services
24 behavioral health service providers served children
610 youths were referred to the juvenile justice system
2 youths were transferred to adult court
1 contracted delinquency prevention program with 4 beds or slots
1 state grant funded delinquency prevention program projected to serve 135 youths
0 probation and community corrections non-residential programs
2 residential and correctional programs with 75 beds
0 detention centers

Number Percent Number Percent
Summary Profile for the Population Under Age 18, 1990 to 2000
1990 2000
Age & Sex
Population Under Age 18
Males Under Age 18
Females Under Age 18
Population Under Age 5
Population Age 5 - 17
Race
Children of One Race
White Children
Black or African American Children
American Indian or Alaska Native Children
Asian Children
Native Hawaiian or Other Pacific Islander Children
Children of Some Other Race
Children of Two or More Races
Hispanic Origin Status
Hispanic Children
Non-Hispanic Children
Non-Hispanic White Children
Non-Hispanic Racial Minorities
Living Arrangements
Children Living in Households
Children Living in Group Quarters
Own Children Living in Single Parent Households
Own Children Living in Married Couple Households
Source: Population Reference Bureau analysis of data from the US Census Bureau for the Annie E. Casey Foundation
1999 Income in Dollars as Reported in Census 2000
• •
•
•
Source: US Census Bureau, Census 2000, SF3 Tables P82, P53, P80 and PCT39
Number NumberPercent Percent
Source: US Census Bureau, Census 2000, SF1 and SF3;Florida Almanac, 2002/2003; Florida County Atlas, 1994
52Center for the Study of Children’s Futures 2004
16,466 100.0 20,330 100.0
8,448 51.3 10,486 51.6
8,018 48.7 9,844 48.4
4,441 27.0 4,469 22.0
12,025 73.0 15,861 78.0
N/A N/A 19,839 97.6
15,444 93.8 18,508 91.0
743 4.5 879 4.3
82 0.5 103 0.5
N/A N/A 195 1.0
N/A N/A 6 0.0
72 0.4 148 0.7
N/A N/A 491 2.4
411 2.5 900 4.4
16,055 97.5 19,430 95.6
15,111 91.8 17,882 88.0
944 5.7 1,548 7.6
16,409 99.7 20,208 99.4
57 0.3 122 0.6
3,096 18.8 5,187 25.5
11,705 71.1 12,730 62.6
Per Capita Income .................... 18,585 Median Family Income .............................. 36,711
Median Household Income ...... 31,001 with own children under age 18 ............. 36,886
Median Nonfamily Income....... 18,783 without own children under age 18 ........ 36,653
Citrus County was established in 1887 fromHernando County and was named in honor ofthe citrus fruit. The county seat is Inverness. With
the western border on the Gulf of Mexico, the CrystalRiver Indian grounds, dozens of freshwater lakes, rivers,springs and parks and home to the endangered manatee,the area is fast growing in popularity. The WithlacoocheeState Forest on the eastern side also dominates thecounty. Industries include a nuclear power plant, healthcare facilities and retailers.
The county comprises 584 square miles of land and waspopulated by 118,085 persons in 2000. There were 202persons per square mile and the general population increasedby 26 percent from 1990. Forty-three percent of thepopulation lived in a rural area. The median age in 2000 was53 years.
There were 62,204 housing units reported with ahomeownership rate of 86 percent. Twenty-one percent ofhouseholds included at least one person under the age of 18years. Annual income was less than $25,000 in 39 percent ofall 52,661 households and 30 percent of the 10,312 familyhouseholds with their own children. Five percent of allhouseholds had earnings of $100,000 or greater.
Twenty-two percent of persons age 25 and over did notgraduate from high school and 38 percent graduated with nofurther education indicated. Thirteen percent obtained abachelor’s degree or higher. Of 5,303 persons age 18 to 24years, 62 percent were high school graduates. Eleven percentof persons 16 to 19 years old were not in school and notworking.
Children under age 18 represented 17 percent of thepopulation in Citrus County, and 19 percent of children livedin poverty. Of the 13,541 persons of all ages living in poverty,27 percent were under the age of 18 years. Forty-sevenpercent of children lived in low-income households and nochildren lived in high poverty neighborhoods.

Multi-Year Trend Data
** method used for calculating changed in 1998Source: Florida Department of Health, Office of Vital Statistics;Florida Department of Education
1992 1993 1994 1995 1996 1997 1998 1999 2000
Children Under Age 6 Below 100% of PovertyGrandparents Responsible 3 or More Years
100
75
50
25
0
Child
ren
Age 3
& 4
Enrol
led
in S
choo
lO
wn Chi
ldre
n Und
er A
ge 6
with
All Par
ents
in th
e La
bor F
orce
Child
ren
Under
Age
6
Below
200
% o
f Pov
erty
Gra
ndpa
rent
s Res
pons
ible
for
and
Livin
g with
Own
Gra
ndch
ildre
n Und
er A
ge 1
8
Own
Child
ren
Under
Age
6
Livin
g in
Sin
gle
Paren
t Hom
es
Per
cent
Source: US Census Bureau, Census 2000, SF1 and SF3
Critical MeasuresCensus 2000
Birth Rate
Teen Birth Rate Age 15-17
Teen Birth Rate Age 15-19
Percent of Births Receiving Early Prenatal Care
Percent of Low Birthweight Births
Percent of Births to Unwed Mothers
Infant Mortality Rate
Teen Violent Death Rate Age 15-19
Percent of Students Eligible for Free/Reduced Lunch
Graduation Rate**
Source: Policy and Services Research Data Center, de la Parte Institute, USF, 2002
Beh
avio
ral H
ealth
and
Juv
enile
Jus
tice
Source: Florida Department of Juvenile Justice, 2003
Source: Florida Department of Juvenile Justice, 2000/01
Chi
ld C
are,
Hea
d S
tart
and
Edu
catio
n
Source: Florida Department of Education, 2001/02
Source: Florida Children’s Forum, 2001
53 Center for the Study of Children’s Futures 2004
45.9
23.9
60.4
49.4 47.3 9.0 8.3 8.4 8.0 7.9 7.6 7.1 7.2 7.4
28.2 27.3 27.0 23.5 25.7 35.7 24.9 30.9 22.1
62.0 49.8 55.5 40.6 47.2 62.0 54.7 52.0 46.4
78.8 73.7 76.5 83.7 86.2 80.6 80.3 84.5 86.3
5.4 6.0 6.0 5.8 7.2 6.1 5.6 8.4 7.6
29.2 32.7 32.8 32.5 32.8 33.0 34.8 37.9 35.2
5.6 10.6 11.5 8.2 10.3 4.8 5.0 9.7 8.0
2.2 4.3 10.4 5.6 8.2 0.0 11.7 5.7 0.0
37.7 40.5 44.3 43.4 42.2 36.9 32.4 41.4 41.8
81.1 82.9 77.8 77.3 66.7 65.4 70.8 72.3 73.6
Citrus County
29 licensed child care centers with a capacity for 1,894 children
8 licensed family child care homes with a capacity for 80 children
10 Head Start and Early Head Start programs with a capacity for 136 children
15,230 children were enrolled in 24 public schools
3,794 children were enrolled in exceptional student education programs
96 children were referred to English for Speakers of Other Languages Programs
1,005 children were enrolled in 7 non-public schools
516 children and families were registered in 369 home education programs
727 children received behavioral health services
26 behavioral health service providers served children
606 youths were referred to the juvenile justice system
3 youths were transferred to adult court
0 contracted delinquency prevention programs
1 state grant funded delinquency prevention program projected to serve 80 youths
0 probation and community corrections non-residential programs
3 residential and correctional programs with 142 beds
0 detention centers

Number Percent Number Percent
Summary Profile for the Population Under Age 18, 1990 to 2000
1990 2000
Age & Sex
Population Under Age 18
Males Under Age 18
Females Under Age 18
Population Under Age 5
Population Age 5 - 17
Race
Children of One Race
White Children
Black or African American Children
American Indian or Alaska Native Children
Asian Children
Native Hawaiian or Other Pacific Islander Children
Children of Some Other Race
Children of Two or More Races
Hispanic Origin Status
Hispanic Children
Non-Hispanic Children
Non-Hispanic White Children
Non-Hispanic Racial Minorities
Living Arrangements
Children Living in Households
Children Living in Group Quarters
Own Children Living in Single Parent Households
Own Children Living in Married Couple Households
Source: Population Reference Bureau analysis of data from the US Census Bureau for the Annie E. Casey Foundation
1999 Income in Dollars as Reported in Census 2000
• •
•
•
Source: US Census Bureau, Census 2000, SF3 Tables P82, P53, P80 and PCT39
Number NumberPercent Percent
Source: US Census Bureau, Census 2000, SF1 and SF3;Florida Almanac, 2002/2003; Florida County Atlas, 1994
54Center for the Study of Children’s Futures 2004
30,534 100.0 39,385 100.0
15,453 50.6 20,123 51.1
15,081 49.4 19,262 48.9
8,019 26.3 9,229 23.4
22,515 73.7 30,156 76.6
N/A N/A 38,055 96.6
27,557 90.3 33,154 84.2
2,029 6.6 3,347 8.5
111 0.4 165 0.4
N/A N/A 664 1.7
N/A N/A 35 0.1
232 0.8 690 1.8
N/A N/A 1,330 3.4
975 3.2 2,194 5.6
29,559 96.8 37,191 94.4
26,908 88.1 31,946 81.1
2,651 8.7 5,245 13.3
30,522 100.0 39,382 100.0
12 0.0 3 0.0
4,338 14.2 7,589 19.3
24,096 78.9 28,254 71.7
Per Capita Income .................... 20,868 Median Family Income .............................. 53,814
Median Household Income ...... 48,854 with own children under age 18 ............. 51,391
Median Nonfamily Income....... 26,928 without own children under age 18 ........ 56,680
Clay County was established in 1858 from aportion of Duval County. The county seat isGreen Cove Springs. Camp Blanding is a large
U.S. Army facility in the area. Private employmentincludes the production of concrete, asphalt, lumber andwood chips, minerals, and dairying. Sulphur springs arenumerous near the St. Johns River and are thought tohave medicinal benefits.
The county comprises 601 square miles of land and waspopulated by 140,814 persons in 2000. There were 234persons per square mile and the general populationincreased by 33 percent from 1990. Twenty-five percent ofthe population lived in a rural area. The median age in 2000was 36 years.
There were 53,748 housing units reported with ahomeownership rate of 78 percent. Forty-three percent ofhouseholds included at least one person under the age of 18years. Annual income was less than $25,000 in 20 percentof all 50,365 households and 16 percent of the 20,183family households with their own children. Eleven percentof all households had earnings of $100,000 or greater.
Fourteen percent of persons age 25 and over did notgraduate from high school and 32 percent graduated withno further education indicated. Twenty percent obtained abachelor’s degree or higher. Of 11,173 persons age 18 to 24years, 72 percent were high school graduates. Sevenpercent of persons 16 to 19 years old were not in schooland not working.
Children under age 18 represented 28 percent of thepopulation in Clay County, and 9 percent of children livedin poverty. Of the 9,437 persons of all ages living inpoverty, 38 percent were under the age of 18 years.Twenty-nine percent of children lived in low-incomehouseholds and 3 percent lived in high povertyneighborhoods.

Multi-Year Trend Data
** method used for calculating changed in 1998Source: Florida Department of Health, Office of Vital Statistics;Florida Department of Education
1992 1993 1994 1995 1996 1997 1998 1999 2000
Children Under Age 6 Below 100% of PovertyGrandparents Responsible 3 or More Years
100
75
50
25
0
Child
ren
Age 3
& 4
Enrol
led
in S
choo
lO
wn Chi
ldre
n Und
er A
ge 6
with
All Par
ents
in th
e La
bor F
orce
Child
ren
Under
Age
6
Below
200
% o
f Pov
erty
Gra
ndpa
rent
s Res
pons
ible
for
and
Livin
g with
Own
Gra
ndch
ildre
n Und
er A
ge 1
8
Own
Child
ren
Under
Age
6
Livin
g in
Sin
gle
Paren
t Hom
es
Per
cent
Source: US Census Bureau, Census 2000, SF1 and SF3
Critical MeasuresCensus 2000
Birth Rate
Teen Birth Rate Age 15-17
Teen Birth Rate Age 15-19
Percent of Births Receiving Early Prenatal Care
Percent of Low Birthweight Births
Percent of Births to Unwed Mothers
Infant Mortality Rate
Teen Violent Death Rate Age 15-19
Percent of Students Eligible for Free/Reduced Lunch
Graduation Rate**
Source: Policy and Services Research Data Center, de la Parte Institute, USF, 2002
Beh
avio
ral H
ealth
and
Juv
enile
Jus
tice
Source: Florida Department of Juvenile Justice, 2003
Source: Florida Department of Juvenile Justice, 2000/01
Chi
ld C
are,
Hea
d S
tart
and
Edu
catio
n
Source: Florida Department of Education, 2001/02
Source: Florida Children’s Forum, 2001
55 Center for the Study of Children’s Futures 2004
14.2 13.2 13.6 13.5 13.0 13.9 13.2 12.4 12.8
30.9 28.9 26.0 25.6 23.6 27.1 22.6 21.0 19.4
51.8 47.7 49.6 43.7 43.3 43.4 42.7 41.9 38.3
82.6 83.0 85.2 87.2 89.7 86.5 90.0 90.3 86.9
6.1 5.5 5.6 6.8 6.3 6.3 7.2 8.2 6.4
21.6 22.6 24.1 23.0 24.7 26.1 26.5 25.8 26.5
9.3 13.5 1.2 10.3 3.6 8.4 10.6 5.7 7.7
4.7 3.6 4.8 1.1 3.1 3.0 4.7 4.5 7.3
22.9 24.3 24.4 23.4 22.2 22.8 23.1 22.7 22.2
90.6 85.1 85.0 81.2 83.8 81.7 65.3 65.9 67.3
53.2
16.3
64.0
31.1
54.2
Clay County
85 licensed child care centers with a capacity for 5,459 children
51 licensed family child care homes with a capacity for 307 children
5 Head Start programs with a capacity for 150 children
29,063 children were enrolled in 34 public schools
6,490 children were enrolled in exceptional student education programs
211 children were referred to English for Speakers of Other Languages Programs
5,241 children were enrolled in 24 non-public schools
641 children and families were registered in 415 home education programs
1,535 children received behavioral health services
27 behavioral health service providers served children
978 youths were referred to the juvenile justice system
8 youths were transferred to adult court
0 contracted delinquency prevention programs
1 state grant funded delinquency prevention program projected to serve 40 youths
0 probation and community corrections non-residential programs
0 residential and correctional programs
0 detention centers

Number Percent Number Percent
Summary Profile for the Population Under Age 18, 1990 to 2000
1990 2000
Age & Sex
Population Under Age 18
Males Under Age 18
Females Under Age 18
Population Under Age 5
Population Age 5 - 17
Race
Children of One Race
White Children
Black or African American Children
American Indian or Alaska Native Children
Asian Children
Native Hawaiian or Other Pacific Islander Children
Children of Some Other Race
Children of Two or More Races
Hispanic Origin Status
Hispanic Children
Non-Hispanic Children
Non-Hispanic White Children
Non-Hispanic Racial Minorities
Living Arrangements
Children Living in Households
Children Living in Group Quarters
Own Children Living in Single Parent Households
Own Children Living in Married Couple Households
Source: Population Reference Bureau analysis of data from the US Census Bureau for the Annie E. Casey Foundation
1999 Income in Dollars as Reported in Census 2000
• •
•
•
Source: US Census Bureau, Census 2000, SF3 Tables P82, P53, P80 and PCT39
Number NumberPercent Percent
Source: US Census Bureau, Census 2000, SF1 and SF3;Florida Almanac, 2002/2003; Florida County Atlas, 1994
56Center for the Study of Children’s Futures 2004
30,340 100.0 49,941 100.0
15,460 51.0 25,531 51.1
14,880 49.0 24,410 48.9
9,189 30.3 13,441 26.9
21,151 69.7 36,500 73.1
N/A N/A 47,990 96.1
25,704 84.7 37,878 75.8
2,468 8.1 4,107 8.2
129 0.4 240 0.5
N/A N/A 343 0.7
N/A N/A 46 0.1
1,878 6.2 5,376 10.8
N/A N/A 1,951 3.9
7,129 23.5 15,741 31.5
23,211 76.5 34,200 68.5
20,874 68.8 28,443 57.0
2,337 7.7 5,757 11.5
30,054 99.1 49,411 98.9
286 0.9 530 1.1
5,765 19.0 11,064 22.2
21,099 69.5 32,732 65.5
Per Capita Income .................... 31,195 Median Family Income .............................. 54,816
Median Household Income ...... 48,289 with own children under age 18 ............. 44,465
Median Nonfamily Income....... 31,931 without own children under age 18 ........ 60,605
Collier County was established in 1923 from aportion of Lee County. It was named for BarronG. Collier, one of South Florida’s leading
developers. It is noted for its abundance of islands andthe Everglades, and it is bordered by the Gulf ofMexico. The county seat is Naples. Health services andlodging provide the majority of private employment.
The county comprises 2,025 square miles of land and waspopulated by 251,377 persons in 2000. There were 124persons per square mile and the general populationincreased by 65 percent from 1990. Ten percent of thepopulation lived in a rural area. The median age in 2000was 44 years.
There were 144,536 housing units reported with ahomeownership rate of 76 percent. Twenty-five percent ofhouseholds included at least one person under the age of 18years. Annual income was less than $25,000 in 22 percentof all 103,126 households and 24 percent of the 23,800family households with their own children. Eighteenpercent of all households had earnings of $100,000 orgreater.
Eighteen percent of persons age 25 and over did notgraduate from high school and 26 percent graduated withno further education indicated. Twenty-eight percentobtained a bachelor’s degree or higher. Of 16,213 personsage 18 to 24 years, 56 percent were high school graduates.Twelve percent of persons 16 to 19 years old were not inschool and not working.
Children under age 18 represented 20 percent of thepopulation in Collier County, and 17 percent of childrenlived in poverty. Of the 25,449 persons of all ages living inpoverty, 32 percent were under the age of 18 years. Forty-one percent of children lived in low-income householdsand 20 percent lived in high poverty neighborhoods.

Multi-Year Trend Data
** method used for calculating changed in 1998Source: Florida Department of Health, Office of Vital Statistics;Florida Department of Education
1992 1993 1994 1995 1996 1997 1998 1999 2000
Children Under Age 6 Below 100% of PovertyGrandparents Responsible 3 or More Years
100
75
50
25
0
Child
ren
Age 3
& 4
Enrol
led
in S
choo
lO
wn Chi
ldre
n Und
er A
ge 6
with
All Par
ents
in th
e La
bor F
orce
Child
ren
Under
Age
6
Below
200
% o
f Pov
erty
Gra
ndpa
rent
s Res
pons
ible
for
and
Livin
g with
Own
Gra
ndch
ildre
n Und
er A
ge 1
8
Own
Child
ren
Under
Age
6
Livin
g in
Sin
gle
Paren
t Hom
es
Per
cent
Source: US Census Bureau, Census 2000, SF1 and SF3
Critical MeasuresCensus 2000
Birth Rate
Teen Birth Rate Age 15-17
Teen Birth Rate Age 15-19
Percent of Births Receiving Early Prenatal Care
Percent of Low Birthweight Births
Percent of Births to Unwed Mothers
Infant Mortality Rate
Teen Violent Death Rate Age 15-19
Percent of Students Eligible for Free/Reduced Lunch
Graduation Rate**
Source: Policy and Services Research Data Center, de la Parte Institute, USF, 2002
Beh
avio
ral H
ealth
and
Juv
enile
Jus
tice
Source: Florida Department of Juvenile Justice, 2003
Source: Florida Department of Juvenile Justice, 2000/01
Chi
ld C
are,
Hea
d S
tart
and
Edu
catio
n
Source: Florida Department of Education, 2001/02
Source: Florida Children’s Forum, 2001
57 Center for the Study of Children’s Futures 2004
14.0 14.3 13.6 13.2 12.6 12.4 12.8 13.0 13.5
52.7 60.3 52.3 44.2 53.7 51.6 52.8 50.2 29.6
81.4 85.1 78.5 75.8 76.9 74.5 76.8 73.7 59.4
80.9 81.8 75.2 76.1 74.9 73.3 72.0 74.2 76.1
5.6 6.6 7.0 6.4 6.2 6.4 7.1 6.6 6.3
34.0 33.6 34.1 35.0 36.2 34.4 37.4 37.1 37.1
9.7 3.2 8.5 6.1 5.2 10.8 6.6 5.6 5.5
13.2 11.8 4.6 8.4 10.7 8.2 4.9 5.5 6.6
40.8 42.1 42.3 39.1 42.6 43.6 41.3 42.2 44.7
68.3 94.0 69.9 75.5 77.9 69.2 63.0 63.3 64.5
48.4
18.4
57.0
44.2
33.1
Collier County
53 licensed child care centers with a capacity for 5,520 children
46 licensed family child care homes with a capacity for 460 children
45 Head Start and Early Head Start programs with a capacity for 445 children
36,515 children were enrolled in 55 public schools
6,820 children were enrolled in exceptional student education programs
4,924 children were referred to English for Speakers of Other Languages Programs
3,881 children were enrolled in 19 non-public schools
648 children and families were registered in 443 home education programs
1,464 children received behavioral health services
34 behavioral health service providers served children
1,519 youths were referred to the juvenile justice system
11 youths were transferred to adult court
1 contracted delinquency prevention program with 35 beds or slots
1 state grant funded delinquency prevention program projected to serve 100 youths
0 probation and community corrections non-residential programs
3 residential and correctional programs with 90 beds
1 detention center with 50 beds

Number Percent Number Percent
Summary Profile for the Population Under Age 18, 1990 to 2000
1990 2000
Age & Sex
Population Under Age 18
Males Under Age 18
Females Under Age 18
Population Under Age 5
Population Age 5 - 17
Race
Children of One Race
White Children
Black or African American Children
American Indian or Alaska Native Children
Asian Children
Native Hawaiian or Other Pacific Islander Children
Children of Some Other Race
Children of Two or More Races
Hispanic Origin Status
Hispanic Children
Non-Hispanic Children
Non-Hispanic White Children
Non-Hispanic Racial Minorities
Living Arrangements
Children Living in Households
Children Living in Group Quarters
Own Children Living in Single Parent Households
Own Children Living in Married Couple Households
Source: Population Reference Bureau analysis of data from the US Census Bureau for the Annie E. Casey Foundation
1999 Income in Dollars as Reported in Census 2000
• •
•
•
Source: US Census Bureau, Census 2000, SF3 Tables P82, P53, P80 and PCT39
Number NumberPercent Percent
Source: US Census Bureau, Census 2000, SF1 and SF3;Florida Almanac, 2002/2003; Florida County Atlas, 1994
58Center for the Study of Children’s Futures 2004
11,901 100.0 14,337 100.0
6,208 52.2 7,392 51.6
5,693 47.8 6,945 48.4
3,112 26.1 3,628 25.3
8,789 73.9 10,709 74.7
N/A N/A 14,043 97.9
9,035 75.9 10,874 75.8
2,724 22.9 2,874 20.0
17 0.1 88 0.6
N/A N/A 80 0.6
N/A N/A 1 0.0
54 0.5 126 0.9
N/A N/A 294 2.1
198 1.7 491 3.4
11,703 98.3 13,846 96.6
8,900 74.8 10,578 73.8
2,803 23.6 3,268 22.8
11,796 99.1 14,299 99.7
105 0.9 38 0.3
2,618 22.0 3,736 26.1
7,730 65.0 8,524 59.5
Per Capita Income .................... 14,598 Median Family Income .............................. 35,927
Median Household Income ...... 30,881 with own children under age 18 ............. 34,103
Median Nonfamily Income....... 18,153 without own children under age 18 ........ 37,810
Columbia County was established in 1832 fromSt. Johns County and named in honor ofChristopher Columbus. The county seat is
Lake City. Natural resources include the OsceolaNational Forest and the bordering Suwannee River.Asphalt paving and mobile home manufacturing andsales are predominant industries. It is also home to theFlorida Sports Hall of Fame.
The county comprises 797 square miles of land and waspopulated by 56,513 persons in 2000. There were 71persons per square mile and the general populationincreased by 33 percent from 1990. Sixty-eight percent ofthe population lived in a rural area. The median age in 2000was 37 years.
There were 23,579 housing units reported with ahomeownership rate of 77 percent. Thirty-seven percent ofhouseholds included at least one person under the age of 18years. Annual income was less than $25,000 in 40 percentof all 20,954 households and 34 percent of the 6,779 familyhouseholds with their own children. Four percent of allhouseholds had earnings of $100,000 or greater.
Twenty-five percent of persons age 25 and over did notgraduate from high school and 35 percent graduated withno further education indicated. Eleven percent obtained abachelor’s degree or higher. Of 5,334 persons age 18 to 24years, 60 percent were high school graduates. Fourteenpercent of persons 16 to 19 years old were not in schooland not working.
Children under age 18 represented 25 percent of thepopulation in Columbia County, and 18 percent of childrenlived in poverty. Of the 8,027 persons of all ages living inpoverty, 31 percent were under the age of 18 years. Fiftypercent of children lived in low-income households and 15percent lived in high poverty neighborhoods.

Multi-Year Trend Data
** method used for calculating changed in 1998Source: Florida Department of Health, Office of Vital Statistics;Florida Department of Education
1992 1993 1994 1995 1996 1997 1998 1999 2000
Children Under Age 6 Below 100% of PovertyGrandparents Responsible 3 or More Years
100
75
50
25
0
Child
ren
Age 3
& 4
Enrol
led
in S
choo
lO
wn Chi
ldre
n Und
er A
ge 6
with
All Par
ents
in th
e La
bor F
orce
Child
ren
Under
Age
6
Below
200
% o
f Pov
erty
Gra
ndpa
rent
s Res
pons
ible
for
and
Livin
g with
Own
Gra
ndch
ildre
n Und
er A
ge 1
8
Own
Child
ren
Under
Age
6
Livin
g in
Sin
gle
Paren
t Hom
es
Per
cent
Source: US Census Bureau, Census 2000, SF1 and SF3
Critical MeasuresCensus 2000
Birth Rate
Teen Birth Rate Age 15-17
Teen Birth Rate Age 15-19
Percent of Births Receiving Early Prenatal Care
Percent of Low Birthweight Births
Percent of Births to Unwed Mothers
Infant Mortality Rate
Teen Violent Death Rate Age 15-19
Percent of Students Eligible for Free/Reduced Lunch
Graduation Rate**
Source: Policy and Services Research Data Center, de la Parte Institute, USF, 2002
Beh
avio
ral H
ealth
and
Juv
enile
Jus
tice
Source: Florida Department of Juvenile Justice, 2003
Source: Florida Department of Juvenile Justice, 2000/01
Chi
ld C
are,
Hea
d S
tart
and
Edu
catio
n
Source: Florida Department of Education, 2001/02
Source: Florida Children’s Forum, 2001
59 Center for the Study of Children’s Futures 2004
15.1 14.5 13.1 13.0 12.8 13.9 13.7 13.3 13.0
60.2 58.1 50.2 50.9 43.1 37.6 40.0 34.6 30.4
92.9 92.4 86.2 89.6 66.9 73.9 64.2 62.1 68.7
64.6 74.0 73.9 77.4 75.9 76.6 80.7 75.4 77.2
9.5 9.2 8.6 8.3 9.6 9.3 9.4 8.5 9.4
42.8 38.7 39.4 42.1 40.2 41.4 39.1 43.6 44.4
13.2 6.0 18.8 6.1 9.0 6.6 15.7 13.2 9.2
11.8 14.5 8.4 2.7 10.2 14.2 2.3 11.1 2.3
42.5 46.4 52.4 51.6 47.7 51.9 52.8 51.6 50.0
82.4 75.7 69.4 71.3 55.9 61.4 63.6 61.8 59.5
40.8
25.2
56.7 56.160.4
Columbia County
35 licensed child care centers with a capacity for 2,613 children
3 licensed family child care homes with a capacity for 30 children
8 Head Start and Early Head Start programs with a capacity for 188 children
9,578 children were enrolled in 17 public schools
1,832 children were enrolled in exceptional student education programs
29 children were referred to English for Speakers of Other Languages Programs
322 children were enrolled in 5 non-public schools
492 children and families were registered in 318 home education programs
617 children received behavioral health services
13 behavioral health service providers served children
423 youths were referred to the juvenile justice system
14 youths were transferred to adult court
1 contracted delinquency prevention program with 4 beds or slots
1 state grant funded delinquency prevention program projected to serve 25 youths
2 probation and community corrections non-residential programs with 55 slots
0 residential and correctional programs
0 detention centers

Number Percent Number Percent
Summary Profile for the Population Under Age 18, 1990 to 2000
1990 2000
Age & Sex
Population Under Age 18
Males Under Age 18
Females Under Age 18
Population Under Age 5
Population Age 5 - 17
Race
Children of One Race
White Children
Black or African American Children
American Indian or Alaska Native Children
Asian Children
Native Hawaiian or Other Pacific Islander Children
Children of Some Other Race
Children of Two or More Races
Hispanic Origin Status
Hispanic Children
Non-Hispanic Children
Non-Hispanic White Children
Non-Hispanic Racial Minorities
Living Arrangements
Children Living in Households
Children Living in Group Quarters
Own Children Living in Single Parent Households
Own Children Living in Married Couple Households
Source: Population Reference Bureau analysis of data from the US Census Bureau for the Annie E. Casey Foundation
1999 Income in Dollars as Reported in Census 2000
• •
•
•
Source: US Census Bureau, Census 2000, SF3 Tables P82, P53, P80 and PCT39
Number NumberPercent Percent
Source: US Census Bureau, Census 2000, SF1 and SF3;Florida Almanac, 2002/2003; Florida County Atlas, 1994
60Center for the Study of Children’s Futures 2004
468,010 100.0 559,213 100.0
240,433 51.4 285,572 51.1
227,577 48.6 273,641 48.9
139,714 29.9 145,752 26.1
328,296 70.1 413,461 73.9
N/A N/A 535,991 95.8
297,188 63.5 346,420 61.9
137,401 29.4 151,349 27.1
862 0.2 1,359 0.2
N/A N/A 6,859 1.2
N/A N/A 242 0.0
26,016 5.6 29,762 5.3
N/A N/A 23,222 4.2
211,561 45.2 278,343 49.8
256,449 54.8 280,870 50.2
119,056 25.4 117,790 21.1
137,393 29.4 163,080 29.2
466,413 99.7 557,259 99.7
1,597 0.3 1,954 0.3
121,173 25.9 152,668 27.3
274,680 58.7 319,467 57.1
Per Capita Income .................... 18,497 Median Family Income .............................. 40,260
Median Household Income ...... 35,966 with own children under age 18 ............. 38,427
Median Nonfamily Income....... 21,807 without own children under age 18 ........ 41,760
M iami-Dade County was established in 1836from a portion of St. Johns County and isknown as the heart of the Gold Coast. The
county seat is Miami. This area has become increasinglypopular and cosmopolitan. Airlines, department stores,communications, banking, transportation, sports, andfood service are major industries. The Art Deco District,Miami Beach, Vizcaya Museum and Gardens, the OrangeBowl and a variety of art museums and theme parks areamong the county’s many attractions.
The county comprises 1,946 square miles of land and waspopulated by 2,253,362 persons in 2000. There were 1,158persons per square mile and the general population increasedby 16 percent from 1990. One percent of the population livedin a rural area. The median age in 2000 was 36 years.
There were 852,278 housing units reported with ahomeownership rate of 58 percent. Thirty-nine percent ofhouseholds included at least one person under the age of 18years. Annual income was less than $25,000 in 36 percent ofall 777,378 households and 32 percent of the 268,766 familyhouseholds with their own children. Eleven percent of allhouseholds had earnings of $100,000 or greater.
Thirty-two percent of persons age 25 and over did notgraduate from high school and 22 percent graduated with nofurther education indicated. Twenty-two percent obtained abachelor’s degree or higher. Of 204,151 persons age 18 to 24years, 70 percent were high school graduates. Eleven percentof persons 16 to 19 years old were not in school and notworking.
Children under age 18 represented 25 percent of thepopulation in Miami-Dade County, and 23 percent ofchildren lived in poverty. Of the 396,995 persons of all agesliving in poverty, 32 percent were under the age of 18 years.Forty-nine percent of children lived in low-incomehouseholds and 38 percent lived in high povertyneighborhoods.

Multi-Year Trend Data
** method used for calculating changed in 1998Source: Florida Department of Health, Office of Vital Statistics;Florida Department of Education
1992 1993 1994 1995 1996 1997 1998 1999 2000
Children Under Age 6 Below 100% of PovertyGrandparents Responsible 3 or More Years
100
75
50
25
0
Child
ren
Age 3
& 4
Enrol
led
in S
choo
lO
wn Chi
ldre
n Und
er A
ge 6
with
All Par
ents
in th
e La
bor F
orce
Child
ren
Under
Age
6
Below
200
% o
f Pov
erty
Gra
ndpa
rent
s Res
pons
ible
for
and
Livin
g with
Own
Gra
ndch
ildre
n Und
er A
ge 1
8
Own
Child
ren
Under
Age
6
Livin
g in
Sin
gle
Paren
t Hom
es
Per
cent
Source: US Census Bureau, Census 2000, SF1 and SF3
Critical MeasuresCensus 2000
Birth Rate
Teen Birth Rate Age 15-17
Teen Birth Rate Age 15-19
Percent of Births Receiving Early Prenatal Care
Percent of Low Birthweight Births
Percent of Births to Unwed Mothers
Infant Mortality Rate
Teen Violent Death Rate Age 15-19
Percent of Students Eligible for Free/Reduced Lunch
Graduation Rate**
Source: Policy and Services Research Data Center, de la Parte Institute, USF, 2002
Beh
avio
ral H
ealth
and
Juv
enile
Jus
tice
Source: Florida Department of Juvenile Justice, 2003
Source: Florida Department of Juvenile Justice, 2000/01
Chi
ld C
are,
Hea
d S
tart
and
Edu
catio
n
Source: Florida Department of Education, 2001/02
Source: Florida Children’s Forum, 2001
61 Center for the Study of Children’s Futures 2004
16.5 16.6 16.5 15.9 15.6 15.1 15.1 14.7 15.0
39.1 43.8 47.7 42.6 39.8 36.0 36.6 33.6 28.3
59.1 62.2 65.1 60.0 59.8 52.2 52.7 50.3 45.6
77.4 80.0 80.8 81.6 82.0 82.8 85.6 86.1 86.4
7.9 8.0 7.9 8.1 7.7 7.9 7.9 7.9 7.9
38.8 40.0 40.6 41.1 40.7 39.5 39.9 41.1 42.5
7.5 7.7 6.6 5.6 6.0 5.6 5.7 5.2 5.8
6.4 7.6 7.4 6.7 5.4 5.5 3.7 4.8 4.1
48.8 53.4 56.2 58.4 59.2 59.1 58.7 59.6 59.1
74.8 75.0 73.9 74.6 73.8 72.1 53.2 52.2 53.9
57.4
22.6
57.1
49.2
32.8
Miami-Dade County
923 licensed child care centers with a capacity for 85,135 children
419 licensed family child care homes with a capacity for 3,925 children
104 Head Start and Early Head Start programs with a capacity for 7,583 children
375,816 children were enrolled in 426 public schools
65,228 children were enrolled in exceptional student education programs
70,761 children were referred to English for Speakers of Other Languages Programs
69,202 children were enrolled in 379 non-public schools
2,175 children and families were registered in 1,675 home education programs
16,735 children received behavioral health services
66 behavioral health service providers served children
10,353 youths were referred to the juvenile justice system
415 youths were transferred to adult court
4 contracted delinquency prevention programs with 69 beds or slots
8 state grant funded delinquency prevention programs projected to serve 1,600 youths
12 probation and community corrections non-residential programs with 477 slots
10 residential and correctional programs with 479 beds
1 detention center with 226 beds

Number Percent Number Percent
Summary Profile for the Population Under Age 18, 1990 to 2000
1990 2000
Age & Sex
Population Under Age 18
Males Under Age 18
Females Under Age 18
Population Under Age 5
Population Age 5 - 17
Race
Children of One Race
White Children
Black or African American Children
American Indian or Alaska Native Children
Asian Children
Native Hawaiian or Other Pacific Islander Children
Children of Some Other Race
Children of Two or More Races
Hispanic Origin Status
Hispanic Children
Non-Hispanic Children
Non-Hispanic White Children
Non-Hispanic Racial Minorities
Living Arrangements
Children Living in Households
Children Living in Group Quarters
Own Children Living in Single Parent Households
Own Children Living in Married Couple Households
Source: Population Reference Bureau analysis of data from the US Census Bureau for the Annie E. Casey Foundation
1999 Income in Dollars as Reported in Census 2000
• •
•
•
Source: US Census Bureau, Census 2000, SF3 Tables P82, P53, P80 and PCT39
Number NumberPercent Percent
Source: US Census Bureau, Census 2000, SF1 and SF3;Florida Almanac, 2002/2003; Florida County Atlas, 1994
62Center for the Study of Children’s Futures 2004
5,666 100.0 7,310 100.0
2,911 51.4 3,814 52.2
2,755 48.6 3,496 47.8
1,636 28.9 1,873 25.6
4,030 71.1 5,437 74.4
N/A N/A 7,158 97.9
4,059 71.6 4,912 67.2
1,231 21.7 1,181 16.2
38 0.7 97 1.3
N/A N/A 33 0.5
N/A N/A 6 0.1
311 5.5 929 12.7
N/A N/A 152 2.1
737 13.0 2,268 31.0
4,929 87.0 5,042 69.0
3,659 64.6 3,754 51.4
1,270 22.4 1,288 17.6
5,584 98.6 6,933 94.8
82 1.4 377 5.2
1,269 22.4 1,735 23.7
3,378 59.6 4,050 55.4
Per Capita Income .................... 14,000 Median Family Income .............................. 34,726
Median Household Income ...... 30,714 with own children under age 18 ............. 30,450
Median Nonfamily Income....... 18,937 without own children under age 18 ........ 37,413
DeSoto County was established in 1887 from aportion of Manatee County and was named forthe Spanish explorer Hernando de Soto. The
county seat is Arcadia. This rural environment isknown for citrus, cattle packing houses, and the All-Florida Rodeo. Fishing and canoeing are popular onthe Peace River.
The county comprises 637 square miles of land and waspopulated by 32,209 persons in 2000. There were 51persons per square mile and the general populationincreased by 35 percent from 1990. Fifty-four percent ofthe population lived in a rural area. The median age in2000 was 37 years.
There were 13,608 housing units reported with ahomeownership rate of 75 percent. Thirty-one percent ofhouseholds included at least one person under the age of 18years. Annual income was less than $25,000 in 40 percentof all 10,784 households and 40 percent of the 2,908family households with their own children. Four percent ofall households had earnings of $100,000 or greater.
Thirty-six percent of persons age 25 and over did notgraduate from high school and 35 percent graduated withno further education indicated. Eight percent obtained abachelor’s degree or higher. Of 3,738 persons age 18 to 24years, 37 percent were high school graduates. Seventeenpercent of persons 16 to 19 years old were not in schooland not working.
Children under age 18 represented 23 percent of thepopulation in DeSoto County, and 33 percent of childrenlived in poverty. Of the 7,030 persons of all ages living inpoverty, 32 percent were under the age of 18 years. Sixty-six percent of children lived in low-income households and65 percent lived in high poverty neighborhoods.

Multi-Year Trend Data
** method used for calculating changed in 1998Source: Florida Department of Health, Office of Vital Statistics;Florida Department of Education
1992 1993 1994 1995 1996 1997 1998 1999 2000
Children Under Age 6 Below 100% of PovertyGrandparents Responsible 3 or More Years
100
75
50
25
0
Child
ren
Age 3
& 4
Enrol
led
in S
choo
lO
wn Chi
ldre
n Und
er A
ge 6
with
All Par
ents
in th
e La
bor F
orce
Child
ren
Under
Age
6
Below
200
% o
f Pov
erty
Gra
ndpa
rent
s Res
pons
ible
for
and
Livin
g with
Own
Gra
ndch
ildre
n Und
er A
ge 1
8
Own
Child
ren
Under
Age
6
Livin
g in
Sin
gle
Paren
t Hom
es
Per
cent
Source: US Census Bureau, Census 2000, SF1 and SF3
Critical MeasuresCensus 2000
Birth Rate
Teen Birth Rate Age 15-17
Teen Birth Rate Age 15-19
Percent of Births Receiving Early Prenatal Care
Percent of Low Birthweight Births
Percent of Births to Unwed Mothers
Infant Mortality Rate
Teen Violent Death Rate Age 15-19
Percent of Students Eligible for Free/Reduced Lunch
Graduation Rate**
Source: Policy and Services Research Data Center, de la Parte Institute, USF, 2002
Beh
avio
ral H
ealth
and
Juv
enile
Jus
tice
Source: Florida Department of Juvenile Justice, 2003
Source: Florida Department of Juvenile Justice, 2000/01
Chi
ld C
are,
Hea
d S
tart
and
Edu
catio
n
Source: Florida Department of Education, 2001/02
Source: Florida Children’s Forum, 2001
63 Center for the Study of Children’s Futures 2004
15.6 15.4 15.0 14.2 13.6 12.8 14.6 14.7 14.5
60.0 72.1 93.0 77.3 64.9 68.4 76.1 79.0 51.2
106.5 109.8 126.8 97.8 117.2 105.7 122.8 126.4 83.7
73.6 77.1 69.4 74.8 74.7 67.0 70.2 66.3 64.9
7.7 6.7 7.6 8.9 7.8 6.0 6.3 7.4 6.8
39.9 40.5 46.6 41.2 39.6 41.3 47.1 44.9 48.1
10.3 2.6 7.6 18.4 5.4 14.2 12.2 11.9 7.1
12.8 6.5 0.0 12.1 18.5 12.0 5.9 5.8 12.3
53.4 55.8 60.9 61.5 62.5 53.3 60.4 47.7 59.2
76.4 75.2 74.4 80.1 85.8 70.2 62.7 67.5 64.8
37.0
23.6
53.4
73.4
54.8
DeSoto County
12 licensed child care centers with a capacity for 770 children
6 licensed family child care homes with a capacity for 60 children
10 Head Start and Early Head Start programs with a capacity for 124 children
4,718 children were enrolled in 13 public schools
987 children were enrolled in exceptional student education programs
367 children were referred to English for Speakers of Other Languages Programs
37 children were enrolled in 2 non-public schools
112 children and families were registered in 76 home education programs
212 children received behavioral health services
17 behavioral health service providers served children
161 youths were referred to the juvenile justice system
9 youths were transferred to adult court
0 contracted delinquency prevention programs
1 state grant funded delinquency prevention program projected to serve 125 youths
0 probation and community corrections non-residential programs
7 residential and correctional programs with 369 beds
0 detention centers

Number Percent Number Percent
Summary Profile for the Population Under Age 18, 1990 to 2000
1990 2000
Age & Sex
Population Under Age 18
Males Under Age 18
Females Under Age 18
Population Under Age 5
Population Age 5 - 17
Race
Children of One Race
White Children
Black or African American Children
American Indian or Alaska Native Children
Asian Children
Native Hawaiian or Other Pacific Islander Children
Children of Some Other Race
Children of Two or More Races
Hispanic Origin Status
Hispanic Children
Non-Hispanic Children
Non-Hispanic White Children
Non-Hispanic Racial Minorities
Living Arrangements
Children Living in Households
Children Living in Group Quarters
Own Children Living in Single Parent Households
Own Children Living in Married Couple Households
Source: Population Reference Bureau analysis of data from the US Census Bureau for the Annie E. Casey Foundation
1999 Income in Dollars as Reported in Census 2000
• •
•
•
Source: US Census Bureau, Census 2000, SF3 Tables P82, P53, P80 and PCT39
Number NumberPercent Percent
Source: US Census Bureau, Census 2000, SF1 and SF3;Florida Almanac, 2002/2003; Florida County Atlas, 1994
64Center for the Study of Children’s Futures 2004
2,588 100.0 3,055 100.0
1,296 50.1 1,551 50.8
1,292 49.9 1,504 49.2
707 27.3 770 25.2
1,881 72.7 2,285 74.8
N/A N/A 3,014 98.7
2,345 90.6 2,699 88.3
234 9.0 293 9.6
6 0.2 11 0.4
N/A N/A 2 0.1
N/A N/A 0 0.0
1 0.0 9 0.3
N/A N/A 41 1.3
26 1.0 56 1.8
2,562 99.0 2,999 98.2
2,320 89.6 2,662 87.1
242 9.4 337 11.0
2,587 100.0 3,053 99.9
1 0.0 2 0.1
595 23.0 788 25.8
1,729 66.8 1,807 59.1
Per Capita Income .................... 13,559 Median Family Income .............................. 31,157
Median Household Income ...... 26,082 with own children under age 18 ............. 28,997
Median Nonfamily Income....... 12,590 without own children under age 18 ........ 32,348
Dixie County was established in 1921 fromLafayette County and was named for the'nickname' of the South. The county seat is
Cross City. It fronts on the Gulf of Mexico and timbercompanies are the major industry. The region is knownfor fishing and hunting.
The county comprises 704 square miles of land and waspopulated by 13,827 persons in 2000. There were 20persons per square mile and the general populationincreased by 31 percent from 1990. Seventy-seven percentof the population lived in a rural area. The median age in2000 was 41 years.
There were 7,362 housing units reported with ahomeownership rate of 86 percent. Thirty-two percent ofhouseholds included at least one person under the age of 18years. Annual income was less than $25,000 in 48 percentof all 5,225 households and 41 percent of the 1,453 familyhouseholds with their own children. Four percent of allhouseholds had earnings of $100,000 or greater.
Thirty-four percent of persons age 25 and over did notgraduate from high school and 39 percent graduated withno further education indicated. Seven percent obtained abachelor’s degree or higher. Of 1,138 persons age 18 to 24years, 62 percent were high school graduates. Seventeenpercent of persons 16 to 19 years old were not in schooland not working.
Children under age 18 represented 22 percent of thepopulation in Dixie County, and 24 percent of childrenlived in poverty. Of the 2,428 persons of all ages living inpoverty, 30 percent were under the age of 18 years. Sixty-one percent of children lived in low-income households and26 percent lived in high poverty neighborhoods.

Multi-Year Trend Data
** method used for calculating changed in 1998Source: Florida Department of Health, Office of Vital Statistics;Florida Department of Education
1992 1993 1994 1995 1996 1997 1998 1999 2000
Children Under Age 6 Below 100% of PovertyGrandparents Responsible 3 or More Years
100
75
50
25
0
Child
ren
Age 3
& 4
Enrol
led
in S
choo
lO
wn Chi
ldre
n Und
er A
ge 6
with
All Par
ents
in th
e La
bor F
orce
Child
ren
Under
Age
6
Below
200
% o
f Pov
erty
Gra
ndpa
rent
s Res
pons
ible
for
and
Livin
g with
Own
Gra
ndch
ildre
n Und
er A
ge 1
8
Own
Child
ren
Under
Age
6
Livin
g in
Sin
gle
Paren
t Hom
es
Per
cent
Source: US Census Bureau, Census 2000, SF1 and SF3
Critical MeasuresCensus 2000
Birth Rate
Teen Birth Rate Age 15-17
Teen Birth Rate Age 15-19
Percent of Births Receiving Early Prenatal Care
Percent of Low Birthweight Births
Percent of Births to Unwed Mothers
Infant Mortality Rate
Teen Violent Death Rate Age 15-19
Percent of Students Eligible for Free/Reduced Lunch
Graduation Rate**
Source: Policy and Services Research Data Center, de la Parte Institute, USF, 2002
Beh
avio
ral H
ealth
and
Juv
enile
Jus
tice
Source: Florida Department of Juvenile Justice, 2003
Source: Florida Department of Juvenile Justice, 2000/01
Chi
ld C
are,
Hea
d S
tart
and
Edu
catio
n
Source: Florida Department of Education, 2001/02
Source: Florida Children’s Forum, 2001
65 Center for the Study of Children’s Futures 2004
14.4 12.6 10.6 12.8 11.7 12.0 11.6 13.4 11.4
41.2 59.4 89.6 24.8 34.8 82.0 52.6 46.3 40.7
117.5 76.0 85.9 63.5 98.7 124.1 84.6 95.2 82.4
72.3 80.0 80.2 82.8 75.2 72.8 74.7 78.6 75.5
8.9 7.1 9.3 11.3 12.0 7.0 4.5 8.8 5.7
33.8 36.4 33.3 38.8 41.3 36.7 36.4 42.3 45.3
19.1 21.4 0.0 6.3 13.3 12.7 13.0 0.0 18.9
14.5 27.0 0.0 0.0 12.2 0.0 23.2 11.3 10.9
51.4 58.8 60.8 58.9 60.3 64.2 63.4 60.0 62.8
50.4 61.7 52.1 50.3 42.6 65.3 60.5 71.2 73.8
37.3
25.0
53.6
74.0
61.7
Dixie County
1 licensed child care center with a capacity for 109 children
1 licensed family child care home with a capacity for 10 children
2 Head Start and Early Head Start programs with a capacity for 51 children
2,265 children were enrolled in 6 public schools
556 children were enrolled in exceptional student education programs
3 children were referred to English for Speakers of Other Languages Programs
0 children were enrolled in non-public schools
69 children and families were registered in 54 home education programs
163 children received behavioral health services
8 behavioral health service providers served children
92 youths were referred to the juvenile justice system
1 youth was transferred to adult court
0 contracted delinquency prevention programs
0 state grant funded delinquency prevention programs
0 probation and community corrections non-residential programs
0 residential and correctional programs
0 detention centers

Number Percent Number Percent
Summary Profile for the Population Under Age 18, 1990 to 2000
1990 2000
Age & Sex
Population Under Age 18
Males Under Age 18
Females Under Age 18
Population Under Age 5
Population Age 5 - 17
Race
Children of One Race
White Children
Black or African American Children
American Indian or Alaska Native Children
Asian Children
Native Hawaiian or Other Pacific Islander Children
Children of Some Other Race
Children of Two or More Races
Hispanic Origin Status
Hispanic Children
Non-Hispanic Children
Non-Hispanic White Children
Non-Hispanic Racial Minorities
Living Arrangements
Children Living in Households
Children Living in Group Quarters
Own Children Living in Single Parent Households
Own Children Living in Married Couple Households
Source: Population Reference Bureau analysis of data from the US Census Bureau for the Annie E. Casey Foundation
1999 Income in Dollars as Reported in Census 2000
• •
•
•
Source: US Census Bureau, Census 2000, SF3 Tables P82, P53, P80 and PCT39
Number NumberPercent Percent
Source: US Census Bureau, Census 2000, SF1 and SF3;Florida Almanac, 2002/2003; Florida County Atlas, 1994
66Center for the Study of Children’s Futures 2004
174,346 100.0 204,991 100.0
88,568 50.8 104,502 51.0
85,778 49.2 100,489 49.0
54,428 31.2 56,247 27.4
119,918 68.8 148,744 72.6
N/A N/A 198,373 96.8
113,927 65.3 115,556 56.4
54,529 31.3 73,544 35.9
483 0.3 608 0.3
N/A N/A 5,019 2.4
N/A N/A 133 0.1
1,471 0.8 3,513 1.7
N/A N/A 6,618 3.2
5,123 2.9 10,202 5.0
169,223 97.1 194,789 95.0
110,937 63.6 110,343 53.8
58,286 33.4 84,446 41.2
173,603 99.6 204,612 99.8
743 0.4 379 0.2
41,306 23.7 62,120 30.3
112,860 64.7 118,323 57.7
Per Capita Income .................... 20,753 Median Family Income .............................. 47,689
Median Household Income ...... 40,703 with own children under age 18 ............. 44,190
Median Nonfamily Income....... 26,592 without own children under age 18 ........ 51,208
Duval County was established in 1822 from St.Johns County and was named for William PopeDuval, the first territorial governor of Florida.
Jacksonville, the county seat, was nearly destroyed byfire in 1901. This county has one of the nation’s largestports, currently a busy military site for the Air Forceand Navy. In 1967 the city of Jacksonville and DuvalCounty consolidated into one large entity. Banking,health care and insurance are among the areas majorindustries.
The county comprises 774 square miles of land and waspopulated by 778,879 persons in 2000. There were 1,007persons per square mile and the general populationincreased by 16 percent from 1990. Four percent of thepopulation lived in a rural area. The median age in 2000was 34 years.
There were 329,778 housing units reported with ahomeownership rate of 63 percent. Thirty-seven percent ofhouseholds included at least one person under the age of 18years. Annual income was less than $25,000 in 28 percentof all 303,871 households and 25 percent of the 102,971family households with their own children. Ten percent ofall households had earnings of $100,000 or greater.
Seventeen percent of persons age 25 and over did notgraduate from high school and 29 percent graduated withno further education indicated. Twenty-two percentobtained a bachelor’s degree or higher. Of 74,604 personsage 18 to 24 years, 74 percent were high school graduates.Ten percent of persons 16 to 19 years old were not inschool and not working.
Children under age 18 represented 26 percent of thepopulation in Duval County, and 17 percent of childrenlived in poverty. Of the 90,828 persons of all ages living inpoverty, 37 percent were under the age of 18 years. Thirty-nine percent of children lived in low-income householdsand 15 percent lived in high poverty neighborhoods.

Multi-Year Trend Data
** method used for calculating changed in 1998Source: Florida Department of Health, Office of Vital Statistics;Florida Department of Education
1992 1993 1994 1995 1996 1997 1998 1999 2000
Children Under Age 6 Below 100% of PovertyGrandparents Responsible 3 or More Years
100
75
50
25
0
Child
ren
Age 3
& 4
Enrol
led
in S
choo
lO
wn Chi
ldre
n Und
er A
ge 6
with
All Par
ents
in th
e La
bor F
orce
Child
ren
Under
Age
6
Below
200
% o
f Pov
erty
Gra
ndpa
rent
s Res
pons
ible
for
and
Livin
g with
Own
Gra
ndch
ildre
n Und
er A
ge 1
8
Own
Child
ren
Under
Age
6
Livin
g in
Sin
gle
Paren
t Hom
es
Per
cent
Source: US Census Bureau, Census 2000, SF1 and SF3
Critical MeasuresCensus 2000
Birth Rate
Teen Birth Rate Age 15-17
Teen Birth Rate Age 15-19
Percent of Births Receiving Early Prenatal Care
Percent of Low Birthweight Births
Percent of Births to Unwed Mothers
Infant Mortality Rate
Teen Violent Death Rate Age 15-19
Percent of Students Eligible for Free/Reduced Lunch
Graduation Rate**
Source: Policy and Services Research Data Center, de la Parte Institute, USF, 2002
Beh
avio
ral H
ealth
and
Juv
enile
Jus
tice
Source: Florida Department of Juvenile Justice, 2003
Source: Florida Department of Juvenile Justice, 2000/01
Chi
ld C
are,
Hea
d S
tart
and
Edu
catio
n
Source: Florida Department of Education, 2001/02
Source: Florida Children’s Forum, 2001
67 Center for the Study of Children’s Futures 2004
18.1 17.1 16.3 16.0 16.4 16.1 16.0 15.8 15.7
54.0 54.2 52.2 54.9 50.3 45.9 47.6 41.1 34.7
85.5 80.4 76.4 76.8 76.0 71.9 71.5 67.0 60.7
74.4 76.3 77.9 79.6 83.1 79.1 83.7 84.9 84.9
8.2 8.1 8.5 8.5 8.1 9.0 9.8 9.5 9.4
33.5 35.4 35.4 35.0 35.4 36.9 38.2 38.4 38.8
8.7 10.6 8.9 9.4 8.0 9.6 9.8 10.2 9.7
6.2 6.9 8.1 6.3 4.6 3.9 5.7 4.8 4.9
39.0 27.6 46.3 46.2 46.4 37.5 46.5 46.2 45.7
84.0 78.2 77.3 71.5 68.7 69.2 58.7 57.4 55.9
58.1
27.6
61.4
41.8
49.1
Duval County
415 licensed child care centers with a capacity for 33,213 children
552 licensed family child care homes with a capacity for 3,907 children
27 Head Start programs with a capacity for 1,248 children
127,417 children were enrolled in 177 public schools
23,627 children were enrolled in exceptional student education programs
2,481 children were referred to English for Speakers of Other Languages Programs
26,743 children were enrolled in 133 non-public schools
2,828 children and families were registered in 1,864 home education programs
9,012 children received behavioral health services
44 behavioral health service providers served children
5,340 youths were referred to the juvenile justice system
59 youths were transferred to adult court
3 contracted delinquency prevention programs with 88 beds or slots
4 state grant funded delinquency prevention programs projected to serve 862 youths
10 probation and community corrections non-residential programs with 614 slots
6 residential and correctional programs with 141 beds
1 detention center with 144 beds

Number Percent Number Percent
Summary Profile for the Population Under Age 18, 1990 to 2000
1990 2000
Age & Sex
Population Under Age 18
Males Under Age 18
Females Under Age 18
Population Under Age 5
Population Age 5 - 17
Race
Children of One Race
White Children
Black or African American Children
American Indian or Alaska Native Children
Asian Children
Native Hawaiian or Other Pacific Islander Children
Children of Some Other Race
Children of Two or More Races
Hispanic Origin Status
Hispanic Children
Non-Hispanic Children
Non-Hispanic White Children
Non-Hispanic Racial Minorities
Living Arrangements
Children Living in Households
Children Living in Group Quarters
Own Children Living in Single Parent Households
Own Children Living in Married Couple Households
Source: Population Reference Bureau analysis of data from the US Census Bureau for the Annie E. Casey Foundation
1999 Income in Dollars as Reported in Census 2000
• •
•
•
Source: US Census Bureau, Census 2000, SF3 Tables P82, P53, P80 and PCT39
Number NumberPercent Percent
Source: US Census Bureau, Census 2000, SF1 and SF3;Florida Almanac, 2002/2003; Florida County Atlas, 1994
68Center for the Study of Children’s Futures 2004
66,380 100.0 69,271 100.0
34,001 51.2 35,293 50.9
32,379 48.8 33,978 49.1
19,360 29.2 17,913 25.9
47,020 70.8 51,358 74.1
N/A N/A 66,684 96.3
44,989 67.8 42,783 61.8
18,552 27.9 21,091 30.4
711 1.1 631 0.9
N/A N/A 1,446 2.1
N/A N/A 63 0.1
385 0.6 670 1.0
N/A N/A 2,587 3.7
1,411 2.1 2,122 3.1
64,969 97.9 67,149 96.9
44,144 66.5 41,686 60.2
20,825 31.4 25,463 36.8
66,205 99.7 69,116 99.8
175 0.3 155 0.2
17,253 26.0 21,559 31.1
41,562 62.6 38,883 56.1
Per Capita Income .................... 18,641 Median Family Income .............................. 41,708
Median Household Income ...... 35,234 with own children under age 18 ............. 36,534
Median Nonfamily Income....... 22,574 without own children under age 18 ........ 45,798
Escambia County was established in 1821 andSpain, France, and England all owned portionsof this county at one time. It is the state’s most
western county and Pensacola, the county seat, isconsidered by many to be a military town. ThePensacola Naval Air Station is on the waterfront.Primary industries include, health care, chemicals,paper products and tourism.
The county comprises 662 square miles of land and waspopulated by 294,410 persons in 2000. There were 445persons per square mile and the general populationincreased by 12 percent from 1990. Eleven percent of thepopulation lived in a rural area. The median age in 2000was 35 years.
There were 124,647 housing units reported with ahomeownership rate of 67 percent. Thirty-four percent ofhouseholds included at least one person under the age of 18years. Annual income was less than $25,000 in 34 percentof all 111,006 households and 33 percent of the 33,802family households with their own children. Seven percentof all households had earnings of $100,000 or greater.
Eighteen percent of persons age 25 and over did notgraduate from high school and 28 percent graduated withno further education indicated. Twenty-one percentobtained a bachelor’s degree or higher. Of 35,460 personsage 18 to 24 years, 80 percent were high school graduates.Eight percent of persons 16 to 19 years old were not inschool and not working.
Children under age 18 represented 24 percent of thepopulation in Escambia County, and 24 percent of childrenlived in poverty. Of the 41,978 persons of all ages living inpoverty, 39 percent were under the age of 18 years. Forty-nine percent of children lived in low-income householdsand 30 percent lived in high poverty neighborhoods.

Multi-Year Trend Data
** method used for calculating changed in 1998Source: Florida Department of Health, Office of Vital Statistics;Florida Department of Education
1992 1993 1994 1995 1996 1997 1998 1999 2000
Children Under Age 6 Below 100% of PovertyGrandparents Responsible 3 or More Years
100
75
50
25
0
Child
ren
Age 3
& 4
Enrol
led
in S
choo
lO
wn Chi
ldre
n Und
er A
ge 6
with
All Par
ents
in th
e La
bor F
orce
Child
ren
Under
Age
6
Below
200
% o
f Pov
erty
Gra
ndpa
rent
s Res
pons
ible
for
and
Livin
g with
Own
Gra
ndch
ildre
n Und
er A
ge 1
8
Own
Child
ren
Under
Age
6
Livin
g in
Sin
gle
Paren
t Hom
es
Per
cent
Source: US Census Bureau, Census 2000, SF1 and SF3
Critical MeasuresCensus 2000
Birth Rate
Teen Birth Rate Age 15-17
Teen Birth Rate Age 15-19
Percent of Births Receiving Early Prenatal Care
Percent of Low Birthweight Births
Percent of Births to Unwed Mothers
Infant Mortality Rate
Teen Violent Death Rate Age 15-19
Percent of Students Eligible for Free/Reduced Lunch
Graduation Rate**
Source: Policy and Services Research Data Center, de la Parte Institute, USF, 2002
Beh
avio
ral H
ealth
and
Juv
enile
Jus
tice
Source: Florida Department of Juvenile Justice, 2003
Source: Florida Department of Juvenile Justice, 2000/01
Chi
ld C
are,
Hea
d S
tart
and
Edu
catio
n
Source: Florida Department of Education, 2001/02
Source: Florida Children’s Forum, 2001
69 Center for the Study of Children’s Futures 2004
16.1 15.5 14.4 13.5 13.4 13.6 13.2 13.1 12.4
48.2 59.7 53.8 50.3 45.3 43.3 37.5 40.4 35.8
70.9 73.1 74.4 66.2 62.1 64.6 60.8 58.1 55.1
78.6 79.1 82.4 84.0 85.3 84.2 83.8 85.4 84.6
8.0 8.4 8.1 8.4 9.1 8.3 8.6 9.3 8.4
37.2 37.9 40.2 39.7 40.2 40.0 39.6 40.0 42.0
12.3 10.3 8.7 8.4 8.8 8.5 8.7 9.1 12.2
5.1 8.2 6.2 5.7 3.4 3.2 4.9 4.3 4.1
51.0 54.7 56.1 55.0 54.9 57.3 55.3 55.4 55.7
68.5 72.4 64.4 63.5 68.3 65.6 62.6 65.2 65.2
45.3
29.3
61.7
52.848.1
Escambia County
97 licensed child care centers with a capacity for 7,770 children
46 licensed family child care homes with a capacity for 352 children
34 Head Start programs with a capacity for 610 children
44,802 children were enrolled in 85 public schools
9,170 children were enrolled in exceptional student education programs
304 children were referred to English for Speakers of Other Languages Programs
7,469 children were enrolled in 30 non-public schools
1,311 children and families were registered in 955 home education programs
3,382 children received behavioral health services
21 behavioral health service providers served children
2,436 youths were referred to the juvenile justice system
37 youths were transferred to adult court
2 contracted delinquency prevention programs with 54 beds or slots
2 state grant funded delinquency prevention programs projected to serve 155 youths
6 probation and community corrections non-residential programs with 264 slots
5 residential and correctional programs with 151 beds
1 detention center with 50 beds

Number Percent Number Percent
Summary Profile for the Population Under Age 18, 1990 to 2000
1990 2000
Age & Sex
Population Under Age 18
Males Under Age 18
Females Under Age 18
Population Under Age 5
Population Age 5 - 17
Race
Children of One Race
White Children
Black or African American Children
American Indian or Alaska Native Children
Asian Children
Native Hawaiian or Other Pacific Islander Children
Children of Some Other Race
Children of Two or More Races
Hispanic Origin Status
Hispanic Children
Non-Hispanic Children
Non-Hispanic White Children
Non-Hispanic Racial Minorities
Living Arrangements
Children Living in Households
Children Living in Group Quarters
Own Children Living in Single Parent Households
Own Children Living in Married Couple Households
Source: Population Reference Bureau analysis of data from the US Census Bureau for the Annie E. Casey Foundation
1999 Income in Dollars as Reported in Census 2000
• •
•
•
Source: US Census Bureau, Census 2000, SF3 Tables P82, P53, P80 and PCT39
Number NumberPercent Percent
Source: US Census Bureau, Census 2000, SF1 and SF3;Florida Almanac, 2002/2003; Florida County Atlas, 1994
70Center for the Study of Children’s Futures 2004
5,479 100.0 8,925 100.0
2,721 49.7 4,525 50.7
2,758 50.3 4,400 49.3
1,477 27.0 2,058 23.1
4,002 73.0 6,867 76.9
N/A N/A 8,679 97.2
4,602 84.0 7,370 82.6
740 13.5 999 11.2
7 0.1 31 0.3
N/A N/A 126 1.4
N/A N/A 3 0.0
58 1.1 150 1.7
N/A N/A 246 2.8
351 6.4 660 7.4
5,128 93.6 8,265 92.6
4,324 78.9 6,932 77.7
804 14.7 1,333 14.9
5,476 99.9 8,925 100.0
3 0.1 0 0.0
925 16.9 1,978 22.2
3,928 71.7 5,946 66.6
Per Capita Income .................... 21,879 Median Family Income .............................. 45,502
Median Household Income ...... 40,214 with own children under age 18 ............. 42,466
Median Nonfamily Income....... 25,357 without own children under age 18 ........ 46,442
Flagler County was established in 1917 fromportions of St. Johns and Volusia counties andnamed for Henry Flagler, developer of the
Florida East Coast Railroad. It is noted for miles ofpristine beaches along the Atlantic Ocean. The countyseat is Bunnell. Yacht building, land development, andtourism are major industries.
The county comprises 485 square miles of land and waspopulated by 49,832 persons in 2000. There were 103persons per square mile and the general populationincreased by 74 percent from 1990. Thirty-three percent ofthe population lived in a rural area. The median age in 2000was 50 years.
There were 24,452 housing units reported with ahomeownership rate of 84 percent. Twenty-four percent ofhouseholds included at least one person under the age of 18years. Annual income was less than $25,000 in 27 percentof all 21,284 households and 26 percent of the 4,655 familyhouseholds with their own children. Nine percent of allhouseholds had earnings of $100,000 or greater.
Fourteen percent of persons age 25 and over did notgraduate from high school and 32 percent graduated withno further education indicated. Twenty-one percentobtained a bachelor’s degree or higher. Of 2,286 personsage 18 to 24 years, 74 percent were high school graduates.Seven percent of persons 16 to 19 years old were not inschool and not working.
Children under age 18 represented 18 percent of thepopulation in Flagler County, and 16 percent of childrenlived in poverty. Of the 4,287 persons of all ages living inpoverty, 33 percent were under the age of 18 years. Thirty-seven percent of children lived in low-income householdsand no children lived in high poverty neighborhoods.

Multi-Year Trend Data
** method used for calculating changed in 1998Source: Florida Department of Health, Office of Vital Statistics;Florida Department of Education
1992 1993 1994 1995 1996 1997 1998 1999 2000
Children Under Age 6 Below 100% of PovertyGrandparents Responsible 3 or More Years
100
75
50
25
0
Child
ren
Age 3
& 4
Enrol
led
in S
choo
lO
wn Chi
ldre
n Und
er A
ge 6
with
All Par
ents
in th
e La
bor F
orce
Child
ren
Under
Age
6
Below
200
% o
f Pov
erty
Gra
ndpa
rent
s Res
pons
ible
for
and
Livin
g with
Own
Gra
ndch
ildre
n Und
er A
ge 1
8
Own
Child
ren
Under
Age
6
Livin
g in
Sin
gle
Paren
t Hom
es
Per
cent
Source: US Census Bureau, Census 2000, SF1 and SF3
Critical MeasuresCensus 2000
Birth Rate
Teen Birth Rate Age 15-17
Teen Birth Rate Age 15-19
Percent of Births Receiving Early Prenatal Care
Percent of Low Birthweight Births
Percent of Births to Unwed Mothers
Infant Mortality Rate
Teen Violent Death Rate Age 15-19
Percent of Students Eligible for Free/Reduced Lunch
Graduation Rate**
Source: Policy and Services Research Data Center, de la Parte Institute, USF, 2002
Beh
avio
ral H
ealth
and
Juv
enile
Jus
tice
Source: Florida Department of Juvenile Justice, 2003
Source: Florida Department of Juvenile Justice, 2000/01
Chi
ld C
are,
Hea
d S
tart
and
Edu
catio
n
Source: Florida Department of Education, 2001/02
Source: Florida Children’s Forum, 2001
71 Center for the Study of Children’s Futures 2004
9.9 8.2 7.8 8.6 7.7 8.1 8.2 7.3 8.6
39.7 26.6 34.9 25.2 32.3 24.4 29.5 21.9 14.0
55.5 30.7 45.2 43.8 48.2 38.0 55.3 35.9 28.1
75.2 81.7 82.7 88.5 86.4 88.4 85.2 89.4 88.9
6.0 5.4 9.6 8.7 8.1 10.7 7.7 7.1 5.6
32.9 24.4 36.4 33.2 33.0 31.8 33.1 35.9 29.5
0.0 10.8 10.7 12.4 6.5 6.0 8.3 8.8 4.8
0.0 5.6 10.5 0.0 10.3 9.8 18.7 4.4 15.6
39.0 40.0 40.1 39.5 38.0 41.4 40.5 40.1 38.1
84.8 78.2 86.2 83.4 88.7 71.4 63.5 64.4 67.4
52.8
17.6
61.9
38.8 40.1
Flagler County
16 licensed child care centers with a capacity for 1,144 children
10 licensed family child care homes with a capacity for 104 children
2 Head Start programs with a capacity for 36 children
7,160 children were enrolled in 13 public schools
1,536 children were enrolled in exceptional student education programs
170 children were referred to English for Speakers of Other Languages Programs
408 children were enrolled in 4 non-public schools
163 children and families were registered in 114 home education programs
395 children received behavioral health services
16 behavioral health service providers served children
328 youths were referred to the juvenile justice system
1 youth was transferred to adult court
0 contracted delinquency prevention programs
1 state grant funded delinquency prevention program projected to serve 50 youths
0 probation and community corrections non-residential programs
0 residential and correctional programs
0 detention centers

Number Percent Number Percent
Summary Profile for the Population Under Age 18, 1990 to 2000
1990 2000
Age & Sex
Population Under Age 18
Males Under Age 18
Females Under Age 18
Population Under Age 5
Population Age 5 - 17
Race
Children of One Race
White Children
Black or African American Children
American Indian or Alaska Native Children
Asian Children
Native Hawaiian or Other Pacific Islander Children
Children of Some Other Race
Children of Two or More Races
Hispanic Origin Status
Hispanic Children
Non-Hispanic Children
Non-Hispanic White Children
Non-Hispanic Racial Minorities
Living Arrangements
Children Living in Households
Children Living in Group Quarters
Own Children Living in Single Parent Households
Own Children Living in Married Couple Households
Source: Population Reference Bureau analysis of data from the US Census Bureau for the Annie E. Casey Foundation
1999 Income in Dollars as Reported in Census 2000
• •
•
•
Source: US Census Bureau, Census 2000, SF3 Tables P82, P53, P80 and PCT39
Number NumberPercent Percent
Source: US Census Bureau, Census 2000, SF1 and SF3;Florida Almanac, 2002/2003; Florida County Atlas, 1994
72Center for the Study of Children’s Futures 2004
2,153 100.0 1,989 100.0
1,095 50.9 1,021 51.3
1,058 49.1 968 48.7
562 26.1 509 25.6
1,591 73.9 1,480 74.4
N/A N/A 1,961 98.6
1,739 80.8 1,659 83.4
399 18.5 289 14.5
8 0.4 0 0.0
N/A N/A 0 0.0
N/A N/A 0 0.0
2 0.1 13 0.7
N/A N/A 28 1.4
21 1.0 42 2.1
2,132 99.0 1,947 97.9
1,724 80.1 1,634 82.2
408 19.0 313 15.7
2,114 98.2 1,988 99.9
39 1.8 1 0.1
416 19.3 532 26.7
1,410 65.5 1,200 60.3
Per Capita Income .................... 16,140 Median Family Income .............................. 31,157
Median Household Income ...... 26,756 with own children under age 18 ............. 28,060
Median Nonfamily Income....... 16,250 without own children under age 18 ........ 32,222
Franklin County was established in 1832 fromEscambia County and its acreage is primarily theApalachicola National Forest. The unspoiled
natural environments on the Gulf Coast and St. GeorgeIsland have attracted many vacation homes. The majorindustry is seafood. The county seat is Apalachicola.
The county comprises 544 square miles of land and waspopulated by 11,057 persons in 2000. There were 20persons per square mile and the general populationincreased by 23 percent from 1990. Seventy-four percent ofthe population lived in a rural area. The median age in 2000was 41 years.
There were 7,180 housing units reported with ahomeownership rate of 79 percent. Twenty-eight percent ofhouseholds included at least one person under the age of 18years. Annual income was less than $25,000 in 46 percentof all 4,103 households and 44 percent of the 1,043 familyhouseholds with their own children. Five percent of allhouseholds had earnings of $100,000 or greater.
Thirty-two percent of persons age 25 and over did notgraduate from high school and 36 percent graduated withno further education indicated. Twelve percent obtained abachelor’s degree or higher. Of 857 persons age 18 to 24years, 59 percent were high school graduates. Seventeenpercent of persons 16 to 19 years old were not in schooland not working.
Children under age 18 represented 18 percent of thepopulation in Franklin County, and 23 percent of childrenlived in poverty. Of the 1,654 persons of all ages living inpoverty, 28 percent were under the age of 18 years. Fifty-nine percent of children lived in low-income householdsand 45 percent lived in high poverty neighborhoods.

Multi-Year Trend Data
** method used for calculating changed in 1998Source: Florida Department of Health, Office of Vital Statistics;Florida Department of Education
1992 1993 1994 1995 1996 1997 1998 1999 2000
Children Under Age 6 Below 100% of PovertyGrandparents Responsible 3 or More Years
100
75
50
25
0
Child
ren
Age 3
& 4
Enrol
led
in S
choo
lO
wn Chi
ldre
n Und
er A
ge 6
with
All Par
ents
in th
e La
bor F
orce
Child
ren
Under
Age
6
Below
200
% o
f Pov
erty
Gra
ndpa
rent
s Res
pons
ible
for
and
Livin
g with
Own
Gra
ndch
ildre
n Und
er A
ge 1
8
Own
Child
ren
Under
Age
6
Livin
g in
Sin
gle
Paren
t Hom
es
Per
cent
Source: US Census Bureau, Census 2000, SF1 and SF3
Critical MeasuresCensus 2000
Birth Rate
Teen Birth Rate Age 15-17
Teen Birth Rate Age 15-19
Percent of Births Receiving Early Prenatal Care
Percent of Low Birthweight Births
Percent of Births to Unwed Mothers
Infant Mortality Rate
Teen Violent Death Rate Age 15-19
Percent of Students Eligible for Free/Reduced Lunch
Graduation Rate**
Source: Policy and Services Research Data Center, de la Parte Institute, USF, 2002
Beh
avio
ral H
ealth
and
Juv
enile
Jus
tice
Source: Florida Department of Juvenile Justice, 2003
Source: Florida Department of Juvenile Justice, 2000/01
Chi
ld C
are,
Hea
d S
tart
and
Edu
catio
n
Source: Florida Department of Education, 2001/02
Source: Florida Children’s Forum, 2001
73 Center for the Study of Children’s Futures 2004
41.2
26.9
54.3
74.972.1
12.8 12.5 10.5 9.2 9.4 10.5 11.9 10.7 9.6
42.1 64.0 28.3 29.9 52.6 45.5 33.5 44.7 18.1
73.0 74.0 73.7 63.4 84.5 68.7 98.3 101.7 70.9
75.0 78.8 81.0 * * 77.5 85.8 88.9 90.3
6.7 6.7 4.8 * * 6.3 10.9 8.5 4.7
37.5 39.5 39.0 * * 35.1 45.0 36.8 46.2
8.3 8.4 19.0 * * 36.0 38.8 17.1 9.4
31.3 0.0 14.8 0.0 0.0 34.0 16.7 0.0 0.0
59.6 60.8 61.5 59.4 54.4 63.1 62.3 62.1 64.2
70.4 75.5 62.3 61.5 74.1 55.5 71.2 63.2 65.8*unreliable ratio, denominator less than 100
Franklin County
4 licensed child care centers with a capacity for 124 children
2 licensed family child care homes with a capacity for 20 children
3 Head Start and Early Head Start programs with a capacity for 56 children
1,442 children were enrolled in 7 public schools
258 children were enrolled in exceptional student education programs
2 children were referred to English for Speakers of Other Languages Programs
61 children were enrolled in 1 non-public school
19 children and families were registered in 14 home education programs
102 children received behavioral health services
11 behavioral health service providers served children
72 youths were referred to the juvenile justice system
9 youths were transferred to adult court
0 contracted delinquency prevention programs
1 state grant funded delinquency prevention program projected to serve 114 youths
0 probation and community corrections non-residential programs
0 residential and correctional programs
0 detention centers

Number Percent Number Percent
Summary Profile for the Population Under Age 18, 1990 to 2000
1990 2000
Age & Sex
Population Under Age 18
Males Under Age 18
Females Under Age 18
Population Under Age 5
Population Age 5 - 17
Race
Children of One Race
White Children
Black or African American Children
American Indian or Alaska Native Children
Asian Children
Native Hawaiian or Other Pacific Islander Children
Children of Some Other Race
Children of Two or More Races
Hispanic Origin Status
Hispanic Children
Non-Hispanic Children
Non-Hispanic White Children
Non-Hispanic Racial Minorities
Living Arrangements
Children Living in Households
Children Living in Group Quarters
Own Children Living in Single Parent Households
Own Children Living in Married Couple Households
Source: Population Reference Bureau analysis of data from the US Census Bureau for the Annie E. Casey Foundation
1999 Income in Dollars as Reported in Census 2000
• •
•
•
Source: US Census Bureau, Census 2000, SF3 Tables P82, P53, P80 and PCT39
Number NumberPercent Percent
Source: US Census Bureau, Census 2000, SF1 and SF3;Florida Almanac, 2002/2003; Florida County Atlas, 1994
74Center for the Study of Children’s Futures 2004
12,164 100.0 11,919 100.0
6,259 51.5 6,064 50.9
5,905 48.5 5,855 49.1
3,178 26.1 3,018 25.3
8,986 73.9 8,901 74.7
N/A N/A 11,765 98.7
3,398 27.9 3,165 26.6
8,530 70.1 8,075 67.7
17 0.1 30 0.3
N/A N/A 21 0.2
N/A N/A 1 0.0
200 1.6 473 4.0
N/A N/A 154 1.3
344 2.8 1,029 8.6
11,820 97.2 10,890 91.4
3,281 27.0 2,709 22.7
8,539 70.2 8,181 68.6
12,151 99.9 11,912 99.9
13 0.1 7 0.1
4,195 34.5 4,181 35.1
5,598 46.0 5,292 44.4
Per Capita Income .................... 14,499 Median Family Income .............................. 36,238
Median Household Income ...... 31,248 with own children under age 18 ............. 32,054
Median Nonfamily Income....... 18,252 without own children under age 18 ........ 40,145
Gadsden County was established in 1823 andborders the Georgia state line. The countycontinues to be noted for its large plantations
and tobacco crops. The county seat is Quincy. Themajor employers are wholesale food distributors,mushroom growers, and makers of lumber, wire andnails, and furniture.
The county comprises 516 square miles of land and waspopulated by 45,087 persons in 2000. There were 87persons per square mile and the general populationincreased by 10 percent from 1990. Sixty-five percent ofthe population lived in a rural area. The median age in 2000was 36 years.
There were 17,703 housing units reported with ahomeownership rate of 78 percent. Forty percent ofhouseholds included at least one person under the age of 18years. Annual income was less than $25,000 in 40 percentof all 15,842 households and 38 percent of the 5,316 familyhouseholds with their own children. Four percent of allhouseholds had earnings of $100,000 or greater.
Twenty-nine percent of persons age 25 and over did notgraduate from high school and 36 percent graduated withno further education indicated. Thirteen percent obtained abachelor’s degree or higher. Of 4,204 persons age 18 to 24years, 64 percent were high school graduates. Twelvepercent of persons 16 to 19 years old were not in schooland not working.
Children under age 18 represented 26 percent of thepopulation in Gadsden County, and 28 percent of childrenlived in poverty. Of the 8,509 persons of all ages living inpoverty, 39 percent were under the age of 18 years. Fifty-nine percent of children lived in low-income householdsand 43 percent lived in high poverty neighborhoods.

Multi-Year Trend Data
** method used for calculating changed in 1998Source: Florida Department of Health, Office of Vital Statistics;Florida Department of Education
1992 1993 1994 1995 1996 1997 1998 1999 2000
Children Under Age 6 Below 100% of PovertyGrandparents Responsible 3 or More Years
100
75
50
25
0
Child
ren
Age 3
& 4
Enrol
led
in S
choo
lO
wn Chi
ldre
n Und
er A
ge 6
with
All Par
ents
in th
e La
bor F
orce
Child
ren
Under
Age
6
Below
200
% o
f Pov
erty
Gra
ndpa
rent
s Res
pons
ible
for
and
Livin
g with
Own
Gra
ndch
ildre
n Und
er A
ge 1
8
Own
Child
ren
Under
Age
6
Livin
g in
Sin
gle
Paren
t Hom
es
Per
cent
Source: US Census Bureau, Census 2000, SF1 and SF3
Critical MeasuresCensus 2000
Birth Rate
Teen Birth Rate Age 15-17
Teen Birth Rate Age 15-19
Percent of Births Receiving Early Prenatal Care
Percent of Low Birthweight Births
Percent of Births to Unwed Mothers
Infant Mortality Rate
Teen Violent Death Rate Age 15-19
Percent of Students Eligible for Free/Reduced Lunch
Graduation Rate**
Source: Policy and Services Research Data Center, de la Parte Institute, USF, 2002
Beh
avio
ral H
ealth
and
Juv
enile
Jus
tice
Source: Florida Department of Juvenile Justice, 2003
Source: Florida Department of Juvenile Justice, 2000/01
Chi
ld C
are,
Hea
d S
tart
and
Edu
catio
n
Source: Florida Department of Education, 2001/02
Source: Florida Children’s Forum, 2001
75 Center for the Study of Children’s Futures 2004
19.1 17.0 15.3 14.3 14.3 13.7 13.6 13.8 13.4
88.6 73.2 80.8 68.8 61.4 56.6 57.9 59.9 64.8
111.3 96.8 101.8 91.8 94.7 85.8 93.1 85.4 93.6
77.2 79.7 81.1 80.5 81.4 83.0 86.5 87.7 84.7
10.6 9.8 10.3 11.3 11.3 10.9 11.7 12.3 11.5
58.4 59.2 56.9 60.5 58.8 59.2 62.7 60.4 60.1
13.6 12.4 20.5 9.4 4.6 13.1 17.3 22.4 17.0
6.0 6.0 11.9 5.8 6.2 2.7 10.7 15.9 5.6
71.9 78.1 74.3 73.1 83.4 82.5 84.0 82.3 73.3
66.0 62.9 50.0 52.0 51.4 55.7 46.0 50.7 51.0
50.7
31.6
63.5 61.356.8
Gadsden County
28 licensed child care centers with a capacity for 1,501 children
5 licensed family child care homes with a capacity for 50 children
29 Head Start programs with a capacity for 195 children
7,433 children were enrolled in 28 public schools
1,441 children were enrolled in exceptional student education programs
372 children were referred to English for Speakers of Other Languages Programs
544 children were enrolled in 2 non-public schools
254 children and families were registered in 160 home education programs
440 children received behavioral health services
12 behavioral health service providers served children
265 youths were referred to the juvenile justice system
8 youths were transferred to adult court
0 contracted delinquency prevention programs
1 state grant funded delinquency prevention program projected to serve 60 youths
0 probation and community corrections non-residential programs
0 residential and correctional programs
0 detention centers

Number Percent Number Percent
Summary Profile for the Population Under Age 18, 1990 to 2000
1990 2000
Age & Sex
Population Under Age 18
Males Under Age 18
Females Under Age 18
Population Under Age 5
Population Age 5 - 17
Race
Children of One Race
White Children
Black or African American Children
American Indian or Alaska Native Children
Asian Children
Native Hawaiian or Other Pacific Islander Children
Children of Some Other Race
Children of Two or More Races
Hispanic Origin Status
Hispanic Children
Non-Hispanic Children
Non-Hispanic White Children
Non-Hispanic Racial Minorities
Living Arrangements
Children Living in Households
Children Living in Group Quarters
Own Children Living in Single Parent Households
Own Children Living in Married Couple Households
Source: Population Reference Bureau analysis of data from the US Census Bureau for the Annie E. Casey Foundation
1999 Income in Dollars as Reported in Census 2000
• •
•
•
Source: US Census Bureau, Census 2000, SF3 Tables P82, P53, P80 and PCT39
Number NumberPercent Percent
Source: US Census Bureau, Census 2000, SF1 and SF3;Florida Almanac, 2002/2003; Florida County Atlas, 1994
76Center for the Study of Children’s Futures 2004
2,422 100.0 3,529 100.0
1,262 52.1 1,807 51.2
1,160 47.9 1,722 48.8
650 26.8 827 23.4
1,772 73.2 2,702 76.6
N/A N/A 3,477 98.5
2,207 91.1 3,218 91.2
195 8.1 203 5.8
6 0.2 16 0.5
N/A N/A 4 0.1
N/A N/A 0 0.0
4 0.2 36 1.0
N/A N/A 52 1.5
28 1.2 110 3.1
2,394 98.8 3,419 96.9
2,184 90.2 3,151 89.3
210 8.7 268 7.6
2,345 96.8 3,516 99.6
77 3.2 13 0.4
428 17.7 777 22.0
1,726 71.3 2,323 65.8
Per Capita Income .................... 13,985 Median Family Income .............................. 34,485
Median Household Income ...... 30,328 with own children under age 18 ............. 35,890
Median Nonfamily Income....... 17,344 without own children under age 18 ........ 33,086
Gilchrist County was established in 1925 andwas the last county formed in Florida. It wasestablished from a portion of Alachua County
and named for Albert Walter Gilchrist, Florida’stwentieth governor. The county seat is Trenton. Dairyand tourism are the main industries; crystal-clearsprings and rivers are plentiful.
The county comprises 349 square miles of land and waspopulated by 14,437 persons in 2000. There were 41persons per square mile and the general populationincreased by 49 percent from 1990. One hundred percentof the population lived in a rural area. The median age in2000 was 35 years.
There were 5,906 housing units reported with ahomeownership rate of 86 percent. Thirty-seven percent ofhouseholds included at least one person under the age of 18years. Annual income was less than $25,000 in 40 percentof all 5,001 households and 32 percent of the 1,694 familyhouseholds with their own children. Four percent of allhouseholds had earnings of $100,000 or greater.
Twenty-eight percent of persons age 25 and over did notgraduate from high school and 36 percent graduated withno further education indicated. Nine percent obtained abachelor’s degree or higher. Of 2,057 persons age 18 to 24years, 54 percent were high school graduates. Eighteenpercent of persons 16 to 19 years old were not in schooland not working.
Children under age 18 represented 24 percent of thepopulation in Gilchrist County, and 18 percent of childrenlived in poverty. Of the 1,844 persons of all ages living inpoverty, 34 percent were under the age of 18 years. Fifty-four percent of children lived in low-income householdsand no children lived in high poverty neighborhoods.

Multi-Year Trend Data
** method used for calculating changed in 1998Source: Florida Department of Health, Office of Vital Statistics;Florida Department of Education
1992 1993 1994 1995 1996 1997 1998 1999 2000
Children Under Age 6 Below 100% of PovertyGrandparents Responsible 3 or More Years
100
75
50
25
0
Child
ren
Age 3
& 4
Enrol
led
in S
choo
lO
wn Chi
ldre
n Und
er A
ge 6
with
All Par
ents
in th
e La
bor F
orce
Child
ren
Under
Age
6
Below
200
% o
f Pov
erty
Gra
ndpa
rent
s Res
pons
ible
for
and
Livin
g with
Own
Gra
ndch
ildre
n Und
er A
ge 1
8
Own
Child
ren
Under
Age
6
Livin
g in
Sin
gle
Paren
t Hom
es
Per
cent
Source: US Census Bureau, Census 2000, SF1 and SF3
Critical MeasuresCensus 2000
Birth Rate
Teen Birth Rate Age 15-17
Teen Birth Rate Age 15-19
Percent of Births Receiving Early Prenatal Care
Percent of Low Birthweight Births
Percent of Births to Unwed Mothers
Infant Mortality Rate
Teen Violent Death Rate Age 15-19
Percent of Students Eligible for Free/Reduced Lunch
Graduation Rate**
Source: Policy and Services Research Data Center, de la Parte Institute, USF, 2002
Beh
avio
ral H
ealth
and
Juv
enile
Jus
tice
Source: Florida Department of Juvenile Justice, 2003
Source: Florida Department of Juvenile Justice, 2000/01
Chi
ld C
are,
Hea
d S
tart
and
Edu
catio
n
Source: Florida Department of Education, 2001/02
Source: Florida Children’s Forum, 2001
77 Center for the Study of Children’s Futures 2004
13.0 12.5 13.1 12.5 11.0 13.8 12.7 11.6 13.0
50.0 49.5 90.4 83.3 39.3 46.0 52.2 23.3 25.9
91.2 71.2 94.9 98.4 69.9 79.6 75.8 43.7 61.8
80.5 84.0 86.8 83.8 83.8 85.1 80.4 83.4 80.6
4.5 6.8 5.3 4.0 10.9 9.2 7.1 6.4 11.0
19.5 31.1 33.8 35.3 34.3 30.5 32.0 28.7 33.7
0.0 0.0 6.6 6.7 21.9 5.7 5.9 19.1 16.6
0.0 22.7 11.0 27.4 17.5 16.9 0.0 0.0 0.0
44.6 47.2 47.6 49.9 50.3 52.7 52.9 54.1 46.3
73.9 73.7 89.0 77.2 87.2 74.1 64.1 55.4 66.5
47.5
20.3
68.5
58.8
46.4
Gilchrist County
2 licensed child care centers with a capacity for 149 children
0 licensed family child care homes
2 Head Start programs with a capacity for 20 children
2,669 children were enrolled in 7 public schools
589 children were enrolled in exceptional student education programs
8 children were referred to English for Speakers of Other Languages Programs
250 children were enrolled in 2 non-public schools
107 children and families were registered in 73 home education programs
216 children received behavioral health services
9 behavioral health service providers served children
111 youths were referred to the juvenile justice system
0 youths were transferred to adult court
0 contracted delinquency prevention programs
1 state grant funded delinquency prevention program projected to serve 75 youths
2 probation and community corrections non-residential programs with 149 slots
0 residential and correctional programs
0 detention centers

Number Percent Number Percent
Summary Profile for the Population Under Age 18, 1990 to 2000
1990 2000
Age & Sex
Population Under Age 18
Males Under Age 18
Females Under Age 18
Population Under Age 5
Population Age 5 - 17
Race
Children of One Race
White Children
Black or African American Children
American Indian or Alaska Native Children
Asian Children
Native Hawaiian or Other Pacific Islander Children
Children of Some Other Race
Children of Two or More Races
Hispanic Origin Status
Hispanic Children
Non-Hispanic Children
Non-Hispanic White Children
Non-Hispanic Racial Minorities
Living Arrangements
Children Living in Households
Children Living in Group Quarters
Own Children Living in Single Parent Households
Own Children Living in Married Couple Households
Source: Population Reference Bureau analysis of data from the US Census Bureau for the Annie E. Casey Foundation
1999 Income in Dollars as Reported in Census 2000
• •
•
•
Source: US Census Bureau, Census 2000, SF3 Tables P82, P53, P80 and PCT39
Number NumberPercent Percent
Source: US Census Bureau, Census 2000, SF1 and SF3;Florida Almanac, 2002/2003; Florida County Atlas, 1994
78Center for the Study of Children’s Futures 2004
1,856 100.0 2,337 100.0
974 52.5 1,217 52.1
882 47.5 1,120 47.9
487 26.2 618 26.4
1,369 73.8 1,719 73.6
N/A N/A 2,275 97.3
1,216 65.5 1,559 66.7
370 19.9 280 12.0
173 9.3 196 8.4
N/A N/A 5 0.2
N/A N/A 0 0.0
91 4.9 235 10.1
N/A N/A 62 2.7
223 12.0 549 23.5
1,633 88.0 1,788 76.5
1,090 58.7 1,287 55.1
543 29.3 501 21.4
1,828 98.5 2,330 99.7
28 1.5 7 0.3
281 15.1 591 25.3
1,240 66.8 1,370 58.6
Per Capita Income .................... 15,338 Median Family Income .............................. 34,223
Median Household Income ...... 30,774 with own children under age 18 ............. 37,500
Median Nonfamily Income....... 16,265 without own children under age 18 ........ 32,444
Glades County was established in 1921 fromDeSoto County and was named for theEverglades. The county seat is Moore Haven.
It is the site of a large Seminole Indian Reservation,home to the Fisheating Creek Wildlife Refuge andManagement Area, and is known for the productionof sugar cane. Outdoor activities such as fishing andboating are popular.
The county comprises 774 square miles of land and waspopulated by 10,576 persons in 2000. There were 14persons per square mile and the general populationincreased by 39 percent from 1990. Seventy-three percentof the population lived in a rural area. The median age in2000 was 40 years.
There were 5,790 housing units reported with ahomeownership rate of 82 percent. Thirty percent ofhouseholds included at least one person under the age of 18years. Annual income was less than $25,000 in 39 percentof all 3,876 households and 32 percent of the 1,020 familyhouseholds with their own children. Six percent of allhouseholds had earnings of $100,000 or greater.
Thirty percent of persons age 25 and over did not graduatefrom high school and 37 percent graduated with no furthereducation indicated. Ten percent obtained a bachelor’sdegree or higher. Of 838 persons age 18 to 24 years, 52percent were high school graduates. Six percent of persons16 to 19 years old were not in school and not working.
Children under age 18 represented 22 percent of thepopulation in Glades County, and 20 percent of childrenlived in poverty. Of the 1,487 persons of all ages living inpoverty, 30 percent were under the age of 18 years. Fifty-four percent of children lived in low-income householdsand no children lived in high poverty neighborhoods.

Multi-Year Trend Data
** method used for calculating changed in 1998Source: Florida Department of Health, Office of Vital Statistics;Florida Department of Education
1992 1993 1994 1995 1996 1997 1998 1999 2000
Children Under Age 6 Below 100% of PovertyGrandparents Responsible 3 or More Years
100
75
50
25
0
Child
ren
Age 3
& 4
Enrol
led
in S
choo
lO
wn Chi
ldre
n Und
er A
ge 6
with
All Par
ents
in th
e La
bor F
orce
Child
ren
Under
Age
6
Below
200
% o
f Pov
erty
Gra
ndpa
rent
s Res
pons
ible
for
and
Livin
g with
Own
Gra
ndch
ildre
n Und
er A
ge 1
8
Own
Child
ren
Under
Age
6
Livin
g in
Sin
gle
Paren
t Hom
es
Per
cent
Source: US Census Bureau, Census 2000, SF1 and SF3
Critical MeasuresCensus 2000
Birth Rate
Teen Birth Rate Age 15-17
Teen Birth Rate Age 15-19
Percent of Births Receiving Early Prenatal Care
Percent of Low Birthweight Births
Percent of Births to Unwed Mothers
Infant Mortality Rate
Teen Violent Death Rate Age 15-19
Percent of Students Eligible for Free/Reduced Lunch
Graduation Rate**
Source: Policy and Services Research Data Center, de la Parte Institute, USF, 2002
Beh
avio
ral H
ealth
and
Juv
enile
Jus
tice
Source: Florida Department of Juvenile Justice, 2003
Source: Florida Department of Juvenile Justice, 2000/01
Chi
ld C
are,
Hea
d S
tart
and
Edu
catio
n
Source: Florida Department of Education, 2001/02
Source: Florida Children’s Forum, 2001
79 Center for the Study of Children’s Futures 2004
11.4 11.1 9.8 7.3 8.2 10.0 9.0 7.6 8.6
57.0 30.9 54.9 51.7 32.4 42.8 36.6 26.7 25.0
72.9 75.7 58.8 62.3 55.4 68.3 50.5 47.8 38.0
* * * * * * * * *
* * * * * * * * *
* * * * * * * * *
* * * * * * * * *
18.8 0.0 18.1 17.1 0.0 32.5 16.0 0.0 15.5
58.0 58.7 57.7 51.9 57.6 58.7 59.3 63.6 62.6
107.8 56.4 58.1 48.6 58.8 60.4 66.7 51.0 54.8*unreliable ratio, denominator less than 100
45.7
25.2
55.759.1
51.1
Glades County
64 children received behavioral health services
8 behavioral health service providers served children
34 youths were referred to the juvenile justice system
0 youths were transferred to adult court
0 contracted delinquency prevention programs
1 state grant funded delinquency prevention program projected to serve 50 youths
0 probation and community corrections non-residential programs
0 residential and correctional programs
0 detention centers
1 licensed child care center with a capacity for 45 children
0 licensed family child care homes
10 Head Start and Early Head Start programs with a capacity for 97 children
1,099 children were enrolled in 8 public schools
205 children were enrolled in exceptional student education programs
41 children were referred to English for Speakers of Other Languages Programs
22 children were enrolled in 1 non-public school
42 children and families were registered in 32 home education programs

Number Percent Number Percent
Summary Profile for the Population Under Age 18, 1990 to 2000
1990 2000
Age & Sex
Population Under Age 18
Males Under Age 18
Females Under Age 18
Population Under Age 5
Population Age 5 - 17
Race
Children of One Race
White Children
Black or African American Children
American Indian or Alaska Native Children
Asian Children
Native Hawaiian or Other Pacific Islander Children
Children of Some Other Race
Children of Two or More Races
Hispanic Origin Status
Hispanic Children
Non-Hispanic Children
Non-Hispanic White Children
Non-Hispanic Racial Minorities
Living Arrangements
Children Living in Households
Children Living in Group Quarters
Own Children Living in Single Parent Households
Own Children Living in Married Couple Households
Source: Population Reference Bureau analysis of data from the US Census Bureau for the Annie E. Casey Foundation
1999 Income in Dollars as Reported in Census 2000
• •
•
•
Source: US Census Bureau, Census 2000, SF3 Tables P82, P53, P80 and PCT39
Number NumberPercent Percent
Source: US Census Bureau, Census 2000, SF1 and SF3;Florida Almanac, 2002/2003; Florida County Atlas, 1994
80Center for the Study of Children’s Futures 2004
2,823 100.0 2,895 100.0
1,498 53.1 1,498 51.7
1,325 46.9 1,397 48.3
702 24.9 674 23.3
2,121 75.1 2,221 76.7
N/A N/A 2,829 97.7
2,118 75.0 2,296 79.3
682 24.2 494 17.1
13 0.5 11 0.4
N/A N/A 14 0.5
N/A N/A 1 0.0
3 0.1 13 0.4
N/A N/A 66 2.3
27 1.0 39 1.3
2,796 99.0 2,856 98.7
2,099 74.4 2,272 78.5
697 24.7 584 20.2
2,805 99.4 2,875 99.3
18 0.6 20 0.7
554 19.6 698 24.1
1,894 67.1 1,742 60.2
Per Capita Income .................... 14,449 Median Family Income .............................. 36,289
Median Household Income ...... 30,276 with own children under age 18 ............. 34,415
Median Nonfamily Income....... 16,206 without own children under age 18 ........ 38,671
Gulf County was established in 1925 from aportion of Calhoun County and named for theGulf of Mexico. Port St. Joe is the county seat
and the site of Florida’s first ConstitutionalConvention. This county is in the Panhandle frontingon the Gulf of Mexico, providing an attractive touristarea. Industries include paper, transportation of crudeoil, magnesium and coal.
The county comprises 555 square miles of land and waspopulated by 13,332 persons in 2000. There were 24persons per square mile and the general populationincreased by 16 percent from 1990. Sixty-seven percent ofthe population lived in a rural area. The median age in 2000was 40 years.
There were 7,587 housing units reported with ahomeownership rate of 81 percent. Thirty-three percent ofhouseholds included at least one person under the age of 18years. Annual income was less than $25,000 in 41 percentof all 4,914 households and 35 percent of the 1,408 familyhouseholds with their own children. Four percent of allhouseholds had earnings of $100,000 or greater.
Twenty-seven percent of persons age 25 and over did notgraduate from high school and 37 percent graduated withno further education indicated. Ten percent obtained abachelor’s degree or higher. Of 935 persons age 18 to 24years, 74 percent were high school graduates. Twelvepercent of persons 16 to 19 years old were not in schooland not working.
Children under age 18 represented 22 percent of thepopulation in Gulf County, and 21 percent of children livedin poverty. Of the 1,988 persons of all ages living inpoverty, 30 percent were under the age of 18 years. Forty-eight percent of children lived in low-income householdsand 25 percent lived in high poverty neighborhoods.

Multi-Year Trend Data
** method used for calculating changed in 1998Source: Florida Department of Health, Office of Vital Statistics;Florida Department of Education
1992 1993 1994 1995 1996 1997 1998 1999 2000
Children Under Age 6 Below 100% of PovertyGrandparents Responsible 3 or More Years
100
75
50
25
0
Child
ren
Age 3
& 4
Enrol
led
in S
choo
lO
wn Chi
ldre
n Und
er A
ge 6
with
All Par
ents
in th
e La
bor F
orce
Child
ren
Under
Age
6
Below
200
% o
f Pov
erty
Gra
ndpa
rent
s Res
pons
ible
for
and
Livin
g with
Own
Gra
ndch
ildre
n Und
er A
ge 1
8
Own
Child
ren
Under
Age
6
Livin
g in
Sin
gle
Paren
t Hom
es
Per
cent
Source: US Census Bureau, Census 2000, SF1 and SF3
Critical MeasuresCensus 2000
Birth Rate
Teen Birth Rate Age 15-17
Teen Birth Rate Age 15-19
Percent of Births Receiving Early Prenatal Care
Percent of Low Birthweight Births
Percent of Births to Unwed Mothers
Infant Mortality Rate
Teen Violent Death Rate Age 15-19
Percent of Students Eligible for Free/Reduced Lunch
Graduation Rate**
Source: Policy and Services Research Data Center, de la Parte Institute, USF, 2002
Beh
avio
ral H
ealth
and
Juv
enile
Jus
tice
Source: Florida Department of Juvenile Justice, 2003
Source: Florida Department of Juvenile Justice, 2000/01
Chi
ld C
are,
Hea
d S
tart
and
Edu
catio
n
Source: Florida Department of Education, 2001/02
Source: Florida Children’s Forum, 2001
81 Center for the Study of Children’s Futures 2004
13.3 14.2 9.8 9.4 11.9 9.9 9.9 9.5 8.5
50.6 64.7 55.1 37.0 59.7 37.0 34.1 27.8 26.2
84.9 86.4 60.4 60.5 96.9 72.1 66.3 56.3 45.7
73.5 75.4 84.4 83.2 74.4 83.0 86.5 85.1 84.1
3.9 6.0 6.9 12.0 7.3 6.4 8.5 8.8 5.5
34.2 37.1 35.4 33.6 39.6 26.2 30.3 39.4 26.8
0.0 6.0 15.4 16.0 6.1 14.2 0.0 21.9 23.6
0.0 0.0 11.8 23.4 11.4 11.2 0.0 10.5 11.8
42.3 46.4 46.6 47.5 47.6 48.5 50.8 53.1 50.4
84.2 97.6 80.1 93.4 85.2 91.6 80.0 83.0 81.5
51.7
23.4
61.3
50.9
72.9
Gulf County
106 children received behavioral health services
12 behavioral health service providers served children
74 youths were referred to the juvenile justice system
3 youths were transferred to adult court
0 contracted delinquency prevention programs
1 state grant funded delinquency prevention program projected to serve 30 youths
0 probation and community corrections non-residential programs
0 residential and correctional programs
0 detention centers
2 licensed child care centers with a capacity for 57 children
1 licensed family child care home with a capacity for 10 children
4 Head Start and Early Head Start programs with a capacity for 80 children
2,218 children were enrolled in 7 public schools
436 children were enrolled in exceptional student education programs
2 children were referred to English for Speakers of Other Languages Programs
98 children were enrolled in 1 non-public school
23 children and families were registered in 17 home education programs

Number Percent Number Percent
Summary Profile for the Population Under Age 18, 1990 to 2000
1990 2000
Age & Sex
Population Under Age 18
Males Under Age 18
Females Under Age 18
Population Under Age 5
Population Age 5 - 17
Race
Children of One Race
White Children
Black or African American Children
American Indian or Alaska Native Children
Asian Children
Native Hawaiian or Other Pacific Islander Children
Children of Some Other Race
Children of Two or More Races
Hispanic Origin Status
Hispanic Children
Non-Hispanic Children
Non-Hispanic White Children
Non-Hispanic Racial Minorities
Living Arrangements
Children Living in Households
Children Living in Group Quarters
Own Children Living in Single Parent Households
Own Children Living in Married Couple Households
Source: Population Reference Bureau analysis of data from the US Census Bureau for the Annie E. Casey Foundation
1999 Income in Dollars as Reported in Census 2000
• •
•
•
Source: US Census Bureau, Census 2000, SF3 Tables P82, P53, P80 and PCT39
Number NumberPercent Percent
Source: US Census Bureau, Census 2000, SF1 and SF3;Florida Almanac, 2002/2003; Florida County Atlas, 1994
82Center for the Study of Children’s Futures 2004
3,156 100.0 3,137 100.0
1,598 50.6 1,620 51.6
1,558 49.4 1,517 48.4
805 25.5 840 26.8
2,351 74.5 2,297 73.2
N/A N/A 3,102 98.9
1,621 51.4 1,660 52.9
1,453 46 1,360 43.4
18 0.6 8 0.3
N/A N/A 4 0.1
N/A N/A 0 0.0
59 1.9 70 2.2
N/A N/A 35 1.1
89 2.8 210 6.7
3,067 97.2 2,927 93.3
1,602 50.8 1,538 49.0
1,465 46.4 1,389 44.3
3,145 99.7 3,081 98.2
11 0.3 56 1.8
948 30.0 880 28.1
1,744 55.3 1,623 51.7
Per Capita Income .................... 10,562 Median Family Income .............................. 30,677
Median Household Income ...... 25,638 with own children under age 18 ............. 26,573
Median Nonfamily Income....... 12,486 without own children under age 18 ........ 32,110
Hamilton County was established in 1827 from aportion of Escambia County and named forAlexander Hamilton, the first U.S. Secretary of
the Treasury. The county seat is Jasper. The FloridaFolklife Program is housed at the Stephen FosterMemorial in White Springs, where an annual festival isheld each year. The phosphate industry is a primaryprivate employer in this county.
The county comprises 515 square miles of land and waspopulated by 13,327 persons in 2000. There were 26persons per square mile and the general populationincreased by 22 percent from 1990. Eighty-one percent ofthe population lived in a rural area. The median age in 2000was 35 years.
There were 4,966 housing units reported with ahomeownership rate of 77 percent. Thirty-nine percent ofhouseholds included at least one person under the age of 18years. Annual income was less than $25,000 in 49 percentof all 4,155 households and 47 percent of the 1,407 familyhouseholds with their own children. Two percent of allhouseholds had earnings of $100,000 or greater.
Thirty-seven percent of persons age 25 and over did notgraduate from high school and 35 percent graduated withno further education indicated. Seven percent obtained abachelor’s degree or higher. Of 1,443 persons age 18 to 24years, 43 percent were high school graduates. Twenty-twopercent of persons 16 to 19 years old were not in schooland not working.
Children under age 18 represented 24 percent of thepopulation in Hamilton County, and 36 percent of childrenlived in poverty. Of the 2,799 persons of all ages living inpoverty, 38 percent were under the age of 18 years. Sixtypercent of children lived in low-income households and100 percent lived in high poverty neighborhoods.

Multi-Year Trend Data
** method used for calculating changed in 1998Source: Florida Department of Health, Office of Vital Statistics;Florida Department of Education
1992 1993 1994 1995 1996 1997 1998 1999 2000
Children Under Age 6 Below 100% of PovertyGrandparents Responsible 3 or More Years
100
75
50
25
0
Child
ren
Age 3
& 4
Enrol
led
in S
choo
lO
wn Chi
ldre
n Und
er A
ge 6
with
All Par
ents
in th
e La
bor F
orce
Child
ren
Under
Age
6
Below
200
% o
f Pov
erty
Gra
ndpa
rent
s Res
pons
ible
for
and
Livin
g with
Own
Gra
ndch
ildre
n Und
er A
ge 1
8
Own
Child
ren
Under
Age
6
Livin
g in
Sin
gle
Paren
t Hom
es
Per
cent
Source: US Census Bureau, Census 2000, SF1 and SF3
Critical MeasuresCensus 2000
Birth Rate
Teen Birth Rate Age 15-17
Teen Birth Rate Age 15-19
Percent of Births Receiving Early Prenatal Care
Percent of Low Birthweight Births
Percent of Births to Unwed Mothers
Infant Mortality Rate
Teen Violent Death Rate Age 15-19
Percent of Students Eligible for Free/Reduced Lunch
Graduation Rate**
Source: Policy and Services Research Data Center, de la Parte Institute, USF, 2002
Beh
avio
ral H
ealth
and
Juv
enile
Jus
tice
Source: Florida Department of Juvenile Justice, 2003
Source: Florida Department of Juvenile Justice, 2000/01
Chi
ld C
are,
Hea
d S
tart
and
Edu
catio
n
Source: Florida Department of Education, 2001/02
Source: Florida Children’s Forum, 2001
83 Center for the Study of Children’s Futures 2004
14.3 12.4 11.7 11.8 11.0 11.4 11.7 11.2 11.0
72.6 50.0 51.7 47.9 30.8 58.3 40.8 39.5 45.6
97.5 63.8 72.0 76.9 78.9 80.8 72.2 72.0 81.7
62.0 69.7 69.8 77.0 82.9 73.9 83.1 79.9 82.6
9.7 9.0 9.3 8.8 10.1 8.9 10.2 11.1 10.7
47.9 46.9 46.4 45.3 43.0 50.3 50.9 46.3 42.3
0.0 20.7 0.0 6.8 0.0 6.4 12.0 6.2 0.0
9.9 0.0 9.7 0.0 9.1 8.9 0.0 0.0 10.7
53.8 59.0 57.8 60.5 62.0 63.0 66.0 65.3 66.8
67.0 79.6 74.0 67.9 64.1 64.8 54.3 70.4 59.5
39.0
27.2
54.8
66.4
49.8
Hamilton County
288 children received behavioral health services
8 behavioral health service providers served children
88 youths were referred to the juvenile justice system
7 youths were transferred to adult court
0 contracted delinquency prevention programs
1 state grant funded delinquency prevention program projected to serve 100 youths
0 probation and community corrections non-residential programs
1 residential and correctional program with 48 beds
0 detention centers
7 licensed child care centers with a capacity for 191 children
1 licensed family child care home with a capacity for 10 children
2 Head Start programs with a capacity for 49 children
2,159 children were enrolled in 9 public schools
407 children were enrolled in exceptional student education programs
54 children were referred to English for Speakers of Other Languages Programs
136 children were enrolled in 4 non-public schools
53 children and families were registered in 33 home education programs

Number Percent Number Percent
Summary Profile for the Population Under Age 18, 1990 to 2000
1990 2000
Age & Sex
Population Under Age 18
Males Under Age 18
Females Under Age 18
Population Under Age 5
Population Age 5 - 17
Race
Children of One Race
White Children
Black or African American Children
American Indian or Alaska Native Children
Asian Children
Native Hawaiian or Other Pacific Islander Children
Children of Some Other Race
Children of Two or More Races
Hispanic Origin Status
Hispanic Children
Non-Hispanic Children
Non-Hispanic White Children
Non-Hispanic Racial Minorities
Living Arrangements
Children Living in Households
Children Living in Group Quarters
Own Children Living in Single Parent Households
Own Children Living in Married Couple Households
Source: Population Reference Bureau analysis of data from the US Census Bureau for the Annie E. Casey Foundation
1999 Income in Dollars as Reported in Census 2000
• •
•
•
Source: US Census Bureau, Census 2000, SF3 Tables P82, P53, P80 and PCT39
Number NumberPercent Percent
Source: US Census Bureau, Census 2000, SF1 and SF3;Florida Almanac, 2002/2003; Florida County Atlas, 1994
84Center for the Study of Children’s Futures 2004
5,688 100.0 7,435 100.0
3,027 53.2 3,888 52.3
2,661 46.8 3,547 47.7
1,513 26.6 2,065 27.8
4,175 73.4 5,370 72.2
N/A N/A 7,247 97.5
4,367 76.8 4,774 64.2
377 6.6 517 7.0
33 0.6 59 0.8
N/A N/A 23 0.3
N/A N/A 6 0.1
894 15.7 1,868 25.1
N/A N/A 188 2.5
1,980 34.8 3,734 50.2
3,708 65.2 3,701 49.8
3,294 57.9 3,070 41.3
414 7.3 631 8.5
5,649 99.3 7,351 98.9
39 0.7 84 1.1
968 17.0 1,440 19.4
3,895 68.5 4,512 60.7
Per Capita Income .................... 12,445 Median Family Income .............................. 32,487
Median Household Income ...... 30,183 with own children under age 18 ............. 30,899
Median Nonfamily Income....... 16,239 without own children under age 18 ........ 33,551
Hardee County was established in 1921 from aportion of DeSoto County and was named forCary Augustus Hardee, who was governor the
year the county was formed. Wauchula is the countyseat. Industries are citrus growing and cattle ranching.
The county comprises 637 square miles of land and waspopulated by 26,938 persons in 2000. There were 42persons per square mile and the general populationincreased by 38 percent from 1990. Forty-six percent ofthe population lived in a rural area. The median age in2000 was 33 years.
There were 9,820 housing units reported with ahomeownership rate of 73 percent. Forty-one percent ofhouseholds included at least one person under the age of18 years. Annual income was less than $25,000 in 41percent of all 8,195 households and 39 percent of the2,946 family households with their own children. Fivepercent of all households had earnings of $100,000 orgreater.
Forty-two percent of persons age 25 and over did notgraduate from high school and 31 percent graduated withno further education indicated. Eight percent obtained abachelor’s degree or higher. Of 2,985 persons age 18 to 24years, 46 percent were high school graduates. Sixteenpercent of persons 16 to 19 years old were not in schooland not working.
Children under age 18 represented 28 percent of thepopulation in Hardee County, and 31 percent of childrenlived in poverty. Of the 6,232 persons of all ages living inpoverty, 36 percent were under the age of 18 years. Sixty-four percent of children lived in low-income householdsand 100 percent lived in high poverty neighborhoods.

Multi-Year Trend Data
** method used for calculating changed in 1998Source: Florida Department of Health, Office of Vital Statistics;Florida Department of Education
1992 1993 1994 1995 1996 1997 1998 1999 2000
Children Under Age 6 Below 100% of PovertyGrandparents Responsible 3 or More Years
100
75
50
25
0
Child
ren
Age 3
& 4
Enrol
led
in S
choo
lO
wn Chi
ldre
n Und
er A
ge 6
with
All Par
ents
in th
e La
bor F
orce
Child
ren
Under
Age
6
Below
200
% o
f Pov
erty
Gra
ndpa
rent
s Res
pons
ible
for
and
Livin
g with
Own
Gra
ndch
ildre
n Und
er A
ge 1
8
Own
Child
ren
Under
Age
6
Livin
g in
Sin
gle
Paren
t Hom
es
Per
cent
Source: US Census Bureau, Census 2000, SF1 and SF3
Critical MeasuresCensus 2000
Birth Rate
Teen Birth Rate Age 15-17
Teen Birth Rate Age 15-19
Percent of Births Receiving Early Prenatal Care
Percent of Low Birthweight Births
Percent of Births to Unwed Mothers
Infant Mortality Rate
Teen Violent Death Rate Age 15-19
Percent of Students Eligible for Free/Reduced Lunch
Graduation Rate**
Source: Policy and Services Research Data Center, de la Parte Institute, USF, 2002
Beh
avio
ral H
ealth
and
Juv
enile
Jus
tice
Source: Florida Department of Juvenile Justice, 2003
Source: Florida Department of Juvenile Justice, 2000/01
Chi
ld C
are,
Hea
d S
tart
and
Edu
catio
n
Source: Florida Department of Education, 2001/02
Source: Florida Children’s Forum, 2001
85 Center for the Study of Children’s Futures 2004
20.6 19.5 18.2 19.4 20.6 19.6 19.5 19.7 19.8
80.5 83.5 94.9 97.9 100.4 85.9 78.4 84.1 71.6
124.5 136.1 139.1 135.5 140.0 126.8 111.0 148.7 109.8
61.0 68.7 66.7 66.4 61.0 66.4 67.4 68.4 65.0
5.6 4.6 6.8 7.4 5.8 7.3 7.0 5.2 7.1
31.1 36.7 38.4 37.2 32.0 38.1 40.0 43.4 47.8
2.3 4.9 7.3 9.0 6.5 2.3 6.7 9.0 2.2
30.7 5.9 0.0 11.6 0.0 0.0 24.4 18.6 18.2
62.3 63.7 63.5 40.1 56.9 64.4 64.9 65.8 71.6
81.1 83.0 65.5 55.6 73.6 72.5 65.0 65.5 57.6
38.4
17.3
49.0
66.9
42.6
Hardee County
254 children received behavioral health services
10 behavioral health service providers served children
206 youths were referred to the juvenile justice system
3 youths were transferred to adult court
0 contracted delinquency prevention programs
1 state grant funded delinquency prevention program projected to serve 50 youths
0 probation and community corrections non-residential programs
1 residential and correctional program with 32 beds
0 detention centers
13 licensed child care centers with a capacity for 653 children
3 licensed family child care homes with a capacity for 30 children
10 Head Start and Early Head Start programs with a capacity for 159 children
5,092 children were enrolled in 10 public schools
1,159 children were enrolled in exceptional student education programs
531 children were referred to English for Speakers of Other Languages Programs
69 children were enrolled in 3 non-public schools
38 children and families were registered in 32 home education programs

Number Percent Number Percent
Summary Profile for the Population Under Age 18, 1990 to 2000
1990 2000
Age & Sex
Population Under Age 18
Males Under Age 18
Females Under Age 18
Population Under Age 5
Population Age 5 - 17
Race
Children of One Race
White Children
Black or African American Children
American Indian or Alaska Native Children
Asian Children
Native Hawaiian or Other Pacific Islander Children
Children of Some Other Race
Children of Two or More Races
Hispanic Origin Status
Hispanic Children
Non-Hispanic Children
Non-Hispanic White Children
Non-Hispanic Racial Minorities
Living Arrangements
Children Living in Households
Children Living in Group Quarters
Own Children Living in Single Parent Households
Own Children Living in Married Couple Households
Source: Population Reference Bureau analysis of data from the US Census Bureau for the Annie E. Casey Foundation
1999 Income in Dollars as Reported in Census 2000
• •
•
•
Source: US Census Bureau, Census 2000, SF3 Tables P82, P53, P80 and PCT39
Number NumberPercent Percent
Source: US Census Bureau, Census 2000, SF1 and SF3;Florida Almanac, 2002/2003; Florida County Atlas, 1994
86Center for the Study of Children’s Futures 2004
8,078 100.0 10,874 100.0
4,159 51.5 5,732 52.7
3,919 48.5 5,142 47.3
2,315 28.7 2,826 26.0
5,763 71.3 8,048 74.0
N/A N/A 10,515 96.7
5,221 64.6 6,630 61.0
1,758 21.8 1,857 17.1
189 2.3 91 0.8
N/A N/A 49 0.5
N/A N/A 0 0.0
881 10.9 1,888 17.4
N/A N/A 359 3.3
2,125 26.3 5,003 46.0
5,953 73.7 5,871 54.0
4,010 49.6 3,814 35.1
1,943 24.1 2,057 18.9
7,993 98.9 10,630 97.8
85 1.1 244 2.2
1,724 21.3 2,495 22.9
5,097 63.1 6,500 59.8
Per Capita Income .................... 13,663 Median Family Income .............................. 34,902
Median Household Income ...... 33,592 with own children under age 18 ............. 31,641
Median Nonfamily Income....... 18,902 without own children under age 18 ........ 38,692
Hendry County was established in 1923 from aportion of Lee County and was named forCaptain Francis Asbury, known as “the cattle
king of South Florida”. The county seat is La Belle.The largest industries are sugar processing, althoughtruck farmers and citrus growers are also present. Thiscounty is the site of the Big Cypress IndianReservation.
The county comprises 1,153 square miles of land and waspopulated by 36,210 persons in 2000. There were 31persons per square mile and the general populationincreased by 40 percent from 1990. Thirty-seven percentof the population lived in a rural area. The median age in2000 was 30 years.
There were 12,294 housing units reported with ahomeownership rate of 72 percent. Forty-six percent ofhouseholds included at least one person under the age of18 years. Annual income was less than $25,000 in 37percent of all 10,854 households and 38 percent of the4,485 family households with their own children. Fivepercent of all households had earnings of $100,000 orgreater.
Forty-six percent of persons age 25 and over did notgraduate from high school and 29 percent graduated withno further education indicated. Eight percent obtained abachelor’s degree or higher. Of 4,773 persons age 18 to 24years, 45 percent were high school graduates. Eighteenpercent of persons 16 to 19 years old were not in schooland not working.
Children under age 18 represented 30 percent of thepopulation in Hendry County, and 31 percent of childrenlived in poverty. Of the 8,373 persons of all ages living inpoverty, 39 percent were under the age of 18 years. Fifty-nine percent of children lived in low-income householdsand 82 percent lived in high poverty neighborhoods.

Multi-Year Trend Data
** method used for calculating changed in 1998Source: Florida Department of Health, Office of Vital Statistics;Florida Department of Education
1992 1993 1994 1995 1996 1997 1998 1999 2000
Children Under Age 6 Below 100% of PovertyGrandparents Responsible 3 or More Years
100
75
50
25
0
Child
ren
Age 3
& 4
Enrol
led
in S
choo
lO
wn Chi
ldre
n Und
er A
ge 6
with
All Par
ents
in th
e La
bor F
orce
Child
ren
Under
Age
6
Below
200
% o
f Pov
erty
Gra
ndpa
rent
s Res
pons
ible
for
and
Livin
g with
Own
Gra
ndch
ildre
n Und
er A
ge 1
8
Own
Child
ren
Under
Age
6
Livin
g in
Sin
gle
Paren
t Hom
es
Per
cent
Source: US Census Bureau, Census 2000, SF1 and SF3
Critical MeasuresCensus 2000
Birth Rate
Teen Birth Rate Age 15-17
Teen Birth Rate Age 15-19
Percent of Births Receiving Early Prenatal Care
Percent of Low Birthweight Births
Percent of Births to Unwed Mothers
Infant Mortality Rate
Teen Violent Death Rate Age 15-19
Percent of Students Eligible for Free/Reduced Lunch
Graduation Rate**
Source: Policy and Services Research Data Center, de la Parte Institute, USF, 2002
Beh
avio
ral H
ealth
and
Juv
enile
Jus
tice
Source: Florida Department of Juvenile Justice, 2003
Source: Florida Department of Juvenile Justice, 2000/01
Chi
ld C
are,
Hea
d S
tart
and
Edu
catio
n
Source: Florida Department of Education, 2001/02
Source: Florida Children’s Forum, 2001
87 Center for the Study of Children’s Futures 2004
21.2 21.3 20.1 20.5 19.1 20.2 21.8 20.0 20.4
82.1 73.2 87.8 74.2 82.1 58.6 79.9 76.1 62.2
125.1 128.1 134.9 114.9 123.7 101.1 133.0 103.9 96.3
53.8 60.1 65.4 67.7 67.3 69.5 70.0 77.5 74.4
7.9 9.0 8.5 4.6 10.2 8.2 7.2 7.2 8.4
38.0 40.3 42.1 40.5 47.0 44.7 45.4 48.8 48.5
11.8 9.9 6.9 6.6 5.2 6.5 3.0 3.3 3.1
13.9 4.7 9.5 0.0 8.7 13.0 8.7 17.2 14.9
52.1 50.1 63.3 54.5 54.9 61.1 50.9 62.9 63.2
65.1 77.4 73.8 72.9 75.4 60.3 66.7 59.8 50.5
47.6
22.2
54.0
63.0
46.7
Hendry County
284 children received behavioral health services
19 behavioral health service providers served children
261 youths were referred to the juvenile justice system
4 youths were transferred to adult court
0 contracted delinquency prevention programs
1 state grant funded delinquency prevention program projected to serve 100 youths
0 probation and community corrections non-residential programs
3 residential and correctional programs with 112 beds
0 detention centers
18 licensed child care centers with a capacity for 997 children
12 licensed family child care homes with a capacity for 122 children
13 Head Start and Early Head Start programs with a capacity for 210 children
7,587 children were enrolled in 18 public schools
1,445 children were enrolled in exceptional student education programs
564 children were referred to English for Speakers of Other Languages Programs
238 children were enrolled in 2 non-public schools
138 children and families were registered in 98 home education programs

Number Percent Number Percent
Summary Profile for the Population Under Age 18, 1990 to 2000
1990 2000
Age & Sex
Population Under Age 18
Males Under Age 18
Females Under Age 18
Population Under Age 5
Population Age 5 - 17
Race
Children of One Race
White Children
Black or African American Children
American Indian or Alaska Native Children
Asian Children
Native Hawaiian or Other Pacific Islander Children
Children of Some Other Race
Children of Two or More Races
Hispanic Origin Status
Hispanic Children
Non-Hispanic Children
Non-Hispanic White Children
Non-Hispanic Racial Minorities
Living Arrangements
Children Living in Households
Children Living in Group Quarters
Own Children Living in Single Parent Households
Own Children Living in Married Couple Households
Source: Population Reference Bureau analysis of data from the US Census Bureau for the Annie E. Casey Foundation
1999 Income in Dollars as Reported in Census 2000
• •
•
•
Source: US Census Bureau, Census 2000, SF3 Tables P82, P53, P80 and PCT39
Number NumberPercent Percent
Source: US Census Bureau, Census 2000, SF1 and SF3;Florida Almanac, 2002/2003; Florida County Atlas, 1994
88Center for the Study of Children’s Futures 2004
18,648 100.0 24,726 100.0
9,456 50.7 12,621 51.0
9,192 49.3 12,105 49.0
5,037 27.0 5,905 23.9
13,611 73.0 18,821 76.1
N/A N/A 24,141 97.6
16,891 90.6 21,737 87.9
1,393 7.5 1,611 6.5
58 0.3 96 0.4
N/A N/A 201 0.8
N/A N/A 12 0.0
177 0.9 484 2.0
N/A N/A 585 2.4
894 4.8 2,021 8.2
17,754 95.2 22,705 91.8
16,199 86.9 20,387 82.5
1,555 8.3 2,318 9.4
18,551 99.5 24,605 99.5
97 0.5 121 0.5
3,274 17.6 5,892 23.8
13,390 71.8 15,864 64.2
Per Capita Income .................... 18,321 Median Family Income .............................. 37,509
Median Household Income ...... 32,572 with own children under age 18 ............. 39,538
Median Nonfamily Income....... 20,131 without own children under age 18 ........ 36,951
Hernando County was established in 1843 andwas named for the Spanish explorer Hernandode Soto. The county seat is Brooksville. The
Withlachoochee State Forest incorporates a largeportion of the county. It is an attractive area for retireesand has a growing population from surroundingcounties, accelerated by the addition of the SuncoastParkway. Health care, electronics, mining, minerals, andtourism support the economy.
The county comprises 478 square miles of land and waspopulated by 130,802 persons in 2000. There were 274persons per square mile and the general populationincreased by 29 percent from 1990. Twenty-four percent ofthe population lived in a rural area. The median age in 2000was 50 years.
There were 62,727 housing units reported with ahomeownership rate of 87 percent. Twenty-four percent ofhouseholds included at least one person under the age of 18years. Annual income was less than $25,000 in 35 percentof all 55,456 households and 27 percent of the 12,465family households with their own children. Five percent ofall households had earnings of $100,000 or greater.
Twenty-two percent of persons age 25 and over did notgraduate from high school and 38 percent graduated withno further education indicated. Thirteen percent obtained abachelor’s degree or higher. Of 7,117 persons age 18 to 24years, 68 percent were high school graduates. Elevenpercent of persons 16 to 19 years old were not in schooland not working.
Children under age 18 represented 19 percent of thepopulation in Hernando County, and 16 percent of childrenlived in poverty. Of the 13,307 persons of all ages living inpoverty, 30 percent were under the age of 18 years. Forty-five percent of children lived in low-income householdsand 6 percent lived in high poverty neighborhoods.

Multi-Year Trend Data
** method used for calculating changed in 1998Source: Florida Department of Health, Office of Vital Statistics;Florida Department of Education
1992 1993 1994 1995 1996 1997 1998 1999 2000
Children Under Age 6 Below 100% of PovertyGrandparents Responsible 3 or More Years
100
75
50
25
0
Child
ren
Age 3
& 4
Enrol
led
in S
choo
lO
wn Chi
ldre
n Und
er A
ge 6
with
All Par
ents
in th
e La
bor F
orce
Child
ren
Under
Age
6
Below
200
% o
f Pov
erty
Gra
ndpa
rent
s Res
pons
ible
for
and
Livin
g with
Own
Gra
ndch
ildre
n Und
er A
ge 1
8
Own
Child
ren
Under
Age
6
Livin
g in
Sin
gle
Paren
t Hom
es
Per
cent
Source: US Census Bureau, Census 2000, SF1 and SF3
Critical MeasuresCensus 2000
Birth Rate
Teen Birth Rate Age 15-17
Teen Birth Rate Age 15-19
Percent of Births Receiving Early Prenatal Care
Percent of Low Birthweight Births
Percent of Births to Unwed Mothers
Infant Mortality Rate
Teen Violent Death Rate Age 15-19
Percent of Students Eligible for Free/Reduced Lunch
Graduation Rate**
Source: Policy and Services Research Data Center, de la Parte Institute, USF, 2002
Beh
avio
ral H
ealth
and
Juv
enile
Jus
tice
Source: Florida Department of Juvenile Justice, 2003
Source: Florida Department of Juvenile Justice, 2000/01
Chi
ld C
are,
Hea
d S
tart
and
Edu
catio
n
Source: Florida Department of Education, 2001/02
Source: Florida Children’s Forum, 2001
89 Center for the Study of Children’s Futures 2004
8.7 9.2 8.4 8.6 8.2 8.5 8.6 8.3 8.9
30.6 30.8 36.0 35.6 34.0 33.3 28.8 26.2 18.7
47.3 51.1 54.4 55.4 59.7 53.0 57.2 47.1 43.9
81.8 83.0 86.3 85.4 87.3 87.2 87.4 89.1 90.4
6.0 6.6 7.7 8.1 7.6 7.5 9.0 7.7 6.4
30.9 30.2 33.4 33.8 35.8 33.4 38.2 36.0 35.1
8.4 6.7 9.2 6.8 4.9 10.5 6.4 9.4 5.1
7.0 6.7 9.7 8.1 13.5 4.9 6.4 1.5 7.3
39.1 43.7 43.2 43.8 45.9 38.8 43.8 40.8 39.1
77.0 75.3 66.1 73.1 84.6 66.1 68.7 67.4 67.8
47.2
22.0
56.8
48.5 46.5
Hernando County
1,052 children received behavioral health services
24 behavioral health service providers served children
508 youths were referred to the juvenile justice system
12 youths were transferred to adult court
1 contracted delinquency prevention program with 4 beds or slots
1 state grant funded delinquency prevention program projected to serve 40 youths
0 probation and community corrections non-residential programs
3 residential and correctional programs with 115 beds
0 detention centers
29 licensed child care centers with a capacity for 1,757 children
37 licensed family child care homes with a capacity for 360 children
15 Head Start programs with a capacity for 267 children
17,940 children were enrolled in 27 public schools
3,423 children were enrolled in exceptional student education programs
192 children were referred to English for Speakers of Other Languages Programs
1,821 children were enrolled in 11 non-public schools
541 children and families were registered in 384 home education programs

Number Percent Number Percent
Summary Profile for the Population Under Age 18, 1990 to 2000
1990 2000
Age & Sex
Population Under Age 18
Males Under Age 18
Females Under Age 18
Population Under Age 5
Population Age 5 - 17
Race
Children of One Race
White Children
Black or African American Children
American Indian or Alaska Native Children
Asian Children
Native Hawaiian or Other Pacific Islander Children
Children of Some Other Race
Children of Two or More Races
Hispanic Origin Status
Hispanic Children
Non-Hispanic Children
Non-Hispanic White Children
Non-Hispanic Racial Minorities
Living Arrangements
Children Living in Households
Children Living in Group Quarters
Own Children Living in Single Parent Households
Own Children Living in Married Couple Households
Source: Population Reference Bureau analysis of data from the US Census Bureau for the Annie E. Casey Foundation
1999 Income in Dollars as Reported in Census 2000
• •
•
•
Source: US Census Bureau, Census 2000, SF3 Tables P82, P53, P80 and PCT39
Number NumberPercent Percent
Source: US Census Bureau, Census 2000, SF1 and SF3;Florida Almanac, 2002/2003; Florida County Atlas, 1994
90Center for the Study of Children’s Futures 2004
12,818 100.0 16,744 100.0
6,445 50.3 8,717 52.1
6,373 49.7 8,027 47.9
3,492 27.2 4,210 25.1
9,326 72.8 12,534 74.9
N/A N/A 16,257 97.1
9,510 74.2 11,600 69.3
2,647 20.7 3,056 18.3
73 0.6 107 0.6
N/A N/A 264 1.6
N/A N/A 6 0.0
470 3.7 1,224 7.3
N/A N/A 487 2.9
1,180 9.2 3,459 20.7
11,638 90.8 13,285 79.3
8,831 68.9 9,650 57.6
2,807 21.9 3,635 21.7
12,785 99.7 16,687 99.7
33 0.3 57 0.3
2,647 20.7 4,499 26.9
8,570 66.9 9,801 58.5
Per Capita Income .................... 17,222 Median Family Income .............................. 35,647
Median Household Income ...... 30,160 with own children under age 18 ............. 33,668
Median Nonfamily Income....... 17,644 without own children under age 18 ........ 36,120
Highlands County was established in 1921 andwas named for its rolling countryside. Thiscounty is home to the Sebring Auto Race and
has many well-known parks and lakes such as HighlandHammock State Park and Lake Istokpoga. The countyseat is Sebring. Private employers are in health care,citrus, boat manufacturing, banking and lawn supplies.
The county comprises 1,028 square miles of land and waspopulated by 87,366 persons in 2000. There were 85persons per square mile and the general populationincreased by 28 percent from 1990. Thirty-three percent ofthe population lived in a rural area. The median age in 2000was 50 years.
There were 48,846 housing units reported with ahomeownership rate of 80 percent. Twenty-three percent ofhouseholds included at least one person under the age of 18years. Annual income was less than $25,000 in 41 percentof all 37,505 households and 37 percent of the 7,791 familyhouseholds with their own children. Five percent of allhouseholds had earnings of $100,000 or greater.
Twenty-five percent of persons age 25 and over did notgraduate from high school and 35 percent graduated withno further education indicated. Fourteen percent obtained abachelor’s degree or higher. Of 5,447 persons age 18 to 24years, 58 percent were high school graduates. Twelvepercent of persons 16 to 19 years old were not in schooland not working.
Children under age 18 represented 19 percent of thepopulation in Highlands County, and 26 percent of childrenlived in poverty. Of the 13,065 persons of all ages living inpoverty, 33 percent were under the age of 18 years. Fifty-three percent of children lived in low-income householdsand 30 percent lived in high poverty neighborhoods.

Multi-Year Trend Data
** method used for calculating changed in 1998Source: Florida Department of Health, Office of Vital Statistics;Florida Department of Education
1992 1993 1994 1995 1996 1997 1998 1999 2000
Children Under Age 6 Below 100% of PovertyGrandparents Responsible 3 or More Years
100
75
50
25
0
Child
ren
Age 3
& 4
Enrol
led
in S
choo
lO
wn Chi
ldre
n Und
er A
ge 6
with
All Par
ents
in th
e La
bor F
orce
Child
ren
Under
Age
6
Below
200
% o
f Pov
erty
Gra
ndpa
rent
s Res
pons
ible
for
and
Livin
g with
Own
Gra
ndch
ildre
n Und
er A
ge 1
8
Own
Child
ren
Under
Age
6
Livin
g in
Sin
gle
Paren
t Hom
es
Per
cent
Source: US Census Bureau, Census 2000, SF1 and SF3
Critical MeasuresCensus 2000
Birth Rate
Teen Birth Rate Age 15-17
Teen Birth Rate Age 15-19
Percent of Births Receiving Early Prenatal Care
Percent of Low Birthweight Births
Percent of Births to Unwed Mothers
Infant Mortality Rate
Teen Violent Death Rate Age 15-19
Percent of Students Eligible for Free/Reduced Lunch
Graduation Rate**
Source: Policy and Services Research Data Center, de la Parte Institute, USF, 2002
Beh
avio
ral H
ealth
and
Juv
enile
Jus
tice
Source: Florida Department of Juvenile Justice, 2003
Source: Florida Department of Juvenile Justice, 2000/01
Chi
ld C
are,
Hea
d S
tart
and
Edu
catio
n
Source: Florida Department of Education, 2001/02
Source: Florida Children’s Forum, 2001
91 Center for the Study of Children’s Futures 2004
11.9 10.8 10.9 10.7 10.8 11.0 10.5 10.3 10.1
59.7 59.5 56.4 49.9 48.4 46.1 49.1 37.8 40.1
97.8 90.4 89.1 88.3 82.4 86.4 83.9 72.9 75.8
64.9 72.6 71.0 69.0 68.9 76.5 76.4 71.2 80.5
9.7 8.3 8.4 8.1 7.5 7.9 6.8 7.9 8.8
37.7 39.8 40.7 40.2 41.1 41.3 39.3 42.6 42.9
15.1 17.5 9.7 12.1 8.2 5.7 3.6 10.7 11.9
11.2 13.8 10.6 2.5 8.3 10.9 10.8 2.7 8.1
44.9 49.3 50.5 54.2 52.0 54.1 55.5 58.1 57.4
78.6 77.6 74.6 71.8 65.0 77.0 70.0 64.7 68.6
51.0
26.0
60.856.2
40.8
Highlands County
839 children received behavioral health services
23 behavioral health service providers served children
648 youths were referred to the juvenile justice system
8 youths were transferred to adult court
0 contracted delinquency prevention programs
2 state grant funded delinquency prevention programs projected to serve 250 youths
0 probation and community corrections non-residential programs
0 residential and correctional programs
0 detention centers
42 licensed child care centers with a capacity for 1,620 children
6 licensed family child care homes with a capacity for 48 children
15 Head Start and Early Head Start programs with a capacity for 223 children
11,304 children were enrolled in 18 public schools
2,551 children were enrolled in exceptional student education programs
461 children were referred to English for Speakers of Other Languages Programs
788 children were enrolled in 8 non-public schools
308 children and families were registered in 210 home education programs

Number Percent Number Percent
Summary Profile for the Population Under Age 18, 1990 to 2000
1990 2000
Age & Sex
Population Under Age 18
Males Under Age 18
Females Under Age 18
Population Under Age 5
Population Age 5 - 17
Race
Children of One Race
White Children
Black or African American Children
American Indian or Alaska Native Children
Asian Children
Native Hawaiian or Other Pacific Islander Children
Children of Some Other Race
Children of Two or More Races
Hispanic Origin Status
Hispanic Children
Non-Hispanic Children
Non-Hispanic White Children
Non-Hispanic Racial Minorities
Living Arrangements
Children Living in Households
Children Living in Group Quarters
Own Children Living in Single Parent Households
Own Children Living in Married Couple Households
Source: Population Reference Bureau analysis of data from the US Census Bureau for the Annie E. Casey Foundation
1999 Income in Dollars as Reported in Census 2000
• •
•
•
Source: US Census Bureau, Census 2000, SF3 Tables P82, P53, P80 and PCT39
Number NumberPercent Percent
Source: US Census Bureau, Census 2000, SF1 and SF3;Florida Almanac, 2002/2003; Florida County Atlas, 1994
92Center for the Study of Children’s Futures 2004
202,274 100.0 253,138 100.0
103,870 51.4 129,918 51.3
98,404 48.6 123,220 48.7
60,887 30.1 68,444 27.0
141,387 69.9 184,694 73.0
N/A N/A 243,439 96.2
152,900 75.6 168,466 66.6
39,163 19.4 51,785 20.5
599 0.3 1,041 0.4
N/A N/A 5,141 2.0
N/A N/A 195 0.1
6,495 3.2 16,811 6.6
N/A N/A 9,699 3.8
28,806 14.2 55,404 21.9
173,468 85.8 197,734 78.1
131,681 65.1 135,100 53.4
41,787 20.7 62,634 24.7
201,020 99.4 251,968 99.5
1,254 0.6 1,170 0.5
46,645 23.1 69,941 27.6
132,751 65.6 152,649 60.3
Per Capita Income .................... 21,812 Median Family Income .............................. 48,223
Median Household Income ...... 40,663 with own children under age 18 ............. 45,752
Median Nonfamily Income....... 26,730 without own children under age 18 ........ 50,388
Hillsborough County was established in 1834from St. Johns County and named for WillsHills, the Earl of Hillsborough. Tampa is the
county seat and one of the state’s most populous cities.Tampa Bay is the site of a substantial international portand a well-known airport, Tampa International. Privateindustry includes air services, food processing, shipping,retail, banking, technology and communications. BuschGardens and the University of South Florida are located inthis county.
The county comprises 1,051 square miles of land and waspopulated by 998,948 persons in 2000. There were 951persons per square mile and the general population increasedby 20 percent from 1990. Six percent of the population livedin a rural area. The median age in 2000 was 35 years.
There were 425,962 housing units reported with ahomeownership rate of 64 percent. Thirty-five percent ofhouseholds included at least one person under the age of 18years. Annual income was less than $25,000 in 29 percent ofall 391,424 households and 25 percent of the 125,584 familyhouseholds with their own children. Eleven percent of allhouseholds had earnings of $100,000 or greater.
Nineteen percent of persons age 25 and over did not graduatefrom high school and 27 percent graduated with no furthereducation indicated. Twenty-five percent obtained abachelor’s degree or higher. Of 93,061 persons age 18 to 24years, 72 percent were high school graduates. Eleven percentof persons 16 to 19 years old were not in school and notworking.
Children under age 18 represented 25 percent of thepopulation in Hillsborough County, and 18 percent of childrenlived in poverty. Of the 122,872 persons of all ages living inpoverty, 35 percent were under the age of 18 years. Thirty-nine percent of children lived in low-income households and21 percent lived in high poverty neighborhoods.

Multi-Year Trend Data
** method used for calculating changed in 1998Source: Florida Department of Health, Office of Vital Statistics;Florida Department of Education
1992 1993 1994 1995 1996 1997 1998 1999 2000
Children Under Age 6 Below 100% of PovertyGrandparents Responsible 3 or More Years
100
75
50
25
0
Child
ren
Age 3
& 4
Enrol
led
in S
choo
lO
wn Chi
ldre
n Und
er A
ge 6
with
All Par
ents
in th
e La
bor F
orce
Child
ren
Under
Age
6
Below
200
% o
f Pov
erty
Gra
ndpa
rent
s Res
pons
ible
for
and
Livin
g with
Own
Gra
ndch
ildre
n Und
er A
ge 1
8
Own
Child
ren
Under
Age
6
Livin
g in
Sin
gle
Paren
t Hom
es
Per
cent
Source: US Census Bureau, Census 2000, SF1 and SF3
Critical MeasuresCensus 2000
Birth Rate
Teen Birth Rate Age 15-17
Teen Birth Rate Age 15-19
Percent of Births Receiving Early Prenatal Care
Percent of Low Birthweight Births
Percent of Births to Unwed Mothers
Infant Mortality Rate
Teen Violent Death Rate Age 15-19
Percent of Students Eligible for Free/Reduced Lunch
Graduation Rate**
Source: Policy and Services Research Data Center, de la Parte Institute, USF, 2002
Beh
avio
ral H
ealth
and
Juv
enile
Jus
tice
Source: Florida Department of Juvenile Justice, 2003
Source: Florida Department of Juvenile Justice, 2000/01
Chi
ld C
are,
Hea
d S
tart
and
Edu
catio
n
Source: Florida Department of Education, 2001/02
Source: Florida Children’s Forum, 2001
93 Center for the Study of Children’s Futures 2004
16.1 15.9 15.5 15.1 15.0 14.9 15.1 14.9 14.9
51.9 48.4 53.7 54.9 56.0 49.1 46.5 43.4 35.6
71.5 70.3 73.4 75.3 73.8 69.5 68.0 66.3 58.1
79.8 81.6 82.0 83.3 83.6 85.0 86.0 86.3 86.1
8.2 7.6 7.7 7.7 7.8 8.1 8.2 8.0 8.1
35.9 36.6 37.2 36.4 37.4 37.6 37.1 38.5 38.7
11.1 8.5 9.2 8.1 9.3 7.6 7.8 8.5 7.9
6.5 6.3 9.4 10.5 6.9 5.4 5.9 7.6 5.4
44.9 46.8 48.9 48.3 48.6 47.9 46.9 46.7 46.0
85.7 78.6 76.2 76.7 74.0 72.8 69.5 71.4 74.4
54.2
24.8
60.5
42.245.4
Hillsborough County
7,062 children received behavioral health services
50 behavioral health service providers served children
7,474 youths were referred to the juvenile justice system
237 youths were transferred to adult court
2 contracted delinquency prevention programs with 44 beds or slots
3 state grant funded delinquency prevention programs projected to serve 540 youths
8 probation and community corrections non-residential programs with 243 slots
5 residential and correctional programs with 336 beds
2 detention centers with 143 beds
388 licensed child care centers with a capacity for 37,310 children
707 licensed family child care homes with a capacity for 6,196 children
67 Head Start and Early Head Start programs with a capacity for 2,946 children
169,948 children were enrolled in 242 public schools
32,854 children were enrolled in exceptional student education programs
18,227 children were referred to English for Speakers of Other Languages Programs
23,183 children were enrolled in 133 non-public schools
2,411 children and families were registered in 1,639 home education programs

Number Percent Number Percent
Summary Profile for the Population Under Age 18, 1990 to 2000
1990 2000
Age & Sex
Population Under Age 18
Males Under Age 18
Females Under Age 18
Population Under Age 5
Population Age 5 - 17
Race
Children of One Race
White Children
Black or African American Children
American Indian or Alaska Native Children
Asian Children
Native Hawaiian or Other Pacific Islander Children
Children of Some Other Race
Children of Two or More Races
Hispanic Origin Status
Hispanic Children
Non-Hispanic Children
Non-Hispanic White Children
Non-Hispanic Racial Minorities
Living Arrangements
Children Living in Households
Children Living in Group Quarters
Own Children Living in Single Parent Households
Own Children Living in Married Couple Households
Source: Population Reference Bureau analysis of data from the US Census Bureau for the Annie E. Casey Foundation
1999 Income in Dollars as Reported in Census 2000
• •
•
•
Source: US Census Bureau, Census 2000, SF3 Tables P82, P53, P80 and PCT39
Number NumberPercent Percent
Source: US Census Bureau, Census 2000, SF1 and SF3;Florida Almanac, 2002/2003; Florida County Atlas, 1994
94Center for the Study of Children’s Futures 2004
3,921 100.0 4,285 100.0
2,030 51.8 2,253 52.6
1,891 48.2 2,032 47.4
978 24.9 1,028 24.0
2,943 75.1 3,257 76.0
N/A N/A 4,221 98.5
3,712 94.7 3,963 92.5
132 3.4 147 3.4
51 1.3 51 1.2
N/A N/A 19 0.4
N/A N/A 1 0.0
8 0.2 40 0.9
N/A N/A 64 1.5
55 1.4 94 2.2
3,866 98.6 4,191 97.8
3,672 93.6 3,921 91.5
194 4.9 270 6.3
3,909 99.7 4,222 98.5
12 0.3 63 1.5
785 20.0 998 23.3
2,753 70.2 2,799 65.3
Per Capita Income .................... 14,135 Median Family Income .............................. 34,286
Median Household Income ...... 27,923 with own children under age 18 ............. 32,905
Median Nonfamily Income....... 13,569 without own children under age 18 ........ 35,175
Holmes County was established in 1848 fromportions of Walton and Jackson counties and islocated in the Panhandle. The name was
derived from Holmes Creek, the county’s easternboundary. Bonifay is the county seat. The economydepends on private employers in the fields of healthcare and clothing.
The county comprises 482 square miles of land and waspopulated by 18,564 persons in 2000. There were 39persons per square mile and the general populationincreased by 18 percent from 1990. Seventy-nine percentof the population lived in a rural area. The median age in2000 was 38 years.
There were 7,998 housing units reported with ahomeownership rate of 81 percent. Thirty-four percent ofhouseholds included at least one person under the age of 18years. Annual income was less than $25,000 in 46 percentof all 6,924 households and 37 percent of the 2,175 familyhouseholds with their own children. Four percent of allhouseholds had earnings of $100,000 or greater.
Thirty-five percent of persons age 25 and over did notgraduate from high school and 38 percent graduated withno further education indicated. Nine percent obtained abachelor’s degree or higher. Of 1,616 persons age 18 to 24years, 65 percent were high school graduates. Ten percentof persons 16 to 19 years old were not in school and notworking.
Children under age 18 represented 23 percent of thepopulation in Holmes County, and 26 percent of childrenlived in poverty. Of the 3,209 persons of all ages living inpoverty, 34 percent were under the age of 18 years. Fifty-four percent of children lived in low-income householdsand 32 percent lived in high poverty neighborhoods.

Multi-Year Trend Data
** method used for calculating changed in 1998Source: Florida Department of Health, Office of Vital Statistics;Florida Department of Education
1992 1993 1994 1995 1996 1997 1998 1999 2000
Children Under Age 6 Below 100% of PovertyGrandparents Responsible 3 or More Years
100
75
50
25
0
Child
ren
Age 3
& 4
Enrol
led
in S
choo
lO
wn Chi
ldre
n Und
er A
ge 6
with
All Par
ents
in th
e La
bor F
orce
Child
ren
Under
Age
6
Below
200
% o
f Pov
erty
Gra
ndpa
rent
s Res
pons
ible
for
and
Livin
g with
Own
Gra
ndch
ildre
n Und
er A
ge 1
8
Own
Child
ren
Under
Age
6
Livin
g in
Sin
gle
Paren
t Hom
es
Per
cent
Source: US Census Bureau, Census 2000, SF1 and SF3
Critical MeasuresCensus 2000
Birth Rate
Teen Birth Rate Age 15-17
Teen Birth Rate Age 15-19
Percent of Births Receiving Early Prenatal Care
Percent of Low Birthweight Births
Percent of Births to Unwed Mothers
Infant Mortality Rate
Teen Violent Death Rate Age 15-19
Percent of Students Eligible for Free/Reduced Lunch
Graduation Rate**
Source: Policy and Services Research Data Center, de la Parte Institute, USF, 2002
Beh
avio
ral H
ealth
and
Juv
enile
Jus
tice
Source: Florida Department of Juvenile Justice, 2003
Source: Florida Department of Juvenile Justice, 2000/01
Chi
ld C
are,
Hea
d S
tart
and
Edu
catio
n
Source: Florida Department of Education, 2001/02
Source: Florida Children’s Forum, 2001
95 Center for the Study of Children’s Futures 2004
12.2 13.5 12.9 10.7 11.7 12.3 10.5 10.5 11.1
47.6 59.3 46.4 58.5 41.4 34.1 18.6 48.7 19.5
57.5 73.5 68.3 79.1 76.8 61.7 57.8 76.1 60.7
86.3 87.7 89.8 89.2 85.5 87.6 91.0 89.4 87.5
6.6 7.8 6.9 7.5 5.9 7.8 4.8 7.0 10.8
20.3 20.1 24.3 32.6 31.5 27.5 27.0 30.7 30.5
0.0 9.1 9.2 21.4 9.9 9.2 10.6 5.0 9.4
40.6 16.2 15.9 15.3 8.5 16.6 8.2 7.8 0.0
53.9 55.9 56.7 58.7 59.3 60.3 61.0 55.7 54.9
82.0 82.7 74.7 84.0 73.2 75.9 76.6 73.5 79.2
26.321.8
60.155.1
50.8
Holmes County
203 children received behavioral health services
12 behavioral health service providers served children
87 youths were referred to the juvenile justice system
11 youths were transferred to adult court
0 contracted delinquency prevention programs
1 state grant funded delinquency prevention program projected to serve 30 youths
0 probation and community corrections non-residential programs
1 residential and correctional program with 40 beds
0 detention centers
10 licensed child care centers with a capacity for 470 children
0 licensed family child care homes
4 Head Start programs with a capacity for 63 children
3,537 children were enrolled in 9 public schools
574 children were enrolled in exceptional student education programs
8 children were referred to English for Speakers of Other Languages Programs
96 children were enrolled in 2 non-public schools
69 children and families were registered in 56 home education programs

Number Percent Number Percent
Summary Profile for the Population Under Age 18, 1990 to 2000
1990 2000
Age & Sex
Population Under Age 18
Males Under Age 18
Females Under Age 18
Population Under Age 5
Population Age 5 - 17
Race
Children of One Race
White Children
Black or African American Children
American Indian or Alaska Native Children
Asian Children
Native Hawaiian or Other Pacific Islander Children
Children of Some Other Race
Children of Two or More Races
Hispanic Origin Status
Hispanic Children
Non-Hispanic Children
Non-Hispanic White Children
Non-Hispanic Racial Minorities
Living Arrangements
Children Living in Households
Children Living in Group Quarters
Own Children Living in Single Parent Households
Own Children Living in Married Couple Households
Source: Population Reference Bureau analysis of data from the US Census Bureau for the Annie E. Casey Foundation
1999 Income in Dollars as Reported in Census 2000
• •
•
•
Source: US Census Bureau, Census 2000, SF3 Tables P82, P53, P80 and PCT39
Number NumberPercent Percent
Source: US Census Bureau, Census 2000, SF1 and SF3;Florida Almanac, 2002/2003; Florida County Atlas, 1994
96Center for the Study of Children’s Futures 2004
17,486 100.0 21,694 100.0
8,907 50.9 11,200 51.6
8,579 49.1 10,494 48.4
4,918 28.1 5,259 24.2
12,568 71.9 16,435 75.8
N/A N/A 21,158 97.5
14,420 82.5 16,864 77.7
2,683 15.3 3,131 14.4
34 0.2 90 0.4
N/A N/A 206 0.9
N/A N/A 9 0.0
193 1.1 858 4.0
N/A N/A 536 2.5
843 4.8 2,431 11.2
16,643 95.2 19,263 88.8
13,798 78.9 15,449 71.2
2,845 16.3 3,814 17.6
17,300 98.9 21,478 99.0
186 1.1 216 1.0
3,362 19.2 5,381 24.8
12,031 68.8 13,624 62.8
Per Capita Income .................... 27,227 Median Family Income .............................. 46,385
Median Household Income ...... 39,635 with own children under age 18 ............. 43,243
Median Nonfamily Income....... 23,974 without own children under age 18 ........ 47,890
I ndian River County was established in 1925 froma portion of St. Lucie County and is on theAtlantic coast. Vero Beach is the county seat.
This county is home to unspoiled beaches and riverfront communities. The county is known for its citrusproducts, although health care and airplanemanufacturing are other major industries.
The county comprises 503 square miles of land and waspopulated by 112,947 persons in 2000. There were 224persons per square mile and the general populationincreased by 25 percent from 1990. Eight percent of thepopulation lived in a rural area. The median age in 2000was 47 years.
There were 57,902 housing units reported with ahomeownership rate of 78 percent. Twenty-four percent ofhouseholds included at least one person under the age of 18years. Annual income was less than $25,000 in 30 percentof all 49,196 households and 24 percent of the 10,735family households with their own children. Twelve percentof all households had earnings of $100,000 or greater.
Eighteen percent of persons age 25 and over did notgraduate from high school and 29 percent graduated withno further education indicated. Twenty-three percentobtained a bachelor’s degree or higher. Of 6,777 personsage 18 to 24 years, 61 percent were high school graduates.Eleven percent of persons 16 to 19 years old were not inschool and not working.
Children under age 18 represented 19 percent of thepopulation in Indian River County, and 14 percent ofchildren lived in poverty. Of the 10,325 persons of all agesliving in poverty, 29 percent were under the age of 18years. Forty-one percent of children lived in low-incomehouseholds and 8 percent lived in high povertyneighborhoods.

Multi-Year Trend Data
** method used for calculating changed in 1998Source: Florida Department of Health, Office of Vital Statistics;Florida Department of Education
1992 1993 1994 1995 1996 1997 1998 1999 2000
Children Under Age 6 Below 100% of PovertyGrandparents Responsible 3 or More Years
100
75
50
25
0
Child
ren
Age 3
& 4
Enrol
led
in S
choo
lO
wn Chi
ldre
n Und
er A
ge 6
with
All Par
ents
in th
e La
bor F
orce
Child
ren
Under
Age
6
Below
200
% o
f Pov
erty
Gra
ndpa
rent
s Res
pons
ible
for
and
Livin
g with
Own
Gra
ndch
ildre
n Und
er A
ge 1
8
Own
Child
ren
Under
Age
6
Livin
g in
Sin
gle
Paren
t Hom
es
Per
cent
Source: US Census Bureau, Census 2000, SF1 and SF3
Critical MeasuresCensus 2000
Birth Rate
Teen Birth Rate Age 15-17
Teen Birth Rate Age 15-19
Percent of Births Receiving Early Prenatal Care
Percent of Low Birthweight Births
Percent of Births to Unwed Mothers
Infant Mortality Rate
Teen Violent Death Rate Age 15-19
Percent of Students Eligible for Free/Reduced Lunch
Graduation Rate**
Source: Policy and Services Research Data Center, de la Parte Institute, USF, 2002
Beh
avio
ral H
ealth
and
Juv
enile
Jus
tice
Source: Florida Department of Juvenile Justice, 2003
Source: Florida Department of Juvenile Justice, 2000/01
Chi
ld C
are,
Hea
d S
tart
and
Edu
catio
n
Source: Florida Department of Education, 2001/02
Source: Florida Children’s Forum, 2001
97 Center for the Study of Children’s Futures 2004
10.8 10.3 9.5 9.5 9.5 9.4 10.1 9.2 10.0
50.4 35.7 57.7 35.6 38.1 38.5 37.2 32.9 26.7
71.2 60.3 66.8 53.8 59.5 61.4 64.1 48.9 49.2
69.1 74.7 77.1 78.3 77.4 75.8 75.7 77.3 78.0
6.7 7.1 5.9 9.0 6.8 5.6 6.5 7.0 7.1
31.9 32.8 34.6 36.5 34.2 35.8 33.8 34.5 36.7
9.8 12.0 8.5 5.2 8.2 4.1 3.7 9.8 8.9
4.1 0.0 3.9 7.5 9.9 1.9 1.9 5.4 7.8
35.7 36.3 35.4 41.4 40.4 39.7 41.8 40.3 45.1
73.4 72.4 66.0 72.8 75.9 65.3 65.2 64.9 65.9
54.9
20.9
61.7
44.848.4
Indian River County
689 children received behavioral health services
19 behavioral health service providers served children
737 youths were referred to the juvenile justice system
8 youths were transferred to adult court
0 contracted delinquency prevention programs
1 state grant funded delinquency prevention program projected to serve 90 youths
0 probation and community corrections non-residential programs
0 residential and correctional programs
0 detention centers
39 licensed child care centers with a capacity for 3,246 children
11 licensed family child care homes with a capacity for 90 children
9 Head Start programs with a capacity for 240 children
15,420 children were enrolled in 27 public schools
3,237 children were enrolled in exceptional student education programs
676 children were referred to English for Speakers of Other Languages Programs
1,744 children were enrolled in 10 non-public schools
336 children and families were registered in 276 home education programs

Number Percent Number Percent
Summary Profile for the Population Under Age 18, 1990 to 2000
1990 2000
Age & Sex
Population Under Age 18
Males Under Age 18
Females Under Age 18
Population Under Age 5
Population Age 5 - 17
Race
Children of One Race
White Children
Black or African American Children
American Indian or Alaska Native Children
Asian Children
Native Hawaiian or Other Pacific Islander Children
Children of Some Other Race
Children of Two or More Races
Hispanic Origin Status
Hispanic Children
Non-Hispanic Children
Non-Hispanic White Children
Non-Hispanic Racial Minorities
Living Arrangements
Children Living in Households
Children Living in Group Quarters
Own Children Living in Single Parent Households
Own Children Living in Married Couple Households
Source: Population Reference Bureau analysis of data from the US Census Bureau for the Annie E. Casey Foundation
1999 Income in Dollars as Reported in Census 2000
• •
•
•
Source: US Census Bureau, Census 2000, SF3 Tables P82, P53, P80 and PCT39
Number NumberPercent Percent
Source: US Census Bureau, Census 2000, SF1 and SF3;Florida Almanac, 2002/2003; Florida County Atlas, 1994
98Center for the Study of Children’s Futures 2004
10,279 100.0 10,449 100.0
5,401 52.5 5,417 51.8
4,878 47.5 5,032 48.2
2,431 23.7 2,558 24.5
7,848 76.3 7,891 75.5
N/A N/A 10,232 97.9
6,922 67.3 7,030 67.3
3,243 31.5 2,977 28.5
61 0.6 73 0.7
N/A N/A 30 0.3
N/A N/A 3 0.0
30 0.3 119 1.1
N/A N/A 217 2.1
134 1.3 285 2.7
10,145 98.7 10,164 97.3
6,835 66.5 6,891 65.9
3,310 32.2 3,273 31.3
9,982 97.1 10,197 97.6
297 2.9 252 2.4
2,340 22.8 2,962 28.3
6,582 64.0 6,025 57.7
Per Capita Income .................... 13,905 Median Family Income .............................. 36,404
Median Household Income ...... 29,744 with own children under age 18 ............. 32,630
Median Nonfamily Income....... 15,615 without own children under age 18 ........ 38,312
Jackson County was established in 1822 fromEscambia County and named for AndrewJackson, governor of the territories of East and
West Florida and later U.S. President. Marianna is thecounty seat. This county enjoys three waterways theChattahoochee, the Flint and the Apalachicola rivers,and is known for Florida Caverns, a large state park.Manufacturing of clothing, furniture and lumber aremajor industries.
The county comprises 916 square miles of land and waspopulated by 46,755 persons in 2000. There were 51persons per square mile and the general populationincreased by 13 percent from 1990. Eighty-three percent ofthe population lived in a rural area. The median age in 2000was 38 years.
There were 19,490 housing units reported with ahomeownership rate of 78 percent. Thirty-five percent ofhouseholds included at least one person under the age of 18years. Annual income was less than $25,000 in 43 percentof all 16,586 households and 36 percent of the 5,169 familyhouseholds with their own children. Five percent of allhouseholds had earnings of $100,000 or greater.
Thirty-one percent of persons age 25 and over did notgraduate from high school and 33 percent graduated withno further education indicated. Thirteen percent obtained abachelor’s degree or higher. Of 4,547 persons age 18 to 24years, 69 percent were high school graduates. Elevenpercent of persons 16 to 19 years old were not in schooland not working.
Children under age 18 represented 22 percent of thepopulation in Jackson County, and 24 percent of childrenlived in poverty. Of the 6,998 persons of all ages living inpoverty, 34 percent were under the age of 18 years. Fifty-three percent of children lived in low-income householdsand 36 percent lived in high poverty neighborhoods.

Multi-Year Trend Data
** method used for calculating changed in 1998Source: Florida Department of Health, Office of Vital Statistics;Florida Department of Education
1992 1993 1994 1995 1996 1997 1998 1999 2000
Children Under Age 6 Below 100% of PovertyGrandparents Responsible 3 or More Years
100
75
50
25
0
Child
ren
Age 3
& 4
Enrol
led
in S
choo
lO
wn Chi
ldre
n Und
er A
ge 6
with
All Par
ents
in th
e La
bor F
orce
Child
ren
Under
Age
6
Below
200
% o
f Pov
erty
Gra
ndpa
rent
s Res
pons
ible
for
and
Livin
g with
Own
Gra
ndch
ildre
n Und
er A
ge 1
8
Own
Child
ren
Under
Age
6
Livin
g in
Sin
gle
Paren
t Hom
es
Per
cent
Source: US Census Bureau, Census 2000, SF1 and SF3
Critical MeasuresCensus 2000
Birth Rate
Teen Birth Rate Age 15-17
Teen Birth Rate Age 15-19
Percent of Births Receiving Early Prenatal Care
Percent of Low Birthweight Births
Percent of Births to Unwed Mothers
Infant Mortality Rate
Teen Violent Death Rate Age 15-19
Percent of Students Eligible for Free/Reduced Lunch
Graduation Rate**
Source: Policy and Services Research Data Center, de la Parte Institute, USF, 2002
Beh
avio
ral H
ealth
and
Juv
enile
Jus
tice
Source: Florida Department of Juvenile Justice, 2003
Source: Florida Department of Juvenile Justice, 2000/01
Chi
ld C
are,
Hea
d S
tart
and
Edu
catio
n
Source: Florida Department of Education, 2001/02
Source: Florida Children’s Forum, 2001
99 Center for the Study of Children’s Futures 2004
13.2 11.8 11.7 10.1 11.4 11.5 10.5 11.6 11.6
40.7 39.4 35.5 40.1 36.9 36.8 39.8 27.1 37.0
69.8 61.3 62.7 60.1 61.3 65.5 60.2 60.0 56.1
86.7 87.3 90.4 89.8 93.7 89.2 91.1 90.1 90.6
6.4 7.1 8.3 7.0 9.1 8.7 9.7 9.7 9.8
33.0 35.4 34.4 33.4 36.4 37.8 41.0 39.5 39.3
7.1 11.9 9.4 8.5 11.0 3.5 11.5 0.0 5.1
14.1 2.8 8.3 2.9 2.9 5.6 8.4 8.5 0.0
13.7 50.1 51.5 51.5 52.6 53.0 53.5 53.8 53.4
78.0 79.2 83.6 75.3 79.7 76.1 58.1 49.8 53.0
31.427.5
63.558.6 60.4
Jackson County
641 children received behavioral health services
12 behavioral health service providers served children
247 youths were referred to the juvenile justice system
11 youths were transferred to adult court
0 contracted delinquency prevention programs
1 state grant funded delinquency prevention program projected to serve 100 youths
1 probation and community corrections non-residential program with 30 slots
4 residential and correctional programs with 288 beds
0 detention centers
20 licensed child care centers with a capacity for 972 children
3 licensed family child care homes with a capacity for 30 children
15 Head Start programs with a capacity for 182 children
7,324 children were enrolled in 22 public schools
1,629 children were enrolled in exceptional student education programs
39 children were referred to English for Speakers of Other Languages Programs
277 children were enrolled in 3 non-public schools
168 children and families were registered in 114 home education programs

Number Percent Number Percent
Summary Profile for the Population Under Age 18, 1990 to 2000
1990 2000
Age & Sex
Population Under Age 18
Males Under Age 18
Females Under Age 18
Population Under Age 5
Population Age 5 - 17
Race
Children of One Race
White Children
Black or African American Children
American Indian or Alaska Native Children
Asian Children
Native Hawaiian or Other Pacific Islander Children
Children of Some Other Race
Children of Two or More Races
Hispanic Origin Status
Hispanic Children
Non-Hispanic Children
Non-Hispanic White Children
Non-Hispanic Racial Minorities
Living Arrangements
Children Living in Households
Children Living in Group Quarters
Own Children Living in Single Parent Households
Own Children Living in Married Couple Households
Source: Population Reference Bureau analysis of data from the US Census Bureau for the Annie E. Casey Foundation
1999 Income in Dollars as Reported in Census 2000
• •
•
•
Source: US Census Bureau, Census 2000, SF3 Tables P82, P53, P80 and PCT39
Number NumberPercent Percent
Source: US Census Bureau, Census 2000, SF1 and SF3;Florida Almanac, 2002/2003; Florida County Atlas, 1994
100Center for the Study of Children’s Futures 2004
3,268 100.0 2,930 100.0
1,659 50.8 1,497 51.1
1,609 49.2 1,433 48.9
833 25.5 682 23.3
2,435 74.5 2,248 76.7
N/A N/A 2,896 98.8
1,510 46.2 1,553 53.0
1,738 53.2 1,315 44.9
2 0.1 12 0.4
N/A N/A 3 0.1
N/A N/A 0 0.0
9 0.3 13 0.4
N/A N/A 34 1.2
33 1.0 49 1.7
3,235 99.0 2,881 98.3
1,487 45.5 1,538 52.5
1,748 53.5 1,343 45.8
3,265 99.9 2,910 99.3
3 0.1 20 0.7
862 26.4 770 26.3
1,873 57.3 1,642 56.0
Per Capita Income .................... 17,006 Median Family Income .............................. 40,407
Median Household Income ...... 32,998 with own children under age 18 ............. 37,653
Median Nonfamily Income....... 16,648 without own children under age 18 ........ 43,093
Jefferson County was established in 1827 fromEscambia County and was named for ThomasJefferson, the third U.S. President. Monticello is
the county seat. This county is primarily agriculturaland is rich with forests and streams. Private employersare in clothing, nurseries, dairying and foodproduction.
The county comprises 598 square miles of land and waspopulated by 12,902 persons in 2000. There were 22persons per square mile and the general populationincreased by 14 percent from 1990. One hundred percent ofthe population lived in a rural area. The median age in 2000was 39 years.
There were 5,251 housing units reported with ahomeownership rate of 81 percent. Thirty-four percent ofhouseholds included at least one person under the age of 18years. Annual income was less than $25,000 in 38 percentof all 4,697 households and 31 percent of the 1,434 familyhouseholds with their own children. Seven percent of allhouseholds had earnings of $100,000 or greater.
Twenty-seven percent of persons age 25 and over did notgraduate from high school and 32 percent graduated withno further education indicated. Seventeen percent obtaineda bachelor’s degree or higher. Of 1,058 persons age 18 to24 years, 66 percent were high school graduates. Fourteenpercent of persons 16 to 19 years old were not in school andnot working.
Children under age 18 represented 23 percent of thepopulation in Jefferson County, and 22 percent of childrenlived in poverty. Of the 2,040 persons of all ages living inpoverty, 31 percent were under the age of 18 years. Forty-nine percent of children lived in low-income householdsand no children lived in high poverty neighborhoods.

Multi-Year Trend Data
** method used for calculating changed in 1998Source: Florida Department of Health, Office of Vital Statistics;Florida Department of Education
1992 1993 1994 1995 1996 1997 1998 1999 2000
Children Under Age 6 Below 100% of PovertyGrandparents Responsible 3 or More Years
100
75
50
25
0
Child
ren
Age 3
& 4
Enrol
led
in S
choo
lO
wn Chi
ldre
n Und
er A
ge 6
with
All Par
ents
in th
e La
bor F
orce
Child
ren
Under
Age
6
Below
200
% o
f Pov
erty
Gra
ndpa
rent
s Res
pons
ible
for
and
Livin
g with
Own
Gra
ndch
ildre
n Und
er A
ge 1
8
Own
Child
ren
Under
Age
6
Livin
g in
Sin
gle
Paren
t Hom
es
Per
cent
Source: US Census Bureau, Census 2000, SF1 and SF3
Critical MeasuresCensus 2000
Birth Rate
Teen Birth Rate Age 15-17
Teen Birth Rate Age 15-19
Percent of Births Receiving Early Prenatal Care
Percent of Low Birthweight Births
Percent of Births to Unwed Mothers
Infant Mortality Rate
Teen Violent Death Rate Age 15-19
Percent of Students Eligible for Free/Reduced Lunch
Graduation Rate**
Source: Policy and Services Research Data Center, de la Parte Institute, USF, 2002
Beh
avio
ral H
ealth
and
Juv
enile
Jus
tice
Source: Florida Department of Juvenile Justice, 2003
Source: Florida Department of Juvenile Justice, 2000/01
Chi
ld C
are,
Hea
d S
tart
and
Edu
catio
n
Source: Florida Department of Education, 2001/02
Source: Florida Children’s Forum, 2001
101 Center for the Study of Children’s Futures 2004
13.9 14.2 10.3 11.7 11.3 11.4 9.3 11.8 9.3
47.5 56.8 30.6 41.8 17.4 13.1 9.7 28.8 28.2
80.5 71.1 48.2 58.1 67.7 61.9 30.4 48.1 44.3
82.8 88.8 83.7 83.5 91.6 82.5 85.0 87.7 85.3
7.6 10.1 3.7 9.5 7.7 11.3 10.5 5.8 6.6
50.9 46.6 52.9 43.0 49.7 48.1 50.4 42.7 45.6
29.2 5.6 7.4 0.0 6.5 18.8 15.0 5.8 0.0
10.4 10.0 0.0 9.5 0.0 0.0 0.0 0.0 11.3
70.1 72.2 70.0 70.3 67.1 67.4 70.6 69.5 68.0
75.6 80.3 71.9 63.8 59.0 73.4 62.6 65.3 78.8
57.9
22.4
68.4
53.6 51.4
Jefferson County
130 children received behavioral health services
9 behavioral health service providers served children
65 youths were referred to the juvenile justice system
5 youths were transferred to adult court
0 contracted delinquency prevention programs
1 state grant funded delinquency prevention program projected to serve 50 youths
0 probation and community corrections non-residential programs
1 residential and correctional program with 30 beds
0 detention centers
6 licensed child care centers with a capacity for 239 children
1 licensed family child care home with a capacity for 10 children
2 Head Start programs with a capacity for 32 children
1,708 children were enrolled in 8 public schools
476 children were enrolled in exceptional student education programs
4 children were referred to English for Speakers of Other Languages Programs
437 children were enrolled in 2 non-public schools
119 children and families were registered in 51 home education programs

Number Percent Number Percent
Summary Profile for the Population Under Age 18, 1990 to 2000
1990 2000
Age & Sex
Population Under Age 18
Males Under Age 18
Females Under Age 18
Population Under Age 5
Population Age 5 - 17
Race
Children of One Race
White Children
Black or African American Children
American Indian or Alaska Native Children
Asian Children
Native Hawaiian or Other Pacific Islander Children
Children of Some Other Race
Children of Two or More Races
Hispanic Origin Status
Hispanic Children
Non-Hispanic Children
Non-Hispanic White Children
Non-Hispanic Racial Minorities
Living Arrangements
Children Living in Households
Children Living in Group Quarters
Own Children Living in Single Parent Households
Own Children Living in Married Couple Households
Source: Population Reference Bureau analysis of data from the US Census Bureau for the Annie E. Casey Foundation
1999 Income in Dollars as Reported in Census 2000
• •
•
•
Source: US Census Bureau, Census 2000, SF3 Tables P82, P53, P80 and PCT39
Number NumberPercent Percent
Source: US Census Bureau, Census 2000, SF1 and SF3;Florida Almanac, 2002/2003; Florida County Atlas, 1994
102Center for the Study of Children’s Futures 2004
1,380 100.0 1,523 100.0
719 52.1 834 54.8
661 47.9 689 45.2
326 23.6 389 25.5
1,054 76.4 1,134 74.5
N/A N/A 1,505 98.8
1,195 86.6 1,253 82.3
169 12.2 137 9.0
2 0.1 19 1.2
N/A N/A 1 0.1
N/A N/A 0 0.0
13 0.9 95 6.2
N/A N/A 18 1.2
30 2.2 185 12.1
1,350 97.8 1,338 87.9
1,180 85.5 1,176 77.2
170 12.3 162 10.6
1,371 99.3 1,521 99.9
9 0.7 2 0.1
266 19.3 309 20.3
976 70.7 1,005 66.0
Per Capita Income .................... 13,087 Median Family Income .............................. 35,020
Median Household Income ...... 30,651 with own children under age 18 ............. 33,550
Median Nonfamily Income....... 20,000 without own children under age 18 ........ 36,974
L afayette County was established in 1856 from aportion of Madison County and named for theMarquis de Lafayette. Mayo is the county seat.
This county is flat and wooded and is known forhunting and fishing. Numerous springs along theSuwannee River create the eastern border. Majorindustries include dairying, boat construction, seafoodpacking and timber.
The county comprises 543 square miles of land and waspopulated by 7,022 persons in 2000. There were 13 personsper square mile and the general population increased by 26percent from 1990. One hundred percent of the populationlived in a rural area. The median age in 2000 was 35 years.
There were 2,660 housing units reported with ahomeownership rate of 81 percent. Thirty-nine percent ofhouseholds included at least one person under the age of 18years. Annual income was less than $25,000 in 42 percent ofall 2,151 households and 36 percent of the 721 familyhouseholds with their own children. Four percent of allhouseholds had earnings of $100,000 or greater.
Thirty-two percent of persons age 25 and over did notgraduate from high school and 40 percent graduated with nofurther education indicated. Seven percent obtained abachelor’s degree or higher. Of 765 persons age 18 to 24years, 57 percent were high school graduates. Nineteenpercent of persons 16 to 19 years old were not in school andnot working.
Children under age 18 represented 22 percent of thepopulation in Lafayette County, and 25 percent of childrenlived in poverty. Of the 999 persons of all ages living inpoverty, 38 percent were under the age of 18 years. Fifty-seven percent of children lived in low-income householdsand no children lived in high poverty neighborhoods.

Multi-Year Trend Data
** method used for calculating changed in 1998Source: Florida Department of Health, Office of Vital Statistics;Florida Department of Education
1992 1993 1994 1995 1996 1997 1998 1999 2000
Children Under Age 6 Below 100% of PovertyGrandparents Responsible 3 or More Years
100
75
50
25
0
Child
ren
Age 3
& 4
Enrol
led
in S
choo
lO
wn Chi
ldre
n Und
er A
ge 6
with
All Par
ents
in th
e La
bor F
orce
Child
ren
Under
Age
6
Below
200
% o
f Pov
erty
Gra
ndpa
rent
s Res
pons
ible
for
and
Livin
g with
Own
Gra
ndch
ildre
n Und
er A
ge 1
8
Own
Child
ren
Under
Age
6
Livin
g in
Sin
gle
Paren
t Hom
es
Per
cent
Source: US Census Bureau, Census 2000, SF1 and SF3
Critical MeasuresCensus 2000
Birth Rate
Teen Birth Rate Age 15-17
Teen Birth Rate Age 15-19
Percent of Births Receiving Early Prenatal Care
Percent of Low Birthweight Births
Percent of Births to Unwed Mothers
Infant Mortality Rate
Teen Violent Death Rate Age 15-19
Percent of Students Eligible for Free/Reduced Lunch
Graduation Rate**
Source: Policy and Services Research Data Center, de la Parte Institute, USF, 2002
Beh
avio
ral H
ealth
and
Juv
enile
Jus
tice
Source: Florida Department of Juvenile Justice, 2003
Source: Florida Department of Juvenile Justice, 2000/01
Chi
ld C
are,
Hea
d S
tart
and
Edu
catio
n
Source: Florida Department of Education, 2001/02
Source: Florida Children’s Forum, 2001
103 Center for the Study of Children’s Futures 2004
12.6 12.0 9.9 10.1 10.1 12.4 10.7 10.1 12.4
64.8 67.3 29.4 51.5 36.8 22.4 30.8 36.0 41.3
87.0 110.4 78.9 64.0 39.4 70.4 62.2 97.1 66.7
* * * * * * * * *
* * * * * * * * *
* * * * * * * * *
* * * * * * * * *
0.0 0.0 0.0 0.0 0.0 0.0 0.0 0.0 20.6
44.0 46.9 48.2 46.7 52.7 51.4 51.3 52.8 51.7
88.0 76.6 71.1 90.9 68.7 89.5 80.6 65.5 58.0*unreliable ratio, denominator less than 100
32.6
18.5
56.559.3
66.1
Lafayette County
75 children received behavioral health services
8 behavioral health service providers served children
16 youths were referred to the juvenile justice system
0 youths were transferred to adult court
0 contracted delinquency prevention programs
1 state grant funded delinquency prevention program projected to serve 50 youths
0 probation and community corrections non-residential programs
0 residential and correctional programs
0 detention centers
4 licensed child care centers with a capacity for 118 children
1 licensed family child care home with a capacity for 10 children
2 Head Start programs with a capacity for 32 children
1,030 children were enrolled in 5 public schools
148 children were enrolled in exceptional student education programs
31 children were referred to English for Speakers of Other Languages Programs
0 children were enrolled in non-public schools
30 children and families were registered in 24 home education programs

Number Percent Number Percent
Summary Profile for the Population Under Age 18, 1990 to 2000
1990 2000
Age & Sex
Population Under Age 18
Males Under Age 18
Females Under Age 18
Population Under Age 5
Population Age 5 - 17
Race
Children of One Race
White Children
Black or African American Children
American Indian or Alaska Native Children
Asian Children
Native Hawaiian or Other Pacific Islander Children
Children of Some Other Race
Children of Two or More Races
Hispanic Origin Status
Hispanic Children
Non-Hispanic Children
Non-Hispanic White Children
Non-Hispanic Racial Minorities
Living Arrangements
Children Living in Households
Children Living in Group Quarters
Own Children Living in Single Parent Households
Own Children Living in Married Couple Households
Source: Population Reference Bureau analysis of data from the US Census Bureau for the Annie E. Casey Foundation
1999 Income in Dollars as Reported in Census 2000
• •
•
•
Source: US Census Bureau, Census 2000, SF3 Tables P82, P53, P80 and PCT39
Number NumberPercent Percent
Source: US Census Bureau, Census 2000, SF1 and SF3;Florida Almanac, 2002/2003; Florida County Atlas, 1994
104Center for the Study of Children’s Futures 2004
30,263 100.0 42,719 100.0
15,543 51.4 21,872 51.2
14,720 48.6 20,847 48.8
8,576 28.3 10,993 25.7
21,687 71.7 31,726 74.3
N/A N/A 41,773 97.8
24,524 81.0 33,547 78.5
4,919 16.3 6,118 14.3
106 0.4 185 0.4
N/A N/A 425 1.0
N/A N/A 27 0.1
544 1.8 1,471 3.4
N/A N/A 946 2.2
1,503 5.0 4,054 9.5
28,760 95.0 38,665 90.5
23,633 78.1 31,327 73.3
5,127 16.9 7,338 17.2
30,044 99.3 42,546 99.6
219 0.7 173 0.4
6,016 19.9 9,986 23.4
20,617 68.1 27,496 64.4
Per Capita Income .................... 20,199 Median Family Income .............................. 42,577
Median Household Income ...... 36,903 with own children under age 18 ............. 42,150
Median Nonfamily Income....... 21,385 without own children under age 18 ........ 42,764
L ake County was established in 1887 fromportions of Sumter and Orange counties; it wasnamed for its large number of lakes. Tavares is
the county seat. This county is also noted for rollinglandscapes and citrus groves. Industries include mobilehome construction, metal fabrication, and concrete.
The county comprises 953 square miles of land and waspopulated by 210,528 persons in 2000. There were 221persons per square mile and the general populationincreased by 38 percent from 1990. Thirty percent of thepopulation lived in a rural area. The median age in 2000was 45 years.
There were 102,830 housing units reported with ahomeownership rate of 81 percent. Twenty-six percent ofhouseholds included at least one person under the age of 18years. Annual income was less than $25,000 in 32 percentof all 88,383 households and 26 percent of the 20,957family households with their own children. Seven percentof all households had earnings of $100,000 or greater.
Twenty percent of persons age 25 and over did not graduatefrom high school and 34 percent graduated with no furthereducation indicated. Seventeen percent obtained abachelor’s degree or higher. Of 12,266 persons age 18 to 24years, 65 percent were high school graduates. Ten percentof persons 16 to 19 years old were not in school and notworking.
Children under age 18 represented 20 percent of thepopulation in Lake County, and 16 percent of children livedin poverty. Of the 19,907 persons of all ages living inpoverty, 34 percent were under the age of 18 years. Forty-one percent of children lived in low-income householdsand 6 percent lived in high poverty neighborhoods.

Multi-Year Trend Data
** method used for calculating changed in 1998Source: Florida Department of Health, Office of Vital Statistics;Florida Department of Education
1992 1993 1994 1995 1996 1997 1998 1999 2000
Children Under Age 6 Below 100% of PovertyGrandparents Responsible 3 or More Years
100
75
50
25
0
Child
ren
Age 3
& 4
Enrol
led
in S
choo
lO
wn Chi
ldre
n Und
er A
ge 6
with
All Par
ents
in th
e La
bor F
orce
Child
ren
Under
Age
6
Below
200
% o
f Pov
erty
Gra
ndpa
rent
s Res
pons
ible
for
and
Livin
g with
Own
Gra
ndch
ildre
n Und
er A
ge 1
8
Own
Child
ren
Under
Age
6
Livin
g in
Sin
gle
Paren
t Hom
es
Per
cent
Source: US Census Bureau, Census 2000, SF1 and SF3
Critical MeasuresCensus 2000
Birth Rate
Teen Birth Rate Age 15-17
Teen Birth Rate Age 15-19
Percent of Births Receiving Early Prenatal Care
Percent of Low Birthweight Births
Percent of Births to Unwed Mothers
Infant Mortality Rate
Teen Violent Death Rate Age 15-19
Percent of Students Eligible for Free/Reduced Lunch
Graduation Rate**
Source: Policy and Services Research Data Center, de la Parte Institute, USF, 2002
Beh
avio
ral H
ealth
and
Juv
enile
Jus
tice
Source: Florida Department of Juvenile Justice, 2003
Source: Florida Department of Juvenile Justice, 2000/01
Chi
ld C
are,
Hea
d S
tart
and
Edu
catio
n
Source: Florida Department of Education, 2001/02
Source: Florida Children’s Forum, 2001
105 Center for the Study of Children’s Futures 2004
46.4
21.4
60.5
44.5 44.9 12.3 11.9 11.6 11.4 10.6 10.7 11.2 10.9 11.3
48.3 47.7 44.1 50.6 48.0 46.8 43.5 37.3 31.0
85.0 74.4 71.5 75.0 81.9 74.7 72.2 72.6 66.2
78.1 81.5 81.6 86.0 86.2 87.2 83.8 83.1 81.7
6.7 7.4 7.6 8.1 8.5 9.4 8.4 8.9 8.3
35.2 32.3 33.5 35.7 37.1 35.9 34.9 37.3 36.6
6.5 9.5 7.0 6.4 9.2 7.4 6.8 6.3 3.0
3.5 5.8 5.8 7.3 2.3 2.2 11.7 2.0 6.3
40.4 42.4 42.7 41.0 40.6 41.8 40.2 39.6 38.9
79.5 69.4 61.9 68.5 75.3 77.0 65.0 66.3 67.5
Lake County
1,748 children received behavioral health services
30 behavioral health service providers served children
1,500 youths were referred to the juvenile justice system
40 youths were transferred to adult court
0 contracted delinquency prevention programs
1 state grant funded delinquency prevention program projected to serve 315 youths
0 probation and community corrections non-residential programs
0 residential and correctional programs
0 detention centers
57 licensed child care centers with a capacity for 4,942 children
20 licensed family child care homes with a capacity for 190 children
22 Head Start and Early Head Start programs with a capacity for 351 children
30,678 children were enrolled in 57 public schools
5,924 children were enrolled in exceptional student education programs
954 children were referred to English for Speakers of Other Languages Programs
3,507 children were enrolled in 40 non-public schools
817 children and families were registered in 564 home education programs

Number Percent Number Percent
Summary Profile for the Population Under Age 18, 1990 to 2000
1990 2000
Age & Sex
Population Under Age 18
Males Under Age 18
Females Under Age 18
Population Under Age 5
Population Age 5 - 17
Race
Children of One Race
White Children
Black or African American Children
American Indian or Alaska Native Children
Asian Children
Native Hawaiian or Other Pacific Islander Children
Children of Some Other Race
Children of Two or More Races
Hispanic Origin Status
Hispanic Children
Non-Hispanic Children
Non-Hispanic White Children
Non-Hispanic Racial Minorities
Living Arrangements
Children Living in Households
Children Living in Group Quarters
Own Children Living in Single Parent Households
Own Children Living in Married Couple Households
Source: Population Reference Bureau analysis of data from the US Census Bureau for the Annie E. Casey Foundation
1999 Income in Dollars as Reported in Census 2000
• •
•
•
Source: US Census Bureau, Census 2000, SF3 Tables P82, P53, P80 and PCT39
Number NumberPercent Percent
Source: US Census Bureau, Census 2000, SF1 and SF3;Florida Almanac, 2002/2003; Florida County Atlas, 1994
106Center for the Study of Children’s Futures 2004
65,570 100.0 86,388 100.0
33,671 51.4 44,576 51.6
31,899 48.6 41,812 48.4
19,935 30.4 22,970 26.6
45,635 69.6 63,418 73.4
N/A N/A 83,693 96.9
54,318 82.8 66,982 77.5
8,985 13.7 10,853 12.6
163 0.2 339 0.4
N/A N/A 747 0.9
N/A N/A 51 0.1
1,518 2.3 4,721 5.5
N/A N/A 2,695 3.1
5,260 8.0 14,213 16.5
60,310 92.0 72,175 83.5
50,849 77.5 58,734 68.0
9,461 14.4 13,441 15.6
65,306 99.6 86,146 99.7
264 0.4 242 0.3
14,222 21.7 22,670 26.2
44,162 67.4 54,206 62.7
Per Capita Income .................... 24,542 Median Family Income .............................. 46,430
Median Household Income ...... 40,319 with own children under age 18 ............. 44,053
Median Nonfamily Income....... 25,827 without own children under age 18 ........ 47,596
L ee County was established in 1887 fromMonroe County and named for General RobertE. Lee. This county is a well-known tourist
center with many bays and harbors along the Gulf ofMexico. The county seat is Fort Myers. It is alsoknown for the beautiful islands of Sanibel andCaptiva. Industries include health care, foliagegrowing, and land developing.
The county comprises 804 square miles of land and waspopulated by 440,888 persons in 2000. There were 549persons per square mile and the general populationincreased by 32 percent from 1990. Twelve percent of thepopulation lived in a rural area. The median age in 2000was 45 years.
There were 245,405 housing units reported with ahomeownership rate of 76 percent. Twenty-five percent ofhouseholds included at least one person under the age of 18years. Annual income was less than $25,000 in 28 percentof all 188,755 households and 24 percent of the 42,954family households with their own children. Eleven percentof all households had earnings of $100,000 or greater.
Eighteen percent of persons age 25 and over did notgraduate from high school and 33 percent graduated withno further education indicated. Twenty-one percentobtained a bachelor’s degree or higher. Of 26,930 personsage 18 to 24 years, 65 percent were high school graduates.Twelve percent of persons 16 to 19 years old were not inschool and not working.
Children under age 18 represented 20 percent of thepopulation in Lee County, and 16 percent of children livedin poverty. Of the 42,316 persons of all ages living inpoverty, 32 percent were under the age of 18 years. Thirty-nine percent of children lived in low-income householdsand 16 percent lived in high poverty neighborhoods.

Multi-Year Trend Data
** method used for calculating changed in 1998Source: Florida Department of Health, Office of Vital Statistics;Florida Department of Education
1992 1993 1994 1995 1996 1997 1998 1999 2000
Children Under Age 6 Below 100% of PovertyGrandparents Responsible 3 or More Years
100
75
50
25
0
Child
ren
Age 3
& 4
Enrol
led
in S
choo
lO
wn Chi
ldre
n Und
er A
ge 6
with
All Par
ents
in th
e La
bor F
orce
Child
ren
Under
Age
6
Below
200
% o
f Pov
erty
Gra
ndpa
rent
s Res
pons
ible
for
and
Livin
g with
Own
Gra
ndch
ildre
n Und
er A
ge 1
8
Own
Child
ren
Under
Age
6
Livin
g in
Sin
gle
Paren
t Hom
es
Per
cent
Source: US Census Bureau, Census 2000, SF1 and SF3
Critical MeasuresCensus 2000
Birth Rate
Teen Birth Rate Age 15-17
Teen Birth Rate Age 15-19
Percent of Births Receiving Early Prenatal Care
Percent of Low Birthweight Births
Percent of Births to Unwed Mothers
Infant Mortality Rate
Teen Violent Death Rate Age 15-19
Percent of Students Eligible for Free/Reduced Lunch
Graduation Rate**
Source: Policy and Services Research Data Center, de la Parte Institute, USF, 2002
Beh
avio
ral H
ealth
and
Juv
enile
Jus
tice
Source: Florida Department of Juvenile Justice, 2003
Source: Florida Department of Juvenile Justice, 2000/01
Chi
ld C
are,
Hea
d S
tart
and
Edu
catio
n
Source: Florida Department of Education, 2001/02
Source: Florida Children’s Forum, 2001
107 Center for the Study of Children’s Futures 2004
12.0 11.7 11.7 11.3 11.4 11.4 11.2 11.3 12.1
49.6 48.9 46.1 54.3 46.7 44.1 41.6 40.2 34.1
68.6 70.4 74.9 80.1 67.5 68.0 69.4 68.0 64.4
71.8 72.5 75.5 75.4 78.7 82.0 82.6 81.8 81.3
7.1 6.2 7.0 7.8 7.3 7.1 7.4 7.8 7.5
34.5 34.6 35.3 37.1 36.9 38.5 39.8 40.3 40.7
8.5 6.6 6.0 11.0 9.4 7.1 7.6 7.8 6.7
9.2 10.3 10.7 6.2 5.3 5.6 6.9 7.6 7.9
42.2 43.6 44.0 43.7 43.9 42.1 43.1 42.3 42.2
91.4 85.5 80.0 82.5 83.7 75.9 69.4 67.8 65.9
47.8
24.5
66.1
42.645.5
Lee County
113 licensed child care centers with a capacity for 10,709 children
46 licensed family child care homes with a capacity for 462 children
27 Head Start programs with a capacity for 618 children
60,706 children were enrolled in 82 public schools
13,449 children were enrolled in exceptional student education programs
6,288 children were referred to English for Speakers of Other Languages Programs
8,711 children were enrolled in 60 non-public schools
1,271 children and families were registered in 852 home education programs
1,998 children received behavioral health services
35 behavioral health service providers served children
2,428 youths were referred to the juvenile justice system
22 youths were transferred to adult court
1 contracted delinquency prevention program with 4 beds or slots
2 state grant funded delinquency prevention programs projected to serve 200 youths
3 probation and community corrections non-residential programs with 116 slots
1 residential and correctional program with 26 beds
1 detention center with 60 beds

Number Percent Number Percent
Summary Profile for the Population Under Age 18, 1990 to 2000
1990 2000
Age & Sex
Population Under Age 18
Males Under Age 18
Females Under Age 18
Population Under Age 5
Population Age 5 - 17
Race
Children of One Race
White Children
Black or African American Children
American Indian or Alaska Native Children
Asian Children
Native Hawaiian or Other Pacific Islander Children
Children of Some Other Race
Children of Two or More Races
Hispanic Origin Status
Hispanic Children
Non-Hispanic Children
Non-Hispanic White Children
Non-Hispanic Racial Minorities
Living Arrangements
Children Living in Households
Children Living in Group Quarters
Own Children Living in Single Parent Households
Own Children Living in Married Couple Households
Source: Population Reference Bureau analysis of data from the US Census Bureau for the Annie E. Casey Foundation
1999 Income in Dollars as Reported in Census 2000
• •
•
•
Source: US Census Bureau, Census 2000, SF3 Tables P82, P53, P80 and PCT39
Number NumberPercent Percent
Source: US Census Bureau, Census 2000, SF1 and SF3;Florida Almanac, 2002/2003; Florida County Atlas, 1994
108Center for the Study of Children’s Futures 2004
43,125 100.0 51,007 100.0
21,965 50.9 26,005 51.0
21,160 49.1 25,002 49.0
12,365 28.7 13,727 26.9
30,760 71.3 37,280 73.1
N/A N/A 49,760 97.6
28,698 66.5 30,391 59.6
13,428 31.1 17,891 35.1
119 0.3 154 0.3
N/A N/A 913 1.8
N/A N/A 21 0.0
259 0.6 390 0.8
N/A N/A 1,247 2.4
873 2.0 1,681 3.3
42,252 98.0 49,326 96.7
28,135 65.2 29,369 57.6
14,117 32.7 19,957 39.1
42,884 99.4 50,707 99.4
241 0.6 300 0.6
10,854 25.2 15,176 29.8
28,254 65.5 30,751 60.3
Per Capita Income .................... 21,024 Median Family Income .............................. 52,962
Median Household Income ...... 37,517 with own children under age 18 ............. 50,007
Median Nonfamily Income....... 21,526 without own children under age 18 ........ 56,340
L eon County was established in 1824 from aportion of Escambia County and named for theSpanish explorer, Juan Ponce de Leon.
Tallahassee is the county seat and Florida’s capital.This site was chosen because at the time of statehoodin 1845, most Floridians lived in north Florida. TheApalachicola National Forest predominates thelandscape, while state government and universitiesare the largest employers.
The county comprises 667 square miles of land and waspopulated by 239,452 persons in 2000. There were 359persons per square mile and the general populationincreased by 24 percent from 1990. Fifteen percent of thepopulation lived in a rural area. The median age in 2000was 30 years.
There were 103,974 housing units reported with ahomeownership rate of 57 percent. Thirty percent ofhouseholds included at least one person under the age of 18years. Annual income was less than $25,000 in 35 percentof all 96,691 households and 24 percent of the 27,383family households with their own children. Ten percent ofall households had earnings of $100,000 or greater.
Eleven percent of persons age 25 and over did not graduatefrom high school and 19 percent graduated with no furthereducation indicated. Forty-two percent obtained abachelor’s degree or higher. Of 51,068 persons age 18 to 24years, 91 percent were high school graduates. Four percentof persons 16 to 19 years old were not in school and notworking.
Children under age 18 represented 21 percent of thepopulation in Leon County, and 17 percent of childrenlived in poverty. Of the 41,078 persons of all ages living inpoverty, 20 percent were under the age of 18 years. Thirty-five percent of children lived in low-income householdsand 23 percent lived in high poverty neighborhoods.

Multi-Year Trend Data
** method used for calculating changed in 1998Source: Florida Department of Health, Office of Vital Statistics;Florida Department of Education
1992 1993 1994 1995 1996 1997 1998 1999 2000
Children Under Age 6 Below 100% of PovertyGrandparents Responsible 3 or More Years
100
75
50
25
0
Child
ren
Age 3
& 4
Enrol
led
in S
choo
lO
wn Chi
ldre
n Und
er A
ge 6
with
All Par
ents
in th
e La
bor F
orce
Child
ren
Under
Age
6
Below
200
% o
f Pov
erty
Gra
ndpa
rent
s Res
pons
ible
for
and
Livin
g with
Own
Gra
ndch
ildre
n Und
er A
ge 1
8
Own
Child
ren
Under
Age
6
Livin
g in
Sin
gle
Paren
t Hom
es
Per
cent
Source: US Census Bureau, Census 2000, SF1 and SF3
Critical MeasuresCensus 2000
Birth Rate
Teen Birth Rate Age 15-17
Teen Birth Rate Age 15-19
Percent of Births Receiving Early Prenatal Care
Percent of Low Birthweight Births
Percent of Births to Unwed Mothers
Infant Mortality Rate
Teen Violent Death Rate Age 15-19
Percent of Students Eligible for Free/Reduced Lunch
Graduation Rate**
Source: Policy and Services Research Data Center, de la Parte Institute, USF, 2002
Beh
avio
ral H
ealth
and
Juv
enile
Jus
tice
Source: Florida Department of Juvenile Justice, 2003
Source: Florida Department of Juvenile Justice, 2000/01
Chi
ld C
are,
Hea
d S
tart
and
Edu
catio
n
Source: Florida Department of Education, 2001/02
Source: Florida Children’s Forum, 2001
109 Center for the Study of Children’s Futures 2004
13.2 13.5 13.3 12.8 12.5 12.4 13.0 12.3 12.2
41.8 33.2 34.8 29.7 31.8 24.4 25.9 22.0 23.5
34.6 32.8 31.9 28.2 26.1 24.9 25.5 22.5 23.7
86.5 89.1 88.9 88.6 90.4 88.8 91.0 91.0 89.9
7.7 8.5 7.9 8.9 7.7 8.6 9.9 9.3 8.9
34.5 34.6 34.6 35.0 33.3 35.5 36.9 38.3 37.5
10.4 7.9 8.5 10.4 5.4 8.1 11.2 14.0 9.7
5.1 5.6 3.0 5.0 4.4 2.5 3.3 2.8 4.0
26.1 31.3 30.6 25.7 29.9 27.4 28.5 30.1 30.0
79.9 73.6 72.6 74.2 80.6 70.2 64.7 67.3 64.2
65.6
27.4
66.7
39.0
53.8
Leon County
109 licensed child care centers with a capacity for 9,695 children
36 licensed family child care homes with a capacity for 360 children
16 Head Start programs with a capacity for 238 children
31,855 children were enrolled in 60 public schools
8,656 children were enrolled in exceptional student education programs
278 children were referred to English for Speakers of Other Languages Programs
5,585 children were enrolled in 34 non-public schools
823 children and families were registered in 502 home education programs
2,774 children received behavioral health services
34 behavioral health service providers served children
1,406 youths were referred to the juvenile justice system
23 youths were transferred to adult court
2 contracted delinquency prevention programs with 61 beds or slots
1 state grant funded delinquency prevention program projected to serve 75 youths
4 probation and community corrections non-residential programs with 132 slots
2 residential and correctional programs with 51 beds
1 detention center with 56 beds

Number Percent Number Percent
Summary Profile for the Population Under Age 18, 1990 to 2000
1990 2000
Age & Sex
Population Under Age 18
Males Under Age 18
Females Under Age 18
Population Under Age 5
Population Age 5 - 17
Race
Children of One Race
White Children
Black or African American Children
American Indian or Alaska Native Children
Asian Children
Native Hawaiian or Other Pacific Islander Children
Children of Some Other Race
Children of Two or More Races
Hispanic Origin Status
Hispanic Children
Non-Hispanic Children
Non-Hispanic White Children
Non-Hispanic Racial Minorities
Living Arrangements
Children Living in Households
Children Living in Group Quarters
Own Children Living in Single Parent Households
Own Children Living in Married Couple Households
Source: Population Reference Bureau analysis of data from the US Census Bureau for the Annie E. Casey Foundation
1999 Income in Dollars as Reported in Census 2000
• •
•
•
Source: US Census Bureau, Census 2000, SF3 Tables P82, P53, P80 and PCT39
Number NumberPercent Percent
Source: US Census Bureau, Census 2000, SF1 and SF3;Florida Almanac, 2002/2003; Florida County Atlas, 1994
110Center for the Study of Children’s Futures 2004
6,279 100.0 8,131 100.0
3,172 50.5 4,168 51.3
3,107 49.5 3,963 48.7
1,664 26.5 1,975 24.3
4,615 73.5 6,156 75.7
N/A N/A 7,988 98.2
5,051 80.4 6,556 80.6
1,108 17.6 1,233 15.2
26 0.4 42 0.5
N/A N/A 30 0.4
N/A N/A 1 0.0
51 0.8 126 1.5
N/A N/A 143 1.8
157 2.5 469 5.8
6,122 97.5 7,662 94.2
4,952 78.9 6,232 76.6
1,170 18.6 1,430 17.6
6,271 99.9 8,107 99.7
8 0.1 24 0.3
1,419 22.6 2,266 27.9
4,082 65.0 4,632 57.0
Per Capita Income .................... 14,746 Median Family Income .............................. 30,899
Median Household Income ...... 26,959 with own children under age 18 ............. 30,772
Median Nonfamily Income....... 16,549 without own children under age 18 ........ 31,032
L evy County was established in 1845 from aportion of Alachua County. It was named forDavid Levy Yulee, the first U.S. Senator from
Florida. Manatee Springs, a state park, and Cedar Key,an offshore island, are popular with native Floridiansand tourists. The county seat is Bronson. Most privateemployers are in services, timber and agriculture.Shellfish aquaculture is a growing industry.
The county comprises 1,118 square miles of land and waspopulated by 34,450 persons in 2000. There were 31persons per square mile and the general populationincreased by 33 percent from 1990. One hundred percent ofthe population lived in a rural area. The median age in 2000was 41 years.
There were 16,570 housing units reported with ahomeownership rate of 84 percent. Thirty-two percent ofhouseholds included at least one person under the age of 18years. Annual income was less than $25,000 in 46 percentof all 13,886 households and 40 percent of the 3,977 familyhouseholds with their own children. Four percent of allhouseholds had earnings of $100,000 or greater.
Twenty-six percent of persons age 25 and over did notgraduate from high school and 38 percent graduated withno further education indicated. Eleven percent obtained abachelor’s degree or higher. Of 2,280 persons age 18 to 24years, 58 percent were high school graduates. Fifteenpercent of persons 16 to 19 years old were not in schooland not working.
Children under age 18 represented 24 percent of thepopulation in Levy County, and 27 percent of childrenlived in poverty. Of the 6,263 persons of all ages living inpoverty, 34 percent were under the age of 18 years. Fifty-eight percent of children lived in low-income householdsand 26 percent lived in high poverty neighborhoods.

Multi-Year Trend Data
** method used for calculating changed in 1998Source: Florida Department of Health, Office of Vital Statistics;Florida Department of Education
1992 1993 1994 1995 1996 1997 1998 1999 2000
Children Under Age 6 Below 100% of PovertyGrandparents Responsible 3 or More Years
100
75
50
25
0
Child
ren
Age 3
& 4
Enrol
led
in S
choo
lO
wn Chi
ldre
n Und
er A
ge 6
with
All Par
ents
in th
e La
bor F
orce
Child
ren
Under
Age
6
Below
200
% o
f Pov
erty
Gra
ndpa
rent
s Res
pons
ible
for
and
Livin
g with
Own
Gra
ndch
ildre
n Und
er A
ge 1
8
Own
Child
ren
Under
Age
6
Livin
g in
Sin
gle
Paren
t Hom
es
Per
cent
Source: US Census Bureau, Census 2000, SF1 and SF3
Critical MeasuresCensus 2000
Birth Rate
Teen Birth Rate Age 15-17
Teen Birth Rate Age 15-19
Percent of Births Receiving Early Prenatal Care
Percent of Low Birthweight Births
Percent of Births to Unwed Mothers
Infant Mortality Rate
Teen Violent Death Rate Age 15-19
Percent of Students Eligible for Free/Reduced Lunch
Graduation Rate**
Source: Policy and Services Research Data Center, de la Parte Institute, USF, 2002
Beh
avio
ral H
ealth
and
Juv
enile
Jus
tice
Source: Florida Department of Juvenile Justice, 2003
Source: Florida Department of Juvenile Justice, 2000/01
Chi
ld C
are,
Hea
d S
tart
and
Edu
catio
n
Source: Florida Department of Education, 2001/02
Source: Florida Children’s Forum, 2001
111 Center for the Study of Children’s Futures 2004
13.9 12.1 11.8 11.5 11.7 11.1 12.4 11.1 12.5
59.3 45.5 43.0 38.0 65.8 31.3 39.3 42.8 42.2
94.1 53.3 75.1 57.1 96.6 71.9 63.6 61.3 66.7
74.3 70.0 74.2 79.6 78.9 80.5 79.5 82.5 82.1
9.4 7.6 7.3 7.5 8.3 8.2 9.2 5.3 9.5
36.6 39.9 37.2 37.6 37.3 33.7 36.9 40.1 39.0
5.2 11.7 23.3 8.7 11.0 5.7 9.9 8.0 9.3
5.9 17.6 23.5 5.0 10.8 10.3 5.1 9.9 4.2
42.1 54.8 51.4 57.0 55.6 56.6 57.9 52.4 57.2
77.5 58.0 58.7 73.0 90.9 60.5 61.2 65.9 55.7
44.4
24.7
57.260.5
45.0
Levy County
19 licensed child care centers with a capacity for 1,304 children
1 licensed family child care home with a capacity for 10 children
11 Head Start and Early Head Start programs with a capacity for 172 children
6,260 children were enrolled in 16 public schools
1,536 children were enrolled in exceptional student education programs
141 children were referred to English for Speakers of Other Languages Programs
75 children were enrolled in 2 non-public schools
199 children and families were registered in 133 home education programs
611 children received behavioral health services
17 behavioral health service providers served children
242 youths were referred to the juvenile justice system
3 youths were transferred to adult court
0 contracted delinquency prevention programs
1 state grant funded delinquency prevention program projected to serve 40 youths
0 probation and community corrections non-residential programs
1 residential and correctional program with 40 beds
0 detention centers

Number Percent Number Percent
Summary Profile for the Population Under Age 18, 1990 to 2000
1990 2000
Age & Sex
Population Under Age 18
Males Under Age 18
Females Under Age 18
Population Under Age 5
Population Age 5 - 17
Race
Children of One Race
White Children
Black or African American Children
American Indian or Alaska Native Children
Asian Children
Native Hawaiian or Other Pacific Islander Children
Children of Some Other Race
Children of Two or More Races
Hispanic Origin Status
Hispanic Children
Non-Hispanic Children
Non-Hispanic White Children
Non-Hispanic Racial Minorities
Living Arrangements
Children Living in Households
Children Living in Group Quarters
Own Children Living in Single Parent Households
Own Children Living in Married Couple Households
Source: Population Reference Bureau analysis of data from the US Census Bureau for the Annie E. Casey Foundation
1999 Income in Dollars as Reported in Census 2000
• •
•
•
Source: US Census Bureau, Census 2000, SF3 Tables P82, P53, P80 and PCT39
Number NumberPercent Percent
Source: US Census Bureau, Census 2000, SF1 and SF3;Florida Almanac, 2002/2003; Florida County Atlas, 1994
112Center for the Study of Children’s Futures 2004
1,348 100.0 1,531 100.0
708 52.5 780 50.9
640 47.5 751 49.1
332 24.6 384 25.1
1,016 75.4 1,147 74.9
N/A N/A 1,515 99.0
1,188 88.1 1,223 79.9
151 11.2 206 13.5
7 0.5 30 2.0
N/A N/A 1 0.1
N/A N/A 0 0.0
0 0.0 55 3.6
N/A N/A 16 1.0
10 0.7 65 4.2
1,338 99.3 1,466 95.8
1,182 87.7 1,215 79.4
156 11.6 251 16.4
1,338 99.3 1,510 98.6
10 0.7 21 1.4
205 15.2 439 28.7
976 72.4 903 59.0
Per Capita Income .................... 17,225 Median Family Income .............................. 34,244
Median Household Income ...... 28,840 with own children under age 18 ............. 27,973
Median Nonfamily Income....... 18,183 without own children under age 18 ........ 39,167
L iberty County was established in 1856 and thecounty seat is Bristol. The Apalachicola NationalForest, the Telogia Creek Wildlife Management
Area and Torreya State Park cover most of the county.Forestry and health care are major industries. Outdooractivities, such as hunting, fishing, and canoeing arepopular.
The county comprises 836 square miles of land and waspopulated by 7,021 persons in 2000. There were 8 personsper square mile and the general population increased by 26percent from 1990. One hundred percent of the populationlived in a rural area. The median age in 2000 was 35 years.
There were 3,156 housing units reported with ahomeownership rate of 82 percent. Thirty-eight percent ofhouseholds included at least one person under the age of 18years. Annual income was less than $25,000 in 43 percentof all 2,227 households and 42 percent of the 764 familyhouseholds with their own children. Five percent of allhouseholds had earnings of $100,000 or greater.
Thirty-four percent of persons age 25 and over did notgraduate from high school and 40 percent graduated withno further education indicated. Seven percent obtained abachelor’s degree or higher. Of 658 persons age 18 to 24years, 58 percent were high school graduates. Ten percentof persons 16 to 19 years old were not in school and notworking.
Children under age 18 represented 22 percent of thepopulation in Liberty County, and 26 percent of childrenlived in poverty. Of the 1,114 persons of all ages living inpoverty, 34 percent were under the age of 18 years. Sixtypercent of children lived in low-income households and 73percent lived in high poverty neighborhoods.

Multi-Year Trend Data
** method used for calculating changed in 1998Source: Florida Department of Health, Office of Vital Statistics;Florida Department of Education
1992 1993 1994 1995 1996 1997 1998 1999 2000
Children Under Age 6 Below 100% of PovertyGrandparents Responsible 3 or More Years
100
75
50
25
0
Child
ren
Age 3
& 4
Enrol
led
in S
choo
lO
wn Chi
ldre
n Und
er A
ge 6
with
All Par
ents
in th
e La
bor F
orce
Child
ren
Under
Age
6
Below
200
% o
f Pov
erty
Gra
ndpa
rent
s Res
pons
ible
for
and
Livin
g with
Own
Gra
ndch
ildre
n Und
er A
ge 1
8
Own
Child
ren
Under
Age
6
Livin
g in
Sin
gle
Paren
t Hom
es
Per
cent
Source: US Census Bureau, Census 2000, SF1 and SF3
Critical MeasuresCensus 2000
Birth Rate
Teen Birth Rate Age 15-17
Teen Birth Rate Age 15-19
Percent of Births Receiving Early Prenatal Care
Percent of Low Birthweight Births
Percent of Births to Unwed Mothers
Infant Mortality Rate
Teen Violent Death Rate Age 15-19
Percent of Students Eligible for Free/Reduced Lunch
Graduation Rate**
Source: Policy and Services Research Data Center, de la Parte Institute, USF, 2002
Beh
avio
ral H
ealth
and
Juv
enile
Jus
tice
Source: Florida Department of Juvenile Justice, 2003
Source: Florida Department of Juvenile Justice, 2000/01
Chi
ld C
are,
Hea
d S
tart
and
Edu
catio
n
Source: Florida Department of Education, 2001/02
Source: Florida Children’s Forum, 2001
113 Center for the Study of Children’s Futures 2004
13.9 12.9 10.2 8.4 10.9 9.7 11.4 10.1 9.2
48.5 54.5 65.0 15.6 38.2 36.0 43.5 40.3 40.0
117.6 87.9 64.4 28.3 65.1 56.8 53.3 69.7 71.4
* * * * * * * * *
* * * * * * * * *
* * * * * * * * *
* * * * * * * * *
0.0 47.7 0.0 21.5 0.0 20.6 0.0 0.0 0.0
39.5 40.6 39.1 49.1 44.4 49.7 50.4 46.7 45.3
89.5 93.0 78.5 85.5 86.4 85.6 71.7 72.7 82.0*unreliable ratio, denominator less than 100
35.3
27.1
56.0
67.6 67.6
Liberty County
2 licensed child care centers with a capacity for 58 children
0 licensed family child care homes
1 Head Start program with a capacity for 20 children
1,320 children were enrolled in 9 public schools
355 children were enrolled in exceptional student education programs
14 children were referred to English for Speakers of Other Languages Programs
163 children were enrolled in 1 non-public school
12 children and families were registered in 10 home education programs
122 children received behavioral health services
12 behavioral health service providers served children
24 youths were referred to the juvenile justice system
0 youths were transferred to adult court
0 contracted delinquency prevention programs
1 state grant funded delinquency prevention program projected to serve 50 youths
1 probation and community corrections non-residential program with 10 slots
2 residential and correctional programs with 120 beds
0 detention centers

Number Percent Number Percent
Summary Profile for the Population Under Age 18, 1990 to 2000
1990 2000
Age & Sex
Population Under Age 18
Males Under Age 18
Females Under Age 18
Population Under Age 5
Population Age 5 - 17
Race
Children of One Race
White Children
Black or African American Children
American Indian or Alaska Native Children
Asian Children
Native Hawaiian or Other Pacific Islander Children
Children of Some Other Race
Children of Two or More Races
Hispanic Origin Status
Hispanic Children
Non-Hispanic Children
Non-Hispanic White Children
Non-Hispanic Racial Minorities
Living Arrangements
Children Living in Households
Children Living in Group Quarters
Own Children Living in Single Parent Households
Own Children Living in Married Couple Households
Source: Population Reference Bureau analysis of data from the US Census Bureau for the Annie E. Casey Foundation
1999 Income in Dollars as Reported in Census 2000
• •
•
•
Source: US Census Bureau, Census 2000, SF3 Tables P82, P53, P80 and PCT39
Number NumberPercent Percent
Source: US Census Bureau, Census 2000, SF1 and SF3;Florida Almanac, 2002/2003; Florida County Atlas, 1994
114Center for the Study of Children’s Futures 2004
4,560 100.0 4,736 100.0
2,410 52.9 2,482 52.4
2,150 47.1 2,254 47.6
1,296 28.4 1,074 22.7
3,264 71.6 3,662 77.3
N/A N/A 4,679 98.8
2,231 48.9 2,307 48.7
2,306 50.6 2,320 49.0
13 0.3 8 0.2
N/A N/A 13 0.3
N/A N/A 1 0.0
9 0.2 30 0.6
N/A N/A 57 1.2
42 0.9 130 2.7
4,518 99.1 4,606 97.3
2,208 48.4 2,236 47.2
2,310 50.7 2,370 50.0
4,554 99.9 4,575 96.6
6 0.1 161 3.4
1,317 28.9 1,487 31.4
2,528 55.4 2,332 49.2
Per Capita Income .................... 12,511 Median Family Income .............................. 31,753
Median Household Income ...... 26,533 with own children under age 18 ............. 30,278
Median Nonfamily Income....... 12,683 without own children under age 18 ........ 33,385
M adison County was established in 1827 froma portion of Escambia County. It was namedfor James Madison, the fourth U.S. President.
The county seat is Madison. Meat and poultry processingand manufacturing of wheel covers, plywood andfurniture are major industries. There are many springs,rivers, lakes, and historic sites throughout the county.
The county comprises 692 square miles of land and waspopulated by 18,733 persons in 2000. There were 27persons per square mile and the general populationincreased by 13 percent from 1990. Seventy-nine percent ofthe population lived in a rural area. The median age in 2000was 36 years.
There were 7,836 housing units reported with ahomeownership rate of 78 percent. Thirty-eight percent ofhouseholds included at least one person under the age of 18years. Annual income was less than $25,000 in 47 percent ofall 6,635 households and 40 percent of the 2,070 familyhouseholds with their own children. Four percent of allhouseholds had earnings of $100,000 or greater.
Thirty-three percent of persons age 25 and over did notgraduate from high school and 34 percent graduated with nofurther education indicated. Ten percent obtained abachelor’s degree or higher. Of 1,715 persons age 18 to 24years, 65 percent were high school graduates. Thirteenpercent of persons 16 to 19 years old were not in school andnot working.
Children under age 18 represented 25 percent of thepopulation in Madison County, and 30 percent of childrenlived in poverty. Of the 3,919 persons of all ages living inpoverty, 35 percent were under the age of 18 years. Fifty-eight percent of children lived in low-income householdsand 68 percent lived in high poverty neighborhoods.

Multi-Year Trend Data
** method used for calculating changed in 1998Source: Florida Department of Health, Office of Vital Statistics;Florida Department of Education
1992 1993 1994 1995 1996 1997 1998 1999 2000
Children Under Age 6 Below 100% of PovertyGrandparents Responsible 3 or More Years
100
75
50
25
0
Child
ren
Age 3
& 4
Enrol
led
in S
choo
lO
wn Chi
ldre
n Und
er A
ge 6
with
All Par
ents
in th
e La
bor F
orce
Child
ren
Under
Age
6
Below
200
% o
f Pov
erty
Gra
ndpa
rent
s Res
pons
ible
for
and
Livin
g with
Own
Gra
ndch
ildre
n Und
er A
ge 1
8
Own
Child
ren
Under
Age
6
Livin
g in
Sin
gle
Paren
t Hom
es
Per
cent
Source: US Census Bureau, Census 2000, SF1 and SF3
Critical MeasuresCensus 2000
Birth Rate
Teen Birth Rate Age 15-17
Teen Birth Rate Age 15-19
Percent of Births Receiving Early Prenatal Care
Percent of Low Birthweight Births
Percent of Births to Unwed Mothers
Infant Mortality Rate
Teen Violent Death Rate Age 15-19
Percent of Students Eligible for Free/Reduced Lunch
Graduation Rate**
Source: Policy and Services Research Data Center, de la Parte Institute, USF, 2002
Beh
avio
ral H
ealth
and
Juv
enile
Jus
tice
Source: Florida Department of Juvenile Justice, 2003
Source: Florida Department of Juvenile Justice, 2000/01
Chi
ld C
are,
Hea
d S
tart
and
Edu
catio
n
Source: Florida Department of Education, 2001/02
Source: Florida Children’s Forum, 2001
115 Center for the Study of Children’s Futures 2004
14.6 11.6 12.6 9.9 11.3 11.3 11.1 10.2 10.9
58.8 70.1 60.3 40.9 47.1 52.2 39.4 20.2 41.8
92.2 90.2 88.0 73.8 68.0 67.6 58.5 60.6 68.5
86.6 88.9 90.1 91.2 88.9 81.9 84.5 82.7 82.5
9.2 8.1 17.9 11.5 7.6 11.6 11.2 11.4 11.0
52.2 54.5 50.7 51.1 53.8 50.0 50.2 52.7 49.8
8.0 20.2 17.9 0.0 9.5 9.3 14.0 5.0 13.7
7.7 23.2 7.8 0.0 23.4 0.0 0.0 7.2 6.6
51.1 59.7 65.4 66.9 63.0 60.7 60.9 60.4 63.4
62.9 64.7 65.2 66.9 70.6 72.1 67.5 56.3 68.4
41.0
33.2
62.7 63.9
49.0
Madison County
11 licensed child care centers with a capacity for 446 children
3 licensed family child care homes with a capacity for 30 children
4 Head Start and Early Head Start programs with a capacity for 90 children
3,443 children were enrolled in 10 public schools
984 children were enrolled in exceptional student education programs
7 children were referred to English for Speakers of Other Languages Programs
0 children were enrolled in non-public schools
49 children and families were registered in 33 home education programs
276 children received behavioral health services
12 behavioral health service providers served children
125 youths were referred to the juvenile justice system
4 youths were transferred to adult court
0 contracted delinquency prevention programs
1 state grant funded delinquency prevention program projected to serve 80 youths
0 probation and community corrections non-residential programs
10 residential and correctional programs with 209 beds
0 detention centers

Number Percent Number Percent
Summary Profile for the Population Under Age 18, 1990 to 2000
1990 2000
Age & Sex
Population Under Age 18
Males Under Age 18
Females Under Age 18
Population Under Age 5
Population Age 5 - 17
Race
Children of One Race
White Children
Black or African American Children
American Indian or Alaska Native Children
Asian Children
Native Hawaiian or Other Pacific Islander Children
Children of Some Other Race
Children of Two or More Races
Hispanic Origin Status
Hispanic Children
Non-Hispanic Children
Non-Hispanic White Children
Non-Hispanic Racial Minorities
Living Arrangements
Children Living in Households
Children Living in Group Quarters
Own Children Living in Single Parent Households
Own Children Living in Married Couple Households
Source: Population Reference Bureau analysis of data from the US Census Bureau for the Annie E. Casey Foundation
1999 Income in Dollars as Reported in Census 2000
• •
•
•
Source: US Census Bureau, Census 2000, SF3 Tables P82, P53, P80 and PCT39
Number NumberPercent Percent
Source: US Census Bureau, Census 2000, SF1 and SF3;Florida Almanac, 2002/2003; Florida County Atlas, 1994
116Center for the Study of Children’s Futures 2004
40,616 100.0 54,647 100.0
20,974 51.6 28,098 51.4
19,642 48.4 26,549 48.6
12,345 30.4 14,902 27.3
28,271 69.6 39,745 72.7
N/A N/A 53,049 97.1
32,758 80.7 41,339 75.6
6,004 14.8 7,949 14.5
134 0.3 221 0.4
N/A N/A 552 1.0
N/A N/A 38 0.1
1,347 3.3 2,950 5.4
N/A N/A 1,598 2.9
3,506 8.6 9,127 16.7
37,110 91.4 45,520 83.3
30,710 75.6 35,841 65.6
6,400 15.8 9,679 17.7
40,372 99.4 53,660 98.2
244 0.6 987 1.8
8,574 21.1 14,213 26.0
26,971 66.4 33,136 60.6
Per Capita Income .................... 22,388 Median Family Income .............................. 46,576
Median Household Income ...... 38,673 with own children under age 18 ............. 46,169
Median Nonfamily Income....... 23,911 without own children under age 18 ........ 46,781
M anatee County was established in 1855 fromportions of Hillsborough and Mosquitocounties. The county seat is Bradenton, part
of a fast growing coastal region. The major employersare involved in health care, and in the production ofcitrus juice and boats. The Manatee River empties intothe Gulf of Mexico and this county includes the popularAnna Maria Island.
The county comprises 741 square miles of land and waspopulated by 264,002 persons in 2000. There were 356persons per square mile and the general populationincreased by 25 percent from 1990. Eight percent of thepopulation lived in a rural area. The median age in 2000was 44 years.
There were 138,128 housing units reported with ahomeownership rate of 74 percent. Twenty-six percent ofhouseholds included at least one person under the age of18 years. Annual income was less than $25,000 in 30percent of all 112,456 households and 25 percent of the26,017 family households with their own children. Ninepercent of all households had earnings of $100,000 orgreater.
Nineteen percent of persons age 25 and over did notgraduate from high school and 32 percent graduated withno further education indicated. Twenty-one percentobtained a bachelor’s degree or higher. Of 16,821 personsage 18 to 24 years, 62 percent were high school graduates.Ten percent of persons 16 to 19 years old were not inschool and not working.
Children under age 18 represented 21 percent of thepopulation in Manatee County, and 16 percent of childrenlived in poverty. Of the 26,104 persons of all ages living inpoverty, 32 percent were under the age of 18 years. Thirty-nine percent of children lived in low-income householdsand 25 percent lived in high poverty neighborhoods.

Multi-Year Trend Data
** method used for calculating changed in 1998Source: Florida Department of Health, Office of Vital Statistics;Florida Department of Education
1992 1993 1994 1995 1996 1997 1998 1999 2000
Children Under Age 6 Below 100% of PovertyGrandparents Responsible 3 or More Years
100
75
50
25
0
Child
ren
Age 3
& 4
Enrol
led
in S
choo
lO
wn Chi
ldre
n Und
er A
ge 6
with
All Par
ents
in th
e La
bor F
orce
Child
ren
Under
Age
6
Below
200
% o
f Pov
erty
Gra
ndpa
rent
s Res
pons
ible
for
and
Livin
g with
Own
Gra
ndch
ildre
n Und
er A
ge 1
8
Own
Child
ren
Under
Age
6
Livin
g in
Sin
gle
Paren
t Hom
es
Per
cent
Source: US Census Bureau, Census 2000, SF1 and SF3
Critical MeasuresCensus 2000
Birth Rate
Teen Birth Rate Age 15-17
Teen Birth Rate Age 15-19
Percent of Births Receiving Early Prenatal Care
Percent of Low Birthweight Births
Percent of Births to Unwed Mothers
Infant Mortality Rate
Teen Violent Death Rate Age 15-19
Percent of Students Eligible for Free/Reduced Lunch
Graduation Rate**
Source: Policy and Services Research Data Center, de la Parte Institute, USF, 2002
Beh
avio
ral H
ealth
and
Juv
enile
Jus
tice
Source: Florida Department of Juvenile Justice, 2003
Source: Florida Department of Juvenile Justice, 2000/01
Chi
ld C
are,
Hea
d S
tart
and
Edu
catio
n
Source: Florida Department of Education, 2001/02
Source: Florida Children’s Forum, 2001
117 Center for the Study of Children’s Futures 2004
12.8 12.6 11.9 12.1 12.1 11.8 11.5 12.0 12.5
56.2 50.0 57.9 59.8 61.7 50.4 46.2 43.8 41.8
90.7 80.4 81.7 88.0 88.8 74.5 72.4 71.3 71.3
69.4 71.4 73.2 75.0 78.6 80.2 80.2 81.8 79.1
6.7 7.3 8.2 7.6 7.8 7.7 7.8 8.5 7.4
37.0 37.6 36.6 38.1 39.2 38.9 40.8 39.1 42.5
7.8 12.3 10.3 9.2 4.5 4.2 7.0 7.9 7.4
4.7 7.4 3.6 5.6 8.0 11.0 8.3 3.2 7.0
41.5 44.1 44.3 43.8 43.0 41.2 41.5 40.4 37.0
71.9 71.5 68.6 61.2 61.5 59.6 56.2 61.4 65.2
54.5
23.7
62.8
42.146.6
Manatee County
82 licensed child care centers with a capacity for 6,050 children
39 licensed family child care homes with a capacity for 316 children
26 Head Start programs with a capacity for 526 children
38,274 children were enrolled in 77 public schools
8,821 children were enrolled in exceptional student education programs
2,405 children were referred to English for Speakers of Other Languages Programs
3,972 children were enrolled in 31 non-public schools
599 children and families were registered in 452 home education programs
1,590 children received behavioral health services
34 behavioral health service providers served children
1,959 youths were referred to the juvenile justice system
32 youths were transferred to adult court
2 contracted delinquency prevention programs with 56 beds or slots
2 state grant funded delinquency prevention programs projected to serve 240 youths
3 probation and community corrections non-residential programs with 166 slots
6 residential and correctional programs with 230 beds
1 detention center with 72 beds

Number Percent Number Percent
Summary Profile for the Population Under Age 18, 1990 to 2000
1990 2000
Age & Sex
Population Under Age 18
Males Under Age 18
Females Under Age 18
Population Under Age 5
Population Age 5 - 17
Race
Children of One Race
White Children
Black or African American Children
American Indian or Alaska Native Children
Asian Children
Native Hawaiian or Other Pacific Islander Children
Children of Some Other Race
Children of Two or More Races
Hispanic Origin Status
Hispanic Children
Non-Hispanic Children
Non-Hispanic White Children
Non-Hispanic Racial Minorities
Living Arrangements
Children Living in Households
Children Living in Group Quarters
Own Children Living in Single Parent Households
Own Children Living in Married Couple Households
Source: Population Reference Bureau analysis of data from the US Census Bureau for the Annie E. Casey Foundation
1999 Income in Dollars as Reported in Census 2000
• •
•
•
Source: US Census Bureau, Census 2000, SF3 Tables P82, P53, P80 and PCT39
Number NumberPercent Percent
Source: US Census Bureau, Census 2000, SF1 and SF3;Florida Almanac, 2002/2003; Florida County Atlas, 1994
118Center for the Study of Children’s Futures 2004
43,092 100.0 55,425 100.0
22,166 51.4 28,594 51.6
20,926 48.6 26,831 48.4
12,312 28.6 13,488 24.3
30,780 71.4 41,937 75.7
N/A N/A 53,963 97.4
33,652 78.1 41,600 75.1
8,622 20.0 9,939 17.9
147 0.3 316 0.6
N/A N/A 421 0.8
N/A N/A 19 0.0
391 0.9 1,668 3.0
N/A N/A 1,462 2.6
1,764 4.1 5,126 9.2
41,328 95.9 50,299 90.8
32,374 75.1 38,750 69.9
8,954 20.8 11,549 20.8
42,973 99.7 54,990 99.2
119 0.3 435 0.8
9,755 22.6 15,241 27.5
28,182 65.4 33,014 59.6
Per Capita Income .................... 17,848 Median Family Income .............................. 37,473
Median Household Income ...... 31,944 with own children under age 18 ............. 36,974
Median Nonfamily Income....... 18,951 without own children under age 18 ........ 37,742
M arion County was established in 1844 fromportions of Alachua and Mosquito counties.The county seat is Ocala. This central Florida
County is known as a popular place to breed and raiseracehorses, including Kentucky Derby winners.Attractions include Silver Springs and the OcalaNational Forest. Additional industries includeelectronics, health care, van conversions, rubber hosesand communication equipment.
The county comprises 1,579 square miles of land and waspopulated by 258,916 persons in 2000. There were 164persons per square mile and the general populationincreased by 33 percent from 1990. Thirty-nine percent ofthe population lived in a rural area. The median age in 2000was 44 years.
There were 122,663 housing units reported with ahomeownership rate of 80 percent. Twenty-eight percent ofhouseholds included at least one person under the age of 18years. Annual income was less than $25,000 in 38 percentof all 106,707 households and 31 percent of the 26,787family households with their own children. Six percent ofall households had earnings of $100,000 or greater.
Twenty-two percent of persons age 25 and over did notgraduate from high school and 36 percent graduated withno further education indicated. Fourteen percent obtained abachelor’s degree or higher. Of 16,459 persons age 18 to 24years, 68 percent were high school graduates. Elevenpercent of persons 16 to 19 years old were not in schooland not working.
Children under age 18 represented 21 percent of thepopulation in Marion County, and 21 percent of childrenlived in poverty. Of the 32,918 persons of all ages living inpoverty, 34 percent were under the age of 18 years. Forty-eight percent of children lived in low-income householdsand 13 percent lived in high poverty neighborhoods.

Multi-Year Trend Data
** method used for calculating changed in 1998Source: Florida Department of Health, Office of Vital Statistics;Florida Department of Education
1992 1993 1994 1995 1996 1997 1998 1999 2000
Children Under Age 6 Below 100% of PovertyGrandparents Responsible 3 or More Years
100
75
50
25
0
Child
ren
Age 3
& 4
Enrol
led
in S
choo
lO
wn Chi
ldre
n Und
er A
ge 6
with
All Par
ents
in th
e La
bor F
orce
Child
ren
Under
Age
6
Below
200
% o
f Pov
erty
Gra
ndpa
rent
s Res
pons
ible
for
and
Livin
g with
Own
Gra
ndch
ildre
n Und
er A
ge 1
8
Own
Child
ren
Under
Age
6
Livin
g in
Sin
gle
Paren
t Hom
es
Per
cent
Source: US Census Bureau, Census 2000, SF1 and SF3
Critical MeasuresCensus 2000
Birth Rate
Teen Birth Rate Age 15-17
Teen Birth Rate Age 15-19
Percent of Births Receiving Early Prenatal Care
Percent of Low Birthweight Births
Percent of Births to Unwed Mothers
Infant Mortality Rate
Teen Violent Death Rate Age 15-19
Percent of Students Eligible for Free/Reduced Lunch
Graduation Rate**
Source: Policy and Services Research Data Center, de la Parte Institute, USF, 2002
Beh
avio
ral H
ealth
and
Juv
enile
Jus
tice
Source: Florida Department of Juvenile Justice, 2003
Source: Florida Department of Juvenile Justice, 2000/01
Chi
ld C
are,
Hea
d S
tart
and
Edu
catio
n
Source: Florida Department of Education, 2001/02
Source: Florida Children’s Forum, 2001
119 Center for the Study of Children’s Futures 2004
12.2 12.6 11.9 11.8 10.7 11.4 11.2 11.0 11.3
40.8 50.3 51.1 47.0 45.1 43.8 44.1 39.7 27.9
70.8 77.5 74.0 72.1 69.4 72.4 70.5 73.8 65.2
63.1 71.9 66.2 72.7 78.4 80.3 77.4 76.6 74.5
7.6 7.9 7.6 7.1 6.8 8.3 7.9 8.4 7.6
38.0 39.0 39.5 38.9 38.8 40.2 39.0 41.7 43.3
5.9 12.2 8.8 13.1 7.6 7.7 8.0 9.4 6.5
12.1 9.5 6.0 7.5 3.9 10.3 8.7 9.8 9.0
43.3 46.1 50.5 50.4 50.9 51.5 50.6 46.2 50.9
74.9 67.0 66.0 68.7 76.8 71.9 57.9 60.3 65.2
48.6
25.8
60.9
51.0 51.1
Marion County
46 licensed child care centers with a capacity for 5,305 children
137 licensed family child care homes with a capacity for 1,264 children
35 Head Start and Early Head Start programs with a capacity for 567 children
39,330 children were enrolled in 65 public schools
7,779 children were enrolled in exceptional student education programs
998 children were referred to English for Speakers of Other Languages Programs
4,834 children were enrolled in 37 non-public schools
1,243 children and families were registered in 881 home education programs
2,174 children received behavioral health services
29 behavioral health service providers served children
1,888 youths were referred to the juvenile justice system
24 youths were transferred to adult court
2 contracted delinquency prevention programs with 44 beds or slots
1 state grant funded delinquency prevention program projected to serve 500 youths
5 probation and community corrections non-residential programs with 394 slots
3 residential and correctional programs with 187 beds
1 detention center with 88 beds

Number Percent Number Percent
Summary Profile for the Population Under Age 18, 1990 to 2000
1990 2000
Age & Sex
Population Under Age 18
Males Under Age 18
Females Under Age 18
Population Under Age 5
Population Age 5 - 17
Race
Children of One Race
White Children
Black or African American Children
American Indian or Alaska Native Children
Asian Children
Native Hawaiian or Other Pacific Islander Children
Children of Some Other Race
Children of Two or More Races
Hispanic Origin Status
Hispanic Children
Non-Hispanic Children
Non-Hispanic White Children
Non-Hispanic Racial Minorities
Living Arrangements
Children Living in Households
Children Living in Group Quarters
Own Children Living in Single Parent Households
Own Children Living in Married Couple Households
Source: Population Reference Bureau analysis of data from the US Census Bureau for the Annie E. Casey Foundation
1999 Income in Dollars as Reported in Census 2000
• •
•
•
Source: US Census Bureau, Census 2000, SF3 Tables P82, P53, P80 and PCT39
Number NumberPercent Percent
Source: US Census Bureau, Census 2000, SF1 and SF3;Florida Almanac, 2002/2003; Florida County Atlas, 1994
120Center for the Study of Children’s Futures 2004
17,738 100.0 23,623 100.0
9,093 51.3 12,166 51.5
8,645 48.7 11,457 48.5
5,162 29.1 5,599 23.7
12,576 70.9 18,024 76.3
N/A N/A 23,053 97.6
14,939 84.2 19,332 81.8
1,859 10.5 2,076 8.8
52 0.3 130 0.6
N/A N/A 168 0.7
N/A N/A 52 0.2
721 4.1 1,295 5.5
N/A N/A 570 2.4
1,518 8.6 3,400 14.4
16,220 91.4 20,223 85.6
14,191 80.0 17,594 74.5
2,029 11.4 2,629 11.1
17,685 99.7 23,521 99.6
53 0.3 102 0.4
3,289 18.5 5,300 22.4
12,757 71.9 16,111 68.2
Per Capita Income .................... 29,584 Median Family Income .............................. 53,244
Median Household Income ...... 43,083 with own children under age 18 ............. 50,327
Median Nonfamily Income....... 26,136 without own children under age 18 ........ 54,869
M artin County was established in 1925 from aportion of Palm Beach County and wasnamed for John W. Martin, governor from
1925 to 1929. High sand dunes along the Atlanticshoreline and the Hobe Sound National Wildlife Refugeare well-known assets. Health care, aerospace, andtourism are major industries. Stuart is the county seat.
The county comprises 556 square miles of land and waspopulated by 126,731 persons in 2000. There were 228persons per square mile and the general populationincreased by 26 percent from 1990. Eleven percent of thepopulation lived in a rural area. The median age in 2000was 47 years.
There were 65,471 housing units reported with ahomeownership rate of 80 percent. Twenty-three percent ofhouseholds included at least one person under the age of 18years. Annual income was less than $25,000 in 27 percentof all 55,379 households and 19 percent of the 12,137family households with their own children. Fifteen percentof all households had earnings of $100,000 or greater.
Fifteen percent of persons age 25 and over did not graduatefrom high school and 28 percent graduated with no furthereducation indicated. Twenty-six percent obtained abachelor’s degree or higher. Of 6,755 persons age 18 to 24years, 58 percent were high school graduates. Elevenpercent of persons 16 to 19 years old were not in schooland not working.
Children under age 18 represented 19 percent of thepopulation in Martin County, and 14 percent of childrenlived in poverty. Of the 10,844 persons of all ages living inpoverty, 30 percent were under the age of 18 years. Thirty-four percent of children lived in low-income householdsand 19 percent lived in high poverty neighborhoods.

Multi-Year Trend Data
** method used for calculating changed in 1998Source: Florida Department of Health, Office of Vital Statistics;Florida Department of Education
1992 1993 1994 1995 1996 1997 1998 1999 2000
Children Under Age 6 Below 100% of PovertyGrandparents Responsible 3 or More Years
100
75
50
25
0
Child
ren
Age 3
& 4
Enrol
led
in S
choo
lO
wn Chi
ldre
n Und
er A
ge 6
with
All Par
ents
in th
e La
bor F
orce
Child
ren
Under
Age
6
Below
200
% o
f Pov
erty
Gra
ndpa
rent
s Res
pons
ible
for
and
Livin
g with
Own
Gra
ndch
ildre
n Und
er A
ge 1
8
Own
Child
ren
Under
Age
6
Livin
g in
Sin
gle
Paren
t Hom
es
Per
cent
Source: US Census Bureau, Census 2000, SF1 and SF3
Critical MeasuresCensus 2000
Birth Rate
Teen Birth Rate Age 15-17
Teen Birth Rate Age 15-19
Percent of Births Receiving Early Prenatal Care
Percent of Low Birthweight Births
Percent of Births to Unwed Mothers
Infant Mortality Rate
Teen Violent Death Rate Age 15-19
Percent of Students Eligible for Free/Reduced Lunch
Graduation Rate**
Source: Policy and Services Research Data Center, de la Parte Institute, USF, 2002
Beh
avio
ral H
ealth
and
Juv
enile
Jus
tice
Source: Florida Department of Juvenile Justice, 2003
Source: Florida Department of Juvenile Justice, 2000/01
Chi
ld C
are,
Hea
d S
tart
and
Edu
catio
n
Source: Florida Department of Education, 2001/02
Source: Florida Children’s Forum, 2001
121 Center for the Study of Children’s Futures 2004
11.5 11.0 10.3 9.8 9.8 9.5 9.3 9.8 9.9
32.4 34.3 35.6 35.3 27.9 25.8 40.0 27.1 24.0
57.2 68.1 63.2 46.5 48.8 44.4 54.0 43.6 56.1
70.8 71.5 75.7 79.0 84.1 82.4 76.4 75.3 74.2
5.4 6.0 7.2 7.6 7.3 5.8 5.9 6.9 6.3
33.0 34.4 36.4 34.0 32.7 32.6 34.3 33.7 37.0
8.2 6.7 12.3 5.5 3.5 6.3 9.0 9.2 8.1
0.0 8.3 8.2 1.9 3.8 3.6 5.3 3.4 4.8
20.6 29.9 31.8 36.3 30.6 30.4 28.3 30.9 30.3
74.0 74.8 79.8 70.9 78.1 68.3 60.6 83.3 85.4
57.0
19.0
55.6
38.4 40.4
Martin County
39 licensed child care centers with a capacity for 3,333 children
2 licensed family child care homes with a capacity for 20 children
13 Head Start programs with a capacity for 245 children
16,792 children were enrolled in 38 public schools
3,386 children were enrolled in exceptional student education programs
1,406 children were referred to English for Speakers of Other Languages Programs
2,144 children were enrolled in 12 non-public schools
468 children and families were registered in 366 home education programs
1,101 children received behavioral health services
24 behavioral health service providers served children
826 youths were referred to the juvenile justice system
14 youths were transferred to adult court
0 contracted delinquency prevention programs
1 state grant funded delinquency prevention program projected to serve 200 youths
1 probation and community corrections non-residential program with 25 slots
2 residential and correctional programs with 79 beds
0 detention centers

Number Percent Number Percent
Summary Profile for the Population Under Age 18, 1990 to 2000
1990 2000
Age & Sex
Population Under Age 18
Males Under Age 18
Females Under Age 18
Population Under Age 5
Population Age 5 - 17
Race
Children of One Race
White Children
Black or African American Children
American Indian or Alaska Native Children
Asian Children
Native Hawaiian or Other Pacific Islander Children
Children of Some Other Race
Children of Two or More Races
Hispanic Origin Status
Hispanic Children
Non-Hispanic Children
Non-Hispanic White Children
Non-Hispanic Racial Minorities
Living Arrangements
Children Living in Households
Children Living in Group Quarters
Own Children Living in Single Parent Households
Own Children Living in Married Couple Households
Source: Population Reference Bureau analysis of data from the US Census Bureau for the Annie E. Casey Foundation
1999 Income in Dollars as Reported in Census 2000
• •
•
•
Source: US Census Bureau, Census 2000, SF3 Tables P82, P53, P80 and PCT39
Number NumberPercent Percent
Source: US Census Bureau, Census 2000, SF1 and SF3;Florida Almanac, 2002/2003; Florida County Atlas, 1994
122Center for the Study of Children’s Futures 2004
13,555 100.0 13,605 100.0
7,034 51.9 7,107 52.2
6,521 48.1 6,498 47.8
4,472 33.0 3,462 25.4
9,083 67.0 10,143 74.6
N/A N/A 13,180 96.9
11,831 87.3 11,692 85.9
1,242 9.2 1,002 7.4
53 0.4 47 0.3
N/A N/A 119 0.9
N/A N/A 8 0.1
268 2.0 312 2.3
N/A N/A 425 3.1
2,302 17.0 3,100 22.8
11,253 83.0 10,505 77.2
9,906 73.1 9,078 66.7
1,347 9.9 1,427 10.5
13,378 98.7 13,582 99.8
177 1.3 23 0.2
2,481 18.3 3,326 24.4
9,528 70.3 8,893 65.4
Per Capita Income .................... 26,102 Median Family Income .............................. 50,734
Median Household Income ...... 42,283 with own children under age 18 ............. 47,614
Median Nonfamily Income....... 31,104 without own children under age 18 ........ 51,888
M onroe County was established in 1823 from aportion of St. Johns County and was namedfor James Monroe, the fifth U.S. President.
The county seat is Key West and a popular tourist areawith localized interest and international flair. Thecounty consists of the southwest tip of the Floridapeninsula and the unique Florida Keys. The portion onthe mainland includes the Everglades National Park.This county consists of many parks and wildliferefuges.
The county comprises 997 square miles of land and waspopulated by 79,589 persons in 2000. There were 80persons per square mile and the general populationincreased by 2 percent from 1990. Seven percent of thepopulation lived in a rural area. The median age in 2000was 43 years.
There were 51,617 housing units reported with ahomeownership rate of 62 percent. Twenty-three percent ofhouseholds included at least one person under the age of 18years. Annual income was less than $25,000 in 27 percentof all 35,106 households and 21 percent of the 7,542 familyhouseholds with their own children. Twelve percent of allhouseholds had earnings of $100,000 or greater.
Fifteen percent of persons age 25 and over did not graduatefrom high school and 29 percent graduated with no furthereducation indicated. Twenty-five percent obtained abachelor’s degree or higher. Of 4,978 persons age 18 to 24years, 72 percent were high school graduates. Nine percentof persons 16 to 19 years old were not in school and notworking.
Children under age 18 represented 17 percent of thepopulation in Monroe County, and 12 percent of childrenlived in poverty. Of the 7,977 persons of all ages living inpoverty, 20 percent were under the age of 18 years. Thirty-three percent of children lived in low-income householdsand no children lived in high poverty neighborhoods.

Multi-Year Trend Data
** method used for calculating changed in 1998Source: Florida Department of Health, Office of Vital Statistics;Florida Department of Education
1992 1993 1994 1995 1996 1997 1998 1999 2000
Children Under Age 6 Below 100% of PovertyGrandparents Responsible 3 or More Years
100
75
50
25
0
Child
ren
Age 3
& 4
Enrol
led
in S
choo
lO
wn Chi
ldre
n Und
er A
ge 6
with
All Par
ents
in th
e La
bor F
orce
Child
ren
Under
Age
6
Below
200
% o
f Pov
erty
Gra
ndpa
rent
s Res
pons
ible
for
and
Livin
g with
Own
Gra
ndch
ildre
n Und
er A
ge 1
8
Own
Child
ren
Under
Age
6
Livin
g in
Sin
gle
Paren
t Hom
es
Per
cent
Source: US Census Bureau, Census 2000, SF1 and SF3
Critical MeasuresCensus 2000
Birth Rate
Teen Birth Rate Age 15-17
Teen Birth Rate Age 15-19
Percent of Births Receiving Early Prenatal Care
Percent of Low Birthweight Births
Percent of Births to Unwed Mothers
Infant Mortality Rate
Teen Violent Death Rate Age 15-19
Percent of Students Eligible for Free/Reduced Lunch
Graduation Rate**
Source: Policy and Services Research Data Center, de la Parte Institute, USF, 2002
Beh
avio
ral H
ealth
and
Juv
enile
Jus
tice
Source: Florida Department of Juvenile Justice, 2003
Source: Florida Department of Juvenile Justice, 2000/01
Chi
ld C
are,
Hea
d S
tart
and
Edu
catio
n
Source: Florida Department of Education, 2001/02
Source: Florida Children’s Forum, 2001
123 Center for the Study of Children’s Futures 2004
12.1 12.4 11.0 9.9 10.4 9.5 8.2 9.2 9.0
39.1 44.9 31.1 29.2 24.0 21.5 26.2 17.5 27.1
70.8 54.6 54.5 51.1 46.2 47.6 40.6 31.3 48.7
87.4 86.8 86.6 91.3 93.6 92.3 90.1 87.2 83.6
6.8 6.0 6.0 4.8 7.3 5.3 5.6 5.1 5.2
26.2 27.0 31.8 32.0 32.1 35.4 30.1 31.5 33.3
5.1 5.9 4.4 3.6 5.7 5.0 1.4 2.5 8.8
6.0 6.0 6.0 5.8 2.9 2.7 5.3 7.7 2.7
28.0 31.5 34.6 34.3 35.0 34.0 33.4 33.0 36.0
33.1 70.8 66.5 77.5 77.3 73.5 71.0 72.0 68.5
56.0
21.1
65.1
35.639.3
Monroe County
38 licensed child care centers with a capacity for 2,436 children
0 licensed family child care homes
9 Head Start programs with a capacity for 215 children
9,264 children were enrolled in 23 public schools
1,824 children were enrolled in exceptional student education programs
652 children were referred to English for Speakers of Other Languages Programs
823 children were enrolled in 8 non-public schools
273 children and families were registered in 200 home education programs
6,137 children received behavioral health services
18 behavioral health service providers served children
355 youths were referred to the juvenile justice system
13 youths were transferred to adult court
2 contracted delinquency prevention programs with 54 beds or slots
1 state grant funded delinquency prevention program projected to serve 135 youths
2 probation and community corrections non-residential programs with 58 slots
0 residential and correctional programs
0 detention centers

Number Percent Number Percent
Summary Profile for the Population Under Age 18, 1990 to 2000
1990 2000
Age & Sex
Population Under Age 18
Males Under Age 18
Females Under Age 18
Population Under Age 5
Population Age 5 - 17
Race
Children of One Race
White Children
Black or African American Children
American Indian or Alaska Native Children
Asian Children
Native Hawaiian or Other Pacific Islander Children
Children of Some Other Race
Children of Two or More Races
Hispanic Origin Status
Hispanic Children
Non-Hispanic Children
Non-Hispanic White Children
Non-Hispanic Racial Minorities
Living Arrangements
Children Living in Households
Children Living in Group Quarters
Own Children Living in Single Parent Households
Own Children Living in Married Couple Households
Source: Population Reference Bureau analysis of data from the US Census Bureau for the Annie E. Casey Foundation
1999 Income in Dollars as Reported in Census 2000
• •
•
•
Source: US Census Bureau, Census 2000, SF3 Tables P82, P53, P80 and PCT39
Number NumberPercent Percent
Source: US Census Bureau, Census 2000, SF1 and SF3;Florida Almanac, 2002/2003; Florida County Atlas, 1994
124Center for the Study of Children’s Futures 2004
11,904 100.0 14,439 100.0
6,133 51.5 7,404 51.3
5,771 48.5 7,035 48.7
3,254 27.3 3,565 24.7
8,650 72.7 10,874 75.3
N/A N/A 14,232 98.6
10,323 86.7 12,737 88.2
1,488 12.5 1,294 9.0
34 0.3 46 0.3
N/A N/A 70 0.5
N/A N/A 7 0.0
30 0.3 78 0.5
N/A N/A 207 1.4
174 1.5 304 2.1
11,730 98.5 14,135 97.9
10,184 85.6 12,557 87.0
1,546 13.0 1,578 10.9
11,826 99.3 14,390 99.7
78 0.7 49 0.3
1,867 15.7 2,807 19.4
8,636 72.5 9,922 68.7
Per Capita Income .................... 22,836 Median Family Income .............................. 52,477
Median Household Income ...... 46,022 with own children under age 18 ............. 50,841
Median Nonfamily Income....... 25,237 without own children under age 18 ........ 54,059
Nassau County was established in 1824 from St.Johns County and named for Nassau Sound.This county is in the northeastern tip of the
state, and its eastern border is the Atlantic Ocean. FortClinch is a major attraction and paper products andtourism are the primary industries. The county seat isFernandina Beach.
The county comprises 652 square miles of land and waspopulated by 57,663 persons in 2000. There were 89persons per square mile and the general populationincreased by 31 percent from 1990. Fifty-one percent of thepopulation lived in a rural area. The median age in 2000was 38 years.
There were 25,917 housing units reported with ahomeownership rate of 81 percent. Thirty-seven percent ofhouseholds included at least one person under the age of 18years. Annual income was less than $25,000 in 24 percentof all 21,952 households and 18 percent of the 7,397 familyhouseholds with their own children. Eleven percent of allhouseholds had earnings of $100,000 or greater.
Nineteen percent of persons age 25 and over did notgraduate from high school and 34 percent graduated withno further education indicated. Nineteen percent obtained abachelor’s degree or higher. Of 4,271 persons age 18 to 24years, 70 percent were high school graduates. Ten percentof persons 16 to 19 years old were not in school and notworking.
Children under age 18 represented 25 percent of thepopulation in Nassau County, and 12 percent of childrenlived in poverty. Of the 5,192 persons of all ages living inpoverty, 31 percent were under the age of 18 years. Thirty-two percent of children lived in low-income householdsand no children lived in high poverty neighborhoods.

Multi-Year Trend Data
** method used for calculating changed in 1998Source: Florida Department of Health, Office of Vital Statistics;Florida Department of Education
1992 1993 1994 1995 1996 1997 1998 1999 2000
Children Under Age 6 Below 100% of PovertyGrandparents Responsible 3 or More Years
100
75
50
25
0
Child
ren
Age 3
& 4
Enrol
led
in S
choo
lO
wn Chi
ldre
n Und
er A
ge 6
with
All Par
ents
in th
e La
bor F
orce
Child
ren
Under
Age
6
Below
200
% o
f Pov
erty
Gra
ndpa
rent
s Res
pons
ible
for
and
Livin
g with
Own
Gra
ndch
ildre
n Und
er A
ge 1
8
Own
Child
ren
Under
Age
6
Livin
g in
Sin
gle
Paren
t Hom
es
Per
cent
Source: US Census Bureau, Census 2000, SF1 and SF3
Critical MeasuresCensus 2000
Birth Rate
Teen Birth Rate Age 15-17
Teen Birth Rate Age 15-19
Percent of Births Receiving Early Prenatal Care
Percent of Low Birthweight Births
Percent of Births to Unwed Mothers
Infant Mortality Rate
Teen Violent Death Rate Age 15-19
Percent of Students Eligible for Free/Reduced Lunch
Graduation Rate**
Source: Policy and Services Research Data Center, de la Parte Institute, USF, 2002
Beh
avio
ral H
ealth
and
Juv
enile
Jus
tice
Source: Florida Department of Juvenile Justice, 2003
Source: Florida Department of Juvenile Justice, 2000/01
Chi
ld C
are,
Hea
d S
tart
and
Edu
catio
n
Source: Florida Department of Education, 2001/02
Source: Florida Children’s Forum, 2001
125 Center for the Study of Children’s Futures 2004
15.7 13.9 13.6 14.1 13.7 13.1 13.6 13.2 12.6
36.0 39.9 34.3 32.5 33.7 26.6 20.7 30.3 27.4
62.9 68.4 58.2 60.7 66.3 56.9 51.5 57.0 48.9
82.8 86.3 85.9 85.3 89.1 88.0 90.7 90.8 90.7
7.4 7.6 6.3 9.2 9.7 8.2 7.4 9.4 7.0
28.9 28.5 26.3 29.7 27.7 29.7 25.5 29.5 28.0
11.1 15.5 3.1 4.3 10.0 2.9 5.4 6.6 9.4
6.1 12.2 15.3 5.8 11.2 10.6 12.9 7.3 12.8
27.0 29.9 32.1 31.6 31.3 29.8 31.8 30.2 33.2
75.8 67.3 61.3 72.6 72.7 72.8 73.7 67.9 55.1
45.3
17.8
54.6
34.8
51.7
Nassau County
37 licensed child care centers with a capacity for 979 children
24 licensed family child care homes with a capacity for 108 children
2 Head Start programs with a capacity for 80 children
10,441 children were enrolled in 20 public schools
1,925 children were enrolled in exceptional student education programs
29 children were referred to English for Speakers of Other Languages Programs
900 children were enrolled in 10 non-public schools
284 children and families were registered in 194 home education programs
1,574 children received behavioral health services
15 behavioral health service providers served children
344 youths were referred to the juvenile justice system
2 youths were transferred to adult court
0 contracted delinquency prevention programs
1 state grant funded delinquency prevention program projected to serve 135 youths
0 probation and community corrections non-residential programs
3 residential and correctional programs with 57 beds
0 detention centers

Number Percent Number Percent
Summary Profile for the Population Under Age 18, 1990 to 2000
1990 2000
Age & Sex
Population Under Age 18
Males Under Age 18
Females Under Age 18
Population Under Age 5
Population Age 5 - 17
Race
Children of One Race
White Children
Black or African American Children
American Indian or Alaska Native Children
Asian Children
Native Hawaiian or Other Pacific Islander Children
Children of Some Other Race
Children of Two or More Races
Hispanic Origin Status
Hispanic Children
Non-Hispanic Children
Non-Hispanic White Children
Non-Hispanic Racial Minorities
Living Arrangements
Children Living in Households
Children Living in Group Quarters
Own Children Living in Single Parent Households
Own Children Living in Married Couple Households
Source: Population Reference Bureau analysis of data from the US Census Bureau for the Annie E. Casey Foundation
1999 Income in Dollars as Reported in Census 2000
• •
•
•
Source: US Census Bureau, Census 2000, SF3 Tables P82, P53, P80 and PCT39
Number NumberPercent Percent
Source: US Census Bureau, Census 2000, SF1 and SF3;Florida Almanac, 2002/2003; Florida County Atlas, 1994
126Center for the Study of Children’s Futures 2004
37,315 100.0 42,133 100.0
19,025 51.0 21,512 51.1
18,290 49.0 20,621 48.9
11,225 30.1 10,843 25.7
26,090 69.9 31,290 74.3
N/A N/A 39,628 94.1
31,046 83.2 33,026 78.4
4,560 12.2 4,790 11.4
217 0.6 254 0.6
N/A N/A 733 1.7
N/A N/A 68 0.2
389 1.0 757 1.8
N/A N/A 2,505 5.9
1,383 3.7 2,393 5.7
35,932 96.3 39,740 94.3
30,157 80.8 31,799 75.5
5,775 15.5 7,941 18.8
37,297 100.0 41,884 99.4
18 0.0 249 0.6
6,583 17.6 9,423 22.4
28,172 75.5 29,030 68.9
Per Capita Income .................... 20,918 Median Family Income .............................. 47,711
Median Household Income ...... 41,474 with own children under age 18 ............. 41,621
Median Nonfamily Income....... 27,232 without own children under age 18 ........ 52,547
Okaloosa County was established in 1915 fromportions of Santa Rosa and Walton counties.The county seat is Crestview. This panhandle
county is known for its white quartz sand beachesalong the Gulf of Mexico and Eglin Air Force Base.The largest private employers are in electronics andhealth care.
The county comprises 936 square miles of land and waspopulated by 170,498 persons in 2000. There were 182persons per square mile and the general populationincreased by 19 percent from 1990. Twelve percent of thepopulation lived in a rural area. The median age in 2000was 36 years.
There were 78,593 housing units reported with ahomeownership rate of 66 percent. Thirty-six percent ofhouseholds included at least one person under the age of18 years. Annual income was less than $25,000 in 26percent of all 66,373 households and 25 percent of the22,403 family households with their own children. Ninepercent of all households had earnings of $100,000 orgreater.
Twelve percent of persons age 25 and over did notgraduate from high school and 27 percent graduated withno further education indicated. Twenty-four percentobtained a bachelor’s degree or higher. Of 16,263 personsage 18 to 24 years, 80 percent were high school graduates.Six percent of persons 16 to 19 years old were not inschool and not working.
Children under age 18 represented 25 percent of thepopulation in Okaloosa County, and 13 percent of childrenlived in poverty. Of the 14,562 persons of all ages living inpoverty, 37 percent were under the age of 18 years. Thirty-eight percent of children lived in low-income householdsand 2 percent lived in high poverty neighborhoods.

Multi-Year Trend Data
** method used for calculating changed in 1998Source: Florida Department of Health, Office of Vital Statistics;Florida Department of Education
1992 1993 1994 1995 1996 1997 1998 1999 2000
Children Under Age 6 Below 100% of PovertyGrandparents Responsible 3 or More Years
100
75
50
25
0
Child
ren
Age 3
& 4
Enrol
led
in S
choo
lO
wn Chi
ldre
n Und
er A
ge 6
with
All Par
ents
in th
e La
bor F
orce
Child
ren
Under
Age
6
Below
200
% o
f Pov
erty
Gra
ndpa
rent
s Res
pons
ible
for
and
Livin
g with
Own
Gra
ndch
ildre
n Und
er A
ge 1
8
Own
Child
ren
Under
Age
6
Livin
g in
Sin
gle
Paren
t Hom
es
Per
cent
Source: US Census Bureau, Census 2000, SF1 and SF3
Critical MeasuresCensus 2000
Birth Rate
Teen Birth Rate Age 15-17
Teen Birth Rate Age 15-19
Percent of Births Receiving Early Prenatal Care
Percent of Low Birthweight Births
Percent of Births to Unwed Mothers
Infant Mortality Rate
Teen Violent Death Rate Age 15-19
Percent of Students Eligible for Free/Reduced Lunch
Graduation Rate**
Source: Policy and Services Research Data Center, de la Parte Institute, USF, 2002
Beh
avio
ral H
ealth
and
Juv
enile
Jus
tice
Source: Florida Department of Juvenile Justice, 2003
Source: Florida Department of Juvenile Justice, 2000/01
Chi
ld C
are,
Hea
d S
tart
and
Edu
catio
n
Source: Florida Department of Education, 2001/02
Source: Florida Children’s Forum, 2001
127 Center for the Study of Children’s Futures 2004
17.1 15.8 15.3 15.0 14.2 13.3 13.2 12.6 12.8
35.7 31.5 32.3 34.1 30.8 27.3 34.7 23.2 27.0
58.1 58.6 58.9 63.6 52.4 48.9 55.6 55.5 56.2
82.6 82.4 81.5 82.3 85.2 84.1 83.9 85.1 82.6
6.5 6.8 6.4 6.4 6.7 6.6 7.6 7.1 7.0
19.6 21.2 23.3 22.8 24.3 24.5 26.7 28.4 29.5
10.1 7.5 6.6 5.7 9.7 7.4 10.7 5.7 6.4
6.9 1.9 1.9 3.8 9.4 4.4 3.4 0.8 1.6
30.3 31.8 31.5 30.9 29.8 28.7 27.9 27.8 27.6
90.3 89.6 87.0 82.1 82.7 78.9 77.1 77.5 76.8
50.2
19.9
58.2
46.152.3
Okaloosa County
67 licensed child care centers with a capacity for 5,892 children
37 licensed family child care homes with a capacity for 336 children
20 Head Start and Early Head Start programs with a capacity for 344 children
30,792 children were enrolled in 56 public schools
6,451 children were enrolled in exceptional student education programs
160 children were referred to English for Speakers of Other Languages Programs
2,313 children were enrolled in 12 non-public schools
806 children and families were registered in 545 home education programs
1,347 children received behavioral health services
15 behavioral health service providers served children
1,248 youths were referred to the juvenile justice system
29 youths were transferred to adult court
1 contracted delinquency prevention program with 4 beds or slots
2 state grant funded delinquency prevention programs projected to serve 110 youths
1 probation and community corrections non-residential program with 40 slots
5 residential and correctional programs with 309 beds
1 detention center with 50 beds

Number Percent Number Percent
Summary Profile for the Population Under Age 18, 1990 to 2000
1990 2000
Age & Sex
Population Under Age 18
Males Under Age 18
Females Under Age 18
Population Under Age 5
Population Age 5 - 17
Race
Children of One Race
White Children
Black or African American Children
American Indian or Alaska Native Children
Asian Children
Native Hawaiian or Other Pacific Islander Children
Children of Some Other Race
Children of Two or More Races
Hispanic Origin Status
Hispanic Children
Non-Hispanic Children
Non-Hispanic White Children
Non-Hispanic Racial Minorities
Living Arrangements
Children Living in Households
Children Living in Group Quarters
Own Children Living in Single Parent Households
Own Children Living in Married Couple Households
Source: Population Reference Bureau analysis of data from the US Census Bureau for the Annie E. Casey Foundation
1999 Income in Dollars as Reported in Census 2000
• •
•
•
Source: US Census Bureau, Census 2000, SF3 Tables P82, P53, P80 and PCT39
Number NumberPercent Percent
Source: US Census Bureau, Census 2000, SF1 and SF3;Florida Almanac, 2002/2003; Florida County Atlas, 1994
128Center for the Study of Children’s Futures 2004
8,050 100.0 9,051 100.0
4,328 53.8 4,866 53.8
3,722 46.2 4,185 46.2
2,284 28.4 2,255 24.9
5,766 71.6 6,796 75.1
N/A N/A 8,783 97.0
6,127 76.1 6,587 72.8
821 10.2 798 8.8
49 0.6 68 0.8
N/A N/A 68 0.8
N/A N/A 7 0.1
993 12.3 1,255 13.9
N/A N/A 268 3.0
1,435 17.8 2,411 26.6
6,615 82.2 6,640 73.4
5,689 70.7 5,608 62.0
926 11.5 1,032 11.4
7,800 96.9 8,803 97.3
250 3.1 248 2.7
1,482 18.4 2,091 23.1
5,251 65.2 5,322 58.8
Per Capita Income .................... 14,553 Median Family Income .............................. 35,163
Median Household Income ...... 30,456 with own children under age 18 ............. 35,662
Median Nonfamily Income....... 18,675 without own children under age 18 ........ 34,862
Okeechobee County was established in 1917from portions of Osceola and Brevard counties.The name is derived from two Hitchiti words,
Oki meaning water and Chobi meaning big. The greatLake Okeechobee borders the county. Farming,commercial fishing, and dairying are the primaryindustries. The county seat is Okeechobee.
The county comprises 774 square miles of land and waspopulated by 35,910 persons in 2000. There were 46persons per square mile and the general populationincreased by 21 percent from 1990. Forty-three percent ofthe population lived in a rural area. The median age in 2000was 37 years.
There were 15,504 housing units reported with ahomeownership rate of 75 percent. Thirty-five percent ofhouseholds included at least one person under the age of 18years. Annual income was less than $25,000 in 40 percentof all 12,614 households and 33 percent of the 3,932 familyhouseholds with their own children. Five percent of allhouseholds had earnings of $100,000 or greater.
Thirty-five percent of persons age 25 and over did notgraduate from high school and 34 percent graduated withno further education indicated. Nine percent obtained abachelor’s degree or higher. Of 3,481 persons age 18 to 24years, 44 percent were high school graduates. Seventeenpercent of persons 16 to 19 years old were not in schooland not working.
Children under age 18 represented 25 percent of thepopulation in Okeechobee County, and 21 percent ofchildren lived in poverty. Of the 5,391 persons of all agesliving in poverty, 34 percent were under the age of 18years. Fifty-five percent of children lived in low-incomehouseholds and 35 percent lived in high povertyneighborhoods.

Multi-Year Trend Data
** method used for calculating changed in 1998Source: Florida Department of Health, Office of Vital Statistics;Florida Department of Education
1992 1993 1994 1995 1996 1997 1998 1999 2000
Children Under Age 6 Below 100% of PovertyGrandparents Responsible 3 or More Years
100
75
50
25
0
Child
ren
Age 3
& 4
Enrol
led
in S
choo
lO
wn Chi
ldre
n Und
er A
ge 6
with
All Par
ents
in th
e La
bor F
orce
Child
ren
Under
Age
6
Below
200
% o
f Pov
erty
Gra
ndpa
rent
s Res
pons
ible
for
and
Livin
g with
Own
Gra
ndch
ildre
n Und
er A
ge 1
8
Own
Child
ren
Under
Age
6
Livin
g in
Sin
gle
Paren
t Hom
es
Per
cent
Source: US Census Bureau, Census 2000, SF1 and SF3
Critical MeasuresCensus 2000
Birth Rate
Teen Birth Rate Age 15-17
Teen Birth Rate Age 15-19
Percent of Births Receiving Early Prenatal Care
Percent of Low Birthweight Births
Percent of Births to Unwed Mothers
Infant Mortality Rate
Teen Violent Death Rate Age 15-19
Percent of Students Eligible for Free/Reduced Lunch
Graduation Rate**
Source: Policy and Services Research Data Center, de la Parte Institute, USF, 2002
Beh
avio
ral H
ealth
and
Juv
enile
Jus
tice
Source: Florida Department of Juvenile Justice, 2003
Source: Florida Department of Juvenile Justice, 2000/01
Chi
ld C
are,
Hea
d S
tart
and
Edu
catio
n
Source: Florida Department of Education, 2001/02
Source: Florida Children’s Forum, 2001
129 Center for the Study of Children’s Futures 2004
18.6 16.4 14.7 15.0 12.7 14.8 13.6 13.5 14.4
74.6 72.9 74.6 69.0 58.2 66.6 57.9 46.0 69.4
122.5 109.1 107.7 98.6 89.3 108.6 80.9 78.4 127.2
50.4 61.2 77.7 75.6 79.0 74.2 77.9 76.9 72.9
5.3 6.5 7.9 8.5 8.0 6.6 7.3 5.2 6.6
35.6 34.1 37.0 38.9 34.9 41.3 40.3 40.6 45.5
3.4 11.4 10.5 4.0 6.9 9.7 4.2 4.1 15.2
13.3 13.1 4.3 8.9 13.2 0.0 8.3 4.1 10.6
53.1 55.0 57.5 53.8 54.0 55.0 49.7 49.3 50.5
78.0 82.4 67.6 64.2 69.9 72.8 62.7 64.3 63.6
43.0
22.5
55.2 55.852.4
Okeechobee County
9 licensed child care centers with a capacity for 689 children
3 licensed family child care homes with a capacity for 26 children
5 Head Start programs with a capacity for 100 children
6,936 children were enrolled in 20 public schools
1,559 children were enrolled in exceptional student education programs
443 children were referred to English for Speakers of Other Languages Programs
214 children were enrolled in 3 non-public schools
117 children and families were registered in 80 home education programs
687 children received behavioral health services
24 behavioral health service providers served children
394 youths were referred to the juvenile justice system
4 youths were transferred to adult court
0 contracted delinquency prevention programs
1 state grant funded delinquency prevention program projected to serve 35 youths
1 probation and community corrections non-residential program with 63 slots
8 residential and correctional programs with 437 beds
0 detention centers

Number Percent Number Percent
Summary Profile for the Population Under Age 18, 1990 to 2000
1990 2000
Age & Sex
Population Under Age 18
Males Under Age 18
Females Under Age 18
Population Under Age 5
Population Age 5 - 17
Race
Children of One Race
White Children
Black or African American Children
American Indian or Alaska Native Children
Asian Children
Native Hawaiian or Other Pacific Islander Children
Children of Some Other Race
Children of Two or More Races
Hispanic Origin Status
Hispanic Children
Non-Hispanic Children
Non-Hispanic White Children
Non-Hispanic Racial Minorities
Living Arrangements
Children Living in Households
Children Living in Group Quarters
Own Children Living in Single Parent Households
Own Children Living in Married Couple Households
Source: Population Reference Bureau analysis of data from the US Census Bureau for the Annie E. Casey Foundation
1999 Income in Dollars as Reported in Census 2000
• •
•
•
Source: US Census Bureau, Census 2000, SF3 Tables P82, P53, P80 and PCT39
Number NumberPercent Percent
Source: US Census Bureau, Census 2000, SF1 and SF3;Florida Almanac, 2002/2003; Florida County Atlas, 1994
130Center for the Study of Children’s Futures 2004
161,486 100.0 226,340 100.0
82,137 50.9 116,143 51.3
79,349 49.1 110,197 48.7
49,862 30.9 61,375 27.1
111,624 69.1 164,965 72.9
N/A N/A 215,256 95.1
114,592 71.0 133,854 59.1
36,139 22.4 55,352 24.5
474 0.3 776 0.3
N/A N/A 7,235 3.2
N/A N/A 217 0.1
6,303 3.9 17,822 7.9
N/A N/A 11,084 4.9
19,533 12.1 51,477 22.7
141,953 87.9 174,863 77.3
102,262 63.3 105,709 46.7
39,691 24.6 69,154 30.6
160,198 99.2 225,302 99.5
1,288 0.8 1,038 0.5
36,316 22.5 61,939 27.4
105,725 65.5 136,436 60.3
Per Capita Income .................... 20,916 Median Family Income .............................. 47,159
Median Household Income ...... 41,311 with own children under age 18 ............. 44,564
Median Nonfamily Income....... 28,985 without own children under age 18 ........ 49,811
Orange County was established in 1824 and is incentral Florida. It was established from aportion of St. Johns County and was originally
named Mosquito County. The county seat is Orlando. Inaddition to Walt Disney World, there are many largetourist attractions. The county has many major privateindustries, including aerospace, communications,publishing, health care and banking.
The county comprises 907 square miles of land and waspopulated by 896,344 persons in 2000. There were 988persons per square mile and the general populationincreased by 32 percent from 1990. Three percent of thepopulation lived in a rural area. The median age in 2000was 33 years.
There were 361,349 housing units reported with ahomeownership rate of 61 percent. Thirty-six percent ofhouseholds included at least one person under the age of18 years. Annual income was less than $25,000 in 27percent of all 336,366 households and 25 percent of the112,294 family households with their own children. Elevenpercent of all households had earnings of $100,000 orgreater.
Eighteen percent of persons age 25 and over did notgraduate from high school and 26 percent graduated withno further education indicated. Twenty-six percentobtained a bachelor’s degree or higher. Of 96,664 personsage 18 to 24 years, 77 percent were high school graduates.Nine percent of persons 16 to 19 years old were not inschool and not working.
Children under age 18 represented 25 percent of thepopulation in Orange County, and 17 percent of childrenlived in poverty. Of the 106,233 persons of all ages livingin poverty, 35 percent were under the age of 18 years.Forty-one percent of children lived in low-incomehouseholds and 14 percent lived in high povertyneighborhoods.

Multi-Year Trend Data
** method used for calculating changed in 1998Source: Florida Department of Health, Office of Vital Statistics;Florida Department of Education
1992 1993 1994 1995 1996 1997 1998 1999 2000
Children Under Age 6 Below 100% of PovertyGrandparents Responsible 3 or More Years
100
75
50
25
0
Child
ren
Age 3
& 4
Enrol
led
in S
choo
lO
wn Chi
ldre
n Und
er A
ge 6
with
All Par
ents
in th
e La
bor F
orce
Child
ren
Under
Age
6
Below
200
% o
f Pov
erty
Gra
ndpa
rent
s Res
pons
ible
for
and
Livin
g with
Own
Gra
ndch
ildre
n Und
er A
ge 1
8
Own
Child
ren
Under
Age
6
Livin
g in
Sin
gle
Paren
t Hom
es
Per
cent
Source: US Census Bureau, Census 2000, SF1 and SF3
Critical MeasuresCensus 2000
Birth Rate
Teen Birth Rate Age 15-17
Teen Birth Rate Age 15-19
Percent of Births Receiving Early Prenatal Care
Percent of Low Birthweight Births
Percent of Births to Unwed Mothers
Infant Mortality Rate
Teen Violent Death Rate Age 15-19
Percent of Students Eligible for Free/Reduced Lunch
Graduation Rate**
Source: Policy and Services Research Data Center, de la Parte Institute, USF, 2002
Beh
avio
ral H
ealth
and
Juv
enile
Jus
tice
Source: Florida Department of Juvenile Justice, 2003
Source: Florida Department of Juvenile Justice, 2000/01
Chi
ld C
are,
Hea
d S
tart
and
Edu
catio
n
Source: Florida Department of Education, 2001/02
Source: Florida Children’s Forum, 2001
131 Center for the Study of Children’s Futures 2004
16.5 16.4 16.1 15.3 14.9 15.3 15.6 15.5 16.2
51.0 52.5 57.4 50.5 43.9 41.7 39.6 37.5 33.2
71.5 69.9 75.1 66.5 59.4 59.6 59.0 54.0 53.4
82.0 84.3 84.5 85.0 85.3 84.7 84.9 85.1 84.4
7.6 8.1 8.2 8.2 9.2 9.3 8.9 9.4 9.2
34.9 35.5 36.3 35.4 36.5 35.9 37.1 37.5 39.3
8.1 5.7 7.5 5.6 7.4 5.7 6.7 9.0 6.6
3.8 3.8 5.5 4.6 5.8 4.8 4.2 3.6 4.7
8.2 44.4 43.7 43.4 44.4 37.0 45.5 47.0 47.4
93.3 77.8 76.5 78.5 65.7 70.6 51.3 49.5 59.8
52.2
23.5
61.3
42.3 44.4
Orange County
280 licensed child care centers with a capacity for 27,986 children
53 licensed family child care homes with a capacity for 517 children
76 Head Start programs with a capacity for 1,436 children
157,498 children were enrolled in 202 public schools
30,675 children were enrolled in exceptional student education programs
18,280 children were referred to English for Speakers of Other Languages Programs
23,377 children were enrolled in 120 non-public schools
2,357 children and families were registered in 1,518 home education programs
8,797 children received behavioral health services
49 behavioral health service providers served children
6,367 youths were referred to the juvenile justice system
82 youths were transferred to adult court
2 contracted delinquency prevention programs with 54 beds or slots
4 state grant funded delinquency prevention programs projected to serve 700 youths
9 probation and community corrections non-residential programs with 437 slots
6 residential and correctional programs with 245 beds
1 detention center with 151 beds

Number Percent Number Percent
Summary Profile for the Population Under Age 18, 1990 to 2000
1990 2000
Age & Sex
Population Under Age 18
Males Under Age 18
Females Under Age 18
Population Under Age 5
Population Age 5 - 17
Race
Children of One Race
White Children
Black or African American Children
American Indian or Alaska Native Children
Asian Children
Native Hawaiian or Other Pacific Islander Children
Children of Some Other Race
Children of Two or More Races
Hispanic Origin Status
Hispanic Children
Non-Hispanic Children
Non-Hispanic White Children
Non-Hispanic Racial Minorities
Living Arrangements
Children Living in Households
Children Living in Group Quarters
Own Children Living in Single Parent Households
Own Children Living in Married Couple Households
Source: Population Reference Bureau analysis of data from the US Census Bureau for the Annie E. Casey Foundation
1999 Income in Dollars as Reported in Census 2000
• •
•
•
Source: US Census Bureau, Census 2000, SF3 Tables P82, P53, P80 and PCT39
Number NumberPercent Percent
Source: US Census Bureau, Census 2000, SF1 and SF3;Florida Almanac, 2002/2003; Florida County Atlas, 1994
132Center for the Study of Children’s Futures 2004
27,149 100.0 46,214 100.0
13,862 51.1 23,774 51.4
13,287 48.9 22,440 48.6
7,907 29.1 11,720 25.4
19,242 70.9 34,494 74.6
N/A N/A 43,909 95.0
23,011 84.8 32,933 71.3
2,249 8.3 4,236 9.2
92 0.3 219 0.5
N/A N/A 954 2.1
N/A N/A 43 0.1
1,319 4.9 5,524 12.0
N/A N/A 2,305 5.0
4,327 15.9 16,460 35.6
22,822 84.1 29,754 64.4
20,148 74.2 23,642 51.2
2,674 9.8 6,112 13.2
27,017 99.5 46,144 99.8
132 0.5 70 0.2
4,658 17.2 11,105 24.0
19,535 72.0 29,426 63.7
Per Capita Income .................... 17,022 Median Family Income .............................. 42,061
Median Household Income ...... 38,214 with own children under age 18 ............. 40,493
Median Nonfamily Income....... 24,088 without own children under age 18 ........ 43,988
Osceola County was established in 1887 fromportions of Orange and Brevard counties. Itwas named for Osceola, leader of the Seminole
Tribe. The county seat is Kissimmee. While cattleranching has been a primary industry in this county,rapid urbanization due to adjoining areas of heavytourism has occurred. Lake Kissimmee and theKissimmee River are important to the region’s waterresources.
The county comprises 1,322 square miles of land and waspopulated by 172,493 persons in 2000. There were 131persons per square mile and the general populationincreased by 60 percent from 1990. Twenty-four percent ofthe population lived in a rural area. The median age in 2000was 35 years.
There were 72,293 housing units reported with ahomeownership rate of 68 percent. Forty-one percent ofhouseholds included at least one person under the age of 18years. Annual income was less than $25,000 in 29 percentof all 60,966 households and 27 percent of the 22,637family households with their own children. Six percent ofall households had earnings of $100,000 or greater.
Twenty-one percent of persons age 25 and over did notgraduate from high school and 34 percent graduated withno further education indicated. Sixteen percent obtained abachelor’s degree or higher. Of 15,674 persons age 18 to 24years, 71 percent were high school graduates. Nine percentof persons 16 to 19 years old were not in school and notworking.
Children under age 18 represented 27 percent of thepopulation in Osceola County, and 15 percent of childrenlived in poverty. Of the 19,532 persons of all ages living inpoverty, 35 percent were under the age of 18 years. Forty-four percent of children lived in low-income householdsand 7 percent lived in high poverty neighborhoods.
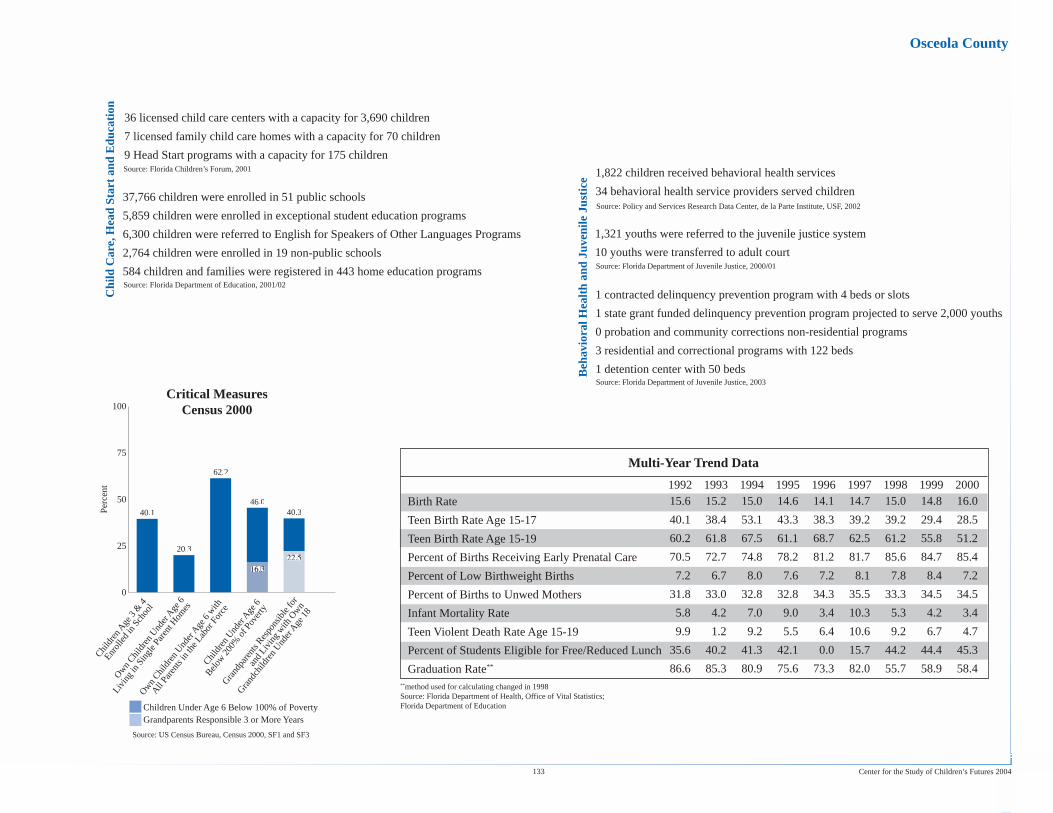
Multi-Year Trend Data
** method used for calculating changed in 1998Source: Florida Department of Health, Office of Vital Statistics;Florida Department of Education
1992 1993 1994 1995 1996 1997 1998 1999 2000
Children Under Age 6 Below 100% of PovertyGrandparents Responsible 3 or More Years
100
75
50
25
0
Child
ren
Age 3
& 4
Enrol
led
in S
choo
lO
wn Chi
ldre
n Und
er A
ge 6
with
All Par
ents
in th
e La
bor F
orce
Child
ren
Under
Age
6
Below
200
% o
f Pov
erty
Gra
ndpa
rent
s Res
pons
ible
for
and
Livin
g with
Own
Gra
ndch
ildre
n Und
er A
ge 1
8
Own
Child
ren
Under
Age
6
Livin
g in
Sin
gle
Paren
t Hom
es
Per
cent
Source: US Census Bureau, Census 2000, SF1 and SF3
Critical MeasuresCensus 2000
Birth Rate
Teen Birth Rate Age 15-17
Teen Birth Rate Age 15-19
Percent of Births Receiving Early Prenatal Care
Percent of Low Birthweight Births
Percent of Births to Unwed Mothers
Infant Mortality Rate
Teen Violent Death Rate Age 15-19
Percent of Students Eligible for Free/Reduced Lunch
Graduation Rate**
Source: Policy and Services Research Data Center, de la Parte Institute, USF, 2002
Beh
avio
ral H
ealth
and
Juv
enile
Jus
tice
Source: Florida Department of Juvenile Justice, 2003
Source: Florida Department of Juvenile Justice, 2000/01
Chi
ld C
are,
Hea
d S
tart
and
Edu
catio
n
Source: Florida Department of Education, 2001/02
Source: Florida Children’s Forum, 2001
133 Center for the Study of Children’s Futures 2004
15.6 15.2 15.0 14.6 14.1 14.7 15.0 14.8 16.0
40.1 38.4 53.1 43.3 38.3 39.2 39.2 29.4 28.5
60.2 61.8 67.5 61.1 68.7 62.5 61.2 55.8 51.2
70.5 72.7 74.8 78.2 81.2 81.7 85.6 84.7 85.4
7.2 6.7 8.0 7.6 7.2 8.1 7.8 8.4 7.2
31.8 33.0 32.8 32.8 34.3 35.5 33.3 34.5 34.5
5.8 4.2 7.0 9.0 3.4 10.3 5.3 4.2 3.4
9.9 1.2 9.2 5.5 6.4 10.6 9.2 6.7 4.7
35.6 40.2 41.3 42.1 0.0 15.7 44.2 44.4 45.3
86.6 85.3 80.9 75.6 73.3 82.0 55.7 58.9 58.4
40.1
20.3
62.2
46.040.3
Osceola County
36 licensed child care centers with a capacity for 3,690 children
7 licensed family child care homes with a capacity for 70 children
9 Head Start programs with a capacity for 175 children
37,766 children were enrolled in 51 public schools
5,859 children were enrolled in exceptional student education programs
6,300 children were referred to English for Speakers of Other Languages Programs
2,764 children were enrolled in 19 non-public schools
584 children and families were registered in 443 home education programs
1,822 children received behavioral health services
34 behavioral health service providers served children
1,321 youths were referred to the juvenile justice system
10 youths were transferred to adult court
1 contracted delinquency prevention program with 4 beds or slots
1 state grant funded delinquency prevention program projected to serve 2,000 youths
0 probation and community corrections non-residential programs
3 residential and correctional programs with 122 beds
1 detention center with 50 beds

Number Percent Number Percent
Summary Profile for the Population Under Age 18, 1990 to 2000
1990 2000
Age & Sex
Population Under Age 18
Males Under Age 18
Females Under Age 18
Population Under Age 5
Population Age 5 - 17
Race
Children of One Race
White Children
Black or African American Children
American Indian or Alaska Native Children
Asian Children
Native Hawaiian or Other Pacific Islander Children
Children of Some Other Race
Children of Two or More Races
Hispanic Origin Status
Hispanic Children
Non-Hispanic Children
Non-Hispanic White Children
Non-Hispanic Racial Minorities
Living Arrangements
Children Living in Households
Children Living in Group Quarters
Own Children Living in Single Parent Households
Own Children Living in Married Couple Households
Source: Population Reference Bureau analysis of data from the US Census Bureau for the Annie E. Casey Foundation
1999 Income in Dollars as Reported in Census 2000
• •
•
•
Source: US Census Bureau, Census 2000, SF3 Tables P82, P53, P80 and PCT39
Number NumberPercent Percent
Source: US Census Bureau, Census 2000, SF1 and SF3;Florida Almanac, 2002/2003; Florida County Atlas, 1994
134Center for the Study of Children’s Futures 2004
169,553 100.0 240,458 100.0
86,767 51.2 123,702 51.4
82,786 48.8 116,756 48.6
53,216 31.4 62,913 26.2
116,337 68.6 177,545 73.8
N/A N/A 231,284 96.2
124,186 73.2 159,538 66.3
38,268 22.6 55,406 23.0
289 0.2 700 0.3
N/A N/A 4,215 1.8
N/A N/A 182 0.1
4,359 2.6 11,243 4.7
N/A N/A 9,174 3.8
18,844 11.1 41,422 17.2
150,709 88.9 199,036 82.8
111,082 65.5 132,898 55.3
39,627 23.4 66,138 27.5
168,944 99.6 239,569 99.6
609 0.4 889 0.4
37,076 21.9 60,887 25.3
114,542 67.6 154,580 64.3
Per Capita Income .................... 28,801 Median Family Income .............................. 53,701
Median Household Income ...... 45,062 with own children under age 18 ............. 51,348
Median Nonfamily Income....... 29,035 without own children under age 18 ........ 55,224
Palm Beach County was established in 1909 froma portion of Dade County. It was named for thecoconut palms that lined the Atlantic Ocean
beach that provides the eastern border. The county seatis West Palm Beach. This area is popular amongtourists and Floridians. Major private employersinclude the production of jet engines, computers, andsugar. There are also many miles of wetlands, wildliferefuges and the Everglades.
The county comprises 1,974 square miles of land and waspopulated by 1,131,184 persons in 2000. There were 573persons per square mile and the general population increasedby 31 percent from 1990. Two percent of the populationlived in a rural area. The median age in 2000 was 42 years.
There were 556,428 housing units reported with ahomeownership rate of 75 percent. Twenty-seven percent ofhouseholds included at least one person under the age of 18years. Annual income was less than $25,000 in 26 percent ofall 474,295 households and 21 percent of the 121,235 familyhouseholds with their own children. Sixteen percent of allhouseholds had earnings of $100,000 or greater.
Sixteen percent of persons age 25 and over did not graduatefrom high school and 27 percent graduated with no furthereducation indicated. Twenty-eight percent obtained abachelor’s degree or higher. Of 74,001 persons age 18 to 24years, 67 percent were high school graduates. Ten percent ofpersons 16 to 19 years old were not in school and notworking.
Children under age 18 represented 21 percent of thepopulation in Palm Beach County, and 15 percent of childrenlived in poverty. Of the 110,430 persons of all ages living inpoverty, 31 percent were under the age of 18 years. Thirty-five percent of children lived in low-income households and18 percent lived in high poverty neighborhoods.

Multi-Year Trend Data
** method used for calculating changed in 1998Source: Florida Department of Health, Office of Vital Statistics;Florida Department of Education
1992 1993 1994 1995 1996 1997 1998 1999 2000
Children Under Age 6 Below 100% of PovertyGrandparents Responsible 3 or More Years
100
75
50
25
0
Child
ren
Age 3
& 4
Enrol
led
in S
choo
lO
wn Chi
ldre
n Und
er A
ge 6
with
All Par
ents
in th
e La
bor F
orce
Child
ren
Under
Age
6
Below
200
% o
f Pov
erty
Gra
ndpa
rent
s Res
pons
ible
for
and
Livin
g with
Own
Gra
ndch
ildre
n Und
er A
ge 1
8
Own
Child
ren
Under
Age
6
Livin
g in
Sin
gle
Paren
t Hom
es
Per
cent
Source: US Census Bureau, Census 2000, SF1 and SF3
Critical MeasuresCensus 2000
Birth Rate
Teen Birth Rate Age 15-17
Teen Birth Rate Age 15-19
Percent of Births Receiving Early Prenatal Care
Percent of Low Birthweight Births
Percent of Births to Unwed Mothers
Infant Mortality Rate
Teen Violent Death Rate Age 15-19
Percent of Students Eligible for Free/Reduced Lunch
Graduation Rate**
Source: Policy and Services Research Data Center, de la Parte Institute, USF, 2002
Beh
avio
ral H
ealth
and
Juv
enile
Jus
tice
Source: Florida Department of Juvenile Justice, 2003
Source: Florida Department of Juvenile Justice, 2000/01
Chi
ld C
are,
Hea
d S
tart
and
Edu
catio
n
Source: Florida Department of Education, 2001/02
Source: Florida Children’s Forum, 2001
135 Center for the Study of Children’s Futures 2004
13.5 13.6 13.5 12.7 12.7 12.4 12.7 12.5 12.5
38.3 41.6 44.4 42.2 37.4 35.3 33.7 31.7 23.9
58.3 60.6 63.7 57.5 57.0 52.1 52.2 49.2 43.5
77.7 77.2 79.9 80.9 80.6 78.9 78.6 78.0 76.7
7.2 7.3 8.0 7.6 7.7 8.2 7.6 7.7 7.7
32.5 33.2 34.1 33.3 33.5 33.7 34.3 34.5 35.9
9.2 7.3 7.8 6.6 5.8 7.0 5.8 6.2 7.1
5.3 4.8 6.9 6.7 7.7 8.1 5.1 8.9 5.9
36.4 37.4 36.8 34.2 29.4 38.9 33.7 39.5 38.7
80.0 79.6 66.2 74.9 67.2 73.8 58.2 63.6 64.9
62.7
21.3
57.5
36.842.2
Palm Beach County
360 licensed child care centers with a capacity for 33,413 children
354 licensed family child care homes with a capacity for 1,730 children
116 Head Start and Early Head Start programs with a capacity for 2,051 children
160,145 children were enrolled in 217 public schools
30,453 children were enrolled in exceptional student education programs
18,413 children were referred to English for Speakers of Other Languages Programs
28,843 children were enrolled in 125 non-public schools
2,504 children and families were registered in 1,681 home education programs
5,819 children received behavioral health services
53 behavioral health service providers served children
5,977 youths were referred to the juvenile justice system
211 youths were transferred to adult court
2 contracted delinquency prevention programs with 54 beds or slots
3 state grant funded delinquency prevention programs projected to serve 335 youths
7 probation and community corrections non-residential programs with 507 slots
7 residential and correctional programs with 408 beds
1 detention center with 93 beds

Number Percent Number Percent
Summary Profile for the Population Under Age 18, 1990 to 2000
1990 2000
Age & Sex
Population Under Age 18
Males Under Age 18
Females Under Age 18
Population Under Age 5
Population Age 5 - 17
Race
Children of One Race
White Children
Black or African American Children
American Indian or Alaska Native Children
Asian Children
Native Hawaiian or Other Pacific Islander Children
Children of Some Other Race
Children of Two or More Races
Hispanic Origin Status
Hispanic Children
Non-Hispanic Children
Non-Hispanic White Children
Non-Hispanic Racial Minorities
Living Arrangements
Children Living in Households
Children Living in Group Quarters
Own Children Living in Single Parent Households
Own Children Living in Married Couple Households
Source: Population Reference Bureau analysis of data from the US Census Bureau for the Annie E. Casey Foundation
1999 Income in Dollars as Reported in Census 2000
• •
•
•
Source: US Census Bureau, Census 2000, SF3 Tables P82, P53, P80 and PCT39
Number NumberPercent Percent
Source: US Census Bureau, Census 2000, SF1 and SF3;Florida Almanac, 2002/2003; Florida County Atlas, 1994
136Center for the Study of Children’s Futures 2004
50,223 100.0 69,514 100.0
25,657 51.1 35,755 51.4
24,566 48.9 33,759 48.6
14,514 28.9 18,134 26.1
35,709 71.1 51,380 73.9
N/A N/A 67,697 97.4
46,442 92.5 62,239 89.5
1,999 4.0 2,358 3.4
209 0.4 295 0.4
N/A N/A 829 1.2
N/A N/A 37 0.1
1,114 2.2 1,939 2.8
N/A N/A 1,817 2.6
3,084 6.1 6,570 9.5
47,139 93.9 62,944 90.5
44,508 88.6 58,162 83.7
2,631 5.2 4,782 6.9
50,007 99.6 69,259 99.6
216 0.4 255 0.4
9,633 19.2 16,844 24.2
35,412 70.5 45,392 65.3
Per Capita Income .................... 18,439 Median Family Income .............................. 39,568
Median Household Income ...... 32,969 with own children under age 18 ............. 41,932
Median Nonfamily Income....... 20,110 without own children under age 18 ........ 38,293
Pasco County was established in 1887 from aportion of Hernando County. It was named forSamuel Pasco of Monticello, once Speaker of
the Florida House of Representatives and later U.S.Senator. The county seat is Dade City. This county wasonce farmland but service industries have beengrowing rapidly along with population and residentialdevelopments. It is home to many commuters to theTampa Bay Region.
The county comprises 745 square miles of land and waspopulated by 344,765 persons in 2000. There were 463persons per square mile and the general populationincreased by 23 percent from 1990. Fifteen percent of thepopulation lived in a rural area. The median age in 2000was 45 years.
There were 173,717 housing units reported with ahomeownership rate of 82 percent. Twenty-six percent ofhouseholds included at least one person under the age of 18years. Annual income was less than $25,000 in 36 percentof all 147,713 households and 26 percent of the 34,879family households with their own children. Six percent ofall households had earnings of $100,000 or greater.
Twenty-two percent of persons age 25 and over did notgraduate from high school and 37 percent graduated withno further education indicated. Thirteen percent obtained abachelor’s degree or higher. Of 20,056 persons age 18 to24 years, 69 percent were high school graduates. Ninepercent of persons 16 to 19 years old were not in schooland not working.
Children under age 18 represented 20 percent of thepopulation in Pasco County, and 16 percent of childrenlived in poverty. Of the 36,201 persons of all ages living inpoverty, 30 percent were under the age of 18 years. Forty-one percent of children lived in low-income householdsand 5 percent lived in high poverty neighborhoods.

Multi-Year Trend Data
** method used for calculating changed in 1998Source: Florida Department of Health, Office of Vital Statistics;Florida Department of Education
1992 1993 1994 1995 1996 1997 1998 1999 2000
Children Under Age 6 Below 100% of PovertyGrandparents Responsible 3 or More Years
100
75
50
25
0
Child
ren
Age 3
& 4
Enrol
led
in S
choo
lO
wn Chi
ldre
n Und
er A
ge 6
with
All Par
ents
in th
e La
bor F
orce
Child
ren
Under
Age
6
Below
200
% o
f Pov
erty
Gra
ndpa
rent
s Res
pons
ible
for
and
Livin
g with
Own
Gra
ndch
ildre
n Und
er A
ge 1
8
Own
Child
ren
Under
Age
6
Livin
g in
Sin
gle
Paren
t Hom
es
Per
cent
Source: US Census Bureau, Census 2000, SF1 and SF3
Critical MeasuresCensus 2000
Birth Rate
Teen Birth Rate Age 15-17
Teen Birth Rate Age 15-19
Percent of Births Receiving Early Prenatal Care
Percent of Low Birthweight Births
Percent of Births to Unwed Mothers
Infant Mortality Rate
Teen Violent Death Rate Age 15-19
Percent of Students Eligible for Free/Reduced Lunch
Graduation Rate**
Source: Policy and Services Research Data Center, de la Parte Institute, USF, 2002
Beh
avio
ral H
ealth
and
Juv
enile
Jus
tice
Source: Florida Department of Juvenile Justice, 2003
Source: Florida Department of Juvenile Justice, 2000/01
Chi
ld C
are,
Hea
d S
tart
and
Edu
catio
n
Source: Florida Department of Education, 2001/02
Source: Florida Children’s Forum, 2001
137 Center for the Study of Children’s Futures 2004
10.0 10.6 10.7 10.9 10.3 10.6 10.6 10.7 11.3
31.9 38.9 43.2 46.1 38.3 41.5 35.4 36.0 27.1
58.3 58.4 62.4 72.6 64.0 63.8 63.9 58.3 52.9
82.8 85.7 86.1 88.3 89.2 88.4 87.3 87.4 89.2
6.5 6.5 6.0 7.1 7.6 7.0 7.6 6.5 7.6
30.7 31.2 31.9 32.0 33.5 32.6 33.0 34.1 33.5
7.9 7.3 6.8 8.4 10.3 6.3 7.6 4.3 6.7
5.1 3.6 7.2 5.1 9.1 8.7 5.9 8.3 4.4
38.8 43.0 48.1 44.0 44.1 44.3 40.8 42.7 44.0
77.3 76.5 74.6 69.6 72.2 73.6 63.5 64.8 65.9
45.2
21.7
60.3
42.6 44.2
Pasco County
91 licensed child care centers with a capacity for 6,986 children
128 licensed family child care homes with a capacity for 1,242 children
30 Head Start programs with a capacity for 603 children
52,675 children were enrolled in 77 public schools
11,892 children were enrolled in exceptional student education programs
1,619 children were referred to English for Speakers of Other Languages Programs
2,770 children were enrolled in 27 non-public schools
1,169 children and families were registered in 874 home education programs
2,686 children received behavioral health services
25 behavioral health service providers served children
1,620 youths were referred to the juvenile justice system
56 youths were transferred to adult court
2 contracted delinquency prevention programs with 39 beds or slots
2 state grant funded delinquency prevention programs projected to serve 295 youths
4 probation and community corrections non-residential programs with 488 slots
5 residential and correctional programs with 194 beds
1 detention center with 57 beds
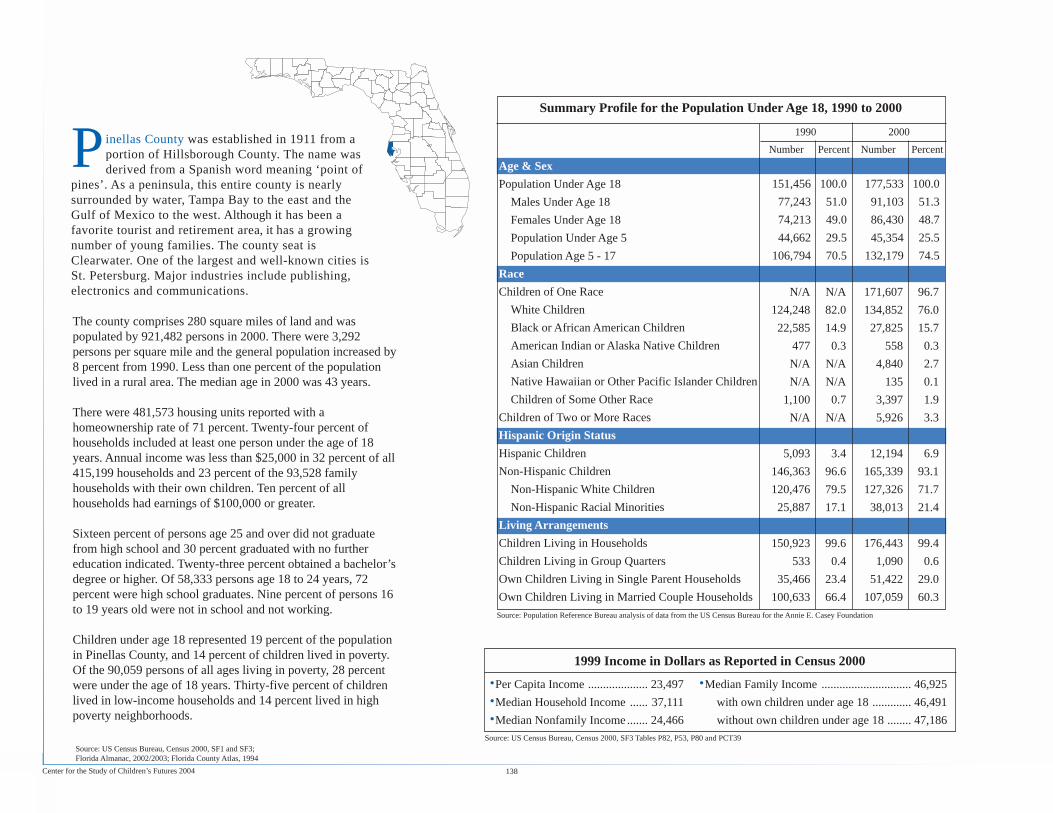
Number Percent Number Percent
Summary Profile for the Population Under Age 18, 1990 to 2000
1990 2000
Age & Sex
Population Under Age 18
Males Under Age 18
Females Under Age 18
Population Under Age 5
Population Age 5 - 17
Race
Children of One Race
White Children
Black or African American Children
American Indian or Alaska Native Children
Asian Children
Native Hawaiian or Other Pacific Islander Children
Children of Some Other Race
Children of Two or More Races
Hispanic Origin Status
Hispanic Children
Non-Hispanic Children
Non-Hispanic White Children
Non-Hispanic Racial Minorities
Living Arrangements
Children Living in Households
Children Living in Group Quarters
Own Children Living in Single Parent Households
Own Children Living in Married Couple Households
Source: Population Reference Bureau analysis of data from the US Census Bureau for the Annie E. Casey Foundation
1999 Income in Dollars as Reported in Census 2000
• •
•
•
Source: US Census Bureau, Census 2000, SF3 Tables P82, P53, P80 and PCT39
Number NumberPercent Percent
Source: US Census Bureau, Census 2000, SF1 and SF3;Florida Almanac, 2002/2003; Florida County Atlas, 1994
138Center for the Study of Children’s Futures 2004
151,456 100.0 177,533 100.0
77,243 51.0 91,103 51.3
74,213 49.0 86,430 48.7
44,662 29.5 45,354 25.5
106,794 70.5 132,179 74.5
N/A N/A 171,607 96.7
124,248 82.0 134,852 76.0
22,585 14.9 27,825 15.7
477 0.3 558 0.3
N/A N/A 4,840 2.7
N/A N/A 135 0.1
1,100 0.7 3,397 1.9
N/A N/A 5,926 3.3
5,093 3.4 12,194 6.9
146,363 96.6 165,339 93.1
120,476 79.5 127,326 71.7
25,887 17.1 38,013 21.4
150,923 99.6 176,443 99.4
533 0.4 1,090 0.6
35,466 23.4 51,422 29.0
100,633 66.4 107,059 60.3
Per Capita Income .................... 23,497 Median Family Income .............................. 46,925
Median Household Income ...... 37,111 with own children under age 18 ............. 46,491
Median Nonfamily Income....... 24,466 without own children under age 18 ........ 47,186
Pinellas County was established in 1911 from aportion of Hillsborough County. The name wasderived from a Spanish word meaning ‘point of
pines’. As a peninsula, this entire county is nearlysurrounded by water, Tampa Bay to the east and theGulf of Mexico to the west. Although it has been afavorite tourist and retirement area, it has a growingnumber of young families. The county seat isClearwater. One of the largest and well-known cities isSt. Petersburg. Major industries include publishing,electronics and communications.
The county comprises 280 square miles of land and waspopulated by 921,482 persons in 2000. There were 3,292persons per square mile and the general population increased by8 percent from 1990. Less than one percent of the populationlived in a rural area. The median age in 2000 was 43 years.
There were 481,573 housing units reported with ahomeownership rate of 71 percent. Twenty-four percent ofhouseholds included at least one person under the age of 18years. Annual income was less than $25,000 in 32 percent of all415,199 households and 23 percent of the 93,528 familyhouseholds with their own children. Ten percent of allhouseholds had earnings of $100,000 or greater.
Sixteen percent of persons age 25 and over did not graduatefrom high school and 30 percent graduated with no furthereducation indicated. Twenty-three percent obtained a bachelor’sdegree or higher. Of 58,333 persons age 18 to 24 years, 72percent were high school graduates. Nine percent of persons 16to 19 years old were not in school and not working.
Children under age 18 represented 19 percent of the populationin Pinellas County, and 14 percent of children lived in poverty.Of the 90,059 persons of all ages living in poverty, 28 percentwere under the age of 18 years. Thirty-five percent of childrenlived in low-income households and 14 percent lived in highpoverty neighborhoods.

Multi-Year Trend Data
** method used for calculating changed in 1998Source: Florida Department of Health, Office of Vital Statistics;Florida Department of Education
1992 1993 1994 1995 1996 1997 1998 1999 2000
Children Under Age 6 Below 100% of PovertyGrandparents Responsible 3 or More Years
100
75
50
25
0
Child
ren
Age 3
& 4
Enrol
led
in S
choo
lO
wn Chi
ldre
n Und
er A
ge 6
with
All Par
ents
in th
e La
bor F
orce
Child
ren
Under
Age
6
Below
200
% o
f Pov
erty
Gra
ndpa
rent
s Res
pons
ible
for
and
Livin
g with
Own
Gra
ndch
ildre
n Und
er A
ge 1
8
Own
Child
ren
Under
Age
6
Livin
g in
Sin
gle
Paren
t Hom
es
Per
cent
Source: US Census Bureau, Census 2000, SF1 and SF3
Critical MeasuresCensus 2000
Birth Rate
Teen Birth Rate Age 15-17
Teen Birth Rate Age 15-19
Percent of Births Receiving Early Prenatal Care
Percent of Low Birthweight Births
Percent of Births to Unwed Mothers
Infant Mortality Rate
Teen Violent Death Rate Age 15-19
Percent of Students Eligible for Free/Reduced Lunch
Graduation Rate**
Source: Policy and Services Research Data Center, de la Parte Institute, USF, 2002
Beh
avio
ral H
ealth
and
Juv
enile
Jus
tice
Source: Florida Department of Juvenile Justice, 2003
Source: Florida Department of Juvenile Justice, 2000/01
Chi
ld C
are,
Hea
d S
tart
and
Edu
catio
n
Source: Florida Department of Education, 2001/02
Source: Florida Children’s Forum, 2001
139 Center for the Study of Children’s Futures 2004
11.2 11.1 10.7 10.5 10.5 10.4 10.6 10.3 10.6
36.1 35.0 35.7 37.8 34.6 36.2 34.6 29.0 25.8
56.0 57.4 53.8 54.9 52.0 53.4 55.1 51.4 47.6
76.0 80.6 84.0 83.6 83.7 84.3 84.2 84.3 85.4
7.5 7.5 8.0 7.6 8.1 8.3 8.3 8.3 7.8
34.0 34.1 34.6 35.5 35.8 36.1 37.0 38.3 38.9
9.1 9.6 8.7 8.1 8.9 7.1 7.9 9.0 6.4
7.2 4.9 4.2 3.8 5.5 4.3 5.9 4.0 5.8
30.7 37.3 37.7 36.8 37.8 36.6 37.8 34.5 35.3
78.0 83.5 75.1 75.1 78.4 72.4 65.3 64.3 64.4
61.0
25.5
63.9
38.3
46.4
Pinellas County
387 licensed child care centers with a capacity for 29,982 children
934 licensed family child care homes with a capacity for 4,667 children
88 Head Start programs with a capacity for 1,546 children
114,601 children were enrolled in 176 public schools
25,192 children were enrolled in exceptional student education programs
2,815 children were referred to English for Speakers of Other Languages Programs
19,863 children were enrolled in 115 non-public schools
2,381 children and families were registered in 1,582 home education programs
5,892 children received behavioral health services
39 behavioral health service providers served children
5,925 youths were referred to the juvenile justice system
147 youths were transferred to adult court
3 contracted delinquency prevention programs with 58 beds or slots
4 state grant funded delinquency prevention programs projected to serve 775 youths
5 probation and community corrections non-residential programs with 236 slots
6 residential and correctional programs with 240 beds
1 detention center with 120 beds

Number Percent Number Percent
Summary Profile for the Population Under Age 18, 1990 to 2000
1990 2000
Age & Sex
Population Under Age 18
Males Under Age 18
Females Under Age 18
Population Under Age 5
Population Age 5 - 17
Race
Children of One Race
White Children
Black or African American Children
American Indian or Alaska Native Children
Asian Children
Native Hawaiian or Other Pacific Islander Children
Children of Some Other Race
Children of Two or More Races
Hispanic Origin Status
Hispanic Children
Non-Hispanic Children
Non-Hispanic White Children
Non-Hispanic Racial Minorities
Living Arrangements
Children Living in Households
Children Living in Group Quarters
Own Children Living in Single Parent Households
Own Children Living in Married Couple Households
Source: Population Reference Bureau analysis of data from the US Census Bureau for the Annie E. Casey Foundation
1999 Income in Dollars as Reported in Census 2000
• •
•
•
Source: US Census Bureau, Census 2000, SF3 Tables P82, P53, P80 and PCT39
Number NumberPercent Percent
Source: US Census Bureau, Census 2000, SF1 and SF3;Florida Almanac, 2002/2003; Florida County Atlas, 1994
140Center for the Study of Children’s Futures 2004
97,742 100.0 118,205 100.0
50,323 51.5 61,072 51.7
47,419 48.5 57,133 48.3
28,219 28.9 31,186 26.4
69,523 71.1 87,019 73.6
N/A N/A 114,884 97.2
74,478 76.2 83,075 70.3
19,936 20.4 23,072 19.5
308 0.3 543 0.5
N/A N/A 1,144 1.0
N/A N/A 57 0.0
2,242 2.3 6,993 5.9
N/A N/A 3,321 2.8
6,126 6.3 16,828 14.2
91,616 93.7 101,377 85.8
70,907 72.5 74,765 63.3
20,709 21.2 26,612 22.5
97,217 99.5 117,187 99.1
525 0.5 1,018 0.9
21,764 22.3 31,195 26.4
63,338 64.8 69,640 58.9
Per Capita Income .................... 18,302 Median Family Income .............................. 41,442
Median Household Income ...... 36,036 with own children under age 18 ............. 40,523
Median Nonfamily Income....... 21,676 without own children under age 18 ........ 42,068
Polk County was established in 1861 fromportions of Brevard and Hillsborough countiesand named for James Knox Polk, the eleventh U.S.
President. The county seat is Bartow. This county isnoted as the largest citrus producer in the state. It washome of one of Florida’s first major attractions, CypressGardens. Proximity to the Tampa Bay area and Orlandohas contributed to rapid growth. Additional majorindustries include phosphate mining, trucking, buildingsupplies, and tourist attractions.
The county comprises 1,874 square miles of land and waspopulated by 483,924 persons in 2000. There were 258persons per square mile and the general populationincreased by 19 percent from 1990. Twenty percent of thepopulation lived in a rural area. The median age in 2000was 39 years.
There were 226,376 housing units reported with ahomeownership rate of 73 percent. Thirty-three percent ofhouseholds included at least one person under the age of 18years. Annual income was less than $25,000 in 33 percentof all 187,162 households and 28 percent of the 54,862family households with their own children. Seven percentof all households had earnings of $100,000 or greater.
Twenty-five percent of persons age 25 and over did notgraduate from high school and 34 percent graduated withno further education indicated. Fifteen percent obtained abachelor’s degree or higher. Of 40,159 persons age 18 to 24years, 64 percent were high school graduates. Elevenpercent of persons 16 to 19 years old were not in schooland not working.
Children under age 18 represented 24 percent of thepopulation in Polk County, and 20 percent of children livedin poverty. Of the 60,953 persons of all ages living inpoverty, 37 percent were under the age of 18 years. Forty-five percent of children lived in low-income householdsand 22 percent lived in high poverty neighborhoods.

Multi-Year Trend Data
** method used for calculating changed in 1998Source: Florida Department of Health, Office of Vital Statistics;Florida Department of Education
1992 1993 1994 1995 1996 1997 1998 1999 2000
Children Under Age 6 Below 100% of PovertyGrandparents Responsible 3 or More Years
100
75
50
25
0
Child
ren
Age 3
& 4
Enrol
led
in S
choo
lO
wn Chi
ldre
n Und
er A
ge 6
with
All Par
ents
in th
e La
bor F
orce
Child
ren
Under
Age
6
Below
200
% o
f Pov
erty
Gra
ndpa
rent
s Res
pons
ible
for
and
Livin
g with
Own
Gra
ndch
ildre
n Und
er A
ge 1
8
Own
Child
ren
Under
Age
6
Livin
g in
Sin
gle
Paren
t Hom
es
Per
cent
Source: US Census Bureau, Census 2000, SF1 and SF3
Critical MeasuresCensus 2000
Birth Rate
Teen Birth Rate Age 15-17
Teen Birth Rate Age 15-19
Percent of Births Receiving Early Prenatal Care
Percent of Low Birthweight Births
Percent of Births to Unwed Mothers
Infant Mortality Rate
Teen Violent Death Rate Age 15-19
Percent of Students Eligible for Free/Reduced Lunch
Graduation Rate**
Source: Policy and Services Research Data Center, de la Parte Institute, USF, 2002
Beh
avio
ral H
ealth
and
Juv
enile
Jus
tice
Source: Florida Department of Juvenile Justice, 2003
Source: Florida Department of Juvenile Justice, 2000/01
Chi
ld C
are,
Hea
d S
tart
and
Edu
catio
n
Source: Florida Department of Education, 2001/02
Source: Florida Children’s Forum, 2001
141 Center for the Study of Children’s Futures 2004
14.9 14.4 14.1 13.8 13.7 14.0 13.9 13.8 14.2
60.7 57.5 61.8 65.1 61.4 62.1 56.6 52.2 43.9
87.3 86.6 87.9 95.3 87.5 93.2 85.0 83.9 78.4
70.9 75.0 76.4 76.8 76.0 75.8 76.4 77.1 74.4
7.4 7.0 7.8 7.0 7.9 7.9 7.0 7.9 7.2
37.8 38.9 41.3 41.7 43.0 42.7 43.0 43.4 44.8
9.7 12.1 10.2 8.3 10.2 8.2 7.5 9.4 7.0
7.4 11.0 8.8 8.4 3.7 6.7 6.6 7.8 6.7
44.6 47.9 50.3 51.9 53.0 53.2 51.6 49.9 50.0
72.5 69.3 70.3 64.2 69.0 71.1 53.3 55.3 52.6
50.4
25.0
61.3
49.153.4
Polk County
185 licensed child care centers with a capacity for 12,155 children
194 licensed family child care homes with a capacity for 1,444 children
44 Head Start programs with a capacity for 942 children
81,196 children were enrolled in 150 public schools
15,434 children were enrolled in exceptional student education programs
3,606 children were referred to English for Speakers of Other Languages Programs
7,833 children were enrolled in 42 non-public schools
2,230 children and families were registered in 437 home education programs
5,568 children received behavioral health services
42 behavioral health service providers served children
4,215 youths were referred to the juvenile justice system
39 youths were transferred to adult court
2 contracted delinquency prevention programs with 44 beds or slots
2 state grant funded delinquency prevention programs projected to serve 550 youths
2 probation and community corrections non-residential programs with 69 slots
10 residential and correctional programs with 798 beds
1 detention center with 90 beds

Number Percent Number Percent
Summary Profile for the Population Under Age 18, 1990 to 2000
1990 2000
Age & Sex
Population Under Age 18
Males Under Age 18
Females Under Age 18
Population Under Age 5
Population Age 5 - 17
Race
Children of One Race
White Children
Black or African American Children
American Indian or Alaska Native Children
Asian Children
Native Hawaiian or Other Pacific Islander Children
Children of Some Other Race
Children of Two or More Races
Hispanic Origin Status
Hispanic Children
Non-Hispanic Children
Non-Hispanic White Children
Non-Hispanic Racial Minorities
Living Arrangements
Children Living in Households
Children Living in Group Quarters
Own Children Living in Single Parent Households
Own Children Living in Married Couple Households
Source: Population Reference Bureau analysis of data from the US Census Bureau for the Annie E. Casey Foundation
1999 Income in Dollars as Reported in Census 2000
• •
•
•
Source: US Census Bureau, Census 2000, SF3 Tables P82, P53, P80 and PCT39
Number NumberPercent Percent
Source: US Census Bureau, Census 2000, SF1 and SF3;Florida Almanac, 2002/2003; Florida County Atlas, 1994
142Center for the Study of Children’s Futures 2004
16,542 100.0 17,304 100.0
8,476 51.2 9,020 52.1
8,066 48.8 8,284 47.9
4,450 26.9 4,326 25.0
12,092 73.1 12,978 75.0
N/A N/A 16,979 98.1
11,529 69.7 11,747 67.9
4,595 27.8 4,135 23.9
31 0.2 73 0.4
N/A N/A 86 0.5
N/A N/A 7 0.0
287 1.7 931 5.4
N/A N/A 325 1.9
625 3.8 1,713 9.9
15,917 96.2 15,591 90.1
11,237 67.9 11,085 64.1
4,680 28.3 4,506 26.0
16,519 99.9 17,249 99.7
23 0.1 55 0.3
4,076 24.6 5,061 29.2
10,184 61.6 9,745 56.3
Per Capita Income .................... 15,603 Median Family Income .............................. 34,499
Median Household Income ...... 28,180 with own children under age 18 ............. 30,904
Median Nonfamily Income....... 16,227 without own children under age 18 ........ 36,132
Putnam County was established in 1849 from St.Johns and Alachua counties. It was named forBenjamin Alexander Putnam, a member of the
State Legislature and first president of the FloridaHistorical Society. The county is known as the “bassfishing capital of the world”. It is also famous forRavine State Gardens. It is the center of the fernhorticultural industry; other major industries are pulpand papermaking, boats, and concrete pipe. Palatka isthe county seat.
The county comprises 722 square miles of land and waspopulated by 70,423 persons in 2000. There were 98persons per square mile and the general populationincreased by 8 percent from 1990. Fifty-four percent of thepopulation lived in a rural area. The median age in 2000was 41 years.
There were 33,870 housing units reported with ahomeownership rate of 80 percent. Thirty-two percent ofhouseholds included at least one person under the age of 18years. Annual income was less than $25,000 in 44 percentof all 27,813 households and 40 percent of the 7,828family households with their own children. Five percent ofall households had earnings of $100,000 or greater.
Thirty percent of persons age 25 and over did not graduatefrom high school and 37 percent graduated with no furthereducation indicated. Nine percent obtained a bachelor’sdegree or higher. Of 5,326 persons age 18 to 24 years, 58percent were high school graduates. Twelve percent ofpersons 16 to 19 years old were not in school and notworking.
Children under age 18 represented 25 percent of thepopulation in Putnam County, and 31 percent of childrenlived in poverty. Of the 14,449 persons of all ages living inpoverty, 36 percent were under the age of 18 years. Fifty-seven percent of children lived in low-income householdsand 23 percent lived in high poverty neighborhoods.

Multi-Year Trend Data
** method used for calculating changed in 1998Source: Florida Department of Health, Office of Vital Statistics;Florida Department of Education
1992 1993 1994 1995 1996 1997 1998 1999 2000
Children Under Age 6 Below 100% of PovertyGrandparents Responsible 3 or More Years
100
75
50
25
0
Child
ren
Age 3
& 4
Enrol
led
in S
choo
lO
wn Chi
ldre
n Und
er A
ge 6
with
All Par
ents
in th
e La
bor F
orce
Child
ren
Under
Age
6
Below
200
% o
f Pov
erty
Gra
ndpa
rent
s Res
pons
ible
for
and
Livin
g with
Own
Gra
ndch
ildre
n Und
er A
ge 1
8
Own
Child
ren
Under
Age
6
Livin
g in
Sin
gle
Paren
t Hom
es
Per
cent
Source: US Census Bureau, Census 2000, SF1 and SF3
Critical MeasuresCensus 2000
Birth Rate
Teen Birth Rate Age 15-17
Teen Birth Rate Age 15-19
Percent of Births Receiving Early Prenatal Care
Percent of Low Birthweight Births
Percent of Births to Unwed Mothers
Infant Mortality Rate
Teen Violent Death Rate Age 15-19
Percent of Students Eligible for Free/Reduced Lunch
Graduation Rate**
Source: Policy and Services Research Data Center, de la Parte Institute, USF, 2002
Beh
avio
ral H
ealth
and
Juv
enile
Jus
tice
Source: Florida Department of Juvenile Justice, 2003
Source: Florida Department of Juvenile Justice, 2000/01
Chi
ld C
are,
Hea
d S
tart
and
Edu
catio
n
Source: Florida Department of Education, 2001/02
Source: Florida Children’s Forum, 2001
143 Center for the Study of Children’s Futures 2004
14.7 13.7 12.9 13.5 12.9 12.9 12.5 13.1 12.2
47.6 64.4 61.6 65.2 61.5 53.7 54.0 50.8 43.9
91.8 88.3 84.7 99.3 93.4 89.5 90.3 84.5 79.0
74.2 74.8 77.8 79.3 78.0 78.6 77.2 74.6 75.3
8.1 5.7 8.8 8.6 8.0 10.8 5.7 8.7 9.8
42.0 43.5 47.0 47.0 42.3 45.8 49.1 45.0 49.1
15.0 11.6 11.2 8.5 12.2 11.0 4.5 6.3 12.3
11.1 8.9 17.6 8.3 2.2 17.2 10.5 8.2 4.1
56.6 58.7 60.5 61.1 61.9 60.8 60.5 59.6 60.2
68.9 57.2 49.5 51.1 57.1 57.1 65.8 61.2 62.9
40.3
29.8
55.360.4 59.8
Putnam County
27 licensed child care centers with a capacity for 1,639 children
41 licensed family child care homes with a capacity for 410 children
12 Head Start programs with a capacity for 222 children
12,643 children were enrolled in 24 public schools
2,487 children were enrolled in exceptional student education programs
490 children were referred to English for Speakers of Other Languages Programs
608 children were enrolled in 11 non-public schools
223 children and families were registered in 146 home education programs
775 children received behavioral health services
17 behavioral health service providers served children
692 youths were referred to the juvenile justice system
5 youths were transferred to adult court
1 contracted delinquency prevention program with 4 beds or slots
1 state grant funded delinquency prevention program projected to serve 135 youths
0 probation and community corrections non-residential programs
0 residential and correctional programs
0 detention centers

Number Percent Number Percent
Summary Profile for the Population Under Age 18, 1990 to 2000
1990 2000
Age & Sex
Population Under Age 18
Males Under Age 18
Females Under Age 18
Population Under Age 5
Population Age 5 - 17
Race
Children of One Race
White Children
Black or African American Children
American Indian or Alaska Native Children
Asian Children
Native Hawaiian or Other Pacific Islander Children
Children of Some Other Race
Children of Two or More Races
Hispanic Origin Status
Hispanic Children
Non-Hispanic Children
Non-Hispanic White Children
Non-Hispanic Racial Minorities
Living Arrangements
Children Living in Households
Children Living in Group Quarters
Own Children Living in Single Parent Households
Own Children Living in Married Couple Households
Source: Population Reference Bureau analysis of data from the US Census Bureau for the Annie E. Casey Foundation
1999 Income in Dollars as Reported in Census 2000
• •
•
•
Source: US Census Bureau, Census 2000, SF3 Tables P82, P53, P80 and PCT39
Number NumberPercent Percent
Source: US Census Bureau, Census 2000, SF1 and SF3;Florida Almanac, 2002/2003; Florida County Atlas, 1994
144Center for the Study of Children’s Futures 2004
18,633 100.0 28,399 100.0
9,540 51.2 14,540 51.2
9,093 48.8 13,859 48.8
5,335 28.6 6,606 23.3
13,298 71.4 21,793 76.7
N/A N/A 27,915 98.3
15,939 85.5 24,852 87.5
2,419 13.0 2,425 8.5
51 0.3 68 0.2
N/A N/A 300 1.1
N/A N/A 24 0.1
90 0.5 246 0.9
N/A N/A 484 1.7
519 2.8 989 3.5
18,114 97.2 27,410 96.5
15,523 83.3 24,196 85.2
2,591 13.9 3,214 11.3
18,305 98.2 28,363 99.9
328 1.8 36 0.1
3,595 19.3 5,543 19.5
12,884 69.1 20,436 72.0
Per Capita Income .................... 28,674 Median Family Income .............................. 59,153
Median Household Income ...... 50,099 with own children under age 18 ............. 60,242
Median Nonfamily Income....... 28,940 without own children under age 18 ........ 58,460
St. Johns County was established in 1821 as oneof Florida’s original two counties, the otherwas Escambia. The county was named for the
St. Johns River and it borders the Atlantic Ocean. Thecounty seat is St. Augustine, the oldest city in theUnited States. Tourism is the major industry followedby aeronautics, aluminum, auto parts manufacturingand health food preparation.
The county comprises 609 square miles of land and waspopulated by 123,135 persons in 2000. There were 202persons per square mile and the general populationincreased by 47 percent from 1990. Twenty-three percent ofthe population lived in a rural area. The median age in 2000was 41 years.
There were 58,008 housing units reported with ahomeownership rate of 76 percent. Thirty-two percent ofhouseholds included at least one person under the age of 18years. Annual income was less than $25,000 in 23 percentof all 49,621 households and 16 percent of the 14,907family households with their own children. Eighteenpercent of all households had earnings of $100,000 orgreater.
Thirteen percent of persons age 25 and over did notgraduate from high school and 24 percent graduated withno further education indicated. Thirty-three percentobtained a bachelor’s degree or higher. Of 8,637 personsage 18 to 24 years, 79 percent were high school graduates.Four percent of persons 16 to 19 years old were not inschool and not working.
Children under age 18 represented 23 percent of thepopulation in St. Johns County, and 10 percent of childrenlived in poverty. Of the 9,698 persons of all ages living inpoverty, 28 percent were under the age of 18 years.Twenty-seven percent of children lived in low-incomehouseholds and 6 percent lived in high povertyneighborhoods.

Multi-Year Trend Data
** method used for calculating changed in 1998Source: Florida Department of Health, Office of Vital Statistics;Florida Department of Education
1992 1993 1994 1995 1996 1997 1998 1999 2000
Children Under Age 6 Below 100% of PovertyGrandparents Responsible 3 or More Years
100
75
50
25
0
Child
ren
Age 3
& 4
Enrol
led
in S
choo
lO
wn Chi
ldre
n Und
er A
ge 6
with
All Par
ents
in th
e La
bor F
orce
Child
ren
Under
Age
6
Below
200
% o
f Pov
erty
Gra
ndpa
rent
s Res
pons
ible
for
and
Livin
g with
Own
Gra
ndch
ildre
n Und
er A
ge 1
8
Own
Child
ren
Under
Age
6
Livin
g in
Sin
gle
Paren
t Hom
es
Per
cent
Source: US Census Bureau, Census 2000, SF1 and SF3
Critical MeasuresCensus 2000
Birth Rate
Teen Birth Rate Age 15-17
Teen Birth Rate Age 15-19
Percent of Births Receiving Early Prenatal Care
Percent of Low Birthweight Births
Percent of Births to Unwed Mothers
Infant Mortality Rate
Teen Violent Death Rate Age 15-19
Percent of Students Eligible for Free/Reduced Lunch
Graduation Rate**
Source: Policy and Services Research Data Center, de la Parte Institute, USF, 2002
Beh
avio
ral H
ealth
and
Juv
enile
Jus
tice
Source: Florida Department of Juvenile Justice, 2003
Source: Florida Department of Juvenile Justice, 2000/01
Chi
ld C
are,
Hea
d S
tart
and
Edu
catio
n
Source: Florida Department of Education, 2001/02
Source: Florida Children’s Forum, 2001
145 Center for the Study of Children’s Futures 2004
12.8 12.2 11.1 11.7 11.1 11.3 10.7 10.5 11.2
42.0 31.6 30.1 40.7 27.7 28.1 31.6 20.9 19.0
58.6 45.9 43.9 56.1 41.7 45.3 45.3 35.7 34.0
77.5 78.6 84.2 83.0 83.9 85.5 84.7 85.7 87.2
6.4 6.9 6.1 6.7 8.6 7.5 8.7 8.0 6.7
31.2 30.0 29.2 28.5 28.0 27.3 26.6 26.0 27.9
7.9 9.8 0.0 5.2 14.8 11.6 6.7 5.0 5.3
10.7 1.8 3.5 3.4 9.6 6.1 8.8 2.8 6.2
23.5 25.7 25.9 24.3 26.9 28.2 23.9 22.7 21.3
70.2 74.2 75.2 76.1 84.8 75.3 72.0 74.9 77.1
60.5
15.8
62.7
25.9
45.8
St. Johns County
45 licensed child care centers with a capacity for 4,080 children
16 licensed family child care homes with a capacity for 151 children
6 Head Start programs with a capacity for 120 children
20,940 children were enrolled in 37 public schools
3,940 children were enrolled in exceptional student education programs
115 children were referred to English for Speakers of Other Languages Programs
2,531 children were enrolled in 22 non-public schools
500 children and families were registered in 330 home education programs
928 children received behavioral health services
22 behavioral health service providers served children
740 youths were referred to the juvenile justice system
17 youths were transferred to adult court
0 contracted delinquency prevention programs
1 state grant funded delinquency prevention program projected to serve 100 youths
0 probation and community corrections non-residential programs
2 residential and correctional programs with 185 beds
1 detention center with 50 beds

Number Percent Number Percent
Summary Profile for the Population Under Age 18, 1990 to 2000
1990 2000
Age & Sex
Population Under Age 18
Males Under Age 18
Females Under Age 18
Population Under Age 5
Population Age 5 - 17
Race
Children of One Race
White Children
Black or African American Children
American Indian or Alaska Native Children
Asian Children
Native Hawaiian or Other Pacific Islander Children
Children of Some Other Race
Children of Two or More Races
Hispanic Origin Status
Hispanic Children
Non-Hispanic Children
Non-Hispanic White Children
Non-Hispanic Racial Minorities
Living Arrangements
Children Living in Households
Children Living in Group Quarters
Own Children Living in Single Parent Households
Own Children Living in Married Couple Households
Source: Population Reference Bureau analysis of data from the US Census Bureau for the Annie E. Casey Foundation
1999 Income in Dollars as Reported in Census 2000
• •
•
•
Source: US Census Bureau, Census 2000, SF3 Tables P82, P53, P80 and PCT39
Number NumberPercent Percent
Source: US Census Bureau, Census 2000, SF1 and SF3;Florida Almanac, 2002/2003; Florida County Atlas, 1994
146Center for the Study of Children’s Futures 2004
34,622 100.0 43,583 100.0
17,733 51.2 22,332 51.2
16,889 48.8 21,251 48.8
10,492 30.3 10,750 24.7
24,130 69.7 32,833 75.3
N/A N/A 42,248 96.9
24,287 70.1 29,500 67.7
9,268 26.8 10,389 23.8
99 0.3 117 0.3
N/A N/A 512 1.2
N/A N/A 27 0.1
649 1.9 1,703 3.9
N/A N/A 1,335 3.1
1,822 5.3 5,244 12.0
32,800 94.7 38,339 88.0
23,270 67.2 26,426 60.6
9,530 27.5 11,913 27.3
34,438 99.5 43,447 99.7
184 0.5 136 0.3
8,209 23.7 12,107 27.8
22,014 63.6 25,792 59.2
Per Capita Income .................... 18,790 Median Family Income .............................. 41,381
Median Household Income ...... 36,363 with own children under age 18 ............. 39,759
Median Nonfamily Income....... 23,241 without own children under age 18 ........ 42,185
St. Lucie County was established in 1905 from aportion of Mosquito County and named for St.Lucie of Syracuse. The Atlantic oceanfront has
been popular for residents and tourists. The countyseat is Fort Pierce. In addition to citrus, major privateemployers are in communications, retailing and healthcare.
The county comprises 572 square miles of land and waspopulated by 192,695 persons in 2000. There were 337persons per square mile and the general populationincreased by 28 percent from 1990. Six percent of thepopulation lived in a rural area. The median age in 2000was 42 years.
There were 91,262 housing units reported with ahomeownership rate of 78 percent. Thirty percent ofhouseholds included at least one person under the age of 18years. Annual income was less than $25,000 in 32 percentof all 76,903 households and 29 percent of the 20,493family households with their own children. Seven percentof all households had earnings of $100,000 or greater.
Twenty-two percent of persons age 25 and over did notgraduate from high school and 33 percent graduated withno further education indicated. Fifteen percent obtained abachelor’s degree or higher. Of 12,953 persons age 18 to 24years, 59 percent were high school graduates. Thirteenpercent of persons 16 to 19 years old were not in schooland not working.
Children under age 18 represented 23 percent of thepopulation in St. Lucie County, and 21 percent of childrenlived in poverty. Of the 25,464 persons of all ages living inpoverty, 35 percent were under the age of 18 years. Forty-six percent of children lived in low-income households and21 percent lived in high poverty neighborhoods.

Multi-Year Trend Data
** method used for calculating changed in 1998Source: Florida Department of Health, Office of Vital Statistics;Florida Department of Education
1992 1993 1994 1995 1996 1997 1998 1999 2000
Children Under Age 6 Below 100% of PovertyGrandparents Responsible 3 or More Years
100
75
50
25
0
Child
ren
Age 3
& 4
Enrol
led
in S
choo
lO
wn Chi
ldre
n Und
er A
ge 6
with
All Par
ents
in th
e La
bor F
orce
Child
ren
Under
Age
6
Below
200
% o
f Pov
erty
Gra
ndpa
rent
s Res
pons
ible
for
and
Livin
g with
Own
Gra
ndch
ildre
n Und
er A
ge 1
8
Own
Child
ren
Under
Age
6
Livin
g in
Sin
gle
Paren
t Hom
es
Per
cent
Source: US Census Bureau, Census 2000, SF1 and SF3
Critical MeasuresCensus 2000
Birth Rate
Teen Birth Rate Age 15-17
Teen Birth Rate Age 15-19
Percent of Births Receiving Early Prenatal Care
Percent of Low Birthweight Births
Percent of Births to Unwed Mothers
Infant Mortality Rate
Teen Violent Death Rate Age 15-19
Percent of Students Eligible for Free/Reduced Lunch
Graduation Rate**
Source: Policy and Services Research Data Center, de la Parte Institute, USF, 2002
Beh
avio
ral H
ealth
and
Juv
enile
Jus
tice
Source: Florida Department of Juvenile Justice, 2003
Source: Florida Department of Juvenile Justice, 2000/01
Chi
ld C
are,
Hea
d S
tart
and
Edu
catio
n
Source: Florida Department of Education, 2001/02
Source: Florida Children’s Forum, 2001
147 Center for the Study of Children’s Futures 2004
14.4 14.0 13.1 12.2 12.0 12.1 12.2 11.4 11.7
68.6 51.7 47.8 39.7 39.5 39.7 37.0 37.7 32.8
91.5 80.9 71.0 63.2 62.1 63.7 62.6 61.0 61.4
71.5 75.9 77.9 80.5 79.6 76.6 78.1 77.0 76.3
6.8 6.3 7.6 7.5 8.5 8.2 8.0 7.4 7.7
38.4 39.2 37.9 40.6 39.3 39.7 40.0 43.4 43.1
10.8 11.7 6.3 11.4 9.8 10.1 8.9 4.6 7.1
3.4 3.3 6.4 9.9 4.1 3.9 10.5 4.6 5.1
44.1 40.1 46.8 50.4 53.2 53.2 53.4 52.1 52.7
68.2 65.1 63.0 60.8 62.7 61.1 63.5 62.9 69.6
51.2
25.2
63.3
48.843.7
St. Lucie County
74 licensed child care centers with a capacity for 6,059 children
26 licensed family child care homes with a capacity for 228 children
25 Head Start programs with a capacity for 455 children
30,587 children were enrolled in 45 public schools
6,026 children were enrolled in exceptional student education programs
1,709 children were referred to English for Speakers of Other Languages Programs
3,442 children were enrolled in 22 non-public schools
370 children and families were registered in 256 home education programs
2,198 children received behavioral health services
27 behavioral health service providers served children
1,457 youths were referred to the juvenile justice system
27 youths were transferred to adult court
1 contracted delinquency prevention program with 4 beds or slots
1 state grant funded delinquency prevention program projected to serve 80 youths
4 probation and community corrections non-residential programs with 271 slots
1 residential and correctional program with 7 beds
1 detention center with 78 beds

Number Percent Number Percent
Summary Profile for the Population Under Age 18, 1990 to 2000
1990 2000
Age & Sex
Population Under Age 18
Males Under Age 18
Females Under Age 18
Population Under Age 5
Population Age 5 - 17
Race
Children of One Race
White Children
Black or African American Children
American Indian or Alaska Native Children
Asian Children
Native Hawaiian or Other Pacific Islander Children
Children of Some Other Race
Children of Two or More Races
Hispanic Origin Status
Hispanic Children
Non-Hispanic Children
Non-Hispanic White Children
Non-Hispanic Racial Minorities
Living Arrangements
Children Living in Households
Children Living in Group Quarters
Own Children Living in Single Parent Households
Own Children Living in Married Couple Households
Source: Population Reference Bureau analysis of data from the US Census Bureau for the Annie E. Casey Foundation
1999 Income in Dollars as Reported in Census 2000
• •
•
•
Source: US Census Bureau, Census 2000, SF3 Tables P82, P53, P80 and PCT39
Number NumberPercent Percent
Source: US Census Bureau, Census 2000, SF1 and SF3;Florida Almanac, 2002/2003; Florida County Atlas, 1994
148Center for the Study of Children’s Futures 2004
22,174 100.0 31,269 100.0
11,574 52.2 16,274 52.0
10,600 47.8 14,995 48.0
6,375 28.7 7,700 24.6
15,799 71.3 23,569 75.4
N/A N/A 30,239 96.7
20,444 92.2 27,813 88.9
1,161 5.2 1,510 4.8
208 0.9 302 1.0
N/A N/A 306 1.0
N/A N/A 28 0.1
90 0.4 280 0.9
N/A N/A 1,030 3.3
443 2.0 1,054 3.4
21,731 98.0 30,215 96.6
20,117 90.7 27,163 86.9
1,614 7.3 3,052 9.8
22,087 99.6 31,170 99.7
87 0.4 99 0.3
3,829 17.3 6,229 19.9
16,703 75.3 22,317 71.4
Per Capita Income .................... 20,089 Median Family Income .............................. 46,929
Median Household Income ...... 41,881 with own children under age 18 ............. 43,660
Median Nonfamily Income....... 24,455 without own children under age 18 ........ 50,134
Santa Rosa County was established in 1842 from aportion of Escambia County and named forSanta Rosa Island. The county seat is Milton. The
majority of the county’s acreage is in timber, includingthe Blackwater River State Forest. Part of the state’sintracoastal waterway, the Santa Rosa Sound, and EglinAir Force Base provide the county’s main economicbase. Other industry includes gas and oil products,clothing, chemicals, and medical services.
The county comprises 1,017 square miles of land and waspopulated by 117,743 persons in 2000. There were 116persons per square mile and the general population increasedby 44 percent from 1990. Twenty-nine percent of thepopulation lived in a rural area. The median age in 2000 was37 years.
There were 49,119 housing units reported with ahomeownership rate of 80 percent. Forty percent ofhouseholds included at least one person under the age of 18years. Annual income was less than $25,000 in 27 percent ofall 43,845 households and 24 percent of the 16,472 familyhouseholds with their their own children. Nine percent of allhouseholds had earnings of $100,000 or greater.
Fifteen percent of persons age 25 and over did not graduatefrom high school and 29 percent graduated with no furthereducation indicated. Twenty-three percent obtained abachelor’s degree or higher. Of 8,449 persons age 18 to 24years, 73 percent were high school graduates. Six percent ofpersons 16 to 19 years old were not in school and notworking.
Children under age 18 represented 27 percent of thepopulation in Santa Rosa County, and 13 percent of childrenlived in poverty. Of the 11,282 persons of all ages living inpoverty, 36 percent were under the age of 18 years. Thirty-eight percent of children lived in low-income households and2 percent lived in high poverty neighborhoods.

Multi-Year Trend Data
** method used for calculating changed in 1998Source: Florida Department of Health, Office of Vital Statistics;Florida Department of Education
1992 1993 1994 1995 1996 1997 1998 1999 2000
Children Under Age 6 Below 100% of PovertyGrandparents Responsible 3 or More Years
100
75
50
25
0
Child
ren
Age 3
& 4
Enrol
led
in S
choo
lO
wn Chi
ldre
n Und
er A
ge 6
with
All Par
ents
in th
e La
bor F
orce
Child
ren
Under
Age
6
Below
200
% o
f Pov
erty
Gra
ndpa
rent
s Res
pons
ible
for
and
Livin
g with
Own
Gra
ndch
ildre
n Und
er A
ge 1
8
Own
Child
ren
Under
Age
6
Livin
g in
Sin
gle
Paren
t Hom
es
Per
cent
Source: US Census Bureau, Census 2000, SF1 and SF3
Critical MeasuresCensus 2000
Birth Rate
Teen Birth Rate Age 15-17
Teen Birth Rate Age 15-19
Percent of Births Receiving Early Prenatal Care
Percent of Low Birthweight Births
Percent of Births to Unwed Mothers
Infant Mortality Rate
Teen Violent Death Rate Age 15-19
Percent of Students Eligible for Free/Reduced Lunch
Graduation Rate**
Source: Policy and Services Research Data Center, de la Parte Institute, USF, 2002
Beh
avio
ral H
ealth
and
Juv
enile
Jus
tice
Source: Florida Department of Juvenile Justice, 2003
Source: Florida Department of Juvenile Justice, 2000/01
Chi
ld C
are,
Hea
d S
tart
and
Edu
catio
n
Source: Florida Department of Education, 2001/02
Source: Florida Children’s Forum, 2001
149 Center for the Study of Children’s Futures 2004
14.7 15.2 13.9 14.1 14.0 14.4 14.0 13.7 13.0
33.5 41.4 31.9 33.7 41.2 35.3 30.5 25.5 18.5
55.0 61.0 56.1 55.6 61.9 54.8 51.7 51.0 44.6
86.0 88.5 87.6 88.9 89.2 88.4 90.3 91.7 90.6
6.0 7.2 6.0 6.1 7.4 7.7 7.2 7.5 7.5
20.8 22.2 23.3 23.4 24.9 24.6 23.1 25.2 24.7
9.3 7.9 4.6 2.2 4.3 8.7 7.2 5.8 4.7
8.3 11.4 7.9 7.4 6.0 7.3 4.1 2.6 8.2
30.7 32.0 35.1 31.0 31.0 30.7 30.4 30.6 31.2
87.2 78.0 75.7 73.6 76.4 69.7 75.4 73.5 75.4
47.2
17.1
56.5
42.3
56.2
Santa Rosa County
27 licensed child care centers with a capacity for 2,480 children
11 licensed family child care homes with a capacity for 117 children
17 Head Start and Early Head Start programs with a capacity for 300 children
23,216 children were enrolled in 38 public schools
4,863 children were enrolled in exceptional student education programs
31 children were referred to English for Speakers of Other Languages Programs
817 children were enrolled in 9 non-public schools
678 children and families were registered in 446 home education programs
1,362 children received behavioral health services
13 behavioral health service providers served children
773 youths were referred to the juvenile justice system
7 youths were transferred to adult court
0 contracted delinquency prevention programs
1 state grant funded delinquency prevention program projected to serve 95 youths
0 probation and community corrections non-residential programs
3 residential and correctional programs with 103 beds
0 detention centers

Number Percent Number Percent
Summary Profile for the Population Under Age 18, 1990 to 2000
1990 2000
Age & Sex
Population Under Age 18
Males Under Age 18
Females Under Age 18
Population Under Age 5
Population Age 5 - 17
Race
Children of One Race
White Children
Black or African American Children
American Indian or Alaska Native Children
Asian Children
Native Hawaiian or Other Pacific Islander Children
Children of Some Other Race
Children of Two or More Races
Hispanic Origin Status
Hispanic Children
Non-Hispanic Children
Non-Hispanic White Children
Non-Hispanic Racial Minorities
Living Arrangements
Children Living in Households
Children Living in Group Quarters
Own Children Living in Single Parent Households
Own Children Living in Married Couple Households
Source: Population Reference Bureau analysis of data from the US Census Bureau for the Annie E. Casey Foundation
1999 Income in Dollars as Reported in Census 2000
• •
•
•
Source: US Census Bureau, Census 2000, SF3 Tables P82, P53, P80 and PCT39
Number NumberPercent Percent
Source: US Census Bureau, Census 2000, SF1 and SF3;Florida Almanac, 2002/2003; Florida County Atlas, 1994
150Center for the Study of Children’s Futures 2004
43,711 100.0 52,827 100.0
22,479 51.4 27,143 51.4
21,232 48.6 25,684 48.6
12,658 29.0 12,797 24.2
31,053 71.0 40,030 75.8
N/A N/A 51,534 97.6
38,663 88.5 45,167 85.5
4,249 9.7 4,389 8.3
90 0.2 153 0.3
N/A N/A 530 1.0
N/A N/A 22 0.0
303 0.7 1,273 2.4
N/A N/A 1,293 2.4
1,573 3.6 4,149 7.9
42,138 96.4 48,678 92.1
37,432 85.6 42,628 80.7
4,706 10.8 6,050 11.5
43,611 99.8 52,712 99.8
100 0.2 115 0.2
8,558 19.6 12,998 24.6
30,959 70.8 34,851 66.0
Per Capita Income .................... 28,326 Median Family Income .............................. 50,111
Median Household Income ...... 41,957 with own children under age 18 ............. 47,452
Median Nonfamily Income....... 27,855 without own children under age 18 ........ 51,033
Sarasota County was established in 1921 from aportion of Manatee County. This Gulf Coast areais known for its cultural activities, such as the
Ringling Museum of Art. Barrier islands include St.Armands Key, Longboat Key, Siesta Key, and CaseyKey. Myakka River State Park is a popular woodlandarea. The county seat is Sarasota. Tourism is the majorindustry. Retailing, electronics, health care, banking andreal estate development are significant to the economy.
The county comprises 572 square miles of land and waspopulated by 325,957 persons in 2000. There were 570persons per square mile and the general population increasedby 17 percent from 1990. Five percent of the populationlived in a rural area. The median age in 2000 was 51 years.
There were 182,467 housing units reported with ahomeownership rate of 79 percent. Twenty percent ofhouseholds included at least one person under the age of 18years. Annual income was less than $25,000 in 26 percent ofall 150,166 households and 22 percent of the 28,113 familyhouseholds with their own children. Thirteen percent of allhouseholds had earnings of $100,000 or greater.
Thirteen percent of persons age 25 and over did not graduatefrom high school and 30 percent graduated with no furthereducation indicated. Twenty-seven percent obtained abachelor’s degree or higher. Of 16,447 persons age 18 to 24years, 69 percent were high school graduates. Seven percentof persons 16 to 19 years old were not in school and notworking.
Children under age 18 represented 16 percent of thepopulation in Sarasota County, and 13 percent of childrenlived in poverty. Of the 24,817 persons of all ages living inpoverty, 27 percent were under the age of 18 years. Thirty-five percent of children lived in low-income households and12 percent lived in high poverty neighborhoods.

Multi-Year Trend Data
** method used for calculating changed in 1998Source: Florida Department of Health, Office of Vital Statistics;Florida Department of Education
1992 1993 1994 1995 1996 1997 1998 1999 2000
Children Under Age 6 Below 100% of PovertyGrandparents Responsible 3 or More Years
100
75
50
25
0
Child
ren
Age 3
& 4
Enrol
led
in S
choo
lO
wn Chi
ldre
n Und
er A
ge 6
with
All Par
ents
in th
e La
bor F
orce
Child
ren
Under
Age
6
Below
200
% o
f Pov
erty
Gra
ndpa
rent
s Res
pons
ible
for
and
Livin
g with
Own
Gra
ndch
ildre
n Und
er A
ge 1
8
Own
Child
ren
Under
Age
6
Livin
g in
Sin
gle
Paren
t Hom
es
Per
cent
Source: US Census Bureau, Census 2000, SF1 and SF3
Critical MeasuresCensus 2000
Birth Rate
Teen Birth Rate Age 15-17
Teen Birth Rate Age 15-19
Percent of Births Receiving Early Prenatal Care
Percent of Low Birthweight Births
Percent of Births to Unwed Mothers
Infant Mortality Rate
Teen Violent Death Rate Age 15-19
Percent of Students Eligible for Free/Reduced Lunch
Graduation Rate**
Source: Policy and Services Research Data Center, de la Parte Institute, USF, 2002
Beh
avio
ral H
ealth
and
Juv
enile
Jus
tice
Source: Florida Department of Juvenile Justice, 2003
Source: Florida Department of Juvenile Justice, 2000/01
Chi
ld C
are,
Hea
d S
tart
and
Edu
catio
n
Source: Florida Department of Education, 2001/02
Source: Florida Children’s Forum, 2001
151 Center for the Study of Children’s Futures 2004
9.3 8.6 8.6 8.3 8.2 8.1 8.2 8.2 8.3
28.2 23.5 29.1 32.9 22.8 31.9 32.6 27.1 20.5
44.8 44.0 42.8 50.3 40.7 46.6 47.0 43.1 43.4
80.7 84.6 82.4 86.3 85.4 84.6 84.2 86.9 87.5
6.5 6.8 7.6 5.9 6.6 6.4 7.0 7.2 8.2
28.1 28.7 30.7 29.8 29.4 31.9 31.8 30.1 33.1
8.2 7.9 9.8 8.0 6.4 3.9 6.5 4.2 8.1
0.8 6.5 4.8 1.7 6.5 3.1 6.9 4.5 4.8
31.0 27.5 21.0 33.1 33.5 36.3 35.6 34.6 34.7
83.9 82.5 75.4 79.9 77.3 79.9 63.0 63.4 70.3
56.3
20.6
61.5
39.644.8
Sarasota County
99 licensed child care centers with a capacity for 6,948 children
131 licensed family child care homes with a capacity for 1,115 children
24 Head Start and Early Head Start programs with a capacity for 558 children
37,141 children were enrolled in 46 public schools
9,691 children were enrolled in exceptional student education programs
1,589 children were referred to English for Speakers of Other Languages Programs
6,202 children were enrolled in 39 non-public schools
746 children and families were registered in 510 home education programs
1,135 children received behavioral health services
32 behavioral health service providers served children
1,338 youths were referred to the juvenile justice system
10 youths were transferred to adult court
1 contracted delinquency prevention program with 4 beds or slots
2 state grant funded delinquency prevention programs projected to serve 230 youths
4 probation and community corrections non-residential programs with 300 slots
1 residential and correctional program with 20 beds
0 detention centers

Number Percent Number Percent
Summary Profile for the Population Under Age 18, 1990 to 2000
1990 2000
Age & Sex
Population Under Age 18
Males Under Age 18
Females Under Age 18
Population Under Age 5
Population Age 5 - 17
Race
Children of One Race
White Children
Black or African American Children
American Indian or Alaska Native Children
Asian Children
Native Hawaiian or Other Pacific Islander Children
Children of Some Other Race
Children of Two or More Races
Hispanic Origin Status
Hispanic Children
Non-Hispanic Children
Non-Hispanic White Children
Non-Hispanic Racial Minorities
Living Arrangements
Children Living in Households
Children Living in Group Quarters
Own Children Living in Single Parent Households
Own Children Living in Married Couple Households
Source: Population Reference Bureau analysis of data from the US Census Bureau for the Annie E. Casey Foundation
1999 Income in Dollars as Reported in Census 2000
• •
•
•
Source: US Census Bureau, Census 2000, SF3 Tables P82, P53, P80 and PCT39
Number NumberPercent Percent
Source: US Census Bureau, Census 2000, SF1 and SF3;Florida Almanac, 2002/2003; Florida County Atlas, 1994
152Center for the Study of Children’s Futures 2004
72,907 100.0 92,606 100.0
37,576 51.5 47,474 51.3
35,331 48.5 45,132 48.7
20,040 27.5 23,062 24.9
52,867 72.5 69,544 75.1
N/A N/A 89,444 96.6
61,437 84.3 71,980 77.7
8,432 11.6 11,065 11.9
232 0.3 292 0.3
N/A N/A 2,326 2.5
N/A N/A 29 0.0
1,357 1.9 3,752 4.1
N/A N/A 3,162 3.4
5,672 7.8 12,340 13.3
67,235 92.2 80,266 86.7
57,313 78.6 64,550 69.7
9,922 13.6 15,716 17.0
72,684 99.7 92,446 99.8
223 0.3 160 0.2
12,414 17.0 19,709 21.3
54,173 74.3 64,503 69.7
Per Capita Income .................... 24,591 Median Family Income .............................. 56,895
Median Household Income ...... 49,326 with own children under age 18 ............. 56,489
Median Nonfamily Income....... 31,445 without own children under age 18 ........ 57,291
Seminole County was established in 1913 fromOrange County and was named for the SeminoleIndians. This area has been changing from an
agricultural region to one of many urban clusters. Thecounty seat is Sanford. Industries include housing,communications, food, electronics, and telephoneequipment.
The county comprises 308 square miles of land and waspopulated by 365,196 persons in 2000. There were 1,185persons per square mile and the general populationincreased by 27 percent from 1990. Four percent of thepopulation lived in a rural area. The median age in 2000was 36 years.
There were 147,079 housing units reported with ahomeownership rate of 69 percent. Thirty-seven percent ofhouseholds included at least one person under the age of 18years. Annual income was less than $25,000 in 20 percentof all 139,631 households and 16 percent of the 48,155family households with their own children. Sixteen percentof all households had earnings of $100,000 or greater.
Eleven percent of persons age 25 and over did not graduatefrom high school and 24 percent graduated with no furthereducation indicated. Thirty-one percent obtained abachelor’s degree or higher. Of 29,697 persons age 18 to 24years, 76 percent were high school graduates. Six percentof persons 16 to 19 years old were not in school and notworking.
Children under age 18 represented 25 percent of thepopulation in Seminole County, and 9 percent of childrenlived in poverty. Of the 26,804 persons of all ages living inpoverty, 31 percent were under the age of 18 years.Twenty-six percent of children lived in low-incomehouseholds and 10 percent lived in high povertyneighborhoods.

Multi-Year Trend Data
** method used for calculating changed in 1998Source: Florida Department of Health, Office of Vital Statistics;Florida Department of Education
1992 1993 1994 1995 1996 1997 1998 1999 2000
Children Under Age 6 Below 100% of PovertyGrandparents Responsible 3 or More Years
100
75
50
25
0
Child
ren
Age 3
& 4
Enrol
led
in S
choo
lO
wn Chi
ldre
n Und
er A
ge 6
with
All Par
ents
in th
e La
bor F
orce
Child
ren
Under
Age
6
Below
200
% o
f Pov
erty
Gra
ndpa
rent
s Res
pons
ible
for
and
Livin
g with
Own
Gra
ndch
ildre
n Und
er A
ge 1
8
Own
Child
ren
Under
Age
6
Livin
g in
Sin
gle
Paren
t Hom
es
Per
cent
Source: US Census Bureau, Census 2000, SF1 and SF3
Critical MeasuresCensus 2000
Birth Rate
Teen Birth Rate Age 15-17
Teen Birth Rate Age 15-19
Percent of Births Receiving Early Prenatal Care
Percent of Low Birthweight Births
Percent of Births to Unwed Mothers
Infant Mortality Rate
Teen Violent Death Rate Age 15-19
Percent of Students Eligible for Free/Reduced Lunch
Graduation Rate**
Source: Policy and Services Research Data Center, de la Parte Institute, USF, 2002
Beh
avio
ral H
ealth
and
Juv
enile
Jus
tice
Source: Florida Department of Juvenile Justice, 2003
Source: Florida Department of Juvenile Justice, 2000/01
Chi
ld C
are,
Hea
d S
tart
and
Edu
catio
n
Source: Florida Department of Education, 2001/02
Source: Florida Children’s Forum, 2001
153 Center for the Study of Children’s Futures 2004
13.8 13.7 14.0 13.4 13.1 13.1 12.2 12.5 12.6
27.2 23.8 29.6 31.1 24.8 19.6 18.3 19.3 17.8
43.8 39.9 47.5 47.2 40.7 40.5 36.8 35.3 32.1
86.4 86.6 87.8 88.5 89.7 89.8 88.1 89.4 89.2
7.0 7.0 7.4 7.2 7.2 8.5 8.3 7.8 7.5
25.3 26.3 27.1 27.8 26.7 27.3 27.6 28.8 27.4
8.2 3.0 6.3 5.0 3.9 4.5 5.7 5.2 4.8
1.9 4.3 5.2 3.5 4.6 5.8 5.2 5.0 4.8
25.5 25.2 24.9 25.1 25.3 26.3 26.8 25.5 25.3
80.6 81.0 73.6 78.6 81.4 75.1 63.3 67.0 70.9
57.2
17.4
59.3
27.8
41.2
Seminole County
108 licensed child care centers with a capacity for 11,801 children
12 licensed family child care homes with a capacity for 106 children
16 Head Start programs with a capacity for 303 children
62,766 children were enrolled in 76 public schools
11,285 children were enrolled in exceptional student education programs
1,973 children were referred to English for Speakers of Other Languages Programs
10,455 children were enrolled in 57 non-public schools
1,116 children and families were registered in 838 home education programs
2,067 children received behavioral health services
34 behavioral health service providers served children
2,240 youths were referred to the juvenile justice system
28 youths were transferred to adult court
1 contracted delinquency prevention program with 4 beds or slots
1 state grant funded delinquency prevention program projected to serve 2,100 youths
1 probation and community corrections non-residential program with 20 slots
3 residential and correctional programs with 64 beds
1 detention center with 39 beds

Number Percent Number Percent
Summary Profile for the Population Under Age 18, 1990 to 2000
1990 2000
Age & Sex
Population Under Age 18
Males Under Age 18
Females Under Age 18
Population Under Age 5
Population Age 5 - 17
Race
Children of One Race
White Children
Black or African American Children
American Indian or Alaska Native Children
Asian Children
Native Hawaiian or Other Pacific Islander Children
Children of Some Other Race
Children of Two or More Races
Hispanic Origin Status
Hispanic Children
Non-Hispanic Children
Non-Hispanic White Children
Non-Hispanic Racial Minorities
Living Arrangements
Children Living in Households
Children Living in Group Quarters
Own Children Living in Single Parent Households
Own Children Living in Married Couple Households
Source: Population Reference Bureau analysis of data from the US Census Bureau for the Annie E. Casey Foundation
1999 Income in Dollars as Reported in Census 2000
• •
•
•
Source: US Census Bureau, Census 2000, SF3 Tables P82, P53, P80 and PCT39
Number NumberPercent Percent
Source: US Census Bureau, Census 2000, SF1 and SF3;Florida Almanac, 2002/2003; Florida County Atlas, 1994
154Center for the Study of Children’s Futures 2004
7,005 100.0 8,570 100.0
3,605 51.5 4,467 52.1
3,400 48.5 4,103 47.9
1,888 27.0 2,108 24.6
5,117 73.0 6,462 75.4
N/A N/A 8,405 98.1
5,158 73.6 6,404 74.7
1,728 24.7 1,751 20.4
52 0.7 38 0.4
N/A N/A 33 0.4
N/A N/A 4 0.0
53 0.8 175 2.0
N/A N/A 165 1.9
275 3.9 580 6.8
6,730 96.1 7,990 93.2
4,939 70.5 6,053 70.6
1,791 25.6 1,937 22.6
6,949 99.2 8,554 99.8
56 0.8 16 0.2
1,754 25.0 2,431 28.4
4,268 60.9 4,885 57.0
Per Capita Income .................... 16,830 Median Family Income .............................. 36,999
Median Household Income ...... 32,073 with own children under age 18 ............. 32,507
Median Nonfamily Income....... 17,932 without own children under age 18 ........ 38,178
Sumter County was established in 1853 from aportion of Mosquito County. The county seat isBushnell. This county was known for mining,
primarily limestone; other industries include railtransportation, trucking, meat products, pipe and tubemanufacturing, and metal production.
The county comprises 546 square miles of land and waspopulated by 53,345 persons in 2000. There were 98persons per square mile and the general populationincreased by 69 percent from 1990. Fifty-one percent of thepopulation lived in a rural area. The median age in 2000was 49 years.
There were 25,195 housing units reported with ahomeownership rate of 86 percent. Twenty-two percent ofhouseholds included at least one person under the age of 18years. Annual income was less than $25,000 in 38 percentof all 20,736 households and 37 percent of the 3,961 familyhouseholds with their own children. Four percent of allhouseholds had earnings of $100,000 or greater.
Twenty-three percent of persons age 25 and over did notgraduate from high school and 39 percent graduated withno further education indicated. Twelve percent obtained abachelor’s degree or higher. Of 3,209 persons age 18 to 24years, 61 percent were high school graduates. Eighteenpercent of persons 16 to 19 years old were not in schooland not working.
Children under age 18 represented 16 percent of thepopulation in Sumter County, and 26 percent of childrenlived in poverty. Of the 6,448 persons of all ages living inpoverty, 35 percent were under the age of 18 years. Fifty-nine percent of children lived in low-income householdsand no children lived in high poverty neighborhoods.

Multi-Year Trend Data
** method used for calculating changed in 1998Source: Florida Department of Health, Office of Vital Statistics;Florida Department of Education
1992 1993 1994 1995 1996 1997 1998 1999 2000
Children Under Age 6 Below 100% of PovertyGrandparents Responsible 3 or More Years
100
75
50
25
0
Child
ren
Age 3
& 4
Enrol
led
in S
choo
lO
wn Chi
ldre
n Und
er A
ge 6
with
All Par
ents
in th
e La
bor F
orce
Child
ren
Under
Age
6
Below
200
% o
f Pov
erty
Gra
ndpa
rent
s Res
pons
ible
for
and
Livin
g with
Own
Gra
ndch
ildre
n Und
er A
ge 1
8
Own
Child
ren
Under
Age
6
Livin
g in
Sin
gle
Paren
t Hom
es
Per
cent
Source: US Census Bureau, Census 2000, SF1 and SF3
Critical MeasuresCensus 2000
Birth Rate
Teen Birth Rate Age 15-17
Teen Birth Rate Age 15-19
Percent of Births Receiving Early Prenatal Care
Percent of Low Birthweight Births
Percent of Births to Unwed Mothers
Infant Mortality Rate
Teen Violent Death Rate Age 15-19
Percent of Students Eligible for Free/Reduced Lunch
Graduation Rate**
Source: Policy and Services Research Data Center, de la Parte Institute, USF, 2002
Beh
avio
ral H
ealth
and
Juv
enile
Jus
tice
Source: Florida Department of Juvenile Justice, 2003
Source: Florida Department of Juvenile Justice, 2000/01
Chi
ld C
are,
Hea
d S
tart
and
Edu
catio
n
Source: Florida Department of Education, 2001/02
Source: Florida Children’s Forum, 2001
155 Center for the Study of Children’s Futures 2004
12.8 13.5 11.3 11.5 9.3 9.2 8.5 8.3 9.2
68.3 60.1 83.2 57.8 38.5 47.9 28.7 29.8 39.7
92.0 107.0 105.0 79.4 72.2 82.5 54.3 54.5 83.5
69.4 77.1 77.8 83.5 83.7 82.8 81.8 84.8 84.6
7.8 8.1 5.0 8.0 5.5 7.5 9.9 7.8 9.0
41.4 40.9 40.3 40.8 43.9 40.3 43.5 48.5 41.9
0.0 8.8 12.6 14.2 13.2 9.7 2.4 14.2 6.3
4.8 9.6 9.4 0.0 3.9 3.4 6.3 3.0 7.9
57.8 61.1 62.6 61.9 62.9 63.2 62.5 60.6 59.1
68.5 66.5 56.8 67.0 76.8 74.5 71.4 74.8 73.1
43.4
26.5
64.459.0
48.2
Sumter County
10 licensed child care centers with a capacity for 611 children
10 licensed family child care homes with a capacity for 100 children
5 Head Start programs with a capacity for 93 children
6,396 children were enrolled in 15 public schools
1,379 children were enrolled in exceptional student education programs
242 children were referred to English for Speakers of Other Languages Programs
55 children were enrolled in 2 non-public schools
169 children and families were registered in 107 home education programs
382 children received behavioral health services
14 behavioral health service providers served children
243 youths were referred to the juvenile justice system
3 youths were transferred to adult court
0 contracted delinquency prevention programs
1 state grant funded delinquency prevention program projected to serve 300 youths
0 probation and community corrections non-residential programs
0 residential and correctional programs
0 detention centers

Number Percent Number Percent
Summary Profile for the Population Under Age 18, 1990 to 2000
1990 2000
Age & Sex
Population Under Age 18
Males Under Age 18
Females Under Age 18
Population Under Age 5
Population Age 5 - 17
Race
Children of One Race
White Children
Black or African American Children
American Indian or Alaska Native Children
Asian Children
Native Hawaiian or Other Pacific Islander Children
Children of Some Other Race
Children of Two or More Races
Hispanic Origin Status
Hispanic Children
Non-Hispanic Children
Non-Hispanic White Children
Non-Hispanic Racial Minorities
Living Arrangements
Children Living in Households
Children Living in Group Quarters
Own Children Living in Single Parent Households
Own Children Living in Married Couple Households
Source: Population Reference Bureau analysis of data from the US Census Bureau for the Annie E. Casey Foundation
1999 Income in Dollars as Reported in Census 2000
• •
•
•
Source: US Census Bureau, Census 2000, SF3 Tables P82, P53, P80 and PCT39
Number NumberPercent Percent
Source: US Census Bureau, Census 2000, SF1 and SF3;Florida Almanac, 2002/2003; Florida County Atlas, 1994
156Center for the Study of Children’s Futures 2004
7,098 100.0 8,369 100.0
3,709 52.3 4,263 50.9
3,389 47.7 4,106 49.1
1,657 23.3 2,099 25.1
5,441 76.7 6,270 74.9
N/A N/A 8,199 98.0
5,601 78.9 6,603 78.9
1,416 19.9 1,375 16.4
23 0.3 32 0.4
N/A N/A 51 0.6
N/A N/A 4 0.0
34 0.5 134 1.6
N/A N/A 170 2.0
114 1.6 500 6.0
6,984 98.4 7,869 94.0
5,537 78.0 6,278 75.0
1,447 20.4 1,591 19.0
7,008 98.7 8,363 99.9
90 1.3 6 0.1
1,395 19.7 1,927 23.0
4,651 65.5 5,192 62.0
Per Capita Income .................... 14,678 Median Family Income .............................. 34,032
Median Household Income ...... 29,963 with own children under age 18 ............. 31,504
Median Nonfamily Income....... 15,656 without own children under age 18 ........ 35,728
Suwannee County was established in 1858 fromColumbia County and named for the SuwanneeRiver. The county seat is Live Oak. This county
has an abundance of forests, lakes, rivers, and clearsprings. It is known among skin divers, fishermen, andhunters. Poultry, mining, boat manufacturing, andornamental plants are the major industries.
The county comprises 688 square miles of land and waspopulated by 34,844 persons in 2000. There were 51persons per square mile and the general populationincreased by 30 percent from 1990. Eighty-one percent ofthe population lived in a rural area. The median age in 2000was 40 years.
There were 15,679 housing units reported with ahomeownership rate of 81 percent. Thirty-four percent ofhouseholds included at least one person under the age of 18years. Annual income was less than $25,000 in 41 percentof all 13,490 households and 34 percent of the 4,133 familyhouseholds with their own children. Four percent of allhouseholds had earnings of $100,000 or greater.
Twenty-seven percent of persons age 25 and over did notgraduate from high school and 39 percent graduated withno further education indicated. Ten percent obtained abachelor’s degree or higher. Of 3,003 persons age 18 to 24years, 63 percent were high school graduates. Twelvepercent of persons 16 to 19 years old were not in schooland not working.
Children under age 18 represented 24 percent of thepopulation in Suwannee County, and 22 percent of childrenlived in poverty. Of the 6,325 persons of all ages living inpoverty, 29 percent were under the age of 18 years. Fifty-six percent of children lived in low-income households and30 percent lived in high poverty neighborhoods.

Multi-Year Trend Data
** method used for calculating changed in 1998Source: Florida Department of Health, Office of Vital Statistics;Florida Department of Education
1992 1993 1994 1995 1996 1997 1998 1999 2000
Children Under Age 6 Below 100% of PovertyGrandparents Responsible 3 or More Years
100
75
50
25
0
Child
ren
Age 3
& 4
Enrol
led
in S
choo
lO
wn Chi
ldre
n Und
er A
ge 6
with
All Par
ents
in th
e La
bor F
orce
Child
ren
Under
Age
6
Below
200
% o
f Pov
erty
Gra
ndpa
rent
s Res
pons
ible
for
and
Livin
g with
Own
Gra
ndch
ildre
n Und
er A
ge 1
8
Own
Child
ren
Under
Age
6
Livin
g in
Sin
gle
Paren
t Hom
es
Per
cent
Source: US Census Bureau, Census 2000, SF1 and SF3
Critical MeasuresCensus 2000
Birth Rate
Teen Birth Rate Age 15-17
Teen Birth Rate Age 15-19
Percent of Births Receiving Early Prenatal Care
Percent of Low Birthweight Births
Percent of Births to Unwed Mothers
Infant Mortality Rate
Teen Violent Death Rate Age 15-19
Percent of Students Eligible for Free/Reduced Lunch
Graduation Rate**
Source: Policy and Services Research Data Center, de la Parte Institute, USF, 2002
Beh
avio
ral H
ealth
and
Juv
enile
Jus
tice
Source: Florida Department of Juvenile Justice, 2003
Source: Florida Department of Juvenile Justice, 2000/01
Chi
ld C
are,
Hea
d S
tart
and
Edu
catio
n
Source: Florida Department of Education, 2001/02
Source: Florida Children’s Forum, 2001
157 Center for the Study of Children’s Futures 2004
12.1 13.1 12.0 11.5 12.1 12.3 13.5 13.6 13.1
37.3 55.0 48.1 38.8 40.9 32.4 46.7 39.4 54.8
67.6 81.9 76.4 62.6 68.3 65.6 75.8 71.1 69.7
76.0 82.7 81.5 78.6 77.1 74.9 82.2 81.1 79.5
9.6 5.5 7.4 8.2 11.1 8.5 8.6 8.1 8.4
34.9 36.9 34.6 36.9 33.7 37.2 32.9 35.8 37.2
9.0 5.5 11.3 2.8 15.8 9.7 17.5 12.7 21.5
9.4 9.1 22.5 4.2 21.8 24.3 8.0 7.9 3.8
24.5 47.5 44.6 43.2 44.9 45.8 45.6 46.2 47.3
81.4 67.5 72.2 67.2 70.1 62.6 60.6 57.7 60.7
47.4
20.1
55.0
61.6 59.7
Suwannee County
10 licensed child care centers with a capacity for 544 children
2 licensed family child care homes with a capacity for 20 children
3 Head Start programs with a capacity for 57 children
5,800 children were enrolled in 11 public schools
838 children were enrolled in exceptional student education programs
127 children were referred to English for Speakers of Other Languages Programs
368 children were enrolled in 4 non-public schools
209 children and families were registered in 137 home education programs
371 children received behavioral health services
12 behavioral health service providers served children
294 youths were referred to the juvenile justice system
10 youths were transferred to adult court
0 contracted delinquency prevention programs
1 state grant funded delinquency prevention program projected to serve 100 youths
0 probation and community corrections non-residential programs
0 residential and correctional programs
0 detention centers

Number Percent Number Percent
Summary Profile for the Population Under Age 18, 1990 to 2000
1990 2000
Age & Sex
Population Under Age 18
Males Under Age 18
Females Under Age 18
Population Under Age 5
Population Age 5 - 17
Race
Children of One Race
White Children
Black or African American Children
American Indian or Alaska Native Children
Asian Children
Native Hawaiian or Other Pacific Islander Children
Children of Some Other Race
Children of Two or More Races
Hispanic Origin Status
Hispanic Children
Non-Hispanic Children
Non-Hispanic White Children
Non-Hispanic Racial Minorities
Living Arrangements
Children Living in Households
Children Living in Group Quarters
Own Children Living in Single Parent Households
Own Children Living in Married Couple Households
Source: Population Reference Bureau analysis of data from the US Census Bureau for the Annie E. Casey Foundation
1999 Income in Dollars as Reported in Census 2000
• •
•
•
Source: US Census Bureau, Census 2000, SF3 Tables P82, P53, P80 and PCT39
Number NumberPercent Percent
Source: US Census Bureau, Census 2000, SF1 and SF3;Florida Almanac, 2002/2003; Florida County Atlas, 1994
158Center for the Study of Children’s Futures 2004
4,823 100.0 4,731 100.0
2,402 49.8 2,402 50.8
2,421 50.2 2,329 49.2
1,333 27.6 1,139 24.1
3,490 72.4 3,592 75.9
N/A N/A 4,663 98.6
3,583 74.3 3,518 74.4
1,162 24.1 1,057 22.3
55 1.1 44 0.9
N/A N/A 22 0.5
N/A N/A 1 0.0
12 0.2 21 0.4
N/A N/A 68 1.4
60 1.2 95 2.0
4,763 98.8 4,636 98.0
3,545 73.5 3,468 73.3
1,218 25.3 1,168 24.7
4,822 100.0 4,729 100.0
1 0.0 2 0.0
1,058 21.9 1,378 29.1
3,124 64.8 2,634 55.7
Per Capita Income .................... 15,281 Median Family Income .............................. 35,061
Median Household Income ...... 30,032 with own children under age 18 ............. 33,592
Median Nonfamily Income....... 13,887 without own children under age 18 ........ 36,103
Taylor County was established in 1856 from aportion of Madison County and was named forZachary Taylor, the twelfth U.S. President. The
county has a long shoreline along the Gulf of Mexicobut is primarily comprised of commercial forests. Thecounty seat is Perry. The industries are pulp andcellulose production, construction, fencing, mulch,pyrotechnics, and lumber.
The county comprises 1,042 square miles of land and waspopulated by 19,256 persons in 2000. There were 19persons per square mile and the general populationincreased by 13 percent from 1990. Sixty-six percent of thepopulation lived in a rural area. The median age in 2000was 38 years.
There were 9,646 housing units reported with ahomeownership rate of 80 percent. Thirty-seven percent ofhouseholds included at least one person under the age of 18years. Annual income was less than $25,000 in 42 percentof all 7,161 households and 37 percent of the 2,339 familyhouseholds with their own children. Five percent of allhouseholds had earnings of $100,000 or greater.
Thirty percent of persons age 25 and over did not graduatefrom high school and 41 percent graduated with no furthereducation indicated. Nine percent obtained a bachelor’sdegree or higher. Of 1,595 persons age 18 to 24 years, 64percent were high school graduates. Twelve percent ofpersons 16 to 19 years old were not in school and notworking.
Children under age 18 represented 25 percent of thepopulation in Taylor County, and 23 percent of childrenlived in poverty. Of the 3,229 persons of all ages living inpoverty, 32 percent were under the age of 18 years. Fifty-three percent of children lived in low-income householdsand 35 percent lived in high poverty neighborhoods.

Multi-Year Trend Data
** method used for calculating changed in 1998Source: Florida Department of Health, Office of Vital Statistics;Florida Department of Education
1992 1993 1994 1995 1996 1997 1998 1999 2000
Children Under Age 6 Below 100% of PovertyGrandparents Responsible 3 or More Years
100
75
50
25
0
Child
ren
Age 3
& 4
Enrol
led
in S
choo
lO
wn Chi
ldre
n Und
er A
ge 6
with
All Par
ents
in th
e La
bor F
orce
Child
ren
Under
Age
6
Below
200
% o
f Pov
erty
Gra
ndpa
rent
s Res
pons
ible
for
and
Livin
g with
Own
Gra
ndch
ildre
n Und
er A
ge 1
8
Own
Child
ren
Under
Age
6
Livin
g in
Sin
gle
Paren
t Hom
es
Per
cent
Source: US Census Bureau, Census 2000, SF1 and SF3
Critical MeasuresCensus 2000
Birth Rate
Teen Birth Rate Age 15-17
Teen Birth Rate Age 15-19
Percent of Births Receiving Early Prenatal Care
Percent of Low Birthweight Births
Percent of Births to Unwed Mothers
Infant Mortality Rate
Teen Violent Death Rate Age 15-19
Percent of Students Eligible for Free/Reduced Lunch
Graduation Rate**
Source: Policy and Services Research Data Center, de la Parte Institute, USF, 2002
Beh
avio
ral H
ealth
and
Juv
enile
Jus
tice
Source: Florida Department of Juvenile Justice, 2003
Source: Florida Department of Juvenile Justice, 2000/01
Chi
ld C
are,
Hea
d S
tart
and
Edu
catio
n
Source: Florida Department of Education, 2001/02
Source: Florida Children’s Forum, 2001
159 Center for the Study of Children’s Futures 2004
14.8 15.2 13.1 11.6 12.1 12.1 12.2 12.1 12.0
50.4 70.6 50.3 56.2 39.9 38.6 40.7 31.4 48.4
99.4 129.0 108.2 75.4 62.1 70.9 78.1 69.3 79.2
87.9 87.1 89.5 91.9 87.3 83.2 88.4 93.3 88.8
7.4 8.3 11.4 10.3 9.2 11.2 9.1 11.2 7.2
33.9 44.5 41.0 39.0 34.2 45.7 39.0 43.2 44.6
11.7 3.8 4.4 4.7 8.8 8.6 4.1 16.6 0.0
0.0 9.4 10.0 16.1 0.0 7.7 0.0 15.1 7.2
43.9 50.6 22.4 50.6 46.7 47.8 46.9 45.2 49.9
70.8 65.3 57.8 82.6 75.5 66.1 61.4 55.1 58.2
51.3
28.8
58.2 58.6
69.4
Taylor County
6 licensed child care centers with a capacity for 267 children
3 licensed family child care homes with a capacity for 173 children
9 Head Start programs with a capacity for 153 children
3,646 children were enrolled in 9 public schools
788 children were enrolled in exceptional student education programs
6 children were referred to English for Speakers of Other Languages Programs
12 children were enrolled in 1 non-public school
105 children and families were registered in 67 home education programs
180 children received behavioral health services
13 behavioral health service providers served children
171 youths were referred to the juvenile justice system
4 youths were transferred to adult court
0 contracted delinquency prevention programs
1 state grant funded delinquency prevention program projected to serve 450 youths
0 probation and community corrections non-residential programs
0 residential and correctional programs
0 detention centers

Number Percent Number Percent
Summary Profile for the Population Under Age 18, 1990 to 2000
1990 2000
Age & Sex
Population Under Age 18
Males Under Age 18
Females Under Age 18
Population Under Age 5
Population Age 5 - 17
Race
Children of One Race
White Children
Black or African American Children
American Indian or Alaska Native Children
Asian Children
Native Hawaiian or Other Pacific Islander Children
Children of Some Other Race
Children of Two or More Races
Hispanic Origin Status
Hispanic Children
Non-Hispanic Children
Non-Hispanic White Children
Non-Hispanic Racial Minorities
Living Arrangements
Children Living in Households
Children Living in Group Quarters
Own Children Living in Single Parent Households
Own Children Living in Married Couple Households
Source: Population Reference Bureau analysis of data from the US Census Bureau for the Annie E. Casey Foundation
1999 Income in Dollars as Reported in Census 2000
• •
•
•
Source: US Census Bureau, Census 2000, SF3 Tables P82, P53, P80 and PCT39
Number NumberPercent Percent
Source: US Census Bureau, Census 2000, SF1 and SF3;Florida Almanac, 2002/2003; Florida County Atlas, 1994
160Center for the Study of Children’s Futures 2004
2,635 100.0 2,937 100.0
1,392 52.8 1,521 51.8
1,243 47.2 1,416 48.2
680 25.8 737 25.1
1,955 74.2 2,200 74.9
N/A N/A 2,885 98.2
2,111 80.1 2,354 80.1
504 19.1 501 17.1
3 0.1 5 0.2
N/A N/A 5 0.2
N/A N/A 0 0.0
8 0.3 20 0.7
N/A N/A 52 1.8
44 1.7 61 2.1
2,591 98.3 2,876 97.9
2,078 78.9 2,327 79.2
513 19.5 549 18.7
2,619 99.4 2,887 98.3
16 0.6 50 1.7
559 21.2 769 26.2
1,844 70.0 1,799 61.3
Per Capita Income .................... 12,333 Median Family Income .............................. 37,516
Median Household Income ...... 34,563 with own children under age 18 ............. 37,184
Median Nonfamily Income....... 16,486 without own children under age 18 ........ 38,534
Union County was established in 1921 from aportion of Bradford County. The county seat isLake Butler. Employment is provided by
several large state prison facilities. The land isprimarily forest; industries include lumber, clothing,trucking, and health care.
The county comprises 240 square miles of land and waspopulated by 13,442 persons in 2000. There were 56persons per square mile and the general populationincreased by 31 percent from 1990. Fifty-two percent ofthe population lived in a rural area. The median age in 2000was 36 years.
There were 3,736 housing units reported with ahomeownership rate of 75 percent. Forty-six percent ofhouseholds included at least one person under the age of 18years. Annual income was less than $25,000 in 34 percentof all 3,365 households and 26 percent of the 1,471 familyhouseholds with their own children. Four percent of allhouseholds had earnings of $100,000 or greater.
Twenty-eight percent of persons age 25 and over did notgraduate from high school and 39 percent graduated withno further education indicated. Eight percent obtained abachelor’s degree or higher. Of 1,139 persons age 18 to 24years, 61 percent were high school graduates. Twentypercent of persons 16 to 19 years old were not in schooland not working.
Children under age 18 represented 22 percent of thepopulation in Union County, and 15 percent of childrenlived in poverty. Of the 1,298 persons of all ages living inpoverty, 34 percent were under the age of 18 years. Forty-seven percent of children lived in low-income householdsand no children lived in high poverty neighborhoods.

Multi-Year Trend Data
** method used for calculating changed in 1998Source: Florida Department of Health, Office of Vital Statistics;Florida Department of Education
1992 1993 1994 1995 1996 1997 1998 1999 2000
Children Under Age 6 Below 100% of PovertyGrandparents Responsible 3 or More Years
100
75
50
25
0
Child
ren
Age 3
& 4
Enrol
led
in S
choo
lO
wn Chi
ldre
n Und
er A
ge 6
with
All Par
ents
in th
e La
bor F
orce
Child
ren
Under
Age
6
Below
200
% o
f Pov
erty
Gra
ndpa
rent
s Res
pons
ible
for
and
Livin
g with
Own
Gra
ndch
ildre
n Und
er A
ge 1
8
Own
Child
ren
Under
Age
6
Livin
g in
Sin
gle
Paren
t Hom
es
Per
cent
Source: US Census Bureau, Census 2000, SF1 and SF3
Critical MeasuresCensus 2000
Birth Rate
Teen Birth Rate Age 15-17
Teen Birth Rate Age 15-19
Percent of Births Receiving Early Prenatal Care
Percent of Low Birthweight Births
Percent of Births to Unwed Mothers
Infant Mortality Rate
Teen Violent Death Rate Age 15-19
Percent of Students Eligible for Free/Reduced Lunch
Graduation Rate**
Source: Policy and Services Research Data Center, de la Parte Institute, USF, 2002
Beh
avio
ral H
ealth
and
Juv
enile
Jus
tice
Source: Florida Department of Juvenile Justice, 2003
Source: Florida Department of Juvenile Justice, 2000/01
Chi
ld C
are,
Hea
d S
tart
and
Edu
catio
n
Source: Florida Department of Education, 2001/02
Source: Florida Children’s Forum, 2001
161 Center for the Study of Children’s Futures 2004
12.0 11.5 9.0 10.2 9.3 9.8 11.6 11.3 9.2
29.9 46.0 41.7 39.8 48.1 46.9 50.2 26.7 36.1
75.6 88.1 62.0 77.6 72.6 76.7 90.1 84.8 58.1
81.8 79.7 89.2 90.7 81.5 79.1 84.1 86.6 88.5
8.0 9.0 6.3 7.8 9.2 5.4 3.2 8.9 7.5
31.4 30.6 31.3 27.1 31.7 34.9 43.9 36.3 36.1
29.2 0.0 0.0 15.5 8.3 15.5 6.4 6.4 7.5
0.0 0.0 0.0 11.1 0.0 0.0 12.1 23.6 0.0
40.7 38.3 40.0 43.1 42.2 42.2 38.4 42.4 42.0
59.8 80.2 64.6 81.4 73.5 83.9 61.0 58.8 63.2
36.1
27.0
64.2
54.3
63.7
Union County
2 licensed child care centers with a capacity for 144 children
0 licensed family child care homes
1 Head Start program with a capacity for 20 children
2,130 children were enrolled in 7 public schools
391 children were enrolled in exceptional student education programs
2 children were referred to English for Speakers of Other Languages Programs
0 children were enrolled in non-public schools
52 children and families were registered in 38 home education programs
95 children received behavioral health services
7 behavioral health service providers served children
66 youths were referred to the juvenile justice system
0 youths were transferred to adult court
1 contracted delinquency prevention program with 100 beds or slots
1 state grant funded delinquency prevention program projected to serve 32 youths
0 probation and community corrections non-residential programs
2 residential and correctional programs with 44 beds
0 detention centers

Number Percent Number Percent
Summary Profile for the Population Under Age 18, 1990 to 2000
1990 2000
Age & Sex
Population Under Age 18
Males Under Age 18
Females Under Age 18
Population Under Age 5
Population Age 5 - 17
Race
Children of One Race
White Children
Black or African American Children
American Indian or Alaska Native Children
Asian Children
Native Hawaiian or Other Pacific Islander Children
Children of Some Other Race
Children of Two or More Races
Hispanic Origin Status
Hispanic Children
Non-Hispanic Children
Non-Hispanic White Children
Non-Hispanic Racial Minorities
Living Arrangements
Children Living in Households
Children Living in Group Quarters
Own Children Living in Single Parent Households
Own Children Living in Married Couple Households
Source: Population Reference Bureau analysis of data from the US Census Bureau for the Annie E. Casey Foundation
1999 Income in Dollars as Reported in Census 2000
• •
•
•
Source: US Census Bureau, Census 2000, SF3 Tables P82, P53, P80 and PCT39
Number NumberPercent Percent
Source: US Census Bureau, Census 2000, SF1 and SF3;Florida Almanac, 2002/2003; Florida County Atlas, 1994
162Center for the Study of Children’s Futures 2004
73,023 100.0 89,862 100.0
37,470 51.3 46,171 51.4
35,553 48.7 43,691 48.6
21,242 29.1 21,657 24.1
51,781 70.9 68,205 75.9
N/A N/A 87,464 97.3
59,698 81.8 70,532 78.5
10,490 14.4 12,633 14.1
207 0.3 292 0.3
N/A N/A 953 1.1
N/A N/A 29 0.0
1,949 2.7 3,025 3.4
N/A N/A 2,398 2.7
4,632 6.3 8,984 10.0
68,391 93.7 80,878 90.0
57,140 78.2 65,409 72.8
11,251 15.4 15,469 17.2
71,579 98.0 89,134 99.2
1,444 2.0 728 0.8
15,256 20.9 24,108 26.8
48,414 66.3 54,548 60.7
Per Capita Income .................... 19,664 Median Family Income .............................. 41,767
Median Household Income ...... 35,219 with own children under age 18 ............. 40,244
Median Nonfamily Income....... 22,095 without own children under age 18 ........ 42,637
V olusia County was established in 1854 from aportion of Mosquito County and is on theAtlantic Coast. The county seat is DeLand.
Tourism is the primary asset and industry, with notablelengthy, hard sand beaches and well-known DaytonaBeach. It also has many wetlands and wildlife refuges.Other industries include medical supplies, electronics,acoustics, plastic and transportation.
The county comprises 1,103 square miles of land and waspopulated by 443,343 persons in 2000. There were 402persons per square mile and the general populationincreased by 20 percent from 1990. Nine percent of thepopulation lived in a rural area. The median age in 2000was 42 years.
There were 211,938 housing units reported with ahomeownership rate of 75 percent. Twenty-seven percentof households included at least one person under the age of18 years. Annual income was less than $25,000 in 34percent of all 184,721 households and 28 percent of the45,192 family households with their own children. Sevenpercent of all households had earnings of $100,000 orgreater.
Eighteen percent of persons age 25 and over did notgraduate from high school and 32 percent graduated withno further education indicated. Eighteen percent obtained abachelor’s degree or higher. Of 36,662 persons age 18 to 24years, 75 percent were high school graduates. Nine percentof persons 16 to 19 years old were not in school and notworking.
Children under age 18 represented 20 percent of thepopulation in Volusia County, and 17 percent of childrenlived in poverty. Of the 49,907 persons of all ages living inpoverty, 29 percent were under the age of 18 years. Forty-two percent of children lived in low-income householdsand 14 percent lived in high poverty neighborhoods.

Multi-Year Trend Data
** method used for calculating changed in 1998Source: Florida Department of Health, Office of Vital Statistics;Florida Department of Education
1992 1993 1994 1995 1996 1997 1998 1999 2000
Children Under Age 6 Below 100% of PovertyGrandparents Responsible 3 or More Years
100
75
50
25
0
Child
ren
Age 3
& 4
Enrol
led
in S
choo
lO
wn Chi
ldre
n Und
er A
ge 6
with
All Par
ents
in th
e La
bor F
orce
Child
ren
Under
Age
6
Below
200
% o
f Pov
erty
Gra
ndpa
rent
s Res
pons
ible
for
and
Livin
g with
Own
Gra
ndch
ildre
n Und
er A
ge 1
8
Own
Child
ren
Under
Age
6
Livin
g in
Sin
gle
Paren
t Hom
es
Per
cent
Source: US Census Bureau, Census 2000, SF1 and SF3
Critical MeasuresCensus 2000
Birth Rate
Teen Birth Rate Age 15-17
Teen Birth Rate Age 15-19
Percent of Births Receiving Early Prenatal Care
Percent of Low Birthweight Births
Percent of Births to Unwed Mothers
Infant Mortality Rate
Teen Violent Death Rate Age 15-19
Percent of Students Eligible for Free/Reduced Lunch
Graduation Rate**
Source: Policy and Services Research Data Center, de la Parte Institute, USF, 2002
Beh
avio
ral H
ealth
and
Juv
enile
Jus
tice
Source: Florida Department of Juvenile Justice, 2003
Source: Florida Department of Juvenile Justice, 2000/01
Chi
ld C
are,
Hea
d S
tart
and
Edu
catio
n
Source: Florida Department of Education, 2001/02
Source: Florida Children’s Forum, 2001
163 Center for the Study of Children’s Futures 2004
11.6 11.2 11.1 10.6 10.2 11.0 10.5 10.4 10.2
38.3 37.9 41.2 45.1 35.1 34.8 30.4 27.7 21.5
55.4 56.5 58.9 59.2 48.9 54.3 50.9 49.7 39.4
71.5 77.1 80.2 85.0 87.6 86.9 87.9 87.8 87.1
6.9 7.0 7.1 7.6 7.3 7.8 8.2 8.5 7.8
32.0 33.2 34.7 36.7 35.6 37.3 38.6 38.7 40.4
7.2 10.7 4.7 5.6 6.7 5.1 7.9 5.2 8.7
4.5 5.4 4.6 10.4 4.8 4.6 3.3 5.7 3.9
33.8 38.0 40.5 39.9 39.7 40.2 38.1 36.5 37.6
79.9 86.5 81.2 82.0 79.8 76.8 70.1 74.9 77.0
54.9
24.0
61.4
44.046.9
Volusia County
134 licensed child care centers with a capacity for 10,160 children
133 licensed family child care homes with a capacity for 1,270 children
37 Head Start programs with a capacity for 600 children
62,416 children were enrolled in 92 public schools
12,833 children were enrolled in exceptional student education programs
1,794 children were referred to English for Speakers of Other Languages Programs
7,198 children were enrolled in 51 non-public schools
1,163 children and families were registered in 790 home education programs
4,594 children received behavioral health services
34 behavioral health service providers served children
3,646 youths were referred to the juvenile justice system
59 youths were transferred to adult court
3 contracted delinquency prevention programs with 65 beds or slots
1 state grant funded delinquency prevention program projected to serve 195 youths
2 probation and community corrections non-residential programs with 350 slots
4 residential and correctional programs with 153 beds
1 detention center with 90 beds

Number Percent Number Percent
Summary Profile for the Population Under Age 18, 1990 to 2000
1990 2000
Age & Sex
Population Under Age 18
Males Under Age 18
Females Under Age 18
Population Under Age 5
Population Age 5 - 17
Race
Children of One Race
White Children
Black or African American Children
American Indian or Alaska Native Children
Asian Children
Native Hawaiian or Other Pacific Islander Children
Children of Some Other Race
Children of Two or More Races
Hispanic Origin Status
Hispanic Children
Non-Hispanic Children
Non-Hispanic White Children
Non-Hispanic Racial Minorities
Living Arrangements
Children Living in Households
Children Living in Group Quarters
Own Children Living in Single Parent Households
Own Children Living in Married Couple Households
Source: Population Reference Bureau analysis of data from the US Census Bureau for the Annie E. Casey Foundation
1999 Income in Dollars as Reported in Census 2000
• •
•
•
Source: US Census Bureau, Census 2000, SF3 Tables P82, P53, P80 and PCT39
Number NumberPercent Percent
Source: US Census Bureau, Census 2000, SF1 and SF3;Florida Almanac, 2002/2003; Florida County Atlas, 1994
164Center for the Study of Children’s Futures 2004
4,020 100.0 5,864 100.0
2,065 51.4 3,057 52.1
1,955 48.6 2,807 47.9
991 24.7 1,352 23.1
3,029 75.3 4,512 76.9
N/A N/A 5,766 98.3
3,305 82.2 5,008 85.4
669 16.6 678 11.6
32 0.8 34 0.6
N/A N/A 7 0.1
N/A N/A 2 0.0
4 0.1 37 0.6
N/A N/A 98 1.7
20 0.5 129 2.2
4,000 99.5 5,735 97.8
3,292 81.9 4,932 84.1
708 17.6 803 13.7
4,020 100.0 5,859 99.9
0 0.0 5 0.1
932 23.2 1,479 25.2
2,650 65.9 3,829 65.3
Per Capita Income .................... 17,678 Median Family Income .............................. 42,222
Median Household Income ...... 37,149 with own children under age 18 ............. 40,594
Median Nonfamily Income....... 23,514 without own children under age 18 ........ 43,946
Wakulla County was established in 1843 froma portion of Leon County. The southernboundary is on the Gulf of Mexico and is an
area noted for fishing and seafood. The ApalachicolaNational Forest comprises much of the land. Thecounty seat is Crawfordville. Suburban housing hasbeen a growing economic industry along withcommercial fishing.
The county comprises 607 square miles of land and waspopulated by 22,863 persons in 2000. There were 38persons per square mile and the general populationincreased by 61 percent from 1990. One hundred percent ofthe population lived in a rural area. The median age in 2000was 37 years.
There were 9,820 housing units reported with ahomeownership rate of 84 percent. Thirty-nine percent ofhouseholds included at least one person under the age of 18years. Annual income was less than $25,000 in 30 percentof all 8,456 households and 27 percent of the 3,162 familyhouseholds with their own children. Seven percent of allhouseholds had earnings of $100,000 or greater.
Twenty-two percent of persons age 25 and over did notgraduate from high school and 35 percent graduated withno further education indicated. Sixteen percent obtained abachelor’s degree or higher. Of 1,784 persons age 18 to 24years, 64 percent were high school graduates. Twelvepercent of persons 16 to 19 years old were not in schooland not working.
Children under age 18 represented 26 percent of thepopulation in Wakulla County, and 15 percent of childrenlived in poverty. Of the 2,437 persons of all ages living inpoverty, 36 percent were under the age of 18 years. Fortypercent of children lived in low-income households and nochildren lived in high poverty neighborhoods.

Multi-Year Trend Data
** method used for calculating changed in 1998Source: Florida Department of Health, Office of Vital Statistics;Florida Department of Education
1992 1993 1994 1995 1996 1997 1998 1999 2000
Children Under Age 6 Below 100% of PovertyGrandparents Responsible 3 or More Years
100
75
50
25
0
Child
ren
Age 3
& 4
Enrol
led
in S
choo
lO
wn Chi
ldre
n Und
er A
ge 6
with
All Par
ents
in th
e La
bor F
orce
Child
ren
Under
Age
6
Below
200
% o
f Pov
erty
Gra
ndpa
rent
s Res
pons
ible
for
and
Livin
g with
Own
Gra
ndch
ildre
n Und
er A
ge 1
8
Own
Child
ren
Under
Age
6
Livin
g in
Sin
gle
Paren
t Hom
es
Per
cent
Source: US Census Bureau, Census 2000, SF1 and SF3
Critical MeasuresCensus 2000
Birth Rate
Teen Birth Rate Age 15-17
Teen Birth Rate Age 15-19
Percent of Births Receiving Early Prenatal Care
Percent of Low Birthweight Births
Percent of Births to Unwed Mothers
Infant Mortality Rate
Teen Violent Death Rate Age 15-19
Percent of Students Eligible for Free/Reduced Lunch
Graduation Rate**
Source: Policy and Services Research Data Center, de la Parte Institute, USF, 2002
Beh
avio
ral H
ealth
and
Juv
enile
Jus
tice
Source: Florida Department of Juvenile Justice, 2003
Source: Florida Department of Juvenile Justice, 2000/01
Chi
ld C
are,
Hea
d S
tart
and
Edu
catio
n
Source: Florida Department of Education, 2001/02
Source: Florida Children’s Forum, 2001
165 Center for the Study of Children’s Futures 2004
14.4 13.7 11.6 12.1 12.2 12.1 12.7 13.1 13.3
50.6 40.7 39.3 61.3 26.3 39.4 22.1 38.0 28.6
79.5 58.5 51.0 71.7 43.5 61.8 68.9 74.0 57.5
85.2 89.3 94.2 89.4 91.0 88.5 89.5 91.9 90.9
6.1 5.9 11.6 8.7 9.8 7.5 8.2 8.5 9.8
37.3 33.2 31.1 32.7 31.7 36.1 33.6 38.6 30.3
9.4 4.9 5.3 9.6 4.5 8.8 11.7 14.7 3.5
0.0 8.8 16.8 0.0 22.1 0.0 6.7 19.5 11.5
38.2 39.8 37.0 36.5 36.1 35.9 33.7 32.4 32.8
90.0 76.3 78.6 80.1 75.5 70.7 76.2 73.7 72.5
69.3
20.0
63.9
46.7
62.3
Wakulla County
6 licensed child care centers with a capacity for 307 children
0 licensed family child care homes
2 Head Start programs with a capacity for 40 children
4,688 children were enrolled in 12 public schools
1,048 children were enrolled in exceptional student education programs
8 children were referred to English for Speakers of Other Languages Programs
21 children were enrolled in 1 non-public school
81 children and families were registered in 60 home education programs
384 children received behavioral health services
16 behavioral health service providers served children
183 youths were referred to the juvenile justice system
1 youth was transferred to adult court
0 contracted delinquency prevention programs
1 state grant funded delinquency prevention program projected to serve 50 youths
0 probation and community corrections non-residential programs
0 residential and correctional programs
0 detention centers

Number Percent Number Percent
Summary Profile for the Population Under Age 18, 1990 to 2000
1990 2000
Age & Sex
Population Under Age 18
Males Under Age 18
Females Under Age 18
Population Under Age 5
Population Age 5 - 17
Race
Children of One Race
White Children
Black or African American Children
American Indian or Alaska Native Children
Asian Children
Native Hawaiian or Other Pacific Islander Children
Children of Some Other Race
Children of Two or More Races
Hispanic Origin Status
Hispanic Children
Non-Hispanic Children
Non-Hispanic White Children
Non-Hispanic Racial Minorities
Living Arrangements
Children Living in Households
Children Living in Group Quarters
Own Children Living in Single Parent Households
Own Children Living in Married Couple Households
Source: Population Reference Bureau analysis of data from the US Census Bureau for the Annie E. Casey Foundation
1999 Income in Dollars as Reported in Census 2000
• •
•
•
Source: US Census Bureau, Census 2000, SF3 Tables P82, P53, P80 and PCT39
Number NumberPercent Percent
Source: US Census Bureau, Census 2000, SF1 and SF3;Florida Almanac, 2002/2003; Florida County Atlas, 1994
166Center for the Study of Children’s Futures 2004
6,594 100.0 8,795 100.0
3,469 52.6 4,522 51.4
3,125 47.4 4,273 48.6
1,746 26.5 2,158 24.5
4,848 73.5 6,637 75.5
N/A N/A 8,527 97.0
5,772 87.5 7,589 86.3
654 9.9 677 7.7
122 1.9 120 1.4
N/A N/A 25 0.3
N/A N/A 6 0.1
6 0.1 110 1.3
N/A N/A 268 3.0
73 1.1 267 3.0
6,521 98.9 8,528 97.0
5,715 86.7 7,450 84.7
806 12.2 1,078 12.3
6,594 100.0 8,780 99.8
0 0.0 15 0.2
1,462 22.2 2,273 25.8
4,472 67.8 5,469 62.2
Per Capita Income .................... 18,198 Median Family Income .............................. 37,663
Median Household Income ...... 32,407 with own children under age 18 ............. 31,859
Median Nonfamily Income....... 20,895 without own children under age 18 ........ 41,541
Walton County was established in 1824 from aportion of Escambia County and was namedfor Colonel George Walton. The western
boundary of the county is part of Eglin Air Force Base.The southern boundary is the Gulf of Mexico and arecognized attraction is the Grayton Beach StateRecreational Area. The county seat is DeFuniakSprings. There are many acres of beach, sloping sanddunes, pine woodlands, and lakes. Industries includepoultry, clothing, orthopedic supplies, and health care.
The county comprises 1,058 square miles of land and waspopulated by 40,601 persons in 2000. There were 38persons per square mile and the general populationincreased by 46 percent from 1990. Eighty percent of thepopulation lived in a rural area. The median age in 2000was 41 years.
There were 29,083 housing units reported with ahomeownership rate of 79 percent. Thirty percent ofhouseholds included at least one person under the age of 18years. Annual income was less than $25,000 in 38 percentof all 16,566 households and 37 percent of the 4,460 familyhouseholds with their own children. Six percent of allhouseholds had earnings of $100,000 or greater.
Twenty-four percent of persons age 25 and over did notgraduate from high school and 32 percent graduated withno further education indicated. Sixteen percent obtained abachelor’s degree or higher. Of 2,942 persons age 18 to 24years, 66 percent were high school graduates. Eight percentof persons 16 to 19 years old were not in school and notworking.
Children under age 18 represented 22 percent of thepopulation in Walton County, and 21 percent of childrenlived in poverty. Of the 5,577 persons of all ages living inpoverty, 33 percent were under the age of 18 years. Fifty-six percent of children lived in low-income households andno children lived in high poverty neighborhoods.

Multi-Year Trend Data
** method used for calculating changed in 1998Source: Florida Department of Health, Office of Vital Statistics;Florida Department of Education
1992 1993 1994 1995 1996 1997 1998 1999 2000
Children Under Age 6 Below 100% of PovertyGrandparents Responsible 3 or More Years
100
75
50
25
0
Child
ren
Age 3
& 4
Enrol
led
in S
choo
lO
wn Chi
ldre
n Und
er A
ge 6
with
All Par
ents
in th
e La
bor F
orce
Child
ren
Under
Age
6
Below
200
% o
f Pov
erty
Gra
ndpa
rent
s Res
pons
ible
for
and
Livin
g with
Own
Gra
ndch
ildre
n Und
er A
ge 1
8
Own
Child
ren
Under
Age
6
Livin
g in
Sin
gle
Paren
t Hom
es
Per
cent
Source: US Census Bureau, Census 2000, SF1 and SF3
Critical MeasuresCensus 2000
Birth Rate
Teen Birth Rate Age 15-17
Teen Birth Rate Age 15-19
Percent of Births Receiving Early Prenatal Care
Percent of Low Birthweight Births
Percent of Births to Unwed Mothers
Infant Mortality Rate
Teen Violent Death Rate Age 15-19
Percent of Students Eligible for Free/Reduced Lunch
Graduation Rate**
Source: Policy and Services Research Data Center, de la Parte Institute, USF, 2002
Beh
avio
ral H
ealth
and
Juv
enile
Jus
tice
Source: Florida Department of Juvenile Justice, 2003
Source: Florida Department of Juvenile Justice, 2000/01
Chi
ld C
are,
Hea
d S
tart
and
Edu
catio
n
Source: Florida Department of Education, 2001/02
Source: Florida Children’s Forum, 2001
167 Center for the Study of Children’s Futures 2004
12.0 12.8 12.0 10.7 10.8 11.5 10.8 10.9 10.6
40.5 49.4 49.0 31.6 46.4 42.1 36.9 32.2 37.0
68.7 77.1 72.9 56.8 73.3 73.5 67.7 57.2 69.8
79.7 85.3 82.3 84.0 84.3 85.6 86.3 82.8 85.1
8.9 6.7 8.4 5.6 4.8 5.3 7.2 6.1 6.8
30.9 34.1 31.2 33.2 31.1 29.7 33.8 34.8 35.1
8.4 12.9 2.6 14.0 0.0 7.2 7.2 6.7 0.0
5.2 15.2 0.0 4.6 4.7 0.0 4.2 8.0 8.0
52.9 46.2 46.1 52.9 50.8 41.3 51.8 51.4 51.5
78.4 77.0 79.8 74.3 76.4 79.6 68.9 75.4 72.1
34.4
24.9
56.3 58.3
40.6
Walton County
7 licensed child care centers with a capacity for 339 children
8 licensed family child care homes with a capacity for 67 children
4 Head Start programs with a capacity for 69 children
5,968 children were enrolled in 16 public schools
1,104 children were enrolled in exceptional student education programs
70 children were referred to English for Speakers of Other Languages Programs
168 children were enrolled in 5 non-public schools
279 children and families were registered in 193 home education programs
448 children received behavioral health services
11 behavioral health service providers served children
252 youths were referred to the juvenile justice system
7 youths were transferred to adult court
0 contracted delinquency prevention programs
1 state grant funded delinquency prevention program projected to serve 150 youths
0 probation and community corrections non-residential programs
0 residential and correctional programs
0 detention centers

Number Percent Number Percent
Summary Profile for the Population Under Age 18, 1990 to 2000
1990 2000
Age & Sex
Population Under Age 18
Males Under Age 18
Females Under Age 18
Population Under Age 5
Population Age 5 - 17
Race
Children of One Race
White Children
Black or African American Children
American Indian or Alaska Native Children
Asian Children
Native Hawaiian or Other Pacific Islander Children
Children of Some Other Race
Children of Two or More Races
Hispanic Origin Status
Hispanic Children
Non-Hispanic Children
Non-Hispanic White Children
Non-Hispanic Racial Minorities
Living Arrangements
Children Living in Households
Children Living in Group Quarters
Own Children Living in Single Parent Households
Own Children Living in Married Couple Households
Source: Population Reference Bureau analysis of data from the US Census Bureau for the Annie E. Casey Foundation
1999 Income in Dollars as Reported in Census 2000
• •
•
•
Source: US Census Bureau, Census 2000, SF3 Tables P82, P53, P80 and PCT39
Number NumberPercent Percent
Source: US Census Bureau, Census 2000, SF1 and SF3;Florida Almanac, 2002/2003; Florida County Atlas, 1994
168Center for the Study of Children’s Futures 2004
4,270 100.0 4,905 100.0
2,180 51.1 2,518 51.3
2,090 48.9 2,387 48.7
1,091 25.6 1,267 25.8
3,179 74.4 3,638 74.2
N/A N/A 4,745 96.7
3,278 76.8 3,876 79.0
865 20.3 732 14.9
79 1.9 92 1.9
N/A N/A 18 0.4
N/A N/A 5 0.1
25 0.6 22 0.4
N/A N/A 160 3.3
66 1.5 131 2.7
4,204 98.5 4,774 97.3
3,245 76.0 3,805 77.6
959 22.5 969 19.8
4,270 100.0 4,874 99.4
0 0.0 31 0.6
821 19.2 1,171 23.9
2,967 69.5 3,148 64.2
Per Capita Income .................... 14,980 Median Family Income .............................. 33,057
Median Household Income ...... 27,922 with own children under age 18 ............. 30,891
Median Nonfamily Income....... 15,816 without own children under age 18 ........ 34,903
Washington County was established in 1825from a portion of Escambia County and wasnamed for George Washington, the first U.S.
President. The county seat is Chipley. Small townspopulate the county and the western boundary is theChoctawhatchee River. Private industry includes bedproducts, clothing, and turbine engines, althoughagriculture predominates.
The county comprises 580 square miles of land and waspopulated by 20,973 persons in 2000. There were 36persons per square mile and the general populationincreased by 24 percent from 1990. Eighty-three percent ofthe population lived in a rural area. The median age in2000 was 39 years.
There were 9,503 housing units reported with ahomeownership rate of 82 percent. Thirty-four percent ofhouseholds included at least one person under the age of 18years. Annual income was less than $25,000 in 45 percentof all 7,971 households and 41 percent of the 2,451 familyhouseholds with their own children. Five percent of allhouseholds had earnings of $100,000 or greater.
Twenty-nine percent of persons age 25 and over did notgraduate from high school and 39 percent graduated withno further education indicated. Nine percent obtained abachelor’s degree or higher. Of 1,706 persons age 18 to 24years, 77 percent were high school graduates. Fourteenpercent of persons 16 to 19 years old were not in schooland not working.
Children under age 18 represented 23 percent of thepopulation in Washington County, and 27 percent ofchildren lived in poverty. Of the 3,757 persons of all agesliving in poverty, 35 percent were under the age of 18years. Fifty-seven percent of children lived in low-incomehouseholds and 40 percent lived in high povertyneighborhoods.

Multi-Year Trend Data
** method used for calculating changed in 1998Source: Florida Department of Health, Office of Vital Statistics;Florida Department of Education
1992 1993 1994 1995 1996 1997 1998 1999 2000
Children Under Age 6 Below 100% of PovertyGrandparents Responsible 3 or More Years
100
75
50
25
0
Child
ren
Age 3
& 4
Enrol
led
in S
choo
lO
wn Chi
ldre
n Und
er A
ge 6
with
All Par
ents
in th
e La
bor F
orce
Child
ren
Under
Age
6
Below
200
% o
f Pov
erty
Gra
ndpa
rent
s Res
pons
ible
for
and
Livin
g with
Own
Gra
ndch
ildre
n Und
er A
ge 1
8
Own
Child
ren
Under
Age
6
Livin
g in
Sin
gle
Paren
t Hom
es
Per
cent
Source: US Census Bureau, Census 2000, SF1 and SF3
Critical MeasuresCensus 2000
Birth Rate
Teen Birth Rate Age 15-17
Teen Birth Rate Age 15-19
Percent of Births Receiving Early Prenatal Care
Percent of Low Birthweight Births
Percent of Births to Unwed Mothers
Infant Mortality Rate
Teen Violent Death Rate Age 15-19
Percent of Students Eligible for Free/Reduced Lunch
Graduation Rate**
Source: Policy and Services Research Data Center, de la Parte Institute, USF, 2002
Beh
avio
ral H
ealth
and
Juv
enile
Jus
tice
Source: Florida Department of Juvenile Justice, 2003
Source: Florida Department of Juvenile Justice, 2000/01
Chi
ld C
are,
Hea
d S
tart
and
Edu
catio
n
Source: Florida Department of Education, 2001/02
Source: Florida Children’s Forum, 2001
169 Center for the Study of Children’s Futures 2004
14.5 13.7 11.9 11.7 12.7 12.4 10.5 10.6 9.9
43.3 39.6 57.6 30.1 34.4 26.9 12.7 30.9 23.7
82.9 76.0 89.9 68.2 65.6 51.2 40.0 57.8 60.3
81.9 85.5 85.0 88.3 89.6 84.9 87.8 86.7 87.5
5.9 7.0 7.9 9.4 6.4 12.7 4.4 8.9 7.7
29.1 34.3 37.4 36.2 38.6 33.9 29.2 33.6 37.3
7.9 0.0 18.6 4.5 0.0 8.0 4.4 4.3 18.2
7.7 0.0 0.0 0.0 0.0 0.0 20.6 6.7 7.1
53.1 48.3 54.4 51.5 52.0 52.3 54.1 52.4 54.6
82.9 87.0 102.9 89.5 84.5 81.9 65.9 69.0 70.5
32.0
23.4
58.362.0 60.1
Washington County
10 licensed child care centers with a capacity for 581 children
2 licensed family child care homes with a capacity for 20 children
4 Head Start programs with a capacity for 63 children
3,373 children were enrolled in 13 public schools
546 children were enrolled in exceptional student education programs
0 children were referred to English for Speakers of Other Languages Programs
0 children were enrolled in non-public schools
116 children and families were registered in 84 home education programs
225 children received behavioral health services
11 behavioral health service providers served children
108 youths were referred to the juvenile justice system
8 youths were transferred to adult court
0 contracted delinquency prevention programs
1 state grant funded delinquency prevention program projected to serve 100 youths
0 probation and community corrections non-residential programs
1 residential and correctional program with 40 beds
0 detention centers


171 Center for the Study of Children’s Futures 2004
“We cannot always buildthe future for our youth,but we can build ouryouth for the future.”
-Franklin D. Roosevelt

172Center for the Study of Children’s Futures 2004

173 Center for the Study of Children’s Futures 2004
This glossary is designed to provide anunderstanding of the myriad of data used in theFlorida KIDS COUNT Databook, 2004 . Anattempt was made to capture the variety of termsor phrases introduced in the various sections ofdata presentation. Data were primarily derivedfrom Census 2000; this included calculationsfrom Census 2000 created by the PopulationReference Bureau for the Annie E. CaseyFoundation KIDS COUNT efforts. Data obtainedfrom Florida statewide sources are identified inthe definition beginning with “Florida Source”and the agencies and contacts are acknowledgedwithin the context of each data presentation andin the preface section of this publication.
Glossary

174Center for the Study of Children’s Futures 2004
Age - generally derived from date of birth information, and is based on the age of the person in complete years.
Alaska Native - a person having origins in any of the original peoples of North and South American (including Central America) and who maintain tribal affiliation orcommunity attachment. Alaska Native includes written responses of Eskimos, Aleuts, and Alaska Indians. The information for Census 2000 is based on the AmericanIndian Tribal Classification List for the 1990 census, which was expanded to list the individual Alaska Native villages when provided as a written response for race.
All parents in the labor force - the own child lives with both parents and both parents are in the labor force; or the own child lives with the mother only and the motheris in the labor force; or the own child lives with the father only and the father is in the labor force. Summary File 3, P46
American FactFinder - an electronic system for access and dissemination of Census Bureau data on the Internet. The system offers prepackaged data product and user-selected data tables and maps from Census 2000, the 1990 Census of Population and Housing, the 1997 Economic Census, and the American Community Survey. Thesystem was formerly known as the Data Access and Dissemination system (DADS).
American Indian - a person having origins in any of the original peoples of North and South American (including Central America) and who maintain tribal affiliationor community attachment. American Indian includes people who indicated their race as “American Indian”, entered the name of an Indian tribe, or reported such entriesas Canadian Indian, French American Indian, or Spanish-American Indian.
Annual income - the “total income” is the sum of the amounts reported separately for wages, salary, commissions, bonuses, or tips; self-employment income from ownnonfarm, or farm businesses, including proprietorships and partnerships; interest, dividends, net rental income, royalty income or income from estates and trusts; SocialSecurity or Railroad Retirement income; Supplemental Security Income (SSI); any public assistance or welfare payments from the state or local welfare office;retirement, survivor, or disability pensions; and any other sources of income received regularly such as Veteran’s (VA ) payments, unemployment compensation, childsupport, or alimony. Census 2000 data represents earnings in 1999. Annual income of households, presented in the profile text was obtained from Summary File 3, P52.
Area - the square miles or square meter recorded for each geographic entity.
Asian - a person having origins in any of the original peoples of the Far East, Southeast Asia, or the Indian subcontinent; self-identification among people of Asiandescent.
Behavioral health services and service providers - (Florida Source) services provided to any child up to their 18th birthday with at least one reported contact with astate-contracted, publicly funded behavioral health service provider. This includes all mental health and substance abuse services provided under contract with theDepartment of Children & Families Office of Alcohol, Drug Abuse, and Mental Health. In addition, it may include services for individuals who are supported byMedicaid or TANF funds. It does not represent services delivered by mental health service providers operating outside of the state contract process. Children areunduplicated by SSN and county according to their county of residence and may appear in the dataset more than once if their residence changed to another county andthey received services in that new county during the same fiscal year. The service providers were unduplicated by their tax ID and county. The child count was based onthe residence county of the service recipient rather than on the county in which the service provider was located. The count of service providers represents the numberof providers within each county that provided services to children of any county within the identified fiscal year. The statewide data included providers servinghomeless children or children from out-of-state. Data were extracted from the State of Florida’s Integrated Data System (IDS) and represent fiscal year 2001-2002.(Policy and Services Research Data Center (2003). Kids Count: Number of Children – Number of Providers: Totals by County. Tampa, FL: Department of MentalHealth Law & Policy, Louis de la Parte Florida Mental Health Institute, University of South Florida)
Birth and death data - (Florida Source) births and deaths are tabulated according to the usual “place of residence” (events occurring to Florida residents regardless of

175 Center for the Study of Children’s Futures 2004
the place of occurrence). For births and fetal deaths, the mother’s residence was used when it differed from the father’s residence. * an asterisk represents unreliablerates and ratios, those with denominators less than 100.
Birth rate - (Florida Source) the number of births per 1,000 resident population.
Births receiving early prenatal care - (Florida Source) births to mothers who received prenatal care in the first three months of pregnancy.
Births to unwed mothers - (Florida Source) births to mothers who recorded on the birth certificate that they were not married.
Black or African American - a person having origins in any of the Black racial groups of Africa. It includes people who indicate their race as “Black, African Am., orNegro,” or provide written entries such as African American, Afro American, Kenyan, Nigerian, or Haitian.
Census - a complete enumeration, usually of a population, but also of businesses and commercial establishments, farms, governments, and so forth.Census block - a subdivision of a Census tract (or, prior to 2000, a block numbering area), a block is the smallest geographic unit for which the CensusBureau tabulates 100-percent data. Many blocks correspond to individual city blocks bounded by streets, but blocks especially in rural areas, may includemany square miles and may have some boundaries that are not streets. The Census Bureau established blocks covering the entire nation for the first time in1990. Previous censuses back to 1940 had blocks established only for part of the nation. Over 8 million blocks are identified for Census 2000.Census county division (CCD) - a subdivision of a county that is a relatively permanent statistical area established cooperatively by the Census Bureau andstate and local government authorities. Used for presenting Decennial Census statistics in those states that do not have well-defined and stable minor civildivisions that serve as local governments.Census (decennial) - the Census of population and housing, taken by the Census Bureau in years ending in 0 (zero). Article I of the Constitution requiresthat a census be taken every ten years for the purpose of reapportioning the U.S. House of Representatives.Census tract - a small, relatively permanent statistical subdivision of a county delineated by a local committee of census data users for the purpose ofpresenting data. Census tract boundaries normally follow visible features, but may follow governmental unit boundaries and other non-visible features insome instances; they always nest within counties. Designed to be relatively homogeneous units with respect to population characteristics, economic status,and living conditions at the time of establishment, census tracts average about 4,000 inhabitants. They may be split by any sub-county geographic entity.
Child - a son or a daughter by birth, a stepchild, or an adopted child of the householder, regardless of the child's age or marital status.
Children age 3 and 4 enrolled in school - children age 3 and 4 that are enrolled in regular school either public or private, which includes nursery school,kindergarten, elementary school, and schooling which leads to a high school diploma or college degree. Summary File 3, PCT23, P8
Children living in households - children under age 18, unless other sub-age cohort is identified, in which one or more people occupy a housing unit as their usualplace of residence. The occupants may be a single family, a person living alone, two or more families living together, or any other group of related or unrelated peoplewho share living arrangements.
Children living in single parent homes - own children under age 6 living in a family household type within the “other family” category includes the combination offemale householder, no husband present and male householder, no wife present. Used for the Critical Measures graphic. Summary File 1, P36, P14
Children with all parents in labor force - includes own children living with both parents and both parents are in the labor force; or own children living with motheronly and the mother is in the labor force; or own children living with the father only and the father is in the labor force. Summary File 3, P46

176Center for the Study of Children’s Futures 2004
Delinquency prevention programs - (Florida Source) community-based prevention programs that target youth most at risk of becoming delinquent. Programsinclude CINS/FINS (Children in Need of Services/Families in Need of Services) shelter, Practical Academic and Cultural Education (PACE) Center for Girls, state-funded Community Partnership grants, grants funded through Invest in Children license tags and federal grants. There are more than 200 delinquency preventionprograms in Florida; some are funded through contract, others through competitive grants.
Contracted juvenile delinquency prevention programs - the Department of Juvenile Justice funds prevention programs that provide services to a widegroup of youth to help prevent them from entering or progressing through the juvenile justice system; contracted services for of status offenders can beadjudicated as Families in Need of Services (FINS). Shelter and non-residential services for these youth serve about 25,000 families annually. PACE Centersfor Girls provide gender-specific programming and education in a day treatment setting for both at-risk and delinquent girls. There are also delinquencyprevention programs that are funded directly through appropriations from the Florida Legislature; these programs include gang prevention efforts, truancyinterdiction efforts and after-school programs.State grant funded juvenile delinquency prevention programs - delinquency prevention grants are designed to provide start-up funding for delinquencyprevention grants for a maximum of three years and applications must secure at least 20% in matching funds. Identified here are the state grant fundedprograms and their service projection counts. There are also grant funds from the U.S. Department of Justice’s Office of Juvenile Justice and DelinquencyPrevention (JJDP) that have not been counted in our data presentation; these programs number approximately 48 across the state.
Demographic Profile (DP) - a profile includes tables that provide various demographic, social, economic, and housing characteristics for the U.S., regions, divisions,states, counties, county subdivisions, places, metropolitan areas, American Indian and Alaska Native areas, Hawaiian home lands and congressional districts. Itincludes 100-percent and sample data from the Decennial Censuses. It also is available on CD-ROM/DVD. For the 1990 Census, there are five tables in theDemographic Profile, labeled DP-1 thru DP-5. For Census 2000, there are four tables, the DP-1 table is available as part of the Summary File 1 release, and the otherthree tables are available as part of the Summary File 3 dataset.
Density - the total population or number of housing units within a geographic entity (for example, United States, state, county, place) divided by the land area of thatentity measured in square kilometers or square miles. Density is expressed as both "people (or housing units) per square kilometer" and "people (or housing units) persquare mile" of land area.
Detailed Tables (DT) - tables from summary files that provide the most detailed data on all topics and geographic areas from the decennial censuses. Tables includetotals and subtotals (except for the 1990 Census detailed tables). Users may choose more than one geographic area and more than one table that display in a scrollinglist. Census 2000 detailed tables are identified and labeled using established guidelines. Table identification begins with a letter that refers to the type of data in thetable, and then a number is assigned sequentially as the tables are produced. Tables labeled: ‘P’ are population tables; ‘H’ are housing tables; ‘PCT’ are populationtables that cover geographies to the census tract level; ‘HCT’ are housing tables that cover geographies to the census tract level; ‘PL’ are tables derived from theRedistricting Data (P.L. 94-171) Summary File. For example, Table P12. Sex by Age, is a population table with the sequential number, ‘12’.
Detention centers - (Florida Source) secure detention centers serve as a holding place for youth who are awaiting a court hearing or transfer to a juvenile residentialor correctional facility. The number of beds identifies the fixed capacity for each center. These short-term temporary programs provide a highly structuredenvironment that includes the requirement for youth to attend an educational program each day. The data presented in this book represent the number of securedetention centers and their fixed bed capacity. Youth under age 18 arrested by law enforcement are evaluated immediately by the Florida Department of JuvenileJustice to determine if they should be detained. Detention screening is performed at a Juvenile Assessment Center or by juvenile probation staff using a standardizedDetention Risk Assessment Instrument. Two types of detention are available: secure detention and home detention. These youth appear before the court within 24hours of placement at which time the juvenile judge decides whether there is a need for continued detention. There is generally a 21 day limit to secure detention, butthose charged with serious offenses can be held up to 30 days. As an example, there were 54,155 admissions to secure detention in Florida in FY 1998/99.

177 Center for the Study of Children’s Futures 2004
Distribution - an array in statistics of the instances of a variable arranged by classes according to their value.
Educational attainment - refers to the highest level of education completed in terms of the highest degree or the highest level of schooling completed.
Employed - includes all civilians 16 years old and over who were either (1) "at work" - those who did any work at all during the reference week as paid employees,worked in their own business or profession, worked on their own farm, or worked 15 hours or more as unpaid workers on a family farm or in a family business; or (2)were "with a job but not at work" - those who did not work during the reference week but had jobs or businesses from which they were temporarily absent due toillness, bad weather, industrial dispute, vacation, or other personal reasons. Excluded from the employed are people whose only activity consisted of work around thehouse or unpaid volunteer work for religious, charitable, and similar organizations; also excluded are people on active duty in the United States Armed Forces. Thereference week is the calendar week preceding the date on which the respondents completed their questionnaires or were interviewed. This week may not be the samefor all respondents.
English for Speakers of Other Languages Programs - (Florida Source) the number of students referred for further evaluation of their language needs. Students arereferred if a yes response is indicated on any of the following questions: “is a language other than English used in the home?” or “did the student have a first languageother than English?” or “does the student most frequently speak a language other than English?”.
Enrolled in non-public school - (Florida Source) the number of students reported as in attendance in a private elementary or secondary school in Florida (based on aFebruary count).
Enrolled in public school - (Florida Source) the number of students enrolled in the Florida public school system (Fall of each school year).
Enrolled in school - persons were classified as enrolled in school if they were attending a “regular” public or private school or college at any time during the 3 monthsprior to the interview. “Regular" school includes nursery school or preschool, kindergarten, elementary school, and schooling that leads to a high school diploma orcollege degree. Schools supported and controlled primarily by a federal, state, or local government are defined as public (including tribal schools). Those supported andcontrolled primarily by religious organizations or other private groups are private.
Ethnicity - there are two minimum categories for ethnicity in Census 2000, Hispanic or Latino and Not Hispanic or Latino. Hispanics and Latinos may be of any race.
Exceptional student education programs - (Florida Source) the Bureau of Instructional Support and Community Services supports school districts and others in theirefforts to provide exceptional student education programs for students ages 3 through 21 who have disabilities or who are gifted. Each school district is responsible forproviding services to students who are eligible for the exceptional student education (ESE) programs. School districts and schools develop their own programs to servetheir students in the most effective way possible. The Bureau provides training to school staff, district administrators, and others on important issues and currentinstructional practices; gives the districts information on state and federal law relating to the education of exceptional students; monitors the districts' compliance withthose laws; helps resolve conflicts between school districts and families of exceptional students; and provides any other technical assistance school districts need. Astudent may belong to more than one program, but is counted only once.
Family - a group of two or more people who reside together and who are related by birth, marriage, or adoption.
Family household (family) - a family includes a householder and one or more people living in the same household who are related to the householder by birth,marriage, or adoption. All people in a household who are related to the householder are regarded as members of his or her family. A family household may containpeople not related to the householder, but those people are not included as part of the householder's family in census tabulations. Thus, the number of family

178Center for the Study of Children’s Futures 2004
households is equal to the number of families, but family households may include more members than do families. A household can contain only one family forpurposes of census tabulations. Not all households contain families since a household may comprise a group of unrelated people or one person living alone.
Family householder - a householder living with one or more people related to him or her by birth, marriage, or adoption. The householder and all people in thehousehold related to him are family members.
Family type - refers to how the members of a family are related to one another and the householder. Families may be a "Married Couple Family," "Single ParentFamily," "Stepfamily," or "Subfamily."
Female householder, no husband present - a category including a family with a female maintaining a household with no husband of the householder present.
Florida Almanac - (general source) information from the Florida Almanac 2002-2003 edition was utilized in the profile text. Marth, D., & Marth, M. J. (2002).McGovern, B. (Ed). (2002). Florida Almanac 2002-2003. Gretna, Louisiana: Pelican Publishing Company.
Florida County Atlas - (general source) information from the Interactive Florida County Atlas, a web version of the 1994 Florida County Atlas and MunicipleFactbook, was utilized in the profile text. Florida State University, Institute of Science and Public Affairs. (1994). Retrieved May 6, 2004, from the Web site:http://www.freac.fsu.edu/InteractiveCountyAtlas/Atlas.html
Foster children - children receiving parental care and guidance although not related through blood or legal ties, placed in care by a government agency. When afoster child is also a relative, such as a nephew or niece, the child is counted as a related individual rather than a foster child.
Grade in which enrolled - the level of enrollment in school, nursery school through college and graduate or professional school.
Graduation Rate - (Florida Source) the percentage of students (tracked by student ID number) who have graduated within four years of entering ninth grade forthe first time. Students who transfer out of the school or district (county) to attend school elsewhere or to enroll in an adult-education program are removed fromthe group of students (cohort) tracked. Incoming transfer students, at the time of their enrollment, are included in the count of the class in which they arescheduled to graduate and are tracked accordingly. A graduate is defined as a student who receives a standard diploma, a special diploma, or a diploma awardedafter successful completion of the GED examination. Certificate recipients are not included. District (county) and state rates cover all schools with graduates,which may include schools other than regular high schools (e.g. alternative education centers). Note: The above method used to calculate the Graduation Ratebegan with the school year 1998/99.
Grandchild - under household type and relationship, other relative, a grandchild is identified as a grandson or granddaughter of the householder.
Grandparent as caregiver - grandparent(s) who have assumed full care of their grandchildren on a temporary or permanent live-in basis. This was a newquestion/data category for Census 2000.
Grandparent living with own grandchildren - includes a person age 30 or older living with their own grandchildren under age 18.
Grandparent responsible for own grandchildren - includes a person age 30 or older living with their own grandchildren under age 18. Responsibility forgrandchildren is determined based on financial responsibility for food, shelter, clothing, day care, etc. for any or all grandchildren living in the household. TheCensus questionnaire addressed the duration of the responsibility, identified as the longest period of time that the grandparent has been responsible. Duration

179 Center for the Study of Children’s Futures 2004
categories ranged from less than 6 months to 5 years or more. The Critical Measures graphic presents the percent responsible less than three years and three years orgreater.
Group quarters population - includes all people not living in households. This term includes those people residing in group quarters as of the date on which aparticular survey was conducted. Two general categories of people in group quarters are recognized: 1) the institutionalized population which includes people underformally authorized supervised care or custody in institutions at the time of enumeration (such as correctional institutions, nursing homes, and juvenile institutions)and 2) the noninstitutionalized population which includes all people who live in group quarters other than institutions (such as college dormitories, military quarters,and group homes). The noninstitutionalized population includes all people who live in group quarters other than institutions.
Head Start programs - (Florida Source) programs are federally funded and serve infants through 5 years old in school-based or center-based settings. Early HeadStart Programs serve infants through 3 years and were included in the count when noted. These programs have income eligibility guidelines. Figures reflect thenumber of programs and the capacity. Note that some Head Start, Early Head Start and PreKindergarten Early Intervention program counts may also be included inthe number of child care centers. Some counties have combined Pre-K and Head Start classrooms.
High-poverty neighborhoods - census tracts where 20 percent or more of the population is below poverty as defined in Census 2000, reference year 1999. If acensus tract has a poverty rate of 20 percent or more, all of the children living in that tract are defined as living in a high-poverty neighborhood. Profile text derivedfrom Summary File 3, P87; Summary File 1, P12. Calculations provided by the Population Reference Bureau for the Annie E. Casey Foundation.
High school - includes schools with either the ninth through the twelfth grade or the tenth through the twelfth grades.
High school graduate - includes people whose highest degree was a high school diploma or its equivalent. People who reported completing the 12th grade but notreceiving a diploma are not high school graduates.
Hispanic or Latino origin - for Census 2000, people who identify with the terms "Hispanic" or "Latino" are those who classify themselves in one of the specificHispanic or Latino categories listed on the Census 2000, "Mexican," "Puerto Rican," or "Cuban", as well as those who indicate that they are "other Spanish, Hispanic,or Latino." Origin can be viewed as the heritage, nationality group, lineage, or country of birth of the person or the person’s parents or ancestors before their arrival inthe United States. People who identify their origin as Spanish, Hispanic, or Latino may be of any race. In the 1990 Census of Population and Housing, a self-designated classification for people whose origins are from Spain, the Spanish-speaking countries of Central or South America, the Caribbean, or those identifyingthemselves generally as Spanish, Spanish-American, etc. Origin can be viewed as ancestry, nationality, or country of birth of the person or person’s parents orancestors prior to their arrival in the United States.
Home education programs - (Florida Source) home education is a parent-directed education alternative. Home education allows the freedom to explore and learn atthe pace of the individual student. A Home Education Program, as defined in Section 228.041(34), Florida Statutes (F.S.), is "sequentially progressive instruction of astudent directed by his or her parent or guardian." Section 232.02(4)(b)1 F.S., requires that a parent or guardian notify the superintendent of schools of the county ofresidence of their intent to establish and maintain a home education program within 30 days of its establishment. In 2001/02, the Department of Education surveyedeach school district to determine the number of individuals who had registered their intent to establish home education programs. The Department of Educationprovides technical assistance, information and materials on home education to school districts and parents. The number of children and families registered in homeeducation programs is presented.
Homeownership rate - computed by dividing the number of owner-occupied housing units by the number of occupied housing units or households. A housing unit isowner-occupied if the owner or co-owner lives in the unit, even if it is mortgaged or not fully paid for.

180Center for the Study of Children’s Futures 2004
Household - a household includes all the people who occupy a housing unit as their usual place of residence.
Household size - the total number of people living in a housing unit.
Household type and relationship - households are classified by type according to the sex of the householder and the presence of relatives. Examples include:married-couple family; male householder, no wife present; female householder, no husband present; spouse (husband/wife); child; and other relatives.
Householder - the person, or one of the people, in whose name the home is owned, being bought, or rented. If there is no such person present, any household member15 years old and over can serve as the householder for the purposes of the census. Two types of householders are distinguished: a family householder and a nonfamilyhouseholder. A family householder is a householder living with one or more people related to him or her by birth, marriage, or adoption. The householder and allpeople in the household related to him are family members. A nonfamily householder is a householder living alone or with nonrelatives only.
Housing unit - a house, an apartment, a mobile home or trailer, a group of rooms, or a single room occupied as separate living quarters, or if vacant, intended foroccupancy as separate living quarters. Separate living quarters are those in which the occupants live separately from any other individuals in the building and whichhave direct access from outside the building or through a common hall. For vacant units, the criteria of separateness and direct access are applied to the intendedoccupants whenever possible.
Income - the "total income" is the sum of the amounts reported separately for wages, salary, commissions, bonuses, or tips; self-employment income from ownnonfarm or farm businesses, including proprietorships and partnerships; interest, dividends, net rental income, royalty income, or income from estates and trusts;Social Security or Railroad Retirement income; Supplemental Security Income (SSI); any public assistance or welfare payments from the state or local welfare office;retirement, survivor, or disability pensions; and any other sources of income received regularly such as Veterans' (VA) payments, unemployment compensation, childsupport, or alimony. Census 2000 data represents income in calendar year 1999.
Annual income all households - Summary File 3, P52Annual income in family households, own children - Summary File 3, P38Median income - the median divides the income distribution into two equal parts: one-half of the cases falling below the median income and one-half abovethe median. For households and families, the median income is based on the distribution of the total number of household and families including those withno income. The median income for individuals is based on individuals 15 years old and over with income. Median income for households, families, andindividuals is computed on the basis of a standard distribution and is rounded to the whole dollar. The characteristics of individuals and the composition ofthe household refer to the time of enumeration (April 1, 2000).
Median family income, with own children, without own children under age 18 - Summary File 3, PCT39Median household income - Summary File 3, P53Median nonfamily income - Summary File 3, P80
Per capita income - the mean income computed for every man, woman, and child in a particular group. It is derived by dividing the total income of aparticular group by the total population in that group. An average obtained by dividing aggregate income by total population of an area. Summary File 3, P82
Infant mortality rate - (Florida Source) the number of deaths to individuals less than one year of age per 1,000 live births.
Labor force - the labor force includes all people classified in the civilian labor force, plus members of the U.S. Armed Forces (people on active duty with the UnitedStates Army, Air Force, Navy, Marine Corps, or Coast Guard). The Civilian Labor Force consists of people classified as employed or unemployed.
Licensed child care centers - (Florida Source) care for children in group settings of 12 children or more. In Florida, a center must be licensed by the State or exempt

181 Center for the Study of Children’s Futures 2004
from licensing. The numbers represented in this publication reflect secular centers or faith-based centers meeting minimum health, safety and training standards as setby the State of Florida and their actual capacity. Actual capacity is the maximum number of children providers will accept. Faith-based child care programs offer careas an integral part of a church or parochial school.
Licensed family child care homes - (Florida Source) care for children in a provider’s own home. In Florida, family child care homes are either registered or licensed.The numbers reflected in this publication represent licensed homes. Family child care homes are inspected prior to being licensed. Actual capacity is the maximumnumber of children the family home provider will accept.
Long form - the Decennial Census questionnaire, sent to approximately one in six households for the 1980, 1990, and 2000 Censuses, contains all of the questions onthe short form, as well as additional detailed questions relating to the social, economic, and housing characteristics of each individual and household. Informationderived from the long form is referred to as sample data, and is tabulated for geographic entities as small as the block group level in 1980, 1990, and 2000 Census dataproducts.
Low birthweight births - (Florida Source) infants who weighed less than 2,500 grams (5 lbs. 8 oz.) at birth.
Low-income households - households with an annual income less than 200 percent of poverty. Profile text identifies children under the age of 18 living in thesehouseholds. Annual income was less than $33,740 (200 percent of poverty), based on an example threshold for a family of four comprised of two adults and twochildren. The ratio of income to poverty level is equal to or less than 1.99. Summary File 3, PCT50
Male householder, no wife present - a category including a family with a male maintaining a household with no wife of the householder present.
Married-couple family household - a category including a family in which the householder and his or her spouse are enumerated as a member of the samehousehold.
Marital status - adults are generally classified by marital status as being married, never married, separated, divorced or widowed.
Median - a measure representing the middle value (if 'n' is odd) or the average of the two middle values (if 'n' is even) in an ordered list of 'n' data values. The mediandivides the total frequency distribution into two equal parts: one-half of the cases fall below the median and one-half of the cases exceed the median. Each median iscalculated using a standard distribution.
Median age - a measure dividing the age distribution in a stated area into two equal parts: one-half of the population falling below the median value and one-halfabove the median value. Median age is computed on the basis of a single year of age distribution.
Median income - the median income divides the income distribution into two equal parts: one-half of the cases falling below the median income and one-half abovethe median. For households and families, the median income is based on the distribution of the total number of households and families including those with noincome. The median income for individuals is based on individuals 15 years old and over with income. (Also see Income).
Multigenerational household - households consisting of three or more generations living together. Parent may be either parent or parent-in-law of the householder.Child may be the natural born, adopted or stepchild of the householder. Relationship refers to how each person is related to the householder. Individual types mayinclude a small number of households with members from additional generations, for example, grandparents or great-grandparents of the householder for whichtabulated data are not available. Total represents only those three types of households specified in the table. Graphic presentation derived from Census 2000, PHC-T-17, special tabulation.

182Center for the Study of Children’s Futures 2004
Native Hawaiian and Pacific Islander - a person having origins in any of the original peoples of Hawaii, Guam, Samoa, or other Pacific Islands. It includes peoplewho indicate their race as “Native Hawaiian,” “Guamanian or Chamorro,” “Samoan,” and “Other Pacific Islander.”
Non-public school - (Florida Source) a non-public school is defined in Section 1002.01(2), Florida Statutes, as “an individual, association, copartnership, orcorporation or a department, division or section of such organizations, that designates itself as an education center that includes kindergarten or a higher grade ...below college level...” Private elementary and secondary schools in Florida are not licensed, approved, accredited or regulated by the state, but they are required tomake their existence known to the Department of Education and respond to an annual survey designed to elicit information about them for public inspection.
Nonfamily householder - a householder living alone or with nonrelatives only.
Nonrelatives - any household member, including foster children, living in the housing unit but not related to the householder by birth, marriage, or adoption.Additional examples include roomer, boarder, housemate unmarried partner.
Not in labor force - includes all people 16 years old and over who are not classified as members of the labor force. This category consists mainly of students,housewives, retired workers, seasonal workers interviewed in an off season who were not looking for work, institutionalized people, and people doing only incidentalunpaid family work (less than 15 hours during the reference week).
Not in school and not working - also referred to as “idle teens”, this measure includes persons age 16 to 19 who are not enrolled in school (full or part time) and notworking (full or part time). Civilians who are unemployed, not in labor force and not enrolled in school. This includes persons that are high school graduates andthose who are not high school graduates. Summary File 3, P38
Occupied housing unit - a housing unit is classified as occupied if it is the usual place of residence of the person or group of people living in it at the time ofenumeration.
Other relative - any household member related to the householder by birth, marriage, or adoption, but not specifically included in any other relationship category,can include grandchildren, brothers, sisters, parents, in-laws, cousins, etc.
Own children - a child under 18 years old, unless other sub-age cohort is identified, who is a son or daughter by birth, marriage (a stepchild), or adoption. For 100-percent tabulations, own children consist of all sons/daughters of householders who are under 18 years of age. For sample data, own children consist of sons/daughters of householders who are under 18 years of age and who have never been married. Therefore, numbers of own children of householders may be different inthese two tabulations.
Owner-occupied housing units - a housing unit is owner-occupied if the owner or co-owner lives in the unit, even if it is mortgaged or not fully paid for.
Parent - within household type and relationship, parent refers to the father or mother of the householder, including a stepparent or adoptive parent. Fathers-in-law andmothers-in-law are included in the “parent-in-law” category.
Parent-in-law - within household type and relationship, a parent-in-law or father-in-law of the householder.
Percent of children living in poverty - the percentage of all children living in families or households where the income is less than the poverty threshold. Thepopulation under age 18 for whom poverty is determined, unless other sub-age cohort is identified.

183 Center for the Study of Children’s Futures 2004
Per capita income - the mean income computed for every man, woman, and child in a particular group. It is derived by dividing the total income of a particulargroup by the total population in that group. An average obtained by dividing aggregate income by total population of an area.
People in family - the total number of people living in one household and related to the householder.
People in household - the total number of people living in one housing unit.
Percentage - a measure calculated by taking the number of items in a group possessing a characteristic of interest and dividing by the total number of items in thatgroup, and then multiplying by 100.
Percent change in population - (general source) the calculation method used here is Time 1 minus Time 2, divided by Time 1, multiplied by 100.
Persons per square mile - the total population or number of housing units within a geographic entity (for example, United States, state, county, place) divided by theland area of that entity measured in square kilometers or square miles. Density is expressed as both "people (or housing units) per square kilometer" and "people (orhousing units) per square mile" of land area.
PHC-1 Tables - Census 2000 Summary Population and Housing Characteristics tables; a publication series that includes information on the 100-percent populationand housing subjects. The data are available for the United States, regions, divisions, states, counties, county subdivisions, places, metropolitan areas, urbanizedareas, American Indian and Alaska Native areas, and Hawaiian homelands. The series is comparable to the 1990 CPH-1 report series, Summary Population andHousing Characteristics. The series is available in printed form and on the Internet in PDF format.
Population - all people, male and female, child and adult, living in a given geographic area. United States population includes all 50 states and the District ofColumbia.
Population projections - (Florida source) the rate of growth provided in this publication are based on the Florida Demographic Estimating Conference Database,updated September 2003. Data are for April 1 of each year. Population growth depends on two components: the natural increase, the difference between births anddeaths; and migration, both domestic and international. The estimates and projections represent permanent residents only, as defined by the Census Bureau guidelinesof “usual place of residence”. Tourists and seasonal residents are thus excluded. Persons from foreign countries are included regardless of legal status and collegestudents, military personnel and prison inmates are included as residents where they are living, not where their “hometown” is.
Poverty - following the Office of Management and Budget’s (OMB’s) Directive 14, the Census Bureau uses a set of money income thresholds that vary by familysize and composition to detect who is poor. If the total income for a family or unrelated individual falls below the relevant poverty threshold, then the family orunrelated individual is classified as being "below the poverty level." Poverty status in not determined for people in institutions, people in military group quarters,people in college dormitories, and unrelated individuals under 15 years old. In 1999, the year that Census 2000 figures represent, for a family of four with two adultsand two related children under age 18, the poverty threshold was $16,895. The poverty status of families and unrelated individuals in 1999 was determined using 48thresholds (income cutoffs) arranged in a two dimensional matrix. To determine the “average” threshold for a given family size weighted average thresholds areprovided by the Census Bureau.
Below poverty - a person is “poor” if they reside in a family with income below the U.S. poverty threshold, as defined by the U.S. Office of Managementand Budget. Poverty thresholds differ by family size and are updated annually for inflation using the Consumer Price Index. However, they do not take intoaccount geographic differences in the cost of living.

184Center for the Study of Children’s Futures 2004
200 percent poverty - 2.00 times the given poverty level based on official thresholds. For example, children in families comprised of two adults and twochildren earning less than $33,740 (200 percent of poverty) in 1999 would be included. A child in a three-person family earning less than $26,846 wouldalso be included in a tabulation of children living in families under 200 percent of poverty, and so forth. The ratio of income to poverty level was equal toor less than 1.99 for these individuals under age six living in families satisfying the official weighted average thresholds in the Critical Measures graphic.
Probation and community corrections non-residential programs - (Florida Source) after a youth under age 18 is charged with a crime and referred to the FloridaDepartment of Juvenile Justice the Department provides a recommendation to the state attorney and the court regarding appropriate sanctions and services for thejuvenile. The recommendation is based on interviews and information from the arresting law enforcement officer, the victim, the juvenile and his or her family, andother sources. The Probation and Community Corrections branch is the most community-based program of the agency. The principle programming for this branchincluded diversion, conditional release, intensive delinquency diversion and other probation services. Probation is an individualized court-ordered program in whichthe youth is restricted to home or another designated placement in lieu of commitment to the Department. Juvenile probation officers supervise youth to ensurecompliance with court-order sanctions, such as restitution, community service or curfew. Conditional Release includes day treatment and community supervisionprograms for youth released from residential commitment programs. Diversion includes low-cost programs to administer sanctions and treatment while keeping lessserious and early offenders out of the judicial system. An Intensive Diversion service program provides early help to juvenile offenders most at risk for becomingchronic offenders.
Public school - (Florida Source) defined in sections 1000.01(4) and 1003.01(2), Florida Statutes as an organization of students for instructional purposes on anelementary, middle or junior high school, secondary or high school, or other public school level authorized under rules of the State Board of Education. These publicK-12 schools shall provide 13 consecutive years of instruction. The funds for support and maintenance of the uniform system of free public K-12 schools shall bederived from state, district, federal and other lawful sources or combinations of sources, including any fees charged nonresidents as provided by law.
Quick Tables (QT) - predefined tables with frequently requested information for a single geographic area. The information includes numerical data and derivedmeasures (e.g., percent distributions, medians). Users may choose more than one geographic area and more than one table that display and print in a scrolling list.
Race - race reflects self-identification data by people according to the race or races with which they most closely identify. For Census 2000, the Federal Office ofManagement and Budget (OMB) revised the standards for how the Federal government would collect and present data on race and ethnicity. The new guidelinesreflect "the increasing diversity of our Nation’s population, stemming from growth in interracial marriages and immigration." These new guidelines revised some ofthe racial categories used in 1990 and preceding censuses and allowed respondents to report as many race categories as were necessary to identify themselves on theCensus 2000 questionnaire. The categories include White alone, Black or African-American alone, American Indian or Alaska Native alone, Asian alone, NativeHawaiian or other Pacific Islander alone, and some other race alone; Race alone or in combination categories produced 63 possible combinations of race in the firstrelease of Census 2000 information. Some tabulations show the number of persons who checked “two or more races”.
Rate - a measure of occurrences in a given period of time divided by the possible number of occurrences during that period.
Ratio - a measure of the relative size of one number to a second number expressed as the quotient of the first number divided by the second.
Related children - includes all people in a household under the age of 18, regardless of marital status, who are related to the householder. Does not includehouseholder's spouse or foster children, regardless of age.
Summary File 1 & 2 - in a family include own children and all other people under 18 years of age in the household, who are related to the householder,except the spouse of the householder. Foster children are not included since they are not related to the householder.Summary File 3 - related children include the sons and daughters of the householder (including natural-born, adopted, or stepchildren) and all other people

185 Center for the Study of Children’s Futures 2004
under 18 years old, regardless of marital status, in the household, who are related to the householder, except the spouse of the householder. Foster childrenare not included since they are not related to the householder.
Resident population - an area's resident population consists of those persons "usually resident" in that particular area (where they live and sleep most of the time).
Residential and correctional programs - (Florida Source) juveniles who are adjudicated (found guilty) by the court can be committed to residential programs thatare classified by risk levels as low, moderate, high or maximum risk. The programs, which include wilderness camps, boot camps, youth academies and maximum-risk facilities, provide schooling, counseling vocational training and specialized treatment. Specialized treatment includes services for mental health, substance abuse,sex offender and developmentally disabled youths.
Responsibility of grandparent - includes a person 30 or older who live with their own grandchildren under age 18. Responsibility for grandchildren is determinedbased on financial responsibility for food, shelter, clothing, day care, etc. for any or all grandchildren living in the household.
Rural - territory, population and housing units not classified as urban. "Rural" classification cuts across other hierarchies and can be in metropolitan or non-metropolitan areas. Urban refers to all territory, population and housing units in urbanized areas and in places of more than 2,500 persons outside of urbanized areas."Urban" classification cuts across other hierarchies and can be in metropolitan or non-metropolitan areas.
Sample data - population and housing information collected from the census long form for a one in six sample of households in the United States and Puerto Rico.
School enrollment - enrollment in regular school, either public or private, which includes nursery school, kindergarten, elementary school, and schooling that leadsto a high school diploma or college degree.
Short form - the Decennial Census questionnaire, sent to approximately five of six households for the 1980, 1990, and 2000 Censuses. For Census 2000, thequestionnaire asked population questions related to household relationship, sex, race, age and Hispanic or Latino origin and housing questions related to tenure,occupancy, and vacancy status. The 1990 short form contained a question on marital status. The questions contained on the short form also are asked on the longform, along with additional questions.
Single parent households - a family household type within the “other family” category includes the combination of female householder, no husband present andmale householder, no wife present. Summary File 1, P28
Some other race - for Census 2000, this includes all other responses not included in the “White”, “Black or African American”, “American Indian or Alaska Native,“Asian,” and “Native Hawaiian or Other Pacific Islander” race categories described above. Respondents providing write-in entries such as multiracial, mixed,interracial, or a Hispanic/Latino group in the ‘some other race’ write-in space are included in this category.
Spouse - a person (husband or wife) legally married to and living with a householder. People in formal marriages, as well as people in common-law marriages, areincluded.
Stepfamily - a "married couple" family in which there is at least one stepchild of the householder present. If the child has been adopted by the householder, that childis classified as an adopted child and the family is not classified as a stepfamily, unless another non-adopted stepchild is present.
Students eligible to participate in the Free and Reduced School Lunch Program - (Florida Source) the National School Lunch Program of the Child Nutrition

186Center for the Study of Children’s Futures 2004
Program is funded by the U.S. Department of Agriculture and administered through the Florida Department of Education. Schools and Residential Child CareInstitutions are eligible to participate in the programs if they are nonprofit and serve children less than 21 years old. Eligibility is based on reported income. Percenteligible is calculated by dividing the number eligible to participate in the Free and Reduced School Lunch Program by the total public school enrollment for the Stateor the specific county.
Subfamily - a married couple with or without children under age 18 or a single parent with one or more own never-married children under the age of 18, residingwith and related to the householder, but not including the householder or the householder's spouse. When grown children move back to the parental home with theirown children or spouse, they are considered a subfamily.
Summary File (SF) - statistics for a large number of geographic areas that are designed to show great subject matter detail presented in tabular form. There are fourmain summary files produced from the data collected during Census 2000. See the individual definitions for Summary Files 1, 2, 3, and 4 for a more in-depthexplanation of each.
Summary File 1 (SF 1) - a Census file presenting 100-percent population and housing figures for the total population, for 63 race categories, and for many other raceand Hispanic or Latino categories. This includes age, sex, households, household relationship, housing units, and tenure (whether the residence is owned or rented).Also included are selected characteristics for a limited number of race and Hispanic or Latino categories. The data are available for the U.S., regions, divisions, states,counties, county subdivisions, places, census tracts, block groups, blocks, metropolitan areas, American Indian and Alaska Native areas, tribal subdivisions, Hawaiianhome lands, congressional districts, and ZIP Code Tabulation Areas. Data are available down to the block level for many tabulations, but only to the census-tract levelfor others. Available on CD-ROM, DVD, and American FactFinder.
Summary File 2 (SF 2) - a Census file presenting data similar to the information included in Summary File 1. These data are shown down to the census tract levelfor 250 race, Hispanic or Latino, and American Indian and Alaska Native tribe categories. For data to be shown in SF 2, a population category must meet a populationsize threshold of 100 or more people of that specific population category in a specific geographic area. Available on CD-ROM, DVD, and American FactFinder.
Summary File 3 (SF 3) - a Census file presenting data on the population and housing long form subjects such as income and education. It includes population totalsfor ancestry groups. It also includes selected characteristics for a limited number of race and Hispanic or Latino categories. The data are available for the U.S.,regions, divisions, states, counties, county subdivisions, places, census tracts, block groups, metropolitan areas, American Indian and Alaska Native areas, tribalsubdivisions, Hawaiian home lands, congressional districts, and Zip Code Tabulation Areas. Available on CD-ROM, DVD, and American FactFinder.
Summary Table - a collection of one or more data elements that are classified into some logical structure either as dimensions or data points.
Summary Tape Files 1-4 (STFs 1-4) - summary tape files are products of the 1990 Census of Population and Housing. They are summary tabulations of 100-percentand sample population and housing data available for public use on computer tape and CD-ROM. Summary Tape Files 1 and 3 also are available through AmericanFactFinder.
Teen birth rate or teen fertility rate - (Florida Source) the number of births to age specific females per 1,000 female population of the same race and age group.
Teen violent death rate - (Florida Source) the number of deaths from homicides, suicides, and accidents to teens 15 to 19 years old, per 10,000 teens of the agegroup. Rates should be interpreted with caution due to low numbers of teens or deaths in some counties.
Tenure - refers to the distinction between owner-occupied and renter-occupied housing units.

187 Center for the Study of Children’s Futures 2004
Two or more races - for Census 2000, people may have chosen to provide two or more races either by checking two or more race response check boxes, byproviding multiple write-in responses, or by some combination of check boxes and write-in responses.
Unemployed - all civilians 16 years old and over are classified as unemployed if they (1) were neither "at work" nor "with a job but not at work" during the referenceweek, and (2) were actively looking for work during the last 4 weeks, and (3) were available to accept a job. Also included as unemployed are civilians who did notwork at all during the reference week, were waiting to be called back to a job from which they had been laid off, and were available for work except for temporaryillness.
Unrelated individual - a person, sharing a housing unit, who is not related to the householder by birth, marriage or adoption; includes foster children.
Weeks worked in (designated calendar year) - the data pertain to the number of weeks during the designated calendar year in which a person did any work for payor profit (including paid vacation, paid sick leave, and military service) or worked without pay on a family farm or in a family business.
Weeks worked in the past 12 months - the data pertain to the number of weeks during the past 12 months in which a person did any work for pay or profit(including paid vacation, paid sick leave, and military service) or worked without pay on a family farm or in a family business.
White - a person having origins in any of the original peoples of Europe, the Middle East, or North Africa. It includes people who indicate their race as “White” orreport entries such as Irish, German, Italian, Lebanese, Near Easterner, Arab, or Polish.
Worked in (designated calendar year) - people 16 years old and over who did any work for pay or profit (including paid vacation, paid sick leave, and militaryservice) or worked without pay on a family farm or in a family business at any time from January to December of the designated calendar year are classified as"worked in (designated calendar year)." All other people 16 years old and over are classified as "did not work in (designated calendar year)."
Worked in the past 12 months - people 16 years old and over who did any work for pay or profit (including paid vacation, sick leave, and military service) orworked without pay on a family farm or in a family business at any time during the past 12 months are classified as "worked in the past 12 months." All other people16 years old and over are classified as "did not work in the past 12 months."
Worker - a term appearing in connection with several subjects: journey-to-work items, class of worker, work status in the past 12 months, weeks worked in the past12 months, and number of workers in family in the past 12 months. The meaning varies and, therefore, should be determined in each case by referring to thedefinition of the subject in which it appears.
Youths referred to the juvenile justice system - (Florida Source) the number of delinquency referrals reported to the Client Information System (CIS). The numberof youths referred is determined by counting only the most serious offense for which a youth is charged during any fiscal year.
Youths transferred to adult court - (Florida Source) the number of juvenile youths reported on the CIS as having jurisdiction transferred for disposition in Floridaadult courts. Transfers for processing in adult court can occur by direct filing of a bill of information by a state attorney, a waiver of jurisdiction by a juvenile courtjudge, or an indictment by a grand jury.
100-percent data - information based on a limited number of basic population and housing questions collected from both the short form and the long form for everyinhabitant and housing unit in the United States.


189 Center for the Study of Children’s Futures 2004
Copyright 2004 Center for the Study of Children’s Futures
This report is produced by the Center for the Study of Children’s Futures.All rights reserved. No part of this report may be reproduced without permission.
Events, activities, programs, and facilities of the University of South Florida are available to all without regard to race, color, marital status, sex, religion, national origin, disability, age, Vietnamor disabled veteran status as provided by law in accordance with the University’s respect for personal dignity. USF is an Equal Opportunity/Affirmative Action/Equal Access Institution.
Recommended citation for this report:
Weitzel, S., Shockley, C., & McCann, C. (2004). Florida KIDS COUNT Data Book, 2004. Tampa, FL:University of South Florida, Louis de la Parte Florida Mental Health Institute,Department of Child and Family Studies, Center for the Study of Children’s Futures.