Flood Risk Report - Federal Emergency Management Agency Hurricane... · ... Federal Emergency...
49
Template – [Insert Project Name] FLOOD RISK REPORT i Flood Risk Report White Oak Bayou Watershed, HUC 12040104 Unincorporated Harris County*, City of Houston*, and City of Jersey Village, Texas *Spans more than one watershed. This report only covers the area within the studied watershed . Report Number 01 05/03/2017
Transcript of Flood Risk Report - Federal Emergency Management Agency Hurricane... · ... Federal Emergency...
Template – [Insert Project Name] FLOOD RISK REPORT i
Flood Risk Report White Oak Bayou Watershed, HUC 12040104 Unincorporated Harris County*, City of Houston*, and City of Jersey Village, Texas *Spans more than one watershed. This report only covers the area within the studied watershed.
Report Number 01 05/03/2017

WHITE OAK BAYOU WATERSHED FLOOD RISK REPORT i
Preface
The Department of Homeland Security (DHS), Federal Emergency Management Agency’s (FEMA) Risk Mapping, Assessment, and Planning (Risk MAP) program provides states, tribes, and local communities with flood risk information and tools that they can use to increase their resilience to flooding and better protect their citizens. By pairing accurate floodplain maps with risk assessment tools and planning and outreach support, Risk MAP has transformed traditional flood mapping efforts into an integrated process of identifying, assessing, communicating, planning for, and mitigating flood-related risks.
This Flood Risk Report (FRR) provides non-regulatory information to help local or tribal officials, floodplain managers, planners, emergency managers, and others better understand their flood risk, take steps to mitigate those risks, and communicate those risks to their citizens and local businesses.
Because flood risk often extends beyond community limits, the FRR provides flood risk data for the entire Flood Risk Project as well as for each individual community. This also emphasizes that flood risk reduction activities may impact areas beyond jurisdictional boundaries.
Flood risk is always changing, and there may be other studies, reports, or sources of information available that provide more comprehensive information. The FRR is not intended to be regulatory or the final authoritative source of all flood risk data in the project area. Rather, it should be used in conjunction with other data sources to provide a comprehensive picture of flood risk within the project area.
WHITE OAK BAYOU WATERSHED FLOOD RISK REPORT ii
Table of Contents Community Name Table .................................................................................................................. i 1 Introduction ............................................................................................................................. 1
1.1 Project Description ........................................................................................................... 1
1.2 About Flood Risk ............................................................................................................. 1
1.2.1 Calculating Flood Risk ............................................................................................. 2
1.2.2 Risk MAP Flood Risk Products ................................................................................ 2
1.3 Uses of this Report ........................................................................................................... 3
1.4 Sources of Flood Risk Assessment Data Used................................................................. 4
1.5 Related Resources ............................................................................................................ 5
2 Flood Risk Analysis ................................................................................................................ 7
2.1 Overview .......................................................................................................................... 7
2.2 Analysis of Risk ............................................................................................................... 7
2.2.1 Changes Since Last FIRM ........................................................................................ 8
2.2.2 Flood Depth and Analysis Grids ............................................................................... 9
2.2.3 Estimated Flood Loss Information............................................................................ 9
2.2.4 Areas of Mitigation Interest .................................................................................... 10
3 Flood Risk Analysis Results ................................................................................................. 19
3.1 Flood Risk Map ............................................................................................................... 20
3.2 White Oak Bayou Watershed Flood Risk Project Area Summary ................................. 22
3.2.1 Overview ................................................................................................................. 22
3.2.2 Flood Risk Datasets ................................................................................................ 23
3.3 Communities .................................................................................................................. 24
3.3.1 City of Jersey Village Summary (CID 480300) ..................................................... 24
3.3.2 Harris County (Unincorporated Areas) Summary (CID 480287)........................... 27
3.3.3 City of Houston, Texas Summary (CID 480296) ................................................... 30
4 Actions to Reduce Flood Risk .............................................................................................. 33
4.1 Types of Mitigation Actions .......................................................................................... 33
4.1.1 Preventative Measures ............................................................................................ 33
4.1.2 Property Protection Measures ................................................................................. 33
4.1.3 Natural Resource Protection Activities ................................................................... 34
4.1.4 Structural Mitigation Projects ................................................................................. 34
WHITE OAK BAYOU WATERSHED FLOOD RISK REPORT iii
4.1.5 Public Education and Awareness Activities ........................................................... 34
4.1.6 Emergency Service Measures ................................................................................. 35
4.2 Identifying Specific Actions for Your Community........................................................ 36
4.3 Mitigation Programs and Assistance .............................................................................. 37
4.3.1 FEMA Mitigation Programs and Assistance .......................................................... 37
4.3.2 Additional Mitigation Programs and Assistance .................................................... 38
5 Acronyms and Definitions .................................................................................................... 39
5.1 Acronyms ....................................................................................................................... 39
5.2 Definitions ...................................................................................................................... 40
6 Additional Resources ............................................................................................................ 43
7 Data Used to Develop Flood Risk Products ......................................................................... 45
WHITE OAK BAYOU WATERSHED FLOOD RISK REPORT 1
FLOOD RISK REPORT
1 Introduction
1.1 Project Description The Harris County Flood Control District (HCFCD) completed Phase 2 Risk MAP production for the White Oak Bayou watershed to reflect drainage system improvements into the watershed’s flood risk mapping. The effort did not include Phase 1 Discovery, but did include the following tasks: Perform Field Survey-Collect survey and as-built drawings for bridge
and culvert modifications within the project limits.
Prepare Hydrologic Data-Update the watershed hydrologic model to include regional detention and channel improvements.
Develop Hydraulic Data-Simulate the 10-, 4-, 2-, 1-, “1% Plus”, and 0.2-percent-annual-chance events for E100-00-00, E101-00-00, E115-00-00, E115-04-00, E116-00-00, E116-05-00, E117-00-00, E121-00-00, E122-00-00, E124-00-00, E125-00-00, E127-00-00, E135-00-00, E141-00-00, and E200-00-00. Update the hydraulic models’ steady flow distributions to match the updated hydrologic model. Optimize and map the floodway boundaries of each studied stream.
Perform Floodplain Mapping- Delineate the 1- and 0.2-percent-annual-chance floodplain boundaries and regulatory floodway boundaries of the studied streams.
Develop Non-Regulatory Products- A Flood Risk Map, Flood Risk Report and Flood Risk Database were created for the White Oak Bayou watershed. A Hazus analysis was not performed.
This report explains flood risk, how flood risk is analyzed, presents the White Oak Bayou watershed flood risk analysis results, and identifies potential actions to reduce flood risk.
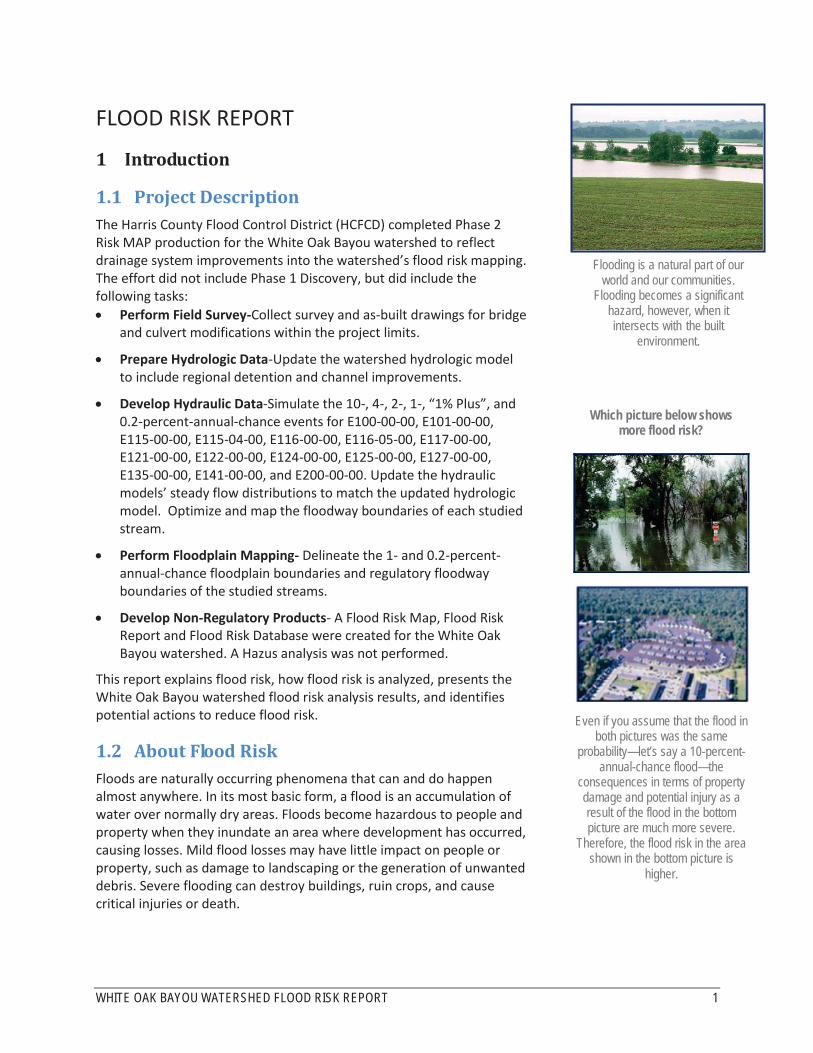
1.2 About Flood Risk Floods are naturally occurring phenomena that can and do happen almost anywhere. In its most basic form, a flood is an accumulation of water over normally dry areas. Floods become hazardous to people and property when they inundate an area where development has occurred, causing losses. Mild flood losses may have little impact on people or property, such as damage to landscaping or the generation of unwanted debris. Severe flooding can destroy buildings, ruin crops, and cause critical injuries or death.
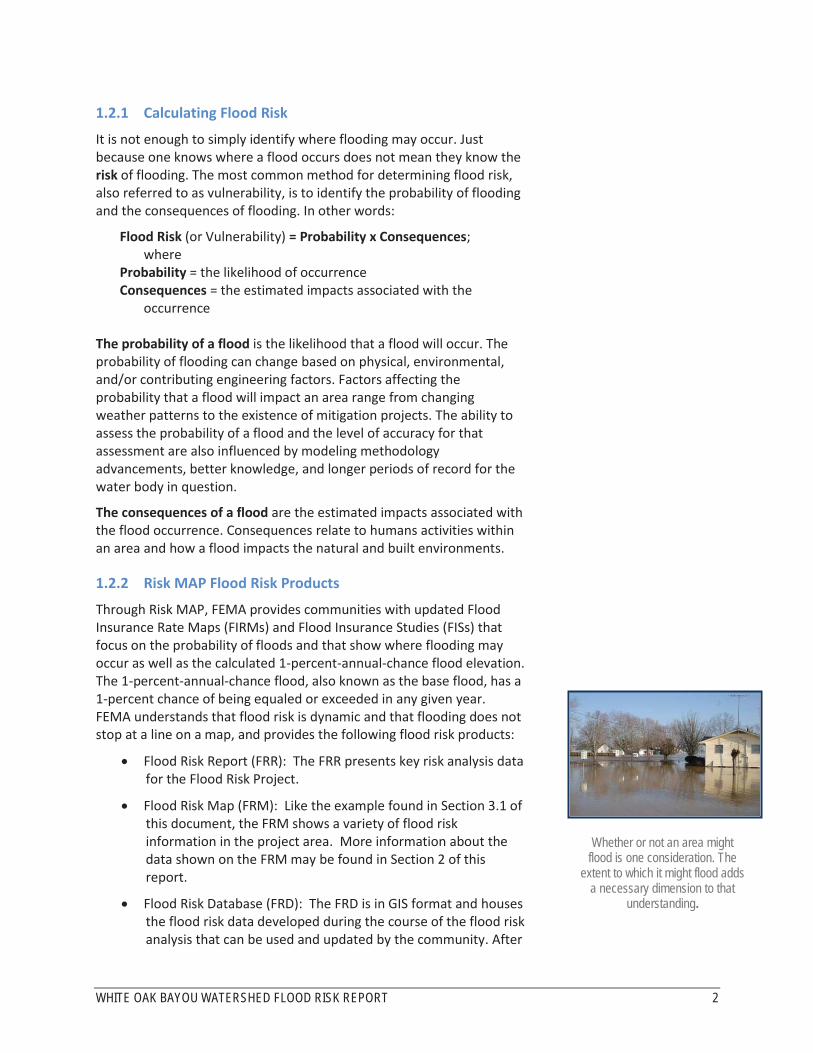
Which picture below shows more flood risk?
Even if you assume that the flood in both pictures was the same
probability—let’s say a 10-percent- annual-chance flood—the
consequences in terms of property damage and potential injury as a result of the flood in the bottom picture are much more severe.
Therefore, the flood risk in the area shown in the bottom picture is
higher.
Flooding is a natural part of our world and our communities.
Flooding becomes a significant hazard, however, when it intersects with the built
environment.
WHITE OAK BAYOU WATERSHED FLOOD RISK REPORT 2
1.2.1 Calculating Flood Risk
It is not enough to simply identify where flooding may occur. Just because one knows where a flood occurs does not mean they know the risk of flooding. The most common method for determining flood risk, also referred to as vulnerability, is to identify the probability of flooding and the consequences of flooding. In other words:
Flood Risk (or Vulnerability) = Probability x Consequences; where
Probability = the likelihood of occurrence Consequences = the estimated impacts associated with the
occurrence
The probability of a flood is the likelihood that a flood will occur. The probability of flooding can change based on physical, environmental, and/or contributing engineering factors. Factors affecting the probability that a flood will impact an area range from changing weather patterns to the existence of mitigation projects. The ability to assess the probability of a flood and the level of accuracy for that assessment are also influenced by modeling methodology advancements, better knowledge, and longer periods of record for the water body in question.
The consequences of a flood are the estimated impacts associated with the flood occurrence. Consequences relate to humans activities within an area and how a flood impacts the natural and built environments.
1.2.2 Risk MAP Flood Risk Products
Through Risk MAP, FEMA provides communities with updated Flood Insurance Rate Maps (FIRMs) and Flood Insurance Studies (FISs) that focus on the probability of floods and that show where flooding may occur as well as the calculated 1-percent-annual-chance flood elevation. The 1-percent-annual-chance flood, also known as the base flood, has a 1-percent chance of being equaled or exceeded in any given year. FEMA understands that flood risk is dynamic and that flooding does not stop at a line on a map, and provides the following flood risk products:
Flood Risk Report (FRR): The FRR presents key risk analysis data for the Flood Risk Project.
Flood Risk Map (FRM): Like the example found in Section 3.1 of this document, the FRM shows a variety of flood risk information in the project area. More information about the data shown on the FRM may be found in Section 2 of this report.
Flood Risk Database (FRD): The FRD is in GIS format and houses the flood risk data developed during the course of the flood risk analysis that can be used and updated by the community. After
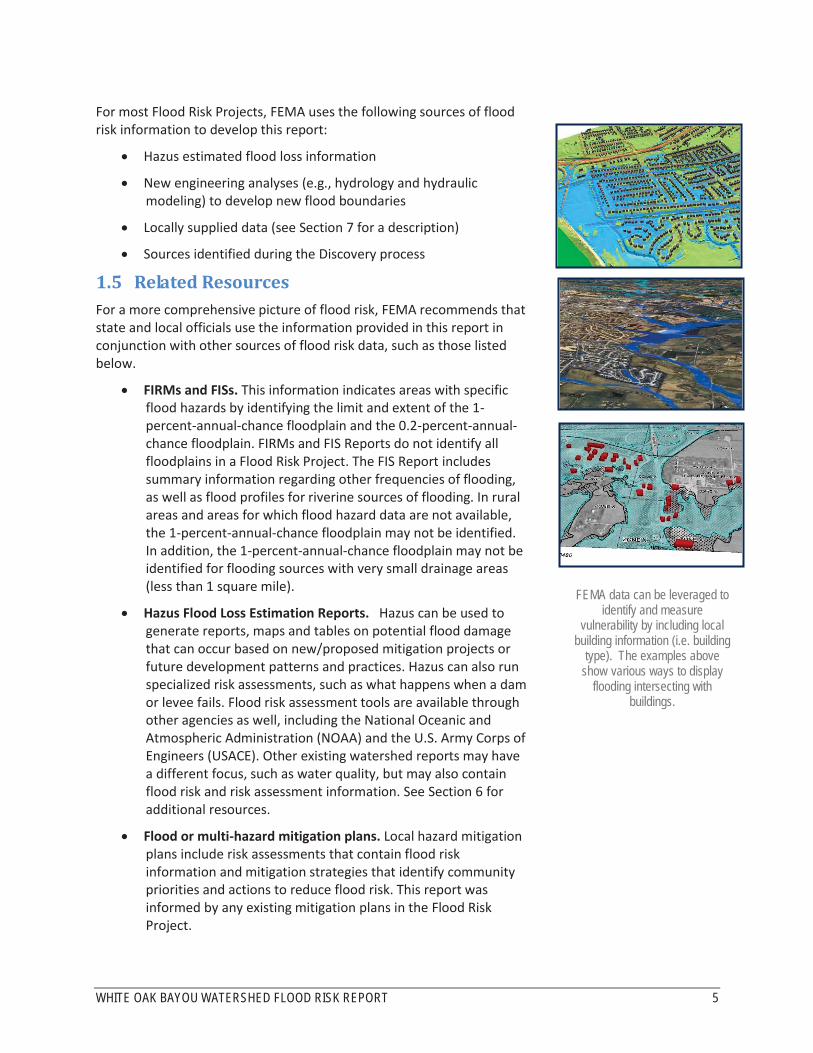
Whether or not an area might flood is one consideration. The
extent to which it might flood adds a necessary dimension to that
understanding.

WHITE OAK BAYOU WATERSHED FLOOD RISK REPORT 3
the Flood Risk Project is complete, this data can be used in many ways to visualize and communicate flood risk within the Flood Risk Project.
These Flood Risk Products provide flood risk information at both the Flood Risk Project level and community level (for those portions of each community within the Flood Risk Project). They demonstrate how decisions made within a Flood Risk Project can impact properties downstream, upstream, or both. Community-level information is particularly useful for mitigation planning and emergency management activities, which often occur at a jurisdictional level.
1.3 Uses of this Report The goal of this report is to help inform and enable communities and tribes to take action to reduce flood risk. Possible users of this report include:
Local elected officials
Floodplain managers
Community planners
Emergency managers
Public works officials
Other special interests (e.g., watershed conservation groups, environmental awareness organizations, etc.)
State, local, and tribal officials can use the summary information provided in this report, in conjunction with the data in the FRD, to:
Update local hazard mitigation plans. As required by the 2000 Federal Stafford Act, local hazard mitigation plans must be updated at least every five (5) years. Summary information presented in Section 3 of this report and the FRM can be used to identify areas that may need additional focus when updating the risk assessment section of a local hazard mitigation plan. Information found in Section 4 pertains to the different mitigation techniques and programs and can be used to inform decisions related to the mitigation strategy of local plans.
Update community comprehensive plans. Planners can use flood risk information in the development and/or update of comprehensive plans, future land use maps, and zoning regulations. For example, zoning codes may be changed to better provide for appropriate land uses in high-hazard areas.
Update emergency operations and response plans. Emergency managers can identify low-risk areas for potential evacuation Vulnerability of infrastructure is
another important consideration.

WHITE OAK BAYOU WATERSHED FLOOD RISK REPORT 4
and sheltering and can help first responders avoid areas of high-depth flood water. Risk assessment results may reveal vulnerable areas, facilities, and infrastructure for which planning for continuity of operations plans (COOP), continuity of government (COG) plans, and emergency operations plans (EOP) would be essential.
Develop hazard mitigation projects. Local officials (e.g., planners and public works officials) can use flood risk information to re-evaluate and prioritize mitigation actions in local hazard mitigation plans.
Communicate flood risk. Local officials can use the information in this report to communicate with property owners, business owners, and other citizens about flood risks, changes since the last FIRM, and areas of mitigation interest. The report layout allows community information to be extracted in a fact sheet format.
Inform the modification of development standards. Floodplain managers, planners, and public works officials can use information in this report to support the adjustment of development standards for certain locations. For example, heavily developed areas tend to increase floodwater runoff because paved surfaces cannot absorb water, indicating a need to adopt or revise standards that provide for appropriate stormwater retention.
The Flood Risk Database, Flood Risk Map, and Flood Risk Report are “non-regulatory” products. They are available and intended for community use but are neither mandatory nor tied to the regulatory development and insurance requirements of the National Flood Insurance Program (NFIP). They may be used as regulatory products by communities if authorized by state and local enabling authorities.
1.4 Sources of Flood Risk Assessment Data Used To assess potential community losses, or the consequences portion of the “risk” equation, the following data is typically collected for analysis and inclusion in a Flood Risk Project:
Information about local assets or resources at risk of flooding
Information about the physical features and human activities that contribute to that risk
Information about where the risk is most severe
Flooding along the Wabash River in Clark County, Illinois,
contributed to a federal disaster declaration on June 24, 2008.
WHITE OAK BAYOU WATERSHED FLOOD RISK REPORT 5
For most Flood Risk Projects, FEMA uses the following sources of flood risk information to develop this report:
Hazus estimated flood loss information
New engineering analyses (e.g., hydrology and hydraulic modeling) to develop new flood boundaries
Locally supplied data (see Section 7 for a description)
Sources identified during the Discovery process
1.5 Related Resources For a more comprehensive picture of flood risk, FEMA recommends that state and local officials use the information provided in this report in conjunction with other sources of flood risk data, such as those listed below.
FIRMs and FISs. This information indicates areas with specific flood hazards by identifying the limit and extent of the 1-percent-annual-chance floodplain and the 0.2-percent-annual-chance floodplain. FIRMs and FIS Reports do not identify all floodplains in a Flood Risk Project. The FIS Report includes summary information regarding other frequencies of flooding, as well as flood profiles for riverine sources of flooding. In rural areas and areas for which flood hazard data are not available, the 1-percent-annual-chance floodplain may not be identified. In addition, the 1-percent-annual-chance floodplain may not be identified for flooding sources with very small drainage areas (less than 1 square mile).
Hazus Flood Loss Estimation Reports. Hazus can be used to generate reports, maps and tables on potential flood damage that can occur based on new/proposed mitigation projects or future development patterns and practices. Hazus can also run specialized risk assessments, such as what happens when a dam or levee fails. Flood risk assessment tools are available through other agencies as well, including the National Oceanic and Atmospheric Administration (NOAA) and the U.S. Army Corps of Engineers (USACE). Other existing watershed reports may have a different focus, such as water quality, but may also contain flood risk and risk assessment information. See Section 6 for additional resources.
Flood or multi-hazard mitigation plans. Local hazard mitigation plans include risk assessments that contain flood risk information and mitigation strategies that identify community priorities and actions to reduce flood risk. This report was informed by any existing mitigation plans in the Flood Risk Project.
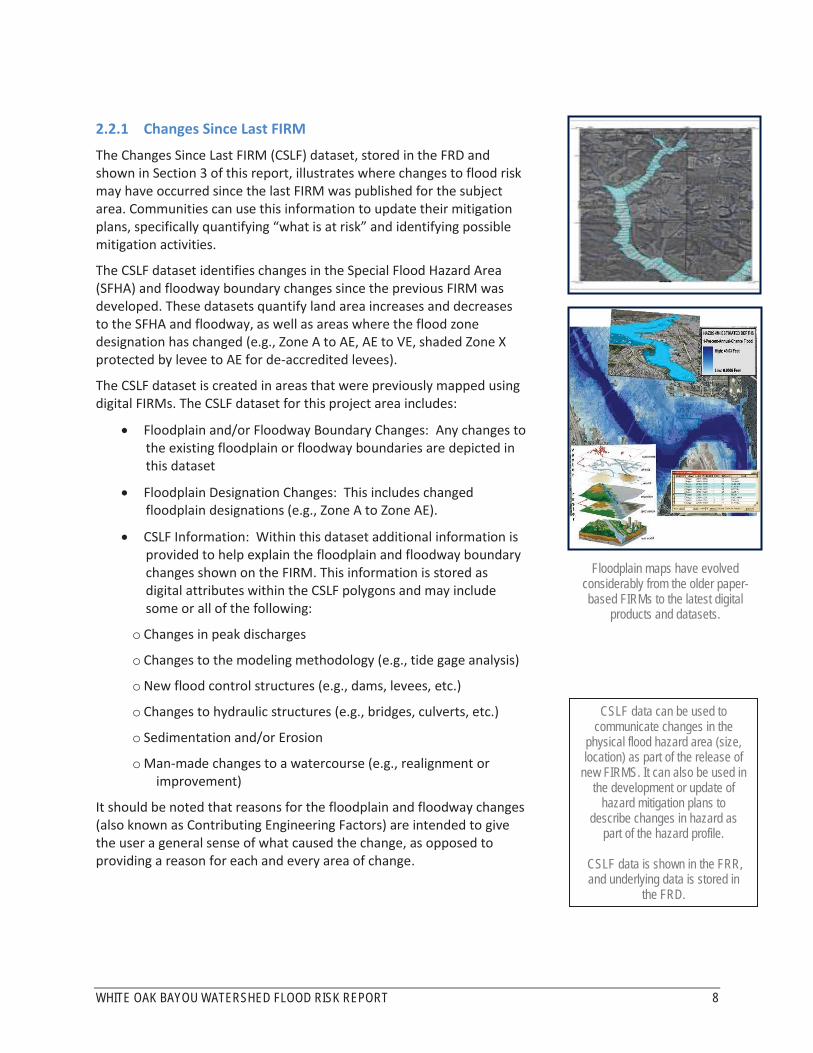
FEMA data can be leveraged to identify and measure
vulnerability by including local building information (i.e. building
type). The examples above show various ways to display
flooding intersecting with buildings.

WHITE OAK BAYOU WATERSHED FLOOD RISK REPORT 6
FEMA Map Service Center (MSC). The MSC has useful information, including fly sheets, phone numbers, data, etc. Letters of Map Change are also available through the MSC. The user can view FIRM databases and the National Flood Hazard Layer (NFHL) Database.

WHITE OAK BAYOU WATERSHED FLOOD RISK REPORT 7
2 Flood Risk Analysis
2.1 Overview Flood hazard identification uses FIRMs, and FIS Reports identify where flooding can occur along with the probability and depth of that flooding. Flood risk assessment is the systematic approach to identifying how flooding impacts the environment. In hazard mitigation planning, flood risk assessments serve as the basis for mitigation strategies and actions by defining the hazard and enabling informed decision making. Fully assessing flood risk requires the following:
Identifying the flooding source and determining the flood hazard occurrence probability
Developing a complete profile of the flood hazard including historical occurrence and previous impacts
Inventorying assets located in the identified flood hazard area
Estimating potential future flood losses caused by exposure to the flood hazard area
Flood risk analyses are different methods used in flood risk assessment to help quantify and communicate flood risk. Flood risk analysis can be performed on a large scale (state, community) level and on a very small scale (parcel, census block). Advantages of large-scale flood risk analysis, especially at the watershed level, include identifying how actions and development in one community can affect areas up- and downstream. On the parcel or census block level, flood risk analysis can provide actionable data to individual property owners so they can take appropriate mitigation steps.
2.2 Analysis of Risk The FRR, FRM, and FRD contain a variety of flood risk analysis information to help describe and visualize flood risk within the project area. Depending on the scope of the Flood Risk Project for this project area, this information may include some or all of the following elements:
Changes Since Last FIRM
Water Surface, Flood Depth, and Analysis Grids
Flood Risk Assessment Information
Areas of Mitigation Interest
State and Local Hazard Mitigation Plans are required to have a comprehensive all-hazard risk assessment. The flood risk analyses in the FRR, FRM, and FRD can inform the flood hazard portion of a community’s or state’s risk assessment. Further, data in the FRD can be used to develop information that meets the requirements for risk assessments as it relates to the hazard of flood in hazard mitigation plans.
Flooding impacts non-populated areas too, such as agricultural
lands and wildlife habitats.
WHITE OAK BAYOU WATERSHED FLOOD RISK REPORT 8
2.2.1 Changes Since Last FIRM
The Changes Since Last FIRM (CSLF) dataset, stored in the FRD and shown in Section 3 of this report, illustrates where changes to flood risk may have occurred since the last FIRM was published for the subject area. Communities can use this information to update their mitigation plans, specifically quantifying “what is at risk” and identifying possible mitigation activities.
The CSLF dataset identifies changes in the Special Flood Hazard Area (SFHA) and floodway boundary changes since the previous FIRM was developed. These datasets quantify land area increases and decreases to the SFHA and floodway, as well as areas where the flood zone designation has changed (e.g., Zone A to AE, AE to VE, shaded Zone X protected by levee to AE for de-accredited levees). The CSLF dataset is created in areas that were previously mapped using digital FIRMs. The CSLF dataset for this project area includes:
Floodplain and/or Floodway Boundary Changes: Any changes to the existing floodplain or floodway boundaries are depicted in this dataset
Floodplain Designation Changes: This includes changed floodplain designations (e.g., Zone A to Zone AE).
CSLF Information: Within this dataset additional information is provided to help explain the floodplain and floodway boundary changes shown on the FIRM. This information is stored as digital attributes within the CSLF polygons and may include some or all of the following:
o Changes in peak discharges
o Changes to the modeling methodology (e.g., tide gage analysis)
o New flood control structures (e.g., dams, levees, etc.)
o Changes to hydraulic structures (e.g., bridges, culverts, etc.)
o Sedimentation and/or Erosion
o Man-made changes to a watercourse (e.g., realignment or improvement)
It should be noted that reasons for the floodplain and floodway changes (also known as Contributing Engineering Factors) are intended to give the user a general sense of what caused the change, as opposed to providing a reason for each and every area of change.
CSLF data can be used to communicate changes in the
physical flood hazard area (size, location) as part of the release of
new FIRMS. It can also be used in the development or update of
hazard mitigation plans to describe changes in hazard as
part of the hazard profile.
CSLF data is shown in the FRR, and underlying data is stored in
the FRD.
Floodplain maps have evolved considerably from the older paper-based FIRMs to the latest digital
products and datasets.
WHITE OAK BAYOU WATERSHED FLOOD RISK REPORT 9
2.2.2 Flood Depth and Analysis Grids
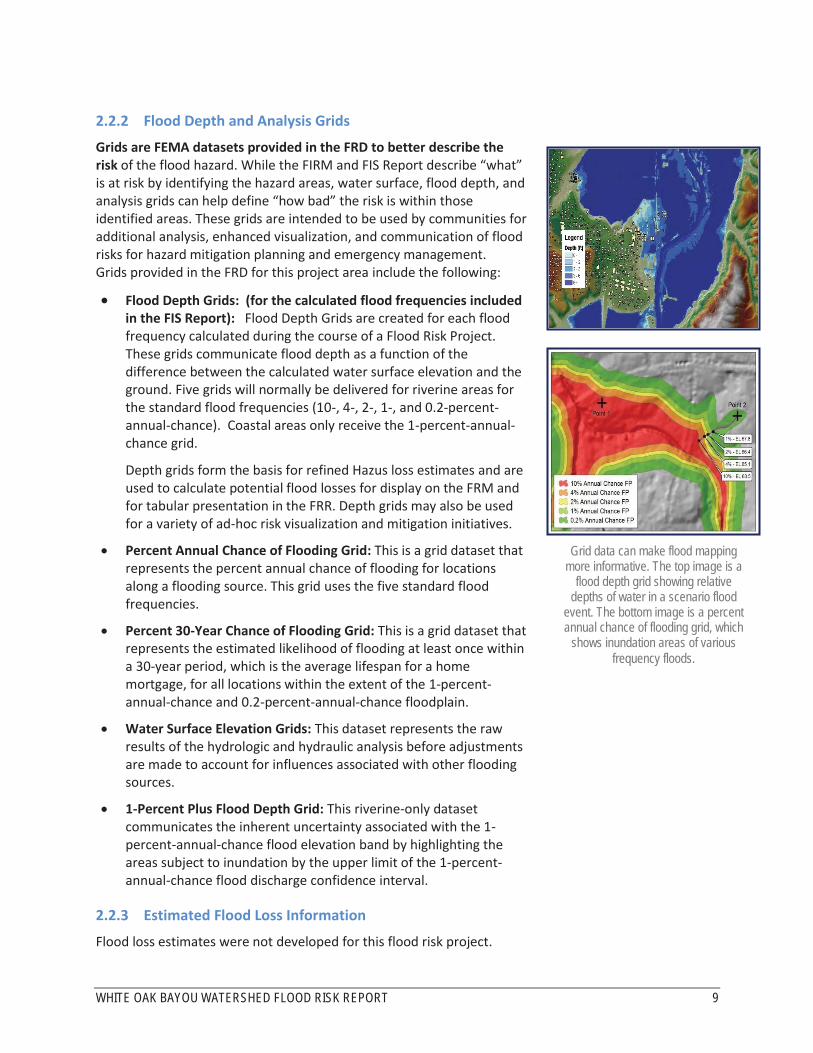
Grids are FEMA datasets provided in the FRD to better describe the risk of the flood hazard. While the FIRM and FIS Report describe “what” is at risk by identifying the hazard areas, water surface, flood depth, and analysis grids can help define “how bad” the risk is within those identified areas. These grids are intended to be used by communities for additional analysis, enhanced visualization, and communication of flood risks for hazard mitigation planning and emergency management. Grids provided in the FRD for this project area include the following:
Flood Depth Grids: (for the calculated flood frequencies included in the FIS Report): Flood Depth Grids are created for each flood frequency calculated during the course of a Flood Risk Project. These grids communicate flood depth as a function of the difference between the calculated water surface elevation and the ground. Five grids will normally be delivered for riverine areas for the standard flood frequencies (10-, 4-, 2-, 1-, and 0.2-percent-annual-chance). Coastal areas only receive the 1-percent-annual-chance grid.
Depth grids form the basis for refined Hazus loss estimates and are used to calculate potential flood losses for display on the FRM and for tabular presentation in the FRR. Depth grids may also be used for a variety of ad-hoc risk visualization and mitigation initiatives.
Percent Annual Chance of Flooding Grid: This is a grid dataset that represents the percent annual chance of flooding for locations along a flooding source. This grid uses the five standard flood frequencies.
Percent 30-Year Chance of Flooding Grid: This is a grid dataset that represents the estimated likelihood of flooding at least once within a 30-year period, which is the average lifespan for a home mortgage, for all locations within the extent of the 1-percent-annual-chance and 0.2-percent-annual-chance floodplain.
Water Surface Elevation Grids: This dataset represents the raw results of the hydrologic and hydraulic analysis before adjustments are made to account for influences associated with other flooding sources.
1-Percent Plus Flood Depth Grid: This riverine-only dataset communicates the inherent uncertainty associated with the 1-percent-annual-chance flood elevation band by highlighting the areas subject to inundation by the upper limit of the 1-percent-annual-chance flood discharge confidence interval.
2.2.3 Estimated Flood Loss Information
Flood loss estimates were not developed for this flood risk project.
Grid data can make flood mapping more informative. The top image is a
flood depth grid showing relative depths of water in a scenario flood
event. The bottom image is a percent annual chance of flooding grid, which
shows inundation areas of various frequency floods.
WHITE OAK BAYOU WATERSHED FLOOD RISK REPORT 10
2.2.4 Areas of Mitigation Interest
Many factors contribute to flooding and flood losses. Some are natural, and some are not. In response to these risks, there has been a focus by the federal government, state agencies, and local jurisdictions to mitigate properties against the impacts of flood hazards so that future losses and impacts can be reduced. An area identified as an Area of Mitigation Interest (AoMI) is an important element of defining a more comprehensive picture of flood risk and mitigation activity in a watershed, identifying target areas and potential projects for flood hazard mitigation, encouraging local collaboration, and communicating how various mitigation activities can successfully reduce flood risk.
This report and the FRM may include information that focuses on identifying Areas of Mitigation Interest that may be contributing (positively or negatively) to flooding and flood losses in the Flood Risk Project. AoMIs are identified through coordination with local stakeholders; through revised hydrologic and hydraulic and/or coastal analyses; by leveraging other studies or previous flood studies; from community mitigation plans, floodplain management plans, and local surveys; and from the mining of federal government databases (e.g., flood claims, disaster grants, and data from other agencies). Below is a list of the types of Areas of Mitigation Interest that may be identified in this Flood Risk Report, shown on the Flood Risk Map, and stored in the Flood Risk Database:
Dams
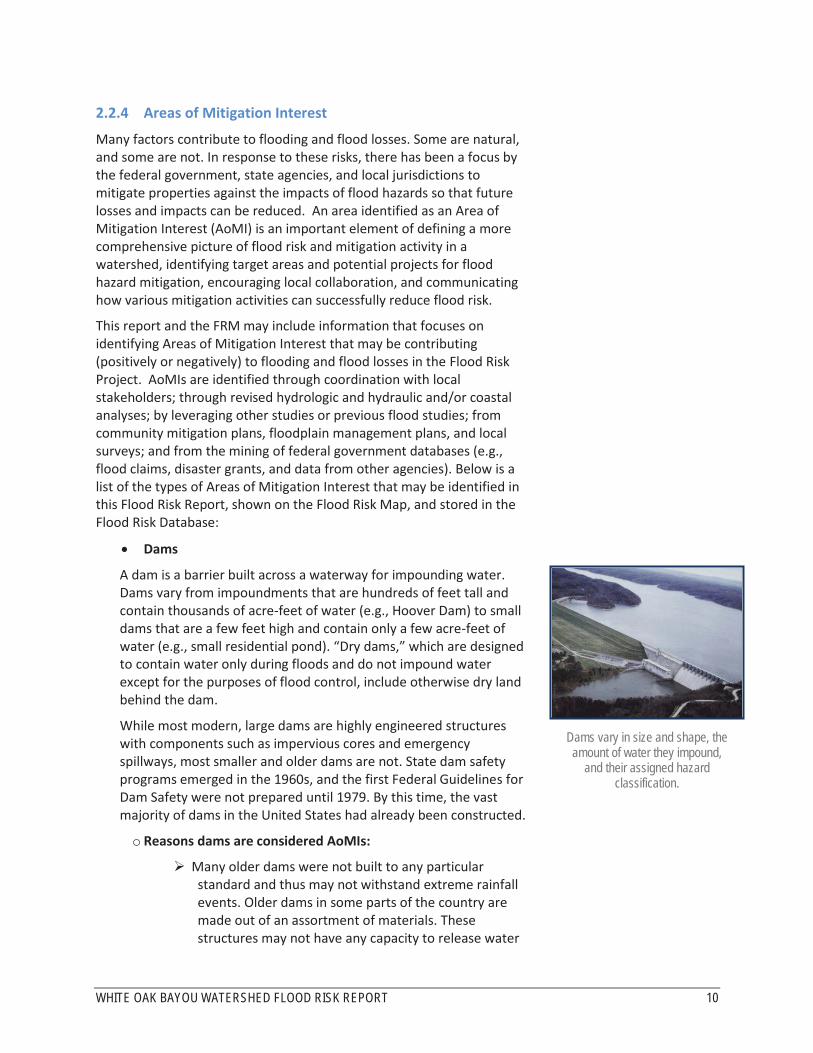
A dam is a barrier built across a waterway for impounding water. Dams vary from impoundments that are hundreds of feet tall and contain thousands of acre-feet of water (e.g., Hoover Dam) to small dams that are a few feet high and contain only a few acre-feet of water (e.g., small residential pond). “Dry dams,” which are designed to contain water only during floods and do not impound water except for the purposes of flood control, include otherwise dry land behind the dam.
While most modern, large dams are highly engineered structures with components such as impervious cores and emergency spillways, most smaller and older dams are not. State dam safety programs emerged in the 1960s, and the first Federal Guidelines for Dam Safety were not prepared until 1979. By this time, the vast majority of dams in the United States had already been constructed.
o Reasons dams are considered AoMIs:
Many older dams were not built to any particular standard and thus may not withstand extreme rainfall events. Older dams in some parts of the country are made out of an assortment of materials. These structures may not have any capacity to release water
Dams vary in size and shape, the amount of water they impound,
and their assigned hazard classification.
WHITE OAK BAYOU WATERSHED FLOOD RISK REPORT 11
and could be overtopped, which could result in catastrophic failure.
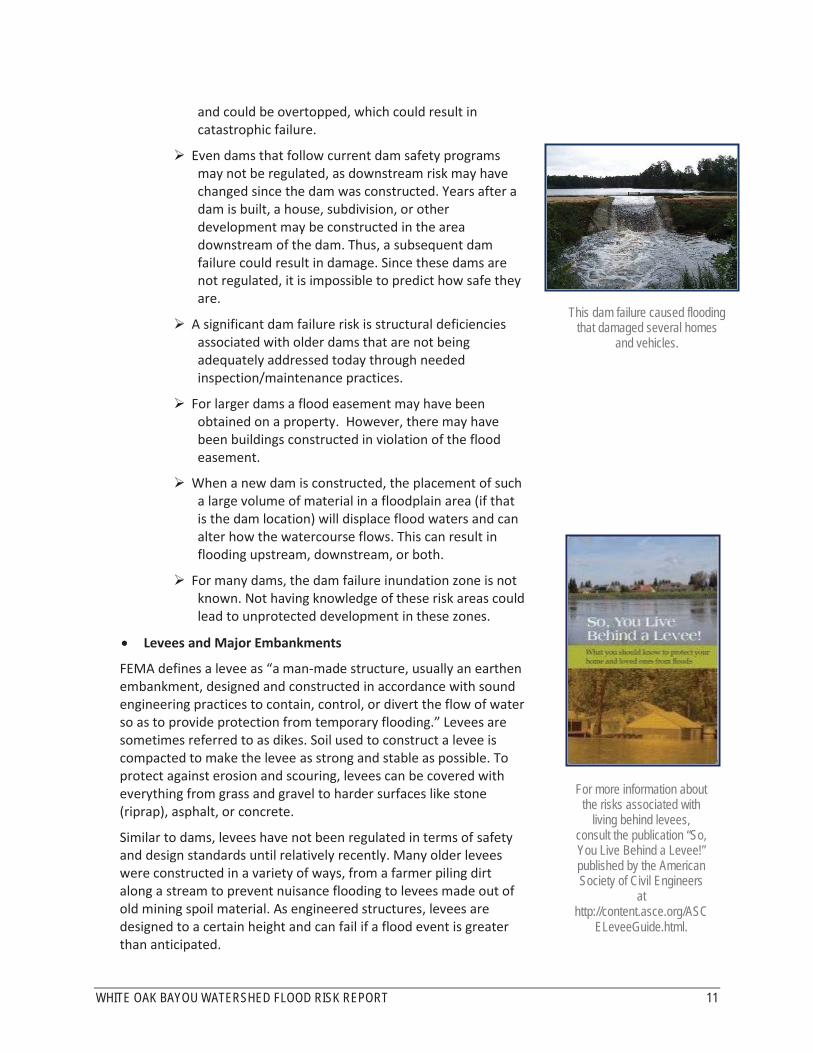
Even dams that follow current dam safety programs may not be regulated, as downstream risk may have changed since the dam was constructed. Years after a dam is built, a house, subdivision, or other development may be constructed in the area downstream of the dam. Thus, a subsequent dam failure could result in damage. Since these dams are not regulated, it is impossible to predict how safe they are.
A significant dam failure risk is structural deficiencies associated with older dams that are not being adequately addressed today through needed inspection/maintenance practices.
For larger dams a flood easement may have been obtained on a property. However, there may have been buildings constructed in violation of the flood easement.
When a new dam is constructed, the placement of such a large volume of material in a floodplain area (if that is the dam location) will displace flood waters and can alter how the watercourse flows. This can result in flooding upstream, downstream, or both.
For many dams, the dam failure inundation zone is not known. Not having knowledge of these risk areas could lead to unprotected development in these zones.
Levees and Major Embankments
FEMA defines a levee as “a man-made structure, usually an earthen embankment, designed and constructed in accordance with sound engineering practices to contain, control, or divert the flow of water so as to provide protection from temporary flooding.” Levees are sometimes referred to as dikes. Soil used to construct a levee is compacted to make the levee as strong and stable as possible. To protect against erosion and scouring, levees can be covered with everything from grass and gravel to harder surfaces like stone (riprap), asphalt, or concrete.
Similar to dams, levees have not been regulated in terms of safety and design standards until relatively recently. Many older levees were constructed in a variety of ways, from a farmer piling dirt along a stream to prevent nuisance flooding to levees made out of old mining spoil material. As engineered structures, levees are designed to a certain height and can fail if a flood event is greater than anticipated.
For more information about the risks associated with
living behind levees, consult the publication “So, You Live Behind a Levee!” published by the American Society of Civil Engineers
at http://content.asce.org/ASC
ELeveeGuide.html.
This dam failure caused flooding that damaged several homes
and vehicles.

WHITE OAK BAYOU WATERSHED FLOOD RISK REPORT 12
A floodwall is a vertical wall that is built to provide protection from a flood in a similar manner as a levee. Typically made of concrete or steel, floodwalls often are erected in urban locations where there is not enough room for a levee. Floodwalls are sometimes constructed on a levee crown to increase the levee’s height.
Most new dams and levees are engineered to a certain design standard. If that design is exceeded, they could be overtopped and fail catastrophically, causing more damage than if the levee was not there in the first place. Few levees anywhere in the nation are built to more than a 1-percent-annual-chance flood protection rating, and the areas behind them are still at some risk for flooding. This threat is called residual risk. In some states, residual risk areas can extend up to 15 miles from a riverbank. Although the probability of flooding may be lower because a levee exists, risk is nonetheless still present. The American Society of Civil Engineers’ publication “So, You Live Behind a Levee!” provides an in-depth explanation of levee and residual risk.
Major embankments, on the other hand, are rarely designed with any flood protection level in mind. Railroads, road abutments, and canals—especially in the Western United States—are not considered levees or dams and have issues such as unknown construction materials/methods. These embankments are not regulated from a flood risk standpoint.
o Reasons levees and major embankments are considered AoMIs:
Like dams, many levees in the United States were constructed using unknown techniques and materials. These levees have a higher failure rate than those that have been designed to today’s standards.
A levee might not provide the flood risk reduction it once did as a result of flood risk changes over time. Flood risk can change due to a number of factors, including increased flood levels due to climate change or better estimates of flooding, development in the watershed increasing flood levels and settlement of the levee or floodwall, and sedimentation in the levee channel. Increased flood levels mean decreased flood protection. The lack of adequate maintenance over time will also reduce the capability of a levee to contain the flood levels for which it was originally designed.
Given enough time, any levee will eventually be overtopped or damaged by a flood that exceeds the levee’s capacity. Still, a widespread public perception of levees is that they will always provide protection.
Canal levee breaches as a result of Hurricane Katrina in New
Orleans in 2005. Note damages can be more extensive due to
high velocity flood flows than if the levee was not there.
WHITE OAK BAYOU WATERSHED FLOOD RISK REPORT 13
This perception may lead to not taking mitigation actions such as purchasing flood insurance.
A levee is a system that can fail due to its weakest point, and therefore maintenance is critical. Many levees in the United States are poorly maintained or not maintained at all. Maintenance also includes maintaining the drainage systems behind the levees so they can keep the protected area dry.
Coastal Structures
Coastal structures are used to “harden” the shoreline for a variety of purposes and include:
o Jetties: Structures constructed to direct currents or accommodate vessels.
o Groynes: Protective structures of stone or concrete that extend from shore into the water to prevent a beach from washing away.
o Sea walls: A form of hard and strong coastal defense constructed on the inland part of a coast to reduce the effects of strong waves.
As the rate of sea level rise accelerates, an increase in coastal erosion is likely. We are now facing rapid sea level changes on a scale of decades. Higher sea levels could affect the coastal zone and accelerate coastal erosion and flooding in a variety of ways, including greater shoreline retreat; increased coastal erosion rates; property destruction; and saltwater intrusion into bays, rivers, and underground water resources. In addition, a general elevation in the water table due to sea level rise will result.
o Reasons coastal structures are considered AoMIs:
While coastal structures or “hardening of the shoreline” may provide a temporary level of flood reduction for a very specific site, it also interrupts the dynamic processes of the littoral flow (flow along the coastline) which results in accelerated coastal erosion.
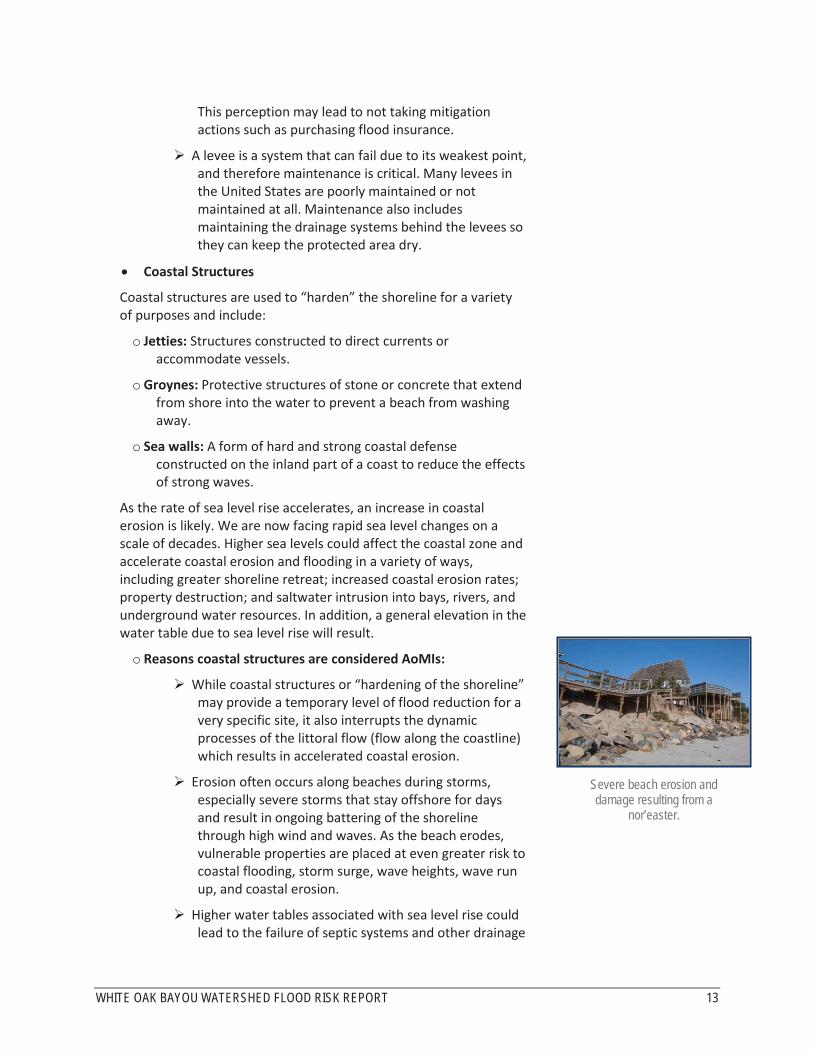
Erosion often occurs along beaches during storms, especially severe storms that stay offshore for days and result in ongoing battering of the shoreline through high wind and waves. As the beach erodes, vulnerable properties are placed at even greater risk to coastal flooding, storm surge, wave heights, wave run up, and coastal erosion.
Higher water tables associated with sea level rise could lead to the failure of septic systems and other drainage
Severe beach erosion and damage resulting from a
nor’easter.
WHITE OAK BAYOU WATERSHED FLOOD RISK REPORT 14
systems, such as storm drains, which need to be located at a certain elevation above the water table. Elevation of the water table would also affect the river drainage systems by affecting the rate of infiltration and increasing the amount of runoff which would, in turn, increase the risk of flooding.
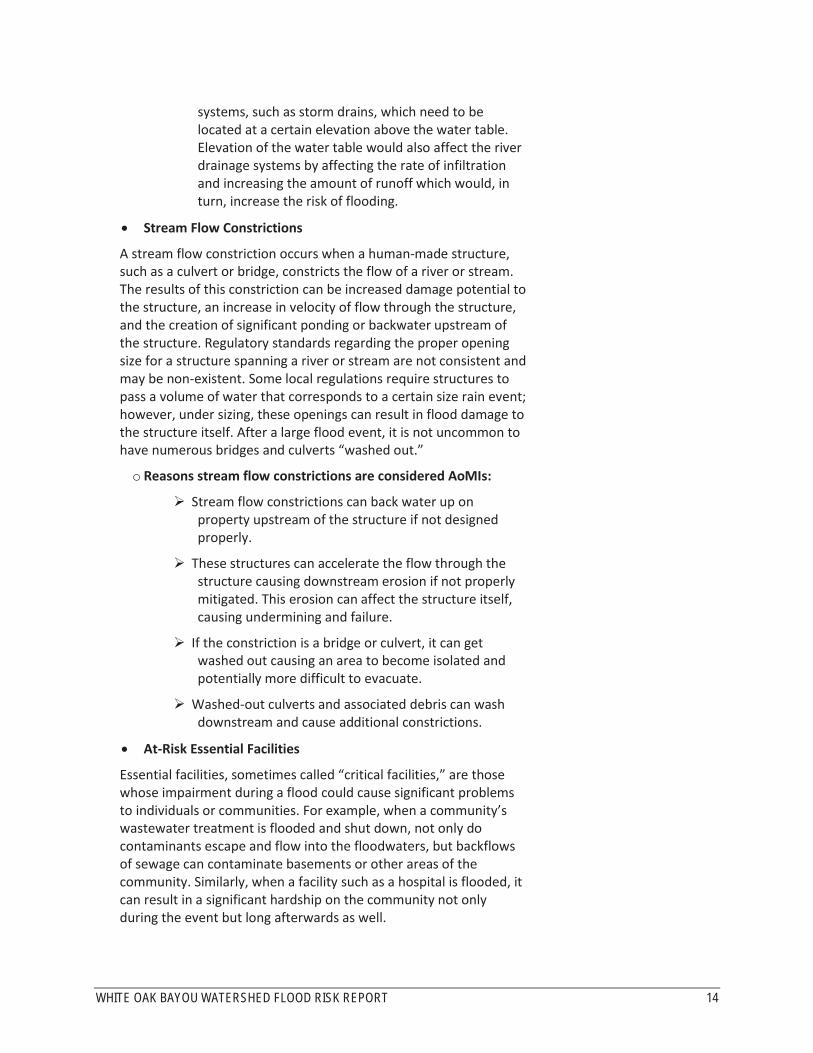
Stream Flow Constrictions
A stream flow constriction occurs when a human-made structure, such as a culvert or bridge, constricts the flow of a river or stream. The results of this constriction can be increased damage potential to the structure, an increase in velocity of flow through the structure, and the creation of significant ponding or backwater upstream of the structure. Regulatory standards regarding the proper opening size for a structure spanning a river or stream are not consistent and may be non-existent. Some local regulations require structures to pass a volume of water that corresponds to a certain size rain event; however, under sizing, these openings can result in flood damage to the structure itself. After a large flood event, it is not uncommon to have numerous bridges and culverts “washed out.”
o Reasons stream flow constrictions are considered AoMIs:
Stream flow constrictions can back water up on property upstream of the structure if not designed properly.
These structures can accelerate the flow through the structure causing downstream erosion if not properly mitigated. This erosion can affect the structure itself, causing undermining and failure.
If the constriction is a bridge or culvert, it can get washed out causing an area to become isolated and potentially more difficult to evacuate.
Washed-out culverts and associated debris can wash downstream and cause additional constrictions.
At-Risk Essential Facilities
Essential facilities, sometimes called “critical facilities,” are those whose impairment during a flood could cause significant problems to individuals or communities. For example, when a community’s wastewater treatment is flooded and shut down, not only do contaminants escape and flow into the floodwaters, but backflows of sewage can contaminate basements or other areas of the community. Similarly, when a facility such as a hospital is flooded, it can result in a significant hardship on the community not only during the event but long afterwards as well.

WHITE OAK BAYOU WATERSHED FLOOD RISK REPORT 15
o Reasons at-risk essential facilities are considered AoMIs:
Costly and specialized equipment may be damaged and need to be replaced.
Impairments to facilities such as fire stations may result in lengthy delays in responding and a focus on evacuating the facility itself.
Critical records and information stored at these facilities may be lost.
Past Flood Insurance Claims and Individual Assistance/Public Assistance Hotspots
Assistance provided after flood events (flood insurance in any event and Individual Assistance [IA] or Public Assistance [PA] after declared disasters) occurs in flood affected areas. Understanding geographically where this assistance is being provided may indicate unique flood problems.
Flood insurance claims are not always equally distributed in a community. Although estimates indicate that 20 to 50 percent of structures in identified flood hazard areas have flood insurance, clusters of past claims may indicate where there is a flood problem. However, clusters of past claims and/or areas where there are high payments under FEMA’s IA or PA Programs may indicate areas of significant flood hazard.
o Reasons past claim hotspots are considered AoMIs:
A past claim hotspot may reflect an area of recent construction (large numbers of flood insurance policies as a result of a large number of mortgages) and an area where the as-built construction is not in accordance with local floodplain management regulations.
Sometimes clusters of past claims occur in subdivisions that were constructed before flood protection standards were in place, places with inadequate stormwater management systems, or in areas that may not have been identified as SFHAs.
Clusters of IA or PA claims may indicate areas where high flood insurance coverage or other mitigation actions are needed.
Areas of Significant Land Use Change
Development, whether it is a 100-lot subdivision or a single lot big box commercial outlet, can result in large amounts of fill and other material being deposited in flood storage areas, thereby increasing flood hazards downstream.
Clusters of past flood insurance claims can show where there is a
repetitive flood problem.
Rooftops, pavements, patios, and driveways contribute to the impervious area in a watershed. This occurs in both urban areas
and rural areas being developed.

WHITE OAK BAYOU WATERSHED FLOOD RISK REPORT 16
Additionally, when development occurs, hard surfaces such as parking lots, buildings and driveways do not allow water to absorb into the ground, and more of the rainwater becomes runoff flowing directly into streams. As a result, the “peak flow” in a stream after a storm event will be higher and will occur faster. Without careful planning, major land use changes can affect the impervious area of a site and result in a significant increase in flood risk caused by streams that cannot handle the extra storm water runoff.
Sometimes a major land use change may be for planning purposes only. For example, a land use change that rezones land from a classification such as floodplain that restricts development to a zone such as industrial or high density residential could result in significant new infrastructure and structures in high flood risk areas.
o Reasons Areas of Significant Land Use Change are considered AoMIs:
Development in areas mapped SFHA reduces flood storage areas, which can make flooding worse at the development site and downstream of it.
Impervious surfaces speed up the water flowing in the streams, which can increase erosion and the danger that fast-flowing floodwaters pose to people and buildings.
Rezoning flood-prone areas to high densities and/or higher intensity uses can result in more people and property at risk of flooding and flood damage.
Key Emergency Routes Overtopped During Frequent Flooding Events
Roads are not always elevated above estimated flood levels, and present a significant flood risk to motorists during flooding events. When alternate routes are available, risks may be reduced, including risks to life and economic loss.
o Reasons overtopped roads are considered AoMIs:
Such areas, when identified, can be accounted for and incorporated into Emergency Action Plans.
Roads may be elevated or reinforced to reduce the risk of overtopping during flood events.
Drainage or Stormwater-Based Flood Hazard Areas, or Areas Not Identified as Floodprone on the FIRM But Known to Be Inundated
Flood hazard areas exist everywhere. While FEMA maps many of these, others are not identified. Many of these areas may be located in communities with existing, older, and often inadequate
When large highways close due to flooding, traffic is detoured causing inconvenience and economic loss.
WHITE OAK BAYOU WATERSHED FLOOD RISK REPORT 17
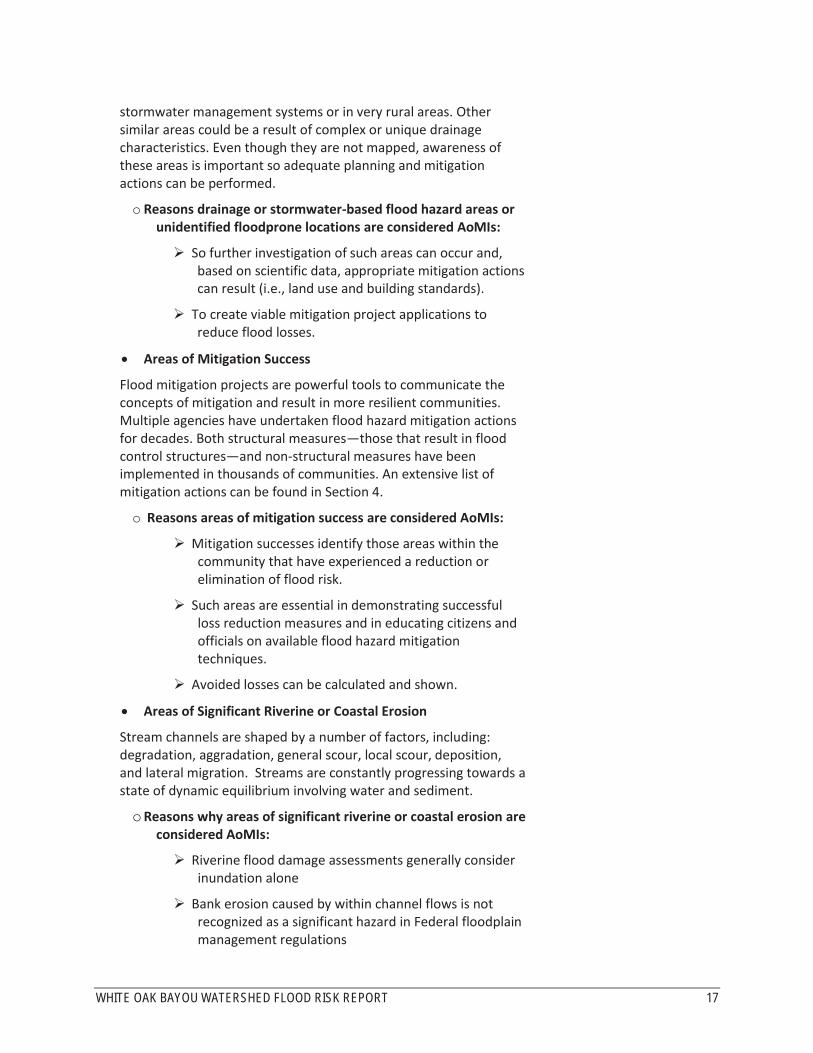
stormwater management systems or in very rural areas. Other similar areas could be a result of complex or unique drainage characteristics. Even though they are not mapped, awareness of these areas is important so adequate planning and mitigation actions can be performed.
o Reasons drainage or stormwater-based flood hazard areas or unidentified floodprone locations are considered AoMIs:
So further investigation of such areas can occur and, based on scientific data, appropriate mitigation actions can result (i.e., land use and building standards).
To create viable mitigation project applications to reduce flood losses.
Areas of Mitigation Success
Flood mitigation projects are powerful tools to communicate the concepts of mitigation and result in more resilient communities. Multiple agencies have undertaken flood hazard mitigation actions for decades. Both structural measures—those that result in flood control structures—and non-structural measures have been implemented in thousands of communities. An extensive list of mitigation actions can be found in Section 4.
o Reasons areas of mitigation success are considered AoMIs:
Mitigation successes identify those areas within the community that have experienced a reduction or elimination of flood risk.
Such areas are essential in demonstrating successful loss reduction measures and in educating citizens and officials on available flood hazard mitigation techniques.
Avoided losses can be calculated and shown.
Areas of Significant Riverine or Coastal Erosion
Stream channels are shaped by a number of factors, including: degradation, aggradation, general scour, local scour, deposition, and lateral migration. Streams are constantly progressing towards a state of dynamic equilibrium involving water and sediment.
o Reasons why areas of significant riverine or coastal erosion are considered AoMIs:
Riverine flood damage assessments generally consider inundation alone
Bank erosion caused by within channel flows is not recognized as a significant hazard in Federal floodplain management regulations

WHITE OAK BAYOU WATERSHED FLOOD RISK REPORT 18
Riverine and coastal erosion can undercut structures and roads, causing instability and possible collapse.
Landslides and mudslides are a result of erosion
Approximately one-third of the nation’s streams experience severe erosion problems
Other
Other types of flood risk areas include drainage or stormwater-based flood hazard areas, or areas known to be inundated during storm events.

WHITE OAK BAYOU WATERSHED FLOOD RISK REPORT 19
3 Flood Risk Analysis Results
The following pages provide summary flood risk results for the Flood Risk Project as follows:
Flood Risk Map (FRM). Within the Flood Risk Project the FRM displays base data reflecting community boundaries, major roads, and stream lines; new Flood Risk Project areas; and graphics and text that promote access and usage of additional data available through the FRD, FIRM, and National Flood Hazard Layer and viewers (desktop or FEMA website, etc.). This information can be used to assist in Flood Risk Project-level planning as well as for developing mitigation actions within each jurisdiction located within the Flood Risk Project.
Flood Risk Project Summary. Within the Flood Risk Project area, summary data for some or all of the following datasets are provided for the entire project area and also on a jurisdiction by jurisdiction basis:
o Changes Since Last FIRM (CSLF). This is a summary of where the floodplain and flood zones have increased or decreased (only analyzed for areas that were previously mapped using digital FIRMs).
o Flood Depth and Analysis Grids. A general discussion of the data provided in the FRD.
o Areas of Mitigation Interest. A description of areas that may require mitigation or additional risk analysis.
The FRM provides a graphical overview of the Flood Risk Project which highlights areas of risk that
should be noted, based on potential losses, exposed facilities,
etc., based on data found in the FRD. Refer to the data in the FRD
to conduct additional analyses.

WHITE OAK BAYOU WATERSHED FLOOD RISK REPORT 20
3.1 Flood Risk Map The Flood Risk Map for this Flood Risk Project is shown below. In addition to this reduced version of the map, a full size version is available within the FRD.

WHITE OAK BAYOU WATERSHED FLOOD RISK REPORT 21
This page left intentionally blank.
WHITE OAK BAYOU WATERSHED FLOOD RISK REPORT 22
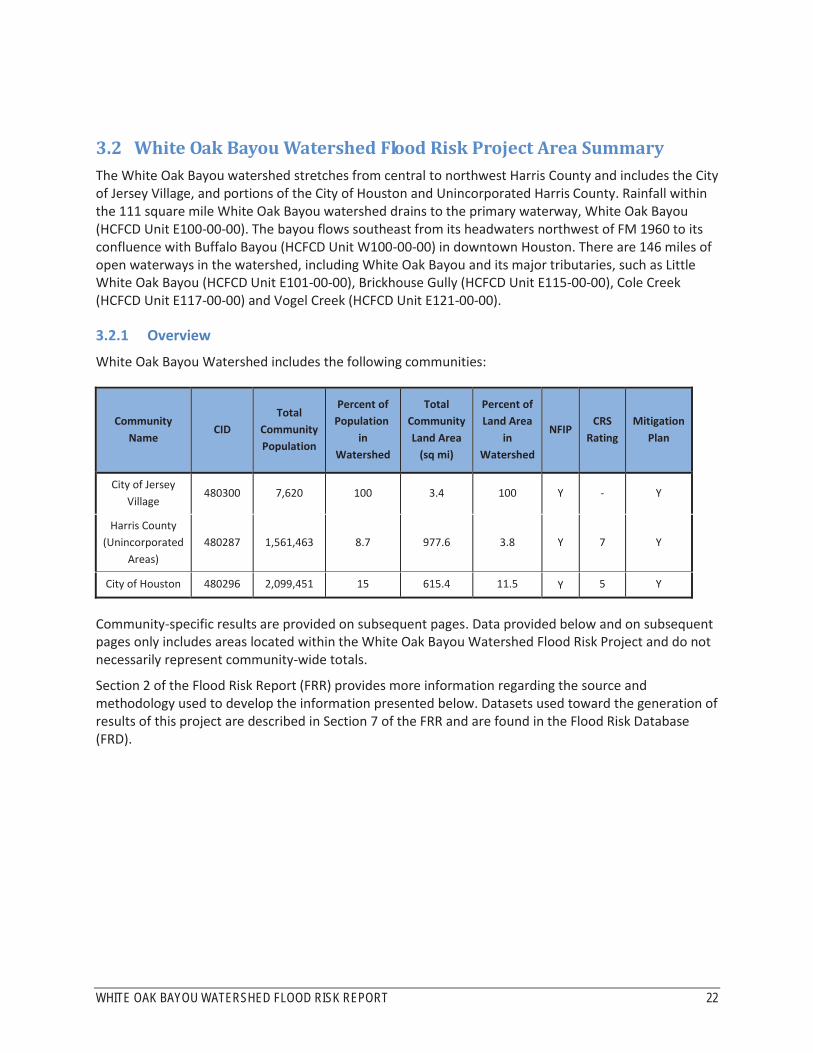
3.2 White Oak Bayou Watershed Flood Risk Project Area Summary The White Oak Bayou watershed stretches from central to northwest Harris County and includes the City of Jersey Village, and portions of the City of Houston and Unincorporated Harris County. Rainfall within the 111 square mile White Oak Bayou watershed drains to the primary waterway, White Oak Bayou (HCFCD Unit E100-00-00). The bayou flows southeast from its headwaters northwest of FM 1960 to its confluence with Buffalo Bayou (HCFCD Unit W100-00-00) in downtown Houston. There are 146 miles of open waterways in the watershed, including White Oak Bayou and its major tributaries, such as Little White Oak Bayou (HCFCD Unit E101-00-00), Brickhouse Gully (HCFCD Unit E115-00-00), Cole Creek (HCFCD Unit E117-00-00) and Vogel Creek (HCFCD Unit E121-00-00).
3.2.1 Overview
White Oak Bayou Watershed includes the following communities:
Community Name
CID Total
Community Population
Percent of Population
in Watershed
Total Community Land Area
(sq mi)
Percent of Land Area
in Watershed
NFIP CRS
Rating Mitigation
Plan
City of Jersey Village
480300 7,620 100 3.4 100 Y - Y
Harris County (Unincorporated
Areas) 480287 1,561,463 8.7 977.6 3.8 Y 7 Y
City of Houston 480296 2,099,451 15 615.4 11.5 Y 5 Y
Community-specific results are provided on subsequent pages. Data provided below and on subsequent pages only includes areas located within the White Oak Bayou Watershed Flood Risk Project and do not necessarily represent community-wide totals.
Section 2 of the Flood Risk Report (FRR) provides more information regarding the source and methodology used to develop the information presented below. Datasets used toward the generation of results of this project are described in Section 7 of the FRR and are found in the Flood Risk Database (FRD).

WHITE OAK BAYOU WATERSHED FLOOD RISK REPORT 23
3.2.2 Flood Risk Datasets
As a part of this Flood Risk Project, flood risk datasets were created for inclusion in the Flood Risk Database. Those datasets are summarized for this Flood Risk Project below:
Changes Since Last FIRM
Special Flood Hazard Area (SFHA) boundaries within White Oak Bayou Watershed were updated due to new engineering analysis performed within the Flood Risk Project. The updated modeling produced new flood zone areas and new base flood elevations in some areas for the Flood Risk Project. The data in this section reflects a comparison between the effective FIRM(s) and the new analysis in this study.
The table below summarizes the increases, decreases, and net change of SFHAs for the watershed.
*Although the Flood Risk Database may contain Changes Since Last FIRM information outside of the White Oak Bayou Flood Risk Project, the figures in this table only represent information within the White Oak Bayou Flood Risk Project.
Section 2 of the FRR provides more information regarding the source and methodology used to develop this table.
o Evidence of actual flood losses can be one of the most compelling factors for increasing a community’s flood risk awareness. Specific areas within each jurisdiction are detailed within the individual community summaries.
Flood Depth and Analysis Grids
o The FRD contains datasets in the form of depth grids for the entire Flood Risk Project that can be used for additional analysis, enhanced visualization, and communication of flood risks for hazard mitigation planning and emergency management. The data provided within the FRD should be used to further isolate areas where flood mitigation potential is high and may be helpful in planning and implementing mitigation strategies. Properties located in areas expected to experience some depth of water should seriously consider mitigation options for implementation. Section 2 of the FRR provides general information regarding the development of and potential uses for this data.
Area of Study Total Area (mi2) Increase (mi2) Decrease (mi2) Net Change (mi2)
Within SFHA 16.9 0.7 1.9 -1.2
Within Floodway 4.1 0.1 0.6 -0.5

WHITE OAK BAYOU WATERSHED FLOOD RISK REPORT 24
3.3 Communities The following sections provide an overview of the community’s floodplain management program as of the date of this publication, as well as summarize the flood risk analysis performed for each project area in the White Oak Bayou Watershed.
3.3.1 City of Jersey Village Summary (CID 480300)
The following pages include Flood Risk data for the City of Jersey Village, Texas.
3.3.1.1 Overview The City of Jersey Village is the smallest of the three communities located within the White Oak Bayou watershed. The information below provides an overview of the community’s floodplain management program information as of the date of this publication.
Community Name CID
Total Community Population
Percent of Population in
Watershed
Total Community Land Area
(sq mi)
Percent of Land Area
in Watershed
NFIP CRS Rating
Mitigation Plan
City of Jersey Village
480300 7,620 100 3.4 100 Y N/A Y
Participating in the Harris County, Texas Multi-Hazard Mitigation Plan which was last updated in
June 2015. National Flood Insurance Program (NFIP) policy coverage (policies/value) = 1,180 policies totaling
approximately $250,572,000 in coverage. NFIP-recognized repetitive loss properties = 151 residential properties and 1 non-residential
properties. NFIP-recognized severe repetitive loss properties = 41 residential properties
Data provided below only includes areas within the City of Jersey Village, that area located within the White Oak Bayou Watershed Flood Risk Project, and do not necessarily represent community-wide totals. Section 2 of the Flood Risk Report (FRR) provides more information regarding the source and methodology used to develop the information presented below. Datasets used toward the generation of results of this project are described in Section 7 of the FRR and are found in the Flood Risk Database (FRD).
3.3.1.2 Community Analyses and Results Changes Since Last FIRM
o Special Flood Hazard Area (SFHA) boundaries within the City of Jersey Village were updated due to new engineering analysis performed on White Oak Bayou (E100-00-00), E127-00-00, and E135-00-00. The updated modeling produced new flood zone areas and new base flood elevations. Population and building data was not analyzed to determine the numbers of persons and buildings in areas of change. The data in this section reflects the comparison between the effective FIRM and the new analysis in this study.

WHITE OAK BAYOU WATERSHED FLOOD RISK REPORT 25
The table below summarizes the increases, decreases, and net change of SFHAs for the community.
Area of Study Total Area (mi2) Increase (mi2) Decrease (mi2) Net Change (mi2)
Within SFHA 0.5 0.0 0.4 -0.4
Within Floodway 0.1 0.0 0.0 0.0
*Although the Flood Risk Database may contain Changes Since Last FIRM information outside the City of Jersey Village, the figures in this table only represent information within the City of Jersey Village.
Section 2 of the FRR provides more information regarding the source and methodology used to develop this table.
Flood Depth and Analysis Grids
o See the FRD for the following depth and analysis grid data (Section 2 of the FRR provides general information regarding the development of and potential uses for this data):
Multi-frequency flood depth grids (10-, 4-, 2-, 1-, and 0.2-percent-annual-chance flood events)
Percent annual chance of flooding grids
Percent chance of flooding over a 30-year period grids
Water surface elevation grids (10-, 4-, 2-, 1-, and 0.2-percent-annual-chance flood events)
1-percent-plus flood depth grids
o Additional information and data layers provided within the FRD should be used to further isolate these and other areas where flood mitigation potential is high. The FRD includes data which may be helpful in planning and implementing mitigation strategies. Properties located in areas expected to experience some depth of water should seriously consider mitigation options for implementation.
Hazus Estimated Loss Information
o A Hazus analysis was not completed as part of this project.
Areas of Mitigation Interest
o Section 2.2.4 of the FRR provides more information regarding areas of mitigation interest, how they are defined for this analysis, and potential mitigation actions that could be considered for each type. The table below summarizes the number of areas of mitigation interest by type.

WHITE OAK BAYOU WATERSHED FLOOD RISK REPORT 26
Type of Mitigation Interest Number of
Areas Data Source Flooded Evacuation Routes 0 Harris County Office of Homeland Security and
Emergency Management & Engineering models Stream Flow Pinch Points 3 Engineering models At-Risk Essential Facilities 0 ArcGIS Online & Engineering models Past Claims Hot Spot 11 State NFIP Area of Mitigation Success (Buyouts) 4 Harris County Flood Control District
o Many areas of mitigation interest were identified for the City of Jersey Village. The main channel
of White Oak Bayou (E100-00-00) is the primary source of flooding in the City. Flooding along E100-00-00 is not necessarily caused by specific constrictions, but by a general lack of channel capacity that is exacerbated by historic subsidence in Jersey Village.
o There are 11 Past Claims Hot Spots within Jersey Village. Each Past Claims Hot Spot represents a census block with five or more repetitive losses.
o Within the limits of Jersey Village there is a Hurricane Evacuation Route (US 290) and a Hurricane Evacuation Route Feeder (the Sam Houston Tollway) that are crossed by E100-00-00 and E127-00-00. This flood risk analysis shows that neither route will be overtopped during the 1-percent-annual-chance event.
o Other areas of mitigation interest include the channel restrictor on E135-00-00, just upstream of Steepleway Boulevard, that causes a 2.3 feet increase in the 1% event peak flood stages. E127-00-00 also has two crossings that induce significant headloss. These crossings include the Union Pacific Railroad and a restrictor just upstream of Rio Grande Street.
o The White Oak Bayou Watershed project includes several constructed Harris County Flood Control District projects that have reduced flooding within the City of Jersey Village. These projects include the Jersey Village Bypass Channel (E200-00-00) and the channel improvements to E141-00-00 that diverts approximately 48% of the E100-00-00 1-percent-annual-chance flow around the City of Jersey Village. The E500-11-00 regional detention facility, which is located approximately 9,000 feet upstream of Jersey Village, reduces storm event flows on E100-00-00.
o There are four flood-prone structures that have been acquired through buyout in the City of Jersey Village and the White Oak Bayou watershed. All four structures are located along E100-00-00.
WHITE OAK BAYOU WATERSHED FLOOD RISK REPORT 27
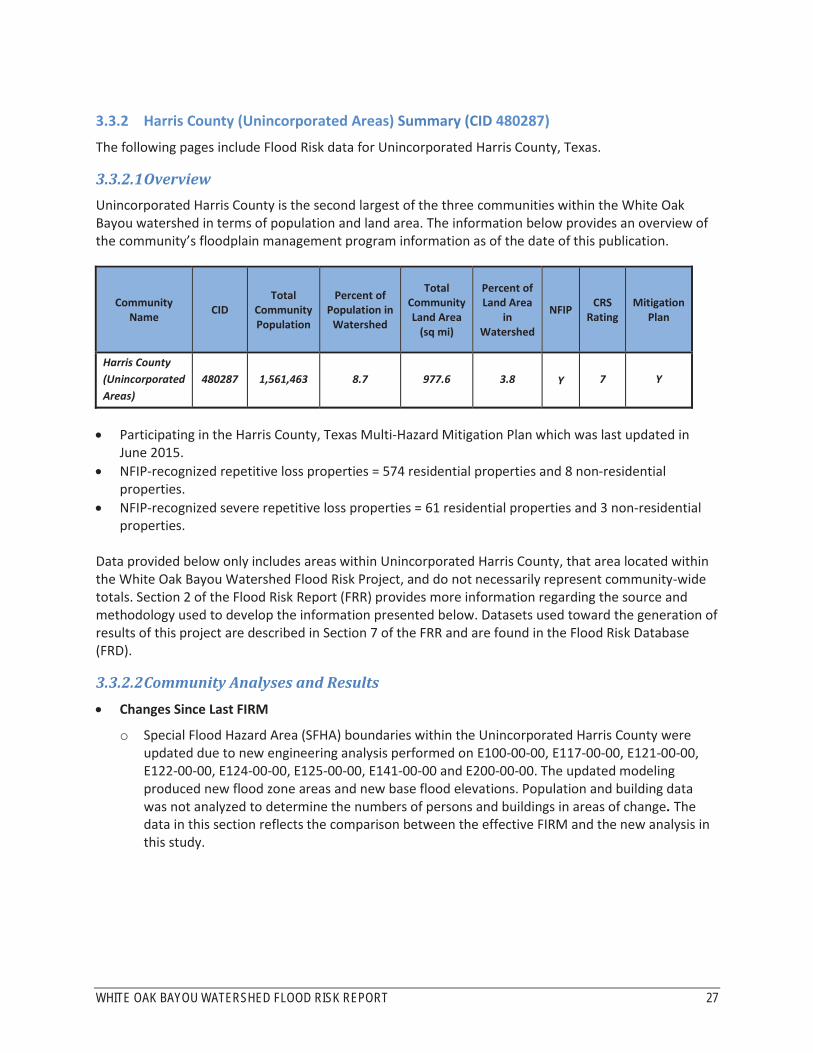
3.3.2 Harris County (Unincorporated Areas) Summary (CID 480287)
The following pages include Flood Risk data for Unincorporated Harris County, Texas.
3.3.2.1 Overview Unincorporated Harris County is the second largest of the three communities within the White Oak Bayou watershed in terms of population and land area. The information below provides an overview of the community’s floodplain management program information as of the date of this publication.
Community Name CID
Total Community Population
Percent of Population in
Watershed
Total Community Land Area
(sq mi)
Percent of Land Area
in Watershed
NFIP CRS Rating
Mitigation Plan
Harris County (Unincorporated Areas)
480287 1,561,463 8.7 977.6 3.8 Y 7 Y
Participating in the Harris County, Texas Multi-Hazard Mitigation Plan which was last updated in
June 2015. NFIP-recognized repetitive loss properties = 574 residential properties and 8 non-residential
properties. NFIP-recognized severe repetitive loss properties = 61 residential properties and 3 non-residential
properties.
Data provided below only includes areas within Unincorporated Harris County, that area located within the White Oak Bayou Watershed Flood Risk Project, and do not necessarily represent community-wide totals. Section 2 of the Flood Risk Report (FRR) provides more information regarding the source and methodology used to develop the information presented below. Datasets used toward the generation of results of this project are described in Section 7 of the FRR and are found in the Flood Risk Database (FRD).
3.3.2.2 Community Analyses and Results Changes Since Last FIRM
o Special Flood Hazard Area (SFHA) boundaries within the Unincorporated Harris County were updated due to new engineering analysis performed on E100-00-00, E117-00-00, E121-00-00, E122-00-00, E124-00-00, E125-00-00, E141-00-00 and E200-00-00. The updated modeling produced new flood zone areas and new base flood elevations. Population and building data was not analyzed to determine the numbers of persons and buildings in areas of change. The data in this section reflects the comparison between the effective FIRM and the new analysis in this study.

WHITE OAK BAYOU WATERSHED FLOOD RISK REPORT 28
The table below summarizes the increases, decreases, and net change of SFHAs for the community.
Area of Study Total Area (mi2) Increase (mi2) Decrease (mi2) Net Change (mi2)
Within SFHA 4.3 0.3 0.5 -0.2
Within Floodway 1.2 0.1 0.2 -0.1
*Although the Flood Risk Database may contain Changes Since Last FIRM information outside of Unincorporated Harris County, the figures in this table only represent information within Unincorporated Harris County.
Section 2 of the FRR provides more information regarding the source and methodology used to develop this table.
Flood Depth and Analysis Grids
o See the FRD for the following depth and analysis grid data (Section 2 of the FRR provides general information regarding the development of and potential uses for this data):
Multi-frequency flood depth grids (10-, 4-, 2-, 1-, and 0.2-percent-annual-chance flood events)
Percent annual chance of flooding grids
Percent chance of flooding over a 30-year period grids
Water surface elevation grids (10-, 4-, 2-, 1-, and 0.2-percent-annual-chance flood events)
1-percent-plus flood depth grids
o Additional information and data layers provided within the FRD should be used to further isolate these and other areas where flood mitigation potential is high. The FRD includes data which may be helpful in planning and implementing mitigation strategies. Properties located in areas expected to experience some depth of water should seriously consider mitigation options for implementation.
Hazus Estimated Loss Information
o A Hazus analysis was not completed as part of this project.
Areas of Mitigation Interest
o Section 2.2.4 of the FRR provides more information regarding areas of mitigation interest, how they are defined for this analysis, and potential mitigation actions that could be considered for each type. The table below summarizes the number of areas of mitigation interest by type.
Type of Mitigation Interest Number of
Areas Data Source Flooded Evacuation Routes 0 Harris County Office of Homeland Security and
Emergency Management & Engineering models Stream Flow Pinch Points 1 Engineering models At-Risk Essential Facilities 2 ArcGIS Online & Engineering models Past Claims Hot Spot 29 State NFIP Area of Mitigation Success (Buyouts) 664 Harris County Flood Control District

WHITE OAK BAYOU WATERSHED FLOOD RISK REPORT 29
o The main channel of White Oak Bayou (E100-00-00) is the primary source of flooding in Unincorporated Harris County. Flooding along E100-00-00 is not necessarily caused by specific constrictions, but by a general lack of channel capacity.
o There are 29 Past Claims Hot Spots within Unincorporated Harris County. Each Past Claims Hot Spot represents a census block with five or more repetitive losses.
o Within the limits of Unincorporated Harris County there is a Hurricane Evacuation Route (US 290) and a Hurricane Evacuation Route Feeder (the Sam Houston Tollway) that are crossed by E100-00-00 and E200-00-00. This flood risk analysis shows that neither route will be overtopped during the 1-percent-annual-chance event.
o There are two At-Risk Essential Facilities within the White Oak Bayou watershed and Unincorporated Harris County. Both facilities are hospitals near E100-00-00 and FM 1960.
o The White Oak Bayou Watershed project includes several constructed Harris County Flood Control District projects that have reduced flooding within Unincorporated Harris County. These projects include the E500-11-00, E500-10-00 (North and South), E500-01-00, E500-02-00 and E500-03-00 regional detention facilities. Harris County Flood Control District channel improvements to E100-00-00 (E122-00-00 to Beltway 8), E200-00-00, and E121-00-00 (just upstream of Arncliffe to the mouth) have also reduced flooding.
o There are 664 flood-prone structures that have been acquired through buyout in Unincorporated Harris County and the White Oak Bayou watershed. This includes 637 structures along E100-00-00, 21 structures on E117-00-00, 2 structures on E121-00-00, 2 structures on E124-00-00, and 2 structures on E125-00-00.
WHITE OAK BAYOU WATERSHED FLOOD RISK REPORT 30
3.3.3 City of Houston, Texas Summary (CID 480296)
The following pages include Flood Risk data for the City of Houston, Texas.
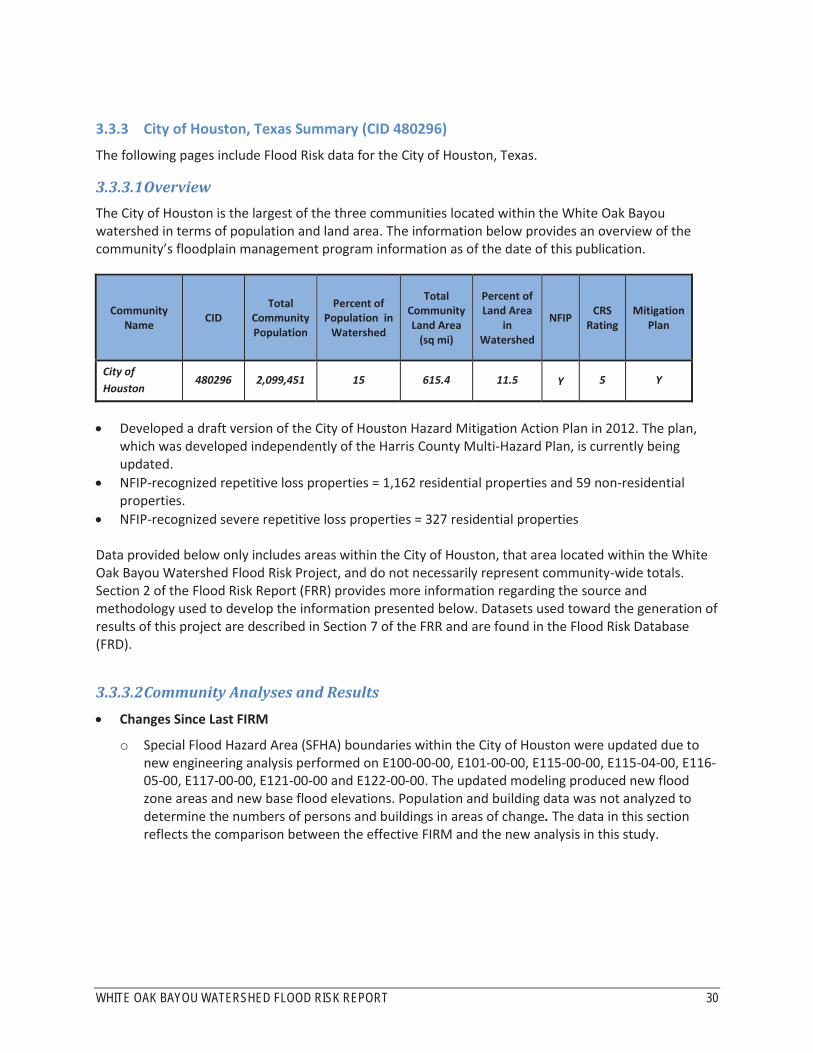
3.3.3.1 Overview The City of Houston is the largest of the three communities located within the White Oak Bayou watershed in terms of population and land area. The information below provides an overview of the community’s floodplain management program information as of the date of this publication.
Community Name CID
Total Community Population
Percent of Population in
Watershed
Total Community Land Area
(sq mi)
Percent of Land Area
in Watershed
NFIP CRS Rating
Mitigation Plan
City of Houston
480296 2,099,451 15 615.4 11.5 Y 5 Y
Developed a draft version of the City of Houston Hazard Mitigation Action Plan in 2012. The plan,
which was developed independently of the Harris County Multi-Hazard Plan, is currently being updated.
NFIP-recognized repetitive loss properties = 1,162 residential properties and 59 non-residential properties.
NFIP-recognized severe repetitive loss properties = 327 residential properties
Data provided below only includes areas within the City of Houston, that area located within the White Oak Bayou Watershed Flood Risk Project, and do not necessarily represent community-wide totals. Section 2 of the Flood Risk Report (FRR) provides more information regarding the source and methodology used to develop the information presented below. Datasets used toward the generation of results of this project are described in Section 7 of the FRR and are found in the Flood Risk Database (FRD).
3.3.3.2 Community Analyses and Results Changes Since Last FIRM
o Special Flood Hazard Area (SFHA) boundaries within the City of Houston were updated due to new engineering analysis performed on E100-00-00, E101-00-00, E115-00-00, E115-04-00, E116-05-00, E117-00-00, E121-00-00 and E122-00-00. The updated modeling produced new flood zone areas and new base flood elevations. Population and building data was not analyzed to determine the numbers of persons and buildings in areas of change. The data in this section reflects the comparison between the effective FIRM and the new analysis in this study.

WHITE OAK BAYOU WATERSHED FLOOD RISK REPORT 31
The table below summarizes the increases, decreases, and net change of SFHAs for the community.
Area of Study Total Area (mi2) Increase (mi2) Decrease (mi2) Net Change (mi2)
Within SFHA 12.1 0.4 1.0 -0.6
Within Floodway 2.8 0.0 0.3 -0.2
*Although the Flood Risk Database may contain Changes Since Last FIRM information outside of the City of Houston, the figures in this table only represent information within the City of Houston.
Section 2 of the FRR provides more information regarding the source and methodology used to develop this table.
Flood Depth and Analysis Grids
o See the FRD for the following depth and analysis grid data (Section 2 of the FRR provides general information regarding the development of and potential uses for this data):
Multi-frequency flood depth grids (10-, 4-, 2-, 1-, and 0.2-percent-annual-chance flood events)
Percent annual chance of flooding grids
Percent chance of flooding over a 30-year period grids
Water surface elevation grids (10-, 4-, 2-, 1-, and 0.2-percent-annual-chance flood events)
1-percent-plus flood depth grids
o Additional information and data layers provided within the FRD should be used to further isolate these and other areas where flood mitigation potential is high. The FRD includes data which may be helpful in planning and implementing mitigation strategies. Properties located in areas expected to experience some depth of water should seriously consider mitigation options for implementation.
Hazus Estimated Loss Information
o A Hazus analysis was not completed as part of this project.
Areas of Mitigation Interest
o Section 2.2.4 of the FRR provides more information regarding areas of mitigation interest, how they are defined for this analysis, and potential mitigation actions that could be considered for each type. The table below summarizes the number of areas of mitigation interest by type.
Type of Mitigation Interest Number of
Areas Data Source Flooded Evacuation Routes 12 Harris County Office of Homeland Security and
Emergency Management & Engineering models Stream Flow Pinch Points 23 Engineering models At-Risk Essential Facilities 3 ArcGIS Online & Engineering models Past Claims Hot Spot 56 State NFIP Area of Mitigation Success (Buyouts) 440 Harris County Flood Control District

WHITE OAK BAYOU WATERSHED FLOOD RISK REPORT 32
o There are 56 Past Claims Hot Spots within the City of Houston. Each Past Claims Hot Spot represents a census block with five or more repetitive losses.
o The main channel of White Oak Bayou (E100-00-00) is a source of flooding in the City of Houston. There are five crossings that cause 1-percent-annual-chance event headloss greater than 1.0 feet. These crossings include the South Heights bridge, the Yale Street bridge, the Union Pacific Railroad bridge, the Burlington Norther Railroad bridge and the North Houston Rosslyn bridge.
o E101-00-00 is a source of flooding in the City of Houston. There are seven crossings that cause 1-percent-annual-chance headloss greater than 1.0 feet. These crossings include IH-45, Coronado/Patton, Cavalcade Street, IH-610, Victoria Drive, Yale Street, and North Shepherd.
o There are six crossings on E115-00-00 that cause 1-percent-annual-chance event headloss greater than 1.0 feet. These crossings include the Watonga Blvd., FWD Railroad, Mangum Road, US 290, Hempstead Road, and Hollister Street.
o There are four crossings on E117-00-00 that cause 1-percent-annual-chance event headloss greater than 1.0 feet. These crossings include the W. Tidwell Road, Windfern Road, the long culvert upstream of US 290, and Fisher Road.
o E122-00-00 has one crossing (Gulf Bank Road) and a channel restrictor that causes 1-percent-annual-chance event headloss greater than 1.0 feet.
o There are three At-Risk Essential Facilities within the White Oak Bayou watershed and the City of Houston. These facilities include a school near E100-00-00 and West Little York Road, a school near E115-00-00 and Bolin Road, and a fire station near E115-04-00 and Bingle Road.
o Within the limits of the City of Houston there are three Hurricane Evacuation Routes (US 290, IH-45 and IH-10) and two Hurricane Evacuation Route Feeders (the Sam Houston Tollway and IH-610) that are crossed by E100-00-00, E101-00-00, E115-00-00 and E117-00-00. This flood risk analysis shows that the E117-00-00 crossing of US 290 and six locations along IH-45 may be overtopped during the 1-percent-annual-chance event. The IH-10 evacuation route between IH-610 and IH-45 may have one location overtopped during the 1-percent-annual-chance event. The IH-10 evacuation route between IH-10 may be flooded by backwater from E100-00-00 at 4 locations.
o The White Oak Bayou Watershed project includes several constructed Harris County Flood Control District projects that have reduced flooding within the City of Houston. These projects include the E500-11-00, E500-10-00 (North and South), E500-01-00, E500-02-00, E500-03-00 and E500-06-00 regional detention facilities. Harris County Flood Control District channel improvements to E100-00-00 (E122-00-00 to Beltway 8) and E121-00-00 (just upstream of Arncliffe to the mouth) have also reduced flooding within the City of Houston.
o There are 440 flood-prone structures that have been acquired through buyout in the City of Houston and the White Oak Bayou watershed. This includes 281 structures along E100-00-00, 57 structures on E101-00-00, 12 structures on E115-00-00, and 90 structures on E121-00-00.
WHITE OAK BAYOU WATERSHED FLOOD RISK REPORT 33
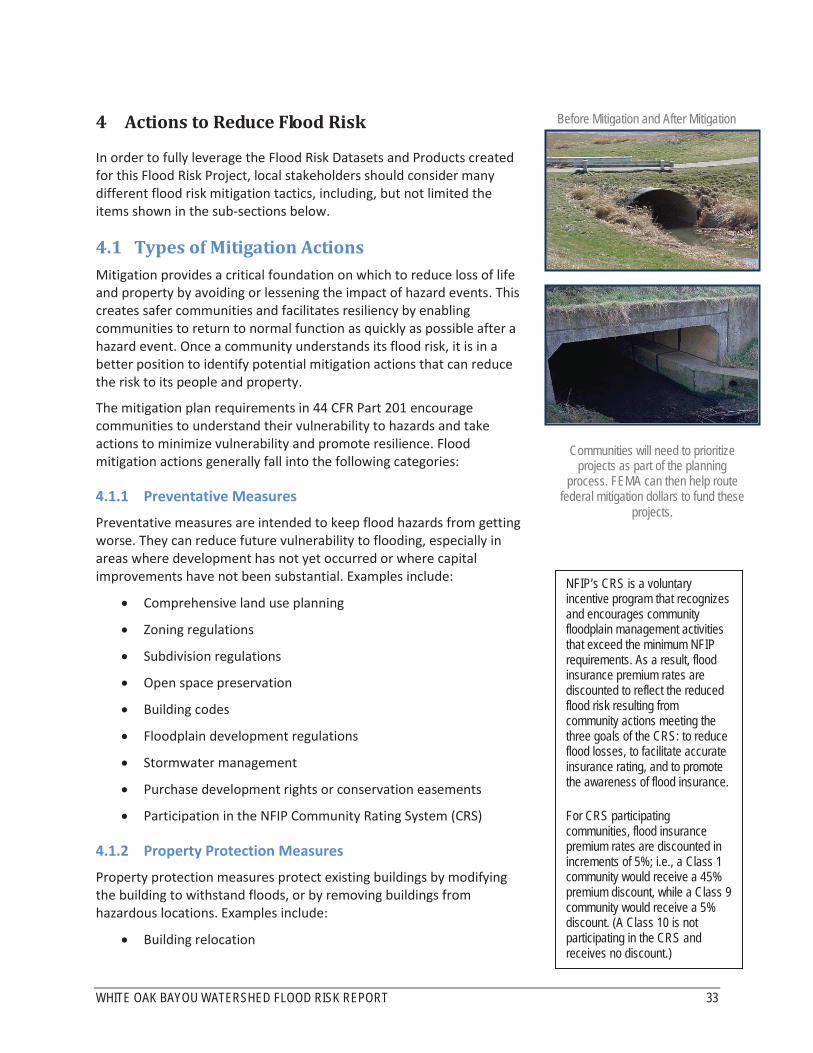
4 Actions to Reduce Flood Risk
In order to fully leverage the Flood Risk Datasets and Products created for this Flood Risk Project, local stakeholders should consider many different flood risk mitigation tactics, including, but not limited the items shown in the sub-sections below.
4.1 Types of Mitigation Actions Mitigation provides a critical foundation on which to reduce loss of life and property by avoiding or lessening the impact of hazard events. This creates safer communities and facilitates resiliency by enabling communities to return to normal function as quickly as possible after a hazard event. Once a community understands its flood risk, it is in a better position to identify potential mitigation actions that can reduce the risk to its people and property.
The mitigation plan requirements in 44 CFR Part 201 encourage communities to understand their vulnerability to hazards and take actions to minimize vulnerability and promote resilience. Flood mitigation actions generally fall into the following categories:
4.1.1 Preventative Measures
Preventative measures are intended to keep flood hazards from getting worse. They can reduce future vulnerability to flooding, especially in areas where development has not yet occurred or where capital improvements have not been substantial. Examples include:
Comprehensive land use planning
Zoning regulations
Subdivision regulations
Open space preservation
Building codes
Floodplain development regulations
Stormwater management
Purchase development rights or conservation easements
Participation in the NFIP Community Rating System (CRS)
4.1.2 Property Protection Measures
Property protection measures protect existing buildings by modifying the building to withstand floods, or by removing buildings from hazardous locations. Examples include:
Building relocation
NFIP’s CRS is a voluntary incentive program that recognizes and encourages community floodplain management activities that exceed the minimum NFIP requirements. As a result, flood insurance premium rates are discounted to reflect the reduced flood risk resulting from community actions meeting the three goals of the CRS: to reduce flood losses, to facilitate accurate insurance rating, and to promote the awareness of flood insurance.
For CRS participating communities, flood insurance premium rates are discounted in increments of 5%; i.e., a Class 1 community would receive a 45% premium discount, while a Class 9 community would receive a 5% discount. (A Class 10 is not participating in the CRS and receives no discount.)
Before Mitigation and After Mitigation
Communities will need to prioritize projects as part of the planning
process. FEMA can then help route federal mitigation dollars to fund these
projects.

WHITE OAK BAYOU WATERSHED FLOOD RISK REPORT 34
Acquisition and clearance
Building elevation
Barrier installation
Building retrofit
4.1.3 Natural Resource Protection Activities
Natural resource protection activities reduce the impact of floods by preserving or restoring natural areas such as floodplains, wetlands, and dunes and their natural functions. Examples include:
Wetland protection
Habitat protection
Erosion and sedimentation control
Best management practices (BMP)
Prevention of stream dumping activities (anti-litter campaigns)
Improved forestry practices such as reforesting or selective timbering (extraction)
4.1.4 Structural Mitigation Projects
Structural mitigation projects lessen the impact of floods by modifying the environmental natural progression of the flooding event. Structural protection such as upgrading dams/levees for already existing development and critical facilities may be a realistic alternative. However, citizens should be made aware of their residual risk. Examples include:
Reservoirs, retention, and detention basins
Levees and floodwalls
Channel modifications
Channel maintenance
4.1.5 Public Education and Awareness Activities
Public education and awareness activities advise residents, business owners, potential property buyers, and visitors about floods, hazardous areas, and mitigation techniques they can use to reduce the flood risk to themselves and their property. Examples include:
Readily available and readable updated maps
Outreach projects
Libraries
Technical assistance
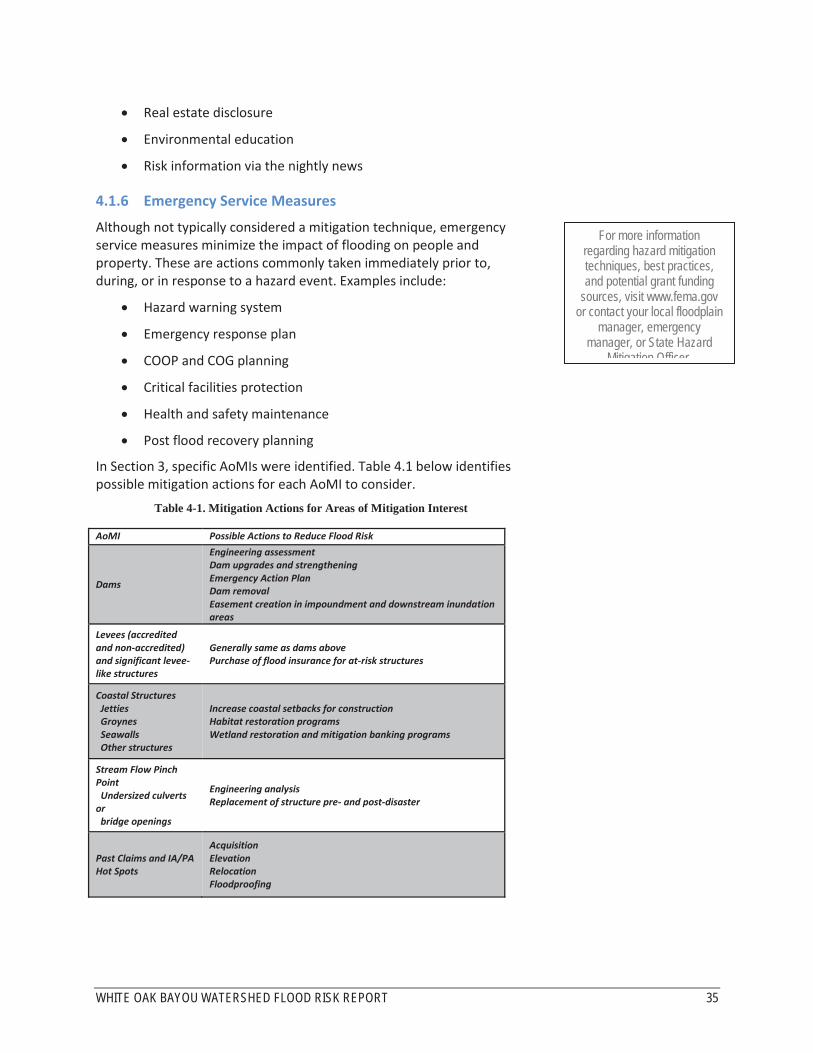
WHITE OAK BAYOU WATERSHED FLOOD RISK REPORT 35
Real estate disclosure
Environmental education
Risk information via the nightly news
4.1.6 Emergency Service Measures
Although not typically considered a mitigation technique, emergency service measures minimize the impact of flooding on people and property. These are actions commonly taken immediately prior to, during, or in response to a hazard event. Examples include:
Hazard warning system
Emergency response plan
COOP and COG planning
Critical facilities protection
Health and safety maintenance
Post flood recovery planning
In Section 3, specific AoMIs were identified. Table 4.1 below identifies possible mitigation actions for each AoMI to consider.
Table 4-1. Mitigation Actions for Areas of Mitigation Interest
AoMI Possible Actions to Reduce Flood Risk
Dams
Engineering assessment Dam upgrades and strengthening Emergency Action Plan Dam removal Easement creation in impoundment and downstream inundation areas
Levees (accredited and non-accredited) and significant levee-like structures
Generally same as dams above Purchase of flood insurance for at-risk structures
Coastal Structures Jetties Groynes Seawalls Other structures
Increase coastal setbacks for construction Habitat restoration programs Wetland restoration and mitigation banking programs
Stream Flow Pinch Point Undersized culverts or bridge openings
Engineering analysis Replacement of structure pre- and post-disaster
Past Claims and IA/PA Hot Spots
Acquisition Elevation Relocation Floodproofing
For more information regarding hazard mitigation techniques, best practices, and potential grant funding
sources, visit www.fema.gov or contact your local floodplain
manager, emergency manager, or State Hazard
Mitigation Officer
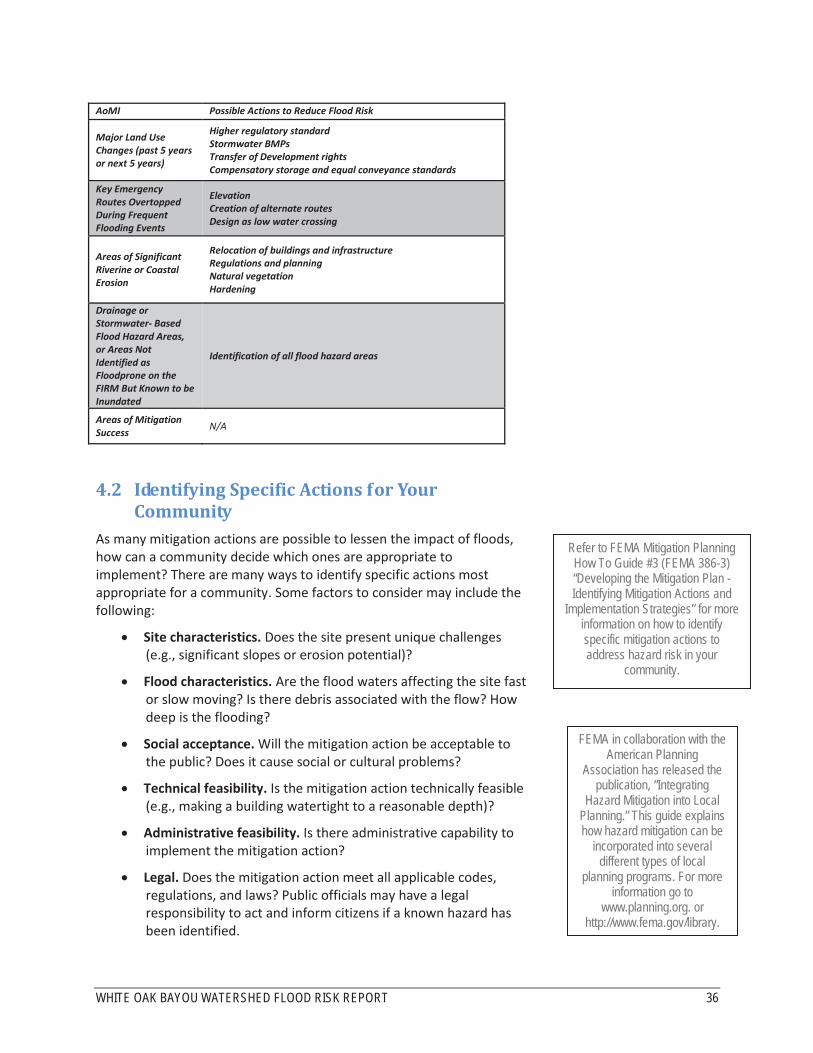
WHITE OAK BAYOU WATERSHED FLOOD RISK REPORT 36
AoMI Possible Actions to Reduce Flood Risk
Major Land Use Changes (past 5 years or next 5 years)
Higher regulatory standard Stormwater BMPs Transfer of Development rights Compensatory storage and equal conveyance standards
Key Emergency Routes Overtopped During Frequent Flooding Events
Elevation Creation of alternate routes Design as low water crossing
Areas of Significant Riverine or Coastal Erosion
Relocation of buildings and infrastructure Regulations and planning Natural vegetation Hardening
Drainage or Stormwater- Based Flood Hazard Areas, or Areas Not Identified as Floodprone on the FIRM But Known to be Inundated
Identification of all flood hazard areas
Areas of Mitigation Success N/A
4.2 Identifying Specific Actions for Your Community
As many mitigation actions are possible to lessen the impact of floods, how can a community decide which ones are appropriate to implement? There are many ways to identify specific actions most appropriate for a community. Some factors to consider may include the following:
Site characteristics. Does the site present unique challenges (e.g., significant slopes or erosion potential)?
Flood characteristics. Are the flood waters affecting the site fast or slow moving? Is there debris associated with the flow? How deep is the flooding?
Social acceptance. Will the mitigation action be acceptable to the public? Does it cause social or cultural problems?
Technical feasibility. Is the mitigation action technically feasible (e.g., making a building watertight to a reasonable depth)?
Administrative feasibility. Is there administrative capability to implement the mitigation action?
Legal. Does the mitigation action meet all applicable codes, regulations, and laws? Public officials may have a legal responsibility to act and inform citizens if a known hazard has been identified.
Refer to FEMA Mitigation Planning How To Guide #3 (FEMA 386-3) “Developing the Mitigation Plan - Identifying Mitigation Actions and
Implementation Strategies” for more information on how to identify specific mitigation actions to address hazard risk in your
community.
FEMA in collaboration with the American Planning
Association has released the publication, “Integrating
Hazard Mitigation into Local Planning.” This guide explains how hazard mitigation can be
incorporated into several different types of local
planning programs. For more information go to
www.planning.org. or http://www.fema.gov/library.
WHITE OAK BAYOU WATERSHED FLOOD RISK REPORT 37
Economic. Is the mitigation action affordable? Is it eligible under grant or other funding programs? Can it be completed within existing budgets?
Environmental. Does the mitigation action cause adverse impacts on the environment or can they be mitigated? Is it the most appropriate action among the possible alternatives?
Your local Hazard Mitigation Plan is a valuable place to identify and prioritize possible mitigation actions. The plan includes a mitigation strategy with mitigation actions that were developed through a public and open process. You can then add to or modify those actions based on what is learned during the course of the Risk MAP project and the information provided within this FRR.
4.3 Mitigation Programs and Assistance Not all mitigation activities require funding (e.g., local policy actions such as strengthening a flood damage prevention ordinance), and those that do are not limited to outside funding sources (e.g., inclusion in local capital improvements plan, etc.). For those mitigation actions that require assistance through funding or technical expertise, several state and federal agencies have flood hazard mitigation grant programs and offer technical assistance. These programs may be funded at different levels over time or may be activated under special circumstances such as after a presidential disaster declaration.
4.3.1 FEMA Mitigation Programs and Assistance
FEMA awards many mitigation grants each year to states and communities to undertake mitigation projects to prevent future loss of life and property resulting from hazard impacts, including flooding. The FEMA Hazard Mitigation Assistance (HMA) programs provide grants for mitigation through the programs listed in Table 4.2 below.
Table 4-2. FEMA Hazard Mitigation Assistance Programs
Mitigation Grant Program Authorization Purpose
Hazard Mitigation
Grant Program (HMGP)
Robert T. Stafford Disaster Relief and
Emergency Assistance Act
Activated after a presidential disaster declaration; provides funds on a sliding scale formula based on a percentage of the total federal assistance for a disaster for long-term mitigation measures to reduce vulnerability to natural hazards
Flood Mitigation Assistance
(FMA)
National Flood Insurance Reform
Act Reduce or eliminate claims against the NFIP
Pre-Disaster Mitigation
(PDM)
Disaster Mitigation Act
National competitive program focused on mitigation project and planning activities that address multiple natural hazards
Communities can link hazard mitigation
plans and actions to the right FEMA grant programs to fund flood risk
reduction. More information about FEMA HMA programs can be found at http://www.fema.gov/government/grant/
hma/index.shtm.
WHITE OAK BAYOU WATERSHED FLOOD RISK REPORT 38
Mitigation Grant Program Authorization Purpose
Repetitive Flood Claims
(RFC)
Bunning-Bereuter-Blumenauer Flood Insurance Reform
Act
Reduce flood claims against the NFIP through flood mitigation; properties must be currently NFIP insured and have had at least one NFIP claim
Severe Repetitive Loss
(SRL)
Bunning-Bereuter-Blumenauer Flood Insurance Reform
Act
Reduce or eliminate the long-term risk of flood damage to SRL residential structures currently insured under the NFIP
The HMGP and PDM programs offer funding for mitigation planning and project activities that address multiple natural hazard events. The FMA, RFC, and SRL programs focus funding efforts on reducing claims against the NFIP. Funding under the HMA programs is subject to availability of annual appropriations, and HMGP funding is also subject to the amount of FEMA disaster recovery assistance provided under a presidential major disaster declaration.
FEMA’s HMA grants are awarded to eligible states, tribes, and territories (applicant) that, in turn, provide subgrants to local governments and communities (subapplicant). The applicant selects and prioritizes subapplications developed and submitted to them by subapplicants and submits them to FEMA for funding consideration. Prospective subapplicants should consult the office designated as their applicant for further information regarding specific program and application requirements. Contact information for the FEMA Regional Offices and State Hazard Mitigation Officers (SHMO) is available on the FEMA website (www.fema.gov).
4.3.2 Additional Mitigation Programs and Assistance
Several additional agencies including USACE, Natural Resource Conservation Service (NRCS), U.S. Geological Survey (USGS), and others have specialists on staff and can offer further information on flood hazard mitigation. The State NFIP Coordinator and SHMO are state-level sources of information and assistance, which vary among different states.
The Silver Jackets program, active in
several states, is a partnership of USACE, FEMA, and state agencies.
The Silver Jackets program provides a state-based strategy for an interagency approach to planning and implementing
measures for risk reduction.
WHITE OAK BAYOU WATERSHED FLOOD RISK REPORT 39
5 Acronyms and Definitions
5.1 Acronyms A AAL Average Annualized Loss ALR Annualized Loss Ratio AoMI Areas of Mitigation Interest B BCA Benefit-Cost Analysis BFE Base Flood Elevation BMP Best Management Practices C CFR Code of Federal Regulations COG Continuity of Government Plan COOP Continuity of Operations Plan CRS Community Rating System CSLF Changes Since Last FIRM D DHS Department of Homeland Security DMA 2000 Disaster Mitigation Act of 2000 E EOP Emergency Operations Plan F FEMA Federal Emergency Management Agency FIRM Flood Insurance Rate Map FIS Flood Insurance Study FMA Flood Mitigation Assistance FRD Flood Risk Database FRM Flood Risk Map FRR Flood Risk Report FY Fiscal Year G GIS Geographic Information System H HMA Hazard Mitigation Assistance HMGP Hazard Mitigation Grant Program

WHITE OAK BAYOU WATERSHED FLOOD RISK REPORT 40
I IA Individual Assistance N NFIA National Flood Insurance Act NFIP National Flood Insurance Program NRCS Natural Resource Conservation Service P PA Public Assistance PDM Pre-Disaster Mitigation R RFC Repetitive Flood Claims Risk MAP Mapping, Assessment, and Planning S SFHA Special Flood Hazard Area SHMO State Hazard Mitigation Officer SRL Severe Repetitive Loss U USACE U.S. Army Corps of Engineers USGS U.S. Geological Survey
5.2 Definitions 0.2-percent-annual-chance flood – The flood elevation that has a 0.2-percent chance of being equaled or exceeded each year. Sometimes referred to as the 500-year flood. 1-percent-annual-chance flood – The flood elevation that has a 1-percent chance of being equaled or exceeded each year. Sometimes referred to as the 100-year flood. Annualized Loss Ratio (ALR) – Expresses the annualized loss as a fraction of the value of the local inventory (total value/annualized loss). Average Annualized Loss (AAL) – The estimated long-term weighted average value of losses to property in any single year in a specified geographic area. Base Flood Elevation (BFE) – Elevation of the 1-percent-annual-chance flood. This elevation is the basis of the insurance and floodplain management requirements of the NFIP. Berm – A small levee, typically built from earth. Cfs – Cubic feet per second, the unit by which discharges are measured (a cubic foot of water is about 7.5 gallons).

WHITE OAK BAYOU WATERSHED FLOOD RISK REPORT 41
Consequence (of flood) – The estimated damages associated with a given flood occurrence. Crest – The peak stage or elevation reached or expected to be reached by the floodwaters of a specific flood at a given location. Dam – An artificial barrier that has the ability to impound water, wastewater, or any liquid-borne material, for the purpose of storage or control of water. Design flood event – The greater of the following two flood events: (1) the base flood, affecting those areas identified as SFHAs on a community’s FIRM; or (2) the flood corresponding to the area designated as a flood hazard area on a community’s flood hazard map or otherwise legally designated. Erosion – Process by which floodwaters lower the ground surface in an area by removing upper layers of soil. Essential facilities – Facilities that, if damaged, would present an immediate threat to life, public health, and safety. As categorized in Hazus, essential facilities include hospitals, emergency operations centers, police stations, fire stations, and schools. Flood – A general and temporary condition of partial or complete inundation of normally dry land areas from (1) the overflow of inland or tidal waters or (2) the unusual and rapid accumulation or runoff of surface waters from any source. Flood Insurance Rate Map (FIRM) – An official map of a community, on which FEMA has delineated both the SFHAs and the risk premium zones applicable to the community. See also Digital Flood Insurance Rate Map. Flood Insurance Study (FIS) Report – Contains an examination, evaluation, and determination of the flood hazards of a community, and if appropriate, the corresponding water-surface elevations. Flood risk – Probability multiplied by consequence; the degree of probability that a loss or injury may occur as a result of flooding. Sometimes referred to as flood vulnerability. Flood vulnerability – Probability multiplied by consequence; the degree of probability that a loss or injury may occur as a result of flooding. Sometimes referred to as flood risk. Floodborne debris impact – Floodwater moving at a moderate or high velocity can carry floodborne debris that can impact buildings and damage walls and foundations. Floodwall – A long, narrow concrete or masonry wall built to protect land from flooding. Floodway (regulatory) – The channel of a river or other watercourse and that portion of the adjacent floodplain that must remain unobstructed to permit passage of the base flood without cumulatively increasing the water surface elevation more than a designated height (usually 1 foot). Floodway fringe – The portion of the SFHA that is outside of the floodway.
WHITE OAK BAYOU WATERSHED FLOOD RISK REPORT 42
Freeboard – A factor of safety usually expressed in feet above a flood level for purposes of flood plain management. “Freeboard” tends to compensate for the many unknown factors that could contribute to flood heights greater than the height calculated for a selected size flood and floodway conditions, such as wave action, bridge openings, and the hydrological effect of urbanization of the watershed (44CFR§59.1). Hazus – A GIS-based risk assessment methodology and software application created by FEMA and the National Institute of Building Sciences for analyzing potential losses from floods, hurricane winds and storm surge, and earthquakes. High velocity flow – Typically comprised of floodwaters moving faster than 5 feet per second. Levee – A human-made structure, usually an earthen embankment, designed and constructed in accordance with sound engineering practices to contain, control, or divert the flow of water so as to provide protection from temporary flooding. (44CFR§59.1) Loss ratio – Expresses loss as a fraction of the value of the local inventory (total value/loss). Mudflow – Mudslide (i.e., mudflow) describes a condition where there is a river, flow or inundation of liquid mud down a hillside usually as a result of a dual condition of loss of brush cover, and the subsequent accumulation of water on the ground preceded by a period of unusually heavy or sustained rain. A mudslide (i.e., mudflow) may occur as a distinct phenomenon while a landslide is in progress, and will be recognized as such by the Administrator only if the mudflow, and not the landslide, is the proximate cause of damage that occurs. (44CFR§59.1) Probability (of flood) – The likelihood that a flood will occur in a given area. Risk MAP – Risk Mapping, Assessment, and Planning, a FEMA strategy to work collaboratively with state, local, and tribal entities to deliver quality flood data that increases public awareness and leads to action that reduces risk to life and property. Riverine – Of or produced by a river. Riverine floodplains have readily identifiable channels. Special Flood Hazard Area (SFHA) – Portion of the floodplain subject to inundation by the 1-percent-annual or base flood. Stafford Act – Robert T. Stafford Disaster Relief and Emergency Assistance Act, PL 100-707, signed into law November 23, 1988; amended the Disaster Relief Act of 1974, PL 93-288. This Act constitutes the statutory authority for most federal disaster response activities especially as they pertain to FEMA and FEMA programs. Stillwater –Projected elevation that flood waters would assume, referenced to National Geodetic Vertical Datum of 1929, North American Vertical Datum of 1988, or other datum, in the absence of waves resulting from wind or seismic effects. Stream Flow Constrictions – A point where a human-made structure constricts the flow of a river or stream.

WHITE OAK BAYOU WATERSHED FLOOD RISK REPORT 43
6 Additional Resources
ASCE 7 – National design standard issued by the American Society of Civil Engineers (ASCE), Minimum Design Loads for Buildings and Other Structures, which gives current requirements for dead, live, soil, flood, wind, snow, rain, ice, and earthquake loads, and their combinations, suitable for inclusion in building codes and other documents. ASCE 24-05 – National design standard issued by the ASCE, Flood Resistant Design and Construction, which outlines the requirements for flood resistant design and construction of structures in flood hazard areas. National Flood Insurance Program (NFIP), Federal Emergency Management Agency (FEMA), www.floodsmart.gov
FEMA, www.fema.gov
ASCE, 2010. So, You Live Behind a Levee! Reston, VA.
FEMA Publications – available at www.fema.gov
FEMA, 1985. Manufactured Home Installation in Flood Hazard Areas, FEMA 85. Washington, DC, September 1985.
FEMA and the American Red Cross, 1992. Repairing Your Flooded Home, FEMA 234/ARC 4476. Washington, DC, August 1992.
FEMA, 1996. Addressing Your Community’s Flood Problems, FEMA 309. Washington, DC, June 1996.
FEMA, 1998. Homeowner’s Guide to Retrofitting, FEMA 312. Washington, DC, June 1998.
FEMA, 1999. Protecting Building Utilities from Flood Damage, FEMA 348. Washington, DC, November 1999.
FEMA, 1999. Riverine Erosion Hazard Areas Mapping Feasibility Study. Washington, DC, September 1999.
FEMA, 2003. Interim Guidance for State and Local Officials - Increased Cost of Compliance Coverage, FEMA 301. Washington, DC, September 2003.
FEMA, 2000. Above the Flood: Elevating Your Floodprone House, FEMA 347. Washington, DC, May 2000.
FEMA, 2001. Understanding Your Risks: Identifying Hazards and Estimating Losses, FEMA 386-2. Washington, DC, August 2001.
FEMA, 2002a. Getting Started: Building Support for Mitigation Planning, FEMA 386-1. Washington, DC, September 2002.
FEMA, 2002b. Integrating Manmade Hazards into Mitigation Planning, FEMA 386-7. Washington, DC, September 2002.
FEMA, 2003a. Developing the Mitigation Plan: Identifying Mitigation Actions and Implementing Strategies, FEMA 386-3. Washington, DC, April 2003.
FEMA, 2003b. Bringing the Plan to Life: Implementing the Hazard Mitigation Plan, FEMA 386-4. Washington, DC, August 2003.

WHITE OAK BAYOU WATERSHED FLOOD RISK REPORT 44
FEMA, 2004a. Design Guide for Improving School Safety in Earthquakes, Floods, and High Winds, FEMA 424. Washington, DC, January 2004.
FEMA, 2004b. Federal Guidelines for Dam Safety: Emergency Action Planning for Dam Owners, FEMA 64. Washington, DC, April 2004.
FEMA, 2005. Integrating Historic Property and Cultural Resource Considerations into Hazard Mitigation Planning, FEMA 386-6. Washington, DC, May 2005.
FEMA, 2006a. Multi-Jurisdictional Mitigation Planning, FEMA 386-8. Washington, DC, August 2006.
FEMA, 2006b. Using the Hazard Mitigation Plan to Prepare Successful Mitigation Projects, FEMA 386-9. Washington, DC, August 2008.
FEMA, 2006c. “Designing for Flood Levels Above the BFE,” Hurricane Katrina Recovery Advisory 8, Hurricane Katrina in the Gulf Coast: Building Performance Observations, Recommendations, and Technical Guidance, FEMA 549, Appendix E. Washington, DC, July 2006.
FEMA, 2007a. Property Acquisition Handbook for Local Communities, FEMA 317. Washington, DC, September 2007.
FEMA, 2007b. Public Assistance Guide, FEMA 322. Washington, DC, June 2007.
FEMA, 2007c. Using Benefit-Cost Review in Mitigation Planning, FEMA 386-5. Washington, DC, May 2007.
FEMA, 2007d. Design Guide for Improving Critical Facility Safety from Flooding and High Winds: Providing Protection to People and Buildings, FEMA 543. Washington, DC, January 2007.
FEMA, 2007e. Selecting Appropriate Mitigation Measures for Floodprone Structures, FEMA 551. Washington, DC, March 2007.
FEMA, 2007f. Design Guide for Improving Hospital Safety in Earthquakes, Floods, and High Winds: Providing Protection to People and Buildings, FEMA 577. Washington, DC, June 2007.
FEMA, 2008. Reducing Flood Losses Through the International Codes: Meeting the Requirements of the National Flood Insurance Program, FEMA 9-0372, Third Edition. Washington, DC, December 2007.
WHITE OAK BAYOU WATERSHED FLOOD RISK REPORT 45
7 Data Used to Develop Flood Risk Products
GIS Basemap information was acquired from the following sources:
Harris County Flood Control District Harris County Office of Homeland Security and Emergency Management United States Geological Survey Federal Emergency Management Agency Map Service Center United States Census Bureau ArcGIS Online
Engineering study information was leveraged from the Harris County Flood Control District. Mitigation Plans and AoMI information were acquired from the Harris County Flood Control District, the Harris County Multi-Hazard Mitigation Plan (June 2015) and the City of Houston Hazard Mitigation Plan 2012.