
FLOOD PROTECTION AND GROUNDWATER … · groundwater recharge dams were considered to be one...
16
International Conference on Drought Management Strategies in Arid and Semi-Arid Regions Muscat (Oman), 11.-14.12.2011 Ministry of Regional Municipalities and Water Resources, Sultanate of Oman Regional Centre on Urban Water Management -Tehran 1 FLOOD PROTECTION AND GROUNDWATER RECHARGE IN THE BATINAH REGİON IN OMAN Ronald Haselsteiner † ABSTRACT In the northern Batinah region of Oman flash floods, cyclones and droughts occur regularly and stroke the country frequently in the previous decades. In order to mitigate these risks and minimize the potential effects/damage of these environmental hazards flood retention and groundwater recharge dams were considered to be one efficient step towards a sustainable use of water and towards flood control. In the years 2008-10 a large number of dam locations were investigated in the North Batinah region in order to protect over ten large wadi areas against floods and create groundwater recharge assets in form of a reservoir combined with irrigation facilities. Of over 40 investigated dam sites the best were chosen and recommended for realization. For this purpose a dam selection concept was prepared which considered over ten decision aspects such as existing settlements, available reservoir volume, groundwater efficiency, costs, etc., and the aspects were weighted to account for the special technical requirements and the needs of the affected parties and the authorities. † Bronnäcker 16 70188 Stuttgart, Germany e-mail: [email protected] T 0049 (0)711 69972840 webpage: http://www.dr-haselsteiner.de M 0090 (0)172 9059 446 The author previously worked for Fichtner GmbH & Co. KG, Germany. Now he is working for EnerjiSA, an electriciy provider, in Turkey within the technical office as team leader.
Transcript of FLOOD PROTECTION AND GROUNDWATER … · groundwater recharge dams were considered to be one...

International Conference on Drought Management Strategies
in Arid and Semi-Arid Regions Muscat (Oman), 11.-14.12.2011
Ministry of Regional Municipalities and Water
Resources, Sultanate of Oman Regional Centre on Urban Water Management -Tehran
1
FLOOD PROTECTION AND GROUNDWATER RECHARGE IN THE
BATINAH REGİON IN OMAN
Ronald Haselsteiner†
ABSTRACT
In the northern Batinah region of Oman flash floods, cyclones and droughts occur regularly
and stroke the country frequently in the previous decades. In order to mitigate these risks and
minimize the potential effects/damage of these environmental hazards flood retention and
groundwater recharge dams were considered to be one efficient step towards a sustainable use
of water and towards flood control.
In the years 2008-10 a large number of dam locations were investigated in the North
Batinah region in order to protect over ten large wadi areas against floods and create
groundwater recharge assets in form of a reservoir combined with irrigation facilities. Of over
40 investigated dam sites the best were chosen and recommended for realization. For this
purpose a dam selection concept was prepared which considered over ten decision aspects
such as existing settlements, available reservoir volume, groundwater efficiency, costs, etc.,
and the aspects were weighted to account for the special technical requirements and the needs
of the affected parties and the authorities.
† Bronnäcker 16
70188 Stuttgart, Germany
e-mail: [email protected] T 0049 (0)711 69972840
webpage: http://www.dr-haselsteiner.de M 0090 (0)172 9059 446
The author previously worked for Fichtner GmbH & Co. KG, Germany. Now he is working for
EnerjiSA, an electriciy provider, in Turkey within the technical office as team leader.

Ronald Haselsteiner
2
For groundwater recharge the present geology, the applied groundwater recharge channels,
the (geo)hydraulic and hydrological constraints, land-use requirements and topographical
aspects had to be evaluated in order to be able to design the reservoirs and dams for the
optimum use of water. Since surface waters are rare, groundwater storage systems are one of
the most important effective tools against droughts in Oman. The investigated reservoirs
showed high groundwater recharge efficiencies for the case that the number of constraints
was limited and the technical facilities such as the downstream infiltration channels could be
placed where they could enfold their optimum functionality.
For economic reasons the application of two types of dams was proved to be reasonable.
On the one hand high flood retentions dams in the mountainous areas a few of several
kilometers away from the coast of the Gulf of Oman could be applied for flood retention And
secondly, groundwater recharge dams similar to the existing ones such as Wadi Hawasinah
close or within the alluvial fan at the Batinah coast can be used for a controlled release of
water and optimum water infiltration conditions in the downstream recharge channels.
1 INTRODUCTION
The Sultanate of Oman is located south of the Gulf of Oman between the Arabian Sea in
the east and the United Arabian Emirates, Saudi Arabia and Yemen in the west. The Sultanate
of Oman is an arid country which faces the corresponding problems regarding water resources
management.
During the last several decades the Arabian countries which own large fossil resources
have experienced a rapid development and these prospering civilizations’ demands also for
natural recourses quickly increased, too. In Oman a large part of the total plantations and
livestock farming is located in the Northern Batinah region at the Gulf of Oman (see figure
1).

Ronald Haselsteiner
3
Figure 1 Northern
Batinah region of the
Sultanate of Oman
The water demand is covered by groundwater withdrawal by 92% in 2008 (Khatry &
Helmi, 2008) which led to considerably decreasing groundwater levels and saltwater
intrusion. As soon as the salination reaches the groundwater wells farming and planting are
affected so that the fertilization of additional areas is required and the groundwater
withdrawal elsewhere. Against the saltwater intrusion expensive structural measures such as
long and deep slurry or cut-off walls can be applied. A reasonable optimized use of
groundwater resources consisting of groundwater recharge and flood retention is an
alternative which works against the saltwater intrusion by increasing again the groundwater
tables and, additionally is increasing the potable water resources.
30 groundwater recharge dams were constructed in Oman, e.g. Ahin or Hawasinah Dam,
and many more dams are under construction or development also in the mountainous area (Al
Hathry, 2011). Recently, Wadi Dayqah located 60 km in the southeast of the capital Muscat
was completed in 2009. The dam serves both flood protection and water supply which is
untypical for previous dam projects in Oman. Wadi Dayqah already was tested by the first
large flood in 2008 initiated by the cyclone Phet in 2010 (Al Harthy et al., 2010).
All the operated groundwater recharge dams are suffering from sedimentation of fine silts
in the reservoir which does not only decrease the available reservoir volume but also is likely
to block existing outlet structures. This aspect is discussed later in more detail.

Ronald Haselsteiner
4
Particular challenge for multi-purpose dam projects in Oman are the presence of many
colliding interests from agriculture, land tenure, water resources, settlements, and concurring
governmental authorities. All these interests have to be considered within a compromise
project finding which also have to meet economic needs.
2 PROJECT DESCRIPTION
For improving both the flood protection of existing assets and inhabitants and the storing
potable waters by groundwater recharge several wadis in the Northern Batinah region were to
be investigated. During the first steps of the feasibility study potential dam locations were
identified and evaluated in terms of several technical and economic aspects such as reservoir
volume, affected settlements, dam volume, etc. (see section 3). The referred project was one
reaction among others which were initiated by the Sultanate of Oman to answer the cyclone
Gonu and its consequences in 2007.
After the evaluation of the dam locations and the attributes for each of the concerned
wadis one or more dams were recommended to be applied in order to obtain optimal flood
protection results and groundwater recharge efficiency.
In general, the approach of placing large flood retention dams in the mountainous areas in
combination with groundwater recharge dams in the flat coastal area was considered to be
reasonable as shown in Figure 2.
Upper Dam
Recharge
Impermeable rocks
Permeable soils
SettlementsGulf
ofOman
Plantings
A
Mountainous Area
Coastal Fan
z
zz
zzz
B
C = A B+
Dam
Figure 2 Combination of upper flood retention dam and coastal recharge dams

Ronald Haselsteiner
5
The project comprised eight major wadis which could be separated in some more
independent wadi branches which made it possible to take more than one dam structure
into consideration per project wadi (see Figure 3).
As aforementioned the proposed dam works aim on releasing retained flood discharges
controlled to the downstream groundwater recharge channels.
Figure 3 Project wadis located in the Northern Batinah region of Oman (after FI, 2009a)
In the initiative studies (FI, 2008) 45 dam sites were investigated within the area of the
mentioned 8 wadi areas. From these 45 potential dam locations 16 sites were favored
after the inception reports (FI, 2008, 2009b) were completed in order to grant protection
against a 200, 500 or 1,000 year flood event. The Gonu cyclone of 2007 was considered
to show a reoccurrence period of approximately 1,000 years. Finally, in FI (2010) only
less than ten dam sites were recommended to be implemented giving priority to the most
effective projects. In Europe normal flood protection works are aimed on a safety degree
which corresponds to a reoccurrence flood period of T = 100-200 a (see for example

Ronald Haselsteiner
6
LUA BW, 2005) also in order to meet economic aspects. But in Oman the economic
effects are considered to be not dominating so that the studies were performed also for
larger reoccurrence periods.
3 DAM PRE-SELECTION CONCEPT & FLOOD PROTECTION WORKS
3.1 General
The pre-selection of the dam location in the Northern
Batinah area was performed in order to identify most
promising dam sites (FI, 2008). After the pre-selection the
selected dam sites would be studied in detail in terms of flood
protection efficiency, geology, geotechnics, structural design,
groundwater recharge, and other engineering aspects.
For each of the parameters listed below, a classification “very good”, “good”, “fair”,
“poor” or “very poor” was introduced (table 1).
3.2 Considered evaluation parameters and weighting
In total 12 parameters were considered (see
table 3). The first five aspects were weighted
strongest. After crediting according to the
rating the single parameters were weighted
applying the factors shown in table 2. Finally,
the weighted credits were summed up.
Table 3 Evaluation parameters
1. Percentage of Mountainous
Catchment
2. Potential Reservoir Storage
3. Relative Costs
4. Groundwater Recharge
5. Settlements, Land Use,
Agriculture
6. Topography
7. Foundations
8. Abutments
9. Construction Materials
10. Accessibility
11. Impact on Existing Infrastructure
12. Environmental Aspects: Effect
on Landscape, Tourism, etc.
Table 1 Classifications and
credits used for the evaluation of
the dam sites
No. Classification Credits
1 very good 2
2 good 1
3 fair 0
4 poor -1
5 very poor -2
Table 2 Geohydraulic parameters of
considered soils

Ronald Haselsteiner
7
3.3 Results of dam pre-selection works
For all the eight project wadis this procedure was applied. The final recommendations
corresponded very well to the basic considerations of flood protection and recharge dams. In
figure 4 the results for project wadi No. 7 Wadi Jahawir/Mabrah are shown (FI, 2008). The
last of the three colored columns reflect the final evaluation credit sum. For this wadi several
main wadi branches were identified so that finally the two dam sites (W7-1, W7-6) were
recommended to be followed up within the next steps of the study.
Figure 4 Recommended dam sites for project wadi No. 7 Wadi Jahawir/Mabrah (FI, 2008)
4 GROUNDWATER RECHARGE ASPECTS AND MODELING
4.1 General
Flood protection and groundwater recharge are basically no concurring aspects. In humid
countries the increase of the groundwater recharge potential increases the retained volume in
the catchment area and contributes to flood protection in this way. As soon as flash floods are
faced and precipitation contacts dry soil/underground infiltration processes are very slow and
storage is limited to negligible. For the aim of groundwater recharge the retention of flood
Ronald Haselsteiner
8
discharges and their temporary storage of water are required in order to enable a controlled
infiltration and recharge process.
Compared to the existing groundwater recharge dams which are designed for the retention
of a 10-year flood unless the spillway is activated the project aim was to retain much higher
discharges for flood protection. The reservoir volume was defined for retaining the
corresponding volume whilst the hydraulic capacity of the spillway was designed for the peak
discharge. The groundwater recharge facilities and the operation scheme were designed for a
20-year flood event.
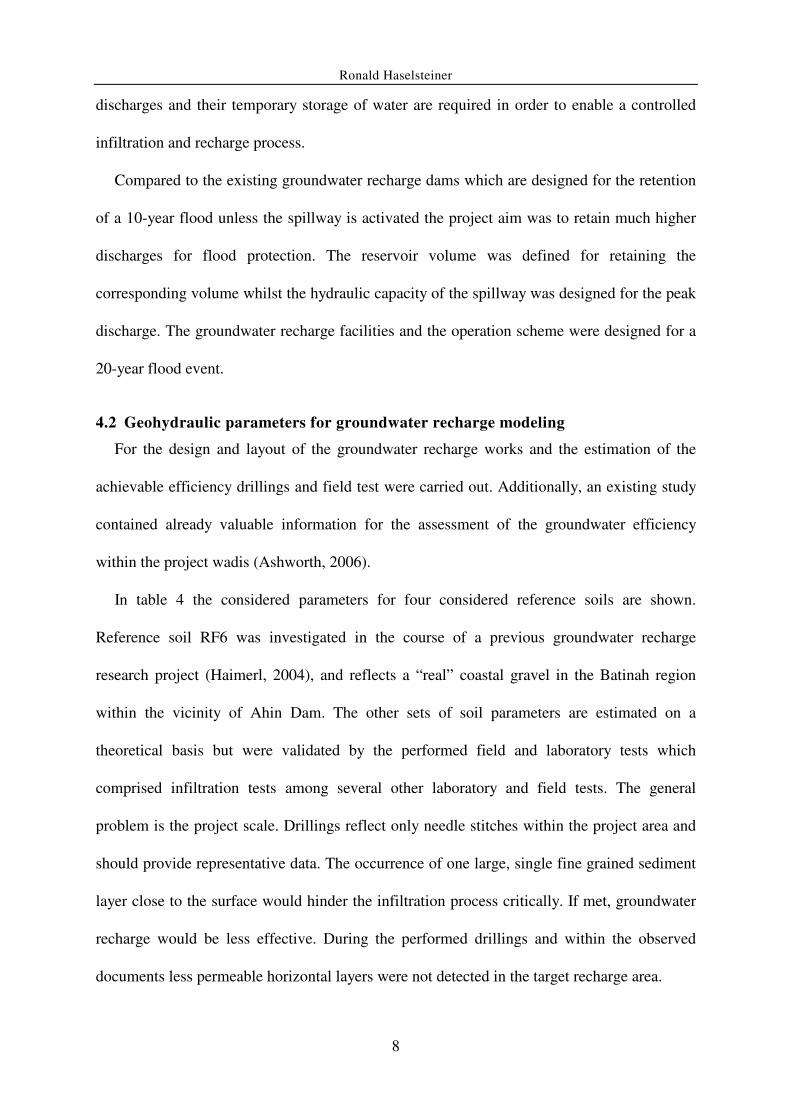
4.2 Geohydraulic parameters for groundwater recharge modeling
For the design and layout of the groundwater recharge works and the estimation of the
achievable efficiency drillings and field test were carried out. Additionally, an existing study
contained already valuable information for the assessment of the groundwater efficiency
within the project wadis (Ashworth, 2006).
In table 4 the considered parameters for four considered reference soils are shown.
Reference soil RF6 was investigated in the course of a previous groundwater recharge
research project (Haimerl, 2004), and reflects a “real” coastal gravel in the Batinah region
within the vicinity of Ahin Dam. The other sets of soil parameters are estimated on a
theoretical basis but were validated by the performed field and laboratory tests which
comprised infiltration tests among several other laboratory and field tests. The general
problem is the project scale. Drillings reflect only needle stitches within the project area and
should provide representative data. The occurrence of one large, single fine grained sediment
layer close to the surface would hinder the infiltration process critically. If met, groundwater
recharge would be less effective. During the performed drillings and within the observed
documents less permeable horizontal layers were not detected in the target recharge area.

Ronald Haselsteiner
9
For modeling the water infiltration process into soil the modeling of the unsaturated zone
is of crucial importance. The unsaturated zone is more and more dominating with decreasing
permeability but the saturated permeability ks [m/s] is the controlling key parameter.
Table 4 Geohydraulic parameters of considered soils
Sandy gravel
(RF1)
Sandy silty
gravel (RF2)
Gravelly silty
sand (RF3)
Gravel "Ahin"
(RF6)
G, s / GE G, s, u / GI, GW S, g, u / SE, SU G, s / GW
0.2 0.25 0.35
(0.15 - 0.32) (0.15 - 0.32) (0.30 - 0.38)
0.01 0.05 0.175
(< 0.03) (0.03 - 0.06) (0.15 - 0.28)
(Sr.FK
= 0.05) (Sr.FK
= 0.20) (Sr.FK
= 0.50)
0 0 0.05 0
(Sr.PWP
= 0.00) (Sr.PWP
= 0.00) (Sr.PWP
= 0.14) (Sr.PWP
= 0.00)
θa[-] 0.005 0.025 0.035 0.025
0.195 0.225 0.315 0.29
(SS = 0.975) (S
S = 0.90) (S
S = 0.90) (S
S = 1.00)
2·10-2 5·10-4 2·10-5
(1·10-0 - 1·10-3) (1·10-2 - 5·10-4) (1·10-3 - 5·10-7)
1 2 2
(2 - 30) (2 - 30) (2 - 30)
0.03 0.05 0.3
(0.03 - 0.05) (< 0.20) (0.20 - 0.40)
0.2 0.05 0.06
(0.005 - 0.035) (0.005 - 0.035) (0.005 - 0.035)
4 5 2.5
(1.5 - 10) (1.5 - 10) (1.5 - 10)
αd[1/cm] 0.15 0.04 0.03 0.15
nd
[-] 4 2.5 2.5 1
0.75 0.8 0.6 0.5
(0.26 - 1.03) (0.26 - 1.03) (0.26 - 1.03) (0.26 - 1.03)
Main
Source
Haimerl
(2004)
Class.
Porosity n [-] 0.29
Haselsteiner
(2007)
Haselsteiner
(2007)
Haselsteiner
(2007)
Natural moisture content /
f ield capacityθr.FC
[-] 0.05
Residual moisture content /
Permanent w ilting point
5
θr[-]
Air pore content (0.1 - 0.5 θr.FC)
Saturated moisture content θs[-]
0.1
Saturated conductivity ks
[m/s] 1·10-4
Anisotropy factor kh/k
v[-]
0.2
nw
[-] 1.7
Capillary height hk
[m]
Drying
Mualem parameter L [-]
van Genuchten
parameters
Wetting
αw[1/cm]
For modeling the unsaturated zone the combined van Genuchten-Mualem model was
applied which is a classical and rather simple and therefore useful mathematical formula
(figure 5; Haselsteiner, 2007; van Genuchten, 1980). Aother important aspect is also the
initial saturation conditions of the concerned infiltration areas. As soon as the soil is partially
saturated the infiltration process accelerates. For permeable gravels the initial conditions are
usually less important since the infiltration process is considered to be very rapid in any case.

Ronald Haselsteiner
10
The deceleration from saturated to partially saturated or dry soil is generally negligible for
high permeable soils.
Figure 5
Saturation –
Matric Suction
and Saturation –
Relative
Conductivity
curves for RF1,
RF2, RF3 and
RF6 soils with a
high to medium
permeability
0.0
0.1
0.2
0.3
0.4
0.5
0.6
0.7
0.8
0.9
1.0
1.0E+00 1.0E+01 1.0E+02 1.0E+03 1.0E+04 1.0E+05
Matric Suction ψm [cmWS]
Satu
ratio
n S
[-]
( )[ ]
−
ψ⋅α+
−+=
n
11n
RSR
1
SSSS
0.0
0.1
0.2
0.3
0.4
0.5
0.6
0.7
0.8
0.9
1.0
0.0 0.2 0.4 0.6 0.8 1.0
Relative Conductivity Kr [-]
2m
m
1
5,0
R S11SK
−−⋅=
Wetting
Drying
RF2
1,8
pF
2,5
pF
RF6
m = 0,20
m = 1,00
4,2
pF
RF2
RF1
RF1
RF3
RF3
RF6
In general, a conservative approach was followed for assumptions or parameters which are
characterized by a large range of variability and/or inaccuracy. The principal model which
was applied within the 2D numerical analyses of the downstream recharge channels is
outlined in figure 6.
Groundwater recharge estimation
works and science are working
usually on a larger scale looking at
regional rain distributions and
estimating the natural degree of
groundwater recharge. For this
purpose GIS application showing
general land uses and average
potential infiltration rates are applied
and/or water balance models are
sym
metr
yaxis
Groundwater table GW
Water level channel
Impermeable strata
Parameter:Permeability kSat [m/s]
Porosity n [-]Initial saturation S0 [-]Anisotropy factor A [-]Channel width WC [m]
Storage Width WST [m]Groundwater depth DGW [m]
Storage depth DST [m]Water level [m]
DG
W[m
]
DS
T[m
]
WC/2 [m]
WST [m]
z [m]
x [m]
Boundary conditions
q = 0
q =
0
line
of
seepage
p =
zG
W
q = 0p = WL
WL [m
]
Figure 6 Infiltration half 3D-model and input parameters

Ronald Haselsteiner
11
developed basing on a network of measurement data (Sharma, 1986; Scanlon, 2006; Sen &
Gieske, 2005).
For this project the project scale concerning the groundwater recharge target area is smaller
reaching hardy 5 km x 10 km for a single project. Of course, the target area is located within
the coastal gravel plains which show both a high permeability which supports the infiltration
process and a high effective porosity which enables the infiltrated water to be stored.
The general approach was to use a 2D numerical model in order to investigate the
fundamental infiltration process and subsequently define an average infiltration rate I [m/d]
value as input parameter for the 1D groundwater recharge model. The results (figure 7) show
the infiltration rate I [m/d] vs. the water pressure [cm] within the recharge channel for soils
with a vertical saturated permeability ks = 10-2
, 10-3
and 10-4
m/s. Selected system parameters
were varied which resulted in the illustrated shaded ranges. The water pressure or head in the
infiltration channels showed only minor sensitivity on the results. Most critical is the absolute
permeability. The channel width is also of a certain influence.
k = 10-4 m/s
k = 10-3 m/s
k = 10-2 m/s
I = 4 m/d
Water pressure [cm]
Figure 7 Resulting infiltration rates derived from 2D numerical modeling using varying model
parameters
Ronald Haselsteiner
12
The groundwater recharge model itself is a combination of a reservoir model considering
the reservoir volume, the water level, the evaporation, the outlet operation, etc. and the
downstream channel hydraulics. The downstream wadis generally show a strong inclination
of 0.8-1.0% and a certain width. The definition of the decisive parameters such as average
length, width and roughness were done on basis of cartographical data and site observations.
The aim was to achieve high groundwater recharge efficiency by using existing wadi
channels. Only in selected cases complete artificial downstream channels should have been
applied in order to reduce the losses to the sea. Usually the existing wadi channels were
connected to the reservoir via outlet tower which was fit with several outlet openings at
different heights. The reservoirs had to be emptied within 14 days which led to implementing
the constraint of maximum 5 % of the retained water volume should remain in the reservoir
after 14 days.
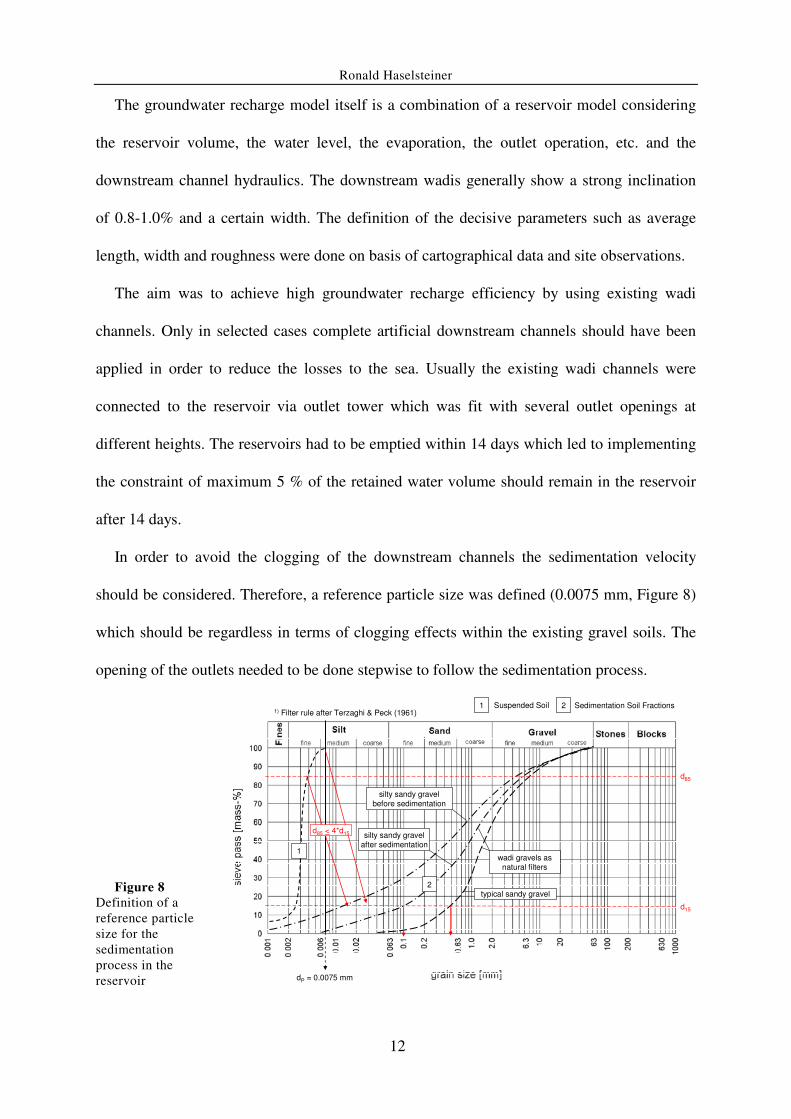
In order to avoid the clogging of the downstream channels the sedimentation velocity
should be considered. Therefore, a reference particle size was defined (0.0075 mm, Figure 8)
which should be regardless in terms of clogging effects within the existing gravel soils. The
opening of the outlets needed to be done stepwise to follow the sedimentation process.
Figure 8
Definition of a
reference particle
size for the
sedimentation
process in the
reservoir
typical sandy gravel
d85
d15
silty sandy gravelbefore sedimentation
silty sandy gravelafter sedimentation
wadi gravels asnatural filters
1) Filter rule after Terzaghi & Peck (1961)
d85 < 4*d15
1
2
1 2 Sedimentation Soil FractionsSuspended Soil
dP = 0.0075 mm

Ronald Haselsteiner
13
The operation works were optimized for the defined recharge flood volume with a
reoccurrence period of T = 10-20 a. Larger floods will activate the spillway and water will be
lost to the sea, and, additionally, sedimentation in the downstream area will occur. The
operation strategy is illustrated in figure 9. As soon as the flood is retained in the reservoir the
outlets stay close until the first lamella between the reservoir level and the first outlet pipes
are free of grain particles larger than the sediment design grain particle.
Figure 9 Operation
strategy for flood
control/retention and
groundwater recharge time
Dis
charg
e[m
³/s]
Reserv
oir W
ate
r Level [m
]
Reservoir
Full
• Controll necessary
CRes > VFlood
FLOOD
PROTECTION
MODE
tsink
14d1
23
tsink tsink
GROUNDWATER RECHARGE
MODE
The same procedure is repeated for all the outlets. The number, diameter and elevations of
outlet pipes and the corresponding towers are subject to an optimization process and some
natural constrains such as the number of existing natural downstream wadi channels.
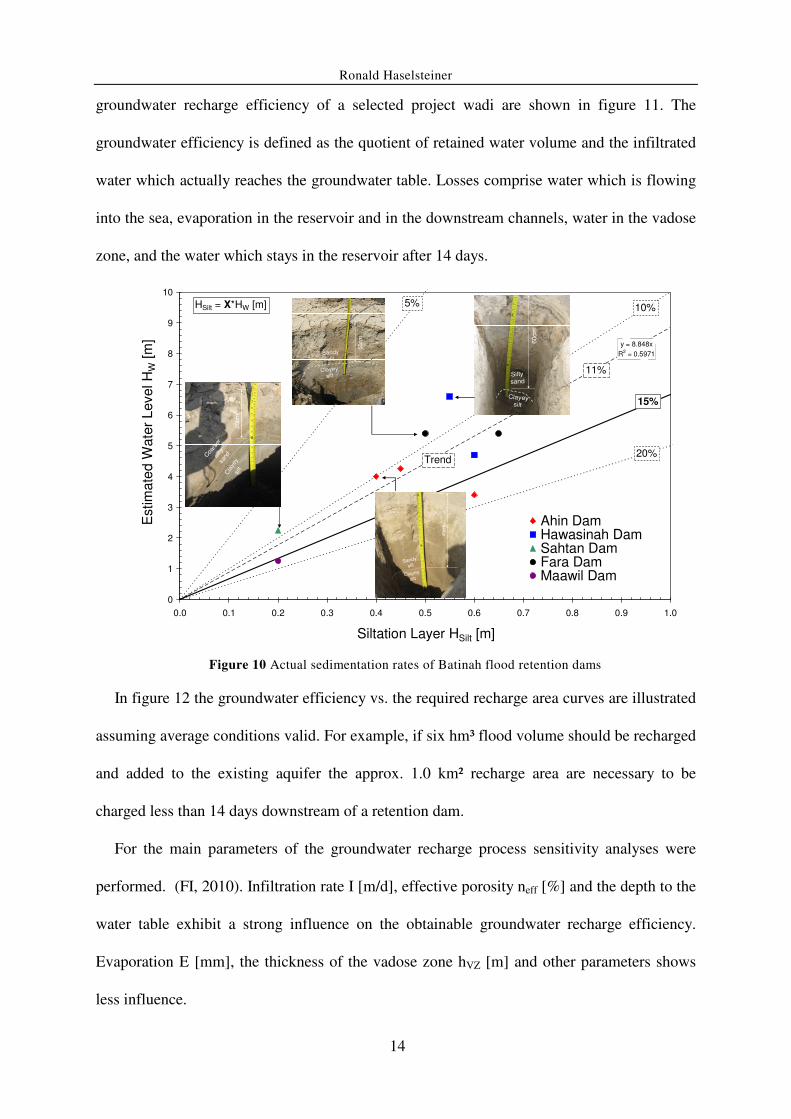
Within the field works in the Batinah area existing dams were visited and the sediment
load was estimated by trying to find a relation between the latest sediment layer and
maximum reservoir height. As shown in figure 10 approximately 11% of the maximum water
level in the reservoir remained as sediment layer in the reservoir. The number of considered
dams was only five and at some other dams a clear relation could not be agreed on. Further
investigation could be helpful.
4.3 Results and groundwater efficiency
The outlet works are simple pipes which work by natural water pressure. The time
dependent discharge of the outlet pipes, in- and output parameter and the obtained
Ronald Haselsteiner
14
groundwater recharge efficiency of a selected project wadi are shown in figure 11. The
groundwater efficiency is defined as the quotient of retained water volume and the infiltrated
water which actually reaches the groundwater table. Losses comprise water which is flowing
into the sea, evaporation in the reservoir and in the downstream channels, water in the vadose
zone, and the water which stays in the reservoir after 14 days.
y = 8.848x
R2 = 0.5971
0
1
2
3
4
5
6
7
8
9
10
0.0 0.1 0.2 0.3 0.4 0.5 0.6 0.7 0.8 0.9 1.0
Siltation Layer HSilt [m]
Estim
ate
d W
ate
r L
evel H
W [
m]
Ahin DamHawasinah DamSahtan DamFara DamMaawil Dam
HSilt = X*HW [m]
50cm
Clayey
silt
Sandy
silt
20%
5%
20cm
Cla
yey
silt
Coa
rser
silty
sand
45cm
Clayey
silt
Sandy
silt
10%
Trend
11%
15%
60cm
Clayeysilt
Silty
sand
Figure 10 Actual sedimentation rates of Batinah flood retention dams
In figure 12 the groundwater efficiency vs. the required recharge area curves are illustrated
assuming average conditions valid. For example, if six hm³ flood volume should be recharged
and added to the existing aquifer the approx. 1.0 km² recharge area are necessary to be
charged less than 14 days downstream of a retention dam.
For the main parameters of the groundwater recharge process sensitivity analyses were
performed. (FI, 2010). Infiltration rate I [m/d], effective porosity neff [%] and the depth to the
water table exhibit a strong influence on the obtainable groundwater recharge efficiency.
Evaporation E [mm], the thickness of the vadose zone hVZ [m] and other parameters shows
less influence.

Ronald Haselsteiner
15
Groundwater Recharge by Dams & Channels
1 Reservoir Characteristics / Dam Volume & LengthVRes. = 12720000 [m³] Press button Control: 10.00 Input constant for all Wadis
WL = 13.70 [m] ∆V Sea losses! 10.00 Input varied for each Wadi
LD = 8700 [m] 10.00 Calculated or derived values
Lres. = 1369.98 [m]
ISlope = 0.01 [-]
2 Outlet Characteristics / Operation Tab. 01: Outlet FacilitiesNout = 6 [-] Level-No. 1 2 3 4 5 6 Σ
Nout,T = 2 [-] Outlets 2 2 2 0 0 0 6
Dvert,Out = 4.57 [m] Level Height [m] 9.1 4.6 0.0 0.0 0.0 0.0
NLevel = 3 [-] (1 to 6)
a = 1.20 [m] (0.1m to 1.2m)
Tempty = 14.00 [a] Vout = 12.59 [Mm³] 99% (min: 95% )
Qmax,Ch = 12.71 [m³/s] T95% = 11.49 [d]
3 Downstream Channels 4 Recharge & Infiltration Parameter 5 Losses & RechargeNchannel = 2 [-] I = 4.00 [m/d] RestRes. 0%
Wchannel = 100.00 [m] EP = 7.00 [mm/d] EPDS 1%
kSt = 35.00 [m1/3
/s] hVZ = 0.60 [m] Sea 29%
LChannel = 7900.00 [m] neff = 0.20 [-] EPRes. 1% Σ
Arecharge = 1.58 [km²] DGW = 15.00 [m] Vadose 2% 33% (corr.)
WGW,Width = 185 [m] Recharge 67% 100%
Figure 01: Discharge outlet
Figure 02: Recharge in downstream channel(s) Figure 03: Results for Recharge and Losses
Wadi Bani Umar B
Evaporation rate
Number of Outlets
average recharge depth
Outflow volume after 14 days
Accumulative Recharge Area
max Discharge per Channel Period for 95% outflow
Average Channel Width
Roughness Wadi/Channel bed
Average GW Channel Width
Number of Outlets per Tower
Reservoir/Flood Volume
Required Water Level
Dam Length
Length of Channels
Slope inclination
Number of Channels
Outlet size (a = b)
Reservoir emptying time
Infiltration rate
Reservoir Length
Vadose zone
effective porosity
Number of Towers
Vertical Distance
25.42
0.0
5.0
10.0
15.0
20.0
25.0
30.0
0 1 2 3 4 5 6 7 8 9 10 11 12 13 14
Time [d]
Dis
ch
arg
e [m
³/s]
0.0
2.0
4.0
6.0
8.0
10.0
12.0
14.0
Re
serv
oir
Vo
lum
e [M
m³]
Outflow
Outlet 1
Outlet 2
Outlet 3
Outlet 4
Outlet 5
Outlet 6
Reservoir Volume
Recharge Volume
67%
Evaporation
Downstream
1%
Rest in Reservoir
0%
Evaporation in
Reservoir
1%
Lost Volume in
Vadose Zone
2%
Losses to Sea
29%
Evaporation in Reservoir Rest in Reservoir
Evaporation Downstream Lost Volume in Vadose Zone
Recharge Volume Losses to Sea
Calculate!
0.0%
12.5%
25.0%
37.5%
50.0%
790 1580 2370 3160 3950 4740 5530 6320 7110 7900
Distance [m]
Re
lativ
e R
echa
rge p
er
Sectio
n [
-]
0%
25%
50%
75%
100%
Vo
lum
e R
ech
arg
e P
erc
en
tage
[-]
Relative Recharge
V Recharge
DownstreamHydrographs
and Reservoir Water Level
(Diagram)
Results(Diagram)
Rechargewithin
downstream
channels(Diagram)
Start button
Input 1:Reservoir
Input 2:Outlet facilities
Input 3:Downstream
channels
Input 4:Recharge &
infiltrationbehaviour
Results:Recharge &losses(table)
Results:Outlet facilities &reservoir
Figure 11 Input & output data of the groundwater recharge model
0.5 1.0 2.0 5.0 6.0 10 20
Figure 12 Recharge area vs. recharge efficiency for different recharge volumes assuming average
conditions

Ronald Haselsteiner
16
REFERENCES
Al Harthy, S. H.; Hieatt, M. J.; Hall, J. K.; Wheeler, M. 2010. The day Wadi Dayqah roared.
International Water Power & Dam Construction, December 2010, pp. 40-43.
Ashworth, J. M. 2006. Drilling and Aquifer Testing Project in the Northern Batinah on behalf
of Geo-Resources Consultancy for the Ministry of Regional Municipalities, Environment
and Water Resources, Oman.
FI 2008. Flood Protection and Groundwater Recharge Dams in the Northern Batinah Region.
Inception Reports for the Projects 209 & 210, Ministry of Regional Municipalities and
Water Resources, Sultanate of Oman, Fichtner GmbH, Muscat 2008.
FI 2009a. Flood Protection and Groundwater Recharge Dams in the Northern Batinah Region.
Interims Project Presentation, Sultanate of Oman, Fichtner GmbH, Muscat 2009.
FI 2009b. Flood Protection and Recharge Dams in the Northers Batinah Region. Inception
Supplementary Report, Sultanate of Oman, Fichtner GmbH, Muscat 2009.
FI 2010. Flood Protection and Groundwater Recharge Dams in the Northern Batinah Region.
Feasibility Studies for the Projects 209 & 210, Ministry of Regional Municipalities and
Water Resources, Sultanate of Oman, Fichtner GmbH, Muscat 2010.
Haimerl, G. 2004. Groundwater Recharge in Wadi Channels Downstream of Dams -
Efficiency and Management Strategies. Phd thesis. Lehrstuhl und Versuchsanstalt für
Wasserbau und Wasserwirtschaft der Technischen Universität München. München,
Bericht Nr. 99.
Haselsteiner, R. 2007. Hochwasserschutzdeiche an Fließgewässern und ihre Durchsickerung.
Phd thesis. Lehrstuhl und Versuchsanstalt für Wasserbau und Wasserwirtschaft der
Technischen Universität München. München, Bericht Nr. 111.
Kathry, A. M. A. and T. Helmi. 2008. The effect of Gonu Cyclone on Recharging
Groundwater Aquifers – Sultanate of Oman. The first International Conference on Water
Resources and Climate Change in the MENA Region. Conference Proceed-ings. Ministry
of Regional Municipalities and Water Resources (MEMWR). Muscat 2008.
Leap, I. D. 2007. The Handbook of Groundwater Engineering. Ed. Jacques W. Delleur.
Taylor & Francis Group. Florida.
LUA BW 2005. Festlegung des Bemessungshochwassers für Anlagen des technischen
Hochwasserschutzes. Landesanstalt für Umweltschutz Baden-Württemberg (LUA BW),
Oberirdische Gewässer, Gewässerökologie, Heft 92.
MRMWR 1998. Dams in the Sultanate of Oman. Ministry of Regional Municipalities and
Water Resources, Sultanate of Oman.
Scanlon, B. R., K. E. Keese, A. L. Flint, L. E. Flint, C. B. Gaye, W. M. Edmunds, I. Simmers
2006. Global synthesis of groundwater recharge in semiarid and aid regions.
Hydrological Processes, Vol. 20, pp. 3335-3370.
Sen, P. K. and A. Gieske 2005. Use of GIS and remote sensing in identifying recharge zones
in an arid catchment: a case study of Roxo River basin, Portugal. Journal of Nepal
Geological Society, Vol. 31. Pp. 25-32.
Sharma, M. L. 1986. Measurement and Prediciton of Natural Groundwater Recharge – An
Overview. Journal of Hydrology (N.Z.), Vol. 25, No. 1, pp. 49-56.
Shaw, Q. H. W. 2010. N new understanding of the early behaviour of roller compacted
concrete in large dams. PhD-Thesis, Faculty of Engineering, Built Environment and
Information Technology, University of Pretoria, South Africa.
UNEP 1992 World Atlas of Desertification. E. Arnold. London.
van Genuchten, M. Th. 1980. A Closed-form Equation for Predicting the Hydraulic
Conductivity of Unsaturated Soils. Soil Sci. Soc. Am. J., Vol. 44, pp. 892 – 898.