
Flood Disturbance and the Distribution of Riparian Species ...
17
D Flood Disturbance and the Distribution of Riparian Species Diversity STOR ® Jacob Bendix Geographical Review, Vol. 87, No. 4 (Oct., 1997), 468-483. Stable URL: http://links.jstor.org/sici?sici=0016-7428%28199710%2987%3A4%3C468%3AFDATD0%3E2.0.C0%3B2-I Geographical Review is currently published by American Geographical Society. Your use of the JSTOR archive indicates your acceptance of JSTOR' s Terms and Conditions of Use, available at http://www.jstor.org/about/terms.html. JSTOR's Terms and Conditions of Use provides, in part, that unless you have obtained prior permission, you may not download an entire issue of a journal or multiple copies of articles, and you may use content in the JSTOR archive only for your personal, non-commercial use. Please contact the publisher regarding any further use of this work. Publisher contact information may be obtained at http://www.jstor.org/joumals/ags.html. Each copy of any part of a JSTOR transmission must contain the same copyright notice that appears on the screen or printed page of such transmission. JSTOR is an independent not-for-profit organization dedicated to creating and preserving a digital archive of scholarly journals. For more information regarding JSTOR, please contact [email protected]. http://www.jstor.org/ Wed Dec 1 16: 18:54 2004
Transcript of Flood Disturbance and the Distribution of Riparian Species ...
DFlood Disturbance and the Distribution of Riparian Species Diversity STOR reg
Jacob Bendix
Geographical Review Vol 87 No 4 (Oct 1997) 468-483
Stable URL httplinksjstororgsicisici=0016-74282819971029873A43C4683AFDATD03E20C03B2-I
Geographical Review is currently published by American Geographical Society
Your use of the JSTOR archive indicates your acceptance of JSTOR s Terms and Conditions of Use available at httpwwwjstororgabouttermshtml JSTORs Terms and Conditions of Use provides in part that unless you
have obtained prior permission you may not download an entire issue of a journal or multiple copies of articles and you may use content in the JSTOR archive only for your personal non-commercial use
Please contact the publisher regarding any further use of this work Publisher contact information may be obtained at httpwwwjstororgjoumalsagshtml
Each copy of any part of a JSTOR transmission must contain the same copyright notice that appears on the screen or printed page of such transmission
JSTOR is an independent not-for-profit organization dedicated to creating and preserving a digital archive of scholarly journals For more information regarding JSTOR please contact supportjstororg
httpwwwjstororg Wed Dec 1 16 1854 2004
FLOOD DISTURBANCE AND THE DISTRIBUTION OF RIPARIAN SPECIES DIVERSITY
JACOB BENDIX
ABSTRACT Biodiversity varies considerably in Southern Californian riparian vegetation The intermediate disturbance hypothesis posits greatest diversity in settings that are subject to moderate-intensity disturbance Flood intensity tends to vary systematically in watershysheds potentially imposing patterns of biodiversity In two study watersheds species richshyness increases with flood severity Diversity or heterogeneity is less predictable Biodiversity patterns in these watersheds are complicated by atypical patterns offlood severity Although riparian diversity may be intimately dependent on flood disturbance the relationship is preshydictable only with due attention to the physiographic details of individual stream networks Keywords biodiversity floods riparian vegetation stream power
ltJn recent years concern has increased for biodiversity and for land-management policies and techniques that favor the preservation of species diversity (Ehrlich and Wilson 1991 Franklin 1993 Nilsson Jansson and Zinko 1997) Riparian environshyments are important to biodiversity at two scales Their presence contributes to reshygional biodiversity and they are notable for their internal diversity as well (Malanson 1993 Naiman Decamps and Pollock1993)The potential influence ofhydrologic disshyturbance on the spatial distribution of riparian species diversity is presented in an empirical example from the Transverse Ranges of Southern California
Theories concerning the spatial occurrence of plant species diversity often emshyphasize the role ofdisturbance regimes ( Grubb 1977 Petraitis Latham and Niesenshybaum 1989 Malanson and Butler 1990 Hobbs and Huenneke 1992) If disturbance does affect diversity it ought to be evident in riparian environments because they are particularly vulnerable to disturbance Most-by some definitions all-riparian zones witness periodic flooding and floods are agents of disturbance
The most prominent theory relating disturbance to species diversity is the intershymediate disturbance hypothesis which predicts maximum diversity in environshyments that experience moderate disturbance (Loucks 1970 Connell 1978 Petraitis Latham and Niesenbaum 1989) Moderate may refer either to disturbance magnishytude or to disturbance frequency this discussion concentrates on magnitude or seshyverity According to this theory intermediate-magnitude disturbance removes only a subset ofthe preexisting vegetation thus making only a portion ofthe affected area available for colonization Diversity is enhanced by the combination ofdisturbance survivors and the newly arrived disturbance exploiters (Figure 1) Partial alteration ofsites by intermediate-magnitude disturbances may also create new microhabitats that in turn are occupied by diverse species (Hughes 1990 Savage Reid and Veblen
bull I thank Mike Kirchoff for assistance in preparation of the figures and three anonymous reviewers for their comments on an initial draft of the manuscript
frac34 DR BENDIX is an assistant professor of geography at Syracuse University Syracuse New York 13244-1020
The Geographical Review 87 (4) 468-483 October 1997 Copyright copy 1997 by the American Geographical Society of New York
FLOOD MAGNITUDES POST-FLOOD VEGETATION
RIPARIAN SPECIES DIVERSITY
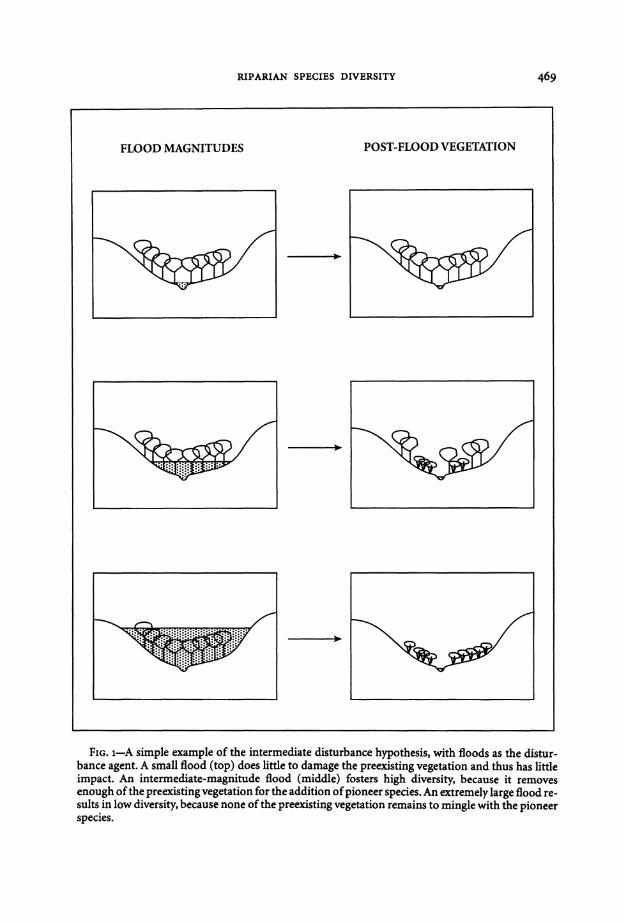
Fm 1-A simple example of the intermediate disturbance hypothesis with floods as the disturshybance agent A small flood (top) does little to damage the preexisting vegetation and thus has little impact An intermediate-magnitude flood (middle) fosters high diversity because it removes enough ofthe preexisting vegetation for the addition ofpioneer species An extremely large flood reshysults in low diversity because none of the preexisting vegetation remains to mingle with the pioneer species
470 THE GEOGRAPHICAL REVIEW
1992) Magnitude may refer to either the areal extent of disturbance or its severity (Malanson 1984) in a fluvial setting area and severity are likely to covary for both the area inundated and the energy of flow increase as discharge increases (Dunne and Leopold 1978)
In riparian settings flooding is a significant form of disturbance A floods deshystructive impact may be felt in several ways through the imposition of anaerobic conditions by inundation through the mechanical breakage of plants by floodwashyters andor the sediment they carry or through erosion ofthe substrate in which the plants are rooted (Hupp 1988 Malanson 1993 Bendix in press) These impacts make floods a major element ofdisturbance in most riparian environments and the domishynant one in many (White 1979 Bendix 1994a Decamps and Tabacchi 1994) Apart from the direct impact on vegetation alteration of site conditions is particularly significant at flood-affected sites where colonization by new species is further facilishytated by the deposition of fresh alluvial substrate
Because of the demonstrable importance of flood disturbance studies that test the applicability of the intermediate disturbance hypothesis to riparian vegetation emphasize the distribution offlood magnitude either as part ofa presumed systemshyatic downstream gradient ofdisturbance (Nilsson and others 1988 1989) or as a varishyable across multiple watersheds (Baker 1990b ) Results to date have been ambiguous and complicated by differences in scale and methodology The possible impacts of flooding on species diversity remain intriguing because floods may impose a disshytinct spatial pattern on the distribution of species diversity
DISTRIBUTION OF FLOOD IMPACTS
The systematic variation of hydrologic variables within watersheds has been quantified in a number of studies beginning with early research on hydraulic geshyometry (summarized in Leopold Wolman and Miller 1964) The net result of these hydrologic patterns is that severity of flooding often varies systematically as one moves downstream through a watershed The most basic pattern is
Q ocA (1)
where Q is discharge (volume of water per time) and A is drainage area Because drainage area increases downstream discharge in most streams also increases with distance downstream This common trend suggests that the disruptive force of floods should also increase as they move down through a watershed But the actual impact of floods depends not so much on the amount ofwater as on the energy exshyerted by it which is only partly determined by discharge
Unit stream power the actual energy per unit area exerted against the valley floor has proved useful in determining both the geomorphic and ecological impacts of floods (Baker and Costa 1987 Bendix 1994a) It is determined by the equation
ro = yDSv (2)
where ro is unit stream power in watts per square meter y is the specific weight of the water-sediment mixture in newtons per cubic meter Dis the average depth offlow in
471 RIPARIAN SPECIES DIVERSITY
meters Sis slope (dimensionless) and vis velocity in meters per second Because y is unlikely to vary significantly along a stream course this equation indicates that unit stream power will change in a downstream direction as a function of the downshystream variation of depth slope and velocity
Downstream change in these variables is fundamental to hydraulic geometry which refers to the geometric rate of change ofhydraulic variables as discharge ( Q) increases These variables can be represented by the following equations (Leopold and Maddock 1953 Leopold and Miller 1956)
D = cQ (3)
S = tQZ (4) V = kQm (5)
Coefficients c t and k and exponentsf z and m can be determined empirically for any given stream When applied to discharge figures for a given recurrence intershyval discharge equations 3-5 describe how the hydraulic parameters react to the downstream changes in discharge The regular geometric changes in these variables suggest that there may be systematic patterns in the impacts of a given flood as it moves through a watershed (given equation 1we should be able to substitute A for Q in these equations)
William Graf provided an example ofsuch a pattern in the Henry Mountains of Utah modeling changing values of stream power (Graf 1983) Such patterns are complex for they may depend on a relationship between valley morphology and the magnitude of the flood in question (Magilligan 1992) and they may even change with erosional modifications of the valley bottom (Graf 1983) It should be noted that the downstream change will not necessarily involve an increase in stream power Luna Leopold M Gordon Wolman and John Miller reported average values of 30-95 and 20 forf z and m respectively for ephemeral streams in the western United States (1964) The negative value for z suggests that decreasing slope may offset the increases in depth and velocity as the flood moves downstream In fact Graffound that within a given watershed the pattern ofstream power fluctuated beshytween positive and negative downstream trends with historical changes in stream morphology (1983)
IMPLI CA TIONS FOR BIOTIC DIVERSITY
For all their potential complexity the patterns offlood severity suggest that if riparshyian species diversity varies with flooding it should also vary systematically through the watershed Ifwe assume a gradient from minimal disturbance-due to small disshycharges-at a streams headwaters to maximum disturbance at its mouth-the highshyest discharges-then the intermediate magnitude of disturbance and hence the highest diversity values should be found in the middle reaches ofthe stream (Figure 2a) Christer Nilsson and his coauthors addressed this possibility with equivocal reshysults In studies ofSwedish rivers species richness was measured at regularly spaced reaches and regressed on distance downstream No relationship appeared in their
(a)
DISTURBANCE
A B C
DRAINAGE AREA
(b)
X
472 THE GEOGRAPHICAL REVIEW
FIG 2-Application ofthe intermediate disturbance hypothesis to a watershed setting See the text for references to (a) and (b)
473 RIPARIAN SPECIES DIVERSITY
overall data butwhen they limited their analysis to native species richness peaked in the middle reaches (Nilsson and others 1988 1989) It remains unclear whether this reflects an intermediate level of disturbance The relationship was not matched by flu vial variables that indicate flood severity and a decreased richness ofnatural speshycies in lower reaches may have been caused by more human presence there favoring weedy species
Although it is tempting to assume that the intermediate disturbance hypothesis locates maximum diversity in a streams middle reaches (Vannote and others 1980) actual patterns observed depend largely on the scale and location of the stream segshyments studied (Meentemeyer 1989 Bendix 1994b) For the intermediate disturbance hypothesis intermediate refers to potential ecological impacts not to potential flood magnitudes A4C in Figure 2a may not coincide with X4Y in Figure 2b In some small streams for example even the largest floods are insufficient to generate more than intermediate disturbance of the vegetation (there X4Y would coincide with A4B) For such a stream the location of ecological intermediate disturbance-and maximum diversity-may be expected downstream In streams where even the uppershymost reaches experience floods severe enough to create an intermediate disturbance X4Y will coincide with B4C with diversity decreasing downstream Thus if the inshytermediate disturbance hypothesis does hold true in fluvial settings itmay result in eishyther a near-linear (positive or negative reflecting A4B or B4C) or a quadratic relationship (A4C) between species diversity and location within the watershed all depending on the relationship between flood magnitudes and ecological sensitivity
Figure 2 remains based on an assumption that discharge-which varies most reshyliably with drainage area and watershed position-equates to potential disturbance Disturbance is however actually quite dependent on variation in the hydraulic components of stream power Any prediction of where intermediate disturbance and maximum diversity would be found in a watershed has to be mediated by unshyderstanding its hydraulic geometry and the resulting distribution ofstream power
Apart from studies by Nilsson and his associates the ties between hydrologic trends and patterns of riparian biodiversity have received little attention Studies have related riparian diversity to positions within the drainage network including Cliff Hupp in Virginia (1982) Eric Tabacchi Anne-Marie Planty-Tabacchi and Odile Decamps in France (1990) and R Carbiener and A Schnitzler in the valley of the Rhine (1990) Each placed greater emphasis on geologic controls in fluvial morshyphology than on overall patterns in a drainage network William Baker did examine riparian species richness in Colorado in relation to the intermediate disturbance hyshypothesis but on a regional rather than watershed scale (Baker 1990b)
As the foregoing discussion indicates our understanding ofpatterns in riparian diversity may be substantially enhanced by drawing on the explicitly spatial eleshyments of fluvial geomorphology Testing these links the remainder of this article uses the example of two watersheds in Southern California to address the relationshyship between hydrogeomorphic disturbance and riparian diversity Specifically I explore whether the alpha-scale-within-site-diversity of woody riparian vegeta-
474 THE GEOGRAPHICAL REVIEW
Piru and Sespe Creeks Southern California
i ~~~ North
FIG 3-The study area Piru and Sespe Creeks in Southern California The dark circles represent sampling sites
tion changes systematically through the watersheds and whether the distribution of that diversity can be related to variation in flood intensity
STUDY AREA
The data are drawn from two watersheds that drain the western Transverse Ranges of California Sespe and Piru Creeks (Figure 3) The Transverse Ranges are domishynated by a complex series of generally eastward-trending structural folds intershysected by numerous compressional and strike-slip faults both parallel to and across the fold axes (Bailey and Jahns 1954)The lithology ofthe region is also complex The watersheds drain areas of Cretaceous and Tertiary sedimentary units in some loshycales in others they intersect a granitic and gneissic basement complex (Merrill 1954) The extensive deformation of the bedrock in these mountains is of some fluvial significance because it results in several localized valley reaches where bedshyrock is exposed at the channel floor Valley bottoms in these watersheds vary from quite narrow (less than 15 meters) to broad (more than 100 meters) Although most have at least modest alluvial floodplains at some sites bedrock control imposes steep stream gradients resulting in high-energy floods
The area has a Mediterranean climate with dry summers and cool wet winters Most streams in the area have negligible to nonexistent discharges in summer but
475 RIPARIAN SPECIES DIVERSITY
may be subject to large floods during frontal storms in winter or early spring when high-intensity long-duration precipitation is dropped on steep slopes with shallow soils (Raphael and others 1995)
Riparian vegetation here is dominated by Fremont cottonwood (Populus freshymontii) white alder (Alnus rhombifolia) seep-willow (Baccharis glutinosa) and sevshyeral willow species (Salix) (Bendix 1994c1) These are often joined on the floodplain and terraces by chaparral species such as chamise (Adenostoma fasciculatum) from the surrounding hillslopes
These watersheds are unusual in the western United States for their absence ofgrazshying impacts Sespe Creek has been virtually immune to grazing pressure due to limited accessibility and the absence of substantial forage (Borchert 1990) and large portions ofthe Piru watershed have experienced such light grazing-at least in recent decades-shythat no measurable impacts on the vegetation can be discerned (Bendix 1994b)
METHODS
An earlier study ofriparian species-environment relationships (Bendix 1994a) proshyvided data onvegetation and hydro logic variables The vegetation data are from lineshyintercept sampling ofwoody species conducted at cross-valley transects at thirty-six sites along the main stream in each watershed (Canfield 1941 Greig-Smith 1983) This sampling strategy provided data not only for the number ofspecies present but also linear cover values-readily converted to importance values-amenable to the calculation of measures of diversity The limitation to woody species reduced any sensitivity ofthe data to the season ofdata collection and to inter- and intra-annual variability of a climatically sensitive herbaceous cover
The calculation of species diversity is complicated somewhat by the multiple definitions ofdiversity some ofwhich are at substantial variance (Peet 1974 provides a good review of these) The two most common approaches to diversity determine either the number of species-richness-present in a sample controlling for either the sample area or the number of individuals in it or heterogeneity of the sample which incorporates both the number of species and the evenness of their represenshytation in the sample This analysis employs two measures the most commonly used formulations for each of these approaches
The simpler of these is richness which requires no equation it is typically a count of the number of species per unit area of sample-except that here the lineshyintercept data require the substitution of unit length for unit area The other meashysure representing heterogeneity is the Shannon-Weaver diversity index (H)
H = -IpiLogpi (6)
in which Pi is the importance value or proportion of the sample-relative cover in this case-belonging to the ith species All subsequent uses here of richness refer to species per meter H is referred to as SW diversity
Estimates for the hydraulic variables and for the average values of unit stream power at each site were calculated from cross-sectional surveys conducted at the
476 THE GEOGRAPHICAL REVIEW
same time as the vegetation surveys from topographic maps and from output ofthe HEC-2 computer program Details of these calculations have been published elseshywhere (Bendix 199~)
Relationships among variables are determined by examination ofbivariate plots and the use of ordinary least-squares regression (Griffith and Amrhein 1991) Reshysults from the latter should be interpreted cautiously however given the small samshyple sizes involved (seventeen sites in Piru Creek and nineteen in Sespe Creek) The small number of observations makes these equations particularly sensitive to the influence ofoutliers As a result I omitted one site that had been used in other studshyies (Bendix 199~ 1994b) because it had only one species the resulting zero value for diversity exerted an undue influence on the regressions
RESULTS AND DISCUSSION
The seventeen sites analyzed in Piru Creek varied in cross-section size from 32 meters to 124 meters and in the number ofspecies present from two to eight In the nineteen Sespe Creek sites cross-sections ranged from 20 meters to 124 meters and the number ofspecies from four to nine Overall twenty-eight species were includedAlshythough these species numbers are low relative to those in many diversity studies (Ricklefs and Schluter 1993) they are comparable to those encountered for woody species diversity in other riparian studies (Baker 1990b)
When related to drainage area-the measure ofposition in the watershed-richshyness and SW diversity show very different patterns in the two creeks (Figure 4) There is disparity not only between the watersheds but also in the distribution of richness as compared with SW diversity1 Richness and SW diversity both increase downstream in the Piru watershed whereas in Sespe richness actually decreases downstream although in that watershed the trends for both richness and SW divershysity are weak and statistically nonsignificant
The difference between the patterns in the two watersheds can largely be exshyplained by examination of hydrologic conditions The assumption of systematic variation in flood impacts is based on equations 3-5 Those equations however were developed to describe channel conditions in alluvial rivers where running washyter can reshape channel dimensions with relative ease Piru and Sespe Creeks have many reaches where they flow directly atop bedrock along such reaches the channel is immune to short-term adjustments in slope Equation 2 suggests that if slope does not vary according to expectation neither will stream power
That suggestion is confirmed in this case Unit stream power is clearly highly sensitive to slope in both watersheds (Figure 5 top) But the distribution of slope (Figure 5 middle) confounds the expectations from average hydraulic geometry values as slope actually increases downstream in Piru Creek and varies almost ranshydomly through Sespe Creek As slope increases in concert with depth and velocity in the Piru watershed stream power increases substantially downstream (Figure 5 bottom) In Sespe Creek the erratic variation of slope results in the equally unpreshydictable distribution of stream power through the watershed
Pl RU CREEK
03 (a) y =-1017 + 09l7(log)x
R 2 = 51
plt 01 ii 02
~ fl ~ 01
0 10 100
ORAi NAGE AREA (KM 2 )
2 y = 0162 + 5134(log)x
1000
(c)
~ ~
~ gt 0
~
0 10 100
ORAi NAGE AREA (KM 2 )
1000
R 2 = 30
SESPE CREEK
(b)03 y = 3609 - I 097(log)x
R2 = 18
ii 02
ill ~
z 0 01 iY
0 10 100 1000
ORAi NAGE AREA (KM 2 )
2 (d)
sectI J Oo (gt
cv J~
0 ~ 0
0g1 Iw 0gt 0
~ y = 17439 - 1372(log)x
R 2 = 01 p gt 5
0 10 100 1000
ORAi NAGE AREA (KM 2 )
RIPARIAN SPECIES DIVERSITY 477
FIG 4-The relationship of richness and SW diversity to drainage area (a) richness x drainage area in Piru Creek (b) richness x drainage area in Sespe Creek (c) SW diversity x drainage area in Piru Creek and (d) SW diversity x drainage area in Sespe Creek
The hypothesis that richness and SW diversity vary systematically through watershysheds was based on the theoretical relationship between diversity and disturbance it remains to assess the relationship between the diversity measures and stream power Richness at least responds substantially to variation in stream power (Figure 6 top) The downstream increase ofstream power in Piru Creek explains an initial finding that richness also increases downstream In Sespe Creek the random distribution ofstream power accounts for a weak relationship between richness and watershed position
Why then does SW diversity (H) not show similar patterns Its relationship to watershed position is weaker than that of species richness in both watersheds probably because its relationship to stream power is weaker (Figure 6 bottom) More puzzling yet the relationship to stream power is different in the two watershysheds positive in Piru negative in Sespe A possible explanation for the discrepancy between richness and SW diversity lies in the lesser sensitivity of richness to high-
PIRU CREEK
10000 (a) 10000
ce -~ ~ ~ 0 CIJ ~ 2 lt( CIJ 0 r Cl)
r z
1000
100
(]og)y = 63186 + 1768 I (]og)X
R2 = 86
0 CIJ ~ 0 0
lt( CIJ 0 r Cl)
r z
1000
100
10 p lt 001
10
SESPECREEK
(b)
(]og)y = 54187 + 14045(]og)X
R2 = 72
plt001
0001 001 01 0001 001 01
i ~ CIJ 0 0 l Cl)
01
001
SLOPE(MIM)
(log)y = -30206 + 5019(]og)X
R2 = 45 p lt 01
(c)
i ~ CIJ 0 0 l
01
001
Ci 0 CIJ
~ a lt( CIJ 0 r Cl)
z =gt
0001 10 100
DRAINAGE AREA (KM 21
10000 (logly = 1603 + 12281(1og)x
R2 = 74
p lt 001
1000
100
10
1000
(e)
-1 0 CIJ ~ 0 0
lt( CIJ 0 r Cl)
r z =gt
0001
10000
1000
100
10
SLOPE (MM)
(d)
(log)y = -10436 - 2499(]og)X
R2 = 14
pgt I
10 100 1000
DRAINAGE AREA (KM2)
(f)
10
(log)y = 26514 + OI42(]og)X
R2 = 00
p gt 5
10 100 1000 10 100 1000
DRAINAGE AREA (KM2) DRAINAGE AREA (KM)
478 THE GEOGRAPHICAL REVIEW
FrG 5-The relationship of unit stream power to slope slope to drainage area and unit stream power to drainage area (a) unit stream power x slope in Piru Creek (b) unit stream power x slope in Sespe Creek (c) slope x drainage area in Piru Creek (d) slope x drainage area in Sespe Creek (e) unit stream power x drainage area in Piru Creek and (f) unit stream power x drainage area in Sespe Creek The values for unit stream power are for the twenty-year recurrence interval flood
PIRUCREEK
03
i 02 0 ~
CIJ z i u 0l i2
y = -1 l 14 + 0740(log)x
R2 = 67 plt 001
ltgt
(a)
i 0 ~ VJ VJ CIJ z i u i2
03
02
01
0 lO 100 1000
UNIT STREAM POWER (WM2)
10000 0
2 (c) 2 y = -0228 + 4106(log)x
0 R2 = 39
plt 01
~ - t ~ CIJ 2 0 $ Ul
~
bullJ J lt)
23 - f-s g1 2 Cl
$
0 10 100 1000
UNIT STREAM POWER (WM2)
10000 0
SESPECREEK
(b) y =-I 352 + 0952(]og)x
R2 = 46 p lt 005
0
~o V (
Ygt ltgt 0
IO 100 1000 10000
UNIT STREAM POWER (WM2)
(d)
()
y = 22718 - 3090(log)x
R2 = 21
p lt 05
10 100 1000 10000
UNIT STREAM POWER (WM2)
479 RIPARIAN SPECIES DIVERSITY
Fm 6-The relationship of richness and SW diversity to unit stream power (a) richness x unit stream power in Piru Creek (b) richness x unit stream power in Sespe Creek ( c) SW diversity x unit stream power in Piru Creek and (d) SW diversity x unit stream power in Sespe Creek
magnitude disturbance A large flood that removes most of a given species from a site will reduce the evenness of the vegetation and therefore H will decline But as long as any representative of the species remains there is no decrease in richness This differential response can be illustrated by modification of Figure 1 to allow a single survivor of the high magnitude flood (Figure 7)
Richness can thus continue to increase with increasing disturbance beyond the threshold where SW diversity will decline In a conceptual sense this means that the scale ofFigure 2a may be different depending on the choice ofbiodiversity measure a watershed that falls within A-)-B when examining richness may actually be within B-)-C if the Shannon-Weaver diversity index is used
FLOOD MAGNITUDES POST-FLOOD VEGETATION
LOW RICHNESSLOW SW DIVERSITY
HIGH RICHNESSHIGH SW DIVERSITY
HIGH RICHNESSLOW SW DIVERSITY
THE GEOGRAPHICAL REVIEW
FIG 7-The differential relationship of richness and diversity to magnitude of disturbance If any of the preexisting vegetation survives the extreme flood there is no diminution of richness but dishyversity decreases
RIPARIAN SPECIES DIVERSITY
CONCLUSIONS
The first question set forth was whether species diversity is distributed systematically through the study watersheds These data suggest that it is with two qualifications One is that the relationship is more clearly seen ifspecies richness is the measure of diversity The other is that the relationship holds only if hydro logic conditions are also distributed systematically This is because yes also fits the second question Dishyversity-especially ifmeasured as richness-is indeed related to flood intensity Preshysumably these relationships would be better expressed in watersheds with purely alluvial channels where the expectations of hydraulic geometry would be fulfilled (Leopold and Maddock 1953)
Do the several complications encountered in this analysis imply that the theoshyretical expectations voiced for patterns ofriparian diversity are unsound Quite the contrary The data indicate that these concepts are useful but only ifapplied to a deshytailed understanding of the local context As with many other ecological relationshyships generalization is possible only to the degree that the underlying assumptions are met In this case there are multiple assumptions Some have been explicitly adshydressed here The floods routed through watersheds must conform to general hyshydrologic norms the range of hydrologic impacts in the watershed must at least partially coincide with the range of ecological vulnerability the measure of biodishyversity must not be overly sensitive Other questions that did not arise in this analysis also merit investigation with more extensive data sets How much is the patshytern of diversity affected by the variation of species composition through a watershyshed with its concomitant impact on disturbance vulnerability How sensitive are diversity patterns to the timing of disturbance in terms of both the length of time for pioneer species to arrive and the suitability ofenvironmental conditions for their establishment (Baker 199oa) And how important are interactions among multiple disturbance agents (Savage 1994 1997)
Despite the questions that remain the spatial relationships between hydrologic processes and disturbance-mediated biotic diversity offer intriguing insights into the spatial patterns ofdiversity And issues that remain suggest that there are abunshydant directions for future research in this area
NOTE
1 Because of the confluence of Lockwood Creek with Piru Creek (Figure 3) there is a notable discontinuity in the drainage area of the Piru Creek sites Consequently the regressions for Piru Creek with drainage area as the independent variable should be interpreted with particular caution because the separation of the data into two clusters may inflate the R2
REFERENCES
Bailey T L and RH Jahns 1954 Geology of the Transverse Range Province Southern California In Geology ofSouthern California edited by RH Jahns 83-106 San Francisco California Divishysion of Mines
Baker V R and JE Costa 1987 Flood Power In Catastrophic Flooding edited by L Mayer and D Nash 1-21 Boston Allen and Unwin
THE GEOGRAPHICAL REVIEW
Baker W L 1990a Climatic and Hydrologic Effects on the Regeneration of Populus Angustifolia James along the Animas River Colorado Journal ofBiogeography 17 (1) 59-73
--- 1990b Species Richness of Colorado Riparian Vegetation Journal of Vegetation Science 1 (1) 119-124
Bendix J 1994a Among-Site Variation in Riparian Vegetation of the Southern California Transshyverse Ranges American Midland Naturalist 132 (1) 136-151
--- 1994b Scale Direction and Pattern in Riparian Vegetation-Environment Relationships Annals of the Association ofAmerican Geographers 84 (4) 652-665
--- In press Stream Power Influence on Southern Californian Riparian Vegetation Journal of Vegetation Science
Borchert M 1990 Interview with the author Goleta Calif July Canfield RH 1941 Application of the Line Intercept Method in Sampling Range VegetationJourshy
nal ofForestry 39 (4) 388-394 Carbiener R and A Schnitzler 1990 Evolution ofMajor Pattern Models and Processes ofAlluvial
Forest of the Rhine in the Rift Valley (FranceGermany) Vegetatio 88 (2) 115-129 Connell J H 1978 Diversity in Tropical Rain Forests and Coral Reefs Science199 (4335 ) 1302-1310 Decamps H and E Tabacchi 1994 Species Richness in Vegetation along River Margins In Aquatic
Ecology Scale Pattern and Process edited by P S GillerA G Hildrew and D G Raffaelli 1-20 London Cambridge Scientific Publications
Dunne T and LB Leopold 1978 Water in Environmental Planning San Francisco W H Freeman Ehrlich PR and E 0 Wilson 1991 Biodiversity Studies Science and Policy Science 253 (5021)
758-762 Franklin J F 1993 Preserving Biodiversity Species Ecosystems or Landscapes Ecological Applicashy
tions 3 (2) 202-205 Graf W L 1983 Downstream Changes in Stream Power in the Henry Mountains Utah Annals of
the Association ofAmerican Geographers 73 (3) 373-387 Greig-Smith P 1983 Quantitative Plant Ecology 3d ed Berkeley University of California Press Griffith D A and C G Amrhein 1991 Statistical Analysis for Geographers Englewood Cliffs NJ
Prentice Hall Grubb P J 1977 The Maintenance of Species-Richness in Plant Communities The Importance of
the Regeneration Niche Biological Reviews 52 (1) 107-145 Hobbs R J and L F Huenneke 1992 Disturbance Diversity and Invasion Implications for Conshy
servation Conservation Biology 6 (3) 324-337 Hughes F M R 1990 The Influence ofFlooding Regimes on Forest Distribution and Composition
in the Tana River Floodplain Kenya Journal ofApplied Ecology 27 (2) 475-491 Hupp CR 1982 Stream-Grade Variation and Riparian-Forest Ecology along Passage Creek Virshy
ginia Bulletin of the Torrey Botanical Club 109 (4) 488-499 --- 1988 Plant Ecological Aspects of Flood Geomorphology and Paleotlood History In Flood
Geomorphology edited by V R Baker R C Kochel and P C Patton 335-356 New York John Wiley and Sons
Leopold LB and T Maddock Jr 1953 The Hydraulic Geometry of Stream Channels and Some Physiographic Implications US Geological Survey Professional Paper 252 Washington DC US Geological Survey
Leopold LB and JP Miller 1956 Ephemeral Streams-Hydraulic Factors and Their Relation to the Drainage Net US Geological Survey Professional Paper 282-A Washington DC US Geologishycal Survey
Leopold LB M G Wolman and JP Miller 1964 Pluvial Processes in Geomorphology San Franshycisco W H Freeman
Loucks 0 L 1970 Evolution of Diversity Efficiency and Community Stability American Zoologist 10 (1) 17-25
Magilligan F J 1992 Thresholds and the Spatial Variability ofFlood Power during Extreme Floods Geomorphology 5 (3-5) 373-390
Malanson G P 1984 Intensity as a Third Factor ofDisturbance Regime and Its Effect on Species Dishyversity Oikos 43 (3) 411-413
--- 1993 Riparian Landscapes New York Cambridge University Press Malanson G P and DR Butler 1990 Woody Debris Sediment and Riparian Vegetation ofa Subshy
alpine River Montana USA Arctic and Alpine Research 22 (2) 183-194
RIPARIAN SPECIES DIVERSITY
Meentemeyer V 1989 Geographical Perspectives of Space Time and Scale Landscape Ecology 3 (3-4) 163-173
Merrill WR 1954 Geology ofthe Sespe Creek-Pine Mountain Area Ventura County In Geology of Southern California edited by R H Jahns map sheet 3 San Francisco California Division of Mines
Naiman R J H Decamps and M Pollock 1993 The Role of Riparian Corridors in Maintaining Regional Biodiversity Ecological Applications 3 (2) 209-212
Nilsson C R Jansson and U Zinko 1997 Long-Term Responses of River-Margin Vegetation to Water-Level Regulation Science 276 (5313) 798-801
Nilsson C G Grelsson M Johansson and U Sperens 1988 Can Rarity and Diversity Be Predicted in Vegetation along River Banks Biological Conservation 44 (3) 201-212
--- 1989 Patterns of Plant Species Richness along Riverbanks Ecology 70 (1) 77-84 Peet R K 1974 The Measurement of Species Diversity Annual Review ofEcology and Systematics
5 285-307 Petraitis P S R E Latham and R A Niesenbaum 1989 The Maintenance of Species Diversity by
Disturbance Quarterly Review ofBiology 64 (4) 393-418 Raphael M J Feddema A J Orme and A R Orme 1995 The Unusual Storms ofFebruary1992 in
Southern California Physical Geography 15 (5) 442-464 Ricklefs R E and D Schluter eds 1993 Species Diversity in Ecological Communities Chicago Unishy
versity of Chicago Press Savage M 1994 Anthropocentric and Natural Disturbance and Patterns of Mortality in a Mixed
Forest in California Canadian Journal ofForest Research 24 ( 6) 1149-1159 --- 1997 The Role ofAnthropogenic Influences in a Mixed-Conifer Forest Mortality Episode
Journal ofVegetation Science 8 (1) 95-104 Savage M M Reid and T T Veblen 1992 Diversity and Disturbance in a Colorado Subalpine Forshy
est Physical Geography 13 (3) 240-249 Tabacchi E A-M Planty-Tabacchi and 0 Decamps 1990 Continuity and Discontinuity of the
Riparian Vegetation along a Pluvial Corridor Landscape Ecology 5 (1) 9-20 Vannote R L G W Minshall K W Cummins J R Sedell and C E Cushing 1980 The River Conshy
tinuum Concept Canadian Journal ofFisheries and Aquatic Sciences 37 (1) 130-137 White P S 1979 Pattern Process and Natural Disturbance in Vegetation Botanical Review 45 (3)
229-299

FLOOD DISTURBANCE AND THE DISTRIBUTION OF RIPARIAN SPECIES DIVERSITY
JACOB BENDIX
ABSTRACT Biodiversity varies considerably in Southern Californian riparian vegetation The intermediate disturbance hypothesis posits greatest diversity in settings that are subject to moderate-intensity disturbance Flood intensity tends to vary systematically in watershysheds potentially imposing patterns of biodiversity In two study watersheds species richshyness increases with flood severity Diversity or heterogeneity is less predictable Biodiversity patterns in these watersheds are complicated by atypical patterns offlood severity Although riparian diversity may be intimately dependent on flood disturbance the relationship is preshydictable only with due attention to the physiographic details of individual stream networks Keywords biodiversity floods riparian vegetation stream power
ltJn recent years concern has increased for biodiversity and for land-management policies and techniques that favor the preservation of species diversity (Ehrlich and Wilson 1991 Franklin 1993 Nilsson Jansson and Zinko 1997) Riparian environshyments are important to biodiversity at two scales Their presence contributes to reshygional biodiversity and they are notable for their internal diversity as well (Malanson 1993 Naiman Decamps and Pollock1993)The potential influence ofhydrologic disshyturbance on the spatial distribution of riparian species diversity is presented in an empirical example from the Transverse Ranges of Southern California
Theories concerning the spatial occurrence of plant species diversity often emshyphasize the role ofdisturbance regimes ( Grubb 1977 Petraitis Latham and Niesenshybaum 1989 Malanson and Butler 1990 Hobbs and Huenneke 1992) If disturbance does affect diversity it ought to be evident in riparian environments because they are particularly vulnerable to disturbance Most-by some definitions all-riparian zones witness periodic flooding and floods are agents of disturbance
The most prominent theory relating disturbance to species diversity is the intershymediate disturbance hypothesis which predicts maximum diversity in environshyments that experience moderate disturbance (Loucks 1970 Connell 1978 Petraitis Latham and Niesenbaum 1989) Moderate may refer either to disturbance magnishytude or to disturbance frequency this discussion concentrates on magnitude or seshyverity According to this theory intermediate-magnitude disturbance removes only a subset ofthe preexisting vegetation thus making only a portion ofthe affected area available for colonization Diversity is enhanced by the combination ofdisturbance survivors and the newly arrived disturbance exploiters (Figure 1) Partial alteration ofsites by intermediate-magnitude disturbances may also create new microhabitats that in turn are occupied by diverse species (Hughes 1990 Savage Reid and Veblen
bull I thank Mike Kirchoff for assistance in preparation of the figures and three anonymous reviewers for their comments on an initial draft of the manuscript
frac34 DR BENDIX is an assistant professor of geography at Syracuse University Syracuse New York 13244-1020
The Geographical Review 87 (4) 468-483 October 1997 Copyright copy 1997 by the American Geographical Society of New York
FLOOD MAGNITUDES POST-FLOOD VEGETATION
RIPARIAN SPECIES DIVERSITY
Fm 1-A simple example of the intermediate disturbance hypothesis with floods as the disturshybance agent A small flood (top) does little to damage the preexisting vegetation and thus has little impact An intermediate-magnitude flood (middle) fosters high diversity because it removes enough ofthe preexisting vegetation for the addition ofpioneer species An extremely large flood reshysults in low diversity because none of the preexisting vegetation remains to mingle with the pioneer species
470 THE GEOGRAPHICAL REVIEW
1992) Magnitude may refer to either the areal extent of disturbance or its severity (Malanson 1984) in a fluvial setting area and severity are likely to covary for both the area inundated and the energy of flow increase as discharge increases (Dunne and Leopold 1978)
In riparian settings flooding is a significant form of disturbance A floods deshystructive impact may be felt in several ways through the imposition of anaerobic conditions by inundation through the mechanical breakage of plants by floodwashyters andor the sediment they carry or through erosion ofthe substrate in which the plants are rooted (Hupp 1988 Malanson 1993 Bendix in press) These impacts make floods a major element ofdisturbance in most riparian environments and the domishynant one in many (White 1979 Bendix 1994a Decamps and Tabacchi 1994) Apart from the direct impact on vegetation alteration of site conditions is particularly significant at flood-affected sites where colonization by new species is further facilishytated by the deposition of fresh alluvial substrate
Because of the demonstrable importance of flood disturbance studies that test the applicability of the intermediate disturbance hypothesis to riparian vegetation emphasize the distribution offlood magnitude either as part ofa presumed systemshyatic downstream gradient ofdisturbance (Nilsson and others 1988 1989) or as a varishyable across multiple watersheds (Baker 1990b ) Results to date have been ambiguous and complicated by differences in scale and methodology The possible impacts of flooding on species diversity remain intriguing because floods may impose a disshytinct spatial pattern on the distribution of species diversity
DISTRIBUTION OF FLOOD IMPACTS
The systematic variation of hydrologic variables within watersheds has been quantified in a number of studies beginning with early research on hydraulic geshyometry (summarized in Leopold Wolman and Miller 1964) The net result of these hydrologic patterns is that severity of flooding often varies systematically as one moves downstream through a watershed The most basic pattern is
Q ocA (1)
where Q is discharge (volume of water per time) and A is drainage area Because drainage area increases downstream discharge in most streams also increases with distance downstream This common trend suggests that the disruptive force of floods should also increase as they move down through a watershed But the actual impact of floods depends not so much on the amount ofwater as on the energy exshyerted by it which is only partly determined by discharge
Unit stream power the actual energy per unit area exerted against the valley floor has proved useful in determining both the geomorphic and ecological impacts of floods (Baker and Costa 1987 Bendix 1994a) It is determined by the equation
ro = yDSv (2)
where ro is unit stream power in watts per square meter y is the specific weight of the water-sediment mixture in newtons per cubic meter Dis the average depth offlow in
471 RIPARIAN SPECIES DIVERSITY
meters Sis slope (dimensionless) and vis velocity in meters per second Because y is unlikely to vary significantly along a stream course this equation indicates that unit stream power will change in a downstream direction as a function of the downshystream variation of depth slope and velocity
Downstream change in these variables is fundamental to hydraulic geometry which refers to the geometric rate of change ofhydraulic variables as discharge ( Q) increases These variables can be represented by the following equations (Leopold and Maddock 1953 Leopold and Miller 1956)
D = cQ (3)
S = tQZ (4) V = kQm (5)
Coefficients c t and k and exponentsf z and m can be determined empirically for any given stream When applied to discharge figures for a given recurrence intershyval discharge equations 3-5 describe how the hydraulic parameters react to the downstream changes in discharge The regular geometric changes in these variables suggest that there may be systematic patterns in the impacts of a given flood as it moves through a watershed (given equation 1we should be able to substitute A for Q in these equations)
William Graf provided an example ofsuch a pattern in the Henry Mountains of Utah modeling changing values of stream power (Graf 1983) Such patterns are complex for they may depend on a relationship between valley morphology and the magnitude of the flood in question (Magilligan 1992) and they may even change with erosional modifications of the valley bottom (Graf 1983) It should be noted that the downstream change will not necessarily involve an increase in stream power Luna Leopold M Gordon Wolman and John Miller reported average values of 30-95 and 20 forf z and m respectively for ephemeral streams in the western United States (1964) The negative value for z suggests that decreasing slope may offset the increases in depth and velocity as the flood moves downstream In fact Graffound that within a given watershed the pattern ofstream power fluctuated beshytween positive and negative downstream trends with historical changes in stream morphology (1983)
IMPLI CA TIONS FOR BIOTIC DIVERSITY
For all their potential complexity the patterns offlood severity suggest that if riparshyian species diversity varies with flooding it should also vary systematically through the watershed Ifwe assume a gradient from minimal disturbance-due to small disshycharges-at a streams headwaters to maximum disturbance at its mouth-the highshyest discharges-then the intermediate magnitude of disturbance and hence the highest diversity values should be found in the middle reaches ofthe stream (Figure 2a) Christer Nilsson and his coauthors addressed this possibility with equivocal reshysults In studies ofSwedish rivers species richness was measured at regularly spaced reaches and regressed on distance downstream No relationship appeared in their
(a)
DISTURBANCE
A B C
DRAINAGE AREA
(b)
X
472 THE GEOGRAPHICAL REVIEW
FIG 2-Application ofthe intermediate disturbance hypothesis to a watershed setting See the text for references to (a) and (b)
473 RIPARIAN SPECIES DIVERSITY
overall data butwhen they limited their analysis to native species richness peaked in the middle reaches (Nilsson and others 1988 1989) It remains unclear whether this reflects an intermediate level of disturbance The relationship was not matched by flu vial variables that indicate flood severity and a decreased richness ofnatural speshycies in lower reaches may have been caused by more human presence there favoring weedy species
Although it is tempting to assume that the intermediate disturbance hypothesis locates maximum diversity in a streams middle reaches (Vannote and others 1980) actual patterns observed depend largely on the scale and location of the stream segshyments studied (Meentemeyer 1989 Bendix 1994b) For the intermediate disturbance hypothesis intermediate refers to potential ecological impacts not to potential flood magnitudes A4C in Figure 2a may not coincide with X4Y in Figure 2b In some small streams for example even the largest floods are insufficient to generate more than intermediate disturbance of the vegetation (there X4Y would coincide with A4B) For such a stream the location of ecological intermediate disturbance-and maximum diversity-may be expected downstream In streams where even the uppershymost reaches experience floods severe enough to create an intermediate disturbance X4Y will coincide with B4C with diversity decreasing downstream Thus if the inshytermediate disturbance hypothesis does hold true in fluvial settings itmay result in eishyther a near-linear (positive or negative reflecting A4B or B4C) or a quadratic relationship (A4C) between species diversity and location within the watershed all depending on the relationship between flood magnitudes and ecological sensitivity
Figure 2 remains based on an assumption that discharge-which varies most reshyliably with drainage area and watershed position-equates to potential disturbance Disturbance is however actually quite dependent on variation in the hydraulic components of stream power Any prediction of where intermediate disturbance and maximum diversity would be found in a watershed has to be mediated by unshyderstanding its hydraulic geometry and the resulting distribution ofstream power
Apart from studies by Nilsson and his associates the ties between hydrologic trends and patterns of riparian biodiversity have received little attention Studies have related riparian diversity to positions within the drainage network including Cliff Hupp in Virginia (1982) Eric Tabacchi Anne-Marie Planty-Tabacchi and Odile Decamps in France (1990) and R Carbiener and A Schnitzler in the valley of the Rhine (1990) Each placed greater emphasis on geologic controls in fluvial morshyphology than on overall patterns in a drainage network William Baker did examine riparian species richness in Colorado in relation to the intermediate disturbance hyshypothesis but on a regional rather than watershed scale (Baker 1990b)
As the foregoing discussion indicates our understanding ofpatterns in riparian diversity may be substantially enhanced by drawing on the explicitly spatial eleshyments of fluvial geomorphology Testing these links the remainder of this article uses the example of two watersheds in Southern California to address the relationshyship between hydrogeomorphic disturbance and riparian diversity Specifically I explore whether the alpha-scale-within-site-diversity of woody riparian vegeta-
474 THE GEOGRAPHICAL REVIEW
Piru and Sespe Creeks Southern California
i ~~~ North
FIG 3-The study area Piru and Sespe Creeks in Southern California The dark circles represent sampling sites
tion changes systematically through the watersheds and whether the distribution of that diversity can be related to variation in flood intensity
STUDY AREA
The data are drawn from two watersheds that drain the western Transverse Ranges of California Sespe and Piru Creeks (Figure 3) The Transverse Ranges are domishynated by a complex series of generally eastward-trending structural folds intershysected by numerous compressional and strike-slip faults both parallel to and across the fold axes (Bailey and Jahns 1954)The lithology ofthe region is also complex The watersheds drain areas of Cretaceous and Tertiary sedimentary units in some loshycales in others they intersect a granitic and gneissic basement complex (Merrill 1954) The extensive deformation of the bedrock in these mountains is of some fluvial significance because it results in several localized valley reaches where bedshyrock is exposed at the channel floor Valley bottoms in these watersheds vary from quite narrow (less than 15 meters) to broad (more than 100 meters) Although most have at least modest alluvial floodplains at some sites bedrock control imposes steep stream gradients resulting in high-energy floods
The area has a Mediterranean climate with dry summers and cool wet winters Most streams in the area have negligible to nonexistent discharges in summer but
475 RIPARIAN SPECIES DIVERSITY
may be subject to large floods during frontal storms in winter or early spring when high-intensity long-duration precipitation is dropped on steep slopes with shallow soils (Raphael and others 1995)
Riparian vegetation here is dominated by Fremont cottonwood (Populus freshymontii) white alder (Alnus rhombifolia) seep-willow (Baccharis glutinosa) and sevshyeral willow species (Salix) (Bendix 1994c1) These are often joined on the floodplain and terraces by chaparral species such as chamise (Adenostoma fasciculatum) from the surrounding hillslopes
These watersheds are unusual in the western United States for their absence ofgrazshying impacts Sespe Creek has been virtually immune to grazing pressure due to limited accessibility and the absence of substantial forage (Borchert 1990) and large portions ofthe Piru watershed have experienced such light grazing-at least in recent decades-shythat no measurable impacts on the vegetation can be discerned (Bendix 1994b)
METHODS
An earlier study ofriparian species-environment relationships (Bendix 1994a) proshyvided data onvegetation and hydro logic variables The vegetation data are from lineshyintercept sampling ofwoody species conducted at cross-valley transects at thirty-six sites along the main stream in each watershed (Canfield 1941 Greig-Smith 1983) This sampling strategy provided data not only for the number ofspecies present but also linear cover values-readily converted to importance values-amenable to the calculation of measures of diversity The limitation to woody species reduced any sensitivity ofthe data to the season ofdata collection and to inter- and intra-annual variability of a climatically sensitive herbaceous cover
The calculation of species diversity is complicated somewhat by the multiple definitions ofdiversity some ofwhich are at substantial variance (Peet 1974 provides a good review of these) The two most common approaches to diversity determine either the number of species-richness-present in a sample controlling for either the sample area or the number of individuals in it or heterogeneity of the sample which incorporates both the number of species and the evenness of their represenshytation in the sample This analysis employs two measures the most commonly used formulations for each of these approaches
The simpler of these is richness which requires no equation it is typically a count of the number of species per unit area of sample-except that here the lineshyintercept data require the substitution of unit length for unit area The other meashysure representing heterogeneity is the Shannon-Weaver diversity index (H)
H = -IpiLogpi (6)
in which Pi is the importance value or proportion of the sample-relative cover in this case-belonging to the ith species All subsequent uses here of richness refer to species per meter H is referred to as SW diversity
Estimates for the hydraulic variables and for the average values of unit stream power at each site were calculated from cross-sectional surveys conducted at the
476 THE GEOGRAPHICAL REVIEW
same time as the vegetation surveys from topographic maps and from output ofthe HEC-2 computer program Details of these calculations have been published elseshywhere (Bendix 199~)
Relationships among variables are determined by examination ofbivariate plots and the use of ordinary least-squares regression (Griffith and Amrhein 1991) Reshysults from the latter should be interpreted cautiously however given the small samshyple sizes involved (seventeen sites in Piru Creek and nineteen in Sespe Creek) The small number of observations makes these equations particularly sensitive to the influence ofoutliers As a result I omitted one site that had been used in other studshyies (Bendix 199~ 1994b) because it had only one species the resulting zero value for diversity exerted an undue influence on the regressions
RESULTS AND DISCUSSION
The seventeen sites analyzed in Piru Creek varied in cross-section size from 32 meters to 124 meters and in the number ofspecies present from two to eight In the nineteen Sespe Creek sites cross-sections ranged from 20 meters to 124 meters and the number ofspecies from four to nine Overall twenty-eight species were includedAlshythough these species numbers are low relative to those in many diversity studies (Ricklefs and Schluter 1993) they are comparable to those encountered for woody species diversity in other riparian studies (Baker 1990b)
When related to drainage area-the measure ofposition in the watershed-richshyness and SW diversity show very different patterns in the two creeks (Figure 4) There is disparity not only between the watersheds but also in the distribution of richness as compared with SW diversity1 Richness and SW diversity both increase downstream in the Piru watershed whereas in Sespe richness actually decreases downstream although in that watershed the trends for both richness and SW divershysity are weak and statistically nonsignificant
The difference between the patterns in the two watersheds can largely be exshyplained by examination of hydrologic conditions The assumption of systematic variation in flood impacts is based on equations 3-5 Those equations however were developed to describe channel conditions in alluvial rivers where running washyter can reshape channel dimensions with relative ease Piru and Sespe Creeks have many reaches where they flow directly atop bedrock along such reaches the channel is immune to short-term adjustments in slope Equation 2 suggests that if slope does not vary according to expectation neither will stream power
That suggestion is confirmed in this case Unit stream power is clearly highly sensitive to slope in both watersheds (Figure 5 top) But the distribution of slope (Figure 5 middle) confounds the expectations from average hydraulic geometry values as slope actually increases downstream in Piru Creek and varies almost ranshydomly through Sespe Creek As slope increases in concert with depth and velocity in the Piru watershed stream power increases substantially downstream (Figure 5 bottom) In Sespe Creek the erratic variation of slope results in the equally unpreshydictable distribution of stream power through the watershed
Pl RU CREEK
03 (a) y =-1017 + 09l7(log)x
R 2 = 51
plt 01 ii 02
~ fl ~ 01
0 10 100
ORAi NAGE AREA (KM 2 )
2 y = 0162 + 5134(log)x
1000
(c)
~ ~
~ gt 0
~
0 10 100
ORAi NAGE AREA (KM 2 )
1000
R 2 = 30
SESPE CREEK
(b)03 y = 3609 - I 097(log)x
R2 = 18
ii 02
ill ~
z 0 01 iY
0 10 100 1000
ORAi NAGE AREA (KM 2 )
2 (d)
sectI J Oo (gt
cv J~
0 ~ 0
0g1 Iw 0gt 0
~ y = 17439 - 1372(log)x
R 2 = 01 p gt 5
0 10 100 1000
ORAi NAGE AREA (KM 2 )
RIPARIAN SPECIES DIVERSITY 477
FIG 4-The relationship of richness and SW diversity to drainage area (a) richness x drainage area in Piru Creek (b) richness x drainage area in Sespe Creek (c) SW diversity x drainage area in Piru Creek and (d) SW diversity x drainage area in Sespe Creek
The hypothesis that richness and SW diversity vary systematically through watershysheds was based on the theoretical relationship between diversity and disturbance it remains to assess the relationship between the diversity measures and stream power Richness at least responds substantially to variation in stream power (Figure 6 top) The downstream increase ofstream power in Piru Creek explains an initial finding that richness also increases downstream In Sespe Creek the random distribution ofstream power accounts for a weak relationship between richness and watershed position
Why then does SW diversity (H) not show similar patterns Its relationship to watershed position is weaker than that of species richness in both watersheds probably because its relationship to stream power is weaker (Figure 6 bottom) More puzzling yet the relationship to stream power is different in the two watershysheds positive in Piru negative in Sespe A possible explanation for the discrepancy between richness and SW diversity lies in the lesser sensitivity of richness to high-
PIRU CREEK
10000 (a) 10000
ce -~ ~ ~ 0 CIJ ~ 2 lt( CIJ 0 r Cl)
r z
1000
100
(]og)y = 63186 + 1768 I (]og)X
R2 = 86
0 CIJ ~ 0 0
lt( CIJ 0 r Cl)
r z
1000
100
10 p lt 001
10
SESPECREEK
(b)
(]og)y = 54187 + 14045(]og)X
R2 = 72
plt001
0001 001 01 0001 001 01
i ~ CIJ 0 0 l Cl)
01
001
SLOPE(MIM)
(log)y = -30206 + 5019(]og)X
R2 = 45 p lt 01
(c)
i ~ CIJ 0 0 l
01
001
Ci 0 CIJ
~ a lt( CIJ 0 r Cl)
z =gt
0001 10 100
DRAINAGE AREA (KM 21
10000 (logly = 1603 + 12281(1og)x
R2 = 74
p lt 001
1000
100
10
1000
(e)
-1 0 CIJ ~ 0 0
lt( CIJ 0 r Cl)
r z =gt
0001
10000
1000
100
10
SLOPE (MM)
(d)
(log)y = -10436 - 2499(]og)X
R2 = 14
pgt I
10 100 1000
DRAINAGE AREA (KM2)
(f)
10
(log)y = 26514 + OI42(]og)X
R2 = 00
p gt 5
10 100 1000 10 100 1000
DRAINAGE AREA (KM2) DRAINAGE AREA (KM)
478 THE GEOGRAPHICAL REVIEW
FrG 5-The relationship of unit stream power to slope slope to drainage area and unit stream power to drainage area (a) unit stream power x slope in Piru Creek (b) unit stream power x slope in Sespe Creek (c) slope x drainage area in Piru Creek (d) slope x drainage area in Sespe Creek (e) unit stream power x drainage area in Piru Creek and (f) unit stream power x drainage area in Sespe Creek The values for unit stream power are for the twenty-year recurrence interval flood
PIRUCREEK
03
i 02 0 ~
CIJ z i u 0l i2
y = -1 l 14 + 0740(log)x
R2 = 67 plt 001
ltgt
(a)
i 0 ~ VJ VJ CIJ z i u i2
03
02
01
0 lO 100 1000
UNIT STREAM POWER (WM2)
10000 0
2 (c) 2 y = -0228 + 4106(log)x
0 R2 = 39
plt 01
~ - t ~ CIJ 2 0 $ Ul
~
bullJ J lt)
23 - f-s g1 2 Cl
$
0 10 100 1000
UNIT STREAM POWER (WM2)
10000 0
SESPECREEK
(b) y =-I 352 + 0952(]og)x
R2 = 46 p lt 005
0
~o V (
Ygt ltgt 0
IO 100 1000 10000
UNIT STREAM POWER (WM2)
(d)
()
y = 22718 - 3090(log)x
R2 = 21
p lt 05
10 100 1000 10000
UNIT STREAM POWER (WM2)
479 RIPARIAN SPECIES DIVERSITY
Fm 6-The relationship of richness and SW diversity to unit stream power (a) richness x unit stream power in Piru Creek (b) richness x unit stream power in Sespe Creek ( c) SW diversity x unit stream power in Piru Creek and (d) SW diversity x unit stream power in Sespe Creek
magnitude disturbance A large flood that removes most of a given species from a site will reduce the evenness of the vegetation and therefore H will decline But as long as any representative of the species remains there is no decrease in richness This differential response can be illustrated by modification of Figure 1 to allow a single survivor of the high magnitude flood (Figure 7)
Richness can thus continue to increase with increasing disturbance beyond the threshold where SW diversity will decline In a conceptual sense this means that the scale ofFigure 2a may be different depending on the choice ofbiodiversity measure a watershed that falls within A-)-B when examining richness may actually be within B-)-C if the Shannon-Weaver diversity index is used
FLOOD MAGNITUDES POST-FLOOD VEGETATION
LOW RICHNESSLOW SW DIVERSITY
HIGH RICHNESSHIGH SW DIVERSITY
HIGH RICHNESSLOW SW DIVERSITY
THE GEOGRAPHICAL REVIEW
FIG 7-The differential relationship of richness and diversity to magnitude of disturbance If any of the preexisting vegetation survives the extreme flood there is no diminution of richness but dishyversity decreases
RIPARIAN SPECIES DIVERSITY
CONCLUSIONS
The first question set forth was whether species diversity is distributed systematically through the study watersheds These data suggest that it is with two qualifications One is that the relationship is more clearly seen ifspecies richness is the measure of diversity The other is that the relationship holds only if hydro logic conditions are also distributed systematically This is because yes also fits the second question Dishyversity-especially ifmeasured as richness-is indeed related to flood intensity Preshysumably these relationships would be better expressed in watersheds with purely alluvial channels where the expectations of hydraulic geometry would be fulfilled (Leopold and Maddock 1953)
Do the several complications encountered in this analysis imply that the theoshyretical expectations voiced for patterns ofriparian diversity are unsound Quite the contrary The data indicate that these concepts are useful but only ifapplied to a deshytailed understanding of the local context As with many other ecological relationshyships generalization is possible only to the degree that the underlying assumptions are met In this case there are multiple assumptions Some have been explicitly adshydressed here The floods routed through watersheds must conform to general hyshydrologic norms the range of hydrologic impacts in the watershed must at least partially coincide with the range of ecological vulnerability the measure of biodishyversity must not be overly sensitive Other questions that did not arise in this analysis also merit investigation with more extensive data sets How much is the patshytern of diversity affected by the variation of species composition through a watershyshed with its concomitant impact on disturbance vulnerability How sensitive are diversity patterns to the timing of disturbance in terms of both the length of time for pioneer species to arrive and the suitability ofenvironmental conditions for their establishment (Baker 199oa) And how important are interactions among multiple disturbance agents (Savage 1994 1997)
Despite the questions that remain the spatial relationships between hydrologic processes and disturbance-mediated biotic diversity offer intriguing insights into the spatial patterns ofdiversity And issues that remain suggest that there are abunshydant directions for future research in this area
NOTE
1 Because of the confluence of Lockwood Creek with Piru Creek (Figure 3) there is a notable discontinuity in the drainage area of the Piru Creek sites Consequently the regressions for Piru Creek with drainage area as the independent variable should be interpreted with particular caution because the separation of the data into two clusters may inflate the R2
REFERENCES
Bailey T L and RH Jahns 1954 Geology of the Transverse Range Province Southern California In Geology ofSouthern California edited by RH Jahns 83-106 San Francisco California Divishysion of Mines
Baker V R and JE Costa 1987 Flood Power In Catastrophic Flooding edited by L Mayer and D Nash 1-21 Boston Allen and Unwin
THE GEOGRAPHICAL REVIEW
Baker W L 1990a Climatic and Hydrologic Effects on the Regeneration of Populus Angustifolia James along the Animas River Colorado Journal ofBiogeography 17 (1) 59-73
--- 1990b Species Richness of Colorado Riparian Vegetation Journal of Vegetation Science 1 (1) 119-124
Bendix J 1994a Among-Site Variation in Riparian Vegetation of the Southern California Transshyverse Ranges American Midland Naturalist 132 (1) 136-151
--- 1994b Scale Direction and Pattern in Riparian Vegetation-Environment Relationships Annals of the Association ofAmerican Geographers 84 (4) 652-665
--- In press Stream Power Influence on Southern Californian Riparian Vegetation Journal of Vegetation Science
Borchert M 1990 Interview with the author Goleta Calif July Canfield RH 1941 Application of the Line Intercept Method in Sampling Range VegetationJourshy
nal ofForestry 39 (4) 388-394 Carbiener R and A Schnitzler 1990 Evolution ofMajor Pattern Models and Processes ofAlluvial
Forest of the Rhine in the Rift Valley (FranceGermany) Vegetatio 88 (2) 115-129 Connell J H 1978 Diversity in Tropical Rain Forests and Coral Reefs Science199 (4335 ) 1302-1310 Decamps H and E Tabacchi 1994 Species Richness in Vegetation along River Margins In Aquatic
Ecology Scale Pattern and Process edited by P S GillerA G Hildrew and D G Raffaelli 1-20 London Cambridge Scientific Publications
Dunne T and LB Leopold 1978 Water in Environmental Planning San Francisco W H Freeman Ehrlich PR and E 0 Wilson 1991 Biodiversity Studies Science and Policy Science 253 (5021)
758-762 Franklin J F 1993 Preserving Biodiversity Species Ecosystems or Landscapes Ecological Applicashy
tions 3 (2) 202-205 Graf W L 1983 Downstream Changes in Stream Power in the Henry Mountains Utah Annals of
the Association ofAmerican Geographers 73 (3) 373-387 Greig-Smith P 1983 Quantitative Plant Ecology 3d ed Berkeley University of California Press Griffith D A and C G Amrhein 1991 Statistical Analysis for Geographers Englewood Cliffs NJ
Prentice Hall Grubb P J 1977 The Maintenance of Species-Richness in Plant Communities The Importance of
the Regeneration Niche Biological Reviews 52 (1) 107-145 Hobbs R J and L F Huenneke 1992 Disturbance Diversity and Invasion Implications for Conshy
servation Conservation Biology 6 (3) 324-337 Hughes F M R 1990 The Influence ofFlooding Regimes on Forest Distribution and Composition
in the Tana River Floodplain Kenya Journal ofApplied Ecology 27 (2) 475-491 Hupp CR 1982 Stream-Grade Variation and Riparian-Forest Ecology along Passage Creek Virshy
ginia Bulletin of the Torrey Botanical Club 109 (4) 488-499 --- 1988 Plant Ecological Aspects of Flood Geomorphology and Paleotlood History In Flood
Geomorphology edited by V R Baker R C Kochel and P C Patton 335-356 New York John Wiley and Sons
Leopold LB and T Maddock Jr 1953 The Hydraulic Geometry of Stream Channels and Some Physiographic Implications US Geological Survey Professional Paper 252 Washington DC US Geological Survey
Leopold LB and JP Miller 1956 Ephemeral Streams-Hydraulic Factors and Their Relation to the Drainage Net US Geological Survey Professional Paper 282-A Washington DC US Geologishycal Survey
Leopold LB M G Wolman and JP Miller 1964 Pluvial Processes in Geomorphology San Franshycisco W H Freeman
Loucks 0 L 1970 Evolution of Diversity Efficiency and Community Stability American Zoologist 10 (1) 17-25
Magilligan F J 1992 Thresholds and the Spatial Variability ofFlood Power during Extreme Floods Geomorphology 5 (3-5) 373-390
Malanson G P 1984 Intensity as a Third Factor ofDisturbance Regime and Its Effect on Species Dishyversity Oikos 43 (3) 411-413
--- 1993 Riparian Landscapes New York Cambridge University Press Malanson G P and DR Butler 1990 Woody Debris Sediment and Riparian Vegetation ofa Subshy
alpine River Montana USA Arctic and Alpine Research 22 (2) 183-194
RIPARIAN SPECIES DIVERSITY
Meentemeyer V 1989 Geographical Perspectives of Space Time and Scale Landscape Ecology 3 (3-4) 163-173
Merrill WR 1954 Geology ofthe Sespe Creek-Pine Mountain Area Ventura County In Geology of Southern California edited by R H Jahns map sheet 3 San Francisco California Division of Mines
Naiman R J H Decamps and M Pollock 1993 The Role of Riparian Corridors in Maintaining Regional Biodiversity Ecological Applications 3 (2) 209-212
Nilsson C R Jansson and U Zinko 1997 Long-Term Responses of River-Margin Vegetation to Water-Level Regulation Science 276 (5313) 798-801
Nilsson C G Grelsson M Johansson and U Sperens 1988 Can Rarity and Diversity Be Predicted in Vegetation along River Banks Biological Conservation 44 (3) 201-212
--- 1989 Patterns of Plant Species Richness along Riverbanks Ecology 70 (1) 77-84 Peet R K 1974 The Measurement of Species Diversity Annual Review ofEcology and Systematics
5 285-307 Petraitis P S R E Latham and R A Niesenbaum 1989 The Maintenance of Species Diversity by
Disturbance Quarterly Review ofBiology 64 (4) 393-418 Raphael M J Feddema A J Orme and A R Orme 1995 The Unusual Storms ofFebruary1992 in
Southern California Physical Geography 15 (5) 442-464 Ricklefs R E and D Schluter eds 1993 Species Diversity in Ecological Communities Chicago Unishy
versity of Chicago Press Savage M 1994 Anthropocentric and Natural Disturbance and Patterns of Mortality in a Mixed
Forest in California Canadian Journal ofForest Research 24 ( 6) 1149-1159 --- 1997 The Role ofAnthropogenic Influences in a Mixed-Conifer Forest Mortality Episode
Journal ofVegetation Science 8 (1) 95-104 Savage M M Reid and T T Veblen 1992 Diversity and Disturbance in a Colorado Subalpine Forshy
est Physical Geography 13 (3) 240-249 Tabacchi E A-M Planty-Tabacchi and 0 Decamps 1990 Continuity and Discontinuity of the
Riparian Vegetation along a Pluvial Corridor Landscape Ecology 5 (1) 9-20 Vannote R L G W Minshall K W Cummins J R Sedell and C E Cushing 1980 The River Conshy
tinuum Concept Canadian Journal ofFisheries and Aquatic Sciences 37 (1) 130-137 White P S 1979 Pattern Process and Natural Disturbance in Vegetation Botanical Review 45 (3)
229-299
FLOOD MAGNITUDES POST-FLOOD VEGETATION
RIPARIAN SPECIES DIVERSITY
Fm 1-A simple example of the intermediate disturbance hypothesis with floods as the disturshybance agent A small flood (top) does little to damage the preexisting vegetation and thus has little impact An intermediate-magnitude flood (middle) fosters high diversity because it removes enough ofthe preexisting vegetation for the addition ofpioneer species An extremely large flood reshysults in low diversity because none of the preexisting vegetation remains to mingle with the pioneer species
470 THE GEOGRAPHICAL REVIEW
1992) Magnitude may refer to either the areal extent of disturbance or its severity (Malanson 1984) in a fluvial setting area and severity are likely to covary for both the area inundated and the energy of flow increase as discharge increases (Dunne and Leopold 1978)
In riparian settings flooding is a significant form of disturbance A floods deshystructive impact may be felt in several ways through the imposition of anaerobic conditions by inundation through the mechanical breakage of plants by floodwashyters andor the sediment they carry or through erosion ofthe substrate in which the plants are rooted (Hupp 1988 Malanson 1993 Bendix in press) These impacts make floods a major element ofdisturbance in most riparian environments and the domishynant one in many (White 1979 Bendix 1994a Decamps and Tabacchi 1994) Apart from the direct impact on vegetation alteration of site conditions is particularly significant at flood-affected sites where colonization by new species is further facilishytated by the deposition of fresh alluvial substrate
Because of the demonstrable importance of flood disturbance studies that test the applicability of the intermediate disturbance hypothesis to riparian vegetation emphasize the distribution offlood magnitude either as part ofa presumed systemshyatic downstream gradient ofdisturbance (Nilsson and others 1988 1989) or as a varishyable across multiple watersheds (Baker 1990b ) Results to date have been ambiguous and complicated by differences in scale and methodology The possible impacts of flooding on species diversity remain intriguing because floods may impose a disshytinct spatial pattern on the distribution of species diversity
DISTRIBUTION OF FLOOD IMPACTS
The systematic variation of hydrologic variables within watersheds has been quantified in a number of studies beginning with early research on hydraulic geshyometry (summarized in Leopold Wolman and Miller 1964) The net result of these hydrologic patterns is that severity of flooding often varies systematically as one moves downstream through a watershed The most basic pattern is
Q ocA (1)
where Q is discharge (volume of water per time) and A is drainage area Because drainage area increases downstream discharge in most streams also increases with distance downstream This common trend suggests that the disruptive force of floods should also increase as they move down through a watershed But the actual impact of floods depends not so much on the amount ofwater as on the energy exshyerted by it which is only partly determined by discharge
Unit stream power the actual energy per unit area exerted against the valley floor has proved useful in determining both the geomorphic and ecological impacts of floods (Baker and Costa 1987 Bendix 1994a) It is determined by the equation
ro = yDSv (2)
where ro is unit stream power in watts per square meter y is the specific weight of the water-sediment mixture in newtons per cubic meter Dis the average depth offlow in
471 RIPARIAN SPECIES DIVERSITY
meters Sis slope (dimensionless) and vis velocity in meters per second Because y is unlikely to vary significantly along a stream course this equation indicates that unit stream power will change in a downstream direction as a function of the downshystream variation of depth slope and velocity
Downstream change in these variables is fundamental to hydraulic geometry which refers to the geometric rate of change ofhydraulic variables as discharge ( Q) increases These variables can be represented by the following equations (Leopold and Maddock 1953 Leopold and Miller 1956)
D = cQ (3)
S = tQZ (4) V = kQm (5)
Coefficients c t and k and exponentsf z and m can be determined empirically for any given stream When applied to discharge figures for a given recurrence intershyval discharge equations 3-5 describe how the hydraulic parameters react to the downstream changes in discharge The regular geometric changes in these variables suggest that there may be systematic patterns in the impacts of a given flood as it moves through a watershed (given equation 1we should be able to substitute A for Q in these equations)
William Graf provided an example ofsuch a pattern in the Henry Mountains of Utah modeling changing values of stream power (Graf 1983) Such patterns are complex for they may depend on a relationship between valley morphology and the magnitude of the flood in question (Magilligan 1992) and they may even change with erosional modifications of the valley bottom (Graf 1983) It should be noted that the downstream change will not necessarily involve an increase in stream power Luna Leopold M Gordon Wolman and John Miller reported average values of 30-95 and 20 forf z and m respectively for ephemeral streams in the western United States (1964) The negative value for z suggests that decreasing slope may offset the increases in depth and velocity as the flood moves downstream In fact Graffound that within a given watershed the pattern ofstream power fluctuated beshytween positive and negative downstream trends with historical changes in stream morphology (1983)
IMPLI CA TIONS FOR BIOTIC DIVERSITY
For all their potential complexity the patterns offlood severity suggest that if riparshyian species diversity varies with flooding it should also vary systematically through the watershed Ifwe assume a gradient from minimal disturbance-due to small disshycharges-at a streams headwaters to maximum disturbance at its mouth-the highshyest discharges-then the intermediate magnitude of disturbance and hence the highest diversity values should be found in the middle reaches ofthe stream (Figure 2a) Christer Nilsson and his coauthors addressed this possibility with equivocal reshysults In studies ofSwedish rivers species richness was measured at regularly spaced reaches and regressed on distance downstream No relationship appeared in their
(a)
DISTURBANCE
A B C
DRAINAGE AREA
(b)
X
472 THE GEOGRAPHICAL REVIEW
FIG 2-Application ofthe intermediate disturbance hypothesis to a watershed setting See the text for references to (a) and (b)
473 RIPARIAN SPECIES DIVERSITY
overall data butwhen they limited their analysis to native species richness peaked in the middle reaches (Nilsson and others 1988 1989) It remains unclear whether this reflects an intermediate level of disturbance The relationship was not matched by flu vial variables that indicate flood severity and a decreased richness ofnatural speshycies in lower reaches may have been caused by more human presence there favoring weedy species
Although it is tempting to assume that the intermediate disturbance hypothesis locates maximum diversity in a streams middle reaches (Vannote and others 1980) actual patterns observed depend largely on the scale and location of the stream segshyments studied (Meentemeyer 1989 Bendix 1994b) For the intermediate disturbance hypothesis intermediate refers to potential ecological impacts not to potential flood magnitudes A4C in Figure 2a may not coincide with X4Y in Figure 2b In some small streams for example even the largest floods are insufficient to generate more than intermediate disturbance of the vegetation (there X4Y would coincide with A4B) For such a stream the location of ecological intermediate disturbance-and maximum diversity-may be expected downstream In streams where even the uppershymost reaches experience floods severe enough to create an intermediate disturbance X4Y will coincide with B4C with diversity decreasing downstream Thus if the inshytermediate disturbance hypothesis does hold true in fluvial settings itmay result in eishyther a near-linear (positive or negative reflecting A4B or B4C) or a quadratic relationship (A4C) between species diversity and location within the watershed all depending on the relationship between flood magnitudes and ecological sensitivity
Figure 2 remains based on an assumption that discharge-which varies most reshyliably with drainage area and watershed position-equates to potential disturbance Disturbance is however actually quite dependent on variation in the hydraulic components of stream power Any prediction of where intermediate disturbance and maximum diversity would be found in a watershed has to be mediated by unshyderstanding its hydraulic geometry and the resulting distribution ofstream power
Apart from studies by Nilsson and his associates the ties between hydrologic trends and patterns of riparian biodiversity have received little attention Studies have related riparian diversity to positions within the drainage network including Cliff Hupp in Virginia (1982) Eric Tabacchi Anne-Marie Planty-Tabacchi and Odile Decamps in France (1990) and R Carbiener and A Schnitzler in the valley of the Rhine (1990) Each placed greater emphasis on geologic controls in fluvial morshyphology than on overall patterns in a drainage network William Baker did examine riparian species richness in Colorado in relation to the intermediate disturbance hyshypothesis but on a regional rather than watershed scale (Baker 1990b)
As the foregoing discussion indicates our understanding ofpatterns in riparian diversity may be substantially enhanced by drawing on the explicitly spatial eleshyments of fluvial geomorphology Testing these links the remainder of this article uses the example of two watersheds in Southern California to address the relationshyship between hydrogeomorphic disturbance and riparian diversity Specifically I explore whether the alpha-scale-within-site-diversity of woody riparian vegeta-
474 THE GEOGRAPHICAL REVIEW
Piru and Sespe Creeks Southern California
i ~~~ North
FIG 3-The study area Piru and Sespe Creeks in Southern California The dark circles represent sampling sites
tion changes systematically through the watersheds and whether the distribution of that diversity can be related to variation in flood intensity
STUDY AREA
The data are drawn from two watersheds that drain the western Transverse Ranges of California Sespe and Piru Creeks (Figure 3) The Transverse Ranges are domishynated by a complex series of generally eastward-trending structural folds intershysected by numerous compressional and strike-slip faults both parallel to and across the fold axes (Bailey and Jahns 1954)The lithology ofthe region is also complex The watersheds drain areas of Cretaceous and Tertiary sedimentary units in some loshycales in others they intersect a granitic and gneissic basement complex (Merrill 1954) The extensive deformation of the bedrock in these mountains is of some fluvial significance because it results in several localized valley reaches where bedshyrock is exposed at the channel floor Valley bottoms in these watersheds vary from quite narrow (less than 15 meters) to broad (more than 100 meters) Although most have at least modest alluvial floodplains at some sites bedrock control imposes steep stream gradients resulting in high-energy floods
The area has a Mediterranean climate with dry summers and cool wet winters Most streams in the area have negligible to nonexistent discharges in summer but
475 RIPARIAN SPECIES DIVERSITY
may be subject to large floods during frontal storms in winter or early spring when high-intensity long-duration precipitation is dropped on steep slopes with shallow soils (Raphael and others 1995)
Riparian vegetation here is dominated by Fremont cottonwood (Populus freshymontii) white alder (Alnus rhombifolia) seep-willow (Baccharis glutinosa) and sevshyeral willow species (Salix) (Bendix 1994c1) These are often joined on the floodplain and terraces by chaparral species such as chamise (Adenostoma fasciculatum) from the surrounding hillslopes
These watersheds are unusual in the western United States for their absence ofgrazshying impacts Sespe Creek has been virtually immune to grazing pressure due to limited accessibility and the absence of substantial forage (Borchert 1990) and large portions ofthe Piru watershed have experienced such light grazing-at least in recent decades-shythat no measurable impacts on the vegetation can be discerned (Bendix 1994b)
METHODS
An earlier study ofriparian species-environment relationships (Bendix 1994a) proshyvided data onvegetation and hydro logic variables The vegetation data are from lineshyintercept sampling ofwoody species conducted at cross-valley transects at thirty-six sites along the main stream in each watershed (Canfield 1941 Greig-Smith 1983) This sampling strategy provided data not only for the number ofspecies present but also linear cover values-readily converted to importance values-amenable to the calculation of measures of diversity The limitation to woody species reduced any sensitivity ofthe data to the season ofdata collection and to inter- and intra-annual variability of a climatically sensitive herbaceous cover
The calculation of species diversity is complicated somewhat by the multiple definitions ofdiversity some ofwhich are at substantial variance (Peet 1974 provides a good review of these) The two most common approaches to diversity determine either the number of species-richness-present in a sample controlling for either the sample area or the number of individuals in it or heterogeneity of the sample which incorporates both the number of species and the evenness of their represenshytation in the sample This analysis employs two measures the most commonly used formulations for each of these approaches
The simpler of these is richness which requires no equation it is typically a count of the number of species per unit area of sample-except that here the lineshyintercept data require the substitution of unit length for unit area The other meashysure representing heterogeneity is the Shannon-Weaver diversity index (H)
H = -IpiLogpi (6)
in which Pi is the importance value or proportion of the sample-relative cover in this case-belonging to the ith species All subsequent uses here of richness refer to species per meter H is referred to as SW diversity
Estimates for the hydraulic variables and for the average values of unit stream power at each site were calculated from cross-sectional surveys conducted at the
476 THE GEOGRAPHICAL REVIEW
same time as the vegetation surveys from topographic maps and from output ofthe HEC-2 computer program Details of these calculations have been published elseshywhere (Bendix 199~)
Relationships among variables are determined by examination ofbivariate plots and the use of ordinary least-squares regression (Griffith and Amrhein 1991) Reshysults from the latter should be interpreted cautiously however given the small samshyple sizes involved (seventeen sites in Piru Creek and nineteen in Sespe Creek) The small number of observations makes these equations particularly sensitive to the influence ofoutliers As a result I omitted one site that had been used in other studshyies (Bendix 199~ 1994b) because it had only one species the resulting zero value for diversity exerted an undue influence on the regressions
RESULTS AND DISCUSSION
The seventeen sites analyzed in Piru Creek varied in cross-section size from 32 meters to 124 meters and in the number ofspecies present from two to eight In the nineteen Sespe Creek sites cross-sections ranged from 20 meters to 124 meters and the number ofspecies from four to nine Overall twenty-eight species were includedAlshythough these species numbers are low relative to those in many diversity studies (Ricklefs and Schluter 1993) they are comparable to those encountered for woody species diversity in other riparian studies (Baker 1990b)
When related to drainage area-the measure ofposition in the watershed-richshyness and SW diversity show very different patterns in the two creeks (Figure 4) There is disparity not only between the watersheds but also in the distribution of richness as compared with SW diversity1 Richness and SW diversity both increase downstream in the Piru watershed whereas in Sespe richness actually decreases downstream although in that watershed the trends for both richness and SW divershysity are weak and statistically nonsignificant
The difference between the patterns in the two watersheds can largely be exshyplained by examination of hydrologic conditions The assumption of systematic variation in flood impacts is based on equations 3-5 Those equations however were developed to describe channel conditions in alluvial rivers where running washyter can reshape channel dimensions with relative ease Piru and Sespe Creeks have many reaches where they flow directly atop bedrock along such reaches the channel is immune to short-term adjustments in slope Equation 2 suggests that if slope does not vary according to expectation neither will stream power
That suggestion is confirmed in this case Unit stream power is clearly highly sensitive to slope in both watersheds (Figure 5 top) But the distribution of slope (Figure 5 middle) confounds the expectations from average hydraulic geometry values as slope actually increases downstream in Piru Creek and varies almost ranshydomly through Sespe Creek As slope increases in concert with depth and velocity in the Piru watershed stream power increases substantially downstream (Figure 5 bottom) In Sespe Creek the erratic variation of slope results in the equally unpreshydictable distribution of stream power through the watershed
Pl RU CREEK
03 (a) y =-1017 + 09l7(log)x
R 2 = 51
plt 01 ii 02
~ fl ~ 01
0 10 100
ORAi NAGE AREA (KM 2 )
2 y = 0162 + 5134(log)x
1000
(c)
~ ~
~ gt 0
~
0 10 100
ORAi NAGE AREA (KM 2 )
1000
R 2 = 30
SESPE CREEK
(b)03 y = 3609 - I 097(log)x
R2 = 18
ii 02
ill ~
z 0 01 iY
0 10 100 1000
ORAi NAGE AREA (KM 2 )
2 (d)
sectI J Oo (gt
cv J~
0 ~ 0
0g1 Iw 0gt 0
~ y = 17439 - 1372(log)x
R 2 = 01 p gt 5
0 10 100 1000
ORAi NAGE AREA (KM 2 )
RIPARIAN SPECIES DIVERSITY 477
FIG 4-The relationship of richness and SW diversity to drainage area (a) richness x drainage area in Piru Creek (b) richness x drainage area in Sespe Creek (c) SW diversity x drainage area in Piru Creek and (d) SW diversity x drainage area in Sespe Creek
The hypothesis that richness and SW diversity vary systematically through watershysheds was based on the theoretical relationship between diversity and disturbance it remains to assess the relationship between the diversity measures and stream power Richness at least responds substantially to variation in stream power (Figure 6 top) The downstream increase ofstream power in Piru Creek explains an initial finding that richness also increases downstream In Sespe Creek the random distribution ofstream power accounts for a weak relationship between richness and watershed position
Why then does SW diversity (H) not show similar patterns Its relationship to watershed position is weaker than that of species richness in both watersheds probably because its relationship to stream power is weaker (Figure 6 bottom) More puzzling yet the relationship to stream power is different in the two watershysheds positive in Piru negative in Sespe A possible explanation for the discrepancy between richness and SW diversity lies in the lesser sensitivity of richness to high-
PIRU CREEK
10000 (a) 10000
ce -~ ~ ~ 0 CIJ ~ 2 lt( CIJ 0 r Cl)
r z
1000
100
(]og)y = 63186 + 1768 I (]og)X
R2 = 86
0 CIJ ~ 0 0
lt( CIJ 0 r Cl)
r z
1000
100
10 p lt 001
10
SESPECREEK
(b)
(]og)y = 54187 + 14045(]og)X
R2 = 72
plt001
0001 001 01 0001 001 01
i ~ CIJ 0 0 l Cl)
01
001
SLOPE(MIM)
(log)y = -30206 + 5019(]og)X
R2 = 45 p lt 01
(c)
i ~ CIJ 0 0 l
01
001
Ci 0 CIJ
~ a lt( CIJ 0 r Cl)
z =gt
0001 10 100
DRAINAGE AREA (KM 21
10000 (logly = 1603 + 12281(1og)x
R2 = 74
p lt 001
1000
100
10
1000
(e)
-1 0 CIJ ~ 0 0
lt( CIJ 0 r Cl)
r z =gt
0001
10000
1000
100
10
SLOPE (MM)
(d)
(log)y = -10436 - 2499(]og)X
R2 = 14
pgt I
10 100 1000
DRAINAGE AREA (KM2)
(f)
10
(log)y = 26514 + OI42(]og)X
R2 = 00
p gt 5
10 100 1000 10 100 1000
DRAINAGE AREA (KM2) DRAINAGE AREA (KM)
478 THE GEOGRAPHICAL REVIEW
FrG 5-The relationship of unit stream power to slope slope to drainage area and unit stream power to drainage area (a) unit stream power x slope in Piru Creek (b) unit stream power x slope in Sespe Creek (c) slope x drainage area in Piru Creek (d) slope x drainage area in Sespe Creek (e) unit stream power x drainage area in Piru Creek and (f) unit stream power x drainage area in Sespe Creek The values for unit stream power are for the twenty-year recurrence interval flood
PIRUCREEK
03
i 02 0 ~
CIJ z i u 0l i2
y = -1 l 14 + 0740(log)x
R2 = 67 plt 001
ltgt
(a)
i 0 ~ VJ VJ CIJ z i u i2
03
02
01
0 lO 100 1000
UNIT STREAM POWER (WM2)
10000 0
2 (c) 2 y = -0228 + 4106(log)x
0 R2 = 39
plt 01
~ - t ~ CIJ 2 0 $ Ul
~
bullJ J lt)
23 - f-s g1 2 Cl
$
0 10 100 1000
UNIT STREAM POWER (WM2)
10000 0
SESPECREEK
(b) y =-I 352 + 0952(]og)x
R2 = 46 p lt 005
0
~o V (
Ygt ltgt 0
IO 100 1000 10000
UNIT STREAM POWER (WM2)
(d)
()
y = 22718 - 3090(log)x
R2 = 21
p lt 05
10 100 1000 10000
UNIT STREAM POWER (WM2)
479 RIPARIAN SPECIES DIVERSITY
Fm 6-The relationship of richness and SW diversity to unit stream power (a) richness x unit stream power in Piru Creek (b) richness x unit stream power in Sespe Creek ( c) SW diversity x unit stream power in Piru Creek and (d) SW diversity x unit stream power in Sespe Creek
magnitude disturbance A large flood that removes most of a given species from a site will reduce the evenness of the vegetation and therefore H will decline But as long as any representative of the species remains there is no decrease in richness This differential response can be illustrated by modification of Figure 1 to allow a single survivor of the high magnitude flood (Figure 7)
Richness can thus continue to increase with increasing disturbance beyond the threshold where SW diversity will decline In a conceptual sense this means that the scale ofFigure 2a may be different depending on the choice ofbiodiversity measure a watershed that falls within A-)-B when examining richness may actually be within B-)-C if the Shannon-Weaver diversity index is used
FLOOD MAGNITUDES POST-FLOOD VEGETATION
LOW RICHNESSLOW SW DIVERSITY
HIGH RICHNESSHIGH SW DIVERSITY
HIGH RICHNESSLOW SW DIVERSITY
THE GEOGRAPHICAL REVIEW
FIG 7-The differential relationship of richness and diversity to magnitude of disturbance If any of the preexisting vegetation survives the extreme flood there is no diminution of richness but dishyversity decreases
RIPARIAN SPECIES DIVERSITY
CONCLUSIONS
The first question set forth was whether species diversity is distributed systematically through the study watersheds These data suggest that it is with two qualifications One is that the relationship is more clearly seen ifspecies richness is the measure of diversity The other is that the relationship holds only if hydro logic conditions are also distributed systematically This is because yes also fits the second question Dishyversity-especially ifmeasured as richness-is indeed related to flood intensity Preshysumably these relationships would be better expressed in watersheds with purely alluvial channels where the expectations of hydraulic geometry would be fulfilled (Leopold and Maddock 1953)
Do the several complications encountered in this analysis imply that the theoshyretical expectations voiced for patterns ofriparian diversity are unsound Quite the contrary The data indicate that these concepts are useful but only ifapplied to a deshytailed understanding of the local context As with many other ecological relationshyships generalization is possible only to the degree that the underlying assumptions are met In this case there are multiple assumptions Some have been explicitly adshydressed here The floods routed through watersheds must conform to general hyshydrologic norms the range of hydrologic impacts in the watershed must at least partially coincide with the range of ecological vulnerability the measure of biodishyversity must not be overly sensitive Other questions that did not arise in this analysis also merit investigation with more extensive data sets How much is the patshytern of diversity affected by the variation of species composition through a watershyshed with its concomitant impact on disturbance vulnerability How sensitive are diversity patterns to the timing of disturbance in terms of both the length of time for pioneer species to arrive and the suitability ofenvironmental conditions for their establishment (Baker 199oa) And how important are interactions among multiple disturbance agents (Savage 1994 1997)
Despite the questions that remain the spatial relationships between hydrologic processes and disturbance-mediated biotic diversity offer intriguing insights into the spatial patterns ofdiversity And issues that remain suggest that there are abunshydant directions for future research in this area
NOTE
1 Because of the confluence of Lockwood Creek with Piru Creek (Figure 3) there is a notable discontinuity in the drainage area of the Piru Creek sites Consequently the regressions for Piru Creek with drainage area as the independent variable should be interpreted with particular caution because the separation of the data into two clusters may inflate the R2
REFERENCES
Bailey T L and RH Jahns 1954 Geology of the Transverse Range Province Southern California In Geology ofSouthern California edited by RH Jahns 83-106 San Francisco California Divishysion of Mines
Baker V R and JE Costa 1987 Flood Power In Catastrophic Flooding edited by L Mayer and D Nash 1-21 Boston Allen and Unwin
THE GEOGRAPHICAL REVIEW
Baker W L 1990a Climatic and Hydrologic Effects on the Regeneration of Populus Angustifolia James along the Animas River Colorado Journal ofBiogeography 17 (1) 59-73
--- 1990b Species Richness of Colorado Riparian Vegetation Journal of Vegetation Science 1 (1) 119-124
Bendix J 1994a Among-Site Variation in Riparian Vegetation of the Southern California Transshyverse Ranges American Midland Naturalist 132 (1) 136-151
--- 1994b Scale Direction and Pattern in Riparian Vegetation-Environment Relationships Annals of the Association ofAmerican Geographers 84 (4) 652-665
--- In press Stream Power Influence on Southern Californian Riparian Vegetation Journal of Vegetation Science
Borchert M 1990 Interview with the author Goleta Calif July Canfield RH 1941 Application of the Line Intercept Method in Sampling Range VegetationJourshy
nal ofForestry 39 (4) 388-394 Carbiener R and A Schnitzler 1990 Evolution ofMajor Pattern Models and Processes ofAlluvial
Forest of the Rhine in the Rift Valley (FranceGermany) Vegetatio 88 (2) 115-129 Connell J H 1978 Diversity in Tropical Rain Forests and Coral Reefs Science199 (4335 ) 1302-1310 Decamps H and E Tabacchi 1994 Species Richness in Vegetation along River Margins In Aquatic
Ecology Scale Pattern and Process edited by P S GillerA G Hildrew and D G Raffaelli 1-20 London Cambridge Scientific Publications
Dunne T and LB Leopold 1978 Water in Environmental Planning San Francisco W H Freeman Ehrlich PR and E 0 Wilson 1991 Biodiversity Studies Science and Policy Science 253 (5021)
758-762 Franklin J F 1993 Preserving Biodiversity Species Ecosystems or Landscapes Ecological Applicashy
tions 3 (2) 202-205 Graf W L 1983 Downstream Changes in Stream Power in the Henry Mountains Utah Annals of
the Association ofAmerican Geographers 73 (3) 373-387 Greig-Smith P 1983 Quantitative Plant Ecology 3d ed Berkeley University of California Press Griffith D A and C G Amrhein 1991 Statistical Analysis for Geographers Englewood Cliffs NJ
Prentice Hall Grubb P J 1977 The Maintenance of Species-Richness in Plant Communities The Importance of
the Regeneration Niche Biological Reviews 52 (1) 107-145 Hobbs R J and L F Huenneke 1992 Disturbance Diversity and Invasion Implications for Conshy
servation Conservation Biology 6 (3) 324-337 Hughes F M R 1990 The Influence ofFlooding Regimes on Forest Distribution and Composition
in the Tana River Floodplain Kenya Journal ofApplied Ecology 27 (2) 475-491 Hupp CR 1982 Stream-Grade Variation and Riparian-Forest Ecology along Passage Creek Virshy
ginia Bulletin of the Torrey Botanical Club 109 (4) 488-499 --- 1988 Plant Ecological Aspects of Flood Geomorphology and Paleotlood History In Flood
Geomorphology edited by V R Baker R C Kochel and P C Patton 335-356 New York John Wiley and Sons
Leopold LB and T Maddock Jr 1953 The Hydraulic Geometry of Stream Channels and Some Physiographic Implications US Geological Survey Professional Paper 252 Washington DC US Geological Survey
Leopold LB and JP Miller 1956 Ephemeral Streams-Hydraulic Factors and Their Relation to the Drainage Net US Geological Survey Professional Paper 282-A Washington DC US Geologishycal Survey
Leopold LB M G Wolman and JP Miller 1964 Pluvial Processes in Geomorphology San Franshycisco W H Freeman
Loucks 0 L 1970 Evolution of Diversity Efficiency and Community Stability American Zoologist 10 (1) 17-25
Magilligan F J 1992 Thresholds and the Spatial Variability ofFlood Power during Extreme Floods Geomorphology 5 (3-5) 373-390
Malanson G P 1984 Intensity as a Third Factor ofDisturbance Regime and Its Effect on Species Dishyversity Oikos 43 (3) 411-413
--- 1993 Riparian Landscapes New York Cambridge University Press Malanson G P and DR Butler 1990 Woody Debris Sediment and Riparian Vegetation ofa Subshy
alpine River Montana USA Arctic and Alpine Research 22 (2) 183-194
RIPARIAN SPECIES DIVERSITY
Meentemeyer V 1989 Geographical Perspectives of Space Time and Scale Landscape Ecology 3 (3-4) 163-173
Merrill WR 1954 Geology ofthe Sespe Creek-Pine Mountain Area Ventura County In Geology of Southern California edited by R H Jahns map sheet 3 San Francisco California Division of Mines
Naiman R J H Decamps and M Pollock 1993 The Role of Riparian Corridors in Maintaining Regional Biodiversity Ecological Applications 3 (2) 209-212
Nilsson C R Jansson and U Zinko 1997 Long-Term Responses of River-Margin Vegetation to Water-Level Regulation Science 276 (5313) 798-801
Nilsson C G Grelsson M Johansson and U Sperens 1988 Can Rarity and Diversity Be Predicted in Vegetation along River Banks Biological Conservation 44 (3) 201-212
--- 1989 Patterns of Plant Species Richness along Riverbanks Ecology 70 (1) 77-84 Peet R K 1974 The Measurement of Species Diversity Annual Review ofEcology and Systematics
5 285-307 Petraitis P S R E Latham and R A Niesenbaum 1989 The Maintenance of Species Diversity by
Disturbance Quarterly Review ofBiology 64 (4) 393-418 Raphael M J Feddema A J Orme and A R Orme 1995 The Unusual Storms ofFebruary1992 in
Southern California Physical Geography 15 (5) 442-464 Ricklefs R E and D Schluter eds 1993 Species Diversity in Ecological Communities Chicago Unishy
versity of Chicago Press Savage M 1994 Anthropocentric and Natural Disturbance and Patterns of Mortality in a Mixed
Forest in California Canadian Journal ofForest Research 24 ( 6) 1149-1159 --- 1997 The Role ofAnthropogenic Influences in a Mixed-Conifer Forest Mortality Episode
Journal ofVegetation Science 8 (1) 95-104 Savage M M Reid and T T Veblen 1992 Diversity and Disturbance in a Colorado Subalpine Forshy
est Physical Geography 13 (3) 240-249 Tabacchi E A-M Planty-Tabacchi and 0 Decamps 1990 Continuity and Discontinuity of the
Riparian Vegetation along a Pluvial Corridor Landscape Ecology 5 (1) 9-20 Vannote R L G W Minshall K W Cummins J R Sedell and C E Cushing 1980 The River Conshy
tinuum Concept Canadian Journal ofFisheries and Aquatic Sciences 37 (1) 130-137 White P S 1979 Pattern Process and Natural Disturbance in Vegetation Botanical Review 45 (3)
229-299

(a)
DISTURBANCE
A B C
DRAINAGE AREA
(b)
X
472 THE GEOGRAPHICAL REVIEW
FIG 2-Application ofthe intermediate disturbance hypothesis to a watershed setting See the text for references to (a) and (b)
473 RIPARIAN SPECIES DIVERSITY
overall data butwhen they limited their analysis to native species richness peaked in the middle reaches (Nilsson and others 1988 1989) It remains unclear whether this reflects an intermediate level of disturbance The relationship was not matched by flu vial variables that indicate flood severity and a decreased richness ofnatural speshycies in lower reaches may have been caused by more human presence there favoring weedy species
Although it is tempting to assume that the intermediate disturbance hypothesis locates maximum diversity in a streams middle reaches (Vannote and others 1980) actual patterns observed depend largely on the scale and location of the stream segshyments studied (Meentemeyer 1989 Bendix 1994b) For the intermediate disturbance hypothesis intermediate refers to potential ecological impacts not to potential flood magnitudes A4C in Figure 2a may not coincide with X4Y in Figure 2b In some small streams for example even the largest floods are insufficient to generate more than intermediate disturbance of the vegetation (there X4Y would coincide with A4B) For such a stream the location of ecological intermediate disturbance-and maximum diversity-may be expected downstream In streams where even the uppershymost reaches experience floods severe enough to create an intermediate disturbance X4Y will coincide with B4C with diversity decreasing downstream Thus if the inshytermediate disturbance hypothesis does hold true in fluvial settings itmay result in eishyther a near-linear (positive or negative reflecting A4B or B4C) or a quadratic relationship (A4C) between species diversity and location within the watershed all depending on the relationship between flood magnitudes and ecological sensitivity
Figure 2 remains based on an assumption that discharge-which varies most reshyliably with drainage area and watershed position-equates to potential disturbance Disturbance is however actually quite dependent on variation in the hydraulic components of stream power Any prediction of where intermediate disturbance and maximum diversity would be found in a watershed has to be mediated by unshyderstanding its hydraulic geometry and the resulting distribution ofstream power
Apart from studies by Nilsson and his associates the ties between hydrologic trends and patterns of riparian biodiversity have received little attention Studies have related riparian diversity to positions within the drainage network including Cliff Hupp in Virginia (1982) Eric Tabacchi Anne-Marie Planty-Tabacchi and Odile Decamps in France (1990) and R Carbiener and A Schnitzler in the valley of the Rhine (1990) Each placed greater emphasis on geologic controls in fluvial morshyphology than on overall patterns in a drainage network William Baker did examine riparian species richness in Colorado in relation to the intermediate disturbance hyshypothesis but on a regional rather than watershed scale (Baker 1990b)
As the foregoing discussion indicates our understanding ofpatterns in riparian diversity may be substantially enhanced by drawing on the explicitly spatial eleshyments of fluvial geomorphology Testing these links the remainder of this article uses the example of two watersheds in Southern California to address the relationshyship between hydrogeomorphic disturbance and riparian diversity Specifically I explore whether the alpha-scale-within-site-diversity of woody riparian vegeta-
474 THE GEOGRAPHICAL REVIEW
Piru and Sespe Creeks Southern California
i ~~~ North
FIG 3-The study area Piru and Sespe Creeks in Southern California The dark circles represent sampling sites
tion changes systematically through the watersheds and whether the distribution of that diversity can be related to variation in flood intensity
STUDY AREA
The data are drawn from two watersheds that drain the western Transverse Ranges of California Sespe and Piru Creeks (Figure 3) The Transverse Ranges are domishynated by a complex series of generally eastward-trending structural folds intershysected by numerous compressional and strike-slip faults both parallel to and across the fold axes (Bailey and Jahns 1954)The lithology ofthe region is also complex The watersheds drain areas of Cretaceous and Tertiary sedimentary units in some loshycales in others they intersect a granitic and gneissic basement complex (Merrill 1954) The extensive deformation of the bedrock in these mountains is of some fluvial significance because it results in several localized valley reaches where bedshyrock is exposed at the channel floor Valley bottoms in these watersheds vary from quite narrow (less than 15 meters) to broad (more than 100 meters) Although most have at least modest alluvial floodplains at some sites bedrock control imposes steep stream gradients resulting in high-energy floods
The area has a Mediterranean climate with dry summers and cool wet winters Most streams in the area have negligible to nonexistent discharges in summer but
475 RIPARIAN SPECIES DIVERSITY
may be subject to large floods during frontal storms in winter or early spring when high-intensity long-duration precipitation is dropped on steep slopes with shallow soils (Raphael and others 1995)
Riparian vegetation here is dominated by Fremont cottonwood (Populus freshymontii) white alder (Alnus rhombifolia) seep-willow (Baccharis glutinosa) and sevshyeral willow species (Salix) (Bendix 1994c1) These are often joined on the floodplain and terraces by chaparral species such as chamise (Adenostoma fasciculatum) from the surrounding hillslopes
These watersheds are unusual in the western United States for their absence ofgrazshying impacts Sespe Creek has been virtually immune to grazing pressure due to limited accessibility and the absence of substantial forage (Borchert 1990) and large portions ofthe Piru watershed have experienced such light grazing-at least in recent decades-shythat no measurable impacts on the vegetation can be discerned (Bendix 1994b)
METHODS
An earlier study ofriparian species-environment relationships (Bendix 1994a) proshyvided data onvegetation and hydro logic variables The vegetation data are from lineshyintercept sampling ofwoody species conducted at cross-valley transects at thirty-six sites along the main stream in each watershed (Canfield 1941 Greig-Smith 1983) This sampling strategy provided data not only for the number ofspecies present but also linear cover values-readily converted to importance values-amenable to the calculation of measures of diversity The limitation to woody species reduced any sensitivity ofthe data to the season ofdata collection and to inter- and intra-annual variability of a climatically sensitive herbaceous cover
The calculation of species diversity is complicated somewhat by the multiple definitions ofdiversity some ofwhich are at substantial variance (Peet 1974 provides a good review of these) The two most common approaches to diversity determine either the number of species-richness-present in a sample controlling for either the sample area or the number of individuals in it or heterogeneity of the sample which incorporates both the number of species and the evenness of their represenshytation in the sample This analysis employs two measures the most commonly used formulations for each of these approaches
The simpler of these is richness which requires no equation it is typically a count of the number of species per unit area of sample-except that here the lineshyintercept data require the substitution of unit length for unit area The other meashysure representing heterogeneity is the Shannon-Weaver diversity index (H)
H = -IpiLogpi (6)
in which Pi is the importance value or proportion of the sample-relative cover in this case-belonging to the ith species All subsequent uses here of richness refer to species per meter H is referred to as SW diversity
Estimates for the hydraulic variables and for the average values of unit stream power at each site were calculated from cross-sectional surveys conducted at the
476 THE GEOGRAPHICAL REVIEW
same time as the vegetation surveys from topographic maps and from output ofthe HEC-2 computer program Details of these calculations have been published elseshywhere (Bendix 199~)
Relationships among variables are determined by examination ofbivariate plots and the use of ordinary least-squares regression (Griffith and Amrhein 1991) Reshysults from the latter should be interpreted cautiously however given the small samshyple sizes involved (seventeen sites in Piru Creek and nineteen in Sespe Creek) The small number of observations makes these equations particularly sensitive to the influence ofoutliers As a result I omitted one site that had been used in other studshyies (Bendix 199~ 1994b) because it had only one species the resulting zero value for diversity exerted an undue influence on the regressions
RESULTS AND DISCUSSION
The seventeen sites analyzed in Piru Creek varied in cross-section size from 32 meters to 124 meters and in the number ofspecies present from two to eight In the nineteen Sespe Creek sites cross-sections ranged from 20 meters to 124 meters and the number ofspecies from four to nine Overall twenty-eight species were includedAlshythough these species numbers are low relative to those in many diversity studies (Ricklefs and Schluter 1993) they are comparable to those encountered for woody species diversity in other riparian studies (Baker 1990b)
When related to drainage area-the measure ofposition in the watershed-richshyness and SW diversity show very different patterns in the two creeks (Figure 4) There is disparity not only between the watersheds but also in the distribution of richness as compared with SW diversity1 Richness and SW diversity both increase downstream in the Piru watershed whereas in Sespe richness actually decreases downstream although in that watershed the trends for both richness and SW divershysity are weak and statistically nonsignificant
The difference between the patterns in the two watersheds can largely be exshyplained by examination of hydrologic conditions The assumption of systematic variation in flood impacts is based on equations 3-5 Those equations however were developed to describe channel conditions in alluvial rivers where running washyter can reshape channel dimensions with relative ease Piru and Sespe Creeks have many reaches where they flow directly atop bedrock along such reaches the channel is immune to short-term adjustments in slope Equation 2 suggests that if slope does not vary according to expectation neither will stream power
That suggestion is confirmed in this case Unit stream power is clearly highly sensitive to slope in both watersheds (Figure 5 top) But the distribution of slope (Figure 5 middle) confounds the expectations from average hydraulic geometry values as slope actually increases downstream in Piru Creek and varies almost ranshydomly through Sespe Creek As slope increases in concert with depth and velocity in the Piru watershed stream power increases substantially downstream (Figure 5 bottom) In Sespe Creek the erratic variation of slope results in the equally unpreshydictable distribution of stream power through the watershed
Pl RU CREEK
03 (a) y =-1017 + 09l7(log)x
R 2 = 51
plt 01 ii 02
~ fl ~ 01
0 10 100
ORAi NAGE AREA (KM 2 )
2 y = 0162 + 5134(log)x
1000
(c)
~ ~
~ gt 0
~
0 10 100
ORAi NAGE AREA (KM 2 )
1000
R 2 = 30
SESPE CREEK
(b)03 y = 3609 - I 097(log)x
R2 = 18
ii 02
ill ~
z 0 01 iY
0 10 100 1000
ORAi NAGE AREA (KM 2 )
2 (d)
sectI J Oo (gt
cv J~
0 ~ 0
0g1 Iw 0gt 0
~ y = 17439 - 1372(log)x
R 2 = 01 p gt 5
0 10 100 1000
ORAi NAGE AREA (KM 2 )
RIPARIAN SPECIES DIVERSITY 477
FIG 4-The relationship of richness and SW diversity to drainage area (a) richness x drainage area in Piru Creek (b) richness x drainage area in Sespe Creek (c) SW diversity x drainage area in Piru Creek and (d) SW diversity x drainage area in Sespe Creek
The hypothesis that richness and SW diversity vary systematically through watershysheds was based on the theoretical relationship between diversity and disturbance it remains to assess the relationship between the diversity measures and stream power Richness at least responds substantially to variation in stream power (Figure 6 top) The downstream increase ofstream power in Piru Creek explains an initial finding that richness also increases downstream In Sespe Creek the random distribution ofstream power accounts for a weak relationship between richness and watershed position
Why then does SW diversity (H) not show similar patterns Its relationship to watershed position is weaker than that of species richness in both watersheds probably because its relationship to stream power is weaker (Figure 6 bottom) More puzzling yet the relationship to stream power is different in the two watershysheds positive in Piru negative in Sespe A possible explanation for the discrepancy between richness and SW diversity lies in the lesser sensitivity of richness to high-
PIRU CREEK
10000 (a) 10000
ce -~ ~ ~ 0 CIJ ~ 2 lt( CIJ 0 r Cl)
r z
1000
100
(]og)y = 63186 + 1768 I (]og)X
R2 = 86
0 CIJ ~ 0 0
lt( CIJ 0 r Cl)
r z
1000
100
10 p lt 001
10
SESPECREEK
(b)
(]og)y = 54187 + 14045(]og)X
R2 = 72
plt001
0001 001 01 0001 001 01
i ~ CIJ 0 0 l Cl)
01
001
SLOPE(MIM)
(log)y = -30206 + 5019(]og)X
R2 = 45 p lt 01
(c)
i ~ CIJ 0 0 l
01
001
Ci 0 CIJ
~ a lt( CIJ 0 r Cl)
z =gt
0001 10 100
DRAINAGE AREA (KM 21
10000 (logly = 1603 + 12281(1og)x
R2 = 74
p lt 001
1000
100
10
1000
(e)
-1 0 CIJ ~ 0 0
lt( CIJ 0 r Cl)
r z =gt
0001
10000
1000
100
10
SLOPE (MM)
(d)
(log)y = -10436 - 2499(]og)X
R2 = 14
pgt I
10 100 1000
DRAINAGE AREA (KM2)
(f)
10
(log)y = 26514 + OI42(]og)X
R2 = 00
p gt 5
10 100 1000 10 100 1000
DRAINAGE AREA (KM2) DRAINAGE AREA (KM)
478 THE GEOGRAPHICAL REVIEW
FrG 5-The relationship of unit stream power to slope slope to drainage area and unit stream power to drainage area (a) unit stream power x slope in Piru Creek (b) unit stream power x slope in Sespe Creek (c) slope x drainage area in Piru Creek (d) slope x drainage area in Sespe Creek (e) unit stream power x drainage area in Piru Creek and (f) unit stream power x drainage area in Sespe Creek The values for unit stream power are for the twenty-year recurrence interval flood
PIRUCREEK
03
i 02 0 ~
CIJ z i u 0l i2
y = -1 l 14 + 0740(log)x
R2 = 67 plt 001
ltgt
(a)
i 0 ~ VJ VJ CIJ z i u i2
03
02
01
0 lO 100 1000
UNIT STREAM POWER (WM2)
10000 0
2 (c) 2 y = -0228 + 4106(log)x
0 R2 = 39
plt 01
~ - t ~ CIJ 2 0 $ Ul
~
bullJ J lt)
23 - f-s g1 2 Cl
$
0 10 100 1000
UNIT STREAM POWER (WM2)
10000 0
SESPECREEK
(b) y =-I 352 + 0952(]og)x
R2 = 46 p lt 005
0
~o V (
Ygt ltgt 0
IO 100 1000 10000
UNIT STREAM POWER (WM2)
(d)
()
y = 22718 - 3090(log)x
R2 = 21
p lt 05
10 100 1000 10000
UNIT STREAM POWER (WM2)
479 RIPARIAN SPECIES DIVERSITY
Fm 6-The relationship of richness and SW diversity to unit stream power (a) richness x unit stream power in Piru Creek (b) richness x unit stream power in Sespe Creek ( c) SW diversity x unit stream power in Piru Creek and (d) SW diversity x unit stream power in Sespe Creek
magnitude disturbance A large flood that removes most of a given species from a site will reduce the evenness of the vegetation and therefore H will decline But as long as any representative of the species remains there is no decrease in richness This differential response can be illustrated by modification of Figure 1 to allow a single survivor of the high magnitude flood (Figure 7)
Richness can thus continue to increase with increasing disturbance beyond the threshold where SW diversity will decline In a conceptual sense this means that the scale ofFigure 2a may be different depending on the choice ofbiodiversity measure a watershed that falls within A-)-B when examining richness may actually be within B-)-C if the Shannon-Weaver diversity index is used
FLOOD MAGNITUDES POST-FLOOD VEGETATION
LOW RICHNESSLOW SW DIVERSITY
HIGH RICHNESSHIGH SW DIVERSITY
HIGH RICHNESSLOW SW DIVERSITY
THE GEOGRAPHICAL REVIEW
FIG 7-The differential relationship of richness and diversity to magnitude of disturbance If any of the preexisting vegetation survives the extreme flood there is no diminution of richness but dishyversity decreases
RIPARIAN SPECIES DIVERSITY
CONCLUSIONS
The first question set forth was whether species diversity is distributed systematically through the study watersheds These data suggest that it is with two qualifications One is that the relationship is more clearly seen ifspecies richness is the measure of diversity The other is that the relationship holds only if hydro logic conditions are also distributed systematically This is because yes also fits the second question Dishyversity-especially ifmeasured as richness-is indeed related to flood intensity Preshysumably these relationships would be better expressed in watersheds with purely alluvial channels where the expectations of hydraulic geometry would be fulfilled (Leopold and Maddock 1953)
Do the several complications encountered in this analysis imply that the theoshyretical expectations voiced for patterns ofriparian diversity are unsound Quite the contrary The data indicate that these concepts are useful but only ifapplied to a deshytailed understanding of the local context As with many other ecological relationshyships generalization is possible only to the degree that the underlying assumptions are met In this case there are multiple assumptions Some have been explicitly adshydressed here The floods routed through watersheds must conform to general hyshydrologic norms the range of hydrologic impacts in the watershed must at least partially coincide with the range of ecological vulnerability the measure of biodishyversity must not be overly sensitive Other questions that did not arise in this analysis also merit investigation with more extensive data sets How much is the patshytern of diversity affected by the variation of species composition through a watershyshed with its concomitant impact on disturbance vulnerability How sensitive are diversity patterns to the timing of disturbance in terms of both the length of time for pioneer species to arrive and the suitability ofenvironmental conditions for their establishment (Baker 199oa) And how important are interactions among multiple disturbance agents (Savage 1994 1997)
Despite the questions that remain the spatial relationships between hydrologic processes and disturbance-mediated biotic diversity offer intriguing insights into the spatial patterns ofdiversity And issues that remain suggest that there are abunshydant directions for future research in this area
NOTE
1 Because of the confluence of Lockwood Creek with Piru Creek (Figure 3) there is a notable discontinuity in the drainage area of the Piru Creek sites Consequently the regressions for Piru Creek with drainage area as the independent variable should be interpreted with particular caution because the separation of the data into two clusters may inflate the R2
REFERENCES
Bailey T L and RH Jahns 1954 Geology of the Transverse Range Province Southern California In Geology ofSouthern California edited by RH Jahns 83-106 San Francisco California Divishysion of Mines
Baker V R and JE Costa 1987 Flood Power In Catastrophic Flooding edited by L Mayer and D Nash 1-21 Boston Allen and Unwin
THE GEOGRAPHICAL REVIEW
Baker W L 1990a Climatic and Hydrologic Effects on the Regeneration of Populus Angustifolia James along the Animas River Colorado Journal ofBiogeography 17 (1) 59-73
--- 1990b Species Richness of Colorado Riparian Vegetation Journal of Vegetation Science 1 (1) 119-124
Bendix J 1994a Among-Site Variation in Riparian Vegetation of the Southern California Transshyverse Ranges American Midland Naturalist 132 (1) 136-151
--- 1994b Scale Direction and Pattern in Riparian Vegetation-Environment Relationships Annals of the Association ofAmerican Geographers 84 (4) 652-665
--- In press Stream Power Influence on Southern Californian Riparian Vegetation Journal of Vegetation Science
Borchert M 1990 Interview with the author Goleta Calif July Canfield RH 1941 Application of the Line Intercept Method in Sampling Range VegetationJourshy
nal ofForestry 39 (4) 388-394 Carbiener R and A Schnitzler 1990 Evolution ofMajor Pattern Models and Processes ofAlluvial
Forest of the Rhine in the Rift Valley (FranceGermany) Vegetatio 88 (2) 115-129 Connell J H 1978 Diversity in Tropical Rain Forests and Coral Reefs Science199 (4335 ) 1302-1310 Decamps H and E Tabacchi 1994 Species Richness in Vegetation along River Margins In Aquatic
Ecology Scale Pattern and Process edited by P S GillerA G Hildrew and D G Raffaelli 1-20 London Cambridge Scientific Publications
Dunne T and LB Leopold 1978 Water in Environmental Planning San Francisco W H Freeman Ehrlich PR and E 0 Wilson 1991 Biodiversity Studies Science and Policy Science 253 (5021)
758-762 Franklin J F 1993 Preserving Biodiversity Species Ecosystems or Landscapes Ecological Applicashy
tions 3 (2) 202-205 Graf W L 1983 Downstream Changes in Stream Power in the Henry Mountains Utah Annals of
the Association ofAmerican Geographers 73 (3) 373-387 Greig-Smith P 1983 Quantitative Plant Ecology 3d ed Berkeley University of California Press Griffith D A and C G Amrhein 1991 Statistical Analysis for Geographers Englewood Cliffs NJ
Prentice Hall Grubb P J 1977 The Maintenance of Species-Richness in Plant Communities The Importance of
the Regeneration Niche Biological Reviews 52 (1) 107-145 Hobbs R J and L F Huenneke 1992 Disturbance Diversity and Invasion Implications for Conshy
servation Conservation Biology 6 (3) 324-337 Hughes F M R 1990 The Influence ofFlooding Regimes on Forest Distribution and Composition
in the Tana River Floodplain Kenya Journal ofApplied Ecology 27 (2) 475-491 Hupp CR 1982 Stream-Grade Variation and Riparian-Forest Ecology along Passage Creek Virshy
ginia Bulletin of the Torrey Botanical Club 109 (4) 488-499 --- 1988 Plant Ecological Aspects of Flood Geomorphology and Paleotlood History In Flood
Geomorphology edited by V R Baker R C Kochel and P C Patton 335-356 New York John Wiley and Sons
Leopold LB and T Maddock Jr 1953 The Hydraulic Geometry of Stream Channels and Some Physiographic Implications US Geological Survey Professional Paper 252 Washington DC US Geological Survey
Leopold LB and JP Miller 1956 Ephemeral Streams-Hydraulic Factors and Their Relation to the Drainage Net US Geological Survey Professional Paper 282-A Washington DC US Geologishycal Survey
Leopold LB M G Wolman and JP Miller 1964 Pluvial Processes in Geomorphology San Franshycisco W H Freeman
Loucks 0 L 1970 Evolution of Diversity Efficiency and Community Stability American Zoologist 10 (1) 17-25
Magilligan F J 1992 Thresholds and the Spatial Variability ofFlood Power during Extreme Floods Geomorphology 5 (3-5) 373-390
Malanson G P 1984 Intensity as a Third Factor ofDisturbance Regime and Its Effect on Species Dishyversity Oikos 43 (3) 411-413
--- 1993 Riparian Landscapes New York Cambridge University Press Malanson G P and DR Butler 1990 Woody Debris Sediment and Riparian Vegetation ofa Subshy
alpine River Montana USA Arctic and Alpine Research 22 (2) 183-194
RIPARIAN SPECIES DIVERSITY
Meentemeyer V 1989 Geographical Perspectives of Space Time and Scale Landscape Ecology 3 (3-4) 163-173
Merrill WR 1954 Geology ofthe Sespe Creek-Pine Mountain Area Ventura County In Geology of Southern California edited by R H Jahns map sheet 3 San Francisco California Division of Mines
Naiman R J H Decamps and M Pollock 1993 The Role of Riparian Corridors in Maintaining Regional Biodiversity Ecological Applications 3 (2) 209-212
Nilsson C R Jansson and U Zinko 1997 Long-Term Responses of River-Margin Vegetation to Water-Level Regulation Science 276 (5313) 798-801
Nilsson C G Grelsson M Johansson and U Sperens 1988 Can Rarity and Diversity Be Predicted in Vegetation along River Banks Biological Conservation 44 (3) 201-212
--- 1989 Patterns of Plant Species Richness along Riverbanks Ecology 70 (1) 77-84 Peet R K 1974 The Measurement of Species Diversity Annual Review ofEcology and Systematics
5 285-307 Petraitis P S R E Latham and R A Niesenbaum 1989 The Maintenance of Species Diversity by
Disturbance Quarterly Review ofBiology 64 (4) 393-418 Raphael M J Feddema A J Orme and A R Orme 1995 The Unusual Storms ofFebruary1992 in
Southern California Physical Geography 15 (5) 442-464 Ricklefs R E and D Schluter eds 1993 Species Diversity in Ecological Communities Chicago Unishy
versity of Chicago Press Savage M 1994 Anthropocentric and Natural Disturbance and Patterns of Mortality in a Mixed
Forest in California Canadian Journal ofForest Research 24 ( 6) 1149-1159 --- 1997 The Role ofAnthropogenic Influences in a Mixed-Conifer Forest Mortality Episode
Journal ofVegetation Science 8 (1) 95-104 Savage M M Reid and T T Veblen 1992 Diversity and Disturbance in a Colorado Subalpine Forshy
est Physical Geography 13 (3) 240-249 Tabacchi E A-M Planty-Tabacchi and 0 Decamps 1990 Continuity and Discontinuity of the
Riparian Vegetation along a Pluvial Corridor Landscape Ecology 5 (1) 9-20 Vannote R L G W Minshall K W Cummins J R Sedell and C E Cushing 1980 The River Conshy
tinuum Concept Canadian Journal ofFisheries and Aquatic Sciences 37 (1) 130-137 White P S 1979 Pattern Process and Natural Disturbance in Vegetation Botanical Review 45 (3)
229-299
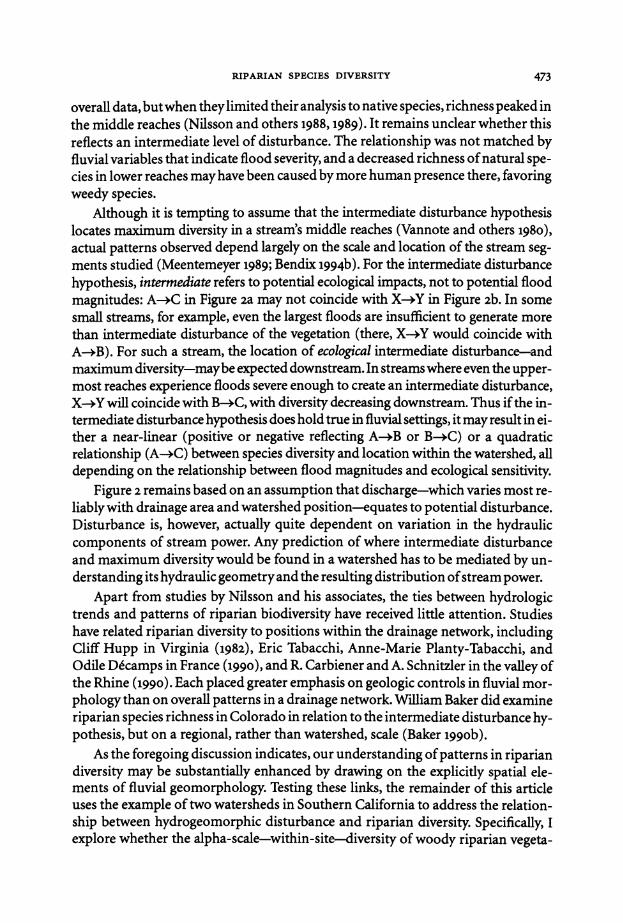
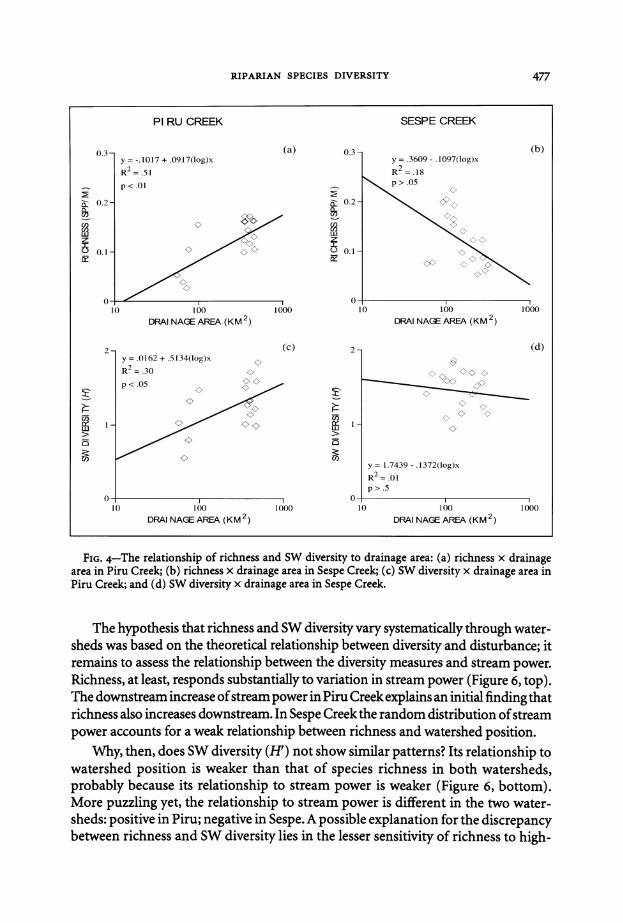
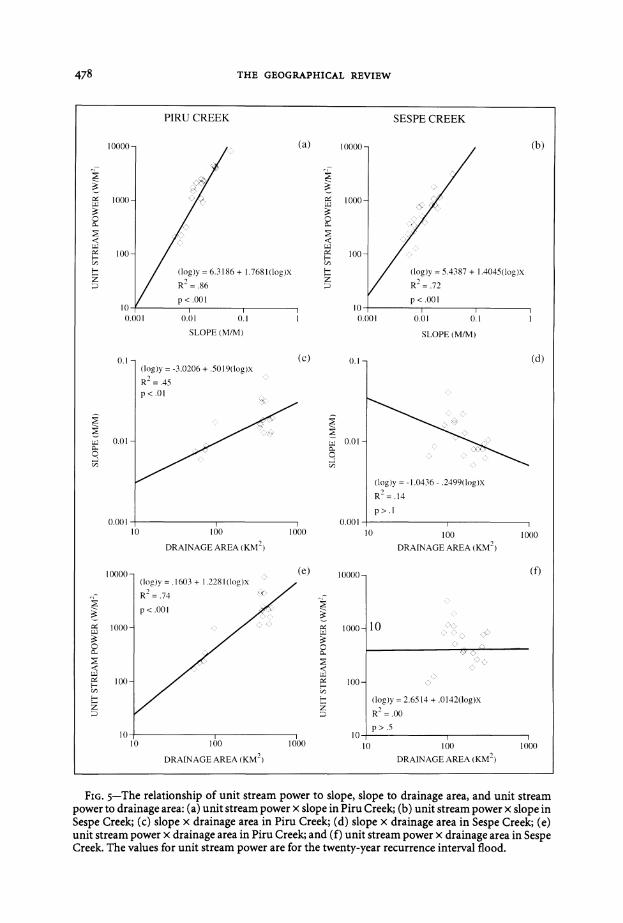
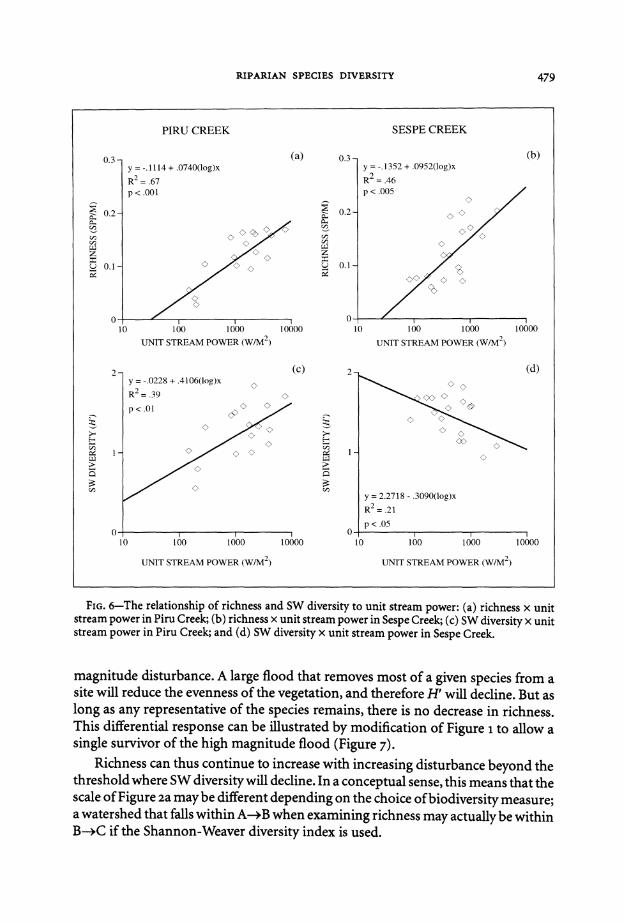
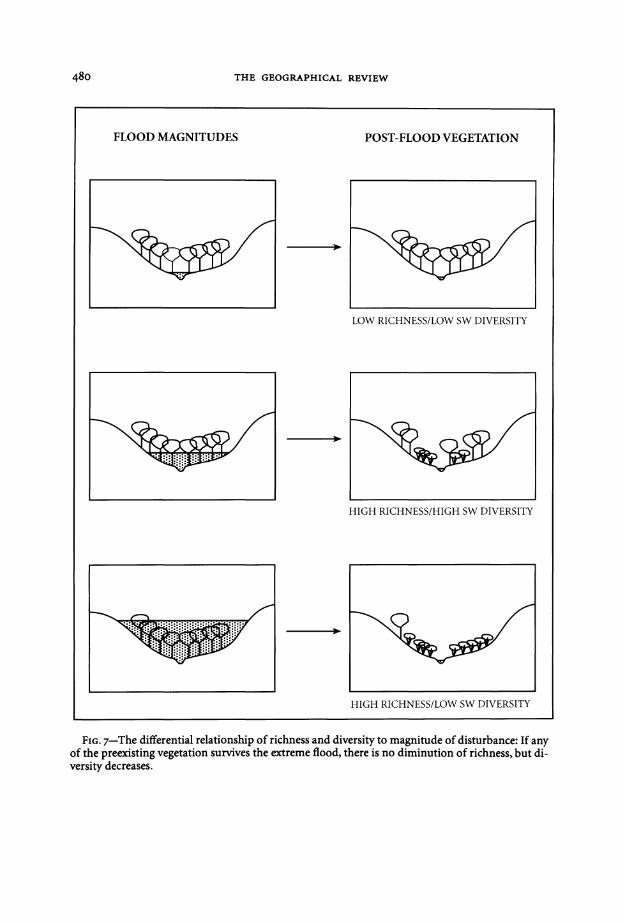
RIPARIAN SPECIES DIVERSITY
CONCLUSIONS
The first question set forth was whether species diversity is distributed systematically through the study watersheds These data suggest that it is with two qualifications One is that the relationship is more clearly seen ifspecies richness is the measure of diversity The other is that the relationship holds only if hydro logic conditions are also distributed systematically This is because yes also fits the second question Dishyversity-especially ifmeasured as richness-is indeed related to flood intensity Preshysumably these relationships would be better expressed in watersheds with purely alluvial channels where the expectations of hydraulic geometry would be fulfilled (Leopold and Maddock 1953)
Do the several complications encountered in this analysis imply that the theoshyretical expectations voiced for patterns ofriparian diversity are unsound Quite the contrary The data indicate that these concepts are useful but only ifapplied to a deshytailed understanding of the local context As with many other ecological relationshyships generalization is possible only to the degree that the underlying assumptions are met In this case there are multiple assumptions Some have been explicitly adshydressed here The floods routed through watersheds must conform to general hyshydrologic norms the range of hydrologic impacts in the watershed must at least partially coincide with the range of ecological vulnerability the measure of biodishyversity must not be overly sensitive Other questions that did not arise in this analysis also merit investigation with more extensive data sets How much is the patshytern of diversity affected by the variation of species composition through a watershyshed with its concomitant impact on disturbance vulnerability How sensitive are diversity patterns to the timing of disturbance in terms of both the length of time for pioneer species to arrive and the suitability ofenvironmental conditions for their establishment (Baker 199oa) And how important are interactions among multiple disturbance agents (Savage 1994 1997)
Despite the questions that remain the spatial relationships between hydrologic processes and disturbance-mediated biotic diversity offer intriguing insights into the spatial patterns ofdiversity And issues that remain suggest that there are abunshydant directions for future research in this area
NOTE
1 Because of the confluence of Lockwood Creek with Piru Creek (Figure 3) there is a notable discontinuity in the drainage area of the Piru Creek sites Consequently the regressions for Piru Creek with drainage area as the independent variable should be interpreted with particular caution because the separation of the data into two clusters may inflate the R2
REFERENCES
Bailey T L and RH Jahns 1954 Geology of the Transverse Range Province Southern California In Geology ofSouthern California edited by RH Jahns 83-106 San Francisco California Divishysion of Mines
Baker V R and JE Costa 1987 Flood Power In Catastrophic Flooding edited by L Mayer and D Nash 1-21 Boston Allen and Unwin
THE GEOGRAPHICAL REVIEW
Baker W L 1990a Climatic and Hydrologic Effects on the Regeneration of Populus Angustifolia James along the Animas River Colorado Journal ofBiogeography 17 (1) 59-73
--- 1990b Species Richness of Colorado Riparian Vegetation Journal of Vegetation Science 1 (1) 119-124
Bendix J 1994a Among-Site Variation in Riparian Vegetation of the Southern California Transshyverse Ranges American Midland Naturalist 132 (1) 136-151
--- 1994b Scale Direction and Pattern in Riparian Vegetation-Environment Relationships Annals of the Association ofAmerican Geographers 84 (4) 652-665
--- In press Stream Power Influence on Southern Californian Riparian Vegetation Journal of Vegetation Science
Borchert M 1990 Interview with the author Goleta Calif July Canfield RH 1941 Application of the Line Intercept Method in Sampling Range VegetationJourshy
nal ofForestry 39 (4) 388-394 Carbiener R and A Schnitzler 1990 Evolution ofMajor Pattern Models and Processes ofAlluvial
Forest of the Rhine in the Rift Valley (FranceGermany) Vegetatio 88 (2) 115-129 Connell J H 1978 Diversity in Tropical Rain Forests and Coral Reefs Science199 (4335 ) 1302-1310 Decamps H and E Tabacchi 1994 Species Richness in Vegetation along River Margins In Aquatic
Ecology Scale Pattern and Process edited by P S GillerA G Hildrew and D G Raffaelli 1-20 London Cambridge Scientific Publications
Dunne T and LB Leopold 1978 Water in Environmental Planning San Francisco W H Freeman Ehrlich PR and E 0 Wilson 1991 Biodiversity Studies Science and Policy Science 253 (5021)
758-762 Franklin J F 1993 Preserving Biodiversity Species Ecosystems or Landscapes Ecological Applicashy
tions 3 (2) 202-205 Graf W L 1983 Downstream Changes in Stream Power in the Henry Mountains Utah Annals of
the Association ofAmerican Geographers 73 (3) 373-387 Greig-Smith P 1983 Quantitative Plant Ecology 3d ed Berkeley University of California Press Griffith D A and C G Amrhein 1991 Statistical Analysis for Geographers Englewood Cliffs NJ
Prentice Hall Grubb P J 1977 The Maintenance of Species-Richness in Plant Communities The Importance of
the Regeneration Niche Biological Reviews 52 (1) 107-145 Hobbs R J and L F Huenneke 1992 Disturbance Diversity and Invasion Implications for Conshy
servation Conservation Biology 6 (3) 324-337 Hughes F M R 1990 The Influence ofFlooding Regimes on Forest Distribution and Composition
in the Tana River Floodplain Kenya Journal ofApplied Ecology 27 (2) 475-491 Hupp CR 1982 Stream-Grade Variation and Riparian-Forest Ecology along Passage Creek Virshy
ginia Bulletin of the Torrey Botanical Club 109 (4) 488-499 --- 1988 Plant Ecological Aspects of Flood Geomorphology and Paleotlood History In Flood
Geomorphology edited by V R Baker R C Kochel and P C Patton 335-356 New York John Wiley and Sons
Leopold LB and T Maddock Jr 1953 The Hydraulic Geometry of Stream Channels and Some Physiographic Implications US Geological Survey Professional Paper 252 Washington DC US Geological Survey
Leopold LB and JP Miller 1956 Ephemeral Streams-Hydraulic Factors and Their Relation to the Drainage Net US Geological Survey Professional Paper 282-A Washington DC US Geologishycal Survey
Leopold LB M G Wolman and JP Miller 1964 Pluvial Processes in Geomorphology San Franshycisco W H Freeman
Loucks 0 L 1970 Evolution of Diversity Efficiency and Community Stability American Zoologist 10 (1) 17-25
Magilligan F J 1992 Thresholds and the Spatial Variability ofFlood Power during Extreme Floods Geomorphology 5 (3-5) 373-390
Malanson G P 1984 Intensity as a Third Factor ofDisturbance Regime and Its Effect on Species Dishyversity Oikos 43 (3) 411-413
--- 1993 Riparian Landscapes New York Cambridge University Press Malanson G P and DR Butler 1990 Woody Debris Sediment and Riparian Vegetation ofa Subshy
alpine River Montana USA Arctic and Alpine Research 22 (2) 183-194
RIPARIAN SPECIES DIVERSITY
Meentemeyer V 1989 Geographical Perspectives of Space Time and Scale Landscape Ecology 3 (3-4) 163-173
Merrill WR 1954 Geology ofthe Sespe Creek-Pine Mountain Area Ventura County In Geology of Southern California edited by R H Jahns map sheet 3 San Francisco California Division of Mines
Naiman R J H Decamps and M Pollock 1993 The Role of Riparian Corridors in Maintaining Regional Biodiversity Ecological Applications 3 (2) 209-212
Nilsson C R Jansson and U Zinko 1997 Long-Term Responses of River-Margin Vegetation to Water-Level Regulation Science 276 (5313) 798-801
Nilsson C G Grelsson M Johansson and U Sperens 1988 Can Rarity and Diversity Be Predicted in Vegetation along River Banks Biological Conservation 44 (3) 201-212
--- 1989 Patterns of Plant Species Richness along Riverbanks Ecology 70 (1) 77-84 Peet R K 1974 The Measurement of Species Diversity Annual Review ofEcology and Systematics
5 285-307 Petraitis P S R E Latham and R A Niesenbaum 1989 The Maintenance of Species Diversity by
Disturbance Quarterly Review ofBiology 64 (4) 393-418 Raphael M J Feddema A J Orme and A R Orme 1995 The Unusual Storms ofFebruary1992 in
Southern California Physical Geography 15 (5) 442-464 Ricklefs R E and D Schluter eds 1993 Species Diversity in Ecological Communities Chicago Unishy
versity of Chicago Press Savage M 1994 Anthropocentric and Natural Disturbance and Patterns of Mortality in a Mixed
Forest in California Canadian Journal ofForest Research 24 ( 6) 1149-1159 --- 1997 The Role ofAnthropogenic Influences in a Mixed-Conifer Forest Mortality Episode
Journal ofVegetation Science 8 (1) 95-104 Savage M M Reid and T T Veblen 1992 Diversity and Disturbance in a Colorado Subalpine Forshy
est Physical Geography 13 (3) 240-249 Tabacchi E A-M Planty-Tabacchi and 0 Decamps 1990 Continuity and Discontinuity of the
Riparian Vegetation along a Pluvial Corridor Landscape Ecology 5 (1) 9-20 Vannote R L G W Minshall K W Cummins J R Sedell and C E Cushing 1980 The River Conshy
tinuum Concept Canadian Journal ofFisheries and Aquatic Sciences 37 (1) 130-137 White P S 1979 Pattern Process and Natural Disturbance in Vegetation Botanical Review 45 (3)
229-299