Flood Control and Management Manual ACKNOWLEDGEMENT
190
Transcript of Flood Control and Management Manual ACKNOWLEDGEMENT


Flood Control and Management Manual ACKNOWLEDGEMENT
WECS A
ACKNOWLEDGEMENT
The Joint Venture of PRECAR (P) Ltd. and SAP (P) Ltd. would like to express their sincere gratitude to the Water
and Energy Commission Secretariat (WECS) for entrusting the responsibility of Preparing River Training Manual
for Nepal.
We would like to express our sincere thanks to all the officers of DWIDM Division Offices, Irrigation Project
Offices and People‘s Embankment Program Offices for their cooperation, support, providing data and
information, guiding in the fields, and supporting in logistics.
Thanks are also due to the beneficiaries of all the case study sites, who were very helpful and informative during
the fieldwork and interaction meetings.
The Consultants are also thankful to the staff of PRECAR and SAP, whose tireless efforts were instrumental for
the timely completion of this Flood Control and Management Manual.
PRECAR (P) Ltd and SAP (P) Ltd
Kathmandu, Nepal
June, 2019


Flood Control and Management Manual FOREWORD
WECS B
FOREWORD
Nepal has more than 6,000 rivers and rivulets flowing through a tectonically unstable geology. Seventy five to
eighty percent of the annual rainfall occurs during the four months of monsoon (June-September) greatly
increasing the flow in these rivers. Poor geological formation in one hand and increased flow on the other hand
has made the situation even more vulnerable for the people living nearby these rivers. Every year, during the
monsoon season, most of the rivers pose great threat to such people and sometimes cause widespread damage
to the life and property.
The problems are not the same everywhere. In the hills, these rivers erode their banks triggering massive
landslides at some places. In the plains there are three types of problems (i) River bank erosion causing damage
to a vast area of agricultural lands and settlements. (ii) Flooding caused by overbank flow causing widespread
inundation in the nearby settlement and (iii) Combination of (i) and (ii) both. Experience has shown that flood and
riverbank erosion are two dominating factors restricting the development in these flood plains. The cause for both
is largely beyond human influence and man can only mitigate their negative effects.
People, who are engaged in the field of river training and river management, need to have thorough knowledge of
river behavior and on its basis professional acumen to devise solutions to control the rivers. These solutions also
need to be economical and sustainable, in terms of both initial investment and recurring maintenance cost.
Water and Emery Commission Secretariat has made an effort to prepare a manual for the professionals, who are
engaged in the field of river training. Considering the new organizational set up of the government viz. federal,
provincial and local, this manual will serve as a standard National Manual of the subject and thus greatly help
maintain uniformity in planning, design and implementation of works across all government and other agencies
involved in river training related works.
WECS would like to thank all those who have worked hard to prepare this manual and hope that this manual
would become a ready reference for all those working in the field of river training and river management. We also
seek comments and suggestions from academia and practicing engineers in order to update the Manual in
coming years.
Secretary
WECS


Flood Control and Management Manual ACRONYMS
WECS C
ACRONYMS
AAB
AAD
ASTM
B|C
BS
:
:
:
:
:
Average Annual Benefit
Average Annual Damage
American Society for Testing and Materials
Benefit Cost Ratio
British Standards
CNDRC : Central Natural Disaster Relief Committee
DHM : Department of Hydrology and Meteorology
DoFSC
EIA
:
:
Department of Forest and Soil Conservation
Environmental Impact Assessment
EIRR
EN
EPR
:
:
:
Economic Internal Rate of Return
European Norm
Environment Protection Regulation
Fr
GLOF
:
:
Froude number
Glacier Lake Outburst Flood
GON
GVSF
GVUSF
HEC-RAS
HFL
HGL
IEE
:
:
:
:
:
:
:
Government of Nepal
Gradually Varied Steady Flow
Gradually Varied Unsteady Flow
Hydrologic Engineering Center - River Analysis System
High Flood Level
Hydraulic Gradient Line
Initial Environmental Examination
IS
ISO
:
:
Indian Standards
International Organization for Standardization
JICA : Japan International Cooperation Agency
MBT
MCT
MFT
:
:
:
Main Boundary Thrust
Main Central Thrust
Main Frontal Thrust
MWL : Mean Water Level
NPW : Net Present Worth
NRCS
NS
:
:
Natural Resources Conservation Service
Nepal Standards
Re : Reynolds number
SCF
SCS
STD
SWG
THZ
:
:
:
:
:
:
Standard Conversion Factor
Soil Conservation Service
South Tibetan Detachment
Standard Wire Gauge
Tethys Himalayan Zone
UDFCD
USBR
VAT
:
:
:
Urban Drainage and Flood Control District
United States Bureau of Reclamation
Value Added Tax
WECS : Water and Energy Commission Secretariat
WRI : Water Resources and Irrigation


Flood Control and Management Manual TABLE OF CONTENTS
WECS D
TABLE OF CONTENTS
ACKNOWLEDGEMENT ....................................................................................................................................................................................... A
FOREWORD ......................................................................................................................................................................................................... B
ACRONYMS .......................................................................................................................................................................................................... C
TABLE OF CONTENTS ........................................................................................................................................................................................ D
LIST OF FIGURES ................................................................................................................................................................................................ H
LIST OF TABLES .................................................................................................................................................................................................. I
LIST OF APPENDICES ........................................................................................................................................................................................ J
1 INTRODUCTION ............................................................................................................................................................. 1-1
1.1 BACKGROUND ................................................................................................................................................................................. 1-1 1.2 ASSUMPTIONS AND LIMITATIONS OF THE MANUAL ................................................................................................................................. 1-1 1.3 LAYOUT OF THE MANUAL ................................................................................................................................................................... 1-2
2 PLANNING, SURVEY AND DESIGN FOR FLOOD CONTROL PROJECTS ................................................................. 2-1
2.1 NECESSITY OF FLOOD CONTROL AND RIVER BANK EROSION CONTROL PLAN .................................................................................................. 2-1 2.2 DIFFERENT PHASES OF FLOOD CONTROL PLAN ........................................................................................................................................ 2-1
2.2.1 Master Plan ............................................................................................................................................................................. 2-1 2.2.2 Feasibility Study ...................................................................................................................................................................... 2-2 2.2.3 Flood Control Project Implementation Plan /Detailed Engineering Design and Implementation............................................. 2-2 2.2.4 Plan revision in course of implementation ............................................................................................................................... 2-2
2.3 SEQUENTIAL STEPS IN FLOOD CONTROL PLANNING: .................................................................................................................................. 2-3 2.4 SURVEY AND INVESTIGATION FOR ACQUIRING DATA ................................................................................................................................. 2-3
2.4.1 Topographical Survey ............................................................................................................................................................. 2-3 2.4.2 Control Survey ......................................................................................................................................................................... 2-4 2.4.3 River Profile Survey ................................................................................................................................................................. 2-4
2.4.3.1 Cross Section Survey ..................................................................................................................................................... 2-4 2.4.3.2 Longitudinal Section Survey: ......................................................................................................................................... 2-5
2.4.4 Material Survey ....................................................................................................................................................................... 2-6 2.4.5 Hydrological Survey: ............................................................................................................................................................... 2-7 2.4.6 Environmental Study ............................................................................................................................................................... 2-7 2.4.7 Social Impact Assessment ..................................................................................................................................................... 2-8 2.4.8 Historical data/information on flood damage ........................................................................................................................ 2-8 2.4.9 Post-Construction Survey ........................................................................................................................................................ 2-8 2.4.10 Layout master Plan.................................................................................................................................................................. 2-9
3 HYDROLOGICAL ASSESSMENT .................................................................................................................................. 3-1
3.1 BACKGROUND ................................................................................................................................................................................. 3-1 3.2 DESIGN FLOOD RETURN PERIOD ........................................................................................................................................................... 3-1 3.3 CALCULATION OF DESIGN FLOOD .......................................................................................................................................................... 3-2
3.3.1 For gauged rivers .................................................................................................................................................................... 3-2 3.3.2 F or ungauged rivers ............................................................................................................................................................... 3-2
3.3.2.1 Method of Transposition: .............................................................................................................................................. 3-2 3.3.2.2 Empirical Methods: ....................................................................................................................................................... 3-3 3.3.2.3 Flood Marks-based Method .......................................................................................................................................... 3-5 3.3.2.4 Hydrologic Modeling ..................................................................................................................................................... 3-6
3.4 FIXING DESIGN DISCHARGE ................................................................................................................................................................ 3-7
4 RIVER MORPHOLOGICAL STUDY ................................................................................................................................ 4-1
4.1 GENERAL GEOLOGY OF NEPAL ............................................................................................................................................................ 4-1 4.2 RIVER BEHAVIOR .............................................................................................................................................................................. 4-1
4.2.1 River Channel Patterns ........................................................................................................................................................... 4-1 4.2.2 Bed forms ................................................................................................................................................................................ 4-3
4.3 CHANNEL GEOMETRY ........................................................................................................................................................................ 4-3 4.3.1 Theoretical Equations .............................................................................................................................................................. 4-4 4.3.2 Empirical Equations ................................................................................................................................................................. 4-4
4.4 CLASSIFICATION OF RIVER ................................................................................................................................................................... 4-4 4.5 INSTABILITY OF RIVERS ...................................................................................................................................................................... 4-5
5 RIVER HYDRAULICS ..................................................................................................................................................... 5-1
5.1 RIVER HYDRAULICS ........................................................................................................................................................................... 5-1 5.2 TYPES OF FLOWS .............................................................................................................................................................................. 5-1
5.2.1 Steady flow vs unsteady flow: ................................................................................................................................................. 5-1 5.2.2 Uniform flow vs non-uniform flow: ........................................................................................................................................... 5-1 5.2.3 Gradually varied flow ............................................................................................................................................................... 5-1 5.2.4 Rapidly varied flow: ................................................................................................................................................................. 5-1
5.3 FLOW REGIMES ............................................................................................................................................................................... 5-1

Flood Control and Management Manual TABLE OF CONTENTS
WECS E
5.4 METHODS FOR FLOOD ROUTING .......................................................................................................................................................... 5-2 5.5 METHODS OF HYDRAULIC ANALYSIS ..................................................................................................................................................... 5-2
6 DESIGN CRITERIA AND PROCEDURES ...................................................................................................................... 6-1
6.1 STRUCTURAL MEASURES FOR RIVER CONTROL ........................................................................................................................................ 6-1 6.2 DESIGN CRITERIA ............................................................................................................................................................................. 6-1
6.2.1 Design Discharge .................................................................................................................................................................... 6-1 6.2.2 Flow Velocity ........................................................................................................................................................................... 6-1 6.2.3 High Flood Level ..................................................................................................................................................................... 6-2 6.2.4 Manning Roughness Coefficient ............................................................................................................................................. 6-2 6.2.5 Waterway................................................................................................................................................................................. 6-2 6.2.6 Scour Magnitude ..................................................................................................................................................................... 6-3 6.2.7 Sediment ................................................................................................................................................................................. 6-4
6.3 DESIGN OF FLOOD EMBANKMENT ........................................................................................................................................................ 6-4 6.3.1 Alignment and Spacing ........................................................................................................................................................... 6-4 6.3.2 Length of the embankment: ..................................................................................................................................................... 6-5 6.3.3 Height ...................................................................................................................................................................................... 6-5
6.3.3.1 Design High Flood Level ................................................................................................................................................. 6-5 6.3.3.2 Free board ..................................................................................................................................................................... 6-5
6.3.4 Top Width ................................................................................................................................................................................ 6-5 6.3.5 Hydraulic Gradient ................................................................................................................................................................... 6-5 6.3.6 Side Slope ............................................................................................................................................................................... 6-5 6.3.7 Slope Surface Protection Works ............................................................................................................................................. 6-6 6.3.8 Borrow Areas ........................................................................................................................................................................... 6-6 6.3.9 Drainage .................................................................................................................................................................................. 6-7 6.3.10 Safety Measures in Design ..................................................................................................................................................... 6-7 6.3.11 Anti-flood Sluices ..................................................................................................................................................................... 6-7 6.3.12 Stability Analysis for High Embankments ................................................................................................................................ 6-7 6.3.13 Bank Protection Works ............................................................................................................................................................ 6-9
6.4 DESIGN OF REVETMENT ..................................................................................................................................................................... 6-9 6.4.1 Design Criteria for Revetment ............................................................................................................................................... 6-10
6.4.1.1 Location and Alignment .............................................................................................................................................. 6-11 6.4.1.2 Design Height .............................................................................................................................................................. 6-11 6.4.1.3 Segment Length ........................................................................................................................................................... 6-11
6.4.2 Loose Stone Pitching ............................................................................................................................................................ 6-11 6.4.2.1 Size of Stone ................................................................................................................................................................ 6-11 6.4.2.2 Thickness of Pitching stone ......................................................................................................................................... 6-12
6.4.3 Gabion revetment .................................................................................................................................................................. 6-13 6.4.4 Filter ....................................................................................................................................................................................... 6-13 6.4.5 Pilarczyk’s Current Attack Equation ...................................................................................................................................... 6-13 6.4.6 Toe Protection ....................................................................................................................................................................... 6-15
6.5 ANTI-FLOOD SLUICE ....................................................................................................................................................................... 6-15 6.5.1 Fixation of FSL at Outfall ....................................................................................................................................................... 6-16 6.5.2 Capacity /design discharge ................................................................................................................................................... 6-16
6.5.2.1 Runoff Estimation from bunded areas ........................................................................................................................ 6-16 6.5.3 Design Considerations: ......................................................................................................................................................... 6-17
6.6 DESIGN OF FLOOD WALLS ................................................................................................................................................................. 6-18 6.6.1 Lateral and Vertical forces ..................................................................................................................................................... 6-18 6.6.2 Flood wall Design .................................................................................................................................................................. 6-20
6.6.2.1 General Dimensioning of Wall Geometry .................................................................................................................... 6-20 6.6.2.2 Design Steps ................................................................................................................................................................ 6-21 6.6.2.3 Combination of Loads .................................................................................................................................................. 6-22 6.6.2.4 Factor of safety against Sliding .................................................................................................................................... 6-22 6.6.2.5 Factor of safety against over turning ........................................................................................................................... 6-22 6.6.2.6 Eccentricity of resultant forces: ................................................................................................................................... 6-23 6.6.2.7 Minimum and maximum Pressure at the Toe and Heel .............................................................................................. 6-23 6.6.2.8 Steps in Design of Reinforced Section of a Cantilever Wall ......................................................................................... 6-23
6.7 DESIGN OF SPURS (GROYNES) AND STUDS ........................................................................................................................................... 6-24 6.7.1 Function: ................................................................................................................................................................................ 6-24 6.7.2 Design Approach for Spurs ................................................................................................................................................... 6-24 6.7.3 Classification of Spurs ........................................................................................................................................................... 6-24 6.7.4 General Features .................................................................................................................................................................. 6-25
6.7.4.1 Location and Length: ................................................................................................................................................... 6-25 6.7.4.2 Orientation: ................................................................................................................................................................. 6-25 6.7.4.3 Spur Height .................................................................................................................................................................. 6-25 6.7.4.4 Spacing: ....................................................................................................................................................................... 6-26 6.7.4.5 Spur Crest Profile ......................................................................................................................................................... 6-26 6.7.4.6 Channel bed and bank embedment ............................................................................................................................ 6-26
6.7.5 Design of Impermeable Spurs ............................................................................................................................................... 6-26 6.7.5.1 Top width: ................................................................................................................................................................... 6-26 6.7.5.2 Side Slopes: ................................................................................................................................................................. 6-26 6.7.5.3 Size and weight of stone for pitching: ......................................................................................................................... 6-26
Flood Control and Management Manual TABLE OF CONTENTS
WECS F
6.7.5.4 Thickness of Pitching: .................................................................................................................................................. 6-26 6.7.5.5 Launching apron .......................................................................................................................................................... 6-26
6.7.6 Sloping Spurs ........................................................................................................................................................................ 6-27 6.8 BED CONTROL STRUCTURES .............................................................................................................................................................. 6-29
6.8.1 Design of Check dams .......................................................................................................................................................... 6-29 6.8.1.1 Spacing ........................................................................................................................................................................ 6-29 6.8.1.2 Design Runoff Estimation ............................................................................................................................................ 6-30 6.8.1.3 Foundation depth ........................................................................................................................................................ 6-30 6.8.1.4 Scour depth ................................................................................................................................................................. 6-30 6.8.1.5 Structural stability of Check dam ................................................................................................................................ 6-31
6.8.2 Sabo Dam.............................................................................................................................................................................. 6-31 6.8.2.1 Design Procedure: ....................................................................................................................................................... 6-31 6.8.2.2 Design considerations ................................................................................................................................................. 6-31 6.8.2.3 Design parameters of the debris flow ......................................................................................................................... 6-32 6.8.2.4 Designing the open section ......................................................................................................................................... 6-32 6.8.2.5 Design of the dam body and foundation ..................................................................................................................... 6-32 6.8.2.6 Sub-sabo dam .............................................................................................................................................................. 6-32
6.8.3 Sills / Bed bars....................................................................................................................................................................... 6-32 6.8.3.1 Height .......................................................................................................................................................................... 6-32
6.9 DESIGN OF STABLE CHANNEL ............................................................................................................................................................. 6-33 6.9.1 Channel lining ........................................................................................................................................................................ 6-33 6.9.2 Design of rigid boundary channels ........................................................................................................................................ 6-33 6.9.3 Design of Non-Scouring Erodible Boundary Channels ......................................................................................................... 6-34 6.9.4 Alluvial Channels: .................................................................................................................................................................. 6-34 6.9.5 Design of an Artificial Cut-off ................................................................................................................................................. 6-35
6.10 GUIDELINES FOR FLOOD CUSHION IN MULTIPURPOSE RESERVOIR PROJECTS; .................................................................................................. 6-36 6.10.1 General Definition of storage zones in Reservoirs ................................................................................................................ 6-36 6.10.2 Retarding Basin or Detention Dam ........................................................................................................................................ 6-37 6.10.3 Basis for Fixation of Flood Storage Level or MWL of Dams .................................................................................................. 6-37
6.11 DESIGN OF GUIDE BANKS ................................................................................................................................................................. 6-38 6.11.1 General Principles ................................................................................................................................................................. 6-38 6.11.2 Width between guide Bunds .................................................................................................................................................. 6-39 6.11.3 Length of Guide Bunds .......................................................................................................................................................... 6-39
6.11.3.1 Upstream Length .................................................................................................................................................... 6-39 6.11.3.2 Downstream Length ................................................................................................................................................ 6-40 6.11.3.3 Curved head and tail of Guide Bunds ...................................................................................................................... 6-40
6.11.4 Sweep Angle of Guide Bund ................................................................................................................................................. 6-40 6.11.5 Design considerations ........................................................................................................................................................... 6-40
6.11.5.1 Material ................................................................................................................................................................... 6-40 6.11.5.2 Top width of guide bund ......................................................................................................................................... 6-40 6.11.5.3 Side slopes of guide bund ....................................................................................................................................... 6-41 6.11.5.4 Free board for Guide Bund ..................................................................................................................................... 6-41 6.11.5.5 Stone for pitching .................................................................................................................................................... 6-41 6.11.5.6 Provision of filter ..................................................................................................................................................... 6-41 6.11.5.7 Launching Apron (Toe Protection) .......................................................................................................................... 6-41 6.11.5.8 Afflux Bund .............................................................................................................................................................. 6-42
6.12 SUBMERGED VANES ........................................................................................................................................................................ 6-42
7 CONSTRUCTION MATERIALS AND TECHNOLOGY ................................................................................................... 7-1
7.1 LOCAL AND COMMUNITY INVOLVED CONSTRUCTION METHOD AND MATERIALS ............................................................................................. 7-1 7.2 MODERN AND AGENCY INVOLVED CONSTRUCTION METHOD AND MATERIALS ............................................................................................... 7-2
7.2.1 Gabions or gabion mattresses ................................................................................................................................................ 7-2 7.2.2 Methods of Gabion Construction: ............................................................................................................................................ 7-3 7.2.3 Concrete Blocks ...................................................................................................................................................................... 7-5
7.2.3.1 Design Procedure for Concrete Blocks .......................................................................................................................... 7-5 7.2.4 Geosynthetics .......................................................................................................................................................................... 7-6
7.2.4.1 Geotextiles .................................................................................................................................................................... 7-6 7.2.5 Porcupines............................................................................................................................................................................... 7-9
7.3 EMERGENCY CONSTRUCTION MATERIALS AND TECHNIQUES ...................................................................................................................... 7-11 7.3.1 Soil And Sand Bags .............................................................................................................................................................. 7-11 7.3.2 Methods of Sand Bagging ..................................................................................................................................................... 7-11
7.3.2.1 Filling Sandbags ........................................................................................................................................................... 7-11 7.3.2.2 Placing Sandbags ......................................................................................................................................................... 7-12
7.3.3 Nylon boxes and old tires ...................................................................................................................................................... 7-12 7.3.4 Permeable spurs ................................................................................................................................................................... 7-12 7.3.5 Bamboo Piling for Fencing .................................................................................................................................................... 7-13 7.3.6 Multi-tier Jack Jetty ................................................................................................................................................................ 7-13 7.3.7 Tube wall Flood Barrier ......................................................................................................................................................... 7-14 7.3.8 Water-Gate Self-Inflating Barrier ........................................................................................................................................... 7-14 7.3.9 Wood & Boulders for Bank Protection ................................................................................................................................... 7-15
8 BIOENGINEERING WORK ............................................................................................................................................. 8-1

Flood Control and Management Manual TABLE OF CONTENTS
WECS G
8.1 BIOENGINEERING TECHNIQUES ............................................................................................................................................................ 8-1 8.1.1 Bush-mattress construction with wood pegs ........................................................................................................................... 8-1 8.1.2 Wattle fences (wicker) ............................................................................................................................................................. 8-1 8.1.3 Log Brush Barrier .................................................................................................................................................................... 8-2 8.1.4 Fascines (bush wattles) ........................................................................................................................................................... 8-2 8.1.5 Vegetated gabions .................................................................................................................................................................. 8-2
8.2 VEGETATION FOR BANK / SLOPE PROTECTION ........................................................................................................................................ 8-3 8.2.1 Sod facing (turfing) .................................................................................................................................................................. 8-3 8.2.2 Vetiver ..................................................................................................................................................................................... 8-3
8.3 MAINTENANCE OF VEGETATION .......................................................................................................................................................... 8-4 8.3.1 Initial Care ............................................................................................................................................................................... 8-4
8.3.1.1 Fertilization.................................................................................................................................................................... 8-4 8.3.1.2 Irrigation ........................................................................................................................................................................ 8-4 8.3.1.3 Soil cultivation and soil improvement ........................................................................................................................... 8-4 8.3.1.4 Care for trees and bushes ............................................................................................................................................. 8-4
9 FLOODPLAIN MANAGEMENT....................................................................................................................................... 9-1
9.1 NON STRUCTURAL METHODS FOR FLOODPLAIN MANAGEMENT .................................................................................................................. 9-1 9.1.1 General .................................................................................................................................................................................... 9-1 9.1.2 Enforcement of Floodplain Zoning regulation .......................................................................................................................... 9-1 9.1.3 Flood Plain Zoning................................................................................................................................................................... 9-1 9.1.4 Pre-Requisites For The Enforcement Of Floodplain Zoning ................................................................................................... 9-2 9.1.5 Regulation of Land Use in Flood Prone Areas ........................................................................................................................ 9-2 9.1.6 Categorization and Prioritization of Structures in Flood Plains Zoning .................................................................................. 9-2 9.1.7 Disaster insurance / relief Fund ............................................................................................................................................... 9-3 9.1.8 The Tax adjustment ................................................................................................................................................................. 9-3 9.1.9 Flood Forecasting and Early Warning System ........................................................................................................................ 9-3 9.1.10 Frequency of Flood Warnings ................................................................................................................................................. 9-4 9.1.11 Devising Public Awareness ..................................................................................................................................................... 9-4 9.1.12 Combination of structural and Non Structural Methods ........................................................................................................... 9-5
9.1.12.1 Flood fighting ............................................................................................................................................................ 9-5 9.1.12.2 Flood Proofing ........................................................................................................................................................... 9-5
10 EMERGENCY FLOOD MANAGEMENT ................................................................................................................... 10-1
10.1 EXISTING PRACTICES ....................................................................................................................................................................... 10-1 10.2 PREPAREDNESS FOR FLOOD DISASTER ................................................................................................................................................. 10-1 10.3 RESPONSE, EVACUATION AND RELIEF OPERATION .................................................................................................................................. 10-2
10.3.1 Emergency Response: .......................................................................................................................................................... 10-2 10.3.2 Post Event Response ............................................................................................................................................................ 10-3 10.3.3 Evacuation ............................................................................................................................................................................. 10-3 10.3.4 Relief And Recovery Measures ............................................................................................................................................. 10-3
10.4 REPAIR AND MAINTENANCE OF FLOOD CONTROL STRUCTURES ................................................................................................................. 10-4 10.4.1 Routine Inspection and Testing ............................................................................................................................................. 10-4 10.4.2 Routine Maintenance Measure ............................................................................................................................................. 10-4
10.4.2.1 Maintenance of Embankment for Rise of River Bed: .............................................................................................. 10-5 10.4.3 Non-Routine Maintenance ..................................................................................................................................................... 10-5 10.4.4 Aesthetic treatment maintenance .......................................................................................................................................... 10-5 10.4.5 Emergency Maintenance ....................................................................................................................................................... 10-5 10.4.6 Training Function and Training Responsibilities .................................................................................................................... 10-5
10.5 FLOOD FIGHTING ........................................................................................................................................................................... 10-6 10.5.1 Preparedness for Flood Fighting ........................................................................................................................................... 10-6 10.5.2 Flood Fighting Measures: ...................................................................................................................................................... 10-6
10.5.2.1 Ring Bund for Sand Boiling ...................................................................................................................................... 10-6 10.5.2.2 Closer ring Bund for Checking Embankment Breach ............................................................................................... 10-7 10.5.2.3 Embankment Overtopping: ..................................................................................................................................... 10-7 10.5.2.4 Embankment Toe failure by Scouring River Bed ..................................................................................................... 10-8
11 EVALUATION ............................................................................................................................................................ 11-1
11.1 COST ESTIMATION .......................................................................................................................................................................... 11-1 11.2 BENEFITS ASSESSMENT .................................................................................................................................................................... 11-1
11.2.1 Estimation of Flood Damages ............................................................................................................................................... 11-2 11.2.2 Summarized Steps to Estimate Damages Avoided (Benefits) .............................................................................................. 11-3
11.3 ECONOMIC ANALYSIS ...................................................................................................................................................................... 11-4 11.3.1 Assumptions .......................................................................................................................................................................... 11-4 11.3.2 Discounting ............................................................................................................................................................................ 11-4 11.3.3 Standard Conversion Factor ................................................................................................................................................. 11-5
11.4 ECONOMIC INDICATORS ................................................................................................................................................................... 11-5 11.4.1 Net Present Worth (NPW) ..................................................................................................................................................... 11-6 11.4.2 Economic Internal Rate of Return (EIRR) ............................................................................................................................. 11-6 11.4.3 Benefit Cost Ratio (B/C) ........................................................................................................................................................ 11-6 11.4.4 Decision Criteria .................................................................................................................................................................... 11-6
11.5 SENSITIVITY ANALYSIS ...................................................................................................................................................................... 11-7
REFERENCES ............................................................................................................................................................................ I

Flood Control and Management Manual TABLE OF CONTENTS
WECS H
LIST OF FIGURES
Figure 2-1: Typical Cross Section of River .............................................................................................................................. 2-5 Figure 2-2 : Typical L- Section of a river plotted after feasibility stage survey ...................................................................... 2-6 Figure 3-1: Schematic diagram of possible water levels on a river channel. .......................................................................... 3-1 Figure 3-2: Different methods for assessment of design flood ............................................................................................... 3-2 Figure 3-3: Specific discharge at different return periods. ...................................................................................................... 3-4 Figure 4-1: Straight river reach ............................................................................................................................................... 4-1 Figure 4-2: Braided Rivers with gravel bars ............................................................................................................................ 4-1 Figure 4-3 : Circular shape of a meander curve ...................................................................................................................... 4-2 Figure 4-4: Sinusoidal Shape of a meander curve ................................................................................................................... 4-2 Figure 4-5 : Meander Characteristics ...................................................................................................................................... 4-2 Figure 4-6: Meandering River .................................................................................................................................................. 4-3 Figure 4-7 : Different Types of Bed Forms ............................................................................................................................... 4-3 Figure 6-1: Definition sketch for calculation of scour depth for gravel bed river & alluvial river bed ................................... 6-3 Figure 6-2 Typical Cross Section of a homogeneous Embankment ....................................................................................... 6-6 Figure 6-3 Typical Cross Section of a Zoned Embankment ...................................................................................................... 6-6 Figure 6-4: Flow Chart for Design of an Embankment .................................................................................................. 6-9 Figure 6-5: Components of Revetment ................................................................................................................................. 6-10 Figure 6-6: Images of typical flood sluices (ungated ) in Karnali embankment and gated flap valve in Kamala Embankment. ............... 6-16 Figure 6-7: Types of Flood walls ........................................................................................................................................... 6-18 Figure 6-8: Typical Loads or Forces acting on Flood Walls .................................................................................................... 6-18 Figure 6-9: Typical Section of Retaining wall / Flood wall .................................................................................................... 6-20 Figure 6-10: Loading on Cantilever Wall with shear key ....................................................................................................... 6-21 Figure 6-11: Typical Layout of Spurs in group ....................................................................................................................... 6-24 Figure 6-12: Definition sketch Types and orientation of spurs ............................................................................................ 6-25 Figure : 6-13: Definition sketch of orientation of spurs ........................................................................................................ 6-25 Figure 6-14: Plan showing Value of Multiplying factor, Maximum scour for spurs and Cross Sections ............................... 6-27 Figure 6-15: Typical Studs for bank protection ..................................................................................................................... 6-27 Figure 6-16: Typical Sloping Spur .......................................................................................................................................... 6-28 Figure 6-17: Check Dam to control erosion and Gully Plugging (Source ICIMOD Resource Manual) ................................... 6-29 Figure 6-18: Check Dam Layout to control steep streams or torrents ................................................................................. 6-30 Figure 6-19: Sabo Dam (Debris Arresting Dam) .................................................................................................................... 6-31 Figure 6-20: Typical Ground sill/bed bar .............................................................................................................................. 6-33 Figure 6-21:ForcesTable acting on a particle resting on slopping side of a channel. ............................................................ 6-34 Figure 6-22: Cutoff Channel .................................................................................................................................................. 6-35 Figure 6-23: Schematic Diagram of Multipurpose Reservoir showing different Storage Zones ........................................... 6-36 Figure 6-24: Flood Control by Retarding Basin .................................................................................................................. 6-37 Figure 6-25: Typical Design Inflow Outflow Hydrographs & Reservoir Level Curve .............................................................. 6-38 Figure 6-26 :Straight Guide Bank; Elliptical Guide Bank ........................................................................................................ 6-39 Figure 6-27: Typical Layout of Guide Bank ............................................................................................................................ 6-40 Figure 6-28: Typical Details of Guide Bank ............................................................................................................................ 6-42 Figure 6-29: Bank profile after implementing the submerged vanes ................................................................................... 6-43 Figure 7-1: A gabion Box and hexagonal double twist mesh .................................................................................................. 7-2 Figure 7-2: Laying Geotextile filters and Gabions before filling stones ................................................................................... 7-4 Figure 7-3: Concrete Dolos and Interlocking Blocks as Revetment ......................................................................................... 7-5 Figure 7-4: Geotextile as filter ................................................................................................................................................. 7-7 Figure 7-5: Geo bags ................................................................................................................................................................ 7-8 Figure 7-6: Geo tubes .............................................................................................................................................................. 7-8 Figure 7-7: Bamboo Porcupine as Damper for Bank Protection ........................................................................................... 7-10 Figure 7-8: RCC Porcupine ..................................................................................................................................................... 7-10 Figure 7-9: Stacking Sand Bags for Construction of a Bund(left, a) Lapping of Sand Bags (right top, b) and Placing of Sand Bags (c) ..... 7-11 Figure 7-10 Sand Bags Wall Used for River Training Works .................................................................................................. 7-12 Figure 7-11 Rubber Tires filled up and used for river protection .......................................................................................... 7-12 Figure 7-12 Bamboo screen and Permeable Spur ................................................................................................................. 7-13 Figure 7-13 : Bamboo Fencing ............................................................................................................................................... 7-13 Figure 7-14: Multi-tier Jack Jetty ........................................................................................................................................... 7-14 Figure 7-15: Tube wall Flood Barrier and Water Gate Self Inflating Barrier ......................................................................... 7-14 Figure 8-1: Bush-Mattress with wood pegs ............................................................................................................................. 8-1

Flood Control and Management Manual TABLE OF CONTENTS
WECS I
Figure 8-2: wattle fences ......................................................................................................................................................... 8-1 Figure 8-3: Log brush barrier ................................................................................................................................................... 8-2
Figure 8-4: Fascines (bush wattles) ................................................................................................................................... 8-2 Figure 8-5: Vegetated gabions ................................................................................................................................................ 8-2 Figure 8-6: Sod Facing (Turfing) ............................................................................................................................................... 8-3 Figure: 8-7 : Vetiver for Slope Stabilization (Slope > 800 ) ....................................................................................................... 8-3 Figure 9-1: Definition Sketch of Flood Plain ........................................................................................................................... 9-1 Figure 10-1: Flow Chart of Emergency Flood Management Activities ................................................................................. 10-1 Figure 10-2: Heightening of Embankment ............................................................................................................................ 10-5 Figure 10-3: Boil Sack Ring .................................................................................................................................................... 10-7 Figure 10-4: Typical Closer Ring bund .................................................................................................................................. 10-7 Figure 10-5: Definition Sketch of Windrow Riprap................................................................................................................ 10-8 Figure 11-1: Flood depth - frequency Relationship ............................................................................................................... 11-2 Figure 11-2: Flow - Frequency Relationship ......................................................................................................................... 11-2 Figure 11-3: Damage-Frequency Relationship ...................................................................................................................... 11-3 Figure 11-4: Damage-frequency relationship ........................................................................................................................ 11-3 Figure 11-5: Damage frequency curves with and without project ........................................................................................ 11-3
LIST OF TABLES
Table 2-1: Survey and Investigation Requirement : ................................................................................................................ 2-3 Table 2-2: Topographic Survey Requirement and Map Scales ................................................................................................ 2-3 Table 2-3: Details of Modified Universal Transverse Mercator System .................................................................................. 2-4 Table 2-4: Cross Section Interval for Different Level of Survey ............................................................................................... 2-4 Table 2-5: Scales of Cross Section Profile ................................................................................................................................ 2-5 Table 2-6 Interval of point Measurement during Feasibility & Detailed design Surveys ........................................................ 2-5 Table 2-7 Longitudinal river profile survey method and plot scales ....................................................................................... 2-5 Table 2-8: River bed and Bank Material Survey ...................................................................................................................... 2-6 Table 2-9: Hydrological Survey ................................................................................................................................................ 2-7 Table 2-10: Environmental study ............................................................................................................................................ 2-8 Table 2-11: Social Impact Assessment .................................................................................................................................... 2-8 Table 2-12: Historical Data Collection .................................................................................................................................... 2-8 Table 3-1: Recommended design flood return periods for various River training mmeasures ............................................. 3-1 Table 3-2: Values of Standard Normal Variety for various Return Periods ............................................................................. 3-5 Table 3-3 : Guidelines for runoff coefficient .......................................................................................................................... 3-5 Table 3-4: Roughness coefficient of common channel conditions. ......................................................................................... 3-6 Table 4-1 : Classification of River............................................................................................................................................. 4-4 Table 5-1: General Guidelines for Typical Methods of Analysis for Various Hydraulic components ...................................... 5-2 Table 5-2: Numerical tools ...................................................................................................................................................... 5-3 Table 6-1: Common River Training and Riverbank Erosion Control Measures ....................................................................... 6-1 Table 6-2: Design Velocities at different location of River Training Measures ....................................................................... 6-2 Table 6-3: Lacey’s Coefficient for different channel conditions .............................................................................................. 6-2 Table 6-4: Recommended multiplying factors (Z) at different locations of the river training structures ............................... 6-3 Table 6-5: Approximate Seepage gradient of Embankment Material ..................................................................................... 6-5 Table 6-6: Maximum Side Slope of Embankments .................................................................................................................. 6-5 Table 6-7: Recommended distance and depth of borrow pits from Embankment toe .......................................................... 6-6 Table 6-8: Design criteria of Revetment ................................................................................................................................ 6-10 Table 6-9: Angle of Repose of Different Materials ................................................................................................................ 6-11 Table 6-10: Stability factors (Sf) of revetment stones in flow conditions ............................................................................. 6-12 Table 6-11: Lateral Forces imposed by soil, water and earthquake and moment about toe of the wall ............................. 6-18 Table 6-12: Specific Weight of Different materials ............................................................................................................... 6-19 Table 6-13: Typical Value of Angle of friction of foundation soil .......................................................................................... 6-19 Table 6-14: Allowable bearing Capacity of different soils: ................................................................................................... 6-23 Table 6-15: Spur Height ......................................................................................................................................................... 6-25 Table 6-16: Spur Spacing ....................................................................................................................................................... 6-26 Table 6-17: Multiplying Factor (F) for maximum depth of scour .......................................................................................... 6-26 Table 6-18: Channel width discharge relation ...................................................................................................................... 6-33 Table 6-19 :Recommended approximate width – depth ration for stable channels ............................................................ 6-35 Table 6-20: Scour Factor ....................................................................................................................................................... 6-41

Flood Control and Management Manual TABLE OF CONTENTS
WECS J
Table 7-1: General Specifications of Local & Community Involved Construction Materials ................................................... 7-1 Table 7-2: General Specifications 0f Gabions .......................................................................................................................... 7-2
Table 7-3: Mesh and Box Characteristics for Gabions (Manually woven) ............................................................................... 7-3 Table 7-4: Mesh and Box Characteristics for Gabions (Mechanically woven - Hexagonal Mesh) ........................................... 7-3 Table 7-5: Various Uses and Specifications of Geotextile Filter, Geobags and Geotubes ....................................................... 7-7 Table 7-6: Reference Properties of Geo-textile as filter .......................................................................................................... 7-7 Table 7-7: Reference Properties Of Non Oven Geotextiles Used For Bags ............................................................................. 7-8 Table 7-8: Properties Of Sand Bagging Materials For Emergency Uses ................................................................................ 7-11 Table 7-9: In stream Wood Structures .................................................................................................................................. 7-15 Table 8-1: Properties of Vetiver as erosion control plant ....................................................................................................... 8-3 Table 9-1: Floodplain Zoning Criteria ...................................................................................................................................... 9-2 Table 9-2: Land use Policy for Flood Plain Management ........................................................................................................ 9-2 Table 11-1: Calculation of Discount Factors for discount rates 10% and 12% ..................................................................... 11-5 Table 11-2: Standard Conversion Factors .............................................................................................................................. 11-5 Table 11-3: Decision Criteria ................................................................................................................................................. 11-6
LIST OF APPENDICES
Appendix: 1 : Review of Master Plans and Design Reports in the Context of Nepal and South Asia
Appendix: 2 : Peak Discharge Calculations
Appendix: 3 : Design Examples
Appendix: 4 : Benefit Calculation (Damage Assessment)
Appendix: 5 : Economic Evaluation
Appendix: 6 : Assessment of Case Studies
Appendix: 7 : Charts and Tables for Design Parameters


Flood Control and Management Manual INTRODUCTION
WECS 1-1
1 INTRODUCTION
1.1 BACKGROUND
Floods occur in rivers when runoff volume exceeds the channel‘s carrying capacity and it overtops riverbanks
inundating adjacent lowlands, eroding banks and depositing abraded material downstream. Rugged topography,
fragile and young geology and monsoon climate system all contribute to higher rates of runoff, erosion and
sedimentation in the river systems that induce various flood related damages with immense cost to the nation.
Every year flood disasters occur in the country, in mountains and Terai alike, causing widespread loss of life and
property. Floods damage infrastructure, agricultural lands and even urban areas. The government spends scarce
resources in trying to limit such damages, repair damaged infrastructure and attempting to enhance safety from
floods as well as for emergency relief to its flood affected population.
Nepal‘s efforts in flood control has not at all been adequate to address the problems of flood disasters, but the
limited works we do have been doing suffers from multiple aspects. Often the works done are not only isolated
and incongruous but also suffer from technical issues failing to meet the desired objectives. Many of the works
completed till date are either inadequate or overly designed. Flood control or river training works are carried out
by a number of different agencies and the communities in the nation, each varying in scale and detail with
differing levels of interventions. These interventions are neither well-engineered nor optimized suitably. Most of
the efforts have been piecemeal distributed works done in haste in response to public pressures or as emergency
measures without holistically analyzing the problem and optimizing available solutions. There exist no unifying
standards of practice in planning, designing and implementing these works such that the design itself becomes
questionable failing to meet the required objectives.
Rivers naturally change their profile and morphology in conformity with their energy potential, flow resistance and
stream bed/bank materials. Stream bed and bank erosion may be the predominant problems in the steep rivers in
the mountain and hill areas, where as bank erosion, overtopping and inundation become pertinent in wider
valleys and the plains of Terai. Problems are location specific and determined by the unique characteristics of the
river, its stage, up-stream hydrology and overall geology. This is further compounded by anthropogenic socio-
economic and environmental settings. A careful analysis of these factors, and an understanding of interplay of
them, is required for a successful planning, design and implementation of flood control works. This requires a
trained professional to plan and design any major river training or flood control measures. Ad hoc interventions
can aggravate situations or induce damage in downstream sections. Capacity development of multiple institutions
and setting-up of procedural frameworks for flood control works is therefore a requirement in this sector.
Furthermore, recent State restructuring from a unitary system to a federal one has created a situation where
government agencies at the Center, State and Local levels all have specific rights to develop and manage water
resources, which includes activities related to river training and flood control as well. The capabilities of these
different hierarchy of agencies need to be enabled to perform mandated tasks of flood control and it is desirable
to have a single reference source to standardize the planning, investigation, design and implementation of river
training works. It is imperative for the Federal Government to prepare and adopt standards effective for the whole
country.
In this context, the Water and Energy Commission Secretariat (WECS) has prepared this manual for flood control
and management. This manual has been prepared with the necessary technical expertise, encompassing various
literatures, regular consultations with executing agencies, group of experts following the terms of references for
the manual development as defined by the WECS. The document attempts to include the current best practices
applicable for the country and draws from lessons learnt from previous success and failure stories – summarizing
case studies from 16 river training works carried out in the past by different agencies in Nepal.
1.2 ASSUMPTIONS AND LIMITATIONS OF THE MANUAL
The following Assumptions have been made in the Manual:
(a) This manual has been prepared as a reference document for flood control works. The terms river bank
erosion control and river training works or flood control works are used interchangeably and are
considered in general to be the same in the document as is current practice in the region.
(b) Any planning and design is dependent upon the quality and availability of data inputs. It is assumed that
the data are available from reliable sources and these correctly represent the variables sought. The

Flood Control and Management Manual INTRODUCTION
WECS 1-2
historic rainfall data and river flow discharge data shall be obtained from the Department of Hydrology
and Meteorology under the Ministry of Energy, Water Resources and Irrigation.
(c) For the flood flow estimation of an ungauged river, a catchment area/discharge relation or empirical
formula have been used. The selection of high flood discharge as derived from different methods shall be
made judiciously.
(d) The manual is mainly concerned with the flood control and associated aspects of bank or river bed
erosion, overtopping and inundation. River training in this report limits the scope to these aspects and
does not include other aspects of channel depth control for navigation purposes.
(e) The user of this manual shall be the qualified engineers with bachelor degree involved in the field of river
training and river management in government and private sectors. Others may use these to be aware of
the practices and familiarize themselves, but shall not be designing and implementing structures in the
rivers.
This Manual has following Limitations, hence, needs to be taken account while referring to:
(a) The consultant was commissioned to prepare Flood Control and Management Manual to be referred for
managing flood problems in Nepal. This manual should not be relied on or used in circumstances other
than those for which it has been originally prepared and for which the consultant was commissioned.
(b) It has been prepared by referring various codes and specifications. While using this manual, the user is
required to update as per future revisions/amendments made in these codes and specifications
(c) It should not be used as a text book; the contents herein are advisory information valid in general
situations, prepared from publicly available information and expert opinions. Specific conditions may
require special considerations and the Consultant is not liable for any losses or penalties arising from use
of this manual.
(d) The manual is not a standalone document and shall comply with all current government directives and
regulatory instruments issued by the government.
(e) It is understood that the rivers are natural systems with intrinsic potentials that erode banks and deposit
materials attaining a temporary equilibrium for a particular stage of flow. All attempts to train the rivers
are only reducing the risks and providing protection to a certain acceptable probability of failure.
1.3 LAYOUT OF THE MANUAL
This Manual is structured into eleven chapters with seven appendices. The first chapter is the Introduction which
briefly describes the background information as well as the assumptions and limitation of the document. The
Chapters are arranged in normal in sequential order of implementing river training works. Chapter Two provides
the information on survey and investigations required for designing river training works. Chapter Three deals with
the important aspect of determining the design discharge for the works to be designed. It describes the
hydrological assessment of catchments focusing mainly on methods of estimation of peak flood of different
probabilities or return periods. Chapter Four provides discussions on geo-morphological characteristics of rivers
that define the types of problems to be encountered. Chapter Five explains basic concepts of River Hydraulics
essential for the flood protection works.
Chapter Six focuses on design criteria and procedures for designing the common structural items in river training
such as embankments, revetments, spurs, flood walls, guide bunds, etc. Chapter Seven introduces the
construction materials and technology for different flood control and river training works. Availability of suitable
materials and technology are important parameters that define the design of the flood protection system. Chapter
Eight deals with bio-engineering works and techniques applied for stability of river banks/slopes. Chapter Nine
focuses on flood plain management and introduces concepts on reducing risks and minimizing loss. Chapter Ten
provides discussions on emergency flood management. The Manual concludes with discussion on evaluation of
flood control/ River training project in Chapter Eleven. These should provide feedback to the designers to
improve upon their future design and remedial works.
The appendices to this manual describe other directly pertinent information required for the design works. A
review of master plans and design reports prepared in the past in Nepal, and experiences in river training and
flood management works of the South Asia region is presented in the Appendix-1. Various calculations and
design examples are presented in Appendix 2, 3, 4 and 5. Assessment of case studies conducted during field
visits under this manual preparation works is given in Appendix-6. Appendix-7 includes important Tables and
Charts containing values of different design parameters required in the design and calculation.

Flood Control and Management Manual PLANNING, SURVEY AND DESING FOR FLOOD CONTROL PROJECTS
WECS 2-1
2 PLANNING, SURVEY AND DESIGN FOR FLOOD CONTROL PROJECTS
2.1 NECESSITY OF FLOOD CONTROL AND RIVER BANK EROSION CONTROL PLAN
Any intervention on a river is bound to have an effect on another location or reach of the river. So all flood
protection works need to be holistically assessed on its impacts on the river basin level. Plans and designs
are to be formulated through a series of studies to determine the best solution for a river engineering
problem. Project planning is conducted in three phases as listed below (except under emergency
conditions) to ensure that the best solution is determined. The best solution is the one with the least cost,
minimum adverse environmental impact and most acceptable to the public. In reality, the efforts are often
determined by the availability of funds.
2.2 DIFFERENT PHASES OF FLOOD CONTROL PLAN
i. Master Plan
ii. Feasibility (Pre- feasibility and Feasibility based on importance)
iii. Flood Control Project Implementation Plan
A fourth phase is also be added to include revisions during implementation or after implementation of
subprojects as newer information emerge or due to the changes in socio-economic environment over time.
Generally, there is no defined linkage between different phases of flood control plan for minor and/or
isolated river control works. However, flood control of medium and large rivers of significant importance
have linkage between these phases of flood control plan. The Master Plan for the flood control of a river is
prepared first on the basis of which pre-feasibility and feasibility study of a particular priority stretch is
conducted which is followed by detailed engineering design for project implementation. The implementation
plan may be revised as required during or even after implementation.
2.2.1 Master Plan
Master Plan is a comprehensive plan of a particular activity designed to guide the future actions of development
in a region or a community. The Master Plan typically covers a period from 15 to 25 years. In terms of river
training or flood control, it represents a vision for the future, with long-range goals and objectives for all activities
that affect flood control including outlay of funds and resources. Master plans are necessary for problematic
streams or rivers where major multi-year projects are undertaken. Preparation of Master Plan involves the
following activities and outcomes.
a) Topographical map of the area with delineation of the river basin or basins with tabulation of
catchment characteristics such as area, land use, vegetation cover, drainage length, slopes etc.
b) Basic hydrological information on rainfall amounts and distribution over the area, discharge of rivers
including sediments and basic geology of the area.
c) Land use maps, population and facilities in project area including projected future scenarios in the
affected areas.
d) Identification of river engineering problems or risks at different reaches of the river under study,
including identification of constraints such as narrow areas, wide low flood plains, flood prone and
erosion sensitive areas, confluences, etc.
e) Identification of possible solutions for the
f) river engineering problem.
g) Determination of existing discharge or conveyance capacity at different reaches of the river.
h) Statement of national or regional/local development goals, strategies, policies and priorities.
i) Preparation of a checklist for preliminary environmental study for alternative river training proposals
including checklists for socio-economic and environmental analysis for alternative projects.
j) Assessment of design discharge at different reaches of the river under consideration.
k) Presentation of typical designs for major flood mitigation measures.
l) Listing of rough estimates of projects considering their scope, scale and typical cost rates.
m) Prioritization of the projects of flood mitigation works for feasibility study based on primary assessment
of economic, environmental and social parameters. The criteria for prioritization shall be the most
feasible ones subject to constraints of economic returns, availability of funds, environmental impacts
and public acceptance.

Flood Control and Management Manual PLANNING, SURVEY AND DESING FOR FLOOD CONTROL PROJECTS
WECS 2-2
n) Presentation of a conceptual plan for flood mitigation to cope with river basin's flood and sediment
disasters. Long term, generally 15 to 20 years, plan is formulated for identified projects in the Master
Plan to achieve optimum benefits in consideration of integrated river basin plan.
o) Presentation of an action plan which incorporates major flood mitigation activities to be performed by
the target years, estimated budget to be allocated to accomplish the targeted activities by the target
year; and maintenance of previously completed activities.
2.2.2 Feasibility Study
From the list of projects or activities proposed in the Master Plan, projects for implementation in the medium
term plan period is selected from a priority list formed within the framework of socio-economic and
environmental importance. Feasibility study of each selected project is done in more detail to define the
individual works, cost estimates and evaluate the financial attractiveness of the projects. Economic
feasibility is also ascertained by quantifying and superposing socio-economic costs and benefits. Economic
methods of assessments are described further in this manual in Chapter 11.
In an effort to ensure transparency in project selection, it is essential that a project ranking or selection
criteria is developed initially. The ranking criteria shall include economic feasibility criteria and incorporating
suitable indices for national or regional development goals and objectives. The study output includes details
of technical, economic, implementation schedule, operation and maintenance etc. including detailed
analyses. The feasibility study will state the overall viability of the project determining whether it is to be
included in the basket of projects for implementation or not. It will also define the implementation period and
the resources required so that governmental budgeting and interagency collaboration is arranged for a
successful project implementation.
2.2.3 Flood Control Project Implementation Plan /Detailed Engineering Design and Implementation
An implementation plan is formulated for a short immediate term or plan period of 5 to 10 years for the
recommended projects from feasibility study based on economic returns, social and environmentally
viability. The projects which are in lower priority are shifted to next phase for implementation.
Flood Control Project Implementation Plan shall include the following activities:
a) Detailed survey, validation and updating of previous studies.
b) Preparation of maps, river profiles and cross sections
c) Preparation of structural and hydraulic design of river training structures and maps showing quarry
areas, burrow pits and disposal areas also.
d) Detailed cost estimates of all components, supervision and monitoring.
e) Assessments of benefit and losses or damages.
f) Preparation of Environment/Social Management Plan, including environmental assessments or
examinations that are required by law and for obtaining necessary permits.
g) Action plans for formation of user groups, steering committees etc. representing various stakeholders
and agencies involved.
h) Project Operation and Maintenance Plan
i) Project Monitoring and Evaluation
2.2.4 Plan revision in course of implementation
All designs and plans should allow flexibilities for improving the outcomes and service delivery. The
implementation of each flood control project may affect other areas of the river basin and the
implementation of entire works specified in the plan. The scope of works and design parameters of each
project may change over time within the plan period due to the following reasons.
a) Lack of sufficient budget to accomplish the planned activities
b) Emergence of newer concepts, technology, materials or revelation of new information that requires
the design and to be revised and the works altered.
c) Impact of ongoing flood control works in river morphology or other natural events that alter the river
regime and which was not envisaged during design
d) Impact of other development activities within the river basin or realignments of socio-political targets
and objectives.
The original implementation plan should be readjusted, as required, and updates prepared. The changes in

Flood Control and Management Manual PLANNING, SURVEY AND DESING FOR FLOOD CONTROL PROJECTS
WECS 2-3
layout of works, design of structures, cross sections, L sections, etc. shall be indicated in the planning maps
and other relevant documents.
2.3 SEQUENTIAL STEPS IN FLOOD CONTROL PLANNING:
The following list shows the steps to be carried out in sequence for flood control planning. It is important to obtain
participation of the local population in all stages of planning as this promotes social acceptance of the
development activities contributing to better implementation, timely completion and ultimate sustainability.
i. Survey and investigation for acquiring data (see Table 2.2 for details):
a. Topographical Data
b. Historical and present river information
c. Historical and present hydrological and meteorological data
d. Geological information including data on availability of raw materials
e. Data on environmental scenario including relevant socio-cultural settings
ii. Data analysis and fixation of design parameters
iii. Formulation of alternative plans, their cost benefit analyses and associated environmental impacts
iv. Evaluation of alternative plans
v. Formulation of optimum plan
2.4 SURVEY AND INVESTIGATION FOR ACQUIRING DATA
The level and standards of surveying and investigation should be set appropriate to the stage of project
development. Table 2.1 specifies the survey and investigation requirements for river training projects at different
stages of project development.
Table 2-1: Survey and Investigation Requirement : Master Plan Feasibility Detailed Layout and Design
Verify the coordinates of
the key locations and
validate the existing
maps;
Carry out surveying for
preparation of
representative cross
sections; and
Carry out representative
bed sediment analysis
Establish control points/ benchmarks
Carry out following survey for collection of
relevant information:
i. Topographical survey, river profile survey,
location of bridges and other structures;
ii. River bed material survey;
iii. Hydrological survey;
iv. Environmental socio–economic baseline
data collection;
v. Flood damage assessment
Topographical survey for site
plan
River profile survey for
construction site;
River bed material / sediment
survey
Quarry survey and plan
Soil investigation/ geotechnical
investigation
2.4.1 Topographical Survey
Topographical map scales required for different stages of the project development is specified in Table 2-2.
Table 2-2: Topographic Survey Requirement and Map Scales Master Plan Feasibility Study Detailed Layout and Design
i. Available topographic
maps in the Survey
Department, Nepal
(1:25,000 or 1:50,000)
or available maps of
larger scales from other
source
ii. Land use map
iii. Available flood hazard
maps
iv. Geological map
v. Other related maps and
remote sensing data if
required
i. In steep terrain scale shall be
1:5,000 to 1:10,000; with contour
intervals of 2.50m to 1.00m as
appropriate, based on field survey
or aerial photographs
ii. In urban areas map scale should be
1: 1000 to 1:500.
iii. Make use of all available maps,
aerial photographs, satellite images,
section / profiles and maps
prepared during Master Plan if
fulfills the above requirement.
iv. Flood hazard maps in the same
scale (as given in i & ii)
i. Structural site plan shall be with a
scale of 1:100 to 1:500 and contour
interval of 0.25m for flat terrain to 1m
in steep terrain condition
ii. All structural design area should be
covered by the site plan.
iii. The width of survey area shall be
extended at least 20 m beyond the
outside of both banks (this shall be
increased when it is necessary to
determine the ground elevation of
main flood prone area)

Flood Control and Management Manual PLANNING, SURVEY AND DESING FOR FLOOD CONTROL PROJECTS
WECS 2-4
2.4.2 Control Survey
A permanent horizontal control line (base line) shall be established throughout the study area along the one
bank and above the water surface prior to topographical survey for feasibility, and this shall be updated for
preparation of detailed layout plan and construction and as a reference for periodic inspection of the
channel cross sections. These points shall be connected to a minimum of fourth order trigonometrical
stations on the national geodetic network or near the project area which are known to be connected to the
national geodetic networks. The line is monumented and elevations and coordinates of the monuments are
established.
The accuracies shall be ±12·√K for elevation control and ±20·√N for angle control; where, K stands for
distance in kilometer and N for number of angle stations. The accuracy for elevation control (±12·√K) shall
be in mm whereas that for angle control (±20·√N) shall be in seconds For checking the accuracy, the
horizontal point closure shall be determined by dividing the linear distance misclosure of the survey into the
overall circuit length of a traverse, loop or network line/circuit. which shall at least be 1: 5000.
The coordinates shall refer to the Modified Universal Transverse Mercator coordinate system used by the Survey
Department, Nepal (Table2 -3).
In minor rivers and topographic survey of small localized area, however, an arbitrary ground control may be
established by the survey team.
Table 2-3: Details of Modified Universal Transverse Mercator System
Spheroid Everest Spheroid 1830
Central meridian 84° East
Latitude of origin 0° North
Scale factor at origin 0.9999
False coordinates of origin 0 m at equator; 500,000 m at 84° East
2.4.3 River Profile Survey
2.4.3.1 Cross Section Survey A cross-section includes the deepest point, the both present water levels (WLs) and the High Flood Levels
(HFLs) of the river and top of both banks (Figure 2-1). For shallow rivers traditional leveling method shall be used.
However, for deep and high velocity river a rubber boat with professional boatmen shall be used and the depth of
the selected spots inside the river shall be measured by weighted line or tape or if available by using eco-
sounding machine. The cross-sections shall be taken normal to the likely flood flow direction. For defining the
positions of the points, the surveyor takes the co-ordinates of those spots with reference to the fixed benchmarks.
Table 2-4, Table 2-5 and Table 2-6 show the Cross section intervals, map scales and interval of survey
points and the typical cross section with details.
Table 2-4: Cross Section Interval for Different Level of Survey
River Condition River Width
< 50m 50 – 500m >500m
A. Master Plan
i. Straight, uniform 500 m 1000 m 1000 m
ii. Straight, irregular 500 m 500 m 500 m
iii. Bend 250 m 250 m 500 m
B. Feasibility Study
i. Straight, uniform 50 m 100 m 250 m
ii. Straight, irregular 50 m 50 m 250 m
iii. Bend 25 m 50 m 100 m
C. Detailed Design for Construction & Layout
i. Straight, uniform 10 m 20m 20 m
ii. Straight, irregular 5 m 10m 10 m
iii. Bend 5 m 5m 10 m

Flood Control and Management Manual PLANNING, SURVEY AND DESING FOR FLOOD CONTROL PROJECTS
WECS 2-5
Table 2-5: Scales of Cross Section Profile
Drawing Scale River Width
< 50m 50 – 500m >500m
D. Master Plan (Cross section of typical site)
i. Horizontal scale 1:1000 1:2000 1:5000
ii. Vertical scale 1:100 for river in Terai and 1:500 for hilly steep rivers
E. Feasibility Study
iii. Horizontal Scale 1:500 1:1000 1:2000
iv. Vertical scale 1:100 for river in Terai and 1:500 for hilly steep rivers
F. Detailed Design (Layout and Construction)
v. Horizontal Scale 1:100 1:200 1:500
vi. Vertical scale 1:10 for flat rivers in Terai and 1:100 for steep rivers in hills
Table 2-6 Interval of point Measurement during Feasibility & Detailed design Surveys
Description River Width
< 50m 50 – 500m >500m
Extended length beyond both embankment 20 m 20m 50 m
Interval of point measurement for cross sections 2m 5m 20m
When a structure is proposed for construction on one side of a rivers having width larger than 200m, cross
section survey may be on only one side covering the deepest riverbed in the survey area.
Figure 2-1: Typical Cross Section of River
2.4.3.2 Longitudinal Section Survey:
The longitudinal profile survey shall follow the thalweg, the line along the deepest channel. The zero chainage or
the zero distance of the river shall be the downstream end (Figure 2-2) of stretch under consideration and the L-
sectional profile shall show the following key information:
i. Existing ground elevation
ii. Bank Top Level
iii. HFL (Bank Full Stage)
iv. Low water stage
v. Location and elevation of controls such as bed rock, outcrops, boulders, etc.
vi. Location of major structures such as bridges and diversion structures and elevations.
Table 2-7 Longitudinal river profile survey method and plot scales Survey
Requirement
Master Plan Feasibility Survey Detailed Design
Survey Available topographic maps or any Field survey along thalweg Field survey along

Flood Control and Management Manual PLANNING, SURVEY AND DESING FOR FLOOD CONTROL PROJECTS
WECS 2-6
method or
data source
other source of more details; water
level related data from
representative cross sections and
field observations during
reconnaissance survey
thalweg
Horizontal
scale
1:2,500 to 1:5,000 (depending on
size of the river)
1:500 to 1:2,500 (depending
on size of the river)
1:500 to 1:2,500
(depending on size
of the river)
Vertical scale 1:100 to 1:500 (Depending on the
topographic condition)
1:100 to 1:500 (Depending
on the topographic
condition)
1:100 to 1:500
(Depending on the
topographic
condition)
Figure 2-2 : Typical L- Section of a river plotted after feasibility stage survey
2.4.4 Material Survey
Investigation of the riverbed material consists of grain size analysis and measurement of specific gravity.
The results shall be arranged in accordance with the required recommended sample quantities taken as
follows: The type of river bed and river bank materials is assessed and indicated in the topographic map
and cross section profiles. The surveys conducted at different stages of project development include:
Table 2-8: River bed and Bank Material Survey Master Plan Feasibility Study Detailed Design
Collect samples of
bed and bank
materials as:
a. For river width <
50 m: minimum
of 1 sample / site
/ 2Km
b. For river width ≥
50m:
minimum of 3
samples / site / 5
km (center, left
and right banks)
Collect samples of bed
and bank materials
as specified in
previous column so
as to:
a. Determine the river
bed characteristics
(Manning‘s ―n‖),
b. Determine
representative Grain
Size Diameter of
Riverbed Material
i.e. D50, D90 etc. by
Update the material survey at structural site in order to:
a. Determine the river bed characteristics (Manning‘s
―n‖),
b. Determine representative Grain Size Diameter of
Riverbed Material i.e. D50, D90 etc. by sieve analysis,
c. Determine the quality of river bed materials (if suitable
for construction use), and
d. Determine the relationship of the diameter of riverbed
materials, riverbed gradient, etc. with the velocity of
flow.
The stability and performance of a structure such as
weir, gate, or dam, etc. founded on soil depend on the
subsoil conditions, ground surface features, type of

Flood Control and Management Manual PLANNING, SURVEY AND DESING FOR FLOOD CONTROL PROJECTS
WECS 2-7
Master Plan Feasibility Study Detailed Design
Extract the
samples by
removing
surface material
during flood
receding stage.
Select and
determine the
most appropriate
sampling site to
extract the
riverbed
materials during
the flood.
sieve analysis,
c. Determine the
quality of river bed
materials (if suitable
for construction use),
d. Determine the
relationship of the
diameter of riverbed
materials, riverbed
gradient, etc. with
the velocity of flow
and
e. Classify the river
segment
characteristic based
on river morphology.
construction, and sometimes the meteorological
changes. Subsoil conditions can be explored by
drilling and sampling, seismic surveying, excavation
of test pits, and by the study of existing data.
Some geological concerns are as follows:
- The bearing capacity of foundation materials
(bedrock or stone)
- The settlement characteristics of deposits
- The expansion potential of shale / clay
- The orientation of the rock layers (dip direction)
- The excavation difficulty
- The drilling problem
If site condition indicates presence of weak or
permeable foundation or in the absence of any
available soil profile, soil investigation is required.
Depending on the proposed structure types and the
site conditions, the following investigation is
recommended.
2.4.5 Hydrological Survey:
The hydrological survey involves the water level observations, measurement of velocities and discharge and collection of the published data as given in Table 2-9.
Table 2-9: Hydrological Survey Master Plan Feasibility Study Detailed Design
Collect the following hydro-
meteorological published
data
Daily and hourly rainfall of all
gauging stations within and
around the catchment area
Hyetographs of past typical
floods on all synoptic rainfall
gauging stations
Maximum water levels
during peak floods at all
gauging stations
Discharge measurement
record for all water level
gauging stations.
Rating curve for all water
level gauging stations
Acquire Drainage area
characteristics
Information on GLOF
Establishment of reliable
hydro-meteorological
database
Collect and update existing
database with collection of the
following hydro-meteorological
published data
Daily and hourly rainfall of all
gauging stations within and
around the catchment area
Hyetographs of past typical floods
on all synoptic rainfall gauging
stations
Maximum water levels during
peak floods at all gauging stations
Discharge measurement record for
all water level gauging stations.
Rating curve for all water level
gauging stations
Review previous study reports
Acquire drainage area
characteristics
Information on GLOF
Establishment of reliable hydro-
meteorological database
Collect and update existing
database with collection of the
following hydro-meteorological
published data
Daily and hourly rainfall of all
gauging stations within and
around the catchment area
Hyetographs of past typical floods
on all synoptic rainfall gauging
stations
Maximum water levels during
peak floods at all gauging station
Discharge measurement record for
all water level gauging stations.
Rating curve for all water level
gauging stations
Review previous study reports
Acquire drainage area
characteristics
Information on GLOF
Establishment of reliable hydro-
meteorological database
2.4.6 Environmental Study
Environmental study involves listing of environmental issues of greater significance, IEE and EIA studies as per environmental protection Act/Rules and preparation of Environmental Management Plan (EMP) as required as given in Table 2-10 below.

Flood Control and Management Manual PLANNING, SURVEY AND DESING FOR FLOOD CONTROL PROJECTS
WECS 2-8
Table 2-10: Environmental study Master Plan Feasibility Study Detailed Design
List environmental issues of greater
significance, if any.
Collect baseline data of physical,
biological and socio-cultural environment
of project affected area to understand the
socio-environmental situation.
Assess impacts of major significance.
Develop mitigation and management
programs to minimize the impacts
Conduct screening exercise to decide whether
the environmental study shall fall on EIA or
IEE based on prevailing Environmental
Protection Rules (EPR) 2054 (with latest
amendment )
With a view to enhance the fulfillment of legal
requirement, the procedure of IEE or EIA as
per Environmental Protection Act 2053,
EPR,2054 with its latest amendments could
also be carried out at this level
Preparation of Environmental Management Plan.
2.4.7 Social Impact Assessment
Social Impact Assessment involves listing of social issues and their mitigation/management plan, collection of baseline social information and preparation of Social Management Plan as required for different studies as predicted in Table 2-11 below.
Table 2-11: Social Impact Assessment Master Plan Feasibility Study Detailed Design
List social issues of greater
significance and mitigation &
management programs to
minimize the impacts
Collect baseline information, identify social
impacts and mitigation measures, conduct
detailed social impact study either separately or
as a part of environmental study.
Prepare social
Management Plan
2.4.8 Historical data/information on flood damage
Historical data and information related to flood damage plays a vital role in planning flood control and management measures. It involves collection of past flood records, damaged caused in the past, flood control/management activities performed, flood hazard map preparation, etc. as required for particular study as described in Table 2-12.
Table 2-12: Historical Data Collection Master Plan Feasibility Study
Investigation and interviews will
give the following information.
1) Records of past floods.
(Frequency, area, depth,
duration of flooding)
2) Conditions of the existing river
facilities.
3) History of flood control
activities in the basin.
4) Determine man made
activities
i. Update the historical data, prepare
hazard map corresponding to depth
resulting from rainfall that have 5-,
25-, 50- and 100-year return
periods. The hazard map should be
plotted in available larger scale
topographical maps.
ii. Assess damages corresponding to
various depths of flood with respect to
different return periods and estimate
damage cost
2.4.9 Post-Construction Survey
A post –construction survey is required for preparation of as built drawings immediately for following completion
of construction and later for general operation and maintenance works. Typical items checked from this survey
are:
• Alignment of embankments
• Profile of the River
• Location of river Facilities
• Correct dimensions of structures
• Orientation of features
• Earthwork quantities

Flood Control and Management Manual PLANNING, SURVEY AND DESING FOR FLOOD CONTROL PROJECTS
WECS 2-9
2.4.10 Layout master Plan
The layout master plan of the river under implementation of river training measures shall be prepared in details in
large scale preferably in 1:10,000 to 1:5,000 scales with proposed works. This map should be updated every
year after intervention marking the details of works performed in the corresponding locations. The updated map
shows the current status of river training works completed, works under construction, revisions made in the
original master plan as well as the works left to be completed as per original/revised master plan of the river. This
will help the planner to propose future works in the concerned river basin systematically.

Flood Control and Management Manual HYDROLOGICAL ASSESSMENT
WECS 3-1
3 HYDROLOGICAL ASSESSMENT
3.1 BACKGROUND
Hydrological assessments are to be carried out to define design discharges for flood control work. The
methodology of computation of design discharge depends upon the availability of observations at the point of
interest at the river. The rivers with observations at point of interest are termed as gauged rivers. If observations
are not available at the point of interest at the river, such rivers are called ungauged rivers. This chapter presents
suitable design flood estimation methods for gauged as well as ungauged rivers in Nepal.
3.2 DESIGN FLOOD RETURN PERIOD
Hydraulic designs of river training work are based on hydrological parameters along river channels. Major
parameters of hydraulic conditions are the depth of flow and flow velocity. It is necessary to make river training
plans based on lowest condition of water levels and expected flood risks associated with the highest flood level
(Figure 3-1).
Expected flood risks are computed in term of design flood frequencies, which are expressed in return periods.
The selection of a return period is linked to the level of associated risks. The size of catchment, importance of
project area, expected benefits and economic viability are some of the criteria that need to be considered while
selecting return periods. Flood return periods to be used for various river training measures are presented in
Table 3-1. Low risk is associated with the protection of agricultural land and rural areas whereas high risk is
linked with the protection of populous urban and industrial areas. In general, the Soil Conservation Service under
the US government recommends the use of a 25-year frequency for minor urban drainage design and a 100-year
frequency is recommended when extensive property damage may occur (Viessman, Lewis and Knapp, 1989).
Figure 3-1: Schematic diagram of possible water levels on a river channel
Table 3-1: Recommended design flood return periods for various River training mmeasures
Descriptions Return Periods (Years)
References Low Risk High Risk
Floodplain development 25 - 100 Ponce (2008)
Spurs (Groynes) 50 IS Code 8404 (1994)
Revetment 50 Max observed
flood
CWC (2012)
Embankment /Levees crest level –
agriculture lands
25 CWC (2012)
Embankment / Levees crest level –
townships with industrial installations
100 Max observed
flood
CWC (2012)
Freeboard 100 CWC (2012)
Regional flood protection work 50 100 Ponce (2008)
Road drainage 10 50 Viessman, Lewis and Knapp
(1989)
Railroads 25 50 Viessman, Lewis and Knapp
(1989)
Bridge 100 500 Ponce (2008)
Design Rainfall Intensity
Drainage (3-day rainfall) 5 15 CWC (2012)
Cross drainage (3-day rainfall) 50 CWC (2012)
Source: Ponce, 2008; CWC, 2012; IS 8404 (1994); Viessman, Lewis and Knapp,1989.

Flood Control and Management Manual HYDROLOGICAL ASSESSMENT
WECS 3-2
Regional Method - based on specific discharge and area relationship
Flood mark based method-flood mark and hydraulic radius observation available
Empirical Method
WECS/DHM method-basin below 3000 m elevation
Rational method-small urban/rural basin of size less than 12 km
2
Hydrologic Modeling-for any sized basins
Point of Interest in River
Gauged Ungauged
Flood Frequency Analysis for fitted distribution Q2, Q5, Q10, Q25, Q50, Q100, Q200, Q500, Q1000
Method of transposition –for hydrologic similar catchment of gauged river
3.3 CALCULATION OF DESIGN FLOOD
Calculation of design flood for gauged and ungauged rivers are described in the chart given in Figure 3-2.
Figure 3-2: Different methods for assessment of design flood
3.3.1 For gauged rivers
The instantaneous flood flows at gauged site are used for Flood frequency Analysis to estimate the flood flows of
specific return periods selecting a suitable probability distribution. Normal distribution, Log Normal distribution,
Gumbel Distribution, Log Pearson Type III, Gamma and Generalized Extreme values (GEV) distribution are the
methods to conduct flood frequency analysis. Generally, data length shall be at least 20 years (exceeding 30-
year period is the preferred length of records - WMO recommended period for statistical assessment). The
procedure to calculate the floods of various return periods is presented in Appendix 2.
Suitable probability distribution is assessed based on statistical indicators of the best fit. Since, such statistics-
based indicators may need extensive calculations or appropriate statistical package, log-normal probability
distribution may be adopted, which is one of the easy-to-use distributions. Three-parameter log-normal
distribution is found to fit well with most of the flood flow series in Nepal (WECS/DHM, 1990; Sharma and
Adhikari, 2004).
3.3.2 F or ungauged rivers
3.3.2.1 Method of Transposition:
The flood discharge at an ungauged location shall be estimated from the flood values at a gauged location by the
method of transposition. The instantaneous flood flows at a desired ungauged site is calculated using a function
of the ratio of the catchment areas as presented in equation 3.1,
3.1

Flood Control and Management Manual HYDROLOGICAL ASSESSMENT
WECS 3-3
Where Qungauged is the discharge (m3/s) of ungauged area, Qgauged is the discharge (m
3/s) of gauged area, Aungauged
is the drainage area (km2) of ungauged basin and Agauged is the drainage area (km
2) of gauged basin. The
exponent (n) increases from 0.5 to 0.8 with increase in unit time. High value of exponent is used for duration
volumes 'of about 60 days or more‘ (Cudworth, 1989), which is less likely in general cases. The assumptions for
application of above equation can be found in detail at Cudworth (1989), which is described in River Training
Report.
Precipitation adjustment needs to be carried out if the basin average precipitation significantly differs between
gauged and ungauged basins using the equation 3.2,
3.2
Where Pungauged is average annual precipitation (mm) over the ungauged basin and Pgauged is average annual
precipitation (mm) over the gauged basin; and the exponent (n) ranges from 0.5 to 0.8 as explained in section
3.3.2.1 above.
3.3.2.2 Empirical Methods:
3.3.2.2.1 Regional Approach Based On Specific Discharge
Figure 3-3 presents the relationship between drainage area and specific discharge for 2-year, 25-year, 50-year
and 100-year recurrence intervals based on the flood frequency assessments published by DHM (Sharma and
Adhikari, 2004). The flood frequency assessment has used data from 1962 to 1995 for 51 stations. The length of
records, however, varies from 11 years to 34 years. Data available for stations with records for less than 10 years
are excluded from the flood frequency analysis carried out by DHM. Since the data used in Figure 3-3, does not
include basins smaller than 12 km2, it should not be used for basins with catchment size below 12 km
2, for which
rational method is recommended.
Figure 3-3 shall be used to obtain discharges at the mostly used return periods (2, 25, 50 and 100-year) in
ungauged catchments. The fitted trend lines are also expressed in terms of equations for specific discharges as
given in equations 3.3 to 3.6.
q-100 year = 61.4 (Basin Area)-0.49
3.3
q-50 year = 43.3 (Basin Area)-0.46
3.4
q-25 year = 30.8 (Basin Area)-0.44
3.5
q-2 year = 4.2 (Basin Area)-0.30
3.6
Where, specific discharge (q) is expressed in m3/s/km
2 and basin area (A) is measured in square kilometer.

Flood Control and Management Manual HYDROLOGICAL ASSESSMENT
WECS 3-4
Figure 3-3: Specific discharge at different return periods
3.3.2.2.2WECS/DHM Method
A widely used regional approach is the WECS/DHM method which provides methodologies to compute
instantaneous as well as daily average flood flows (WECS/DHM, 1990). The equations 3.7 and 3.8 are used to
compute peak flows at 2-year and 100-year return period in WECS/DHM method.
8783.0
30002 8767.1 AQ
3.7
7342.0
3000100 639.14 AQ
3.8
Where, Q2 = 2-year flood in m3/s
Q100 = 100-year flood in m3/s
A3000 = Catchment area below 3000m in km2.
Based on the algebraic evaluations of the equations used for lognormal distribution, the following relationship
(WECS/DHM, 1990) shall be used to estimate floods at other return periods.
)exp(ln 2 lf SQQ
3.9
Where, 326.2/)/ln( 2100 QQl
3.10
S = standard normal variate, given in the Table 3-2. Q2 = 2-year flood in m
3/s and
Q100 = 100-year flood in m3/s

Flood Control and Management Manual HYDROLOGICAL ASSESSMENT
WECS 3-5
Table 3-2: Values of Standard Normal Variety for various Return Periods Return Period (T) in years Standard Normal Variety (S)
2 0
5 0.842
10 1.282
20 1.645
25 1.759
50 2.054
100 2.326
The equation 3.11 illustrates the calculation of 50 yr return period flood (Q50) based on Table 3-2.
326.2/)/ln(054.2lnexp 2100250 QQQQ
3.11
Q2 and Q100 are estimated using the formula 3.7 and 3.8 respectively.
3.3.2.2.3 Rational Method
This method is generally used when the catchment area is less than 12 km2 (Mutreja, 1986) and the catchment
lies in urban and rural area. Despite problems in its applications due to assumption of uniform precipitation over
the catchment, it is widely used due to unavailability of simpler alternatives. Rational Method is formulated as
given in equation 3.12:
3.12
where Q is the discharge (m3/s), A is the area of the basin (km
2), C is runoff coefficient and is rainfall intensity
in mm/hr.
Rainfall intensity ( ) in cm/hr for a given return period shall be computed as (Sharma, 1989; equation 3.13):
3.13
Where, ITt = Rainfall intensity in cm/hr for given return period T (Years) and time of concentration t (min)
The Kirpich equation 3.14 is one of the most widely used formula for determining the time of concentration in
minutes.
3.14
Where, L is the length of watershed (km) and H is the difference in elevation (m)
Table 3-3 presents suggestive guidelines for the use of runoff coefficient (Chow, Maidment, & Mays, 1988).
Chow, Maidment and Mays (1988) provide the details of the runoff coefficient, the values of which are dependent
upon catchment surface and the flood return period. When runoff from a catchment with a mixture of land uses, a
composite runoff coefficient should be used. The composite runoff coefficient is weighted based on the area of
each respective land use, i.e. the weighted average is to be taken.
Table 3-3 : Guidelines for runoff coefficient Return Periods
2-Year 25-Year 50-Year 100-Year
Runoff Coefficient
Concrete 0.75 0.88 0.92 0.97
Cultivated land 0.35 0.44 0.48 0.51
Range land 0.33 0.42 0.45 0.49
Forest 0.31 0.40 0.43 0.47
3.3.2.3 Flood Marks-based Method
Flood marks along the bank of a river provide useful information of past floods. The flood marks can be surveyed
for the estimation of discharge by indirect method (slope-area method). The following steps may be followed to
compute the discharge (French, 1986).
1) Selection of high-water mark

Flood Control and Management Manual HYDROLOGICAL ASSESSMENT
WECS 3-6
a. Steep sided bank provides better marks
b. Straight channel preferred
c. Contracting reach preferred over the expanding reach if straight reach is not available
d. Bridges and bending channel should be avoided
e. Length considered for slope assessment should exceed 75 time the mean flow depth
f. Fall should be equal to or greater than 0.15 m.
2) Compute upstream and downstream conveyances (Ku and Kd) using the equation 3.15
3.15
Where A is the cross sectional area in square meter (m2) and R is the hydraulic radius in meter (Area/Perimeter)
and n is the Manning‘s coefficient. Details of the values of roughness coefficient (Manning‘s n) can be found in
text books on open channel hydraulics (Chow, Open channel hydraulics, 1959). Summary is given in Table 3-4
Table 3-4: Roughness coefficient of common channel conditions.
Type of channel Manning‘s n
Lined or built-up channels 0.010 to 0.025
Unmaintained channels 0.04 to 0.14
Streams on plain 0.025 to 0.15
Mountain streams 0.03 to 0.07
Flood plains 0.025 to 0.16
Major streams with top width exceeding 30 m 0.025 to 0.10
Manning‘s n can be estimated by any one of the methods given below:
a. Calculate n directly, using equation 3.16 given below for given cross section, stage, slope and discharge for river reach near the Discharge Gauging station for different river stages and take an average value;
3.16
b. If the median particle size of the river bed and sides are available use Strickler's equation 3.17 assuming equivalent roughness coefficient ks equal to mean diameter of the particles in metre
3.17
Where, D50 = Mean diameter particle size of bed material in metre
3) Compute average conveyance
3.18
4) Compute slope
3.19
Where ∆h is the difference in excess water level between upstream and downstream reaches and L is the length
between upstream and downstream points considered.
5) Compute discharge
3.20
Discharge obtained in this manner is the zero-order discharge which serves the purpose for approximate
estimations required for hydraulic designs. This value shall be optimized for better accuracy, which needs several
iterative processes. See further details about the optimization process in French (1986).
3.3.2.4 Hydrologic Modeling
Hydrological modeling can be applied for obtaining flood hydrograph in a watershed with rainfall and runoff
records. A selected hydrological model can be a simple unit hydrograph model to a much sophisticated
mathematical model that uses numerous basin characteristics. HEC-HMS, SWAT, VIC, DHSVM, WEBDHM,

Flood Control and Management Manual HYDROLOGICAL ASSESSMENT
WECS 3-7
MIKE NAM/SHE are the examples of some hydrologic models that can be used to simulate flood hydrograph at
ungauged desired location. The model shall be calibrated and validated at known points below the ungauged
point. While doing so, the model shall be set up in such a way that the model would be able to provide the river
flow at ungauged site.
Whatever the method used to estimate the flood hydrograph at ungauged site, a special attention and care
should be given in analyzing the observed flood near by the ungauged site.
Further, detail of hydrologic assessment for computation of design flood can be found in ―Hydrologic Manual for
Infrastructures, 2019 prepared by WECS‖
3.4 FIXING DESIGN DISCHARGE
Flood discharges can be estimated from the methods mentioned in the above sections. The values obtained
should be compared. The highest of these values should be adopted as the design discharge (Q) provided it
does not exceed the next highest discharge by more than 50 percent. If it does, restrict it to that limit [Hydrologic
Manual for Infrastructures, 2019 prepared by WECS]. However, the design flood discharge should be fixed after
comparing the calculated flood discharge with that of nearby river station; and by expert judgment based on
justified supporting data and necessary hydrological considerations.

Flood Control and Management Manual RIVER MORPHOLOGICAL STUDY
WECS 4-1
4 RIVER MORPHOLOGICAL STUDY
4.1 GENERAL GEOLOGY OF NEPAL
Nepal Himalaya forms the central part of the Great Himalayan Arc formed as a result of the ongoing tectonic
collision between the Indian Plate and Eurasian Plate which began 50 million years ago and continues even
today. Nepal can be divided into following five major tectonic zones based on geology which have distinct
boundaries marked by major thrusts or normal faults. Generally River behaviors and characteristics are
controlled by geology of the area.
Terai Zone - Main Frontal Thrust (MFT)
Siwalik Zone - Main Boundary Thrust (MBT)
Lesser Himalayan Zone - Main Central Thrust (MCT)
Higher Himalayan zone - South Tibetan Detachment (STD)
Tibetan Zone - Tethys Himalayan zone (THZ)
4.2 RIVER BEHAVIOR
River behavior, in general, can be well understood by examining the following characteristics: River Channel
Pattern, Bed form, Longitudinal Profile and Channel Geometry.
4.2.1 River Channel Patterns
River channel pattern has traditionally been classified as straight, meandered or braided. The degree of
meandering of a river is defined by the sinuosity, which is the ratio of centerline length (Lc) to wavelength or
valley length of the meander (LV). Straight channels have very little curvature within a reach having a sinuosity
of less than 1.1. The river reach with a sinuosity between 1.1 and 1.5 are sinuous, and meandering rivers have
a sinuosity of greater than 1.5.
Figure 4-1: Straight river reach Figure 4-2: Braided Rivers with gravel bars
A meander shape shall be described as a circular curve, sine curve, parabolic curve or sine- generated curve.
The circular curve is used as an elementary form to describe a meander (Figure 4-3). However, the basic river
meander is essentially the sinusoidal curve (Figure 4-4) which can be described by equation 4.1.
4.1
where, ɵ is the direction of angle measured from the down valley direction; ω is the maximum angle the curve
makes with the mean downstream direction; 2πx is the distance along the meandering path in which x is the
length of cord along the meandering path; and L is the total distance along the meandering length. The
maximum possible value of ω in above equation is 2.2 radians (125 degree) in which adjacent limps of the
meander intersect leading to cutoff formation.

Flood Control and Management Manual RIVER MORPHOLOGICAL STUDY
WECS 4-2
Figure 4-3 : Circular shape of a meander curve
Figure 4-4: Sinusoidal Shape of a meander curve
Figure 4-5 : Meander Characteristics
Sinuous rivers are the transition between straight and meandering rivers. The characteristics of a meandering
curve have important bearing on design and maintenance of engineering structures in the rivers such as
bridges, diversion headworks, guide bunds, flood embankments, diversion intakes etc. The cross-section at the
meandering bend apex is normally asymmetrical having deep portion of the stream located along the outer bank
and a broad, shallow portion extending from the inner bank toward the centre of the river. The thalweg wanders
from deep pool at the outer side of a bend over a shallow crossover to next deep pool at the outer side of the
next bend, and so on (Figure 4-5).

Flood Control and Management Manual RIVER MORPHOLOGICAL STUDY
WECS 4-3
Figure 4-6: Meandering River The braided river that flows in two or more channels around alluvial bars or islands is shown in Figure 4-2.
Braided rivers are wide and shallow and divided to branches by a number of semi-stable or unstable bars or
islands. They have a braided look at the low flow stages with exposed bars, but all or some of the bars are
submerged during the high flow stages.
4.2.2 Bed forms
A free surface flow over an erodible sand bed generates a variety of different bed forms and bed configuration.
The sketches of the various types of bed forms are presented in Figure 4-7.
Figure 4-7 : Different Types of Bed Forms Ripples and dunes play significant roles in the makeup of hydraulic roughness of an alluvial channel. The bed
form known as chute and pools occurs in very steep streams, e.g. in mountain torrents.
4.3 CHANNEL GEOMETRY
The channel geometry such as width, depth, bed slope and velocity are the function of discharge, sediment
transport rate, and permissible shear stress / velocity; and suspended-sediment load is the function of discharge
and permissible shear stress as:
B = f1 (Q, Qs, s)
d = f2 (Q, Qs, s)
v = f3 (Q, Qs, s)

Flood Control and Management Manual RIVER MORPHOLOGICAL STUDY
WECS 4-4
S = f4 (Q, Qs, s)
Qs = f5 (Q,s)
Where, B = width in meter D = mean depth in meter V = mean velocity ms
-1
Qs = suspended-sediment load, in units of weight per unit time Q = water discharge, in cubic meter per second (cumecs);
s = permissible shear stress in N/m2
f1, f2, f3, f4 and f5 are five different functions
Many attempts have been made to solve the above functions. It is understood that B, D, and V are power
functions of Q.
4.3.1 Theoretical Equations
Theoretically, width, depth, and velocity are each a function of discharge as described by the formulas above, the three equations can immediately be related to one another through the identity
Q= area X velocity,
Q=B*D*V 4.2
Chezy and Manning have derived equations for rigid boundary channels by solving the before described
functions as:
V = 4.3
and 4.4
Where, C = Chezy constant, n = Manning's coefficient, R= hydraulic radius in metric unit and S = bed slope of
channel in metric unit. The manning equation is dependent on boundary roughness. By comparison of above
two equations, it can be seen that the value of C in metric unit comes out to be and therefore this
coefficient is dependent on roughness of boundary as well as channel geometry.
4.3.2 Empirical Equations
Empirical relationships between widths, depths, flow velocities, discharges, and the suspended-sediment loads
are obtained from previously observed data and experiments. Various equations derived by Lacey, Blench and
Kennedy, etc. exist which shall be used to calculate the channel geometry for alluvial rivers in Nepal.
Other approaches using concepts of minimum stream power, sediment concentration, or energy dissipation also
exist and shall be used in specific cases to predict channel shape.
4.4 CLASSIFICATION OF RIVER
A simplified classification as per the Table 4-1 can help us understand typical characteristics and behavior to
identify problem areas and proposed solutions

Flood Control and Management Manual RIVER MORPHOLOGICAL STUDY
WECS PRECAR-SAP-JV 4-4
Table 4-1 : Classification of River
Category
Steepness (main location)
Valley shape Bed Material
Channel Pattern
Typical Characteristics Recommended River Training Structures
A Single, straight, high velocity river
Narrow valley without flood plain or Irregular narrow flood plains
Rocks and very large to large boulders
Single, straight
i. Movement of gravel and boulder bed during high flow;
ii. Bars are usually along sides of river and not extremely large;
iii. Bank erosion is usually localized; and iv. Frequent boulder rapids
Gravity or Cantilever or Counterfort Retaining Wall as per the requirement of site.
B Single meandering channel
Partially confined by valley sides or unconfined wider valley on alluvial flood plain
Gravel and sand on the bed
Single, meandering river
i. Regular sinus pattern; ii. Point bars are common; iii. River can be within partially confined valley or
on alluvial flood plain such as terai; iv. Flow velocities are not high; and meander
pattern shift d/s by eroding at outside of bends.
Embankment or Spurs or Porcupine, Embankment with Spurs as per the requirement of site.
C Split channel with high velocity river
Partially confined by valley sides or unconfined valley
Boulder and gravel
Two to three active channels with flood ways
i. Channels are split by island and bars; ii. Bars are generally composed of boulder and
gravel iii. Velocities are relatively high; and iv. Bank erosion takes place at many locations.
Concrete block bank revetment with spurs/studs.
D Split meandering river
Unconfined valley in flood plain
Sand gravel layers
Two to three active channels with flood ways; irregular active meanders;
i. Channels are split by island and bars; ii. Meandering pattern indicates erosion at
outside of bends; iii. Bar material generally composed of sand and
gravel; and iv. Erosion protection works can involve cutoff
and relocation of main flow channels
Embankment, Spurs, Embankment with spurs, Cutoff and Porcupine as per the requirement of site.
E Braided river Less confined valley
Boulders and gravel
Braided, several active channels (two to three)
i. Channels are split by island and bars; ii. Extensive erosion of banks and islands occurs
along the river reach; and iii. Erosion protection works can involve
relocation of several main flow channels and cutoffs.
Embankment, Spurs, Embankment with spurs, Cutoff and Porcupine as per the requirement of site.
Source: Headworks, River training works and Sedimentation manual, PDSP M.7 and Design Manual for River Training works in Nepal (WECs)

Flood Control and Management Manual RIVER MORPHOLOGICAL STUDY
WECS 4-5
4.5 INSTABILITY OF RIVERS
An alluvial river channel is continually adjusting to achieve dynamic equilibrium between discharge, sediment
transport, channel geometry, and slope. A disturbance to equilibrium of the system, such as the construction of a
storage dam, occurrence of landslides, or removal of riparian vegetation can disrupt this equilibrium. Following
equation gives a qualitative relationship between sediment load and size, and river slope and water discharge as:
4.5
Where, Qs = sediment load (of sizes represented in the riverbed),
D50 = average sediment particle diameter of the riverbed,
Qw = water discharge, and
S = river channel slope.
River channel stability may be assessed through the following indicators:
Amounts and rates of historical changes of bed elevation and horizontal position,
Sediment transport capacity,
Channel bank stability,
Planform characteristics such as sinuosity or meander wavelength,
Comparison of channel planform with a known stable reference reach,
Channel hydraulic capacity (bankfull discharge),
Stage-discharge curves, and
Bed-material grain size distributions to cite several examples.
More than one approach may be used to check various processes in the stability assessment.

Flood Control and Management Manual DESIGN CRITERIA AND PROCEDURES
WECS 5-1
5 RIVER HYDRAULICS
5.1 RIVER HYDRAULICS
A hydraulic analysis of a river stretch gives information regarding the slope, hydraulic geometry, unit stream
power, shear stress, and overall energy of the river at that stretch under various flow conditions. This will also
help predict how the river will respond to the proposed modifications. Hydraulic analyses can range from simple
calculations of depth, velocity and discharge to complex three-dimensional computer models or physical
laboratory models to simulate the river itself. It is necessary to select the level and type of analysis that will
provide the required information for proposed works within the project budget and time frame.
5.2 TYPES OF FLOWS
A basic understanding required is the flow type and regimes of the river stretches as discussed below.
5.2.1 Steady flow vs unsteady flow:
Steady flow and unsteady flow are classified based on whether the velocity at a specific location in magnitude or
direction is constant or changes with respect to time. If it is changing with time, it is called unsteady. If it is not
changing with time, it is called steady.
5.2.2 Uniform flow vs non-uniform flow:
Uniform flow and non-uniform flow are classified based on whether the depth, water area, energy lines etc. of the flow are constant or varied along the channel. If it is not changing at different locations within the reach it is uniform flow, otherwise it is non-uniform flow.
5.2.3 Gradually varied flow
If the slope of the surface of a body of water is not distinguished by the naked eyes, the condition therein is
termed gradually varied flow (GVF), e.g., gradual expansions and contractions in cross section shape or due to
changes in slope or roughness cause the flow to accelerate (or decelerate) slowly in response. The GVF can be
steady (GVSF) or unsteady (GVUSF) forms depending upon if the flow is steady or unsteady.
5.2.4 Rapidly varied flow:
If spatial changes to the flow (depth and/or velocity) occur abruptly and the pressure distribution is not
hydrostatic, the flow is classified as rapidly varied. Rapidly varied flow (RVF) is usually a local phenomenon.
Examples are the hydraulic jump and hydraulic drop.
5.3 FLOW REGIMES
The Froude number is a ratio of inertial to gravitational forces which aids to identify the state of flow as either
subcritical (Fr< 1) or supercritical (Fr> 1).
Where, Fr is Froude number and given by 5.1
and
v = characteristic flow velocity in m/sec; g = characteristic acceleration in m / sec2; L = characteristic length in
meter.
A flow is laminar, transitional, or fully turbulent depending on the ratio of the inertial to viscous forces as defined
by the dimensionless Reynolds number, which is derived as
Re = VL/ 5.2
Where, Re = Reynolds number (dimensionless)
V = characteristic flow velocity (m/sec)
L = characteristic length (m)
= kinematic viscosity of water (m2/sec)

Flood Control and Management Manual DESIGN CRITERIA AND PROCEDURES
WECS 5-2
In open channels, L is usually taken as the hydraulic radius; i.e., the cross-sectional area normal to the flow
divided by the wetted perimeter. Open channel flow with Reynold‘s number less than 500 is considered laminar
where as it is termed turbulent if it exceeds 2,000. Any in between value is termed to be in transition. (Chow
1959).
5.4 METHODS FOR FLOOD ROUTING
Two general classifications of flood routing methods are hydrologic and hydraulic. Hydrologic methods are generally based on the solution of the conservation of mass equation and a relation of storage and discharge in a stream reach or reservoir. In general, hydrologic flood routing methods involve simplified numerical techniques, conservation of mass and steady flow hydraulics. Muskingum, Converse methods are some examples of Hydrologic routing. Hydraulic methods are based on solutions of the conservation of mass and the conservation of momentum equations. The hydraulic flood routing methods involve complex numerical solutions of partial differential equations and the theory of unsteady flow hydraulics. Saint Venant equations are the governing equations for determining the flow variables along the channel in hydraulic routing. Kinematic wave routing, diffusive wave routing and dynamic wave routing are the types of hydraulic routing. Kinematic wave routing is considered in steep slopes only (mountainous region) where storage effect is minimum and backwater effects are neglected so peak attenuation is minimum. The Saint Venant equations for one dimensional flow in river channel are represented by equation 5.3(continuity equation) and 5.4 (momentum equation).
5.3
Where A = cross-sectional area of the flow, Q = water discharge, and ql = lateral inflow per unit length.
5.4
Where Sf = friction slope, So = bed slope = , h = water depth, β = momentum correction coefficient (β 1) and
Z = height of river bed above datum. The friction slope is assumed to be a function of the flow, such that where K = conveyance. The conveyance is calculated using a resistance function, such as Manning's or Chezy's.
= (
And for Manning's equation.
The above equations are applicable for unsteady and non- uniform flow condition. In steady and non-uniform flow
condition the above equations can further be reduced by putting . For uniform flow condition the equation
shall be reduced taking .
5.5 METHODS OF HYDRAULIC ANALYSIS
The general guideline for selecting typical analysis procedures for various components of river control measures is given in Table 5-1.
Table 5-1: General Guidelines for Typical Methods of Analysis for Various Hydraulic components
S.N. River Control Measures Typical Analysis Procedures
1 Flood Embankment Gradually varied steady flow; sediment analysis is often qualitative. Detail movable boundary analysis may be necessary on flank levees.
2 Dams (height determination)
Usually hydrologic reservoir routing suffices, or gradually varied uniform stead flow may be used.
3 Spillway Gradually varied flow analyses or reservoir routing required to determine, crest elevation, specific discharge and width of spillway required. The

Flood Control and Management Manual DESIGN CRITERIA AND PROCEDURES
WECS 5-3
S.N. River Control Measures Typical Analysis Procedures
spillway profile shall require numerical and/or physical models to design and test depending upon scale of development.
4 Channel Modifications Usually carry out a gradually varied steady flow analysis with a qualitative study of movable boundary analysis to establish magnitude of effects, quantitative analysis recommended for long reaches of channel modifications and/or streams with high sediment concentration along with physical model tests for problem identification and designs (typically when supercritical flow channels are involved)
5 Interior Flood Hydrologic routings normally for pump and gravity drain sizing, GVSF for channel design, numerical and/or physical model testing for approach channel and pump sump analysis depending upon problem scale or severity.
6 Bypass/ Diversions GVSF or GVUSF analysis, physical model testing, movable boundary analysis on sediment-laden streams.
7 Confluences GVSF usually, GVUSF for major confluences with backwater effects.
8 Overbank Flow GVSF normally, GVUSF/Multi-D for very wide floodplains or alluvial fans.
9 Flood Plain Management GVSF normally
Source: Engineering Manual 1110-2-1416, Engineering and design river hydraulics 1993 USACE
Some important numerical tools which are frequently used in hydraulic analysis are presented below in Table 5-2.
Table 5-2: Numerical tools 1. HEC-RAS The numerical model HEC-RAS developed by the U.S. Army Corps of Engineers uses the
gradient and topography to evaluate the flow depth, velocities and flooded zones. It is also useful to calculate sediment transport and water temperature. Web: hec.usace.army.mil/software/hec-ras/
2. MIKE11 MIKE 11 is a model that simulates water flows levels, water quality, and sediment transport in rivers, flood plains, irrigation canals, and reservoirs. MIKE 11 includes components for rainfall-runoff modeling, hydrodynamic modeling, hydraulic structure operations, and sediment transport and water quality modeling, with calculations conducted under unsteady or quasi steady state. Although applications are of multidimensional nature, the software's solutions involve one-dimensional calculations. Web: http://www.mikepoweredbydhi.com/products
3. iRIC iRIC (International River Interface Cooperative) is a software developed with the purpose of offering a complete simulation environment of the riverbed and its results can be exported and used to analyze, mitigate and prevent disasters, through the visualization of the results of the river simulation. Web: http://i-ric.org/en/
4. RRI International Centre for water Hazard and Risk Management (ICHARM) has developed a new numerical model called Rainfall-Runoff-Inundation (RRI) model. The model simulates various hydrologic processes including rainfall-runoff, stream-flow discharge, and inundation over floodplains in an integrated manner. http://www.icharm.pwri.go.jp/research/rri/index.html
5. FlowMaster FlowMaster is a hydraulic analysis program used for the design and analysis of open channels, pressure pipes, inlets, gutters, weirs, and orifices. Mannings, Hasen-Williams, Kutter, Darcy- Weisbach, or Colebrook-White equations are used in the calculations. FlowMaster is a proprietary model that can be obtained from Haestad Methods, Bentley Systems, Inc. Web: http://www.bentley.com/en-US/Products/FlowMaster/
6. HydroCAD HydroCAD Runoff hydrographs are computed using the SCS runoff equation and the SCS dimensionless unit hydrograph. The program computes runoff hydrographs, routes flows through channel reaches and reservoirs, and combines hydrographs at confluences of the watershed stream system. HydroCAD has the ability to simulate backwater conditions by allowing the user to define the backwater elevation prior to simulating a rainfall event. HydroCAD is a proprietary model and can be obtained from HydroCAD Software Solutions LLC. Web: https://www.hydrocad.net/

Flood Control and Management Manual DESIGN CRITERIA AND PROCEDURES
WECS 6-1
6 DESIGN CRITERIA AND PROCEDURES
6.1 STRUCTURAL MEASURES FOR RIVER CONTROL
There are various river engineering works that are used, either singly or in combination, to provide flood
protection and to control riverbank erosion to protect life and property of the people. These are summarized in
Table 6.1. Design of these structures is presented in the subsequent headings.
Table 6-1: Common River Training and Riverbank Erosion Control Measures
6.2 DESIGN CRITERIA
In order to ensure uniformity in design of river training and riverbank erosion control structures, the following
design criteria are being laid down. The design criteria have been updated based on the latest standards followed
in Nepal.
6.2.1 Design Discharge
For Design Discharge, refer to Chapter 3.
6.2.2 Flow Velocity
Computing the average channel velocity or the mean velocity requires a design discharge and cross section.
6.1
If the design channel is a compound channel, it may be necessary to divide the channel into panels and calculate
velocities for each panel. In channels with meandering bends, the velocity on the outside of the bend may be
significantly higher than the average velocity. When a river has low banks that are overtopped and the floods
spread out over the banks, the designer should consider design velocity for this river stage. A river with at least
one low bank is not entrenched. The maximum velocity will occur as the water spreads-out across the floodplain,
unless another terrace is encountered.
The local velocities against various river training works shall be taken as mentioned in Table 6-2.
S.N. Category Problems Facilities / Structural Measures
1 High water training Over flow / Inundation / Flooding
Flood embankment/Dike/Levee/ flood walls Widening of waterway/river Dredging/Excavation Combination of above
2 Reduction/control of the peak discharge of flood
Flooding down stream Dam Retarding basin or Detention basin
3 River Bank erosion, River training.
Bank cutting, River shifting Revetment Spurs Change of waterway/cut-off channel
4 Prevention of riverbed degradation
River bed erosion and bed lowering
Ground sill / bed bar, drops, check dams.
5 Prevention of sediment and debris to maintain the flow uninterrupted
Surface erosion and land slides
Sabo works / debris arresting dam (for sediment and debris control) Regular maintenance of channel (excavation/dredging)
6 Protection of river structures confining river flow
Afflux (Rise of water level Up Stream)
Guide bund

Flood Control and Management Manual DESIGN CRITERIA AND PROCEDURES
WECS 6-2
Table 6-2: Design Velocities at different location of River Training Measures
S.N River characteristics Type of River Training works
Estimated local Velocity VL
1 Approximately straight channel Revetment VL= 2/3Vm
2 Severe Bend Revetment VL= 1.25Vm
3 Nose of a spur Spur VL= 2Vm
4 Severe Bend (Concave side) Spurs VL= 1.25Vm
5 Channel banks Guide bank Vm
6 Nose of Guide Bank-well streamlined Guide bank VL= 1.5Vm
7 Nose of Guide Bank-poorly streamlined lined Guide bank VL= 2Vm
8 Direct Impingement Banks VL= 1.5Vm
9 Box like structures River edges VL= 1.25Vm
SOURCE: Design Manual for River Training works in Nepal, HMG, MOWR, Water and Energy Commission Secretary, Nepal, 1979.
6.2.3 High Flood Level
Calculate the HFL using the Manning‘s equation (Equation 6.2). This requires Design discharge (Qd), Manning‘s
coefficient (n), the river gradient and river bed width for the reach considered.
6.2
Where, n = Manning‘s Coefficient
R = Hydraulic Radius = A/P, m
A = Area of flow at HFL, m2
P = Wetted Perimeter, m
S = Bed Slope of River along thalweg
The calculated HFL corresponding to Qd may be or may not be equal to the previously observed HFL at site. If
calculated HFL is smaller than observed HFL, adopt observed HFL as High Flood Level. But if calculated HFL is
greater than observed HFL, adopt calculated HFL as high flood level for design consideration.
The HFL can also be determined by using hydraulic models like HEC-RAS and similar other softwares.
6.2.4 Manning Roughness Coefficient
For Manning Roughness Coefficient (n), refer to Chapter 3
6.2.5 Waterway
In confined rivers with stable banks, waterway (P), shall approximately be taken equal to the actual width of the
river at the bankfull flow condition. However, for meandering alluvial rivers, P shall be estimated by Lacey‘s
equation:
6.3
Where, Qd is the bank full flood discharge in m3/s, P is the waterway in meter and β is Lacey‘s coefficient,
depending upon the hydro-geomorphologic characteristics of the river channel. Its values for different channel
conditions are presented in Table 6-3 below.
Table 6-3: Lacey’s Coefficient for different channel conditions
Channel Conditions Range of Lacey‘s Coefficient (β)
Alluvial Channel 4.7 - 4.9
Boulder Gravel Mixed soil 4.1 - 4.7
Rocky Channel 3.6 – 4.1

Flood Control and Management Manual DESIGN CRITERIA AND PROCEDURES
WECS 6-3
6.2.6 Scour Magnitude
The depth of the scour below HFL in alluvial rivers having width equal to or greater than the Lacey waterway shall
be calculated using equation 6.4 (Lacey‘s Equation).
6.4
Where the normal/Lacey‘s waterway of the stream is restricted, scour depth may be calculated using the design
discharge intensity proposed by Blench, 1957 (Equation 6.5).
6.5
Where,
df = regime mean flow depth in m
Q = Design discharge in m3/s
q = discharge intensity (m3/s/m) during design flood (allowing for any non-uniformity across the channel
width.)
f = silt factor given by:
6.6
Where: D50 = median size of river bed particles, The scour depth, ds, (water surface to base of the scour hole) is then obtained by multiplying df by a factor Z whose values depend upon the location of the scour.
6.7
Based on classification of scour by Lacey, the following values of Z shall be used while designing the river
training works
Table 6-4: Recommended multiplying factors (Z) at different locations of the river training structures
S.N. Channel Situation Value of Z
1 Straight Reach 1.25
Apron, bank and along the guide banks of a straight reach 1.5
2 Nose of Guide Banks
Well streamlined 1.75
Poorly streamlined 2.0
3 Nose of spurs 2.0
Gentle convex bend in bank 1.5
4 Bank subject to direct impingement 2.0
Source: Design Manual for Irrigation Projects in Nepal, 1990
Actual scour depth (ds‘) below existing river bed may thus be determined as:
d's = ds – db 6.8 Where, db is difference between highest flood level and existing river bed level, as depicted in Figure 6-1.
Allowances has to be made for any anticipated general or cyclic degradation and any channel deepening induced
by the training works themselves. The scour depth for a gravel-bed river with coarse and poorly sorted material
shall be computed as:
Figure 6-1: Definition sketch for calculation of scour depth for gravel bed river & alluvial river bed

Flood Control and Management Manual DESIGN CRITERIA AND PROCEDURES
WECS 6-4
d's = zb – Da 6.9
6.10
6.11
6.12
6.13
In which the zb is the thickness of active layer, Da is the smallest armour size in gravel bed, e is the porosity of
the bed material, Pa is the fraction of all the armor sizes present in the bed material, d’s is the scour depth,
is the shear velocity, h is the depth of flow, I is the energy slope, D50 is the median particle size,
is the kinematic viscosity of water, Ss is the specific gravity of sediment. The porosity shall be determined by
following empirical formula:
6.14
6.2.7 Sediment
Sediment data include channel bed and bank material samples, sediment gradation, total sediment load (water
discharge versus sediment discharge), sediment yield, channel bed forms, and erosion-deposition tendencies.
Aggradation, rising of river bed level, occurs when the sediment load is more than the carrying capacity of the
river, and degradation occurs when the river energy is excessive, there is low sediment content and the river bed
is erosion prone. If the river reach is experiencing d/s progressing degradation, then the following USBR formula
shall be used to assess ultimate degradation.
6.15
Where, = ultimate depth of degradation below average bed level
= Change in slope from existing to future stable slope;
L = distance to d/s control point, m
Aggradation shall be assessed by field evaluation of sediment deposits and by comparing historical river cross sections.
6.3 DESIGN OF FLOOD EMBANKMENT
A flood embankment is designed to protect low lying areas from being inundated with recurrent floods.
6.3.1 Alignment and Spacing
The following points shall be considered while proposing the alignment of embankment along the river:
i. Reduction of the existing waterway area shall be avoided as much as possible;
ii. The alignment shall be as straight as possible. Sharp curves should be avoided since these portions are
subject to direct attack of flow;
iii. Where there is sufficient space, the dike should not be too close to the river channel or riverbanks to
prevent undermining or scouring;
iv. The embankment alignment should not pass through valuable land, historical or religious structures, and
weak/permeable foundation;
v. Caution should be given that continuous dikes/ embankments on both banks should not be provided to
avoid far reaching consequences of irreversible aggradations; and
vi. Alignment of embankments should also be planned so that land acquisition for embankment construction
is feasible and is not prolonged.
The spacing between the embankments in jacketed reach of river should not be less than 3 times regime
waterway for the design flood discharge for large and medium rivers in Terai. In no case should an embankment
be placed at a distance less than regime waterway.

Flood Control and Management Manual DESIGN CRITERIA AND PROCEDURES
WECS 6-5
6.3.2 Length of the embankment:
The length of the embankment should be such that it protects the area targeted and is keyed in to higher grounds
at both the ends to prevent outflanking.
6.3.3 Height
The height of the embankment shall be based on the design flood level plus the required freeboard.
6.3.3.1 Design High Flood Level
Design flood level for embankment shall correspond to the return period or frequency of the flood to be
considered depending upon the scenario of the area to be protected as described in Chapter 3,
Table 3-1.
6.3.3.2 Free board
As a guideline, a minimum free board of 1.5 m over design HFL including the backwater effect, if any, should be
provided for the rivers carrying design discharges up to 3000 cumecs. For a higher discharge or for aggrading
flashy rivers a minimum free board of 1.8 m over the design HFL shall be provided. This should be checked also
for ensuring a minimum of about 1.0 m free board over the design HFL corresponding to 100 years design flood.
6.3.4 Top Width
The top width of the embankment shall be designed for the dual-purpose of local road and flood control. In such a
case the top width should be at least 5 m or a width adequate for the type of vehicular-traffic designed to use the
embankment. Turning platforms 6m wide and 15 to 30m long with a 3m wide ramp with a side slope 1:3 shall be
provided towards the land side of the embankment in every kilometer for access and exit.
Clear berms of 1m width on either side sloping towards the outer edges of the embankment may be provided for
drainage. No water should be allowed to collect over the embankment at any stage. Suitably designed gutter
drains may be provided on both side slopes at intervals.
In small isolated stretches of the river where no road is feasible, the top width of the embankment shall be not be
less than 3m to accommodate the tools and plants for construction. However, the minimum width shall be
governed by the design criteria to prevent the embankment from possible collapse due to seepage.
6.3.5 Hydraulic Gradient
It is desirable to know the approximate line of seepage or hydraulic gradient line (HGL). Hydraulic Gradient line
should be determined on the basis of the analysis of the soils, which are to be used in the construction of
embankments. However, the following guidelines presented in Table 6-5 are recommended in absence of test
result.
Table 6-5: Approximate Seepage gradient of Embankment Material
Type of fill Slope of Hydraulic Gradient Line
Clayey Soil 1 in 4
Clayey sand 1 in 5
Sandy Soil 1 in 6
Source: IS 12094 (2000), Guidelines for planning and design of River Embankments
6.3.6 Side Slope
The side slopes are dependent upon the material and height of the embankment as given in Table 6-6 and figure
6-2. The side slope should be flatter than the angle of repose of the material of the embankment.
Table 6-6: Maximum Side Slope of Embankments S.N. Height (H) Maximum Slope (H:V) Condition
River side Land side
1 H ≤ 4.5m 2:1 2:1 When the soil is good and to be used in the most favorable condition of saturation and drawdown.
2 4.5m < H ≤ 6m 3:1 3:1 When the soil is good and to be used in the most favorable condition of saturation and drawdown.
Source: Handbook for flood protection, anti-erosion and river raining works, CWC (2012).
a. In cases of higher embankments protected with revetment, the river side slope shall be governed by the
revetment type as specified in section 6.9.

Flood Control and Management Manual DESIGN CRITERIA AND PROCEDURES
WECS 6-6
b. If the construction material is sand, the slope should be protected with a cover of 0.6 m thick good soil;
and it should preferably be more or less free draining material to take care of sudden drawdown towards
the riverside.
c. A minimum cover of 0.6 m over the HGL shall be maintained toward the land side of the embankment to
ensure protection against piping.
d. A berm of suitable width preferably 1.5m shall be provided to maintain the minimum cover at level where
the HGL crosses the land side slope line. For embankments above 6 m height detailed design of the
embankment incorporating soil properties of the fill material and underlying foundation shall be carried
out and included in the project estimate.
Figure 6-2 Typical Cross Section of a homogeneous Embankment Source: Handbook for flood protection, anti-erosion and river raining works, CWC (2012).
6.3.7 Slope Surface Protection Works
Generally the side slopes and 0.6 m width on top from the edges of the embankments should be turfed with grass
sods. In embankments which are in imminent danger of erosion, necessity of protective measures such as slope
protection by rip-rap and / or river training works should be examined in Section 6.4.
Figure 6-3 Typical Cross Section of a Zoned Embankment
6.3.8 Borrow Areas
Generally borrow areas will be on the river side of the embankments and located at a minimum distance of 25 m
from the toe of the embankment for height less or equal to 6m and 50m for height greater than 6m. The
recommended mean distance of the borrow pits from the toe of the embankments as well as the depth of borrow
pits should generally be as described in Table 6-7.
Table 6-7: Recommended distance and depth of borrow pits from Embankment toe Distance of borrow pits (m) from toe
Maximum depth of borrow pits(m)
Riverside Land side
25 to 50 1 0.6
50 to 75 1.5 0.6
75 to 100 2 0.6
Source: Handbook for flood protection, anti-erosion and river raining works, CWC (2012).
In order to stop development of flow parallel to the embankment, cross-bars in the burrow pits shall be provided
at every 50 m with widths 8 times the depth of borrow pits. In certain cases when the depth of the borrow pit is

Flood Control and Management Manual DESIGN CRITERIA AND PROCEDURES
WECS 6-7
limited to 0.3 meters the borrow pit may be closer to the embankment but in no case the distance between the
toe of the embankment and the edge of the borrow pit shall be less than 5 meters.
6.3.9 Drainage
For drainage, longitudinal drains on the berm and cross drains are to be provided at suitable places as collectors.
Toe drain should be provided to prevent sloughing of toe. Perforated pipe embedded in properly designed graded
filter shall be provided at toes of large embankments susceptible to toe failure.
6.3.10 Safety Measures in Design
Embankments and associated structures should be stable under all stages of construction and conditions of
drawdown. It is therefore necessary that stability checks for various conditions should be done to ensure safety.
Seismic forces should also be considered for high embankments. The factors of safety should be more than 1.5.
Safety against cracks due to unequal settlement and wetting: Unequal settlements can be largely avoided by
preparing the foundations properly and by selecting suitable material for construction. Where the foundation soil
is weak, suitable strengthening measures must be taken. Clayey soils containing organic matter such as remains
of plants and root or sodic soils that tend to disperse when wet should be rejected. Well graded homogenous
materials are most suitable for construction. In case of difficulty in getting full quantities of suitable material,
zoned sections with impervious core and a pervious casing may be adopted. High embankments must be
mechanically compacted in layers to achieve optimum density with appropriate moisture content. Breaking of big
clods especially in clayey soils is to be done and organic/vegetable matter removed to safeguard against
seepage/leakage/piping.
If dispersive subsoils are encountered, the disturbance of this soil should be avoided whenever possible. If this is
not possible, minimize exposure of dispersive soils, provide a minimum cover of 150 mm of non-dispersive
topsoil and revegetate to prevent erosion. Embankments should not be constructed with dispersive soils. Some
dispersive soils form a cake layer on top surface – soil crusting – and this sign needs to be investigated in
potential burrow areas and it is best to discard them. Adjacent areas with dispersive soils should be prepared
such that runoff is distributed and sand blocks and filters or geotextiles are embedded in critical locations to
control tunneling and gully erosion. No excavations, trench drainage construction should be allowed in dispersive
soils. Upland drainage control is required to minimize runoff through the dispersive soils.
The dispersive soils can also be treated chemically to increase the strength with increase in lime, alum and
gypsum content up to certain limit, the use should be limited and the runoff from this area should not be allowed
to pollute the waterways. The treated soils regain strength permanently. Chemical ameliorants such as hydrated
lime (calcium hydroxide), gypsum (calcium sulphate), alum (aluminum sulphate) and long chain polyacrylamides
have been used to prevent dispersion and piping in these soils. Hydrated lime is the most commonly applied
product with the rate varying between 0.5 to 4.0 % by weight, depending on soil chemistry and level of
dispersion. In alkaline soils (pH >7.3), hydrated lime is not suitable due to the formation of insoluble calcium
carbonate. Accordingly, gypsum is the preferred ameliorant. In certain cases, the dispersive soils encountered in
the alignment may need to be removed, re-engineer the foundation and construct the embankment using suitable
soils hauled from another area. Disposal areas of the dispersive soils need to be carefully done to prevent
erosion and environmental degradation. No water ponding is to be allowed in areas with dispersive soils.
6.3.11 Anti-flood Sluices
Sluices with regulating arrangements should be provided for land side drainage. Sluices may be designed as per
provision of drainage design discussed in Section 6.5
6.3.12 Stability Analysis for High Embankments
The criterion for stability analysis for high embankment is based on the stability analysis of embankment dams.
The most important cause of failure of an embankment is sliding. A portion of the earth may slide downwards and
outwards with respect to remaining part, generally along a well-defined slide surface. The failure is caused when
the average shearing stress exceeds the average shearing resistance along the sliding surface due to various
loading conditions.
Slope stability is generally analyzed by two methods depending upon the profile of failure surface viz. (a) Circular
arc method and (b) Sliding Wedge method. In the ―Circular arc‟ method or ―Swedish Slip Circle‟ method, the

Flood Control and Management Manual DESIGN CRITERIA AND PROCEDURES
WECS 6-8
rupture surface is assumed cylindrical or in the cross- section by an arc of a circle. The sliding wedge method
assumes that the failure surface is approximated by a series of planes.
For low embankments, it is usually adequate to design the sections with considerations of hydraulic gradient and
minimum cover for all stages of construction, condition of saturation and draw down provided that the foundation
conditions are satisfactory. For high embankments the section proposed should be checked for stability by
Swedish Circle method. The minimum factor of safety aimed at should be 1.5.
If the embankment is located in an area subjected to earthquakes, the design should be checked for additional
earthquake induced loads equivalent to 0.1g for vertical acceleration and 0.2g for horizontal acceleration. Special
analyses and geotechnical designs are required if the embankment lies on or is on the vicinity of major faults.
i. Selection of design parameters
The shear strengths and apparent cohesion of materials from representative borrow areas for embankment
construction and of the foundation material of the embankment is obtained by performing tri-axial shear tests.
The undisturbed samples of the foundation materials are used for the tests while for the embankment material
the samples are compacted to target compaction values. Testing in each case shall be from zero to maximum
normal stress expected in the embankment.
The design shear parameters for fill material is fixed at 75% availability from an adequate number of samples,
and for foundation soils minimum shear strength values along foundation obtained are adopted after rejecting
extreme or freak values.
ii. Analysis procedure
The procedure of obtaining driving and resisting forces involves assumption of a tentative cross-section of the
embankment, a possible circular failure surface, division of the slip circle mass into a number of slices,
calculation of forces on each slice and summation of the forces. The factor of safety against sliding for assumed
failure surface is obtained by the equation:
6-16
Where:
FS = Factor of safety
S= Resisting or stabilizing Force
V = Driving or actuating force
N = Force normal to the arc or slice
U = Pore water pressure.
= Angle of shearing resistance
W = Weight of the slice
= Angle made by the radius of the failure surface with the vertical at the centre of slice.
C1 = Unit cohesion, and
b = Width of the slice
iii. Stability computation
The slope stability analysis is carried out to get the minimum factor of safety for a tested section under different
loading conditions for downstream and upstream slopes respectively. The computer programmes used for static
analysis are used for the computations or simple analytical methods can suffice also.
iv. Final selection of embankment section
Based on the results of studies for slope stability by static and pseudo static methods, the required parameters
for the design of a section are selected. These parameters are used to design safe and economic sections for the
embankment. The experience of the designer and the data on behavior of embankments constructed in almost
identical situations are important.
v. Additional defensive design measures The design details should also include additional measures for the safety and defensive measures to enhance
performance. These measures may include:

Flood Control and Management Manual DESIGN CRITERIA AND PROCEDURES
WECS 6-9
Provision of adequate freeboard for settlement, slumping and fault movement.
Use of wide transition zones of materials not vulnerable to cracking.
Use of drains near critical zones and central portion of embankment.
Use of wide core zones.
Use of adequate well-graded filter zone upstream of core to serve as a crack stopper.
Controlled compaction of embankment zones.
Removal or treatment of foundation materials that are of low strength or density.
Widening of core at abutment interfaces.
Special treatment of foundations at faults including provision of transition embankment sections.
Stabilization of hill slopes susceptible to sliding around reservoir rim.
Figure 6-4: Flow Chart for Design of an Embankment
6.3.13 Bank Protection Works
The selection of the type of bank protection works depends upon the river problems to be solved and
construction materials readily available. Revetments, spurs, combination of spurs and revetment, retards are
some common type of structures constructed for bank protection works. Guidelines for the selection and design
of these structures are given in sections below:
6.4 DESIGN OF REVETMENT
The revetment structure protects the slope from erosion and consists of slope armoring works, foundation works
and toe protection works. The components of revetment are illustrated in the Figure 6-5.
Data Input
1 Design discharge (Q),
2 River slope (S),
3 Average cross section area (A),
4 Manning‘s Coefficient (N)
5 Gradation of river bed material
Hydraulic Analysis for determining
6 Average velocity (V = Q/A) and local velocity (Vl),
7 Silt factor (f),
8 Manning‘s Coefficient (N)
9 Scour depth
Design outputs
10 Alignment & Spacing
11 Free board
12 Height of embankment
13 Side slopes
14 Stability analysis for high embankment
15 Auxiliary works (drainage, berms, turfing, pitching etc.)

Flood Control and Management Manual DESIGN CRITERIA AND PROCEDURES
WECS 6-10
Figure 6-5: Components of Revetment
6.4.1 Design Criteria for Revetment
Similar revetment is not applicable in all hydro-geological conditions. A particular type of revetment is found functional as well as durable for a particular situation. Its selection is based on certain design criteria as depicted below in Figure 6-8.
Table 6-8: Design criteria of Revetment Type of Revetment
Allowable velocity (m/s)
Slope of revetment(H:V)
Remarks
Sodden Riverbank with Pile Fence
2 2:1 a. Not applicable for places near roads and houses. b. Diameter and length of wooden pile shall be determined considering
past construction records. c.Diameter of fill boulder shall be determined as given in Section 6-10
Dry Boulder Pitching
3.0
Milder than 2 :1
a. Diameter of boulder shall be determined using method specified in Section 6-10
b. Height shall not exceed 3 meters.
Gabion mattress
5 Milder than 1.5 : 1
a. Size of the gabion box shall be determined using mass specific weight. b. Gabion works is not advisable in rivers where diameter of boulders
present in river bed material greater than 20cm.
Gabion (Pile-up type)
6.5 1.5 : 1 to 0.5 : 1 Same as above for gabion mattresses
Precast Cement blocks
1.5:1 a. Thickness of the concrete blocks may be determined by similar way as described in pitching stones.
b. The specific density of the concrete block may be taken as 2400 kg/m
3.
Grouted revetment (spread type)
5 1.5 : 1 to 0.5 : 1 a. Generally revetment may be provided in panels of size 3mx3m or 3mx5m. The size of panel may be varied depending upon the length of river reach to be protected and length of slope.
b. Drain holes or weep holes may be provided in each panel for free drainage of pore water from saturated bank soil beneath it.
c. The weight and thickness of the panel is determined in similar manner as gabion pitching.
Reinforced concrete
a. Concrete pavement revetments are cast-in-place on a prepared slope to provide the necessary bank protection. However, it is among the most expensive river bank protection designs. Because rigid revetments are prone to failure, Concrete slope paving should only be used if other counter measures are not feasible.
b. Provide minimum 20cm thickness
Sheet pipe Vertical a. Provided for deep foundation
Source: Technical Standards and Guidelines for design of flood control structures, June 2010, Department of public works and Highways, JICA

Flood Control and Management Manual DESIGN CRITERIA AND PROCEDURES
WECS 6-11
6.4.1.1 Location and Alignment
Revetments are placed on slopes that are exposed to high current such as at outer bends and other locations
where river flows impinge directly on the banks and slope cannot be allowed to be eroded. The alignment of
revetment shall follow that of the river channel while severe curves shall be smoothened.
6.4.1.2 Design Height
The design height of a revetment should be equal to the design flood level plus minimum 0.3m in unconstricted reaches and 0.60m in constricted reaches. Erratic phenomena such as embankment settlement, aggradation etc. should be considered when establishing freeboard heights.
6.4.1.3 Segment Length
The length of one segment of revetment in the longitudinal direction should be less than 50 meters in order to
prevent the extension of damage once the section of revetment collapses. Edge of the segment end shall be
adequately filled with joint material (mortar) to connect with the adjoining revetment.
6.4.2 Loose Stone Pitching
6.4.2.1 Size of Stone
a. Tractive force design relationship :
This method gives realistic result in subcritical flow condition. The median size of the stone in SI unit is given by:
Where = Correction factor for rock specific gravity (Csg)
= Correction factor for stability factor
6.18
6.19
SF = Stability Factor given in Table 6-10
= average velocity in m/s
da = average depth of river in m
=specific gravity of boulders (may be adopted as 2.65)
K = the ratio of the incipient motion tractive force on a sloping surface to the incipient motion
tractive forces on a level surface and is defined as:
6.20
Angle of Bank Slope (degrees)
= Riprap angle of repose (degrees) and values of for different pitching stones are given in
Table 6-9
Table 6-9: Angle of Repose of Different Materials Median diameter in
mm Angle of Repose in degree
Crushed ledge rock Very angular Very rounded
0.30 32.0 31.4 29.2 1.50 34.5 32.9 29.5 3.00 36.6 33.8 29.9 15.00 40.0 37.5 32.5 30.00 40.8 39.1 34.8 150.00 42.0 41.2 38.3
Source: KG Rangaraju, 1993, Flow through Open Channel, Tata MCGraw Hills Publishing Co. Ltd. New Delhi India;
Stability factors, SF for various flow conditions are tabulated in Table 6-10
6.17

Flood Control and Management Manual DESIGN CRITERIA AND PROCEDURES
WECS 6-12
Table 6-10: Stability factors (Sf) of revetment stones in flow conditions
Flow Condition Stability Factor Range
Uniform flow; Straight or mildly curving reach (curve radius/channel width is more than 30 ); Impact from wave action and floating debris is minimal; Little or no uncertainty in design parameters.
1.0 – 1.2
Gradually varying flow; Moderate bend curvature (30 > curve radius/channel width > 10 ); Impact from waves, ice or floating debris moderate.
1.3 – 1.6
Approaching rapidly varying flow; Sharp bend curvature (curve radius/channel width is less than 10 ); Significant impact potential from floating debris and/or ice; Significant wind and/or boat generated waves (1 - 2 feet); High flow turbulence; Turbulently mixing flow at bridge abutments; Significant uncertainty in design parameters.
1.7- 2.0
Source: Design of Riprap Revetment, HEC 11
b. Velocity based method:
For critical flow condition velocity based method shall be used to determine the weight of the pitching stones to
get the realistic result. In this method weight of a stone in Kg (W) on horizontal bed shall be calculated by
California Bank and Shore Protection equation:
6.21
Where V = mean velocity of flow and Ss = specific gravity of stone
And, the weight of stone in kg (W) on river bank slope shall be calculated by:
6.22
Where, K is slope correction factor expressed by Equation 6.20.
Isbash (1936) presents an equation for mean velocity against stone and is useful for critical flow condition.
6.23
C = Isbash constant 0.86 to 1.20: The lower value for the Isbash constant represents the flow velocity at which
loose surface stones first begin to roll. The higher value represents the flow velocity at which stones protected by
adjacent particles begin to move and roll until they find another ―seat‖.
= Median diameter of spherical stone, m
Mean velocity shall be expressed by following equation for common pitching stone.
V = 5.68C
6.24
The size of the spherical stone D% shall be determined by following relation:
6.25
Where = Weight of D% (% passing category of stone) stone in kg
Minimum dimension of stones > D%
6.4.2.2 Thickness of Pitching stone
The thickness of revetment is generally based on the flow velocity, sediment runoff likely to occur in the proposed
works, soil and hydrostatic pressure at the back of revetment and other associated factors.
Minimum overall thickness t in metre shall not be less than:
i. the spherical diameter of the D100 stone or 1.5 times the spherical diameter of the D50 stone or
whichever is greater
ii. 0.30 m for practical placement.
Layer thickness determined either by criterion 1 or 2 should be increased by 50% when the riprap is placed
underwater to compensate for uncertainties associated with this placement condition.

Flood Control and Management Manual DESIGN CRITERIA AND PROCEDURES
WECS 6-13
6.4.3 Gabion revetment
In case of crates filled with stones, the bulk specific gravity of the protection is required to be worked out to
account for the porosity. The mass specific gravity of the protection shall be worked out using following
relationship:
6.26
The empirical relation for the porosity ‗ ‘ is given below.
6.27
Where, D50= median diameter of stones used in crate in millimeters.
and are specific gravity of gabion filled with stone and stones (kg/m3)
= porosity of the boulders in gabions.
For working out volume of crates, Sm should be used instead of Ss. Shape of crates or blocks should be as far as
possible cubical. The minimum size of the stones filled into the gabion mattresses should not be smaller than the
minimum opening size of the mesh. Crates may be made of G.I. wire or nylon ropes of adequate strength and
should be with double knots and close knits. For minor works the value of shall be taken as 0.40.
6.4.4 Filter
The filter is required below the revetment and launching apron to avoid washing out of finer materials. Either the
use of an inverted (graded) filter or geo-synthetic filter may be used. However, geosynthetic filter is preferable
from the point of quality control and is more convenient. The specification for synthetic filter is given in Chapter 7.
A graded filter of size 150 mm to 300 mm thickness may be laid beneath the pitching to prevent failure by sucking
out of the finer base by flowing water. Filter has to satisfy the criteria with respect to the next lower size and the
base material:
(i) For uniform grain size filter,
6.28
(ii) For graded material of sub-rounded particles,
6.29
6.30
6.4.5 Pilarczyk’s Current Attack Equation
Pilarczyk (1995) presented a design formula for making a preliminary assessment of pitching and alternative
protection elements (such as gabions) to resist current attack.
6.31
Parameters specific to this stability formula and guidance on how to use equation is given below:
1. Where = nominal thickness of the protection element (m); and this shall be determined as:
Pitching stone and rip-rap: =Dn50 0.84D50(m)
Box gabions and gabion mattresses: = average thickness of element (m)
For blocks thickness of block
2. Relative submerged density,
rip-rap and pitching stones:
= / – 1

Flood Control and Management Manual DESIGN CRITERIA AND PROCEDURES
WECS 6-14
box gabions and gabion mattresses:
= (1 - )( / – 1)
where = layer porosity =0.4,
= apparent mass density of stones (kg/m³), and
= mass density of water (kg/m³)
3. Critical mobility parameter of the protection element, (dimensionless)
The mobility parameter expresses the stability characteristics of the system. The ratio compares the stability
of the system to the critical Shields value of loose stones, which is used as a reference. The ratio thus
enables a first impression (and not more) of the (relative) stability of composite systems such as gabions and this
should always be verified in a model test.
rip-rap and armour stone: = 0.035
box gabions and gabion mattresses: = 0.070
rock fill in gabions: < 0.100
4. Stability correction factor, :
Relationships for hydraulic stability of protection elements are based on continuous layers. However, in practice
armour stone is not placed as an infinitely continuous layer and transitions are introduced, e.g. at edges or
between gabions. By including the stability correction factor the influence of the geometry of transitions – and the
associated different hydraulic loadings – are taken into account. The values given below are advisory values and
shall be applied as a first estimate. For systems less stable than a continuous armour stone layer: > 1.
exposed edges of gabions/stone mattresses: = 1.0
exposed edges of loose rip-rap and armour stone: = 1.25
continuous rock protection: = 0.75
interlocked blocks and cabled block mats: = 0.5
5. Turbulence factor, :
low turbulence and uniform flow: = 0.67
normal turbulence level at straight reach: = 1.0
non-uniform flow, increased turbulence in outer bends: = 1.5
non-uniform flow, sharp outer bends: = 2.0
non-uniform flow, special cases: > 2
6. Velocity profile factor, :
is the conversion factor for from the local bottom mean velocity to the mean velocity. Following formulae are
presented for a fully developed velocity profile and a non- developed profile.
fully developed logarithmic velocity profile:
not fully developed velocity profile:
Where, d= water depth (m), D= size of the protection materials and kr = roughness height (m); kr = Dn50 for rip-rap
and armour stone; for shallow rough flow (d/D < 5), k h 1 shall be applied.
7. Side slope factor, ksl
The side slope factor is defined as the product of two terms: a side slope term, , and a longitudinal slope
term :
=
where and ; is the side slope angle (º), is the angle of repose of the armour
stone (º) and is the slope angle in the longitudinal direction (º).

Flood Control and Management Manual DESIGN CRITERIA AND PROCEDURES
WECS 6-15
8. V= Average Velocity of flow and g = acceleration due to gravity.
6.4.6 Toe Protection
To prevent the sliding and failure of the revetment on slope, the toe is to be protected. This may be in the form of
a simple toe-key, toe wall, sheet pile or a launching apron
i. Toe Key
A toe key may be provided at the toe when rock or an un-erodible stratum is available just below the river bed
and the overlaying banks are erodible. The key is in the form of stone or concrete blocks filled in the trench below
the hard river bed for depth equal to the thickness of pitching ―t‖ for proper anchorage. Sole purpose of this key is
to provide lateral support to the pitching. The key may be of mortar or in geo-bags similar to the pitching material.
ii. Toe wall When a hard stratum is available below the river bed at a reasonable depth, toe wall is recommended. The
thickness of the toe wall depends upon height of wall and height of overlaying pitching. The toe wall may be
designed as retaining wall and be constructed in masonry or gabions along with provisions for weep holes. The
depth of the foundation shall be placed at least 1.0 m below the deepest riverbed or the anticipated scour level.
iii. Launching Apron Launching apron should be provided for protection of toe and it should form a continuous flexible cover over the
slope of the scour hole in continuation of pitching up to the point of deepest scour. Launching apron should be
laid at normal low water level, or at as low a level as techno-economically viable.
The size and shape of apron depends on: (i) size of stone, (ii) thickness of launched apron, (iii) the depth of scour
and (iv) slope of launched apron.
Thickness of Launching Apron: The thickness of launching apron depends upon the thickness of the pitching on slope. The thickness of the
launched loose apron should be 50 percent more than the thickness of the pitching on the slopes to compensate
for uncertainties associated with placement of stones after launching underwater. However, this shall not be
increased in case of gabion apron.
Depth of Scour The extent of scour depends on angle of attack, discharge intensity, duration of flood and silt concentration, etc.
Scour depth calculation is explained in section 6.2.6.
Slope of launched apron The slope of the launched apron may be taken 2 H : 1 V for loose boulders or stones and 1.5 H : 1 V for concrete
blocks or stones in crates. Adequate quantity of stone for the apron has to be provided to ensure complete
protection of the whole of the scoured face slopes.
If the scour hole slope is 1:Z then length of apron to protect scour hole slope is given by:
6.32
The thickness of launched apron shall be increased by 50% to compensate for uncertainty of pitching under
water. In case of gabions, the thickness of the launched apron shall be maintained as pitching thickness of the
embankment slope and same thickness of gabion mattresses or gabion boxes shall be laid horizontally to a
length of Ls to fill the scour hole.
6.5 ANTI-FLOOD SLUICE
The design of anti-flood sluice involves consideration of many factors related to hydrology, hydraulics, physical
environment, imposed exterior loads, construction, maintenance and socio-economics. Two types of anti-flood
sluices are shown in Figure
For major tributaries, the least cost solution to the problem may be too allow flood waters to spread to
secondary drainage channels or tributaries and construct embankments along the tributaries tying to the
main line embankment with bell mouth shaped opening and extending upstream to the limit of backwater
influence or high ground.
Culverts are effective only when the main river is at low flow, one-way flow vertical gates or flap
gates/valves may be installed in culverts. This will require some ponding to be developed which will

Flood Control and Management Manual DESIGN CRITERIA AND PROCEDURES
WECS 6-16
develop enough head to automatically open gates to permit out flow when the main river flow is lower. The
gates will close automatically to prevent entry of backwater from the main stem river when the head
differential is reversed. The culverts may either be slab culvert or closed piped culverts.
To obtain adequate head for a pressure conduit to be effective, elevation of the piped conduit must be
sufficiently high to permit gravity discharge, and supplementary pumping facilities or ponding areas with
gravity outfall are required to pass drainage downstream of conduit intake as well as any flow in excess of
conduit capacity. Design principle of anti-sluice involves the fixation of u/s FSL of flood behind the
embankment, assessment of quantity of flood water passing through the sluice, selection of types of
sluices, sizing of sluice opening with suitable sluice gate and provision of appropriate energy dissipation
devices downstream of the sluice.
Figure 6-6: Images of typical flood sluices (ungated ) in Karnali embankment and gated flap valve in Kamala Embankment.
6.5.1 Fixation of FSL at Outfall
The FSL of the flood water behind the embankment should at least be slightly higher than the dominant flood
level of the river. The dominant flood level is the stage of river/outfall which is (a) attained and not exceeded for
more than 3 days at a time; and also (b) attained and not exceeded 75% of time over a period of preferably not
less than 10 years.
6.5.2 Capacity /design discharge
Normally the flood sluice is provided to accommodate the design discharge within natural valley lines of drains
without raised embankments so as to allow free flow of water from the surroundings areas. Estimation of run off
from the bunded area shall be as given below:
The flood sluices shall be designed for 3 day rainfall of 10 year return period for terai region and 24hr rainfall for
hilly area. However, in specific cases requiring higher degree of protection, return period of 25 year may also be
adopted.
6.5.2.1 Runoff Estimation from bunded areas
If the sluice is for passing the flood from the bunded field, the run-off from bunded field, for example paddy field,
will be estimated by simple water balance with following assumptions:
Water balance in Terai shall be:
• initial water level is 40cm;
• maximum water level is 300mm which may persist for up to one day;
• depth in excess of 200 mm may persist for up to 3 days;
• no rain follows the design rainfall for several days;
• Losses due to evapotranspiration and deep percolation are replaced by on-going irrigation /or flood
inflows during the design rainfall.
The balance may be expressed as:
For t

Flood Control and Management Manual DESIGN CRITERIA AND PROCEDURES
WECS 6-17
h = 40 + – Q.t 6.33
For t h = 40 + P – Q.t 6.34
Where, h is the depth of water in field in mm, P is the design three day rainfall in mm (5 years return period) in
mm, t is the number of days that have elapsed since the rainfall begins and Q is the drainage runoff in mm / day.
Similarly, water balance in hills shall be:
• initial water level is 40cm;
• maximum water level is 100mm;
• no rain follows the design rainfall for several days;
• Losses due to evapotranspiration and deep percolation are replaced by on-going irrigation /or flood
inflows during the design rainfall.
The balance may be expressed as:
h = P – 60
6.35
6.5.3 Design Considerations:
1) The box culverts are normally designed as free flowing. The pipe culverts are designed as free or full
flowing. Free board should be minimum 0.2m for allowing siltation inside the culvert.
2) The design velocity is normally limited to 1 to 1.5m/s to prevent scour d/s of culvert.
For box culvert, velocity through the sluice opening (vs) is given by:
6.36
Where, hl = HFL of drain - HFL
3) Culvert opening area shall be determined as:
6.37
Area of the box culvert and slab culvert of width B and water depth h be A = Bh,
In case of free flow inside piped conduit at water depth h (m) and internal radius of pipe, r in m., A shall be
calculated by:
6.38
In full pressure flow condition
6.5.3.1.1.1 6.39
4) The barrel of the culvert is designed as reinforced concrete member whereas the wing walls and returns
walls not necessarily be as an RCC member.
5) Concrete pipes are generally used for piped culverts, although HDPE pipes may be suitable for small drains.
The pipes are embedded in masonry or mass concrete headwalls. For low cost structures head walls may
be omitted and the pipes are projected through the river bank slope
6) The thickness of the pipe will be decided based on the uplift below pipe. The uplift is calculated by drawing
velocity gradient line from outlet to inlet. The highest uplift may occurs at situation when the d/s river flows in
minimum level and u/s drain flows at highest level.
7) The design water level in the drains out falling into rivers should be ensured that the drain can flow
unhampered throughout most of the year. It is likely that there will be times of year when flood water levels
in the river are high and the sluice is unable to drain. Such events are inevitable, and it is generally not
practicable to design against them, although the outfall level of drain should be higher than river level.
Periodic backing up in the drainage system thus is accepted. In some instances,
8) Maximum duration of river flood should be assesses from available flood data.

Flood Control and Management Manual DESIGN CRITERIA AND PROCEDURES
WECS 6-18
6.6 DESIGN OF FLOOD WALLS
Flood walls may be the alternative of embankment to protect urban areas, areas close to important facilities or in boulder stage rivers. Figure 6-7, shows several types of flood walls in river frontage.
Figure 6-7: Types of Flood walls
6.6.1 Lateral and Vertical forces
Figure 6-8 illustrates the different vertical and lateral forces that act on a typical flood wall and Table 6-11 gives
their computation. The numbers in parenthesis in Figure 6-8 is the identification (ID) of the load as given in Table
6-11.
Figure 6-8: Typical Loads or Forces acting on Flood Walls
Table 6-11: Lateral Forces imposed by soil, water and earthquake and moment about toe of the wall
Load ID
Load Pressure Force Moment about Toe (A)
(1) Traffic Surcharge
(2) Saturated earth above water
((h/3+hw))

Flood Control and Management Manual DESIGN CRITERIA AND PROCEDURES
WECS 6-19
Load ID
Load Pressure Force Moment about Toe (A)
(3) Saturated Earth below water table
(4) Water Pressure
(5) Water Pressure
(6) Passive Earth Pressure
(7) Earthquake
(8) Uplift
(9) Self-weight
(10) Base friction
The magnitude of the forces and bending moment about the toe shall be calculated using the expressions given
Table 6-11. The common values of specific weight ( ) of structural as well as the retained material is given in
Table 6-12. The value of traffic surcharge coefficient S shall be taken as 350 kg/m2 for normal construction and
operating conditions and higher values should be used if larger machinery or cranes are to be brought near it.
Table 6-12: Specific Weight of Different materials Dead Load Symbol
Specific Weight
Water 9.8
Stone / stone masonry 21
Mass Concrete 24
Reinforced Concrete 25
Steel 78.5
Dry soil 16
Saturated soil 20
Dry compacted soil 18.5
Saturated compacted soil 21.5
Gabions 14
The value of active earth pressure coefficient Ka and the passive earth pressure coefficient (Kp) are related to
forces exerted by the retained material and are calculated using the angle of repose of retained soil from Table
6-13.
6.40
The passive earth pressure coefficient (Kp) is the reciprocal of Ka:
6.41
Table 6-13: Typical Value of Angle of friction of foundation soil
Soil type Gravel 40
0 - 55
0
Sandy gravel 350 - 50
0
Sand (loose) 280 - 34
0
Sand (dense) 340 - 45
0
Silt, silty sand (loose) 200 - 22
0
Silt, silty sand (dense) 250 - 10
0

Flood Control and Management Manual DESIGN CRITERIA AND PROCEDURES
WECS 6-20
The earthquake loading is calculated using an acceleration coefficient, which is multiplied by dead weight of the
structure to produce an additional lateral loading acting on centre of gravity of the structure. For smaller
structures, earthquake loading shall be ignored. For major structures, the value of the coefficient ―e‖ for
foundation on soil with bearing capacity greater than 50kN/m2 and less than 50kN/m
2 shall be estimated as 0.15
and 0.25 respectively:
6.6.2 Flood wall Design
6.6.2.1 General Dimensioning of Wall Geometry
Figure 6-9: Typical Section of Retaining wall / Flood wall
a. Wall height shall be at least up to high flood level plus free board as specified in Section 6.3.3. In case of
walls adjacent to roads, it should be kept at least 0.80m above road level for aesthetic purpose.
b. Typically, the footing is located under the wall in such a manner that 1/3 of its width forms the toe and 2/3
of the width forms the heel of the wall.
c. Steps for access to the river shall be provided at every 500 m alternately on either side of the banks for
bank protection works in urban areas or additional if necessary.
d. The river width between the flood walls on both the bank should be sufficient to allow flood peaks pass
without causing more than 10% reduction in the designed river water width.
e. The footing should rest on suitable natural soil or on controlled and engineered backfill material at least 1m
below the design scour level. If suitable rock strata is available, it should be suitably benched and the
foundation anchored on it.
Gravity walls:
Typical wall thicknesses at top (W) of gravity walls (stone or brick masonry and plain concrete) shall be 30 to 40
cm. The footing width depends on the magnitude of the lateral forces, allowable soil bearing capacity, dead load,
and the wall height. The width of a gravity wall at base shall be estimated at first based on the thumb rule such
that base width is 0.6 times wall height. Iterative design shall be done to come up with the optimal design.
Cantilever wall:
a. Cantilever wall is a vertical or inclined RCC slab monolithic with a slab base. They are also classified
according to their shapes such as L type wall of inverted T type wall.
b. A cantilever wall is generally economical for heights up to about 6 m.
c. RCC cut-offs shall be placed under the footing as a safety key, although excavation for their construction
may be complicated due to sand boiling. It may be suitable for smaller heights, for larger walls, steel or
plastic sheet piling shall be used.
d. The depth of cut off or sheet pile should at least be more than the anticipated scour depth calculated with
the factor of safety and the width of concrete cut off should be at least 20 cm.
In case wall is unsafe against sliding a shear key shall be provided beneath the wall footing on the heel side or as
a extension of shear key for concrete construction. The factor of safety against sliding shall be checked along the
failure surfaces i.e along the horizontal plane passing below cutoff or shear key and along the inclined plane
joining the base of the cutoff and toe of the footing (A-B).The factor of safety shall be checked based on following
loading conditions as indicated below.

Flood Control and Management Manual DESIGN CRITERIA AND PROCEDURES
WECS 6-21
Figure 6-10: Loading on Cantilever Wall with shear key
If = Total vertical force acting at the key base
= shearing angle of passive resistance R= Total passive force = Pp x a
= 45 + /2 PA=Active horizontal pressure at key base for H+a = Ka γ (H+a) Pp= Unit passive pressure on soil above shearing plane AB
/2) = P. Kp
P = Earth pressure at BC =Total frictional force under flat base
Friction Coefficient
For equilibrium, = FOS x PA
R = Total Passive Resistance = Pp x a FOS= / PA
Counterfort wall:
Counterfort wall is a vertical or inclined slab supported by buttresses monolithic with the front of the wall slab and
the base slab. These are suitable for greater heights (above 6m) when the cantilever wall becomes
uneconomical. The design of a counterfort wall shall be somewhat complex because the number of components
which must be designed differently than for a conventional cantilevered wall.
Buttressed wall:
Buttressed wall is same as the counterfort wall but the buttress are on back of the wall. Buttressed reinforced
concrete retaining walls are seldom used. Such walls are generally used in those cases where property line
limitations on the earth retention side do not allow space for the large heel of a traditional cantilevered retaining
wall.
6.6.2.2 Design Steps
Compute all applied loads, soil pressures, seismic load, axial load, surcharges, impact, or any others as
specified in Section 6.6.1.
Compute overturning moments, about the front (toe) bottom edge of the footing. For a trial, assume the
footing width, to be about 1/2 to 2/3‘s the height of the wall, with 1/3 being at the toe. The top width of
cantilever RCC wall shall be up to 15cm to 20 cm and its front face shall be battered in 1:50 slope.
Compute resisting moments about the front edge of the footing.
Check factor of safety against sliding and overturning.
Based upon an acceptable factor of safety against overturning, calculate the eccentricity of the total vertical
load. Is it within or outside the middle-third of the footing width?.
Calculate the soil pressure at the toe and heel. If the eccentricity, e, is > B/6 (B = width of footing) it will be
outside the middle third of the footing width (not recommended!), and because there cannot be tension
between the footing and soil, a triangular pressure distribution will be the result. Consult with the project

Flood Control and Management Manual DESIGN CRITERIA AND PROCEDURES
WECS 6-22
geotechnical engineer if this condition cannot be avoided, as it will result in a substantially lowered
allowable soil bearing pressure.
Design of the stem is usually an iterative procedure. Start at the bottom of the stem where moments and
shears are maximum. Then, for economy, check at one third and two third up the stem to determine if the
bar size shall be reduced or alternate bars dropped.
Design footing for moments and shears and select reinforcing.
Redesign if the sections adopted were too large or too safe.
Design steps of Counterfort Retaining Wall:
After establishing the retained height, select a spacing for the counterforts, usually one-half to two-thirds of
the retained height. Determine the footing width required and soil bearing at both the toe and heel because
it will be needed to establish the counterfort dimensions, and for stability calculations as if the wall is a
continuous cantilevered wall. You can add an estimated weight of the counterforts prorated as a uniform
longitudinal axial load.
Design the wall as a two-way slab, fixed at the base and at the counterfort crossings and free at the top.
Design the footing toe as a cantilever from the wall.
Design the heel as a longitudinal beam spanning between counterforts.
The counterfort will be a tapered as trapezoidal shaped tension member.
Check the final design for stability, overturning, sliding, and soil pressures
6.6.2.3 Combination of Loads
The final structural dimensions of the floodwall shall be fixed to resist anticipated earth, flood related forces for
the following combination of loads.
1. River at HFL + Surcharge+ saturated soil behind wall
2. River at lowest water level + surcharge+ saturated soil behind wall
3. River at HFL and no soils behind wall above top surface of wall footing/foundation.
6.6.2.4 Factor of safety against Sliding
A wall, including its footing, may fail by sliding if the sum of the lateral forces acting upon it is greater than the
total forces resisting the displacement. The resisting forces should always be greater than the sliding forces by a
factor of safety. The Minimum factor of safety against sliding shall be 1.5.
FS = 6.42
Where,
= F1+F2a+F2b+F3+ F4+F7
= F5+F6+F10
Shear key shall be provided to ensure both economy and safety of the wall if it fails in sliding but is safe in
overturning and bearing pressure. A shear key generates additional resistance to sliding because of the passive
earth pressure due to the soil in front of the shear key. Passive earth pressure being much greater than active
earth pressure, even a small depth of shear key can generate tremendous resistance to sliding.
6.6.2.5 Factor of safety against over turning
The flood wall may also fail by overturning. This may occur if the sum of the overturning moments about the toe is
greater than the sum of the resisting moments about it. The sum of resisting moments is kept greater than the
sum of the overturning moments by a factor of safety, which shall be adopted a minimum of 2.0
FS = 6.43
= M1 to M4, M7and M8
= M5, M6, and M11

Flood Control and Management Manual DESIGN CRITERIA AND PROCEDURES
WECS 6-23
6.6.2.6 Eccentricity of resultant forces:
The resultant forces should pass within the middle third of the foundation. If the eccentricity is more than B/6,
where B is the width of the foundation, the resultant force will lie outside the middle third of the foundation and
create a tension zone in the foundation. The position of the reaction(x) is calculated from Equation 6-45.
6.44
Eccentricity, 6.45
Where,
6.6.2.7 Minimum and maximum Pressure at the Toe and Heel
The bearing pressures (BP) are calculated from:
6.46
A wall may fail if the pressure under its footing exceeds the allowable soil bearing capacity.
The bearing pressure for the foundation soil is calculated by allowing maximum allowable settlement (25cm)
using standard penetration test at structural site. However, for minor structures, the allowable bearing pressure
as denoted in Table 6-14 may be used. The minimum allowable pressure at the heel is zero.
Table 6-14: Allowable bearing Capacity of different soils:
Soil Type Allowable bearing Pressure
1 . Soft Clays & silts <80
2 . Firm clays and firm sandy clays 100
3 . Stiff clays and stiff sandy clays 200
4 . Very stiff boulder clays 350
5 . Loose well graded sands and gravels / sand mixtures 100
6 . Compact well graded sands and gravels / sand mixtures 200
7 . Fine, Loose dry sands <100
8 . Black cotton soil 150
6.6.2.8 Steps in Design of Reinforced Section of a Cantilever Wall
a. Draw the load diagram of different loads as tabulated above in Section 6.2.2 and calculate the maximum
bending moment and reactions at critical sections.
b. Calculate maximum shear force (F) in N
c. Calculate the wall thickness using formula:
d 6.47
Where, Mr = Maximum bending moment at design section (N-mm)
R = a factor related to the concrete steel permissible stresses.
d = effective depth of a wall (mm)
b = width of wall
d = effective depth of the reinforced section
d. Calculate the steel reinforcement area (mm2) as:
6.48
Where is permissible stress of steel and j is lever arm. Determine the spacing of bars per m
run of the wall:
6.49
Where, is area of a bar

Flood Control and Management Manual DESIGN CRITERIA AND PROCEDURES
WECS 6-24
e. The minimum and maximum area of main reinforcement steel shall be 0.25% and 4% of the concrete area
respectively.
f. Check maximum shear stress (N/mm2) of the wall sections by:
6.50
The shear stress qv in no circumstances exceeds the qc.
g. Values of R, J and allowable shear stresses of concrete and steel shall be obtained from design codes.
6.7 DESIGN OF SPURS (GROYNES) AND STUDS
6.7.1 Function:
Spurs (Groynes) are structures constructed transverse to the river flow and extend from the bank into the river.
These protect the bank on which are located and deflect the main current according to their orientations. A typical
layout of spurs in group is presented in Figure 6-11.
Figure 6-11: Typical Layout of Spurs in group
Spurs fulfill one or more of the following functions:
a. Training the river along a desired course by attracting, deflecting or repelling the flow of a channel.
b. Creating a slack flow with the object of siting up the area in the vicinity.
c. Protecting the river bank by keeping the flow away from it.
d. Contracting a wide river channel, usually for the improvement of depth for navigation.
6.7.2 Design Approach for Spurs
The river bank characteristics that influence decision to use spurs are bank height, bank width, bank
configuration, and bank vegetation. Spurs are best suited for the protection of low- (less than 3m) to medium-
height (from 3 to 6m) banks from the erosion. Short-radius bends (less than 120m) is usually not cost effective
when compared to other counter measures. They are also well-suited for use along steep-cut banks where
significant site preparation would be required for other counter measure types. Studs are usually used for bank
protection in the rivers having width less than 30m so as to avoid the negative impact of river on opposite bank or
further downstream. Use of studs in between the spurs constructed in river embayment is very effective to protect
bank. The success of repelling type spur depends upon the extent and the quickness with which scour occurs at
the nose, and also on how quickly the pockets between the spurs get filled up with sediment. The impermeable
groynes under this limitation are useless in Boulder Rivers, in which the rate of silt deposition may be slow or in
flashy rivers in which floods rise and fall so quickly that desired silting does not take place.
6.7.3 Classification of Spurs
A. Classification according to method and materials of construction
B. Classification according to the height of spur with
respect to water level
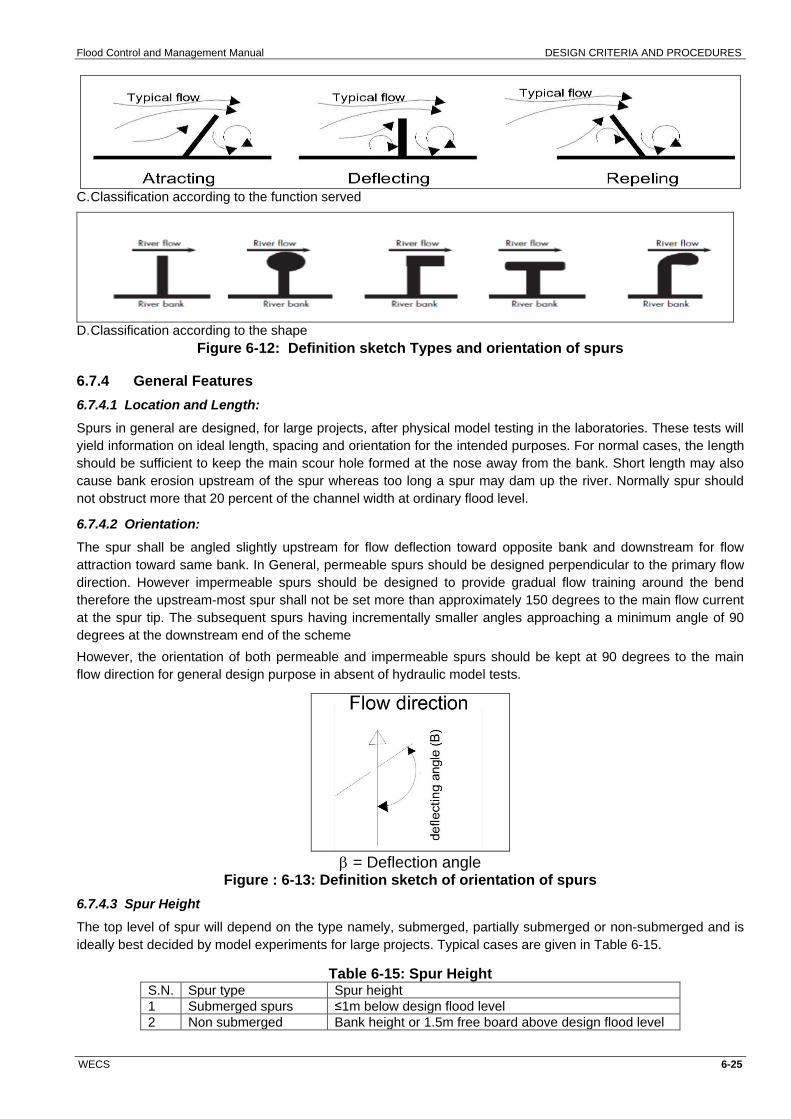
Flood Control and Management Manual DESIGN CRITERIA AND PROCEDURES
WECS 6-25
C. Classification according to the function served
D. Classification according to the shape
Figure 6-12: Definition sketch Types and orientation of spurs
6.7.4 General Features
6.7.4.1 Location and Length:
Spurs in general are designed, for large projects, after physical model testing in the laboratories. These tests will
yield information on ideal length, spacing and orientation for the intended purposes. For normal cases, the length
should be sufficient to keep the main scour hole formed at the nose away from the bank. Short length may also
cause bank erosion upstream of the spur whereas too long a spur may dam up the river. Normally spur should
not obstruct more that 20 percent of the channel width at ordinary flood level.
6.7.4.2 Orientation:
The spur shall be angled slightly upstream for flow deflection toward opposite bank and downstream for flow
attraction toward same bank. In General, permeable spurs should be designed perpendicular to the primary flow
direction. However impermeable spurs should be designed to provide gradual flow training around the bend
therefore the upstream-most spur shall not be set more than approximately 150 degrees to the main flow current
at the spur tip. The subsequent spurs having incrementally smaller angles approaching a minimum angle of 90
degrees at the downstream end of the scheme
However, the orientation of both permeable and impermeable spurs should be kept at 90 degrees to the main
flow direction for general design purpose in absent of hydraulic model tests.
= Deflection angle Figure : 6-13: Definition sketch of orientation of spurs
6.7.4.3 Spur Height
The top level of spur will depend on the type namely, submerged, partially submerged or non-submerged and is
ideally best decided by model experiments for large projects. Typical cases are given in Table 6-15.
Table 6-15: Spur Height S.N. Spur type Spur height
1 Submerged spurs ≤1m below design flood level
2 Non submerged Bank height or 1.5m free board above design flood level

Flood Control and Management Manual DESIGN CRITERIA AND PROCEDURES
WECS 6-26
Permeable spurs should be designed to a height that will permit the passage of heavy debris over the spur crest
and not cause structural damage.
6.7.4.4 Spacing:
Model studies may be conducted for site specific cases. However, in absence of model study, for small projects,
the spacing of the spurs adopted in terms of the length (L) of the spur as tabulated in Table: 6-16.
Table 6-16: Spur Spacing S.N. River reach Spur spacing in
metre Remarks
1 Straight 3L The spacing shall be smaller in narrow rivers (Width < 200m) and larger for wide rivers > 500m. The discharges should be nearly equal in curved & straight reaches
2 Curved (concave bank) (3 to 3.5) L
3 Curved (convex bank) (2 to 3)L
6.7.4.5 Spur Crest Profile
Permeable spurs should be designed with level crests unless bank height or other special conditions dictate the
use of a sloping crest design. Impermeable spurs may have level crest too. However in general, impermeable
spurs should be designed with a slight fall towards the spur nose, thus allowing different amounts of flow
constriction with stage (particularly important in narrow-width channels), and the accommodation of changes in
meander trace with stage. (two profiles: sloping in both direction and stepped)
6.7.4.6 Channel bed and bank embedment
The spur should be keyed a minimum of 2m into the channel bank to protect the spur from being flanked when
flood stages overtop the spur. The nose or tip of the spur is vulnerable to being undermined by the scour hole
that will develop due to the flow contraction that occurs at the spur tip. Therefore, the spur tip needs to be
protected against undermining from scour. A launching apron shall be put at the spur tip to protect the spur from
undermining. Design procedure for the launching apron is same as stated in Section 6.4.5.
6.7.5 Design of Impermeable Spurs
6.7.5.1 Top width:
The top width of spur should be 3 to 6 m as per requirement for placement and movement of equipment used for
construction of spurs.
6.7.5.2 Side Slopes:
Slopes of the sides and nose of the spur should be between 2:1 and 3:1 depending upon the material used. For
cohesionless soils, slopes on upstream and downstream faces of 2(H): 1 (V) may be adequate. For spurs
constructed wholly in stones steeper slopes may be adopted. However in piled up gabion spurs, footings with
adequate width may be provided to attain the stability of the spur against sliding and overturning.
6.7.5.3 Size and weight of stone for pitching:
The size and weight of the pitching stone required on the sloping face of spur may be worked out using the same
procedure given in Section 6.4.1.
6.7.5.4 Thickness of Pitching:
The thickness of pitching should be equal to two layers of stones determined for velocity as indicated in Section
6.4.2. The thickness ‗t‘ of the pitching should be provided in an appropriate length of upstream shank or stem of
the spur up to which the river action prevails and the semicircular nose.
6.7.5.5 Launching apron
The launching apron shall be designed using the same procedure indicated in Section 6.4.5 and shall be
wrapped around the nose and extended to the base of the spur. The length of the apron will vary as shown in
Table 6-17.
Table 6-17: Multiplying Factor (F) for maximum depth of scour S.No. Location Value of F
(i) Nose 2 to 2.5
(ii) Transition from nose to shank and first 30 to 60m in upstream
1.5

Flood Control and Management Manual DESIGN CRITERIA AND PROCEDURES
WECS 6-27
(iii) Next 30 to 60m in upstream 1.0
(iv) Transition from nose to shank and first 15 to 30m on downstream.
1.0
Design of a typical spur is presented in Appendix-3
Figure 6-14: Plan showing Value of Multiplying factor, Maximum scour for spurs and Cross Sections
Studs are a series of short spurs (length 10 to 15m) that can help to deflect the flow from the bank to be
protected. These are angled 10 to 20 degrees upstream and spaced about 75m apart. They are most effective in
straight or relatively flat convex banks, where stream lines are parallel to the bank. Studies are also provided in
bitween two spurs constructed across the bank where the attack of river flow is critical.
Figure 6-15: Typical Studs for bank protection
6.7.6 Sloping Spurs
Impermeable spurs designed with a slight fall towards the spur nose, thus allowing different amounts of flow
constriction with stage are termed as sloping spurs. They are effectively used to protect the bank erosion in
narrow-width river without imparting adverse impact on opposite bank or further downstream. Two profiles of

Flood Control and Management Manual DESIGN CRITERIA AND PROCEDURES
WECS 6-28
sloping spurs namely spur sloped in both directions (transverse and longitudinal) and spur stepped in length
(longitudinal) direction are in common practice in River Training works.
Spur stepped in length (longitudinal) direction are constructed of gabions. Spur is made of gabions and steps are
designed in such a way that its height goes on decreasing at different locations towards the nose. Construction of
such spurs is easy and also economical if boulders are available nearby the construction site.
Body of sloping spur sloped in both directions is generally made of either river bed material or boulder depending
upon the river flow impact and the severity of the problem. Gabions or concrete blocks are used to cover the
body for protection. Concrete blocks used to cover the body of sloping spurs constructed with river bed materials
in East Rapti River near Manhari, Makwanpur to protect East West Highway road embankment is found quite
effectively functioning. In case of river bed material used for construction of spur body, suitable filter fabric is used
beneath the cover to protect the body materials from escaping along with the flow of the river. Side slope of the
spur body is fixed based on the angle of repose of the material used in construction. However, side slope of
1.5H:1V in case of boulder and 2H:1V in case of river bed materials is generally adopted for construction of spur
body. As per the design requirement, launching apron along the whole length of spur in upstream side, up to half
length of spur in downstream side (from nose to middle of spur length) and in nose (semi-circular shaped) of the
spur is provided to safe guard the spur from scour action. Spurs sloped in both directions are much effective as
they allow smooth passage of flow at different stages across the spur body and traps maximum silt in the pockets
in between the spurs. Volume of the materials used for construction of the body of such spurs is accurately
calculated using integration method as explained in the report. Typical spur sloped in both directions is illustrated
in Figure 6-16 below.
Figure 6-16: Typical Sloping Spur

Flood Control and Management Manual DESIGN CRITERIA AND PROCEDURES
WECS 6-29
6.8 BED CONTROL STRUCTURES
Sills/Bed bars, check dams and drops are provided to prevent rivers from deepening and to stabilize the riverbed
over a long distance. These are essentially erosion protection works in mountainous rivers/streams and in flashy
rivers in the Terai zone.
6.8.1 Design of Check dams
These are traverse structures provided to stabilize the longitudinal profile of steep mountainous torrents. The
Check dams shall be constructed from a wide range of locally available materials including boulders, wood,
bamboo, gravel/ sand, concrete, masonry, and many other materials.
Figure 6-17: Check Dam to control erosion and Gully Plugging (Source ICIMOD Resource Manual)
The design steps involved in check dam design shall be as follows:
6.8.1.1 Spacing
The space between consecutive check dams is selected to obtain the desired gradient between the bottom of the
upper dam and the top of the lower dam – known as the compensation gradient. The spacing depends on the
slope of the original waterway, the compensation gradient, and the effective height of the dams (DSCWM 2005).
It is given by
6.51
Where, d = spacing between two successive check dams (horizontal distance), h = height of the check dams up to the notch, S0 = existing slope of bed in per cent, and Se = stabilizing slope of bed in per cent (usually 3–5%).
The number of check dams (N) required in the stream is calculated as follows (DSCWM 2005):
6.52
Where, a = total vertical distance between the first and the last check dam in the gully or torrent, b = total vertical distance of the gully, and H = average height of the dams.

Flood Control and Management Manual DESIGN CRITERIA AND PROCEDURES
WECS 6-30
Figure 6-18: Check Dam Layout to control steep streams or torrents
6.8.1.2 Design Runoff Estimation
The method of estimation of design runoff is given in Section 3. The rational formula developed by
WECs and DHM shall be used for small catchments in Nepal. The centre of the check dam should be
made lower to form spillway through which the discharge occurs. The notch (spill way section) is
designed to accommodate the peak runoff and dimensions are calculated accordingly.
Where, Q = design discharge (m3/s), is known from other estimations.
C = discharge coefficient, 3 for loose rock, log and brushwood dams; 1.8 for gabion and cement masonry dams. L = length of spillway section (m), and H = depth of spillway (m).
6.8.1.3 Foundation depth
The check dams are built on a foundation which anchors them into the ground to increase stability and ensure
that they do not collapse or overturn when the peak flow or run off occurs or the dams are silted up. The
following should be taken into account in the design and construction of the foundation:
• The bottom of the foundation should lie below the anticipated scour level.
• In erodible strata, if df is the mean flow depth below the designed highest flood level, , the minimum depth
off foundation below the highest flood level (ds) should be1.5df.
• The scour depth should be taken from the expected bed level after siltation of the lower check dam and
establishment of the new bed gradient, due to the reduced bed load after the erosion control.
• As a rule of thumb, take the foundation to be 1m.
6.8.1.4 Scour depth
The safety of the check dams is mostly endangered by scouring. Scour occurs when the bed velocity of the
stream reaches the velocity that can move the particles of the bed material. The scouring action of the current is
not uniform; it is deeper at the obstruction and at bends.
The scour depth (df) is calculated from Schocklitch‘s formula in case of hilly torrent (DSCWM 2004):
6.54
Where, df = scour depth in m below water level,
dm= grain diameter in mm, determined on the basis that 90% of the bed material is smaller than dm,
h = water level difference in m above and below the check dam, and
q = runoff in m3/m width of spillway.
6.53

Flood Control and Management Manual DESIGN CRITERIA AND PROCEDURES
WECS 6-31
The breadth of the scour hole is calculated as 1.5 × length of the notch. The length of the scour hole or
apron is calculated as in case of torrent. A launching apron should be constructed in
the stream bed immediately downstream of checkdam to protect the bed erosion.
6.8.1.5 Structural stability of Check dam
Check dams are designed for safety against overturning, safety against sliding, and safety against the
bearing pressure on the foundation soil follow the same the procedure given in design of flood wall.
6.8.2 Sabo Dam
Sabo dams are relatively small structures built across the stream bed in upstream areas in the form of a cross
dike. Their main functions of this type of dam are to: (1) reduce the volume of sediment discharge and (2) prevent
the movement of sediments on streambeds, consequently reducing the impact of debris flow, as shown in Figure
6 -17. Sabo dams are usually constructed using masonry, concrete, reinforced concrete, or steel cribs according
to the conditions in the planned area.
Based on their purpose and the way they function, sabo dams are classified into four types:
• check consolidation dam;
• river bed erosion control dam;
• river bed sediment runoff control dam; and debris flow control dam.
Figure 6-19: Sabo Dam (Debris Arresting Dam)
6.8.2.1 Design Procedure:
Sabo structures must be designed according to the intended function and should be stable enough to
withstand all the expected design forces. The main steps in designing a sabo dam are as follows:
setting general design considerations,
determination of design parameters of debris flow,
design of open section,
design of dam body,
design of dam foundation, and
design of other appurtenances.
6.8.2.2 Design considerations
The basic design parameters are defined by the hydrological parameters, geological and topographical
conditions at the proposed locations. The dam should be located on stable ground, if possible on firm
bedrock, as dams mostly fail by sliding and slope failures. Ideally the dam should be located in a stable
narrow section of the riverbed to give the highest stability and most cost effective construction. The height of
the dam is usually reduced if it has to be built on a gravel base.

Flood Control and Management Manual DESIGN CRITERIA AND PROCEDURES
WECS 6-32
6.8.2.3 Design parameters of the debris flow
Dynamic forces of the flowing debris which include the height and velocity of debris flow, maximum water
stage, peak debris discharge, density of debris etc. are the major design parameters. The catchment
sediment yield, peak runoff and land uses are also parameters that affect the sizing of the sabo dams.
6.8.2.4 Designing the open section
The topography and geological features upstream and downstream of the sabo dam should be taken into
consideration when designing the open section. The axis of the sabo dam is placed at right angles to the
direction of the river with the open section at the centre of the river course. The open section should be at
least 3m wide, and the final width also depends on the width of the stream bed. The height of the open section
is determined from the design depth of the opening, the free board, and the maximum diameter of boulders
expected in the debris flow.
A 50% sediment discharge is added to the actual flood discharge to obtain the design discharge.
6.55
Where, Qs= design discharge including sediment, and Q = actual flood discharge.
6.8.2.5 Design of the dam body and foundation
The design of the body of the dam is based mainly on a stability analysis. The main forces acting on the
dam body are overturning, sliding, and bearing resistance of the foundation. The debris flow hydraulic
forces are calculated by assuming a unit weight of debris-laden water of 11.8kN/m3.
The dam foundation is determined by considering the bearing capacity and the nature of the underlying
foundation material (soil or rock). Foundation treatment such as construction of a cut-off wall is
recommended when the material is poor. A cut-off wall should be constructed at the toe of the dam to
prevent damage by scouring.
The design loads that must be considered for a gravity type sabo dam are:
• hydrostatic pressure,
• sediment pressure,
• uplift pressure,
• seismic inertia force, and
• Hydrodynamic pressure during an earthquake.
6.8.2.6 Sub-sabo dam
A sub-sabo dam shall be constructed when the main dam height is high or the overflow depth is deep. The main
function of a sub-sabo dam is to reduce the overflow energy of the mass overflowing the dam. Selection of the
position of the sabo dam and sub-sabo dam should be based on the extent of sedimentation and designed to
prevent sediment-related disaster.
The desirable distance between the main dam and sub dam shall be calculated using the following empirical
formula.
6.56
Where L = distance between the main dam and sub dam,
= 1.5~2.0 (value depends on height of sabo dam at overflow section and width of crest),
H1 = height of the main dam (front apron) above the bedrock (m), and
h3 = overflow depth of the main dam (m).
6.8.3 Sills / Bed bars
6.8.3.1 Height
The ground sill/bed bar is provided to stabilize the riverbed, but it creates instability in the immediate downstream
riverbed reaches of the river. In general, the crest height of a ground sill/bed bar shall coincide with the design
bed height, and the standard height shall be less than 2 m.

Flood Control and Management Manual DESIGN CRITERIA AND PROCEDURES
WECS 6-33
The ground sills/bed bars lower the water level profiles suddenly at their locations causing sudden increase of
flow velocity. This condition tends to lower the riverbed immediately upstream of the ground sill/bed bar as well
as scouring of the downstream area. These aspects should be considered in the determination of the crest
height. Both sides of the ground sill/bed bar body shall be anchored sufficiently in to dikes or revetments forming
the banks of the torrent. Sufficient length of an impervious floor d/s of sill/bed bar with cutoff wall/ sheet piles
shall be provided to protect it from piping and scouring tendency of flow. A launching apron with concrete blocks
protection shall be provided at d/s end of the apron to protect it from d/s degradation.
Figure 6-20: Typical Ground sill/bed bar
The sill/bed bar should be checked for surface flow condition for design flood to determine downstream flood level.
6.9 DESIGN OF STABLE CHANNEL
Channels need to be designed to safely discharge the design flood and the sediment load entering into it to make
it stable and sustainable. The depth of flow, longitudinal slope and dimensions of the channel need to be
determined. The channels shall be constructed as rigid channels, permitting discharges with higher velocities so
that no sediment gets settled in the channel and yet the channel boundaries are not eroded. The construction
ease, operational criteria and maintenance issues all need to be carefully though over in designing rigid
channels. In erodible boundaries, i.e. the earthen channels, the velocities need to set to be within the non-
erodible and non-scouring velocities.
6.9.1 Channel lining
Channel lining is a protective layer used to protect the banks and bed of a channel against erosion. Channel
lining can help increase the velocity of flow, prevent sediment deposits and growth of vegetation. Lined structures
also enhance hydraulic efficiency, reduce seepage and strengthen the banks and thus are recommended in such
problem areas. Lined channels have also been increasingly used in built-up areas to reduce footprint. However,
channel lining can have a marked environmental impact and the necessity and the type of structure should be
carefully assessed.
Channel lining structures shall be made from many materials including concrete gabions, and wood, as well as
earth, rocks, asphalt, and plastic. Concrete and cement linings have a higher environmental impact, while natural
materials generally a lower one. Nonetheless, concrete or boulder lined channels have been the most common
practice currently.
6.9.2 Design of rigid boundary channels
The principle of hydraulic design of channels with rigid boundary like rock cuts or artificial linings is to maintain a
velocity at which the fine sediment in suspension will not settle to the boundary and yet the velocity is smaller
than that which can damage the lining. The design involves the Manning's equation for determination of h and B
for given values of Q, n and S and width discharge relationship for trapezoidal channel specified by USBR as
given in Table 6.18
Table 6-18: Channel width discharge relation Q (m3/s) 1.0 10.0 20.0 100.0
B(m) 1.2 2.4 2.9 8.0

Flood Control and Management Manual DESIGN CRITERIA AND PROCEDURES
WECS 6-34
6.9.3 Design of Non-Scouring Erodible Boundary Channels
The design principle of this type of channel condition is to obtain a cross section in which the material on the
boundary is on the verge of motion. Such a design has been carried out by using Lanes Tractive shear stress
method.
Figure 6-21:ForcesTable acting on a particle resting on slopping side of a channel.
Assuming negligible longitudinal slope of a channel, for a particle resting on a side channel making angle 0
with
the horizontal surface and having an angle of repose of the bank material , the shear stress which just causes
movement ( )shall be computed by following expression:
6.57
Where, is shear stress on the bed of the channel.
z = cot
W' = submerged weight of the boundary materialThe unit weight of boundary materials ()shall be taken from
Table 6-12. One can calculate K for known values of and . of boundary material and shall be taken from
Table 6-13 The bed shear stress is taken as 90% of critical tractive shear stress . The critical tractive stress
shall be computed either by use of Shield diagram or expressions given below:
6.58
6.59
6.60
where, τ* = Shields parameter, dimensionless
c = critical shear stress ( N/m2)
s = specific weight of sediment (N/m3)
w= specific weight of water (N/m3)
D = particle diameter (m)
6.9.4 Alluvial Channels:
There are several approaches in designing alluvial channels, and are discussed below. Kennedy Equation
Kennedy found that the non-scouring and non-silting velocity U0 is related to depth by equation:
U0 = 0.55mh0.64
6.61

Flood Control and Management Manual DESIGN CRITERIA AND PROCEDURES
WECS 6-35
Where h is expressed in metre, U0 in m/s and m is critical velocity ratio m (defined as U/U0) is greater than unity
for coarser sand and less than unity for finer sands. This combined with normal flow equation like Manning's
Equation provides two equations for determination of three unknowns B, h and slope S (if side slope of
trapezoidal section Z is assumed) for known values of Q, m and N.
If the h value determined after assuming S and Z is significantly different than recommended width depth ratio for
stable canals given in table 6-18 suitable modification in the slope would be necessary. Typical design Example
is given in Appendix 3
Table 6-19 :Recommended approximate width – depth ration for stable channels
Q(m3/s) 5.0 10.0 15.0 50.0 100.0 200.0 300.00
B/h 4.5 5.0 6.5 9.0 12.0 15.0 18.0
Lacey's (1929) proposed the following equations for channel design describing the relationships among channel
slope S, water discharge Q, and silt factor, fs for taking the consideration of sediment size on the channel
dimension (Ranga Raju, 1993).
6.62
P = 4.75Q1/2
6.63
6.64
Where, silt factor, fs = 1.76D50
1/2
R = Hydraulic radius in m, V = Average flow velocity m/s, Q = Water discharge, m3/s and D50 = mean diameter of
bed material in mm.
6.9.5 Design of an Artificial Cut-off
Cutoffs are short channels across the neck of bends made
to cut off the loop and direct the flow through a direct path.
Cutoff decreases the original channel length resulting in
some changes in flow regime. Construction of cutoff
combined with downstream stabilization hence helps to
meet its purpose effectively. It helps to protect settlements
behind the loop and reclaim the large chunk of land.The
typical artificial cutoff is presented in Figure 6-21. The
design of an artificial cut-off, its alignment and cross section
are based on the following considerations:
a. To design a pilot channel, its alignment should be traced
first; the entrance of the pilot channel is usually located
in the concave bank of the bend well upstream of point
of inflection to avoid the deposition of excavated
channel by sediment. The shape of entrance to a cut-off should be made as bell-mouth.
b. The shape of the cutoff may be both straight and curved, in former case; the pilot ditch is usually passed
along the axis of the cutoff while in the latter case, along the cutoff‘s convex band.
c. The pilot ditch should amount to be 1/10th to 1/3
rd of entire channel width and depends on erosion resistance
of soil and the slope advantage due to cutoff. The least cost excavated channel that meets the local criteria
for widening is selected from tractive force ratio which is the ratio of RS of both channels
d. Assuming the flow division between the old river bend and the pilot channel, backwater computations are
made for each alternative pilot channel cross section for a range of likely discharges from a common point
Figure 6-22: Cutoff Channel
A B

Flood Control and Management Manual DESIGN CRITERIA AND PROCEDURES
WECS 6-36
downstream of the cutoff (point B). Computations are continued by trial and error until a common level of
energy grade line at upstream point ( point A) is obtained, indicating the assumed flow diversion is correct.
e. Another assumption is that the sediment transport capacity of the pilot channel should be 1.5 to 2 times more
than the parent channel. The lanes equation shall be used to determine the multiplying factor for sediment
carrying capacity of the pilot channel with respect to parent channel.
f. As a rule of thumb, the rate of flow which has to be directed into the pilot channel in sandy soil should, at
least, be 0.25 to 0.30 of the dominant (bankfull) discharge of the parent river. However, in gravel bed river the
self-scouring is limited due to armoring, therefore the pilot channel must be deeper and the rate of flow in it
should be doubled.
g. The excavation of the pilot channel is begun from the lower end and up to the low water level only; the
remaining works has to be done by the river itself.
h. Where cuts are unlikely to develop by scour because of too low velocities or high resistance of bed material,
they should be excavated initially to the main river section. According to regime formula of Lacey RS2
depends wholly upon the particle size, where R is hydraulic radius and S is river gradient. Thus the section of
the cut-off should be excavated so that RS2 of excavated section should have at least as high as the value of
RS2 of the existing river section.
i. As the slopes of the cut and river are inversely proportional to their lengths, a workable relationship is
obtained for the pilot cut to be self-scouring, provided that the expression R/L2 (L being the length of channel
reach under consideration) is greater for the pilot cut than for the river section. Hence, in practice pilot cuts
are designed to a rather deeper section. The tractive force is directly proportional to the depth of channel.
Hence deeper cut would be helpful for rapid development
6.10 GUIDELINES FOR FLOOD CUSHION IN MULTIPURPOSE RESERVOIR PROJECTS;
6.10.1 General Definition of storage zones in Reservoirs
The storage provided by multipurpose reservoir projects shall be designed to provide flood protection if the high
flows or a part of it is retained in the reservoir. Often the storage dams have volumes set aside as surcharge
storage to attenuate the flood peaks and provide flood relief to downstream areas. The storage zones are
conceptualized to consist of the following zones or parts as shown in Figure 6-22.
Figure 6-23: Schematic Diagram of Multipurpose Reservoir showing different Storage Zones

Flood Control and Management Manual DESIGN CRITERIA AND PROCEDURES
WECS 6-37
Normal Conservation Level (NCL) is the highest level of the reservoir at which water is intended to be held for
various uses such as irrigation and power other than flood control.
Full Reservoir Level (FRL) is the highest level of the reservoir at which water is intended to be held for various
uses including part or total of the flood storage without allowing any passage of water through the spillway.
Maximum Water Level (MWL) is the highest level to which the reservoir waters will rise while passing the design
flood with the spillway facilities in full operation.
Surcharge Storage-The storage between the crest of an uncontrolled spillway or the top of the crest gates in
normal closed position and the MWL is termed as the surcharge storage.
Storage for flood control is provided to attenuate the flood in downstream areas, reducing the peak flood of the
hydrograph as shown in Figure 6-22. Flood storage depends on the height at which the maximum water level
(MWL) is fixed above the normal conservation level (NCL) and its status, if it was full or empty beforehand.
The determination of the MWL involves the routing of the design flood through the reservoir and spillway. When
the spillway capacity provided is low, the flood storage required for moderating a particular flood will be large and
vice versa. A higher MWL involves larger submergence and hence this aspect has also to be kept in view while
fixing the MWL and the flood storage capacity of the reservoir.
6.10.2 Retarding Basin or Detention Dam
Retarding basins water bodies, natural or manmade that temporarily store water reducing peak runoff
downstream and release it later or gradually augmenting low flows. These basins provide downstream flood
control, channel erosion control, and to some extent mitigate post-development reduced runoff during low flows.
The detention basins are dry structures during non-precipitation periods. A detention basin holds excess flood for
a short time before it drains out to a natural watercourse, or for a longer time for agricultural, consumptive,
aesthetic, recreational or other uses as in multipurpose reservoirs.
The discharge to the retarding basin shall be computed from a reservoir routing method.
Figure 6-24 shows a typical retarding basin, in which outflow to main channel is equal to inflow until the
inflow reaches storage starting discharge and then outflow is kept constant. The volume of the retarding
basin is computed as the sum of the diverted discharge.
Figure 6-24: Flood Control by Retarding Basin
6.10.3 Basis for Fixation of Flood Storage Level or MWL of Dams
1 Basic Data requirements for fixation of the MWL are:
Inflow hydrograph (Figure 6-25) that is reliably expected at the dam site along with potential upstream
uses and consumptive uses that may alter the inflow to the storage reservoir;
Diversion requirements as well as other outflows (environmental, evapotranspiration, seepage,
percolation, and other requirements) as a time series data if the usage is temporally varying ; and
Storage Capacity curve determined by ArcGIS or from valley contour levels using topographical maps,
plots of elevation of the reservoir versus surface area and elevation of the reservoir versus volume is
required to obtain the storage capacity curve;
Reservoir level versus spillway capacity (Figure 6-25) is required to design the spillway and fix the
maximum allowable level in the reservoir. This level is governed by the discharge permitted through the
spillway, which is a function of the width of the spillway crest and head over the crest; and
Initial outflow and storage (or initial reservoir level).

Flood Control and Management Manual DESIGN CRITERIA AND PROCEDURES
WECS 6-38
Determination of dead storage requirement requires the sediment inflow rate, trapping efficiency and the
sediment yield of the upstream catchment.
Figure 6-25: Typical Design Inflow Outflow Hydrographs & Reservoir Level Curve 2. The determination of the MWL involves the routing of the design flood through the reservoir and spillway.
Basic equation for routing flood through reservoir is given by:
6.65
Where t = time interval,
I1 = initial inflow in m3/s,
I2 = final inflow in m3/s after t h,
Ot = initial outflow in m3/s,
0s = final outflow in m3/s after t h,
S2, = final gross storage in cumec h after t h,
S1, = initial gross storage in cumec h, and
S = incremental storage in time t h.
Storage capacity is usually given in hectare-metres which should be converted into cumec- hour or cumec - day,
if the time interval t is expressed in hours or a part of a day. From flood routing the reservoir level vs time period
is plotted and the maximum water level is determined.
It should be assumed that the reservoir would be filled to the full reservoir level at the beginning of the
spillway design flood.
For the single purpose detention dam the initial level shall be the highest level maintained in reservoir
for the flood storage without allowing any passage of water through the spillway. A higher MWL involves
larger submergence and hence this aspect has also to be kept in view while fixing the MWL and the
flood storage capacity of the reservoir.
The determination of the MWL involves the routing of the design flood through the reservoir and spillway. When
the spillway capacity provided is low, the flood storage required for moderating a particular flood will be large and
vice versa. A higher MWL involves larger submergence and hence this aspect has also to be kept in view while
fixing the MWL and the flood storage capacity of the reservoir.
6.11 DESIGN OF GUIDE BANKS
6.11.1 General Principles
Guide banks are provided in rivers to confine and guide the river flow through a major structure, such as weirs,
barrages and bridges. Alluvial rivers in flood plains spread over a very large area during floods and it would be
very costly to provide bridges or any other structure across the entire natural spread. It is necessary to narrow
down and restrict its course to flow axially through the diversion structure. Guide bunds are provided for this
purpose of guiding the river flow past the diversion structure without causing damage to it and its approaches.
They are constructed on either or both on the upstream and downstream of the structure and on one or both the
flanks as required.

Flood Control and Management Manual DESIGN CRITERIA AND PROCEDURES
WECS 6-39
Guidebunds are provided in cases when 15% or more of the discharge occurs in floodplains and this needs to be
directed under a bridge or headworks. Straight or elliptical shaped guide bunds are mostly used. Figure 6-24
shows the geometry of some guidebanks.
(A).Straight Guide bank (B). Elliptical Guide bank
Figure 6-26 :Straight Guide Bank; Elliptical Guide Bank
6.11.2 Width between guide Bunds
The minimum width between guide bunds should be selected to provide the required waterway opening area
through the headworks or bridges to safely pass the design floods. Factors such HFL possible, allowable scour,
backwater etc., and construction procedure may also impose the limitation of constriction of waterway of the river
at the location of structures.
6.11.3 Length of Guide Bunds
In major structures, upstream and downstream lengths of the guidebank should be decided based on results of
model studies incorporating the past history of river in the reach where the structure is proposed. However, the
following shall be adopted in absence of modeled dimensions.
6.11.3.1 Upstream Length
a. For waterway within the close range of Lacey’s waterway (L): The upstream length of guide banks shall be
1.0 L to 1.5 L, where L is the length of structure between the abutments. For elliptical guide banks the
upstream length (that is up to the semi major axis a) is generally kept as 1.0L to 1.25L.
b. For wide alluvial belt: the length of guide banks should be decided from two important considerations
the maximum obliquity of current ( it is desirable that obliquity of flow to the river axis should not be
more than 300 ), and
the limit to which the main channel of the river shall be allowed to flow near the approach
embankment in the event of the river developing excessive embayment behind the guide bank. The
radius of worst possible loop should be ascertained from the data of acute loops formed by the river
during past. In case of river where adequate past surveys are not available, the radius of worst loop
shall be determined by dividing the average radius of loop worked out from the available surveys of
the river by 2.5 for river having a maximum discharge up to 5 000 m3/s and by 2.0 for discharging
above 5 000 m3/s. The above considerations are illustrated in Fig. 6.24. The limit to which the main
channel of the river shall be allowed to flow near approach embankment has to be decided based on
importance of structure and local conditions.
c. In cases where the detailed examination in accordance with (ii) is difficult for want of data, as a general
guide the upstream length of the guide bank may be kept 1.0Lto 1.5 L.

Flood Control and Management Manual DESIGN CRITERIA AND PROCEDURES
WECS 6-40
6.11.3.2 Downstream Length
The downstream length is adopted as 0.2L to 0.4 L so that the river flow is passed in streamline and no large
swirls and turbulence are caused by fanning out of the flow downstream which could not endanger the structure
and its appurtenances.
Figure 6-27: Typical Layout of Guide Bank
6.11.3.3 Curved head and tail of Guide Bunds
The heads and tails of the guidebunds are kept curved to guide in the river flow smoothly and axially to the
structure, and release it similarly without introducing adverse scours and flow conditions that could damage the
structure. Smoother wider curves are better but uneconomical. The radius of the curves should be kept as small
as possible a value of equal to 0.45 L has been found to be satisfactory. Radius of curved tail may be 0.3 to 0.5
times the radius of curved head.
Physical modeling could be done to test composite curves with a number of different radii.
6.11.4 Sweep Angle of Guide Bund
The sweep angle is related to the loop formation. For curved head the angle of sweep may range from 1200 to
1450 according to river curvature. For curved tail it varies from 45
0 to 60
0.
6.11.5 Design considerations
After fixing up the layout of the guide bunds in accordance with the guidelines mentioned in the foregoing
paragraphs, the details of the guide bund sections have to be worked out. The various dimensions worked out
are top width, free board, side slopes, and size of stone for pitching, thickness of pitching, filters and launching
apron. The typical embankment section of the guide bank has been given in Figure 6-25. The design guidelines
for the same are given below.
6.11.5.1 Material
Guide banks may be made of locally available materials from river bed, preferable silt, sand, or sand cum gravel.
It can also be constructed with loose stones forming a trapezoidal section. Gabions and sheet piling shall also be
used.
6.11.5.2 Top width of guide bund
Guide bunds in larger rivers or structures that require vehicular access for operation and maintenance shall have
a minimum top width of 5 m to allow vehicle movement (trucks and construction equipment) at the straight
section of embankment. The widths need to be increased to allow for vehicle turning at bends and the nose of the

Flood Control and Management Manual DESIGN CRITERIA AND PROCEDURES
WECS 6-41
guide bunds. It is also customary to stack boulders and other materials for flood fighting and emergency repair
works.
In places where the embankments are smaller and vehicular access is not deemed necessary, a top width of 2 m
suffices subject to stability against seepage path and minimum cover requirements.
6.11.5.3 Side slopes of guide bund
The side slopes of guide bund have to be fixed from stability considerations of the bund which depend on the
material of which the bund is made and also its height and maximum water depth it has to resist. Generally the
side slopes of the guide bund vary from 2:1 to 3:1 (H:V).
6.11.5.4 Free board for Guide Bund
A minimum free board of 1 to 1.5 m above the HFL is provided on all sides. The higher value of water level
should be adopted as the top level of the upstream guide bund:
a. Highest flood level for design flood
b. Affluxed water level in the rear portion of the guide bank calculated after adding velocity head to HFL
corresponding to the design flood at the upstream nose of the guide bank.
6.11.5.5 Stone for pitching
The sloping surface of the guide bund on the water side has to withstand erosive action of flow. Design of size
and thickness of stone pitching on embankment of the guide bund shall be determined by the same procedure
described in Section 6.4
6.11.5.6 Provision of filter
The pitched stones should be placed on a designed filter or geosynthetic filter so that the finer materials from the
bund below the stones are prevented from being washed out away or sucked out by the repetitive wave action
and drawdowns in water surface. Geosynthetic filters shall preferably be used to fulfill the requirement as it is
easy to lay, durable, efficient and quality control is easy. A 150 mm thick sand layer over the geosynthetic filter
shall be laid to avoid rupture of fabric by the stones
In case of non-availability of geosynthetic filter an inverted filter of the thickness 20 to 30 cm may also be
provided. Filter has to satisfy the criteria as given in Section 6.4.3.
6.11.5.7 Launching Apron (Toe Protection)
Launching apron should be provided for protection of toe and it should form a continuous flexible cover over the
slope of the scour hole in continuation of pitching up to the point of deepest scour. Design procedure for
launching apron has been given in Section 6.4.5. Launching apron should be laid at normal low water level, or at
as low a level as techno-economically viable.
The maximum scour depth d‘s is determined by multiplying the scour depth ds with factors F. The value of F at
different locations of the spur is given in Table 6-20.
Table 6-20: Scour Factor Location Scour Factor (F)
Upstream curved head of guide bank 2 -2.5
Straight reach of guide bank to nose of downstream guide bank 1.5
Downstream curved tail of guide bank 1.5- 1.75
(i) Slope of Apron After Launching For the loose boulders or stones, the slope of launched apron may be taken as 2H: 1V and for concrete blocks or
stones in wire crates, the slope may be taken as 1.5H:1V. Adequate quantity of stone for the apron has to be
provided to ensure complete protection of the whole of the scoured face according to levels and slopes as
determined in (iii) above.
(For 2:1 slope of launched apron and scour factor 2.5 for upstream curved head and 1.5 for shanks)

Flood Control and Management Manual DESIGN CRITERIA AND PROCEDURES
WECS 6-42
Figure 6-28: Typical Details of Guide Bank
(ii) Sizes and shape of Launching Apron
After determining the thickness of launched apron as described in previous section (Section 6.4.5) and the level
of design scour to be adopted for different portions of the guide bank, the quantity of stone required for launched
position of apron from laid level to design scour level shall be calculated. The quantity of stone so calculated may
be provided in a wedge shape having a width of l.5 Ds for loose dumping stone launching apron (Figure 6-26)
and average thickness, T. Thickness of laid apron may be kept 0.8 T near the toe of the guide bank and 1.2 T at
the river end. However, for gabion launching apron the thickness of launched apron shall be maintained same as
slope pitching and a gabion box is considered as a single unit of launching material to fill the scour hole.
Therefore, height of the gabion should be the same height of pitching on slope. The thickness of horizontal apron
should be multiple of gabion thickness. The length should be decided with respect to launched length and length
of gabion.
6.11.5.8 Afflux Bund
Afflux bunds extend from the abutments of guide bunds (usually) or approach bunds as the case may be. The
upstream afflux bunds are connected to grounds with levels higher than the afflux highest flood level or existing
flood embankments, if any. The downstream afflux bunds, if provided, are taken to such a length as would be
necessary to protect the canal/approach bunds from the high floods. The design procedure for afflux bund
section shall be the same as flood embankment.
6.12 SUBMERGED VANES
Submerged vanes are low longitudinal stone or other erosion resistance material filled structures which are
designed to guide the flow away from an eroding bank. Top of vanes are below the design water surface
elevation and would not connect to the high bank. They are angled upstream to redirect overtopping flows away
from the bank to be protected while providing pooled area for deposit of sediments. Overtime, these vanes fill up
the river portion they are located in and guide the deeper thalweg away from the bank to be protected. A typical
layout and cross section of river after construction of the submerged vanes is shown in Figure 7.9
(Layout of vanes for bank protection (left) and Cross section sketch of river after installation of vanes (rights)

Flood Control and Management Manual DESIGN CRITERIA AND PROCEDURES
WECS 6-43
Figure 6-29: Bank profile after implementing the submerged vanes
The key design/construction elements of vanes are length, crest orientation angle, crest elevation and slope,
channel width and depth, channel centerline radius of curvature for the bend, local scour, stone size, placement
of appropriate foundation rocks, and vane spacing. Orientation and size of the submerged vanes should be
decided after the model study to get their desired results. However, for preliminary design following assumption
shall be adopted:
a. At the bankline, vane height shall be between (a) the annual mean high water, or 2 year return period
design water surface elevation and (b) the elevation of the lower limit suitable for the establishment of
woody riparian vegetation.
b. The orientation angle should be 20 to 30 degrees from the bank-line tangent.
c. Spacing of vanes measured along the chord between two adjacent vanes should not exceed 5Tw where
Tw is the thalweg width.

Flood Control and Management Manual CONSTRUCTION MATERIALS AND TECHNOLOGY
WECS 7-1
7 CONSTRUCTION MATERIALS AND TECHNOLOGY
Different construction materials have their own unique quality and are used according to the site specific
conditions and severity of problem, availability, cost effectiveness, maintenance cost, etc. These days, new
innovative materials with unique characteristics like durability, resistance to chemical waste, environment friendly,
ease of installation, etc. are mostly used in for construction of river training structures.
7.1 LOCAL AND COMMUNITY INVOLVED CONSTRUCTION METHOD AND MATERIALS
All materials, whether used by the agency or the community in flood control/River training measures should be
acceptable from engineering consideration with respect to durability of the intervention proposed and their
standards and specifications shall be as given in Table 7-1:
Table 7-1: General Specifications of Local & Community Involved Construction Materials S.N Materials Specifications Application areas
1 River bed material / Soil
River bed material consisting of sand, silt should be free from roots and organic material. Loamy and clayey type soil as a fill material should be avoided
Construction of embankment, fill material of sand bags, bamboo fences etc.
2 Boulders Stones having higher density are suitable for pitched crest, riprap on slope above water level etc., whereas sand stones, lime stones are recommended for gabions / mattresses, pitching and drywall etc. under water level, etc. The boulders should be angular and regular in shape when used in revetment. The boulders should have sharp clean edges at the intersections of relatively flat faces. Rounded boulders should not be used in revetment. The boulders for gabions including sand stones, lime stones etc. shall be hard, angular to round and durable with quality such that they shall not disintegrate on exposure to water or weathering during the life of the structure. The size may be between 0.15 m and 0.25 m with a variation of 5% oversize and/or 5% undersize, provided it is not placed on the gabion exposed surface. The size shall be such that a minimum of three layers of boulders must be achieved when filling the gabions of 1m thick and appropriate for manual handling.
Construction of spurs, embankment pitching, dry flood walls, filling materials of bamboo fences and mattresses etc.
3 Wooden log,/ tree trunks
Normal tree logs and trunks are acceptable as available in the vicinity provided that they are robust enough for the intended purposes of giving support.
Used in bank protection in the form of poles, stakes, piles, beams, battens, log, brush, etc. Fencing, mattresses, freshly cut trees are sometimes utilized as the first protection against bank scour and a simple method of silting up the scour holes near the bank. Timber cribs made of wooden logs tied with steel braces and filled with boulder or gravel are often applied in training of mountain rivers.
4 Brushes As available near by the critical areas, as emergency measures. Community may also use them as environmental friendly and cheaper alternatives to stabilize small diversions, bunds, etc.
Used as permeable dams with brush spurs, screen and dampers during emergency flood fighting
5 Bamboo poles
Normally, the larger girth of 25 cm to 30 cm is used for
the main members, whereas, the smaller girth of 20 cm to
25 cm is used for bracings. If suitable sizes are not
available, use of bamboos of girth smaller than the
Used in construction of
bamboo porcupines, fencing,
cribs in tropical and sub-
tropical regions

Flood Control and Management Manual CONSTRUCTION MATERIALS AND TECHNOLOGY
WECS 7-2
S.N Materials Specifications Application areas
specified can be made. 6 Local
plants Should be water tolerant trees and shrubs as well as element of structures able to propagate.
Bio engineering, resource generation, however, use in small channels is avoided because it may significantly reduce the channel capacity.
7.2 MODERN AND AGENCY INVOLVED CONSTRUCTION METHOD AND MATERIALS
7.2.1 Gabions or gabion mattresses
The gabions are rectangular boxes made of square or hexagonal double twist steel wire mesh filled with the
small size boulders. Gabion mattresses are smaller in size than gabions normally between 0.15m to 0.50m thick.
Gabions or mattresses shall be used for river training works when appropriate size, weight and quality boulders
are not available for loose revetment or riprap.
Table 7-2: General Specifications 0f Gabions Materials Characteristics
Stone/Boulder Stones used for filling the gabion boxes or mattresses shall be clean, hard, sound, and angular rock fragments or stones.
The specific gravity of the stone shall be not less than 2.50 and the stones shall not absorb water more than 5 per cent when tested as per IS: 1124.
The length of any stone shall not exceed three times its dimension of the mesh of the crate. However smaller size of stones as spall shall be allowed for filling voids and its volume including voids shall not be more than 20 per cent of the total volume of the stone
Wire Characteristics
All wires used in the manufacturing crates and diaphragms, binding and connecting lids and boxes should be galvanized zinc or PVC to prevent from rusting.
The weight of deposition of zinc should be in accordance with NS: 163 Heavily Coated and Soft Type
Zinc coating should be uniform and be able to withstand minimum number of dips and adhesion test specified as per NS: 163
The steel wire should be mild steel wire complying with NS 163-2045.The tensile strength shall be between 350 to 550 N/mm2. Tolerance on diameter of wire shall be ± 2.5 percent and a minimum elongation of 10 percent, performed on a gauge length of test specimen as 200 mm.
Crates The wire shall be woven into a hexagonal mesh or rectangular mesh with a minimum of 2 twists as shown in Figure 7-1 and standard sizes of the wires used for construction shall be as shown in Table 7.1
All edges of the crates shall be finished with a selvedge wire at least 2 gauges heavier than the mesh wire.
Opening of the meshes of gabions or mattresses should be smaller than the size of smallest boulder so that boulders could not be taken out of the meshes and they are kept intact.
Gabion box is divided into several compartments with transverse diaphragms for stability and increased strength.
In case of machine woven crates all sides of end panels and internal diaphragms, except the bottom, should be mechanically selvedged in such a way as to prevent unravelling of the mesh and to develop the full strength of the mesh.
Figure 7-1: A gabion Box and hexagonal double twist mesh
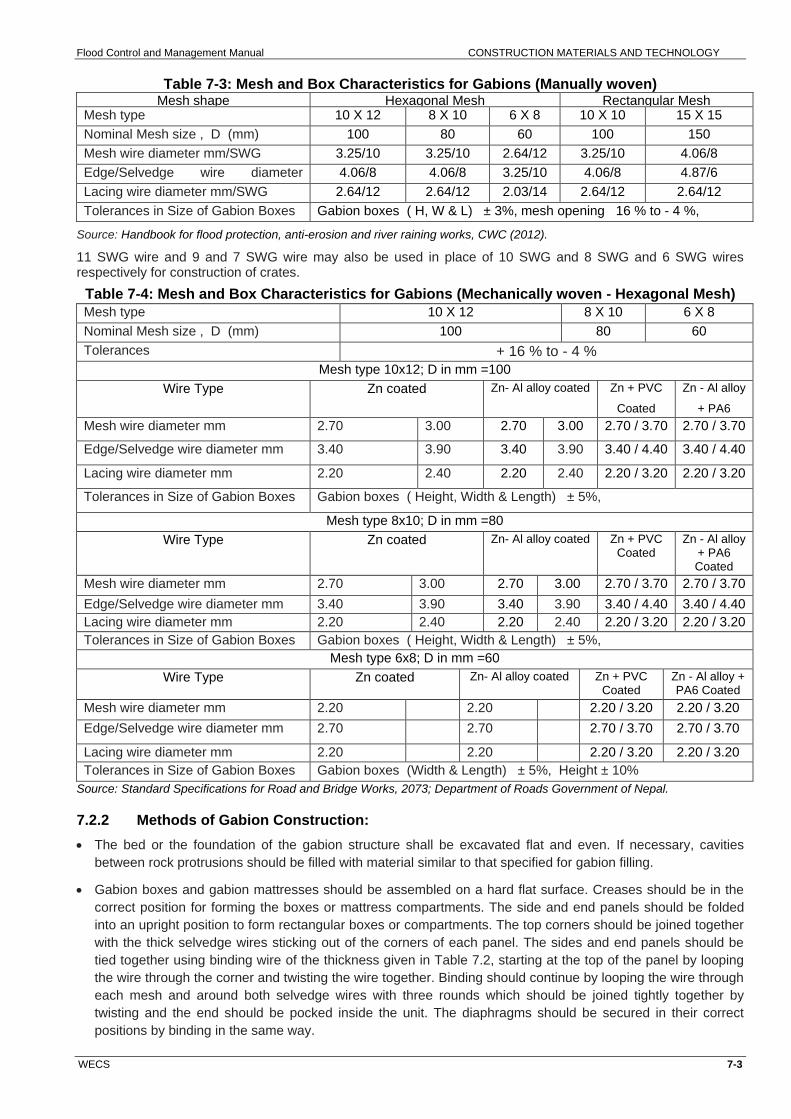
Flood Control and Management Manual CONSTRUCTION MATERIALS AND TECHNOLOGY
WECS 7-3
Table 7-3: Mesh and Box Characteristics for Gabions (Manually woven) Mesh shape Hexagonal Mesh Rectangular Mesh
Mesh type 10 X 12 8 X 10 6 X 8 10 X 10 15 X 15
Nominal Mesh size , D (mm) 100 80 60 100 150
Mesh wire diameter mm/SWG 3.25/10 3.25/10 2.64/12 3.25/10 4.06/8
Edge/Selvedge wire diameter
mm/SWG
4.06/8 4.06/8 3.25/10 4.06/8 4.87/6
Lacing wire diameter mm/SWG 2.64/12 2.64/12 2.03/14 2.64/12 2.64/12
Tolerances in Size of Gabion Boxes Gabion boxes ( H, W & L) ± 3%, mesh opening 16 % to - 4 %,
Source: Handbook for flood protection, anti-erosion and river raining works, CWC (2012).
11 SWG wire and 9 and 7 SWG wire may also be used in place of 10 SWG and 8 SWG and 6 SWG wires respectively for construction of crates.
Table 7-4: Mesh and Box Characteristics for Gabions (Mechanically woven - Hexagonal Mesh)
Mesh type 10 X 12 8 X 10 6 X 8
Nominal Mesh size , D (mm) 100 80 60
Tolerances + 16 % to - 4 %
Mesh type 10x12; D in mm =100
Wire Type Zn coated Zn- Al alloy coated Zn + PVC
Coated
Zn - Al alloy
+ PA6
Coated Mesh wire diameter mm 2.70 3.00 2.70 3.00 2.70 / 3.70 2.70 / 3.70
Edge/Selvedge wire diameter mm 3.40 3.90 3.40 3.90 3.40 / 4.40 3.40 / 4.40
Lacing wire diameter mm 2.20 2.40 2.20 2.40 2.20 / 3.20 2.20 / 3.20
Tolerances in Size of Gabion Boxes Gabion boxes ( Height, Width & Length) ± 5%,
Mesh type 8x10; D in mm =80
Wire Type Zn coated Zn- Al alloy coated Zn + PVC Coated
Zn - Al alloy + PA6 Coated
Mesh wire diameter mm 2.70 3.00 2.70 3.00 2.70 / 3.70 2.70 / 3.70
Edge/Selvedge wire diameter mm 3.40 3.90 3.40 3.90 3.40 / 4.40 3.40 / 4.40
Lacing wire diameter mm 2.20 2.40 2.20 2.40 2.20 / 3.20 2.20 / 3.20
Tolerances in Size of Gabion Boxes Gabion boxes ( Height, Width & Length) ± 5%,
Mesh type 6x8; D in mm =60
Wire Type Zn coated Zn- Al alloy coated Zn + PVC Coated
Zn - Al alloy + PA6 Coated
Mesh wire diameter mm 2.20 2.20 2.20 / 3.20 2.20 / 3.20
Edge/Selvedge wire diameter mm 2.70 2.70 2.70 / 3.70 2.70 / 3.70
Lacing wire diameter mm 2.20 2.20 2.20 / 3.20 2.20 / 3.20
Tolerances in Size of Gabion Boxes Gabion boxes (Width & Length) ± 5%, Height ± 10%
Source: Standard Specifications for Road and Bridge Works, 2073; Department of Roads Government of Nepal.
7.2.2 Methods of Gabion Construction:
The bed or the foundation of the gabion structure shall be excavated flat and even. If necessary, cavities
between rock protrusions should be filled with material similar to that specified for gabion filling.
Gabion boxes and gabion mattresses should be assembled on a hard flat surface. Creases should be in the
correct position for forming the boxes or mattress compartments. The side and end panels should be folded
into an upright position to form rectangular boxes or compartments. The top corners should be joined together
with the thick selvedge wires sticking out of the corners of each panel. The sides and end panels should be
tied together using binding wire of the thickness given in Table 7.2, starting at the top of the panel by looping
the wire through the corner and twisting the wire together. Binding should continue by looping the wire through
each mesh and around both selvedge wires with three rounds which should be joined tightly together by
twisting and the end should be pocked inside the unit. The diaphragms should be secured in their correct
positions by binding in the same way.

Flood Control and Management Manual CONSTRUCTION MATERIALS AND TECHNOLOGY
WECS 7-4
The gabion boxes and gabion mattresses should be laid in such a manner that the hinges of the lid will be on
the lower side on slopes and on the outer side in walls. Where mattresses are laid horizontally hinges should
not be placed on the downstream side. The crates shall be placed in their final position before filling them.
They shall be stretched to their full dimension and securely pegged to the ground or wired to adjacent gabion
before filling. The selvedges of the crate shall be bound to the selvedges of adjacent crates with binding wire.
The gabion, before filling, should be anchored at one end or side and stretched from the opposite end or side
by inserting temporary bars and levering them forward. The top and bottom should be kept stretched by
tensioning with tie wires attached to an anchorage or equivalent approved method until the gabion has been
filled.
The filling should be carried out by placing individual stones into the gabion by hand in courses similar to dry
random rubble masonry. All the gabions exposed to outer surface should be provided with bracing. All 1m
deep gabions should be filled in three equal layers and 0.5 m deep gabions in two equal layers. Horizontal
bracing wires made with the same bindings wire as used for tying should be fixed directly above each layer of
the stone in the compartments, the wires being looped round two adjoining meshes in each side of the
compartment and joined together to form a double tie which should be tensioned by wind lacing together to
keep the face of the gabions even and free from bulges. Bracing wires should be spaced horizontally along
and across the gabions at distances not greater than 0.5 m. Where the upper faces of gabion boxes are not
covered with further gabions vertical bracing wires should be fitted between the top and bottom mesh using
two tie wires per square meter of surface. The ties should be fixed to the bottom of the units prior to filling and
tied down to the lid on completion. Where a double layer of gabion boxes is used to form an apron both upper
and lower layers should have vertical tie wires.
In walls gabion boxes should be placed such that vertical joints are not continuous, but staggered. Aprons
should be formed of headers. If more than one unit is required to obtain the necessary width, units of unequal
lengths should be used and the joints between should be staggered.
In channel linings, gabion box and mattress units should be laid so that the movement of stone inside the
mesh due to gravity or flow of water is avoided. Hence, on side slopes, unit should be placed with their internal
diaphragms at right angles to the direction of the slope and, on inverts, as far as possible, at right angles to
the direction of flow.
The gabion boxes and mattress compartment should be over filled by 50 mm above their tops to allow for
subsequent settlement. The lids should then be tied down with binding wire to the tops of all partition panels.
The lids should be stretched to fit the sides exactly by means of suitable tool but due care should be taken to
ensure that the gabions are not so full that the lids are overstretched. The corners should be temporarily
secured first.
Graded filter or Geo-textile filter should be kept between the gabions and natural soil so that soil particles can‘t
get out of the natural soil due to suction. This will also prevent the structural fill from being washed into the
rock voids in the event of a rainfall and to drain off excess water from the structural fill.
Figure 7-2: Laying Geotextile filters and Gabions before filling stones

Flood Control and Management Manual CONSTRUCTION MATERIALS AND TECHNOLOGY
WECS 7-5
7.2.3 Concrete Blocks
Cement Concrete (CC) blocks are sometimes used in place of boulders for construction of bank revetment or
slope protection of the embankment in places where this is economically justified. The CC blocks may be pre-
cast or cast in-situ; however precast blocks are mostly used and preferred too. Blocks may be cubical, cuboidal
or in the shape of a tetrahedron. Concrete blocks may be loose non-interlocking or interlocking blocks. Non-
interlocking blocks may be susceptible to vandalism and theft unless individual blocks are heavy enough.
Figure 7-3: Concrete Dolos and Interlocking Blocks as Revetment
Concrete blocks may be reinforced depending upon their use in places where strength, durability or conformity to
varied surface geometry is important. Heavy reinforced concrete blocks of higher strengths should be used in
rivers with an intensive bed-load because of its abrasive action. Their sizes and weights should be defined on the
water currents they are subject to, similar to weight of individual boulders in boulder rip rap design. Their shapes
shall be made so that individual blocks hook on to each other provide a stronger combined protection against
erosion and scour. Concrete dolos, reinforced concrete block in a complex geometric shape weighing heavy even
can also, advantageously be used to protect river banks of such rivers.
Interlocking concrete blocks have different interlocking geometric shapes like shiplap, tongue and groove, cellular
blocks etc. The interlocking provides an additional stability by including the weights of adjacent blocks. Cable
connected concrete blocks and geotextile-bonded concrete blocks are also used advantageously for revetment
and launching in under water conditions.
The minimum grade of concrete blocks used for pitching on embankment slopes shall be M30 (28 days specific
compressive strength of 30 N/mm2) and recommended minimum thickness of the concrete block to be 50mm to
120mm. Individual block strength shall not be less than 85 percent of the specified strength. All concrete blocks
shall be sound and free of cracks or other visual defects which will interfere with the proper paving of the unit or
impair the strength or performance of the pavement constructed with the paver blocks.
The water absorption, being the average of three units, when determined in the manner described in IS 15658 :
2006, shall not be more than 6 percent by mass but in individual samples it should be restricted to 7-percent (IS
15658 : 2006).
7.2.3.1 Design Procedure for Concrete Blocks
Components of a pre-cast concrete block revetment design include layout of a general scheme or concept, bank
preparation, mattress and block size, slope, edge treatment, filter design, and surface treatment. Design
information is provided below in each of these areas.
Pre-cast block revetments are placed on the channel bank as continuous mattresses. Emphasis in
design should be placed on toe design, edge treatment, and filter design.
Channel banks should be graded to a uniform slope. Any large boulders, roots, and debris should be
removed from the bank prior to final grading. Also, holes, soft areas, and large cavities should be filled.
The graded surface, either on the slope or on the river bed at the toe of the slope on which the revetment
is to be constructed, should be true to line and grade. Light compaction of the bank surface is
recommended to provide a solid foundation for the mattress.
The overall mattress size is dictated by the longitudinal and vertical extent required of the revetment
system. Articulated block mattresses are assembled in sections prior to placement on the bank; individual

Flood Control and Management Manual CONSTRUCTION MATERIALS AND TECHNOLOGY
WECS 7-6
mattress sections should be constructed to a size that is easily handled on site by available construction
equipment. The size of individual blocks is quite variable from manufacturer to manufacturer.
Manufacturer's literature should be consulted when selecting an appropriate block size for a given
hydraulic condition.
Weight and size of the precast block is related to the velocity (V) of the flow. Weight (W) in Kilogram is
given by equation 7.1.
7.1
Where, V = Design Velocity in m/sec
SS = Relative density of the concrete block
Blocks may be cubical, cuboidal or in the shape of a tetrahedron. The volume of the blocks depends on the
shape of the blocks and the weight (W) is equal to Volume of the block multiplied by specific weight of the
concrete. Hence, the size of the cubical block shall be calculated by:
W = L*B*D *Ss*1000 Kg 7.2
Where, L, B and D are the length width and height of the individual cubical block in meter.
Thickness (t) in meter of the concrete blocks revetment layer is determined by:
7.3
Where, V is design velocity (m/sec) and Ss is relative density of the concrete block which is taken as 2.4.
Size of the individual block shall be so selected that it is easily handled on site by available construction
equipment during construction. The designed size and thickness may not match with the available manufactured
size and thickness of the blocks. If the size of the available blocks are smaller than the designed size and
thickness of the revetment for given velocity, the available blocks shall be bolted together or joined in some
fashion; as such, they form a continuous blanket or mat.
Pre-cast block revetments can be used on bank slopes up to 1V:1.5H. However, an earth anchor should
be used at the top of the revetment to secure the system against slippage. Pre-cast block revetments that
are assembled by simply butting individual blocks end to end (with no physical connection) should not be
used on slopes greater than 1V:3H.
The edges of pre-cast block revetments (the toe, head, and flanks) require special treatment to prevent
undermining. Of primary concern in the design of mattress revetments is the toe treatment. The toe
treatment consist of a launching apron design as illustrated in Section 6 As a minimum, toe aprons
should extend 1.5 times the anticipated scour depth in the vicinity of the bank toe. Two alternatives have
also been used for edge treatments at the top and flanks. The edges can be terminated at-grade or in a
termination trench.
Prior to installing the mats, a geotextile filter fabric should be installed on the bank to prevent bank
material from leaching through the openings in the mattress structure. Although a fabric filter is
recommended, graded filter material can be used if it is properly designed and installed to prevent
movement of the graded material through the protective mattress.
The spaces between and within individual blocks located above the low water line should be filled with
earth and seeded so that natural vegetation can be established on the bank This treatment enhances
both the structural stability of the embankment and its aesthetic qualities.
7.2.4 Geosynthetics
Some of the common geosynthetic materials used in river training works are as follows:
7.2.4.1 Geotextiles
The geotextile fabric shall be a woven or non-woven or knitted fabric which can be used as different elements of training works, e.g. filters, drains, containers, screens, etc. These shall be plain sheets for filters or manufactured as bags and tubes. The specifications of these geotextiles and their uses are given in Table 7-5: Various Uses Table 7-5: Various Uses and Specifications of Geotextile Filter, Geobags and Geotubes.

Flood Control and Management Manual CONSTRUCTION MATERIALS AND TECHNOLOGY
WECS 7-7
Table 7-5: Various Uses and Specifications of Geotextile Filter, Geobags and Geotubes Geotextiles Uses in river training works Specifications
Geotextile
filter
Under the boulder riprap, blocks or
gabion revetment on slopes to prevent
the loss of soil under the protective
measures
(See Figure 7-4)
Materials for textile shall preferably be
polypropylene or at least 70% polypropylene and
rest may be polyethylene or any other equivalent
material.
The standard roll length and width should be 100
m and 5 m.
The textile shall comply the properties as given in
Table 7.6:
Geo_bags Geo-textile bags range in volume from
0.05 m3 to around 5 m
3, and are pillow
shaped, box shaped or mattress shaped
suited for different uses. The bags filled
with river bed materials or sand are used
for construction of erosion control works
in revetments and spurs; and emergency
construction and maintenance of the
embankments or other short term flood
protection works. However, they are not
suitable to be used as revetment on
slopes steeper than 1:1.5 (Figure 7-5)
The bags should be good soil tightness and high
seam efficiency;
Geo-textile used to manufacture geo-bags should
have high mechanical properties for enhanced
durability along with enhanced puncture,
abrasion and ultra violet resistance properties.
Geo-textile should be inert to biological
degradation, resistant to abrasion and naturally
encountered chemicals, alkalis, and acids.
Geo-textile used to manufacture geo-textile bags
made of non-woven material may conform to the
properties listed in Table 7-6
Geo- tubes Geo-textile tube is a tube made of geo-
textile and is generally filled with sand or
dredged material. These tubes are
generally about 1 m to 3 m in diameter,
though they can be customised to any
size depending on their application.
Today, geo-textile tubes ranging in
diameters from 1.5 m to 5.0 m are used
in flood protection applications. (Figure
7-6)
The top layer of geo tubes is exposed to river
drag forces and sediment transport acting on the
surface of the bags. In order to confirm the long-
term stability of the geotextile, abrasion tests is
an important element to assure stability in the
given environment
Figure 7-4: Geotextile as filter
Table 7-6: Reference Properties of Geo-textile as filter
S.N Properties Marginal Value Reference for Test Method
Mechanical Properties
1 Tensile strength (WARP/WEFT)(≥) 28/26 KN/m IS 1969
2 Elongation at designated peak tensile load
(WARP/WEFT)(≤)
25%/25% IS 1969
3 Trapezoid tear strength (WARP/WEFT) (≥) 300 N/300N ASTM D 4533

Flood Control and Management Manual CONSTRUCTION MATERIALS AND TECHNOLOGY
WECS 7-8
4 Puncture Strength(≥) 250 N ASTM D 4833
Hydraulic properties
1 Apparent opening size(≤) 75 microns ASTM D 4751
2 Permeability(≥) 10 l/m2/s ASTM D 4491
Physical
1 Unit Weight(≥) 140g/sqm. ASTM D 3776
Table 7-7: Reference Properties Of Non Oven Geotextiles Used For Bags
Properties Test Standards Test Value
Opening size O90 EN ISO 12956 ≥0.06 and _0.08 mm
Mass per unit area BS EN 965 ≥400 g/m2
CBR puncture resistance EN ISO 12236 ≥4000 N
Tensile strength (machine direction or MD and cross machine direction or CMD)
a
EN ISO 10319 ≥20.0 kN/m
Elongation at maximum force (MD) EN ISO 10319 ≥60% and ≤100%
Elongation at maximum force (CMD) EN ISO 10319 ≥40% and ≤100%
Permeability, (velocity index for a headloss of 50 mm e vH50)
EN ISO 11058 ≥2 * 10_3 m/s
Abrasion Following RPG of BAW,
Germany, O90 according to EN ISO 12956 and thickness according to BS EN 9641
After test: tensile strength ≥75% of specified tensile strength, thickness ≥ 75% of original value, O90≤0.09b mm
UV resistance ASTM D4355b ≥70% of original tensile
strength before exposure a in case of non-isotropic material ≥14 kN/m for machine direction. bThe same requirements apply in case the ISO test is used.
CBR: CBR expresses tensile strength and resistance to puncturing. The latter is required to cope with bamboo
stakes used for berthing boats, and in combination with tensile strength, to permit lifting of bags by their corners
without undue elongation or rupture.
Permeability: The geotextile bag and sand fill act as a filter and needed to be sufficiently permeable.
Elongation: Excessive elongation and deformation of the bag scan lead to poor performance as bank protection.
Figure 7-5: Geo bags Figure 7-6: Geo tubes
Testing and Certification
Geosynthetic materials shall be tested and certified in the following manner.
The manufacturer shall have ISO or Chartered Engineers (CE) certification for manufacturing process
and quality control.
Geosynthetic shall be tested in accordance with tests prescribed by NS. In absence of NS codes, tests
prescribed either by IS, ASTM, EN, or ISO shall be conducted.

Flood Control and Management Manual CONSTRUCTION MATERIALS AND TECHNOLOGY
WECS 7-9
General Requirement for Placing and Laying Geo- textile filter
Geotextile filter shall be placed directly on the surfaces behind or under rip rap, stone pitching, retaining
walls, drainage backfill, gabions and mattresses, and in any other locations to prevent wash out of fines
Overlay of the fabric shall take place as soon as possible after placement of the fabric. The fabric shall be
joined by overlapping with a minimum overlap of 300 mm above water level and 900 mm below water level.
Overlap at roll ends and at adjacent sheets shall be a minimum of 450 mm, except when placed under
water. In such instances, the overlap shall be a minimum of 1 m.
Exposure of Geotextile to the open between lay down and cover shall be a maximum of 14 days to minimize
damage potential.
Where seams are required in the longitudinal trench direction, they shall be joined by either sewing or
overlapping.
Geotextile Fabric should not be pierced or damaged during the entire Construction period. Damages, if any,
during installation shall be repaired by placing a geotextile patch over the damaged area and extending it
1m beyond the perimeter of the tear or damage.
Laying Geo-synthetic Bags
The following sequence shall be followed in the construction of geo- bag structures.
The river bank may be trimmed to achieve the required slope mentioned in the construction drawing.
The loose earth residue remaining after the excavation is removed and the slope formation may be given
necessary ramming to remove any undulations and corrected to the desired slope (if required) before the
start of installation of the non-woven geo-textile on the trimmed surface. At the bottom and top of the slope,
anchor trench or key shall be prepared as per the required design.
The geo-textile fabric may be laid across the dressed slope over which sand filled geo-textile bags may be
kept.
The geo-textile bags may be filled at a location preferably higher than the HFL. This may ensure that the
filling process of the bag remains unaffected by the rain and subsequent changes in the water levels.
The sand used for filling may be transported to the site by dumpers and bulldozers or any other appropriate
mode conducive to the local availability and geographical suitability. The bags may be supplied to the
project in the folded form and packed in bundles. The bags may be filled with sand by suitable methods. The
sand used for filling should possess the technical specifications of the project.
After the sand filling is completed, the geo-textile bag may be weighed to confirm the desired weight as per
the technical requirements of the project. After confirmation of the weight, the geo-textile bag may be
stitched at the mouth by means of a bag closing machine or hand-sewn properly.
7.2.5 Porcupines
Porcupines are a form of permeable structure designed to reduce flow velocity and trap sediment. They have
pole-like projections in all directions, resembling a porcupine with its quills. They are used as flood control
structures and for river bank and bed protection as these function as screens, spurs, or dampeners.
Originally such devices were made of timber or bamboo (Figure 7-7) but these have a limited life span. The use
of wooden and bamboo is replacing the RCC porcupine (Figure 7-8).
Design of Porcupines:
Porcupine is a prismatic or tetrahedral type permeable structure. Tetrahedral type porcupine comprises of
six members made of Reinforced cement concrete (RCC) or bamboo poles. These are joined with the help
of iron nuts and bolts. 4 to 5 strands of 4 mm GI wire are generally used for inter-connecting the porcupines
and this may be anchored with the ground.
The size of the members of RCC porcupine generally adopted is 3m*0.1m*0.1m or 2m*0.1m*0.1m.
Reinforced cement concrete with Concrete grade of M20 or pre stressed cement (PSC) is mainly used for
construction of RCC porcupine due to ease of construction, longer durability and low cost.
Porcupine screens are a cost effective alternative to the impermeable bank protection works for the rivers
carrying considerable amount of silt and are widely used as spurs and dampers for flood fighting and long
term low cost solution.
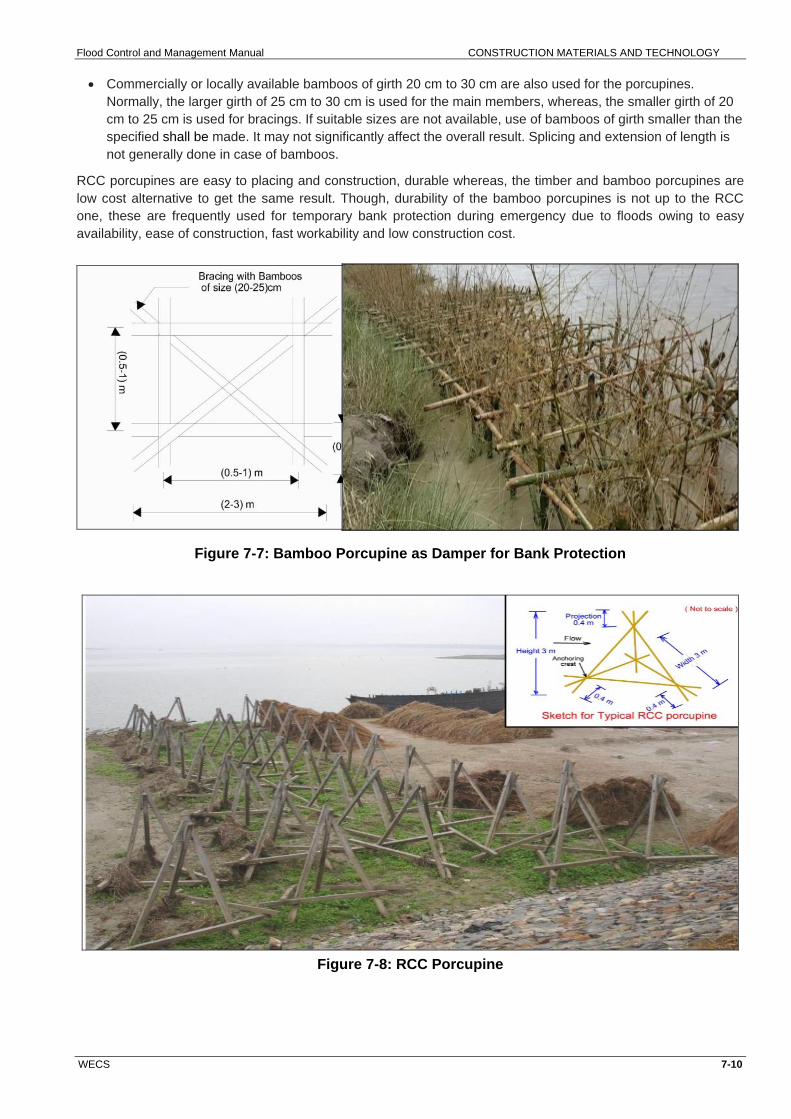
Flood Control and Management Manual CONSTRUCTION MATERIALS AND TECHNOLOGY
WECS 7-10
Commercially or locally available bamboos of girth 20 cm to 30 cm are also used for the porcupines.
Normally, the larger girth of 25 cm to 30 cm is used for the main members, whereas, the smaller girth of 20
cm to 25 cm is used for bracings. If suitable sizes are not available, use of bamboos of girth smaller than the
specified shall be made. It may not significantly affect the overall result. Splicing and extension of length is
not generally done in case of bamboos.
RCC porcupines are easy to placing and construction, durable whereas, the timber and bamboo porcupines are
low cost alternative to get the same result. Though, durability of the bamboo porcupines is not up to the RCC
one, these are frequently used for temporary bank protection during emergency due to floods owing to easy
availability, ease of construction, fast workability and low construction cost.
Figure 7-7: Bamboo Porcupine as Damper for Bank Protection
Figure 7-8: RCC Porcupine

Flood Control and Management Manual CONSTRUCTION MATERIALS AND TECHNOLOGY
WECS 7-11
7.3 EMERGENCY CONSTRUCTION MATERIALS AND TECHNIQUES
Different construction materials readily available and engineering techniques are applied for river training during emergency floods as explained below in different sub-sections:
7.3.1 Soil And Sand Bags
Soil and sand bags are simple, local, low cost materials which have appreciable and effective use during time of emergency floods. Their properties are explained below in Table 7-8.
Table 7-8: Properties Of Sand Bagging Materials For Emergency Uses
Emergency Materials
Specifications Application in river training works
Soils The soil used for filling Geo-textile bags, mattress, tubes and cement bags (sand bags) shall preferably be coarse sand and free from roots and organic material. Loamy and clayey type soil or dispersive soils should be avoided for filling such bags.
As clayey soil swell when wet and when loaded undergo secondary compaction (consolidation), free board for embankment should be reasonably provided with due consideration of consolidation in case of clay filled flood embankment proposed in critical (flood prone) sites.
Used as a fill material for flood embankment, spurs, Geo-textile bags, mattress and tubes during emergency works.
Sand bags Size of the sand bags 75 cm (30 inch) high, 50 cm (20 inch) wide and 10 cm (4 inch) thick and contain about 1.25 cubic feet sand.
Sand bags should be new and free from any sort of wear and tear. As sand bags have short life, these should not be used for long term flood protection measures.
Geosynthetic bags and tubes are also used as sand bagging
Used in emergency flood fighting as revetment, filling materials for fencing, embankment raising
7.3.2 Methods of Sand Bagging
7.3.2.1 Filling Sandbags
The bags should be about one-half full and tied near the top so that the sand can move easily. Overfilled
bags and bags tied too low lead to gaps in the bund or wall, which allows water to seep through.
Filling sandbags usually is a two-person operation. One member of the team holds the bag on the ground
slightly in front of his or her spread feet and the second shovels the sand into the bag.
(a)
(b)
(c)
Figure 7-9: Stacking Sand Bags for Construction of a Bund(left, a) Lapping of Sand Bags (right top, b) and Placing of Sand Bags (c)

Flood Control and Management Manual CONSTRUCTION MATERIALS AND TECHNOLOGY
WECS 7-12
7.3.2.2 Placing Sandbags
Place the first layer of bags lengthwise on the bund (parallel to the flow), lapping the bags so that the filled
portion of one bag lies on the unfilled portion of the next, with the untied open end of the bag facing
downstream. Offset adjacent rows or layers by one half bag length to eliminate continuous joints. The base of
the bund should be about 2 to 3 times as wide as the dike is high to provide adequate friction surface area.
A trench shall be dug and the bottom layer of bags placed in it to improve stability. Plastic sheets can be
used to help seal the flood embankment if available. The figure 7.11 and 7.12 show the placing and stacking
of sand bags in river embankment.
Figure 7-10 Sand Bags Wall Used for River Training Works
7.3.3 Nylon boxes and old tires
Nylon crates (boxes) and old tires can also be used for emergency flood fighting. Nylon boxes filled with sand
bags, shall be launched into flowing water next to the bank being eroded during floods. This will help to prevent
toe erosion by lowering flow velocity and inducing siltation. This eventually deflects the flow away from the bank.
Old vehicle tires can also be rolled into river bank during flood and filled with boulders or filled sandbags to
prevent bank erosion.
Figure 7-11 Rubber Tires filled up and used for river protection
7.3.4 Permeable spurs
Permeable spurs made of bushes, wooden logs, live branches of trees, straws, etc. are used by local people
during emergency flood to deflect flow away from eroding banks and protect banks at different locations of
flooding river. Bush spur helps to retard flow velocity and encourages siltation upstream of structure. This is an
effective local measure used during emergency flood.

Flood Control and Management Manual CONSTRUCTION MATERIALS AND TECHNOLOGY
WECS 7-13
Figure 7-12 Bamboo screen and Permeable Spur
7.3.5 Bamboo Piling for Fencing
Bamboo piling or fencing is a permeable type of structure used in rural areas and during emergency flood
fighting. Bamboo shall be used in the form of piles to strengthen a foundation or stabilize a flood embankment or
river bed. The rows of bamboo piles should be firmly fixed with a rope or iron wire. Piling in wet soil is very easy
but may otherwise require more strength. Bamboo piling is difficult in rivers having boulder as bed material. It
may be necessary to excavate small holes in boulder covered parts of the river bed. Two parallel rows of piles
shall be prepared and the space between them filled with boulders and pebbles or sand bags as a toe protection
measure for flood embankments.
Figure 7-13 : Bamboo Fencing
Materials required for bamboo piling are:
Bamboo piles
Digging tools (in case of boulder or gravel bed), hammer
Boulders or pebbles or sand bags During bamboo piling, piles of length about 2-2.5m are driven 1 m into the riverbed and 40 cm apart such that 1-
1.5m length remain exposed at the top. Piles are tied together with rope or iron wire. Space between the parallel
rows of piles is filled with boulders or pebbles of sand bags as a toe protection measure.
Green Bamboo posts can also be used in slope erosion prevention as bamboos propagate and grow to arrest
erosion.
7.3.6 Multi-tier Jack Jetty
Jack Jetty as a cost effective river training measure, a permeable form of bank protection (See Figure 7-15). RCC
Kellner Jetties are monolithic RCC structures very similar to the RCC porcupines. RCC Kellner jetty‘s are cast in-
situ or pre-casted and consists of 3 RCC or steel members laced with wire. They are lighter than the RCC
porcupines and there is no risk of rusting of the nuts and bolts as compared to the RCC porcupines. A typical
picture of RCC kellener Jetty is given in Figure 7-15. Multi-tier Jack jetty shall be kept in stocks and dropped
using air lift, cranes or other techniques to protect the river bank in case of emergency flood fighting

Flood Control and Management Manual CONSTRUCTION MATERIALS AND TECHNOLOGY
WECS 7-14
Figure 7-14: Multi-tier Jack Jetty
7.3.7 Tube wall Flood Barrier
Tube wall made of PVC is a temporary flood barrier that is flexible and light in weight. It can be quickly organized
in position making it ideal as a flood barrier for fast response to emergency flood threats. It consists of air inflated
tube sections that are interconnected by zips to form a continuous protective flood barrier. Each tube includes a
skirt which lies on the ground on the flood side. When flood water covers the skirt, the water‘s own weight
squeezes the skirt against the ground forming a seal. The friction of the weighted skirt against the ground
anchors the entire Tube wall. Higher water levels provide better anchoring, and the Tube wall remains stable
even if the water should rise to its top. Its deployment is easy; the tubes are rolled out, inflated with air using a
handheld blower, zipped together and arranged to provide optimum flood protection. It can be extended
indefinitely so that wide area can be protected by flood.
Figure 7-15: Tube wall Flood Barrier and Water Gate Self Inflating Barrier
7.3.8 Water-Gate Self-Inflating Barrier
The Water-Gate constructed from high strength PVC fabric is a stylish modern technology used for flood fighting
during emergency. It is a portable, self-inflating, reusable water barrier that shall be used in place of traditional
methods, such as sandbags, or rock dams that is practiced during emergency flood. The Water-Gate shall be
installed or removed in minutes and easily packed and reused for a different application too. It is self-inflated by
water and get anchored and stable due to water load exerted by the water head above the skirt which is the part

Flood Control and Management Manual CONSTRUCTION MATERIALS AND TECHNOLOGY
WECS 7-15
of barrier placed in front of the main body as shown in the figure. The portable barrier can be easily transported
by vehicle to the required site or smaller barriers are light enough to be carried by a person. The Water-Gate can
be installed by one person, with the barrier available in several lengths and heights and can be linked together to
create longer sections. The barriers are manufactured in various lengths ranging from 9.1 m (30 ft) to 15.2m (50
ft) and heights from 0 .15m (½ ft) through 1.5m (5 ft).
7.3.9 Wood & Boulders for Bank Protection
Table 7-9 contains classification system for large wood in stream wood and boulder structures and methods for placing them
Table 7-9: In stream Wood Structures Configuration Sketch Description
Engineered Log Jam
Intermittent structures built by stacking whole trees and logs in grid. Emulates natural formations. Creates diverse physical conditions, traps additional debris.
Log vanes
Single logs secured to bed protruding from bank and angled upstream. Also called log bendway weir. Low-cost, minimally intrusive
Log weirs
Weirs spanning small streams comprised of one or more large logs. Creates pool habitat
Rootwads
Logs buried in bank with rootwads protruding into channel. Protects low banks, provides scour pools with woody cover
Tree revetments or roughness logs
Whole trees placed along bank parallel to current. Trees are overlapped (shingled) and securely anchored. Deflects high flows and shear from outer banks; may induce sediment deposition and halt erosion.
Toe logs
One or two rows of logs running parallel to current and secured to bank toe. Gravel fill may be placed immediately behind logs. Used for temporary toe protection
Source: Bank Stabilization Design Guidelines, USBR

Flood Control and Management Manual BIOENGINEERING WORK
WECS 8-1
8 BIOENGINEERING WORK
Live vegetation has been used for a very long time, to reduce soil erosion, for stream bank and bed stabilization,
or to protect seawalls or sand dunes from the force of water.
8.1 BIOENGINEERING TECHNIQUES
Biotechnical engineering techniques are used stabilize unstable slopes and banks. The different of
bioengineering construction methods can be classified according to the purpose, material or construction
characteristics. Some methods are either point-by-point systems (structures of single root stocks), linear systems
(structures of rows of root stocks) or covering systems (surface-covering mattress of plant webbings). It is
essential to understand the mechanisms through which these plants provide protection so that the same may be
replicated at problem areas. Some of the methods are listed below:
1. Surface protection methods (covering methods)
2. Stabilization methods using growing (live) materials
3. Methods combining live and other materials
4. Supplementary methods
5. Support structures using non-living material
The techniques used for soil erosion protection and river slope stabilization using plants or branches that can
easily take root and eventually provide the required engineered support are described below. Knowledge of
indigenous plants that can be easily transplanted and grow rapidly is required and the local agency must
catalogue these plants and train its personnel.
8.1.1 Bush-mattress construction with wood pegs
Bush mattress construction with living branches shall be used (which will sprout) for protection and slope
stabilization. They are built rectangular like a mattress and placed on the slope along contour lines direction.
Each mattress contains 15 to 30 live branches of plants that can easily grow (such as Salix, Eleagnus, Platanuse,
etc.) each with length 60 cm and diameter 6-40 mm. The sprout buds of branches are bedded in the same
direction and they tied up in fascines 15-30 cm length.
Figure 8-1: Bush-Mattress with wood pegs
8.1.2 Wattle fences (wicker)
Chestnut pegs (length 1m, diameter 4-5 cm) are driven into the soil (depth 50-70 cm) every one meter along the
contour. Between these pegs (every 20 cm) shorter pegs or other live branches (diameter 2-3 cm, length 60 cm)
are driven in (depth 30cm) and strong rods of sprouting material (such as rods of Salix, Platanus) are woven
around them.
Figure 8-2: wattle fences

Flood Control and Management Manual BIOENGINEERING WORK
WECS 8-2
8.1.3 Log Brush Barrier
This construction method is primarily erosion control from surface runoff and logs and brushes are used to slow
down flowing water, allow filtration and catch sediments. The brush grows as provides additional protection as a
swale. The log brush barriers are wood parts of trees(diameter 20-25 cm length 6 m) (such as Cypressus,
Pinusnigra, Quercus, etc.)
Figure 8-3: Log brush barrier
8.1.4 Fascines (bush wattles)
Chestnut pegs (length 1.5-2.0 m diameter 4-5 cm)are driven into the soil (depth 0.7-1.2 m) every 30 cm between
them. 60 living branches/ m of Salix Vitex etc. are driven into the soil (length 1.0 m, diameter 1-5cm) in two layers
(they are built inclined) until to touch the equable part of slope. 30 of them are driven into the soil from one
direction and 30 of them are driven into the soil from the other direction. The living branches are covered with
soil. (Height of soil 15 cm).
Figure 8-4: Fascines (bush wattles)
This construction extended on needed parts of slope. The same construction shall be done without use of chestnut pegs but the use with living branches and their covering with soil
8.1.5 Vegetated gabions
Gabions are rather stiff boxes or flexible rolls of close-meshed wire filled with coarse gravel. Between gabion
boxes and within them, living branches are introduced to root in both the gabion and the surrounding soil. If
gabions could be displaced by mechanical forces, they are fixed with deep-reaching metal poles. Combinations
of gabions of different shape and dimensions are easily possible. Similar to other structures, the decision which
soil material should be used is always a trade-off between filter criteria and requirements of the vegetation.
Figure 8-5: Vegetated gabions

Flood Control and Management Manual BIOENGINEERING WORK
WECS 8-3
It should be noted that the growing plants should be protected and allowed to take root and grow before it can be
fully effective. Proper watering and fertilizing of the plants may be required.
8.2 VEGETATION FOR BANK / SLOPE PROTECTION
8.2.1 Sod facing (turfing)
Sod or turf is grass along with its root zone which holds together the earth material with it. Live sod is placed on
embankment slopes, river bank slopes or other locations for their stability and safety against sheet erosion, runoff
retardation and enhanced infiltration. The sod facing work is generally taken up as soon as possible following the
construction of the embankment, provided the season is favorable for establishment of the sod.
Figure 8-6: Sod Facing (Turfing)
8.2.2 Vetiver
Vetiver is a special type of grass having longer and dense roots. Because of its longer roots and high tensile
strength, this grass is resistant to the high velocity streams and checks the bank erosion and hence used
effectively for bank protection. Vetivers having following properties are desirable for bank protection.
Table 8-1: Properties of Vetiver as erosion control plant S.N. Descriptions Desired Property
1 Average tensile strength 75 MPa
2 Root length Up to 3 m
3 Life under 14 m of water Up to 5 months
4 Air temperature range for sustainability -140C to 55
0C
5 Soil PH 3 to 10
Source: CWC - 2012, Hand Book for Flood Protection, Anti-erosion and RT Works
Figure: 8-7 : Vetiver for Slope Stabilization (Slope > 800 )

Flood Control and Management Manual BIOENGINEERING WORK
WECS 8-4
8.3 MAINTENANCE OF VEGETATION
Biotechnical methods rely on fast growing and, if possible, self-spreading plants. In cultivated landscapes,
streams and their tributaries are remainders of natural systems. Important aspects for the structural quality of
natural reaches of streams include:
the unity of the stream and riparian zone
linking of different biotopes, reaches and corridors
stream bed dynamics (dynamics of water flow and sediment transportation)
diversity of substrates, choriotops, structures and vegetation
Unique patterns of (land) use in different watersheds.
River training works, as technical answers to land use conflicts, often restrict streams to ascertain (modified)
channel. That reduces potential stream development and cuts down on morphological and structural stream
quality. Ecological improvement of such altered reaches is often restricted to measures on the waterline or in the
immediate riparian zone. Biotechnical methods are examples of more biologically sensitive approaches to stream
bank protection and design, where these methods are also acceptable from an engineering point of view.
Nevertheless, they are methods to help secure banks and technical structures. This explains why biotechnical
methods require more care and maintenance in their early stages than later on. How much work they require
depends on the type of vegetation to be established and the construction method used. Care and maintenance
during plant development typically includes activities such as:
8.3.1 Initial Care
Care during and immediately after construction depends on the goals of initial plant development. Standards
for different types of plantings have been developed and there requirements are briefly listed below.
Fertilization, irrigation, soil cultivation and soil improvement can help meet these standards.
Care and maintenance during plant development
Biotechnical structures tend to accelerate plant succession, thereby establishing some sort of climax
vegetation in a short period of time. This explains why biotechnical methods require more care and
maintenance in their early stages than later on. How much work they require depends on the type of
vegetation to be established and the construction method used. Care and maintenance during plant
development typically includes activities such as:
8.3.1.1 Fertilization
Sites where biotechnical structures are used are often poor in plant nutrients and top soil. To promote plant
development, fertilization has repeatedly proven successful, especially on raw soil. On pioneer stands it promotes
a much faster closing of the plant cover, which in return reduces the risk of erosion. Mineralized fertilizers,
manure, compost and cuttings are commonly used. The amount, combination and timing of fertilizer is plant, site
and time specific, and should be detailed in a fertilization plan.
8.3.1.2 Irrigation
In moderate climatic zones irrigation should only be used to sludge the root stocks of new plantings, or to assist
during droughts. Overly intensive irrigation jeopardizes the development of a wide-spreading root-system. On the
other hand, in arid zones, or areas with very dry summers, may require irrigation to ensure successful growth.
8.3.1.3 Soil cultivation and soil improvement
Loosening of soil and (mechanical) weed control promote plant development, particularly at the beginning. A 10-
20 cm thick mulch layer of rotting material (especially litter, straw, grass and weed cuttings) can regulate
temperature and humidity close to the soil surface, and improve soil activity.
8.3.1.4 Care for trees and bushes
Woody plants may require cutting in the first 2 years to improve their health and shape. Bushes with a single
main stem are cut to produce several main shoots. High stem trees and single woody shoots may require
support by fastening them to pegs for the first 3-5 years.

Flood Control and Management Manual FLOODPLAIN MANAGEMENT
WECS 9-1
9 FLOODPLAIN MANAGEMENT
The floodway includes the channel of a river or stream and the overbank areas adjacent to the channel. The
floodway carries the bulk of the flood water down stream and is usually the area where water velocities and
forces are the greatest and most destructive.
Figure 9-1: Definition Sketch of Flood Plain
Floodplain management results in structural and nonstructural measures for development of floodplain that
minimize the risk to life and property from floods and the risk to the floodplain‘s natural functions posed by human
development.
9.1 NON STRUCTURAL METHODS FOR FLOODPLAIN MANAGEMENT
9.1.1 General
The Non Structural Methods for flood plain management envisage mitigating the flood damages by:
enforcing floodplain zoning regulation, and
flood forecasting and flood warning in case of threatened inundation
education to community
Flood Insurance and Tax adjustment
wetland
9.1.2 Enforcement of Floodplain Zoning regulation
The aims of this work include:
discouraging people for creation of valuable assets/settlement of the people in the areas subject to
frequent flooding
avoiding inappropriate development in areas of high risk,
managing land use and development so that it does not increase risk in other areas without prior
agreement, and
managing land use activities in areas where the consequences of flooding may be low to reduce risk
elsewhere.
9.1.3 Flood Plain Zoning
The basic concept of floodplain zoning is to regulate land use in the floodplains to restrict the damage caused by
floods. Floodplain zoning, therefore, aims at demarcating zones or areas likely to be affected by floods of
different magnitudes or frequencies and probability levels, and specify the types of permissible developments in
these zones, so that whenever floods actually occur, the damage can be minimized, if not avoided. It, therefore,
envisages laying down limitations on development of both the unprotected as well as protected areas. In the
unprotected areas, boundaries of areas in which developmental activities will be banned, are to be
established to prevent indiscriminate growth. In the protected areas, only such developmental activities can be
allowed, which will not involve heavy damage in case the protective measures fail.

Flood Control and Management Manual FLOODPLAIN MANAGEMENT
WECS 9-2
9.1.4 Pre-Requisites For The Enforcement Of Floodplain Zoning
The basic requirements to be taken care of before implementing flood plain zoning are as follows:
Broad demarcation of areas vulnerable to floods.
Preparation of a large-scale maps (1:10,000/1:15,000) of area vulnerable to floods with contours
at an interval of 0.3m or 0.5 m.
Marking of reference river gauges with respect to which, the areas likely to be inundated for
different magnitudes of floods will be determined.
Demarcation of areas liable to inundation by floods of different frequencies, e.g., like once in two, five,
ten, twenty years and so on. Similarly, demarcation of areas likely to be affected on account of
accumulation of rainwater for different frequencies of rainfall like 5, 10, 25 and 50 years.
Marking of likely submersion areas for different flood stages or accumulation of rainwater on the maps
The Water Induced Disaster Management Policy, 2013 has endorsed this principle in policy document and has
demarcated the floodplains as given Table- 9-1
Table 9-1: Floodplain Zoning Criteria
S.N.
Zoning of Floodplain Return Period flood (year) Nomenclature of Risk Zone
Remarks
1 Floodway 2 Z0 Bank full Discharge
2 Highly risk Area 2 – 5 Z1
3 Risky Area 5 – 25 Z2
4 Moderately risk Area 25 - 100 Z3
5 Riskless Area >100 Z4
9.1.5 Regulation of Land Use in Flood Prone Areas
There can be different considerations for such regulations. Table 9-2 gives the different considerations adopted for DWIMP policy.
Table 9-2: Land use Policy for Flood Plain Management S.N. Flood
Plain Zone
Recommended Land use Remarks
1 Z0 Floodway Reserved for river flow
2 Z1 Agriculture, forest, parking spot for vehicles, recreational spot etc.
Construction of private houses and development of residential area are prohibited.
3 Z2 Land use as in Z1 and construction of housing with high plinth level.
The area falls on level corresponding to 25year return period flood + 50cm
4 Z3 All activities stated in Z1 and Z2 and development of residential area, public houses, hospitals, school and emergency centres etc.
The area falls in flooding depth corresponding to 50 year return period flood + 50cm.
5 Z4 Strategic structures like emergency shelters, hydropower station, large industries etc. as usual.
9.1.6 Categorization and Prioritization of Structures in Flood Plains Zoning
In the regulation of land use in floodplains, different types of buildings and utility services have been grouped under four priorities from the point of view of the damage likely to occur and the floodplain zone in which they are to be located: Priority1: Strategic structures like emergency shelters, hydropower station, large industries etc. buildings should
be located in such a fashion that they are above the levels corresponding to a 100-year frequency or the
maximum observed flood levels.
Priority 2: Public institutions, government offices, universities, public libraries and residential areas. Buildings
should be above a level corresponding to a 25-year flood.
Priority 3: Infrastructure such as playgrounds and parks can be located in areas vulnerable to frequent
floods. Since every city needs some open areas and gardens, by restricting building activity in a vulnerable area,
it will be possible to develop parks and play grounds, which would provide a proper environment for the growth of
the city.
Priority 4: Forest belt and agricultural land shall be maintained in further frequent floods.

Flood Control and Management Manual FLOODPLAIN MANAGEMENT
WECS 9-3
It is important that an appropriate techno-legal regime is put in place for the regulation of developmental activities in the flood plains, preventing blocking and encroachment of water ways, prohibiting reclamation, conservation and restoration of existing wetlands and depressions etc. Provisions are required in the regulations to ensure that buildings and the infrastructure in floodplains are flood resilient. The different level of governments will put in place mechanisms for the enforcement of the acts, regulations and bye-laws made by them and identify the authority who will be responsible for their implementation and make them accountable for any lapses/violations.
9.1.7 Disaster insurance / relief Fund
Flood insurance has several advantages as a means of modifying the loss burden. So far, it has not been widely adopted in Nepal. It is more popular in many counties where damage due to inundation and erosion caused mostly by excessive rainfall is covered by Insurance Policies. Suitable criteria for working out the insurance premium should be determined according to the floodplain zones.
Generally, flood insurance coverage is provided for insurable buildings and their contents damaged by a ―general condition of surface flooding‖ in the floodplain. Moreover, coverage of insurance for crop damage can also be included in insurance policy. Contents coverage is for the removable items inside an insurable building and other business firms. A relief fund may also be maintained at community level.
9.1.8 The Tax adjustment
Floodplain areas and adjacent waters combine to form a complex and dynamic physical and biological system found nowhere else such as wetlands. When portions of floodplains are preserved in their natural state, or restored to it, they provide many benefits to natural as well as human systems such as wetlands, greenways and national parks and preserves. The location of floodplains and these natural resources often coincide giving communities and local government dual incentive to protect these natural resources and recreational and aesthetic benefits. Hence, the government should adjust taxes on development activities in flood plains by enacting tax adjustment policy to reduce the distress while developing that sort of resources and establishment of industries and other development activities within floodplain.
9.1.9 Flood Forecasting and Early Warning System
I. Data Collection Real time hydrological and meteorological data viz. river gauge reading, discharge and rainfall, are the basic requirements for the formulation of a flood forecast. The hydrological and hydro meteorological data from entire river basin and sub basins should be daily collected, analyzed and utilized for formulation of flood forecasts.
ii. Transmission of Data to the Forecasting Centres Transmission of data on a real-time basis from the hydrological and hydro meteorological stations to the flood forecasting centres is a vital factor in the Flood forecasting system. Telephone/telex/fax/V-SAT/Internet facilities shall be utilized from data transmission. Besides this, automatic water level/rainfall sensors with satellite based transmitters are also installed in the rainfall and runoff gauging stations in maintaining a reliable and quick system of data transmission .
iii. Data Processing and Formulation of Forecasts Historical data like gauge, discharge and rainfall are utilized for the development of techniques for formulation of forecasts on a real-time basis. Forecasts are formulated at the Flood Forecasting (FF) stations by predicting river stage/inflow with time of occurrence. After receipt of the hydrological and meteorological data from field formations, the data is processed in FF centres/control rooms to check its consistency and the data is modified, if any inaccuracy is found, before using in forecast formulation. The inflow forecasts are mainly formulated by using following Methods
Rainfall runoff correlation developed for the particular catchment.
Computer-based rainfall -runoff watershed model based flood routing
Forecasts (stage/inflow) are issued whenever the river stage at the FF site exceeds or is likely to exceed a specified level called warning level of the site which is fixed in consultation with the concerned agency. The warning level is generally 1 m below the danger level of the site. In the forecast, the current date and time of issue of forecast, present water level/inflow and anticipated water level/inflow with corresponding date and time are normally included.
DHM defines warning level as the water level at a specific location on the bank of a river when flood starts inundating areas adjacent to the river channel. The flood below warning level does not usually reach to settlement areas. When the level of water on a specific site goes on increasing and reach to a level when river

Flood Control and Management Manual FLOODPLAIN MANAGEMENT
WECS 9-4
flow starts inundating settlement areas with potential damage to lives and properties, such a level is designated as danger level.
iv. Dissemination of Flood Forecasts and Warnings
At the national level, the Department of Hydrology and Meteorology (DHM), is mandated to monitor all hydrological and meteorological activities in Nepal. DHM collects hydrological, meteorological, and climate information and disseminates it to a variety of stakeholders for water resources, agriculture, energy, and other development activities (www.dhm.gov.np). DHM has 286 meteorological stations nation-wide. The stations are regularly monitored and the information is collected centrally at the DHM office. In addition there are 170 hydrological stations, including 20 with sedimentation monitoring. Most of the hydro meteorological stations are manually operated, while some have been upgraded to automatic stations, able to continuously monitor flood parameters such as rainfall and water level around the clock and to transmit the data in real time.
v. Warning and Society
Flood warning service may be highly organized and integrated on a technical and administrative level, but the perception and response is always dependent on social structures and frameworks. These can be highly variable and often unpredictable. The goal at the community level is that warnings should be received by all individuals. The way in which messages are disseminated in communities will depend on local conditions, but may include some or all of the following:
a. Media warnings; b. General warning indicators, for example sirens; c. Warnings delivered to areas by community leaders or emergency services; d. Dedicated automatic telephone warnings to properties at risk; e. Dissemination of information about flooding and flood conditions affecting communities upstream.
One approach to achieve this is to pass warning messages from village to village as the flood moves downstream;
f. Keeping watch and giving regular information about the river level and the embankment conditions in the local area. The frequency of the river and embankment watches should be increased as the flood height increases and
g. Crosses the critical danger level; h. A community-based warning system to pass any information about an approaching flood to every
family
VI. Flood Risk Mapping Flood hazard maps of a particular stretch of a river are prepared based on the hydrological and hydraulic modeling for floods of different return periods. Based on the flood hazard maps so prepared, flood risk maps are prepared to identify the vulnerable areas for flood of certain return period to evaluate the lives and properties at risk. Based on such flood risk map, appropriate river training measures are prescribed to protect lives and properties at danger within such vulnerable areas.
9.1.10 Frequency of Flood Warnings
Triggers for flood warnings should be set so that they are not reached too frequently, so creating unnecessary responses or disruption. Frequency can also lead to a negligent attitude by operators and public, where warnings are not needed. A similar problem exists if too many false alarms are given. There is a crucial balance to be struck between a precautionary approach and an unwillingness to issue warnings for fear of these being ―wrong‖. A phased-alert warning system goes some way to overcoming these problems, as long as the various stages and their implications are clearly understood. The system should also allow for the alert-warning situation to be downgraded if conditions improve or forecasts change. An indicative number of no more than five warning events per year in a given location, averaged over a period of years, is considered to be of the correct order where flooding is an irregular occurrence.
9.1.11 Devising Public Awareness
To minimize the risks to their safety and property from flood, it is critical that people in floodplain areas learn how to prepare for, respond to and recover from flood events. The floodplain management plan must include ensuring that the people who will be affected by flooding are given the opportunity and the tools to manage it in their own interests.

Flood Control and Management Manual FLOODPLAIN MANAGEMENT
WECS 9-5
9.1.12 Combination of structural and Non Structural Methods
9.1.12.1 Flood fighting
This flood fighting strategy includes the Community-level disaster preparedness programme during extreme floods. Detail regarding this aspect is dealt in separate subheading.
9.1.12.2 Flood Proofing
Flood proofing is essentially a combination of structural change and emergency action, not involving any evacuation. Flood proofing encourages persistent human occupancy of flood plains. This action requires carrying out frequency analysis of the flood to identify the areas which are prone to flooding in different return year floods. The areas which may inundate at least once in five years shall be selected for flood proofing activities.
Flood proofing plan for flood plain Management include:
i. Quick drainage facilities in the flood prone area a) improving clogged drainage b) Providing additional waterway
II. Potable drinking water and sanitary arrangements
a. Ensuring uncontaminated drinking water facility b. Providing efficient public lavatories
Ill. Human dwellings and animal shelters. a. Providing temporary shelters for people living on high ground b. Providing raised platform or rehabilitation on high ground for flood affected people c. Providing raised platforms for animals. d. constructing houses on raised plinth, so that flood water flows underneath. e. Building escapes areas under roofs for family members and other valuables f. Concentrate houses on higher grounds of the communities, to prevent residential shelters from being inundated during floods; g. Discouraging and restricting settlements in high-risk areas.
IV. Storage facilities for food grains, fodder and other essential commodities. a. Providing flood storage facilities in local municipality for catering to flood shelters; b. Developing grain storage facility above raised container
V. Communication links like telephone/wireless/road/rail/boat. a. Providing road links from shelters to the administrative centre b. Raising of existing village roads in inundated areas; c. Providing a power boat for each of the shelters; d. Provision of telephone/wireless communication to nearest administrative centre.
VI. Agricultural Adjustment: a. Cultivating fast growing crops immediately after the spring crops so as to reduce the risk of damage
during flood. b. Growing crops like sweet potatoes which are growing safely even if the lands are covered with sand by
floods. c. Shifting maize to rice based cultivation because paddy is less vulnerable or more flood resistant crop
than maize. d. Setting aside some extra rice seedlings to replant paddy if there is the risk of damage of planted paddy
due to flooding.

Flood Control and Management Manual EMERGENCY FLOOD MANAGEMENT
WECS 10-1
10 EMERGENCY FLOOD MANAGEMENT
The objective of this guide is to assist the development and implementation of consistently effective flood emergency response and recovery planning by the Principal Response Agencies and others so as to minimize the impacts and damages caused by flood events in Nepal
10.1 EXISTING PRACTICES
The Government of Nepal has been following a trend of providing immediate response as rescue and relief work during a flood disaster, especially during the monsoon floods and landslides utilizing the armed police force and Nepalese army. Besides that the disaster data management and national and international disaster fund management is the responsible field of the Ministry of Home Affairs. Presently, activities for prevention of flood and landslide, inundation and erosion control and relief work are the responsibility of provincial and local government. However, the central government helps them during emergency situations. The Department of Water Resources and Irrigation (DoWRI) acts as a lead coordinating agency for emergency flood disaster Management at central level. The DoWRI has established People‘s Embankment Program Offices and River Training Projects to carry out major river training works. Besides, Water Resources and Irrigation Development Division offices and Sub-division offices under provincial Government of Nepal are established to reach up to the community for flood and landslide management works. In the same way the Department of Forest and Soil Conservation (DoFSC) reaches up to the community level for shallow landslide and soil conservation works. The flow chart (Figure 10-1) is self-explanatory on present emergency flood management activities. Besides this, Draft Water Resources policy has proposed establishing at least an Emergency Disaster
Management Centre at each province for management of flood and landslide disaster.
Figure 10-1: Flow Chart of Emergency Flood Management Activities
10.2 PREPAREDNESS FOR FLOOD DISASTER
The plans made in advance for disaster mitigation, warning, emergency operations, rehabilitation and recovery
will involve activities such as training, post-disaster evaluation review, emergency planning and co-ordination of
Central, State and Local level preparedness programs and research. Following activities should be in place as
the preparedness for flood disaster:
The water disaster management agency in each level of the Government should make water disaster
management system fully functional, effective and responsive to people's needs by undertaking

Flood Control and Management Manual EMERGENCY FLOOD MANAGEMENT
WECS 10-2
programs related with flood hazard and risk mapping; zoning; networking of information system;
community level preparedness; relief and rehabilitation; and mitigation of water related hazards.
The media networks should be effectively utilized in flood disaster preparedness works to disseminate
information on weather, and probability of occurrence of flood disasters to help prevent people from
possible consequences. All forms of communication should be kept in running condition during the
potential disaster seasons.
Preparation of public awareness programs and awareness dissemination should be carried out through
established systems with effective and maximum use of media; interaction and consultations; education;
and other informal means to sensitize the people about disasters. In addition, the nongovernmental
sector, civil society and community based organizations; and local social groups should be encouraged
to undertake such activities.
Development and review evacuation plans should be at regular interval. Emphasize should be given to
educate people and the community for community level preparedness, to properly act during disasters
through rehearsals, mock-up drills, and simulation exercises at frequent intervals at different locations
and providing training in rescue operations for identified groups from the local community. Emphasis
should also be given for formation of standing committees to support search and rescue program given
with necessary facilities at local level (Vulnerable localities).
Strengthening of the local coping capacity, extension of indigenous knowledge and skills, and the
implementation of community based programs should be taken up on a priority basis to mitigate the
impacts of disaster. It should also be supplemented by the application of suitable advanced technologies
in the field of disaster risk reduction.
Adequate stocks of rescue and relief materials should also be stored at appropriate locations by
establishment of emergency supply warehouses for high risk areas on central and provincial basis.
Prompt mobilization of critical facilities such as ambulance and other machinery and equipment should
be ensured by establishment of Regional Response Centres.
Health sector preparedness plans should be formulated at both public and private levels to ensure
adequate health care facilities during disaster and also preventing epidemics at all levels.
Mechanism for Intra and inter sectorial coordination at different level of the Governments should be
established.
Flood disaster emergency plan should mobilize the resources needed to undertake emergency work
during a flood, including repairing and maintaining flood protection structures and assisting with the
evacuation of people. Hence, preparation of a trained and able ‗emergency workforce‘ to undertake these
tasks should also be included in preparedness plan.
Develop an Emergency Response Fund with its operational modalities.
10.3 RESPONSE, EVACUATION AND RELIEF OPERATION
10.3.1 Emergency Response:
The response to a flood begins either when a flood warning is received or, if there is no warning, when flooding
first starts to occur. A key decision is whether people evacuate or ‗shelter in place‘ (in either a house or safe
haven). Emergency response activities include a risk mitigation, rescue operations, continuity management, and
coordination of multiagency response (i.e., reactive phase). Emergency response phase consists of the following
endeavors:
i. Search and rescue teams should be promptly mobilized by involving security personnel,
groups of skilled people, and local representatives of political parties, local bodies, national and
international NGOs, community organizations, volunteer groups, etc.
ii. The personal security and access to essential services should be made for all affected people
with priority to children, women, senior citizens and differently baled people by creating
sufficient shelter and sanitation facilities.
iii. Health support activities should be activated realizing the importance of 'golden hours', to
minimize morbidity, mortality and disability of affected people by providing timely on-site health
care facilities or transporting them to better equipped hospitals. Establishment of temporary
field level hospitals or health camps should be undertaken as required. Public and private
medical institutions should also be mobilized for the purpose.

Flood Control and Management Manual EMERGENCY FLOOD MANAGEMENT
WECS 10-3
iv. Reliable and effective communication systems should be established. Media should be
encouraged to disseminate correct information in the event of disasters.
v. Regular assessment of relief distribution should be carried out and adjusted accordingly.
vi. Other required set-ups in the emergency plan must also be implemented, including, for example,
preparing and opening emergency shelters, arrangements for emergency water supply and
sanitation, storage of food, and moving animals to safe areas.
10.3.2 Post Event Response
The adverse effects of floods do not finish when the flood waters recede. The people and communities affected
will feel the effects for many weeks or even months after the flood has occurred, and this needs to be planned for
in post-event emergency planning. It is clear that floods have an economic impact, through damage to property
and infrastructure. The effect of floods has on the health of the people affected. This need to be anticipated and
the proper levels of assistance should be planned and put in place in an efficient way. In this way disruption and
trauma after an event can be minimized. The issues to be considered in this response are:
the awareness that the post-event period is one when the effects of a flood disaster are still being felt
that elderly and previously infirm members of the public are likely to be affected most
10.3.3 Evacuation
An evacuation operation is conducted as a sequential process, ideally consisting of the following five phases:
Decision, which involves the assessment of considerations in making a decision to evacuate people, such
as:
i. identification of the authority to evacuate
ii. identification of evacuation triggers and completion restrictions (egg the closure of evacuation
routes by floodwaters),
iii. identification of evacuation priorities,
iv. identification of evacuation risks to determine whether evacuation is the best option,
v. estimation of time available to conduct the evacuation, and
vi. Estimation of time likely to be needed to complete the evacuation.
Once the decision to evacuate is made, communities must accept the authority of the evacuation
organizers.
Warning, involves the development and communication of an evacuation warning to the affected people.
Withdrawal involves following aspects:
Identification of suitable evacuation routes, and transport strategies,
responsibilities and arrangements for security of evacuated areas,
transport provision and arrangements for special-needs groups This may include a need to
arrange for the movement of wheelchairs and life-support equipment,
responsibilities and arrangements for the movement of the companion animals and pets of
evacuees, and of livestock.
Shelter, involves the provision of the basic needs of affected people away from the immediate or the
potential effects of flooding. This includes:
i. Suitable evacuation shelters, including sufficient capacity to accommodate all evacuees in flood
free areas above Probable Maximum Flood (PMF) levels, and accessible from areas likely to
be flooded and eroded by floods. The Flood free areas such as behind the sound embankment
maybe appropriate places for shelters.
ii. Responsibilities and arrangements for the provision of welfare and security for evacuees, and
iii. Suitable shelters for the pets of evacuees.
Return, involves the assessment of the safety of an affected area and the return of evacuees to their
places of residence. This includes damage assessment strategies and arrangements and transport
arrangements.
10.3.4 Relief And Recovery Measures
Relief is extended by the local agencies both in the Government and voluntary sectors on the basis of
assessment made immediately after the occurrence of the disaster. However, relief programme is initiated on the
Flood Control and Management Manual EMERGENCY FLOOD MANAGEMENT
WECS 10-4
basis of detailed assessment of damage made at the district or local level and the funds available with State /
local Governments.
The relief actions depend on local circumstances. They may include building temporary flood defenses by using
sandbags, bamboo piling or other locally available materials and helping vulnerable people to respond to the
flood, for example evacuation of the elderly and infirm.
Recovery activities in emergency management are typically limited to the immediate aftermath of a hazard event,
such as refocusing displaced people, addressing welfare needs, and restoring critical services. The government
prepares its own standard norms of relief packages taking into consideration of prevailing practices and
standards. These packages should be distributed to the affected people irrespective of their caste, creed,
religion, community or sex.
The key elements of relief measures are:
Making arrangements and delivering disaster relief and rehabilitation supplies;
Identification and assignment of responsibilities to different organisation for handling relief and
rehabilitation;
Planning for emergency shelter and feeding for victims; and
Securing relief and rehabilitation funding.
10.4 REPAIR AND MAINTENANCE OF FLOOD CONTROL STRUCTURES
The maintenance of flood control structures may be required to insure serviceability of the structures in time of
flood and maintenance function involves actual repair and restoration procedures as below:
10.4.1 Routine Inspection and Testing
Channels and floodway‘s - Periodic maintenance must be carried out during the flood as well as following the
flood. For this periodic inspection of improved channels and floodway shall be made by the authorized agency
such that:
The channel or floodway is clear of debris; weeds, and wild growth;
The channel or floodway is not being restricted by the depositing of waste materials, building of
unauthorized structures or other encroachments;
The capacity of the channel or floodway is not being reduced by the formation of shoals;
Banks are not being reduced by the formation of shoals;
Banks are not being damaged by rain or wave wash, and that no sloughing of banks has occurred;
Pitching sections, spurs and flood walls are in good condition;
Approach and outlet channels adjacent to the improved channel or floodway are sufficiently clear of
obstructions and debris to permit proper functioning of the project work.
The capacity of the channel is not being reduced by sediment deposition beyond the limits
Certain recurrent problems should have routine inspection and testing program such as:
Concrete Cracking. The test program will include measurements to determine if the crack is stable; or if
not, the rate of displacement and crack progression. If the test program indicates that the crack is stable,
the appropriate repair is recommended in the inspection report. However, if the crack is found to be
active, an investigation program is recommended to determine the cause of the crack and the necessary
corrective action.
Scour Areas. Any unlined channel may experience scour. This is especially true where major side
channels or side drains enter the channel. An annual test program is required to determine the extent of
this scour and to follow its effects; this test program will include a survey to plot the channel profile in
areas that scour is noted.
10.4.2 Routine Maintenance Measure
As the repair and maintenance of river training structure is easier after the monsoon is over and the flood
subsides, routine maintenance shall be carried out after monsoon.

Flood Control and Management Manual EMERGENCY FLOOD MANAGEMENT
WECS 10-5
10.4.2.1 Maintenance of Embankment for Rise of River Bed:
In braided rivers, bed rise due to deposition of sediment prevails frequently in Nepalese rivers. This situation
results in inadequate flood carrying capacity of river channel. This situation requires heightening of the existing
embankment. The heightening of existing embankment can either be simply rising of earthen embankment with
grass turfing, with or without plantation or it may require further slope protection with revetment and subsequent
addition of launching apron.
The borrow pits for embankment heightening is placed on the river side which helps to develop the deep channel
by removing the sediment from the bed.
Figure 10-2: Heightening of Embankment
10.4.3 Non-Routine Maintenance
Certain maintenance procedures which are not explicitly described as routine are implied to insure serviceability
in times of flood. Such procedures would include repair of any damage caused by flood runoff, maintenance of
the berm, roadway and the right-of-way fencing (so as to provide unimpeded access to the project units at all
times), and other such required maintenance which occurs on an irregular basis.
The failures of serviceability of structures due to faulty design and faulty alignment of the embankment such as
inadequate width, height and alignment may require redesign and reconstruction of the entire system or parts of
the system.
10.4.4 Aesthetic treatment maintenance
Aesthetic treatment maintenance shall maintain or improve upon the original design concept level of aesthetic
quality and utilitarian effectiveness. This includes maintenance of landscaping, painting concrete walls, repairing,
replacing and painting sign posts etc.
10.4.5 Emergency Maintenance
Emergency maintenance may be required at the time of monsoon because the severe erosion of the
embankment, which may lead to complete breach. If the erosion of the embankment is rapid, the following
measure shall be adopted to check the erosion.
Extension of apron toward main flow by dumping large size boulders or gabion boxes filled with stones.
Reconstruction of damaged portion of the protection works.
Pile driving and fencing to lowest scour depth.
Destruction of dam created by land slide and debris flow
10.4.6 Training Function and Training Responsibilities
The operation and maintenance organization should formulate regularly the scheduled program to provide
training in certain critical areas to maintenance crew and affected communities in the following aspects:

Flood Control and Management Manual EMERGENCY FLOOD MANAGEMENT
WECS 10-6
a. Inspection Training: Inspection training will be designed to insure uniform inspection procedures, uniform
reporting, and inspection controls over repairs and project construction; to qualify alternative personnel for each
type of inspection; and to supplement and verify adequacy of the inspectors.
b. Repair Training: Repair training is intended to insure uniform repair procedures and competent workmanship.
A corollary responsibility is the development of standard repair methods, in cooperation with the local government
and affected community. These methods should be documented in written form to insure that the techniques and
procedures are not lost with personnel changes.
c. Investigation and Test Training: Training in the investigation and test program will be designed to develop
and maintain uniform methods, procedures, and valid program results.
10.5 FLOOD FIGHTING
When the rate of erosion is too high and flood is reoccurring, in such a situation emergency maintenance of
existing structure alone with the conventional practice shall not be adequate but requires flood fighting measures
such as:
Construct porcupine in natural ground and extend it to river bank and further down to the main flow by
increasing the length progressively.
Construct bamboo piling and fencing or pile spurs
Provide screen on the embankment slope
Repair the damaged portion by filling sand bags
Protect bank by old tyres and nylon mesh
This strategy for flood fighting includes the community-level disaster preparedness programme during extreme
floods: The key programme elements are:
Establishment of emergency supply warehouses for high-risk areas on central/state/ local basis;
conducting of rehearsals/drills exercises with all key stakeholders at frequent intervals at different
locations and providing training in rescue operations for identified groups;
Formation of standing committees to support search and rescue programme with necessary facilities at
district as well as local level (vulnerable localities);
10.5.1 Preparedness for Flood Fighting
Emergency installation of locally available material for bank protection works such as bamboo piles;
Grow indigenous shrubs on the land cutting sites
Plant bamboo on river banks as protective measures;
Construct temporary spurs with locally available materials like bamboo logs, sand bags and stones if
available;
Use bamboo piling and sand bags for bank protection; and
Place tree trunk and boulders to reconstruct the breached portion of embankment
Construction of riprap windrow and trench cut riprap protection
A stock of boulder, crates, sand bags etc. should be kept ready as an emergency flood fighting measures
10.5.2 Flood Fighting Measures:
10.5.2.1 Ring Bund for Sand Boiling
The common method for controlling a boil is to create a watertight sack ring around it. The sandbag structure
should be high enough to slow the velocity of the water and prevent further discharge of material from the boil.
The flow of water should never be stopped completely, since this may cause the boil to ―break out‖ in an area
near the existing sack ring. A spillway must be constructed to direct water away from all boil sites
The sack ring should be large enough to encompass the area immediately surrounding the discharge point (3 to
4 feet diameter). If several boils carrying material are found, a single large sack ring may be constructed around
the entire ―nest‖ of boils
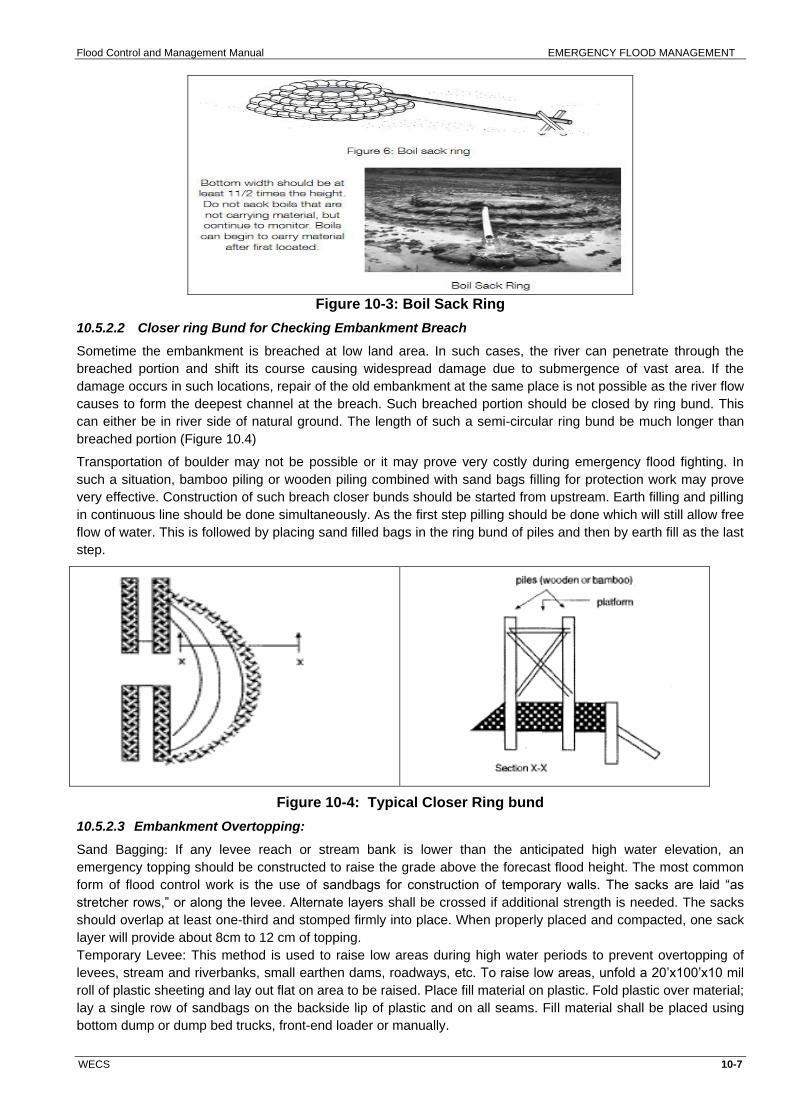
Flood Control and Management Manual EMERGENCY FLOOD MANAGEMENT
WECS 10-7
Figure 10-3: Boil Sack Ring
10.5.2.2 Closer ring Bund for Checking Embankment Breach
Sometime the embankment is breached at low land area. In such cases, the river can penetrate through the
breached portion and shift its course causing widespread damage due to submergence of vast area. If the
damage occurs in such locations, repair of the old embankment at the same place is not possible as the river flow
causes to form the deepest channel at the breach. Such breached portion should be closed by ring bund. This
can either be in river side of natural ground. The length of such a semi-circular ring bund be much longer than
breached portion (Figure 10.4)
Transportation of boulder may not be possible or it may prove very costly during emergency flood fighting. In
such a situation, bamboo piling or wooden piling combined with sand bags filling for protection work may prove
very effective. Construction of such breach closer bunds should be started from upstream. Earth filling and pilling
in continuous line should be done simultaneously. As the first step pilling should be done which will still allow free
flow of water. This is followed by placing sand filled bags in the ring bund of piles and then by earth fill as the last
step.
Figure 10-4: Typical Closer Ring bund
10.5.2.3 Embankment Overtopping:
Sand Bagging: If any levee reach or stream bank is lower than the anticipated high water elevation, an
emergency topping should be constructed to raise the grade above the forecast flood height. The most common
form of flood control work is the use of sandbags for construction of temporary walls. The sacks are laid ―as
stretcher rows,‖ or along the levee. Alternate layers shall be crossed if additional strength is needed. The sacks
should overlap at least one-third and stomped firmly into place. When properly placed and compacted, one sack
layer will provide about 8cm to 12 cm of topping.
Temporary Levee: This method is used to raise low areas during high water periods to prevent overtopping of
levees, stream and riverbanks, small earthen dams, roadways, etc. To raise low areas, unfold a 20‘x100‘x10 mil
roll of plastic sheeting and lay out flat on area to be raised. Place fill material on plastic. Fold plastic over material;
lay a single row of sandbags on the backside lip of plastic and on all seams. Fill material shall be placed using
bottom dump or dump bed trucks, front-end loader or manually.

Flood Control and Management Manual EMERGENCY FLOOD MANAGEMENT
WECS 10-8
Wooden panels are used on the waterside shoulder and reinforced on the opposite side with sandbags. The
method is used to raise low reaches during high water and divert debris flows. Stakes 2‖x 4‖x 6‘ should be driven
on the waterside shoulder 6 feet apart. A shallow trench is and lined with empty sandbags to provide a seal. Pre-
constructed wooden panels are placed in the trench.
10.5.2.4 Embankment Toe failure by Scouring River Bed
Riprap windrow
Windrow revetment technique consists of burying or piling a sufficient supply of erosion-resistant material in a
windrow below or on the existing land surface along the bank, then permitting the area between the natural
riverbank and the windrow to erode though natural processes until the erosion reaches and undercuts the supply
of stones. This technique is useful for flood fighting at actively eroding sites when the stream bed cannot be
accessed for construction or at location of spatial certainty but temporal uncertainty for damages to occur.
Design Procedure for Riprap windrow shall be as indicated below:
Refer to the steps in the Revetment Design Procedures for guidance on most aspects of the Windrow
Riprap design.
Windrows should be constructed of well-graded, self-launching stone that is of adequate size.
The upstream and downstream ends of riprap windrows should be protected against erosion by placing
tiebacks at the ends of longitudinal stone toe. Upstream and downstream tiebacks should be designed
based on local experience and geomorphic analysis. Length of tiebacks is based upon expected channel
migration during launching flow events. Tiebacks should be angled about 30 degrees from the primary
flow direction.
The volume of riprap is determined as the product of the length of the bank slope plus bed scours where
riprap will launch and the riprap thickness, and plan view length of the project including tie-backs The toe
scour amount is estimated based on maximum scour depth. Toe scour riprap is the volume that would
uniformly cover the scour depth at the existing bank slope. A minimum of 25% should be added to the
riprap volume.
Windrows should be trapezoidal shaped to provide launching that is as uniform as possible and supplies
a steady supply of stones.
Figure 10-5: Definition Sketch of Windrow Riprap
Trench filled revetments
This technique is stacking of boulder in a trench dug near the toe of the embankment along the bankline. The
trench filled revetment serves the same purpose of the windrow riprap. The trench should be excavated to the
lowest practical level during low flows. The trench will most often be trapezoidal with 1:1 side slopes. The height
of the stone should be ½ to 1 times the width for launching

Flood Control and Management Manual EVALUATION
WECS 11-1
11 EVALUATION
Economical aspect is one of the various aspects examined during evaluation of a project for implementation. This
aspect of project evaluation is more significant as the evaluator can judge the investment justified or unjustified
only after economic evaluation.
11.1 COST ESTIMATION
Cost estimate of any flood management project is based upon the rates and quantities of various items of flood
control measures proposed. The rate analysis of the various items is based upon the approved district rate of the
concerned district and the approved rate analysis norm of the government which is updated from time to time.
The quantities of items are derived from the design drawings of the works. Total cost of a flood management
project includes:
Capital cost, related to work items designed and proposed for construction
Operation and maintenance cost, related to the cost required for operation and maintenance after completion
of the project. It is generally taken to be 1.5% to 5% of capital cost depending upon the nature and volume
of the works under the project
Contingencies:
Physical contingency, related to uncertainty about the exact nature of the works. It is taken to be 10% of
capital cost as per the prevailing Public Procurement Act 2063 and Public Procurement Rules 2064 of
Nepal.
Price contingency, related to uncertainty about the variations in prices in future. It is taken to be 10% of
capital cost as per the prevailing Public Procurement Act 2063 and Public Procurement Rules 2064 of
Nepal.
Other contingency, related to unseen miscellaneous minor works and construction supervision
management. It is taken as per the prevailing Public Procurement Act 2063 and Public Procurement Rules
2064 of Nepal.
Besides, Provision for VAT (as per the prevailing Public Procurement Act 2063 and Public Procurement Rules
2064 of Nepal) is also made in the total cost estimation.
Cost estimates are generally prepared using financial prices so that the actual cost of the project could be known
to the client for better planning. For economic analysis, financial costs are either adjusted using standard
conversion factor (SCF) or economic prices are used for costing itself.
11.2 BENEFITS ASSESSMENT
The direct benefits of flood control/river training measures are generally the value of the losses or damages that
would have occurred without river control/training measures. Such benefits often anticipated are as follows:
Increase in crop yield
Increase in area under crop
Increase in value of the land reclaimed
Saving in transportation expenses
Value of houses damaged
Value of cattle lost
Value of pets/ poultry products lost
Value of damages to public utilities such as road, sewer, electricity and telephone line, vehicles etc.
Apart from the primary quantifiable benefits (tangible benefits), there are secondary / intangible benefits of the
project, which cannot be ignored. They are:
Introduction of River control technology and skill enhancement of the project people due to the introduction of
various related training programs.
Improvement in road infrastructures in project area making easy access to people.
Improvement of living standard of the people in project area due to increase in income.
Significant employment impact in the project area.

Flood Control and Management Manual EVALUATION
WECS 11-2
Development of other businesses.
Aggradations of natural environment.
Improvement in health condition due to reduction in health hazard.
Increase in revenue for the government due to value enhancement of land, increase in production and
related industries and business.
Reduction in loss of human and cattle lives.
11.2.1 Estimation of Flood Damages
Flood damages depend upon the severity of the flooding event where the severity, in case of riverine flooding, is
dictated generally by the flooding levels but also by high flow velocities and duration of flooding. The severity of
flooding is estimated using hydrologic and hydraulic models to simulate the water surface elevations and flow
velocities caused by storm events of various magnitudes. Hydrologic models are used to estimate the peak flows
that are caused by a range of rainfall events. These models simulate physical watershed processes to convert
rainfall into runoff. Modeling is typically performed for individual storm events of varying severity. The result of
hydrologic modeling is typically the relationship between peak flows and their probability of occurrence as shown
in Figure 11-1. Such relationship can be determined for any given location along a stream.
A hydraulic model takes the peak flows resulting from the hydrologic model and estimates water surface
elevations. The horizontal extent of the flooding caused by a given event is one of the results of hydraulic
modeling. This area called the floodplain is determined by intersecting the flood elevations with the terrain.
Floodplains for severe storms cover greater area than those for lesser events. The second result from hydraulic
modeling is the relationship between flood elevations and probability of exceedance as shown in Figure 11-2.
A floodplain inventory is required to determine the zero-damage elevations as well as the types of buildings and
other assets at risk. The damages caused by a flood reaching a given elevation are a function of the flooding
depth that causes damages. Therefore, the zero-damage elevation, typically the elevation of the lowest occupied
floor in each building, is necessary to determine the depth of the flood waters inside. Similarly, for utilities, roads,
bridges and other infrastructure, it is possible to determine a zero-damage elevation below which the asset is not
expected to sustain damages.
Elevation damage curve is a relationship between the flood water depths and corresponding accumulated all
damages of all the assets that would occur if the flood waters reach that elevation. Typical shape of this curve is
shown in Figure 11-3. Since each flood elevation in Figure 11-3 is associated with the probability of the rainfall
event that caused it, the elevation-damage curve can be transformed into a damage-frequency curve by
assigning the exceedance probability to the corresponding damages as shown in Figure 11-4.
Figure 11-1: Flood Depth - Frequency Relationship Figure 11-2: Flow - Frequency Relationship

Flood Control and Management Manual EVALUATION
WECS 11-3
The process of computing damages avoided (benefits) requires estimation of the damage frequency relationship
with and without the flood protection project. The same sequence of computations explained above for the
without-project condition is applicable for with the project condition. Figure 11-5 illustrates the result of the two
parallel computations. The area under each curve in Figure 11-5 corresponds to the average annual damages
(AAD). Therefore, the difference between the two areas is the expected annual damages avoided, which by
definition corresponds the average annual benefits (AAB). This is represented by black shaded area in the Figure
11-5.
Figure 11-5: Damage frequency curves with and without project
11.2.2 Summarized Steps to Estimate Damages Avoided (Benefits)
Delineate the study area
Conduct inventory of the study area to categorize buildings, infrastructure and other assets and estimate
zero damage elevations for each asset.
Evaluate and plot depth damage relationships for all assets.
Perform hydrologic and hydraulic modelling for a series of events of varying severity to determine flood
elevation - frequency relationships, for with and without the project conditions.
Calculate elevation-damage relationships accumulated for all assets in the study area, for with and
without project conditions.
Calculate damage-frequency relationships for with and without project conditions.
Calculate average annual damages (AAD), for with and without project conditions, as the areas under the
corresponding damage-frequency curves.
Calculate the average annual benefits (AAB) as the AAD without project minus the AAD with project.
Financial benefit is converted to economic benefit with the use of Standard Conversion Factor (CFC) as a multiplier.
Figure 11-4: Damage-Frequency Relationship Figure 11-3: Elevation-Damage Relationship

Flood Control and Management Manual EVALUATION
WECS 11-4
11.3 ECONOMIC ANALYSIS
Economic analysis of a project aims at determining whether the project is consistent with the overall national and
sectoral objectives. Furthermore, it tells whether the investment proposed is the best means of achieving the
intended objectives. The analysis assesses a project in the context of national economy and hence differs from
financial analysis both in terms of identification and evaluation of inputs and outputs, and therefore in the
composition of costs and benefits. Though the financial analysis and economic analysis are closely related and
both are conducted in monetary terms, they have following important distinctions:
The financial analysis evaluates the commercial viability of the project from the view point of the project
entity whereas economic analysis evaluates from the view point of the society.
In financial analysis market prices are normally used whereas in economic analysis ―shadow‖ prices
which reflect social or economic values are used.
In economic analysis, interest on capital is never separated and deducted from the gross return whereas
in financial analysis interest paid to the external suppliers of money may be deducted to derive the
benefit available to the owners of the capital.
In economic analysis, taxes and subsidies are treated as transfer payments whereas in financial analysis,
taxes are treated as cost and subsidies as return.
The evaluator must be acquainted with the following terms while performing economic evaluation:
11.3.1 Assumptions
Cost and benefit streams of a project are estimated under the certain assumptions. The assumptions generally
made are as follows:
The project life (for example: 15 or 20 or 25 or 50 years etc., depending upon the nature of the works)
The Construction period and year wise capital cost flow ( for example: construction period 3 years; 30%
investment of capital cost in first year, 40% investment of capital cost in second year and remaining 30%
investment of capital cost in third year).
The maintenance cost that would be required after completion (generally 1.5% to 5 % of capital cost).
Benefit development period (for example: 3 years for benefit development such that 40%, 80% and 100 %
benefits are generated in first, second and third years respectively after completion of project. Full benefit
would be realized from third year after completion onwards till the life of the project).
Prices used in the estimation - all constant prices.
Discount rate used (interest rate offered by commercial banks, generally adopted rate is 10% to 12%, in case
of ADB it is 9%).
Base year for deriving present worth.
11.3.2 Discounting
Discounting is a process by which future amounts can be expressed in terms of present worth using an
appropriate discount rate where discount rate is an interest rate on a sum of money borrowed, usually offered by
most of the commercial banks. Discount rate is sometimes also taken as the borrowing rate the nation has to pay
to finance the project. Discounting calculates the amount of money required today which, when invested today at
an interest rate equivalent to discount rate would yield the future amount. It assumes a viewpoint which looks
back from the future to the present.
If the interest/discount rate is "i", then the sum arising in "n" years‘ time ("An") from an investment of "A0" is given
by the relation,
An = A0 * (1+i) n
Similarly, the present value ("A0") of a sum ("An") expected to arise in "n" years‘ time is:
A0 = An / (1+i) n
The factor [1 / (1+i) n
] is known as discount factor (for any i and n), which when multiplied with future amount
gives the present amount. The table 11-1 illustrates the calculation of discount factors for two discount rates -
10% and 12%, project life of 25 years.

Flood Control and Management Manual EVALUATION
WECS 11-5
Table 11-1: Calculation of Discount Factors for discount rates 10% and 12%
Years Discount factor at 10% discount rate
Discount factor at 12% discount rate
D.F. = 1 / (1+i)n,
where n = 1,2,3,…..25 and i =10% for (2) or 12% for (3)
(1) (2) (3) (4)
1 0.90909 0.89285 D.F. = 1 / (1+i)1
2 0.82644 0.79718 D.F. = 1 / (1+i)2
3 0.7513 0.71176 D.F. = 1 / (1+i)3
4 0.683 0.6355 D.F. = 1 / (1+i)4
5 0.6209 0.56741 D.F. = 1 / (1+i)5
6 0.56445 0.50661 D.F. = 1 / (1+i)6
7 0.51313 0.45233 D.F. = 1 / (1+i)7
8 0.46648 0.40386 D.F. = 1 / (1+i)8
9 0.42407 0.36058 D.F. = 1 / (1+i)9
10 0.38551 0.32194 D.F. = 1 / (1+i)10
11 0.35046 0.28744 D.F. = 1 / (1+i)11
12 0.3186 0.25664 D.F. = 1 / (1+i)12
13 0.28963 0.22914 D.F. = 1 / (1+i)13
14 0.2633 0.20458 D.F. = 1 / (1+i)14
15 0.23936 0.18266 D.F. = 1 / (1+i)15
16 0.2176 0.16308 D.F. = 1 / (1+i)16
17 0.19781 0.1456 D.F. = 1 / (1+i)17
18 0.17982 0.13 D.F. = 1 / (1+i)18
19 0.16347 0.11607 D.F. = 1 / (1+i)19
20 0.1486 0.10363 D.F. = 1 / (1+i)20
21 0.13509 0.09252 D.F. = 1 / (1+i)21
22 0.1228 0.0826 D.F. = 1 / (1+i)22
23 0.11163 0.07375 D.F. = 1 / (1+i)23
24 0.10148 0.06584 D.F. = 1 / (1+i)24
25 0.09225 0.05878 D.F. = 1 / (1+i)25
11.3.3 Standard Conversion Factor
The factors which are used to covert financial prices of goods and services to economic prices, taking account of
distortions to the pricing system within the national economy are called standard conversion factors (SCF). These
are pre-calculated factors which are directly used for conversion of financial prices into economic prices during
economic analysis. Table 11-2 shows some of the standard conversion factors (PDSP manual -M10)
Table 11-2: Standard Conversion Factors S.N. Descriptions Hills Terai 1 Construction cost 0.95 0.95
2 Benefit# 0.95 0.95
3 Operation and Maintenance Cost 0.96 0.90
Note: # SCFs are also used for calculating economic benefits though it is not mentioned in PDSP manual - M10
11.4 ECONOMIC INDICATORS
Economic indicators namely Net Present Worth (NPW), Economic Internal Rate of Return (EIRR) and Benefit
Cost Ratio (B/C) are commonly used for comparing cost and benefit streams in arriving at investment decisions.

Flood Control and Management Manual EVALUATION
WECS 11-6
11.4.1 Net Present Worth (NPW)
Net Present Worth is the difference between the present worth of the benefit and cost streams of a project which
have been discounted at a rate equal to the opportunity cost of the capital. Discount rate generally considered
here in Nepal ranges from 10% to 12%.
This is expressed as:
1 1
Nt t
tt
B CNPW
i
Where, Bt = benefit in each year
Ct = cost in each year
i = discount rate
t = 1, 2, 3…..N, years
N = life of the project
11.4.2 Economic Internal Rate of Return (EIRR)
Economic Internal Rate of Return is the rate of discount at which the cost and benefit streams over the life of the
project are equalized. It is the maximum interest rate that a project could pay for the resources used if the project
is to recover its investment and operating costs. It is that discount rate which will make the net present worth of
the incremental net benefit stream equal to zero.
Economic Internal rate of return (EIRR) is the discount rate, r, such that
1
01
Nt t
tt
B C
r
Where, Bt = benefit in each year
Ct = cost in each year
r = internal rate of return (IRR)
t = 1, 2, 3…..N, years
N = life of the project
11.4.3 Benefit Cost Ratio (B/C)
Benefit cost ratio is the ratio obtained when the present worth of the benefit stream is divided by the present
worth of the cost stream, both the streams being discounted at the opportunity cost of the capital. It has high
degree of sensitivity to the way costs and benefits are classified.
This is expressed as:
1
1
1
t
tN
tit
B
iB
CC
i
where, Bt = benefit in each year; Ct = cost in each year; i = discount rate; t = 1, 2, 3..N, years; N = life of the project
11.4.4 Decision Criteria
A project is considered to be economically viable if the economic indicators show the results as in Table 11-3:
Table 11-3: Decision Criteria
S.N. Economic Indicators Results
Single project Alternate Projects
1 NPW Positive Project with Maximum positive NPW
2 B/C Greater than 1 Project with Maximum positive NPW (This project may not be the one with the greatest BC ratio)
3 EIRR Greater than Discount Rate Project with Maximum EIRR greater than Discount Rate
11.1
11.2
11.3

Flood Control and Management Manual EVALUATION
WECS 11-7
11.5 SENSITIVITY ANALYSIS
Criteria used for investment decisions are calculated using the most probable values of the parameters in the
cost and benefit streams of a project. The values of parameters can change over the life of the project for a
variety of reasons, and these changes are difficult to predict. The effects of possible changes in these variables
on decision criteria must be assessed in order to minimize possible adverse effects on the project‘s viability. The
sensitivity analysis is the test which indicates how a possible change in events may affect a project‘s economic
viability.
Sensitivity of cost of the project and benefit are carried out to know the effect on the net present worth (NPW),
Benefit-cost ratio and Economic Internal Rate of Return. Sensitivity of cost is carried out by holding all other
factors constant, except the cost, which is increased by 20%. Sensitivity of benefit is conducted by decreasing it
by 20%, while holding all other factors constant. Also the sensitivity of the cost and benefit is conducted by
increasing the cost by 20% and decreasing the benefit by 20%, while holding all other factors constant. Not much
variation in the value of economic indicators helps to conclude that the project is least sensitive and hence
investment on such project would not be risky.

Flood Control and Management Manual REFERENCES
WECS i
REFERENCES
AB Shrestha et. Al, 2912, Resource Manual On Flash Flood Risk Management, International Centre
For Integrated Mountain Development, Kathmandu, Nepal;
B. Przedwojski & Blazejewsky et al; River Training Technique, Fundamental, design and Applications;
A. A Balkema, Rottordam The Netherlands, 1995
Chow, V. T. (1959). Open channel hydraulics. New York: mcgraw Hill Book Company.
Chow, V. T., Maidment, D. R., & Mays, L. W. (1988). Applied hydrology. New York: McGraw-Hill Book Company.
Cudworth, A. G. (1989) Flod hydrology manual. A Water Resources Technical Publication. Denver: Bureau of Reclaimation, US Department of Interior.
CWC (2012). Handbook for flood protection, anti-erosion and river raining works. New Delhi: Central Water Commission.
Department of Irrigation, Government of Nepal (1990). Design Manual for Irrigation Projects in Nepal, M9 Drainage Manual, Government of Nepal, Kathmandu.
Department Of Public Works and Highways Japan International Cooperation Agency Manual On Flood
Control Planning, March 2003, Project For The Enhancement Of Capabilities In Flood Control And
Sabo Engineering Of The DPWH
Department Of Public Works and Highways, Japan International Cooperation Agency Technical
Standards And Guidelines for Design of Flood Control Structures, Project for The Strengthening of
Flood Management Function of The DPWH, 2010;
Department Of the Army EM 1110-2-1418 U.S. Army Corps of Engineers CECW-EH-D Washington,
DC 20314-1000,Manual No. 1110-2-1418 31 October 1994, Engineering and Design Channel Stability
Assessment For Flood Control Projects
Design Practices and Specifications Adopted By The Maccafferi Pvt. Ltd.(www. Maccafferi.Com)
Engineering Field Handbook, Part 650, 2008; United States Department of Agriculture; Natural
Resources Conservation Service, USA
Environmental Protection Act, 2053 and Environmental Protection Rule,2054;
French, R. H. (1986). Open-channel hydraulics. New York: McGraw-Hill Book Company.
General Guidelines for Preparing River Morphological Reports, Government Of India, Central Water
Commission, March, 2009
General Guidelines For Preparing River Morphological Reports, Government Of India, Central Water
Commission, March, 2009
GoN (1990) Design Manual For Irrigation Projects In Nepal, M7 Headworks River Training Works And
Sedimentation Manual, DoI, Planning And Design Strengthening Project, United Nations Development
Programme.
GoN(1990) Design Manual For Irrigation Projects In Nepal, M7,Headworks River Training Works And
Sedimentation Manual, dOI, Planning and Design Strengthening Project, United Nations Development
Programme.
GoN, Ministry of Water Resources, Department of Electricity Development; Design Guidelines for
Headworks for Hydropower Project,
Government of India, Central board of Irrigation and Power, River behaviour, Management and
Training, (1989). Desktop Publisher Central board of Irrigation, New Delhi India.
Government of India, Central Water Commission, Flood Management Organization, (2012). Flood

Flood Control and Management Manual REFERENCES
WECS ii
Management, Anti Erosion and River Training Works
Indian Standard, IS 15568, 2006, Precast Concrete Blocks For Paving — Specification, Bureau Of
Indian Standards Manak Bhavan, 9 Bahadur Shah ZafarMarg New Delhi 110002
Jha, Hemant et al., Flood control Measures, Best Practice Report, an Approach to Community Based
Flood Control Measures in Terai, GTZ, Kathmandu, 2009
JICA- Master plan study for Flood Mitigation in Nepalese Rivers
JICA. (2002). Technical standards and guidelines for planning and design. Tokyo: Department of Public Works and Highways.
Karmacharya, J. L. (1982). Hydrological studies of Nepal. Kathmandu: Water and Energy Commission Secretariat.
KG Rangaraju, 1993, Flow through Open Channel, Tata MCGrawHills Publishing Co. Ltd. New Delhi
India;
Linsley, R.K.; M.A. Kohler; J.L.H. Paulhus (1988). Hydrology for engineers /. - SI metric ed. New York:
McGraw-Hill
Luna B. Leopold And Thomas Maddock, Jr; 1953;. The Hydraulic Geometry of Stream Channels And
Some Physiographic Implications; Geological Survey Professional Paper 252, Department of the
Interior, US
Margret S Pitersen; River Engineering Prentice-Hall Englewood Cliffs, New Jersey, USA; 1986
Mutreja, K.N. (1986). Applied hydrology. New Delhi: Tata McGraw-Hill Publishing Company Limited.
National Disaster Management Guidelines for Management of Flood, National Disaster Management
Authority; Government of India
Part 654 Stream Restoration Design National Engineering Handbook, USA, 2007;United State
Department of Agriculture, National Resources Conservation Services, USA
Pilarczyk, K.W. (1984). Filters in W. van Aalst (ed.), Chapter 2, The Closure of Tidal Basins, Delft
University Press, Delft, The Netherlands.
Planning and Design Strengthening Project (PDSP), Design Manuals for Irrigation Projects in Nepal,
M2 Survey and Mapping Manual; Sir Macdonald & Partner Ltd.; 1990
Ponce, V.M. (2008). Q&A on the return period to be used for designed.
http://ponce.sdsu.edu/return_period.html, 28 March 2019
S. Dey, Fluvial Hydrodynamics, Geoplanet: Earth And Planetary Sciences, Doi: 10.1007/978-3-642-
19062-9_9, © Springer-Verlag Berlin Heidelberg 2014
S.A. Brawn; 1985; US Department of Transportation, Federal Highway Administration; Design of spur
type stream Bank Stabilization Structures
S.A. Brawn; 1985; US Department of Transportation, Federal Highway Administration; Design of spur
type stream Bank Stabilization Structures
Sharma, K.P. (1989). Simple storm water drainage design model (STORMDRAIN). Kathmandu:
Department of Water Supply and Sewerage.
Sharma, K.P. and N.R. Adhikari (2004). Hydrological estimations in Nepal. Kathmandu: Department of
Hydrology and Meteorology.
Standard Specifications for Road and Bridge Works, 2073; Department Of Roads Government Of Nepal.
U.S. Army Corps of Engineers, Office, Chief of Engineers (1991). Hydraulic design of flood control channels, EM1110-2-1601,U.S. Government Printing Office, Washington DC.
U.S. Army Corps of Engineers, Office, Chief of Engineers (2000). Design and construction of levees EM 1110-2-1913, U.S. Government Printing Office, Washington DC.
U.S. Department Of The Interior Bureau Of Reclamation Technical Service Center; Erosion and
Sedimentation; Sedimentation And River Hydraulics Group Denver, Colorado, 2006

Flood Control and Management Manual REFERENCES
WECS iii
U.S. Department of the Interior Bureau of Reclamation, Bank Stabilization Design Guidelines,
Technical Service Centre Denver, Colorado, USA
UDFCD. (2017). USDCM: Volume 1- management, hydrology and hydraulice. Colorado: Urban
Drainage and Flood Control District
Vanoni VA (1975) Sedimentation Engineering. ASCE Manual Number 54, American Society Of Civil
Engineers, New York
Viessman, W; G.L.Lewis and J.W. Knapp (1989). Introduction to hydrology. Singapore: Harper and Row Publishers.
WECS (2018). Hydrological manual for infrastructures. Report prepared by : ADAPT-Nepal - Great Nepal Pvt. Ltd. JV. Kathmandu; Water and Energy Commission Secretarial.
WECS. (1979). Design manual for river training works in Nepal. Kathmandu: Water and Energy Commission Secretariat.
WECS/DHM. (1990). Methodologies for estimating hydrologic characteristics of ungauged locations in Nepal. Kathmandu: Water and Energy Commission Secretariat and Department of Hydrology and Meteorology.

Flood Control and Management Manual APPENDICES
WECS
APPENDICES


Flood Control and Management Manual Appendix -1
WECS 1
Appendix: 1 : Review of Master Plans and Design Reports in the Context of Nepal and
South Asia 1.1 Flood and River Bank Erosion Control in the Indian Subcontinent Flood and riverbank erosion are two dominating factors restricting the development of the flood plains. The cause for both is largely beyond human influence and man can only mitigate their negative effects. The major rivers of the Indian subcontinent, namely Ganges and Brahmaputra are specifically difficult to deal with. Their river basins are dominated by the effects of plate movement with the Indian subcontinent slamming into the Eurasian plate at a rate of about three millimeters per year. As a consequence the Himalayas, the highest and one of the most instable mountain ranges of the world was formed, characterized by steep, instable slopes, frequent earthquakes, and high seasonal rainfall from monsoon cloud busts as a consequence of blocked air movement along the mountains. The densely populated plains south of the Himalayas are formed by the depositions of fluvial erosion processes. As the mountain building continues the plains continuously undergo changes. 1.1.1 The three elements of design The standard engineering design process is generally based on the following three main elements:
Figure-1: Principles of integrated design (Pilarczyk, 2000) 1.1.2 A short review of common designs The generally followed riverbank protection concept is based on a ballasted filter above water level and a falling apron concept below water level as shown in Figure 2 (following an example from Bangladesh with concrete blocks). This concept provides a good protection above low water level with a ballasted filter protecting the fine underlying soil from erosion through waves or currents. The underwater part, however, shows weaknesses, as the falling apron concept results only in an about one-layer thick coverage (design formula often refer to 1.5 layers for quantity estimates). This layer is not stable and prone to winnowing, the loss of fines through the gaps in the protection, with subsequently steeper and steeper slopes and eventually a geotechnical mass failure of part of the bank (Figure 3 and Figure 4). This mass failure would occur more often in stable or degrading rivers, such as in the downstream Bangladesh part, while the aggrading tendency in some areas of Assam reduces the risk due to less scour and undermining of the bank. Overall design points (i) and (iii) have weaknesses, while point (ii) is generally fulfilled in designing the protective elements sufficiently heavy to resist flow forces or waves.
Mitigation measures are easy to achieve and can be built cost effectively, through dumping of additional layers of protection over initially launched material, or building the bank protection to the bottom layer on filters such as bamboo mats or geo-textile filter cloth (often referred to as fascine works). The second point to address is the geotechnical slope stability. This point is important due to the fact that the bank material often consists of fine sands and silts that are prone to liquefaction if suddenly undermined through erosion or shaken from earth quakes.

Flood Control and Management Manual Appendix -1
WECS 2
Figure 2: Bank protection built from the riverbank depending on falling aprons
Figure 3: Details of developed bank protection system, showing weakness under water
Figure 4: The geotechnical failure of the protected riverbank

Flood Control and Management Manual Appendix -1
WECS 3
After the Koshi Flood of 2008, the Emergency Flood Damage Rehabilitation Project of Government of Nepal, under the grant assistance of ADB has critically reviewed various master plans and design reports made for DWIDM in the past and encapsulated the river bank protection methods and techniques proposed in various rivers of Nepal. An overview of these master plans and design reports is tabulated in Table-1.1.
Table 1.1 Overview of master plans and design reports recently made for DWIDM
River Master plan study/ Design report
Koshi Department of Water Induced Disaster Project, Water Induced Disaster
Division Office Division No. 1, Biratnagar (2009)
Kamala Full bright Consultancy (Pvt.) Ltd. (2007)
Narayani North Star Engineering Consultant (P) Ltd. (2010)
Water Asia (P) Ltd. Consulting Engineers (2004)
West Rapti Nepal Consult (P) Ltd. JV Research Engineers Consultant, Everest
Engineering Consultants, and RIDA (P) Ltd. (2007)
Karnali Manisha Engineering Management Consultants (P) Ltd. ( 2011)
Mahakali Department of Water Induced Disaster Prevention, People‘s Embankment
Program Field Office no. 7, Mahendranagar, Kanchanpur ( 2011)
Table 1.2 provides an overview of the design methods used and in particular the design equations. The design methods deal in particular with the following design parameters:
design discharge
waterway width
scour depth
size bank protection elements
launching apron dimensions
spur lay-out
embankments
An inspection of Table 1.2 reveals the following:
The design methods used for all different rivers are similar and correspond to Indian standards.
This design method is based on the Lacey‘s depth and width. Input variables are the design discharge Q and the silt factor f via D50 (in mm).
The recurrence interval for the determination of design discharge is 50 years for most rivers and 100 years for the Koshi River. Considering that the damage which would occur would the embankment of the Koshi fail, there seems to be some logic in this.
The method to determine the design discharge is based on the method of Gumbel.
Only for the Mahakali the highest flood on record is used for design purposes.
For the branches of the Karnali River 2/3 of the design discharge is used..
Central in the design is the determination of the scour depth which is a certain factor (here mostly 1.5 is used) times the Lacey scour depth.
For the design velocity two equations are used, where the design velocity according to Kennedy is much higher than the Lacey velocity. Neither is used in the design of the gabions, which seems to be fairly standard in dimensions applied.
The freeboard used varies between 1.5 and 1.8 m.

Flood Control and Management Manual Appendix -1
WECS 4
Table 1.2 Design methods and data used as derived from the different master plans and design reports
Design
parameter Parameter Formula used
Rivers
Koshi West Rapti
Narayani Karnali Mahakali Upper reach Lower reach
Design
discharge
Recurrence interval design
flood (year) 100 50 50 50 50
Maximum
recorded Q
in 1934
Extrapolation method
Gumbel Gumbel Gumbel Gumbel
Gumbel
(GEV)
Design flood (m3/s) 22512 6,166 8,286
1.15 *15652
=18000
2/3% of Q50
=
2/3*17151
=11435
15000
Waterway
width
Lacey width (m) QP 75.4 720 373 433 637
Waterway design (m) PXW *1 X1=3 X1 =3 X1 = 3 X1 = 2.5 X1 =3
Scour depth
D50 (mm) 10 0.18-0.59 2.49
Silt factor f (note that D50 is in
mm) 5076.1 Df 5.56 5.28-4.31
(avg 4.85)
(0.40 –
2.75)
avg 1
2.5 2.78 2
Lacey depth (m) 3/1)(473.0
f
QR 7.52 5.12 9.54 9.10 7.58 9.23
Scour depth (m) RXd s 2 X2 = 1.5R Nose: X2 =
2.0-2.5 R
Nose: X2 =
2.0-2.5 R
Nose: X2 =
2.0R
Nose: X2 =
2.0 R
Nose: X2 =
2.0 R
Size bank
protection
elements
Design velocity
(m/s)
Lacey 3/16/144.0 fQu 1.32 1.113 1.98 3.03 2.94 2.75
Kennedy 64.0Rmu
(m=1) 3.64 2.84 4.23 4.11 4.39 4.16
Diameter protective elements Not provided

Flood Control and Management Manual Appendix -1
WECS 5
Design
parameter Parameter Formula used
Rivers
Koshi West Rapti
Narayani Karnali Mahakali Upper reach Lower reach
Launching apron
Pitching thickness (m) 3/1006.0 QT 0.17 (Used 0.3)
0.3 0.3 0.3 0.3 0.30
Launching apron thickness (launched)
1.25 T 0.375 0.375 0.375 0.375 0.375 0.375
Launching apron thickness (un-launched)
1.9 T ~ 0.60 to 1.0 m
0.60 to 1.0 m 0.60 to 1.0 m
0.60m 0.50m 0.50 to 0.60m
Length launching apron (m) 1.5 ds 1.5ds 1.5ds 1.5ds 1.5ds 1.5ds 1.5ds
Spur lay-out
Length L (m)
L = 3% river width
L < 10% river width 1/10 of river
width 1/10 of river width
Orientation Transverse to flow
Transverse to flow
17.5 o Transverse to
flow Transverse to flow
Transverse to flow
Spacing S (m) S = (3-4) L 3L ( 3-4) L ( 3-4) L (2-3)L (2-2.5) L (3-4)L
Embankments
Top width (m) 2.5 - 5 2.5 – 5 6 5 6
River slope 1V:2H 1V:2H 1V:2H 1V:2H 1V:1H
Land slope 1V:2H 1V:2H 1V:2H 1V:2H 1V:2H
Freeboard (m) BIS 1.8 m 1.8 m 1.8 1.5 1.8

Flood Control and Management Manual Appendix -1
WECS 6
Based on the review the following conclusions have been made:
Bank protection works along the major Terai rivers in Nepal consist almost exclusively of spurs often
combined with revetments in between, made of gabions filled with boulders. Also the launching
aprons are constructed of gabions.
The life time of these bank protection works is less than 10 years and often much shorter.
In many cases the failure seems to be caused by the occurrence of large scour holes in combination
with the not proper launching of the gabions. Due to this the gabions are subjected to large stresses
resulting in their disintegration, which subsequently in a number of steps results in a total failure of the
spurs.
Apart from the Koshi River spurs and embankments, monitoring and maintenance of the bank
protection works is not carried out.
Designs are based on standard designs from Indian standards, developed for ―normal‖ alluvial rivers
(not for braided rivers on alluvial fans with steep slopes and quick change in particle size distribution)
and might not be applicable.
No field measurements have been carried out to verify the design boundary conditions (discharge of
the attacking channel, scour depths, local velocities, etcetera)
The master plans all start from the presumption that embanking is a good strategy. In view of the
negative experiences from the Koshi River (in particular the Koshi 2008 flood), a separate study
should be carried out to determine the best strategy to deal with flooding problems along the major
Terai rivers.
The master plans are deficient in a number of aspects, related to the alignment of the embankments,
drainage facilities and embankment levels in relation to future flood levels.
The economic feasibility of the embankments schemes as proposed in the master plans is too
optimistic: life time of the bank protection works is much less than assumed (25 years), maintenance
is underestimated and drainage structures should be added.
Data on bank protections works and embankments are difficult to retrieve as they are now stored in
different offices and identification and access is difficult. This makes it very difficult to assess the initial
designs and the past maintenance.
Subsequently, some proposals have been made to improve the functioning and increase the life-time of bank
protection works and embankments. Ideally this should be under an institutional strengthening program for
DWIDM, in which possible improvements can be piloted. The following recommendations are made:
A bank protection pilot project should be initiated in which the cause of the failure of the bank
protection works is identified and remedial measures are tested. The ultimate aim of such a pilot
project would be the development of bank protection works, which with proper and timely
maintenance could last several decades rather than several years as is now the case.
Revetments without spurs might be preferable, because these result in lower velocities near the bank
and less deep scour holes.
In such a pilot project other bank protection techniques should be tested. One possible technique is
revetments made up of large geo-bags below the low water line and gabions above the low waterline,
constructed using an adaptive approach as applied in Bangladesh. Such practice can be effectively
used in the Terai Rivers of Nepal.
By necessity field measurements should be carried out to assess the design boundary conditions in
the Terai Rivers. Part of the pilot project should be the building up of capacity in Nepal to carry out
these measurements, which in view of the steep rivers and large velocities are not standard.

Flood Control and Management Manual Appendix -1
WECS 7
The embankments should not be built on the edge of the bank of the river. Some safety distance
between bank protection works and embankments should be provided for. Drainage facilities should
be supplied and drainage within the embanked areas should be optimized (via bridges and culverts).
Embankment levels and overall design of the embankments should be determined considering the
future rise of flood levels in these rivers on alluvial fans, when and where appropriate.
Master plans should be improved, not only in technical sense as recommended in the previous point,
but also regarding the economic feasibility of the proposed projects.
A GIS-based embankment and bank protection GIS-based asset management system should be
developed, which contains all relevant information and can be consulted on-line by the different staff
involved in design, monitoring and maintenance both in the DWIDM central offices and the Division
offices. Such an asset management system can help in allocating the limited funds at places where
they are really needed.

Flood Control and Management Manual Appendix -2
WECS 1
Appendix: 2 : Peak Discharge Calculations Peak /Design Discharge Calculations: A. Rational Method (Basin Area <12 km
2):
Small Basin having following parameters: Basin Area = 10 km
2, Length of basin = 3 km, Elevation difference = 150 m, Nature of land use = Agriculture.
Solution: Design Discharge is calculated in the following tabular form using Rational Method:
Return Period (T) in Years Relation Used 2 25 50 100
C
0.35 0.44 0.48 0.51
L (km)
3 3 3 3
H (m)
150 150 150 150
Time of concentration (t) in minutes
29.45 29.45 29.45 29.45
Rainfall Intensity (ITt) in cm/hr
2.74 3.81 4.17 4.56
Catchment Area (A) in km
2
10 10 10 10
Design Discharge (Q) in m
3/s
Q = 0.278 CT ITl A (Rainfall intensity in mm/hr)
26.67 46.56 55.58 64.62
B. Regional Method (Basin Area >12 km
2): Basin Area = 43,000 km
2
Solution: Specific Discharge (q) in m
3/s/km
2 for different Return Periods can be calculated by using either Figure
3-2 of manual or specific discharge relations directly. Design Discharge is calculated in the following tabular form using Regional Method:
Return Period (T) in Years
Relation Used Catchment Area (A) in
km2
Specific Discharge
(q) in m
3/s/km
2
Design Discharge (Q
= q*A) in m
3/s
2 q-2 year = 4.2 (Basin Area)-0.30
43,000 0.171 7,357
25 q-25 year = 30.8 (Basin Area)-0.44
43,000 0.282 12,114
50 q-50 year = 43.3 (Basin Area)-0.46
43,000 0.320 13,758
100 q-100 year = 61.4 (Basin Area)-0.49
43,000 0.329 14,166
C. Alternate Regional Method based on WECS/DHM 1990 Method (Basin Area >12 km
2): Basin Area below
3,000m= 19,500 km2
Solution: Design Discharge (Q) in m
3/s for different Return Periods can be calculated by using Regression
Equations (WECS/DHM 1990 Method) directly as shown in following tabular form:
Return Period (T) in Years
Regression Equations used Catchment Area below 3,000m (A) in km
2
Standard Normal Variate (s)
Design Discharge (Q) in m
3/s
2 Q2 = 1.88(Area of Basin below 3000m)0.88
19,500 0 11,204
25 Qt = exp (lnQ2+s*ln(Q100/Q2)/2.326)
19,500 1.759 17,243
50 19,500 2.054 18,536
100 Q100 = 14.63(Area of Basin below 3000m)0.73
19,500 2.326 19,814

Flood Control and Management Manual Appendix -2
WECS 2
D. Flood Frequency Analysis (Basin Area >12 km
2):
1. Normal distribution
XT = Xav + KT ×σx
and
Table 1: Annual peak discharge series for Karnali River from 1981 to 2010
S.N. Year X=Qpeak(m
3/s)
1 1981 8790
2 1982 8980
3 1983 21700
4 1984 6390
5 1985 8380
6 1986 7970
7 1987 5940
8 1988 12500
9 1989 7310
10 1990 9010
11 1991 6280
12 1992 6090
13 1993 6820
14 1994 7270
15 1995 9550
16 1996 6460
17 1997 7680
18 1998 9400
19 1999 8090
20 2000 12500
21 2001 7870
22 2002 7010
23 2003 8010
24 2004 6160
25 2005 9010
26 2006 9270
27 2007 9900
28 2008 12500
29 2009 17000
30 2010 8900
Average (Xav) 9091.33
SD (σx) 3376.30
Table 2: Calculation of KT (For Normal Distribution) and XT (Peak Flood Discharge for different p)
T p w KT (z) Xav=Ave (Qpeak) SD (σx) XT (m
3/s)
2 0.5 1.1774 0.0097
9091.33 3376.30
9124.08
5 0.2 1.7941 0.8573 11985.83
10 0.1 2.1460 1.3010 13483.90
20 0.05 2.4477 1.6670 14719.62
25 0.04 2.5373 1.7738 15080.21
50 0.02 2.7971 2.0789 16110.32
100 0.01 3.0349 2.3535 17037.45
200 0.005 3.2552 2.6046 17885.24
500 0.002 3.5255 2.9089 18912.65
1000 0.001 3.7169 3.1222 19632.81

Flood Control and Management Manual Appendix -2
WECS 3
.
2. Log Normal distribution
XT =e( Yav + KT ×σy)
and
Table 1: Annual peak discharge & Log Transformed time series for Karnali River from 1981 to 2010
S.N. Year X=Qpeak(m
3/s) Y=ln(Qpeak)
1 1981 8790 9.08
2 1982 8980 9.10
3 1983 21700 9.99
4 1984 6390 8.76
5 1985 8380 9.03
6 1986 7970 8.98
7 1987 5940 8.69
8 1988 12500 9.43
9 1989 7310 8.90
10 1990 9010 9.11
11 1991 6280 8.75
12 1992 6090 8.71
13 1993 6820 8.83
14 1994 7270 8.89
15 1995 9550 9.16
16 1996 6460 8.77
17 1997 7680 8.95
18 1998 9400 9.15
19 1999 8090 9.00
20 2000 12500 9.43
21 2001 7870 8.97
22 2002 7010 8.86
23 2003 8010 8.99
24 2004 6160 8.73
25 2005 9010 9.11
26 2006 9270 9.13
27 2007 9900 9.20
28 2008 12500 9.43
29 2009 17000 9.74
30 2010 8900 9.09
Average (Yav) 9.07
SD (σy) 0.30
Table 2: Calculation of KT and XT (Peak Flood Discharge for different T)
T p w KT (z)
Ave (Yav)
SD (σy)
AT =Yav + KT ×σy
XT
=EXP(AT)
2 0.5 1.1774 0.0097
9.07 0.30
9.073 8717
5 0.2 1.7941 0.8573 9.327 11237
10 0.1 2.1460 1.3010 9.460 12836
20 0.05 2.4477 1.6670 9.570 14328
25 0.04 2.5373 1.7738 9.602 14794
50 0.02 2.7971 2.0789 9.694 16220
100 0.01 3.0349 2.3535 9.776 17606
200 0.005 3.2552 2.6046 9.851 18977
500 0.002 3.5255 2.9089 9.943 20806
1000 0.001 3.7169 3.1222 10.007 22181

Flood Control and Management Manual Appendix -2
WECS 4
3. Gumbel's Distribution or Extreme Value Type -I Distribution (EVI)
XT =u +αYT
Where, u = μ − 0.5772×α (Location Factor)
μ = xav
(Mean of original Time Series)
α = (σx ×√6)/π (Scale factor)
YT = (-ln(-ln(1-1/T))) (Reduced Variate)
Table 1: Annual peak discharge for Karnali River from 1981 to 2010
S.N. Year X=Qpeak(m
3/s)
1 1981 8790
2 1982 8980
3 1983 21700
4 1984 6390
5 1985 8380
6 1986 7970
7 1987 5940
8 1988 12500
9 1989 7310
10 1990 9010
11 1991 6280
12 1992 6090
13 1993 6820
14 1994 7270
15 1995 9550
16 1996 6460
17 1997 7680
18 1998 9400
19 1999 8090
20 2000 12500
21 2001 7870
22 2002 7010
23 2003 8010
24 2004 6160
25 2005 9010
26 2006 9270
27 2007 9900
28 2008 12500
29 2009 17000
30 2010 8900
Average (Xav) 9091.33
SD (σx) 3376.30
Table 2: Calculation of YT and XT (Peak Flood Discharge for different T)
T p YT
α = (σx ×√6)/π μ = xav SD (σx)
u = μ − 0.5772×α
XT =u +αYT
2 0.5 0.36651
2632.49 9091.3 3376.30 7571.86
8536.69
5 0.2 1.49994 11520.43
10 0.1 2.25037 13495.93
20 0.05 2.9702 15390.88
25 0.04 3.19853 15991.96
50 0.02 3.90194 17843.67
100 0.01 4.60015 19681.71
200 0.01 5.29581 21513.02
500 0 6.21361 23929.12
1000 0 6.90726 25755.15

Flood Control and Management Manual Appendix -2
WECS 5
4. Log Pearson Type-III distribution
XT =e( Yav + KT ×σy)
Variance = Sum(Y-Yav)2/(n-1)
m = Rank
Standard Deviation (σy) = (Variance)0.5
n = Number of observations in time series
Skew Coefficient (Cs) = n * Sum(Y-Yav)3/(n-1)(n-2)(σy)
3
Where, KT is the frequency factor, obtained from standard table corresponding to probability of execeedence, p (= 1/T) and coefficient of Skewness, Csy
Table 1: Annual peak discharge & Log Transformed time series for Karnali River from 1981 to 2010
Rank Year X=Qpeak(m
3/s) Y=ln(Qpeak) (Y-Yav)
2 (Y-Yav)
3 Tr= (n+1)/m p = 1/T
1 1983 21700 9.99 0.8464 0.7787 31.00 0.0323
2 2009 17000 9.74 0.4489 0.3008 15.50 0.0645
3 2008 12500 9.43 0.1296 0.0467 10.33 0.0968
4 1988 12500 9.43 0.1296 0.0467 7.75 0.1290
5 2000 12500 9.43 0.1296 0.0467 6.20 0.1613
6 2007 9900 9.20 0.0169 0.0022 5.17 0.1935
7 1995 9550 9.16 0.0081 0.0007 4.43 0.2258
8 1998 9400 9.15 0.0064 0.0005 3.88 0.2581
9 2006 9270 9.13 0.0036 0.0002 3.44 0.2903
10 1990 9010 9.11 0.0016 0.0001 3.10 0.3226
11 2005 9010 9.11 0.0016 0.0001 2.82 0.3548
12 1982 8980 9.10 0.0009 0.0000 2.58 0.3871
13 2010 8900 9.09 0.0004 0.0000 2.38 0.4194
14 1981 8790 9.08 0.0001 0.0000 2.21 0.4516
15 1985 8380 9.03 0.0016 -0.0001 2.07 0.4839
16 1999 8090 9.00 0.0049 -0.0003 1.94 0.5161
17 2003 8010 8.99 0.0064 -0.0005 1.82 0.5484
18 1986 7970 8.98 0.0081 -0.0007 1.72 0.5806
19 2001 7870 8.97 0.0100 -0.0010 1.63 0.6129
20 1997 7680 8.95 0.0144 -0.0017 1.55 0.6452
21 1989 7310 8.90 0.0289 -0.0049 1.48 0.6774
22 1994 7270 8.89 0.0324 -0.0058 1.41 0.7097
23 2002 7010 8.86 0.0441 -0.0093 1.35 0.7419
24 1993 6820 8.83 0.0576 -0.0138 1.29 0.7742
25 1996 6460 8.77 0.0900 -0.0270 1.24 0.8065
26 1984 6390 8.76 0.0961 -0.0298 1.19 0.8387
27 1991 6280 8.75 0.1024 -0.0328 1.15 0.8710
28 2004 6160 8.73 0.1156 -0.0393 1.11 0.9032
29 1992 6090 8.71 0.1296 -0.0467 1.07 0.9355
30 1987 5940 8.69 0.1444 -0.0549 1.03 0.9677
Sum 2.6102 0.9546
Average (Yav) 9.07
SD (σy) 0.30 Check 0.30 OK
Variance 0.0900 Check 0.0900 OK
Cs 1.3063
Using formula
Table 2: Calculation of KT and XT (Peak Flood Discharge for different T)
T K(1.3) K(1.4)
KT
=K(1.3063) Ave (Yav) SD (σy) AT =Yav + KT ×σy
XT
=EXP(AT)
2 -0.21 -0.225 -0.2109
9.07 0.30
9.007 8160
5 0.719 0.705 0.7181 9.285 10775
10 1.339 1.3370 1.3389 9.472 12991
25 2.108 2.128 2.1093 9.703 16367
50 2.666 2.706 2.6685 9.871 19361
100 3.211 3.271 3.2148 10.034 22788
200 3.745 3.828 3.7502 10.195 26769

Flood Control and Management Manual Appendix 3
WECS - 6 -
Appendix: 3 : Design Examples 3.1 Design Example for a Spur:
Land side Ground Level to be protected from erosion= 252.00m
River deepest level Level = 245.00m
Observed HFL 250.80m
River bed level near bank 246.50m
D50 size of the river bed and bank material 5mm
silt factor f = 1.76(D50)^0.5 3.94
Existing average bankfull flow width W= 360.00m
Design dicharge Qd (50 years Return period= 5000m3/s
Average water depth below observed HFL from cross section survey data =
5.80m
Lacey Water way = 332.00m > existing bank
N = 1/25*d501/6
0.017 << as given in table
However, take N = 0.35 for natural river 0.035
Let us assume the rectangular Channel
Average Cross Section Area A = Wd 2088.0m2
Wetted perimeter P = Lacey water way 332.00m
River slope along Thalweg S=1:750 0.00133
Mean Hydraulic Radius R =A/P 6.29m
Average velocity Vm =Qd/A 2.39m/s
Determination of the actual water depth for 1 in 50 year return period design discharge be d;
Use Manning equation:
Putting Values of W, N and S, value of d with respect to V after trail shall be:
d= 5.10m
V after trail = 3.05m/s
A = 1693.20m2
Q = 5156.76m3/s
Design depth of water, da= 5.10m
Length of spur:
Take length of spur <20% of bankfull width (360m) of river; L < 72.00m

Flood Control and Management Manual Appendix 3
WECS - 7 -
Adopt effective length L= 70.00m
Local velocity of river at spur head =1.25*Vm = 3.81m/s
The purpose of the spurs is to defect the flow from on bank to another hence provide impermeable spurs
Spacing between impermeable spurs in concave bank shall be 2 to 3 times spur length
Hence, provide spacing between spur 3 times spur length; S = 210.00m
Further, the spacing shall be determined by drawing tangent from thalweg and the line parallel to tangent passing through the spur tip. Next spur shall be installed at point where the line passing through the spur tip meets the river bank.
However, the spacing shall be kept at least 210 m in concave bank; adopt, S= 200.00m
Spur Orientation
Spurs should be kept at 90 degrees to the main flow direction.
Channel bed and Channel bank Contact
The spurs shall be keyed a minimum of 2m into the channel bank to protect the spur from being flanked when flood stages overtop the spur.
The top level of the embankment along the bank shall be kept at 1.5m above design high flow level. 251.60m
Height of embankment = 6.60m
Spur Section
Top width of the spur embankment shall be kept 5 m as per requirement for placement and movement of equipments used for construction of spurs with both side slope of 2H:1V.
Top width of spur having both sides (u/s & d/s) slope of 2H:1V be 3.0m Top level of spur = ( RBL+d-1.0) one meter below HFL 249.10m
Height of spur, H = 4.10m
Slope length Ls = 4.1*sqrt(2^2 + 1)
U/s & d/s slopes width = H*(1+Z^2)^0.5 9.2m
Base width of spur embankment =2*2*H+Top width =(2*2*4.1+3)m 19.4m
(when u/s & d/s slope is provided as: 1V: 2H for spur embankment)

Flood Control and Management Manual Appendix 3
WECS - 8 -
Spur cross section drawing Design of Pitching Stones: (a) Slope pitching for spur head portion: Design velocity =
3.81m/s
The flow near the spur head is generally governed by critical flow condition, hence velocity based method shall be used to determine the weight of the pitching stones to get the realistic result. In this method weight of stone (Kg) on horizontal bed and spur slope shall be calculated by California Bank and Shore Protection equation:
Where,
for bank slope 2:1, θ = 26.57 Degrees
For pitching boulders, ǿ = 30 Degrees
K = [1-Sin2θ/Sin
2Φ ]
1/2 0.447
Density of Pitching boulders, Ss = 2.650
W = 93.16 Kg
0.400 M
This weight & size of the stones may not be readily available for dry loose pitching for spurs. Hence small boulders shall be used in gabion mattresses for slope pitching
D50 15 Cm
Porosity of gabions
0.29
Bulk density of the gabion =
1.87
Mass specific weight of the gabion box = 1871kg/m3
Residual negative velocity head h = v^2/2g 0.74m
Thickness of gabions per running meter=
t =3.81^2/[2g(1.87-1)] 0.85m
Let us provide Lg X Wg X t m gabions for U/s and d/s 1:1.5 slope (least dimensions) for spur head portion
Lg = 3.00m
Wg = 1.00m
t = 1.00m
Adopt 3 m x1 m x1 m gabions in slope
This shall be filled with 150mm median sized stones in layers. The mesh type of machine woven mattresses shall be 10cm x 12cm hexagonal machine woven. The smallest size of the stone shall not be less than 100mm.

Flood Control and Management Manual Appendix 3
WECS - 9 -
(b) Slope pitching for spur Shank Portion Design velocity = 3.05m/s W = 24.42 Kg
0.260 M
Residual negative velocity head h = v^2/2g 0.47m Thickness of gabions = 0.54m
Let us provide Lg X Wg X t m gabions for U/s and d/s 1:1.5 slope (least dimensions) for spur head portion
Lg = 3.00m Wg = 1.50m t = 0.50m Adopt 3 m x1.5 m x0.5 m gabions in slope for sank portion
(c) Design of Launching Apron: Design of Launching Apron for Nose of spur
Scour depth below water surface ds= 5.12m
Water depth da = 5.10m
Take multiplier factor (F) for Nose of the spur 2.0
Launching apron for toe protection shall be designed for scour depth of F*ds
Depth up to which apron is anticipated to launch below river bed ds' = F*ds-da
ds' = F*ds-da 5.15m
Use readily available 150mm stones in gabion boxes
Assuming that apron would launch at a slope of ZH : 1V.; Z = 1.5 Length of launched apron L =5.152*(1+1.5²)^0.50 9.28m
Let us provide the same size of the gabion as on slope pitching
Thickness of gabion after launching = 1.00m Volume required per m run of apron = L *t 9.28m3 Volume of each ( 3mx1mx1 m) box per meter run = 3.000m3/m
Number of Gabions required per meter of apron, N = 4.00
Provide single layer of gabions 4 numbers so that length dimension shall be perpendicular to flow
Total length on horizontal bed L = N * Lg 12.00m

Flood Control and Management Manual Appendix 3
WECS - 10 -
Design of Launching Apron for shank portion
Scour depth below water surface ds=
5.12m
Water Depth da = 5.10m
Take Multiplier factor F for Nose of the spur 1.5
Launching apron for toe protection shall be designed for scour depth of F*ds
Depth up to which apron is anticipated to launch below river bed ds' = F*ds-da
ds' = F*ds-da 2.58m
Use readily available 150mm stone in gabion boxes
Assuming that apron would launch at a slope of ZH : 1V.; Z = 1.5
Length of launched apron L =ds'*√(1+Z²) 4.66m
Let us provide the same size of the gabion as on slope pitching
Thickness of gabion after launching = 0.50m
Volume required per m run of apron = L *t 2.33m3/m
Volume of each ( 1.5*1*0.5m) box per meter run = 0.75m3/m
Length dimension of gabion, lg = 1.50m
Number of Gabions required per meter of apron, N = 4
Provide single layer of gabions 4 numbers so that length dimension shall be perpendicular to flow
Total length on horizontal bed L = N * Lg 6.00m

Flood Control and Management Manual Appendix 3
WECS - 11 -

Flood Control and Management Manual Appendix 3
WECS - 12 -
3.2 Design Example of A Flood Embankment River bed and bank are composed of sand and gravel,
River training problem: inundation in agricultural land
Land side Ground Level= 140.60m
River side Ground Level = 140.00m
HFL 143.00m
Observed Low Water Level LWL 141.50m
Design Discharge for 25 year Return period Qd = 2000.00m3/s
River slope along thalweg 0.0010
Bank full width Wb = 240.00m
Lacey Water way = 212.43m
Median sized bed material from site investigation
D50 5.00mm
Silt factor,
3.94
Where D50 is in mm.
Manning N = 0.017 very small for river
However, provide N = 0.035 for rivers in plain area 0.035
Mean water depth at bankful discharge d = 0.47(Q/f)^0.33 3.7m
An embankment shall be designed for flood control which is considered more cost effective than the other
options such as detention dams or flow diversion. Moreover, appropriate locations for these options are not
available immediate upstream of the problem area.
(a) Spacing of Embankment
The embankment has to be provided to encounter the inundation problem adjacent of existing riverbank. The
existing width of the river is greater than the Lacey water way. Therefore, it is provided along the existing river
bank so that the width in no case shall be smaller than the three times Lacey water way.
Hence adopt distance between embankment W = 3 times Lc 720.00m
Say, W = 720.00m

Flood Control and Management Manual Appendix 3
WECS - 13 -
(b) Embankment section
Top width of the embankment shall have been kept minimum of 5.00m in view for future development as
a public road. The turning platforms 6m wide and 20m long with 3m wide ramp of side slope 1:3 and
grade of 15% shall be provided towards the land side of the embankment in every kilometer. Both side
slope of the embankment shall be 2H:1V up to a height of less than 4.5m. A free board of 1.50 m has
been maintained in the entire length of the proposed embankment.
The longitudinal slopes of embankments shall be kept parallel to the water profile and both end of the
embankment shall be tied to the high ground.
The provision for right of way shall be 1.5 meters additional width beyond the toe of the embankments on
the river side and width of 3 meters beyond the toe of embankment on the land side for plantation.
(c) Check for seepage through the proposed section:
Draw a seepage line from HFL toward landside with slope of 1:6 for gravel mixed sandy
soil of the construction material. It is seen that:
Distance required to cut the ground line from upstream face Ls = 20.4 m
Actual distance provided at base of embankment Lb = 21.8 m
Hence, seepage line is well within cover of 0.60m. Hence, the proposed section is safe
against seepage pressure.
(d) Protection Works
Protection works in embankment have been provided at different places. In some areas,
geo-membrane up to a height of 2.00m has been provided to stop sheet flow / seepage
from countryside or river side. Clay soil layer of thickness 0.5m on face of river side slope
shall be provided to reduce the seepage.
(e) Check for shear stress and Critical Velocity of the river for bed & Bank
Average depth of river at design flood, da = 3.7m
Width of river B = 720.00m
Area of flow A = B * da 2644.97m2
The channel is considered as rectangular Channel in preliminary
calculation
Average Velocity Va = Q/A =
0.76m/s
Allowable velocity (Vc) for fine gravel =
1.83m/s Table II A-7
Hence, safe from critical velocity consideration as 0.76m/s < 1.83m/s fine gravel

Flood Control and Management Manual Appendix 3
WECS - 14 -
HFL 143.00 Seepage line (1V:6H)
Existing River
Bed140.00m
BTL 144.50
GL 140.60
3.90m
0.60m
3.00m
1.50m
Embankment Section
20.67m
21.81m
Land side2H:1V
2H:1V
9.00m 5.00m 7.81m

Flood Control and Management Manual Appendix 3
WECS - 15 -
3.3 Design example of Revetments along the Existing River Bank of a River
River type: Meandering
River bed and bank are composed of sand and gravel,
River training problem:
Erosion and inundation
Land side Ground Level= 142.50m
River side Ground Level = 140.00m
HFL 143.00m
Observed Low Water Level LWL 141.50m
Design Discharge for 25 year Return period Qd = 2000.00m3/s
River slope along thalweg 0.0010
Bankfull width Wb = 240.00m
Lacey Water way =
212.43m
Median sized bed material from site investigation
D50 15.00mm
Silt factor,
6.82
Where D50 is in mm.
Manning N = 0.020
very small for river
However, provide N = 0.035 for rivers in plain area 0.035
Mean water depth at bankful discharge d = 0.47(Q/f)^0.33 3.1m
An embankment shall be designed to check the inundation problem along the existing bank.
(a) Embankment section
Top width of the embankment shall have been kept minimum of 5.00m in view for future development as a public road. Both side slope of the embankment shall be 2H:1V up to a height of less than 4.5m.
A free board of 1.50 m has been maintained in the entire length of the proposed embankment.
(b) Check for seepage through the proposed section:
Draw a seepage line from HFL toward landside with slope of 1:6 for gravel mixed sandy soil of the construction material. It is seen that:
Distance required to cut the groundline from upstream face Ls = 9.0 M
Actual distance provided at base of embankment Lb = 18.0 M
Hence, seepage line is well within cover of 0.60m. Hence, the proposed section is safe against seepage pressure.
(c) Check for shear stress and Criticle Velocity of the river for bed & Bank
Average depth of river at design flood, da =
3.1m
Width of river B =
240.00m
Area of flow A = B * da
735.49m2

Flood Control and Management Manual Appendix 3
WECS - 16 -
The channel is considered as rectangular Channel in preliminary calculation
Average Velocity Va = Q/A =
2.72m/s
Allowable velocity Vc =
1.83m/s
Table II A-7
2.72m/s > 1.83m/s
fine gravel
Hence, the River side slope should be protected with pitching stone:
(d) Checking of stable channel with respect to critical shear stress
i. Compute Shield's Critical stresss:
γS = 26500N/m3
γ = 9850N/m3
D50 =
15.00mm
Assume kinematic viscosity of water, n (m2/s)
1.000000E-06
β = (1/ν √(γ s- γ )/γ *gD3)^-0.6
0.0047
Shield coefficient
τ* = 0.22 β + 0.06X 10^-7.7β
0.056
Critical shield shear stress on bed material τc = τ*(γ s- γ )D50
14.04N/m2
Z =
2
in degrees (See table 5.18 for sandy gravel river bed materials)
35.0
0.63
Criticle shear stress on sides
8.79N/m2
a. The applied shear stress acting on the grains in an infinitely wide channel is then calculated from equation
t∞ = dS =
30.19N/m2
b. Actual stress on channel bed, τb
From Figure I appendix 7 b/d vs t∞/tb:
At b/d =
78.32
Z =
2
t∞/tb =
0.89
tb =t∞*0.89
26.87N/m2
c. Actual stress on channel side, τs
From Figure II Appendix 7 b/d vs t∞/ts:
At b/d = Z =2 78.32

Flood Control and Management Manual Appendix 3
WECS - 17 -
ts/t ∞=
0.76
ts =t ∞*0.76
22.94N/m2
Shear stress on channel side is greater than allowable stress on channel side. Hence, the river bank should be protected with boulder pitching
Design of Revetment/ Pitching
Fraude No
Where, V = Mean velocity and L = Characteristic length of the flow and can be taken as hydraulic radius of Flow.
Area of flow = Bd + Zd
2
754.27m2
wetted perimeter P = B + 2*d. sqrt(1+z
2)
253.70m
L = R = A/P =
2.97m
Fr =
0.50
Flow is subcritical; hence use tractive force design relation
Satbility factor, SF for gradually varying flow; Moderate bend curvature (curve radius more than 30m /channel width is more than 10m); Impact from waves, ice or floating debris moderate. 1.5
Correction factor for stability
1.40
Take specific gravity of stone 2.65
= Correction factor for rock specific gravity (Csg)
1.00
For pitching boulders, ǿ =
33 degree
0.57
D50=
0.22m
Weight of median size stones can be calculated as:
W = (D/0.124)^3*Ss
14.60kg
Hence, use 25mm median sized stone for pitching river side slope of the embankment.
Thickness of the pitching, t= v^2/2g(Ss-1)
0.29m
Hence, provide 30cm thick pitching using at least 25cm D50 stones

Flood Control and Management Manual Appendix 3
WECS - 18 -
Design of Toe protection
Scour depth below water surface ds= 0.473*(Q/f)^(1/3) 3.14m
Water Depth da =
3.1m
Take Multiplier factor F for scour depth in gentle bend of river bank 1.5
Launching apron for toe protection shall be designed for scour depth of F*ds
Depth up to which apron is anticipated to launch below river bed ds' = F*ds-da
ds' = F*ds-da
1.65m
Size of loose stone D50 =
0.22m
Weight of mean stone size=
14.60kg
These stones can be handled easily for loose dumping apron.
Assuming that apron would launch at a slope of ZH : 1V.; Z =
2
Length of launched apron L =ds'*√(1+Z²)
3.69m
Thickness of 250 mm (D50 ) boulders in slope to withstand the residual negative head of water
T = V^2/(2g*(Ss-1)
0.24m
The minimum thickness shall be greater of T or 0.3m or two layers of D50 stone.
Hence provide two layers of 250mm stones resulting in 0.50m thick launched apron.
Quantity of stone required per meter run of apron Ql= T*Ls= 1.84m3/m
Length of launching horizontal bed with 2 layers of D50 stones 3.70m
Height of launching apron H = 0.50m
Provide 5m long 0.50m thick apron on horizontal floor
Fig: Section of embankment with revetment

Flood Control and Management Manual Appendix 3
WECS - 19 -
3.4 Design example of a Stable New River Diversion Channel for Flood Control using Critical Shear Stress Method Design a channel to carry 41.5 m3/s of clear water through 3mm gravel on a slope of 0.0001. The canal is to be trapezoidal in shape having side slope of 2H:1V.
D50 = mean diameter of bed material (mm)
3
0.015
Bed slope 0.0001 1. Compute Shield's Critical stress:
= 26500 KN/m3
9850 KN/m3 Assume kinematic viscosity of water, v (m2/s)
0.000001 β = (1/ν √(γ s- γ )/γ *gD3)^-0.6 0.020 Shield coefficient
τ* = 0.22 β + 0.06X 10^-7.7β 0.046 Critical shield shear stress τc = τ*(γ s- γ )D50 2.293 Stress in bed τbl = 0.90tc (N/m2) 2.064 z = cotθ 2
31.3 degrees
0.509
Shear stress on sides
1.050 N/m2
Calculation of channel size is made in tabular form 1 2 3 4 5 6 7 8 9
B/h ts/t ∞ tb/t ∞ H B A R U Q
7.00 0.78 0.99 1.37 9.57 16.82 0.91 0.62 10.38
34.00 0.78 0.99 1.37 46.48 67.27 0.03 0.62 41.53
Column 2
The maximum applied shear stress acting on the grains in an infinitely wide channel is calculated from equation
t∞ = g h S
Actual stress on channel side, τs
From Figure B/h vs t∞/ts (figure II, Appendix 7): At B/h =
7, and z =2 ts/t ∞= 0.78
column 3: From Figure B/h vs t∞/tb (figure I,
Appendix 7): At B/h =
7, and z =2 tb/t ∞= 0.985
Column 4
Taking tsl = ts h = 1.367m
=
Taking tbl = tb h = 2.127m
Consider smaller value of h
= 1.367m Calculate U using Manning Equation and Q by continuity equation of trapezoidal channel.

Flood Control and Management Manual Appendix 3
WECS - 20 -
3.5 Design a Flood Wall on River Front of Boulder Stage Rivers with Flowing Data
Design Constants High Flood Level (HFL) of U/s end of the river reach
614.00m
River Bed Level (RBL)
609.50m Existing Bank top level
613.50m
Free Board (Fr)
1.50m Depth of foundation below river bed
1.25m
Height of the wall above river bed (H' = HFL+Fr-RBL)
6.00m Height of wall above Base (H)
= 7.25m
Wall top level
615.50m Minimum Water Level at river side
609.50m
Wall height above river bed > 6m, hence Counter Fort Wall shall be the economical alternative in boulder bed rivers
A. Proportioning of Wall Components: Assume thickness of Vertical wall
= 0.25m Thickness of toe slab=(1/10 to1/14)H from 600mm to 429mm 0.50m Thickness of heel slab, Th
= 0.50m
Width of base slab=b = (0.6 to 0.7) H from 4.35m to 5.075m 5.00m
Toe projection= bt= (1/3 to ¼)b from 1.65m to 1.25m = 1.30m
Heel Projection, bh
= 3.45m Height of wall above base slab (h)
= 6.75m
Width of counterfort
0.40m Height of counterfort h
6.75-1.0-0.5 m = 5.25m
Clear spacing between counterforts (L) =3.5(H/γ)0.25
= 2.74m 3.00m
or 1/2H to 1/3rd H From 3.625m to2.42m
Provide Counterfort at
m c/c 3.00m Clear spacing between counterforts (L)
2.60m
Height of Wet soil h1
= 0.00m Height of saturated soil h2
= 6.00m
Height of saturated soil above footing h2'
= 5.50m Height of water behind the wall h3 (assuming WT at river bed) 1.25m Height of water above footing behind wallh3' in river side
0.75m
Height of water above base h5 in river side
2.25m Height of water above footing wall h5' in river side
1.75m
Depth of submerged soil in river bed, h6
1.25m Depth of submerged soil in river bed above footing, h'6
0.75m
7.25m
6.00m
1.25m

Flood Control and Management Manual Appendix 3
WECS - 21 -
Design Parameters Surcharge : Equivalent to 0.3m of sturated soil S = 0.3x20 = 6.00 KN/M2
Unit weight of wet Earth (γwet)
= 18.00 KN/M3
Unit weight of saturated Earth (γsat)
= 20.00 KN/M3
Unit weight of submerged Earth (γsub)
= 10.00 KN/M3
Unit weight of water(γw)
= 10.00 KN/M3
Angle of Repose (υ)
= 30.00 Degree
Coefficient of Active Pressure (Ka) =(1-Sinυ)/(1+Sinυ) = 0.33
Coefficient of Passive Pressure (Ka)
=(1+Sinυ)/(1-Sinυ) = 3.00
Coefficient of Friction (μ)
=tanυ = 0.58 Safe bearing capacity of soil (p)
= 300.00 KN/m2
Characteristic strength of steel Fe 500
= 500.00 N/mm2
Tensile strength of concrete (fe 500) σst=0.55fy = 275.00 N/mm2
Density of Concrete(γc)
= 25.00 KN/m3
Characteristic strength of concrete (M20) fck = 20.00 N/mm2
Bond stress of M20
=1.6*1.2
1.92 N/mm2
Development Length (Ld) 500x υ/(1.92x 4) = = 36 υ
B) Check stability of the wall
S.No. Description of Loads Load in KN per m run
Lever arm (m)
Moment about Toe in kN-m
1 Self Weight
Wt of stem, W1=25x0.25x1x6.75 42.19 1.425 60.12
Wt of base slab, W2=25x5x1x0.5 62.50 2.5 156.25
2 Wt of earth over heel slab, W3=
Wet Soil, Wwet = γwet. h1.bh 0.00 3.275 0.00
Saturated Soil, Wsat = γsat. h2'.bh 379.50 3.275 1242.86
Submerged soil behind the wall, Ww = γsub. h3'.bh 25.88 3.275 84.74
Water behind wall , Ww' = γsub. h3'.bh 25.88 3.275 84.74
3 Uplift =1/2(10*(2.25+1.25)*5 -62.5 2.5 -156.25
4 Minimum Water in River side , Ww = γw. H5'.bt 29.25 0.65 19.01
5 Submerged soil in River side above footing, Ww = γw. h6'.bt 9.75 0.65 6.34
Total 512.44 1497.81

Flood Control and Management Manual Appendix 3
WECS - 22 -
S.No. Description of Loads Load in KN
Lever arm (m)
Moment about T in kN-m
1 Surcharge = ka*S*H 14.36 3.63 52.04 2 Wet Soil at top (for h1) 3 Saturated soil (for h2) Triangular Part 118.80 3.25 386.10 Rectangular Part 49.50 0.625 30.94 3 Submerged soil (for h3) Triangular Part 2.58 0.42 1.07 4 Water pressure behind wall 25.31 0.75 18.98 Water pressure in river -25.31 0.75 -18.98
5 Submerged soil in river(for h4') P=1/kp*h4^2 -23.44 0.42 -9.77
Total 161.80 460.38 Restoring Moment, ∑M
= = 1497.81 kN
Overturning moment (Mo)
= 460.38 kN-m FoS against overturning; FM =∑M/Mo = 3.25 >1.55 Safe
Check for Sliding
Total horizontal force tending to slide the wall =Ph = 161.80 kN Resisting force
=∑μ.W = 297.21 kN
FoS against sliding
=∑μ.W/Ph = 1.84 >1.55 Safe
Check for Pressure distribution at Base Net moment (M)
=∑M-Mo = 1037.43 kN-m
Let x be the distance from toe where the resultant R acts (x) =M/∑W = 2.02 m
Eccentricity (e)
=b/2-x = 0.48 <b/6=(0.83)
Therefore whole base is under compression
Maximum pressure at toe (PA) =∑W/b(1+6e/b) = 160.97 kN/m2
< 300kN/m2 safe
Minimum pressure at toe (PD) =∑W/b(1-6e/b) = 44.01 kN/m2
Pressure Intensity at junction of stem with toe (PB) = 130.56 kN/m
2
Pressure Intensity at junction of stem with heel (PC) = 124.71 kN/m2
Sno. Load in KN
Lever
arm (m)
1 Surcharge ka*S*H 14.36 3.63
2 Wet Soil at top (for h1)
3 Saturated soil (for h2)
Traingular Part 118.80 3.25
Rectangular Part 49.50 0.625
3 Submerged soil (for h3)
Traingular Part 2.58 0.42
4 Water pressure behind wall 25.31 0.75
Water pressure in river -25.31 0.75
5 Submerged soil in river(for h4') P=1/kp*h4 2̂-23.44 0.42
161.80
Restoring Moment, ?M = = 1497.81 kN
Overturning moment (Mo) = 460.38 kN-m
FoS against overturning; FM =?M/Mo = 3.25 >1.55 Safe
Check for Sliding
Total horizontal force tending to slide the wall=Ph = 161.80 kN
Resisting force =?μ.W = 297.21 kN
FoS against sliding =?μ.W/P h = 1.84 >1.55 Safe
Check for Pressure distribution at Base
Net moment (M) =?M-Mo = 1037.43 kN-m
Eccentricity (e) =b/2-x = 0.48 <b/6=(0.83)
Therefore whole base is under compression
Maximum pressure at toe (PA) =?W/b(1+6e/b)= 160.97 kN/m2
<
300kN/m2
safe
Minimum pressure at toe (PD) =?W/b(1-6e/b)= 44.01 kN/m2
Pressure Intensity at junction of stem with toe (PB)
Pressure Intensity at junction of stem with heel (PC)= 124.71 kN/m2
0.25m 14.36
h2
7.25m 49.50
h3
118.80
-23.4 2.58
Total 460.38
Let x be the distance from toe where
the resultant R acts (x)
52.04
=M/?W
386.10
= 130.56 kN/m2
30.94
1.07
18.98
-18.98
= 2.02 m
-9.77
Description of Loads Moment about T in kN-m
160.97 kN/m2
13
0.5
6 k
N/m
2
12
4.7
1 k
N/m
2
44.01 kN/m2
M,lim/bd2 = for Fe 415 &M20 2.66 N/mm2

Flood Control and Management Manual Appendix 3
WECS - 23 -
A) Design of Toe Slab Consider a strip, 1m wide, near the outer edge D
The upward pressure intensity rectangular
130.56* 1.3 ` 169.730 kN/m
Triangular portion 1/2*(160.97-130.56)* 1.3
39.530 kN/m Downward toe slab 1.3*25*0.5
16.250 kN/m
foundation soil 1.3*10*0.75
9.750 kN/m Water
1.3*10*2.25
29.250 kN/m
Uplift at junction 1.3*10*1.51
19.630 Net upward pressure Pu =
173.640 kN/m
Therefore, Maximum negative bending moment (M1) in heel slab, at counterforts is
Mu=1.5*((169.73-16.25-9.75-29.25)*1.3/2 + 2/3*39.53*1.3+(48.88)/2*1.3/2) 186.836 KN-m Use 16 mm dia bars with cover 75 mm
Effective depth d =
417.000 mm
1.074 <2.66 URS
pt =
0.264
%< Ast max(0.96%)
Mu/bd2
1.070 Ok
Ast required =
1100.880 mm2 spacing of 16 mm dia
182.637 mm
provide 16 mm dia @ 180.000
mm c/c at bottom face of the toe, pt
= 0.268 % ok
Critical shear stress tc
=
=0.8 fck/6.89pt
8.669
0.370 N/mm2
Shear Force V
V=1.5*Pu/2 = 130.230 kN
τv=V/bd = 0.31 N/mm
2 OK
Distribution steel 0.12 % of gross area
= 600.00 mm2
Provide 12
mm dia @ 180 mm c/c
Area of steel provided
= 628.319 mm2
Top Bars
Provide 12 mm dia @ 180 mm c/c
Distribution steel
Provide 12 mm dia @ 180 mm c/c
B) Design of heel slab Clear spacing between counterforts, lc
2.6
Consider a strip, 1m wide, near the outer edge D The downward Weight:
Soils
=(0.75x10+5.5x20+0.75x10)x1
125 KN/m
Self weight of heel =25x0.5x 1
12.5 KN/m
Uplift at D 10*0.75
7.5 KN/m
Upward soil pressure 44.01kN/m2 x 1m =
44.01 KN/m Net down force at D= =125+12.5-44.01-7.5
85.99 KN/m

Flood Control and Management Manual Appendix 3
WECS - 24 -
Therefore, maximum negative bending moment in heel slab, at counterforts is
M1=1.5* pl
2/12 = 72.662 KN-m
Maximum positive bending moment in heel slab, at centre of span
M2= 1.5*pl
2/16
54.496 KN-m
Use 16
mm dia bars with cover 75 mm
Effective depth d =
417.000 mm Mu/bd
2
0.418 <2.66 URS
at pt = 0.1
%< Ast max(0.96%)
Mu/bd
2 0.420 Ok
Ast =
Ast required = = 417.000 mm2 spacing of 16 mm dia
482.163 mm
provide (for shear consideration)
16 mm dia @ 140 mm c/c at bottom face of the heel, pt =
0.344 % ok as >Ast max(0.12%)
Critical shear stress tc
=
=0.8 fck/6.89pt
6.743
0.411 N/mm2
Shear Force V
V=1.5*85.99*1.3 = 167.681 kN
τv=V/bd = 0.40 N/mm
2 OK
Distribution steel
=0.12 % of gross area = 600.00 mm2
Provide 12 mm dia @ 180 mm c/c Area of steel provided
= 628.319 mm
2
Top Bars Max positive bending moment at centre of the span
54.50
Mu/bd2
0.313 <2.66 URS
at pt = 0.073
%< Ast max(0.96%)
Mu/bd
2 0.310 Ok
Ast =
Ast required = = 600.000 mm2 spacing of 12 mm dia
188.496 mm
Provide 12 mm dia @ 180 mm c/c Distribution steel
Provide 12 mm dia @ 180 mm c/c
= 600.00 mm
2
C) Design of Stem The pressure intensity at bottom of stem p
30.755 kN/m2
0.33*6+0.33*18*0+0.33*20*5.5+0.33*10*0.75+10*0.75-10*1.75

Flood Control and Management Manual Appendix 3
WECS - 25 -
Therefore, maximum negative bending moment (M1) in heel slab, at counterforts is
M1=1.5 pl
2/12 25.988 KN-m
[25.988*10^6/(2.66* 1000)]^0.5 98.843 mm
Available effective depth d - ef cov - dia of main bar/2 167.000 Ok Mu/bd
2
0.932 <2.66 URS
at pt =
0.228
%< Ast max(0.96%)
Mu/bd
2
0.930 Ok
Ast =
Ast required = 380.760 mm2 spacing of 12 mm dia
297.031 mm
provide (for shear consideration) 12 mm dia @ 250
mm c/c at outer face of stem, pt = 0.271 % ok
Critical shear stress tc
=0.8 fck/6.89pt
8.572
0.372 N/mm2
Shear Force V V=1.5*30.755*1.3
59.972 kN
τv=V/bd
0.36 N/mm
2 OK
Distribution steel
=0.12 % of gross area 300.00 mm2
Provide 12 mm dia @ 300 mm c/c Area of steel provided
376.991 mm
2 ok
Side Bars Provide 12 mm dia @ 300 mm c/c
Distribution steel Provide 12 mm dia @ 300 mm c/c
D) Design of Counterfort Width of Counterfort
0.40 C/C Counterfort Sapcing (l)
3.00
Lateral force acting at base of the counterfort P =
602.23 Moment at base: PL Mu=
2445.59 kN-m
The effective depth available
Tan θ = 1.52
θ = 56.69 degree
d = 2797 mm
The counterfort acts as T beam of width 400.00 mm
[2445.59*10^6/(2.66*400)]^0.5
1516.076 mm <2797mm,ok

Flood Control and Management Manual Appendix 3
WECS - 26 -
Side Bars
Provide 12 mm dia @ 300 mm c/c
Distribution steel
Provide 12 mm dia @ 300 mm c/c
D) Design of Counterfort =
Width of Counterfort = 0.40
C/C Counterfort Sapcing (l) = 3.00
Lateral force acting at base of the counterfort P = 602.23
Moment at base: PL Mu= = 2445.59 kN-m
5.25
d=2797 mm
3.45 θ
The effective depth available
Tan θ = 1.52
θ = 56.69 degree
d = 2797 mm
The counterfort acts as T beam of width 400.00 mm
[2445.59*10 6̂/(2.66*400)] 0̂.51516.076 mm <2797mm,ok
Mu/bd2 0.782 <2.66 URS
at pt = 0.187 %< Ast max(0.96%)
Mu/bd2 0.780 Ok
Ast = Ast required == 2092.156 mm2
As, min = 0.87bd/fy 1946.712
provide 20 mm dia 7 Nrs
Provide # in two layers+
Pt = 0.363 %
Curtail half of the bars in height H 1̂/2-ld from top
6.75 0̂.5-36 φ 1.88m
=√( _ /( , ∗ ))
/( ^2 )=0.87 ( /100)(1−1.005 / ( /100))
Mu/bd2
0.782 <2.66 URS
at pt = 0.187 %< Ast max(0.96%)
Mu/bd
2 0.780 Ok
Ast =
Ast required = = 2092.156 mm2
As, min =
0.87bd/fy
1946.712 provide 20 mm dia
7 Nrs
Provide #
in two layers+ Pt =
0.363 %
Curtail half of the bars in height H^1/2-ld from top
6.75^0.5-36 υ 1.88m
Vertical Stirrups Maximum pressure at end of heel slab =
85.990 kN/m
Total downward force at D=
85.99*3
257.970 kN Vertical stirups Ast =
1.5*257.97*1000/0.87fy 889.552 mm2
Using # 8 mm 2-legged stirrups , Ast = 100.53096 spacing = 1000 x 100/888 = 110 mm c/c. 112.41617 Provide # 8 mm 2-legged stirrups at 110 mm c/c.
Increase the spacing of vertical stirrups from 110 mm c/c to 450 mm c/c towards the end C
Horizontal ties The direct pull by the wall on counterfort for 1 m height at base
= kaγh x c/c distance
92.265 kN/m
Area of steel required to resist the direct pull
=1.5*140.4*103/(0.87*415)
318.15517 mm2
Using # 8 mm 2-legged stirrups, Ast = 100 mm2
spacing =
315.98092 mm
Provide 8 mm at
300 mc/c
Since the horizontal pressure decreases with h, the spacing of stirrups can be increased from 300 mm c/c to 450 mm c/c towards the top.

Flood Control and Management Manual Appendix 3
WECS - 27 -

Flood Control and Management Manual Appendix 3
WECS - 28 -
3.6 Design Example of Concrete Block
River type: Straight reach River bed and bank are composed of sand and gravel,
River training problem: River Bank Erosion of valuable land
Design Discharge for 50 year Return period Qd = 10000m3/s River slope along thalweg 0.0020 Bed width of channel, Wb = 350.00m
Lacey Water way =
475.00m Median sized bed material from site investigation
D50 5.00mm
Silt factor,
3.94 Where D50 is in mm.
Manning N = 0.017
very small for river
Take, N = 0.03 for straight rivers in plain area 0.030 Cross section of river at high flood flow level 1800m2 Approximate average velocity of flow V = Q/A = 5.56m/s The channel is trapezoidal with 2:1 bank slope
Using Manning equation to get the average depth of flow at design discharge:
Putting Values of W, N and S, value of d with respect to V after trail shall be: d= 5.90m A = 2134.62m P= 376.39m R = 5.67m V after trail = 4.74m/s Q = 10125.67m3/s Mean water depth at bank full discharge d 5.9m And average velocity, V = 4.74m/s
As the velocity of the river reach is higher than 3m/s, which is generally applicable for boulder pitching. The larger sized boulders are not readily available and are not economically supplied. Hence, the concrete block pitching is considered as economical revetment material for such a situation.
Design of Revetment/ Pitching
Weight of the armour is given by:

Flood Control and Management Manual Appendix 3
WECS - 29 -
for bank slope 2:1, θ =
26.57 Degree
Taking, Φ = 3/4 of Φ of sublayer well compacted sand ( 40 degrees) 30 Degree
K = [1-Sin2θ/Sin
2Φ ]
1/2
0.450
W=0.0232*2.4*4.74^6/(0.45(2.4-1))^3
511.41 Kg
Minimum volume of RCC blocks = W/(2.4*1000 )
0.213 m3
Thickness of concrete block pitching determined by Pilarckyz equation is less than 30 cm
Let us provide thickness t =
0.3 M
Surface area required =
0.71 m2
Hence provide 1 layer of 1.0mx0.80mX0.30m cubical concrete blocks butting each other with cement mortar on bank slope.
Weight of blocks provided W =
576 Kg
Free board for pitching Fr =
1 M
Total depth above average river bed level = 5.9+1 6.90 M
Sloping length for pitching = 6.9*(1+2^2)^0.5 15.43 M
Hence provide 1m x 0.80m x 0,30m cubical blocks 20 Numbers in slope for vertical extent of pitching so that length dimension shall be along the river flow and width dimension shall be along the bank slope resulting slope length Ls = 16.00 M
Design of Toe protection (Launching)
Scour depth below water surface ds= 0.473(Q/f)^1/3
6.45m
Water Depth da =
5.90m
Take Multiplier factor F for scour depth in straight
1.5
Launching apron for toe protection shall be designed for scour depth of F*ds
Depth up to which apron is anticipated to launch below river bed ds' = F*ds-da
ds' = F*ds-da
3.78m Size of loose blocks
Assuming that apron would launch at a slope of ZH : 1V.; Z = 2 Length of launched apron L =ds'*√(1+Z²) 3.78*(1+2*^2)^0.5 8.45m Minimum volume of blocks V for same thickness of revetment on scour hole slope / m
length of bank= 2.54m3/m The minimum thickness of launching apron (use same size of the blocks as in bank
slope) 0.30m
Hence provide eleven rows of 1m x0.80mx0.30m concrete blocks so that length dimension shall be across flow direction.
Length of launching apron on horizontal floor Lh =
8.80m
Volume of block provided V =
2.64m3/m Ok
Thickness of Concrete block revetment using Pilarczyk Equation:
Design Data:
Design Discharge 10000 m3/s
Average Velocity (Vm) 4.74 m/s

Flood Control and Management Manual Appendix 3
WECS - 30 -
depth of flow (h) = 5.9 M
For Bank slope (2H:1V ) , angle α for loose revetment 26.57 Degrees
Taking, Φ = 3/4 of Φ of sub layer well compacted (for sand it is 40 degrees) 30.00 Degrees
River slope β 0.11 Degrees
Size of the pitching stone (Dn) using Pilarczyk Equation is:
Values of different parameters and size of the revetment (concrete block) are:
Parameters: Continuous layer Edges and transitions
stability parameter for continue top layer, Φsc 0.5 0.75
Δm =ρs /ρw– 1 1.4 1.4
Turbulence factor for increased turbulence, kt 1.5 1.5
shield parameter, Ψcr 0.05 0.05
Depth parameter for developed velocity profile, kd = (1 – (sin² α /sin²Φ))0.5
kd = (1 – (sin² α /sin²Φ))
0.5 0.45 0.45
kl = sin(Φ - β)/(sinΦ); 1.00 1.00
ksl = Kd. Kl 0.45 0.45
ksl = Cosα for anchored mattresses and interconnected blocks (cabled) 0.89 0.89
Depth parameter for developed velocity profile, Kh kh = 2 / (log
2 (1 + 12h / ks )) 0.20 0.20
Take ks = 0.05 for smooth blocks
For Anchored blocks, Dn = t 0.10m 0.15m
For loose blocks, Dn = t 0.19m 0.29m

Flood Control and Management Manual Appendix 4
WECS - 31 -
APPENDIX: 4 : BENEFIT CALCULATION (DAMAGE ASSESSMENT)
Table: 1 Estimated Flood Damage
Left Bank land elevation = 6.9 m
Right Bank land elevation = 6.97 m
Return
Period
(Yrs)
Discharge
(m3/s)
Water
Surface
Elevation
(m)
water
Depth in
LB land
(m)
water
Depth in
RB land
(m)
2 201 6.83 0 0
5 281 7.63 0.73 0.66
10 323 8.01 1.11 1.04
25 380 8.49 1.59 1.52
50 413 8.78 1.88 1.81
100 459 9.16 2.26 2.19

Flood Control and Management Manual Appendix 4
WECS - 32 -
Table: 2 Estimated Flood Damage
LB h<5 LB 5<=h<6 LB 6<=h<7 LB 7<=h<8 LB 8<=h<9 LB 9<=h<10 LB 10<=h<20 RB h<5 RB 5<=h<6 RB 6<=h<7 RB 7<=h<8RB 8<=h<9RB 9<=h<10 RB 10<=h<20
2 90 126 75 54 29 43 34 0 2 0 0 0 0 2
5 90 126 75 54 29 43 34 0 2 0 0 0 0 2
10 90 126 75 54 29 43 34 0 2 0 0 0 0 2
25 90 126 75 54 29 43 34 0 2 0 0 0 0 2
50 90 126 75 54 29 43 34 0 2 0 0 0 0 2
100 90 126 75 54 29 43 34 0 2 0 0 0 0 2
Table: 3 Estimated Flood Damage
If inundated : 1, if not inundated : 0
LB h<5 LB 5<=h<6 LB 6<=h<7 LB 7<=h<8 LB 8<=h<9 LB 9<=h<10 LB 10<=h<20 RB h<5 RB 5<=h<6 RB 6<=h<7 RB 7<=h<8RB 8<=h<9RB 9<=h<10 RB 10<=h<20
2 0 0 0 0 0 0 0 0 0 0 0 0 0 0
5 1 1 1 1 0 0 0 1 1 1 1 0 0 0
10 1 1 1 1 1 0 0 1 1 1 1 1 0 0
25 1 1 1 1 1 0 0 1 1 1 1 1 0 0
50 1 1 1 1 1 0 0 1 1 1 1 1 0 0
100 1 1 1 1 1 1 0 1 1 1 1 1 1 0
Return
Period
Number of Houses by Ground Elevation
Return
Period
(Yrs)
Inundated or Not Inundated

Flood Control and Management Manual Appendix 4
WECS - 33 -
Table: 4 Estimated Flood Damage
LB h<5 LB 5<=h<6 LB 6<=h<7 LB 7<=h<8 LB 8<=h<9 LB 9<=h<10 LB 10<=h<20 RB h<5 RB 5<=h<6 RB 6<=h<7 RB 7<=h<8RB 8<=h<9RB 9<=h<10 RB 10<=h<20
2 0 0 0 0 0 0 0 0 0 0 0 0 0 0
5 90 126 75 54 0 0 0 0 2 0 0 0 0 0
10 90 126 75 54 29 0 0 0 2 0 0 0 0 0
25 90 126 75 54 29 0 0 0 2 0 0 0 0 0
50 90 126 75 54 29 0 0 0 2 0 0 0 0 0
100 90 126 75 54 29 43 0 0 2 0 0 0 0 0
Return
Period
(Yrs)
Number of Inundated houses
Table: 5 Estimated Flood Damage
Average
Assess
Value
0.1<=h
<0.3
0.3<=h
<0.6
0.6<=h
<1.0 1<=h
0.1<=h
<0.3
0.3<=h
<0.6
0.6<=h
<1.0 1<=h NRs/unit
0.1<=h
<0.3
0.3<=h
<0.6
0.6<=h
<1.0 1<=h
0.1<=h
<0.3
0.3<=h
<0.6
0.6<=h<
1.0 1<=h
0.1<=h
<0.3
0.3<=h
<0.6
0.6<=h<
1.0 1<=h
2 0 0 0 0 0 0 0 0 500000 0.025 0.03 0.035 0.040 0 0 0 0 0 0 0 0 0
5 0 0 345 0 0 0 2 0 500000 0.025 0.03 0.035 0.040 0 0 6037500 0 0 0 35000 0 6072500
10 0 0 0 374 0 0 0 2 500000 0.025 0.03 0.035 0.040 0 0 0 7480000 0 0 0 40000 7520000
25 0 0 0 374 0 0 0 2 500000 0.025 0.03 0.035 0.040 0 0 0 7480000 0 0 0 40000 7520000
50 0 0 0 374 0 0 0 2 500000 0.025 0.03 0.035 0.040 0 0 0 7480000 0 0 0 40000 7520000
100 0 0 0 417 0 0 0 2 500000 0.025 0.03 0.035 0.040 0 0 0 8340000 0 0 0 40000 8380000
Damage by Inundation Depth
(RB)Total
Damage
(NRs)
Return
Period
(Yrs)
Number of houses by
water depth in LB
Number of houses by
water depth in RB
Damage ratio by Inundation
DepthDamage by Inundation Depth (LB)

Flood Control and Management Manual Appendix 4
WECS - 34 -
Table: 6 Annual Damage Reduction
Without
project
With
project
Reduction
of Damage
201 2 0.5 0 0 0 0 0
281 5 0.2 6072500 0 6072500 3036250 0.3 910875 910875
323 10 0.1 7520000 0 7520000 6796250 0.1 679625 1590500
380 25 0.04 7520000 0 7520000 7520000 0.06 451200 2041700
413 50 0.02 7520000 0 7520000 7520000 0.02 150400 2192100
459 100 0.01 8380000 0 8380000 7950000 0.01 79500 2271600
Annual Damage Reduction (Benefit per year) for 50 year Return Period = NRs 2.19 Million
Source: Technical Standards and Guidelines for Planning of Flood Control Structures, June 2010
Department of Public Works and Highways
Discharge
(m3/s)
Average
Damage
Reduction
of interval
(NRs)
Probablity
of Interval
Annual
Damage
reduction
(NRs)
Accumulation
of Annual
Damage
Reduction
(NRs)
Return
Period
(Yrs)
Probability
(p)
Amount of Damage (NRs)

Flood Control and Management Manual Appendix -5
WECS - 1 -
Appendix: 5 : Economic Evaluation Example 1: Calculate the NPW, B/C and EIRR of a river training project (500m embankment with revetment construction) in Terai with the following details: Construction cost - NRs 50 million O & M cost - 3% of capital cost Construction period - 3 years Net incremental benefit/year - NRs 12.5 million The evaluation problem illustrated above in Example-1 can be solved by following three methods:
Spreadsheet Program Method
Graphical Method
Similar Triangles Method (From graph of NPV [immediate +ve and –ve values] plotted along X-axis and Discount Rate along Y-axis
Solution 1: Spreadsheet Program Method:
Assumptions:
a. Project Life will be 20 years
b. Discount rate to be used =12%
Year wise Cost and Benefit calculation:
Amount in Thousand (NRs)
Financial Capital Cost 50,000
Financial o & M cost @ 3% (50,000*0.03) 1,500
Financial Net incremental Benefit/year 12,500
Economic capital cost (50,000*0.95) 47,500
Economic O & M cost (1,500*0.90) 1,350
11,875
S.N Descriptions Year 1 Year 2 Year 3 Year 4 Year 5 Year 6Year 6 &
onwards
1 Capital Cost 14,250 23,750 9,500
2 Cumulative Capital Cost 14,250 38,000 47,500
3 O & M Cost 1,350 1,350 1,350 1,350
4 Benefit 4,750 8,312.5 11,875 11,875
Economic Net incremental
benefit/year (12,500*0.95)
c. Out of the total capital cost, 30% investment will be made in first year, 50% in second year and
remaining 20% in third year of construction period
d. Benefit development period will be 3 years after the completion of construction works such
that 40% benefit will be realized in first year, 70% in second year and 100% in third year onwards
till the life of the project.
e. Standard conversion factors to be used to calculate economical cost and benefit are 0.95 for
capital cost and net incremental benefit; and 0.9 for O & M cost.

Flood Control and Management Manual Appendix -5
WECS - 2 -
Spreadsheet Program Method:
0
1 14250.00 14250.00 -14250.00 0.89285 12723.11 0.00
2 23750.00 23750.00 -23750.00 0.79718 18933.03 0.00
3 9500.00 9500.00 -9500.00 0.71176 6761.72 0.00
4 0.00 1350.00 1350.00 4750.00 3400.00 0.63550 857.93 3018.63
5 0.00 1350.00 1350.00 8312.50 6962.50 0.56741 766.00 4716.60
6 0.00 1350.00 1350.00 11875.00 10525.00 0.50661 683.92 6015.99
7 0.00 1350.00 1350.00 11875.00 10525.00 0.45233 610.65 5371.42
8 0.00 1350.00 1350.00 11875.00 10525.00 0.40386 545.21 4795.84
9 0.00 1350.00 1350.00 11875.00 10525.00 0.36058 486.78 4281.89
10 0.00 1350.00 1350.00 11875.00 10525.00 0.32194 434.62 3823.04
11 0.00 1350.00 1350.00 11875.00 10525.00 0.28744 388.04 3413.35
12 0.00 1350.00 1350.00 11875.00 10525.00 0.25664 346.46 3047.60
13 0.00 1350.00 1350.00 11875.00 10525.00 0.22914 309.34 2721.04
14 0.00 1350.00 1350.00 11875.00 10525.00 0.20458 276.18 2429.39
15 0.00 1350.00 1350.00 11875.00 10525.00 0.18266 246.59 2169.09
16 0.00 1350.00 1350.00 11875.00 10525.00 0.16308 220.16 1936.58
17 0.00 1350.00 1350.00 11875.00 10525.00 0.14560 196.56 1729.00
18 0.00 1350.00 1350.00 11875.00 10525.00 0.13000 175.50 1543.75
19 0.00 1350.00 1350.00 11875.00 10525.00 0.11607 156.69 1378.33
20 0.00 1350.00 1350.00 11875.00 10525.00 0.10363 139.90 1230.61
47500.00 22950.00 70450.00 191187.50 120737.50 45258.40 53622.12
NPW at 12% discount rate 8363.72
B/C at 12% 1.18
Economic Internal Rate of Return (EIRR) 14.76%
Amount in Thousand
Cash
Flow
Discount
Factor at
12%
Present
Value of
Cost
Present
Value of
Benefit
Year Capital costO & M
cost
Total
CostBenefit

Flood Control and Management Manual Appendix -5
WECS - 3 -
Graphical Method:
0
1 -14250.00 0.89285 -12723.11 0.87719 -12499.96 0.86206 -12284.36 0.84745 -12076.16
2 -23750.00 0.79718 -18933.03 0.76946 -18274.68 0.74315 -17649.81 0.71817 -17056.54
3 -9500.00 0.71176 -6761.72 0.67496 -6412.12 0.64064 -6086.08 0.60861 -5781.80
4 3400.00 0.63550 2160.70 0.59207 2013.04 0.55227 1877.72 0.51577 1753.62
5 6962.50 0.56741 3950.59 0.51935 3615.97 0.47609 3314.78 0.43709 3043.24
6 10525.00 0.50661 5332.07 0.45557 4794.87 0.41042 4319.67 0.37041 3898.57
7 10525.00 0.45233 4760.77 0.39962 4206.00 0.35381 3723.85 0.31390 3303.80
8 10525.00 0.40386 4250.63 0.35054 3689.43 0.30500 3210.13 0.26601 2799.76
9 10525.00 0.36058 3795.10 0.30749 3236.33 0.26293 2767.34 0.22543 2372.65
10 10525.00 0.32194 3388.42 0.26972 2838.80 0.22666 2385.60 0.19104 2010.70
11 10525.00 0.28744 3025.31 0.23659 2490.11 0.19539 2056.48 0.16189 1703.89
12 10525.00 0.25664 2701.14 0.20753 2184.25 0.16843 1772.73 0.13719 1443.92
13 10525.00 0.22914 2411.70 0.18204 1915.97 0.14519 1528.12 0.11626 1223.64
14 10525.00 0.20458 2153.20 0.15968 1680.63 0.12516 1317.31 0.09852 1036.92
15 10525.00 0.18266 1922.50 0.14007 1474.24 0.10789 1135.54 0.08349 878.73
16 10525.00 0.16308 1716.42 0.12286 1293.10 0.09300 978.83 0.07075 744.64
17 10525.00 0.14560 1532.44 0.10777 1134.28 0.08017 843.79 0.05995 630.97
18 10525.00 0.13000 1368.25 0.09453 994.93 0.06911 727.38 0.05080 534.67
19 10525.00 0.11607 1221.64 0.08292 872.73 0.05957 626.97 0.04305 453.10
20 10525.00 0.10363 1090.71 0.07273 765.48 0.05135 540.46 0.03648 383.95
120737.50 8363.73 2013.40 -2893.55 -6697.73
S.NDiscount
RateNPW
1 12% 8.36
2 14% 2.01
3 16% -2.89
4 18% -6.70
Amount in million
Discount
Factor at
14%
Present
Value of
Cash
flow at
14%
Discount
Factor at
18%
Discount
Factor at
16%
Present
Value of
Cash
flow at
16%
Amount in Thousand
YearCash
Flow
Discount
Factor at
12%
Present
Value of
Cash
flow at
12%
Present
Value of
Cash
flow at
18%

Flood Control and Management Manual Appendix -5
WECS - 4 -

Flood Control and Management Manual Appendix -5
WECS - 5 -
Similar Triangles Method:
EIRR = Discount Rate for zero NPW
= DF + CD [From Graph plotted above]
= DF + (DE/BE)* AB [From similar triangles ABC and CDE]
= DF + (DE/[DE+BD])*AB [ BE = DE+BD]
= 14% +(NPW at 14% / [NPW at 14% + absolute value of NPW at 16%]*(16% - 14%)
= 14% + 2.01340 / [2.01340 +2.89355]*2%
=14 % + 0.82 %
= 14.82 %

Flood Control and Management Manual Appendix – 6
WECS - 1 -
Appendix: 6 : Assessment of Case Studies
6.1 ASSESSMENT OF CASE STUDIES 6.1.1 Planning and Design The river training works in Nepal have been planned and designed to protect the settlements and properties from recurrent floods occurring in different rivers on different occasions. These works have been accelerating with the establishment of DWIDP. In the past river training works were being planned and implemented under the Department of Irrigation. The major river training works planned and implemented under the DOI were flood protection dykes in East Rapti Irrigation Project in Chitwan district, flood protection embankments in Bakra river in Morang district, flood protection works in Rajapur Irrigation Rehabilitation Project in Bardiya district, flood protection works in Sunsari Morang Irrigation Project in Sunsari district and river training works in Praganna Kulo Irrigation Project in Dang district. These project based planning and design are mostly appropriate in the context of addressing riverbank erosion problems except Bakra flood protection works which have been facing several technical deficiencies. The main deficiency is the height of the embankment which had overtopped several times at several locations. The bed level of the river has been aggrading due to high sediment transport from the Chure catchment erosion. The embankments of Rajajur Irrigation Project had also breached and washed out in the past. The height of embankment in Pragnna Kulo has also overtopped at places from the floods of West Rapti River. This is mainly due to lower bank height caused due to lower free board. The dyke of East Rapti and concrete spurs at Rajaiya are performing better due to adequate planning and design. The preparation of the Master Plan for the river training works was initiated with the master plan preparation of eight rivers of Nepal carried out by JICA in 1999. These eight rivers were Ratuwa - Mawa River in Jhapa and Morang districts, Lohandra river in Morang district, Lakhandehi river in Sarlahi district, Narayani river in Chitwan and Nawalparasi districts, Tinau river in Rupandehi district, West Rapti river in Dang and Banke districts, Babai river in Bardiya district and Khutiya river in Kailali district. This master plan study had identified Babai and Lakhandehi as two most vulnerable rivers and had hence recommended to implement proposed measures immediately. However, the implementation of these master plans is yet to be materialized. With this initiation, the River Training Division of DOI had also started preparing river training master plans of various rivers in the name of socio-technical master plans. These master plans not only prepared technical feasibility of the flooding and inundation problems but also assessed the socio-economic aspects of flooding including its impacts on social life of the affected people. In addition, these master plans also carried out economic evaluation of the project after assessment of expected benefits and investment. With the establishment of DWIDP various feasibility studies and master plans were prepared to deal the river training works in holistic approach. Mostly these studies were based on the feasibility of certain stretch of the river that followed district or region boundaries. The systematic planning and design have been initiated with the implementation of People‘s Embankment Program in 2066/67. However, the implementation of these PEPs has been based on the annual budget allocation and demand of the local people to cope with recent flooding problems. With the changes in the river morphology due to monsoon floods and river bed mining, the study carried out in the past might not reflect the actual river site conditions during the implementation of river training works. Hence, the feasibility studies are being carried out regularly to update the existing master plans of the river. Due to lack of proper guidelines and norms for the preparation of these feasibility studies and master plans are not uniform. The study of Girwari River training works, Kamala River Training Works and Bagmati river Training works were comparatively sound in engineering design. The Kamala and Bagmati river training works were planned and designed based on Indian Standard as these projects were implemented under Indian grant. The maintenance of earthen embankment without protection works are the major issues in the Kamala and Bagmati projects. 6.1.2 Design of Embankment The embankment and spurs are found the most appropriate river training structures in all cases study sites. The embankments were designed and constructed with river bed material using conventional technology. The main issue is the alignment of the embankment. In most cases embankments function as the bank of the river which has been aligned directly on the eroded banks. In Bagmati River training works embankments were aligned at least one Lacey‘s perimeter away from the bank line. Despite the provisions in the Detailed Project Reports, the embankment passes along the bank in Kamala and Ratuwa rivers. Almost in all embankments, gabion revetment was found used to protect the embankment from water waves. The design of embankments was limited to the determination of top width, height, side slope and free board. The free boards have also been adopted randomly without any justifications. No stability analysis and no seepage

Flood Control and Management Manual Appendix – 6
WECS - 2 -
analysis based on geotechnical investigation have been found in the design reports. The geotechnical investigations have not been carried out in all cases and the side slopes of the embankment have been determined randomly with the physical judgment of the available embankment material. In most cases 1:2 (V:H) slope was found adopted for side slope which is technically stable in silty soil. In the clayey soil steeper slope which is comparatively economical may be technically suitable. In case of sandy soils, even more flat slope may be required technically. The available reports lack the criteria of providing side slopes which ought to be based on the type of material used for the construction of embankments. In most cases the river side slopes of the embankment are protected with gabion revetments because these embankments are aligned right on the bank line. In Bagmati and Kamala river gabion revetments are provided only at the vulnerable locations. In these rivers embankments should have been aligned at least one Lacey‘s waterway away from the bank line. This provision has been maintained in Bagmati River but not necessarily maintained in the Kamala river embankments. Most of the river training works under the case study were designed and implemented using conventional technology. The use of gabion wires with crated boulders are the general treatment of river training works. The weaving of gabion boxes have also not uniform and different mesh sizes were observed even in one river site. In most cases rectangular mesh sizes with 10 gauge Galvanized Iron Wires have been used for crate boxes. In some cases machine made boxes having hexagonal mesh with 10 gauges GI wires were also used which were found of better quality in comparison with the handmade crated boxes. The availability of boulder for filling the crated boxes and the size of boulders are questionable in some cases. The bioengineering is one of the most successful measures for the slope stabilization and bank protection works. The uses of bioengineering works were found very limited in all the studied case examples. The provisions of green belt as the secondary defense for the river flooding were also very limited in the case examples. In East Rapti dykes more greenery has been maintained along the embankments. The inner side of the embankment was planted with trees and in some locations outer side of the embankment has also greenery defense belt. To follow the provisions of the DPR in Girwari Khola greenery belt has been maintained for about 15 m to 25 m on the outside of the embankment. In other cases no provisions of bioengineering and greenery defense have been observed in the design and implementation. 6.1.3 Design of Spurs and Launching Aprons The design of spurs and studs are not uniform in most case study examples. The diagnosis of the design of spurs is carried out based on their length, type of spurs (permeable and impermeable), and spur body material. The length of spurs varies significantly throughout the case studies. The longest spurs are observed in Koshiriver where length of spurs varies from 300 m to 1.00 km. These spurs were constructed with river bed material and protection works were carried out only at the header parts. After the Koshi River, longer spurs are observed in Bagmati River where length varies from 125 m to 185 m. The river training works in Koshi, Bagmati and Kamala rivers were designed as per standard Indian practices. The design parameters of these rivers are on higher side than those of other river training works. The length of spurs does not match with design flood discharge/river‘s width of the case study river training works (Table 6-1). The length of sloping spurs constructed with river bed material in East Rapti River is 50 m. The performance of these spurs is satisfactory. In other medium and small rivers the length of spurs is 15 m which are considered as short spurs. The spacing of these spurs is kept about 3 times the length of the spurs. The length of spurs in Narayani River seems less in comparison with its design flood discharge. The sloping spurs with river bed material are found less effective than the boulder body sloping spurs. But these boulder body spurs are more expensive than river bed material spurs. The studs are short length spurs which are constructed in embankment with revetments. The performance of these studs is reported to be better than long spurs. In Ratuwa and West Rapti river studs are functioning well. In Karnali river studs are constructed along with spurs to protect the embankments.

Flood Control and Management Manual Appendix – 6
WECS - 3 -
Table 6-1 : Length of spurs and launching aprons
S.N River Design flood discharge (m
3/s)
Waterway provided (m)
Lenth of spur (m)
Length of launching apron (m)
1 Ratuwa-Mawa river 1,013 456 studs 9
2 Kamala river 5,000 1,800 125 30
3 Bagmati river 11,000 2,200 125 28
4 East Rapti river 1,290 50 9
5 Narayani 13,500 1.085 15 12
6 GirwariKhola 535 - 12 6
7 Tinau 4,000 100 15 9
8 Babai 5,460 - 15 9
9 Karnali 13,723 - - 15
The design reports of some river training works under case studies were not available and design parameters were assessed based on field site conditions. The designs of scour protection have been carried out using Lacey‘s regime formula. In all cases the length of launching apron has been calculated based on 1:2 (V: H) launching assumption. This assumption is more applicable for alluvial rivers and for gravel and boulder stage rivers the launching slope may be more steeper as 1:1.5 (V:H).
6.2 Construction and Sustainability
6.2.1 Construction Technology Used
Most of the river training works under the case study were designed and implemented using conventional technology. Use of new technology in the design and implementation is found very limited in case study sites. The use of gabions (GI wire crates filled with boulders) is the general treatment of river training works. The weaving of gabion boxes is also not uniform and different sizes were observed even in one river site. Rectangular mesh sizes with 10 gauge Galvanized Iron Wires are common for crate boxes. However, machine made hexagonal mesh with 10 gauges GI wires were also found used in some cases, where their functions were comparatively better with respect to quality. The availability of boulder for filling the crated boxes and the size of boulders are questionable in some cases.
The embankment and spurs are found the most applicable river training structures in all cases study sites. The use of bamboo porcupines, bamboo reinforcement and bamboo pilings were found limited in the case examples. It was reported that the bamboo porcupines were used during the flood fighting in West Rapti River in Banke district. But these porcupines were not observed during the field visits. The use of bamboo reinforcement in combination with sand bags spurs, proved to be a low cost technology has been found successful in Tinauriver in Marchawar area. During the flood fighting in monsoon, nylon crates and sand bags have been used extensively. The use of geo-synthetic bags was limited. During field visit geo-bag spurs were observed only in Kamala River.
In boulder-stage Rivers, concrete structures have been constructed for river training works which is encouraging. In Tinau River in the vicinity of Butwal municipality concrete retaining walls, sloping concrete revetments and concrete bed bars have been used. The bed bars are the RCC retaining walls constructed below the river bed level to control the vertical gradient. The performance of the bed bars in Tinau River has been found very effective. In Mahakali River in Darchula RCC counter fort walls, concrete retaining walls and concrete blocks are being constructed. However, the quality of concrete works seems inferior to withstand the abrasion effects of rolling big boulders. The eroded concrete blocks and eroded top of bed bars reveals the need to increase the grade of concrete in such highly vulnerable river regime.

Flood Control and Management Manual Appendix – 6
WECS - 4 -
Series of bed bars in Tinau river near Butwal Geo synthetic bags in Kamala river near Bandipur, Siraha
The RCC spurs constructed in East Rapti River by Department of Roads are found functional even after more than 25 years of construction (constructed during 1993-94). The initial investment of these concrete spurs might have higher than that of gabion spurs, but their sustainability and functionality are far better than gabion spurs in vulnerable rivers having high velocity and heavy rolling bed load.
The recent use of concrete porcupines has been found extensive in Bagmati and Kamala rivers. The performance of these porcupines to retard the flood flow was observed satisfactory in these rivers. In other river training works use of concrete porcupines were not observed.
The bioengineering, one of the most successful measures for the slope stabilization and bank protection were found very limited in all the studied case examples. The provisions of green belt as the secondary defence for the river flooding were also very limited in the case examples. In East Rapti dykes more greenery has been maintained along the embankments. The inner side of the embankment was planted with trees and in some locations outer side of the embankment has also greenery defense belt. Greenery belt has been maintained for about 15 m to 25 m on the outside of the embankment in Girwari Khola. In other cases, bioengineering and greenery defense were not found.
Concrete porcupines in Bagmati river near Dharampur
Concrete porcupines in Kamala river near Kiratpur
6.2.2 Provision of Drainage Outlets and Irrigation Inlets The embankments aligned along the riverbank not only protect the banks from the erosion and inundation but also regulates the surface drainage or sheet flow inside the embankments. To allow the free flow of collected surface drainage through the embankment drainage outlets are to be provided on the embankment. The outlet structures are required only in continuous embankments which totally block the drainage flow. These outlet structures are named differently in different reports and text books such as drainage outlet structure, anti flood sluices, and culverts. The design of these outlet structures is the part of the design of the river training works and their provisions assures the adequacy of the planning and design.

Flood Control and Management Manual Appendix – 6
WECS - 5 -
In most case studies drainage outlets are provided with adequate openings with or without gates. In Narayani River Training Project Chitwan part of the embankment was eroded due to lack of provision of drainage outlet near Tamang Basti. The area usually inundates from the flood water of East Rapti River and a gated anti-flood sluice is necessary at this location. These drainage structures in all case example sites are found concrete piped structures either with gates or ungated. The gated structures are equipped with vertical sliding gates to be operated with spindle fixed on the pipe outlet. In few cases flap gates culverts were also observed. In Kamala river training works anti flood sluice with flap gates are functioning well. The ungated pipe culverts are also functioning well in most cases. At one location, near Bhalohiya on the right bank of the Bagmati River ungated concrete pipe culvert was washed out in last monsoon from the flood waters of the Bagmati River.
The implementation of pipe culverts are not always appropriate to suit with the length of the concrete pipe or the length of the embankment base. The drainage outlets of Karnali river embankments constructed by Karnali River Training Project and Rani Jamara Irrigation Project are observed inferior in quality and in aesthetic view.
In the master plans of eight river training works prepared by JICA the structural measures for the drainage outfalls were not provisioned, rather it provisioned discontinuous embankment at places to allow drainage flow pass freely through the openings in between embankments. This concept is more or less utilized in Mahakali and Girwari river training works constructed under the guidance of JICA experts.
The inlet of irrigation water from the rivers is the essential components in the design of earthen embankments. In most case study sites irrigation inlet structures have been observed under the embankments. These irrigation inlets and intakes are two types according to their functionality and safeguarding from the floods, gated inlets and un-gated inlets. The gated structures not only regulate the irrigation water into the main canal but also control the flood flow entering into the canal during the monsoon season.
Anti-flood sluice in Kamala embankment near Sagara, Dhanusha
Drain outlet in Karnali embankment near Anantapur, Bardiya
The gated irrigation intakes on East Rapti dykes are facing problems due to aggrading nature of the river which has compelled to excavate the river after each large flood. The gated intake structures and associated river training works in Karnali river of Rajapur Irrigation Project are functioning well in Budhi Kulo, Tapra and Manau intakes despite frequent repair of river training works and diversion issues at Tapra and Manau intakes. In Karnali river irrigation intakes and embankments are tied up with the embankments and no major issues have been observed during the field visits. In Tinau river concrete bed bars have been constructed to control the vertical gradient of the river and to allow irrigation diversion to Sorah and Chhattis Kulo. In Girwari Khola there are as many as 24 irrigation systems on both banks of the river from Jyalbas to Parsauni and only one irrigation canal has gated intake on the embankment. All other canals are equipped with concrete pipe inlet across the embankment and no major issues for irrigation diversion have been observed during the field visit.

Flood Control and Management Manual Appendix – 6
WECS - 6 -
Ungated outlet in Karnali embankment near Jagatpur, Kailali
Open pipe outlet in Mahakali embankment in Dodhara, Kanchanpur
In Praganna Kulo irrigation intakes are tied with embankments. The diversion of second intake (Praganna intake) is functioning well while other two intakes are facing problems of irrigation diversion. In Banganaga river permanent weir was constructed across the river to irrigation 6,500 ha of land at the downstream of east-west highway. Another irrigation diversion is located at the foothill for the Shringighat Kulo which supplies water to both banks of the river to irrigate fields at the vicinity of east west highway.
Piped irrigation inlet in Girwari Khola embankment Gated irrigation intake at East rapti dyke
In Bagmati, Kamala, Narayani, Koshi, West RaptiBanke, Babai, and Mahakali rivers irrigation diversion issues have not been observed during the field visits. 6.2.3 Sustainable Impacts The case study examples of river training works revealed that all the river training works are very effective and have significant positive impacts on livelihood. The impacts on livelihoods can be evaluated based on the facilities or benefits provided by the river training works. The main benefits observed during case studies are protection of settlements and properties, reclamation of eroded agricultural lands, provision of access roads, increase in value of lands, prevention of out migration and enhancement of economic activity. The protection of settlements and properties is the major benefit of the river training works which not only protects agricultural lands, houses, business centers but also protect other permanent properties. The river training works also protect settlements and properties from inundation and flooding. In addition, river training works saves infrastructures constructed across the river such as weir and barrages, bridges and culverts. All the case studied river training works have very positive impacts with respect to protection of properties and infrastructures. The reclamation of agricultural lands is another major benefit of the river training works. The embankment constructed outside the eroded parts of the lands not only safeguards the lands but also reclaims the eroded lands. The closure of avulsion in Kamala River in Hatmunda and Phulbaria are the best examples of reclamation of agricultural lands. Similarly, West Rapti embankment at Khururiya reclaimed the eroded lands. The embankment constructed along the left bank downstream of Bagmati barrage had remained a large chunk of land eroded during 1993 floods.

Flood Control and Management Manual Appendix – 6
WECS - 7 -
The provision of access road on the top of the embankment is one of the major benefits of the river training works. All the embankments visited during the case studies provide access for local transport. In general there is lack of roads along the river banks and areas along the river banks are remote in this aspect. The provision of gravel roads on the top of the embankment provides access to these remote areas where transport facilities were negligible. The right bank of Kamala embankment, right bank of Bagmati embankment, East Rapti dyke, Mahakali embankment in Dodhara and Koshi embankments are the best examples of access roads that facilitate rural transport and enhance economic activity.
Paddy field in GirwariKhola Community Program in Bagmati embankment in
Rautahat
The value of agricultural lands has been increased since the implementation of river training works in case study sites. The lands along the river banks are always susceptible to erosion and hence its value is always less in comparison to agricultural lands inside the river banks. With the introduction of river training works bank erosion has been stopped and the value of these lands has also increased. With the implementation of river training works agricultural activities in the case study sites are increased, which help to prevent out migration. 6.3 Maintenance Requirements The maintenance of the river training works is the major issue in its sustainability. In all cases embankments are made of river bed material using local technology of dosing soils from the adjacent fields. These embankments are susceptible to erosion by rain cuts, grazing of cattle, and human encroachment. The gabion spurs are mostly eroded after 2-3 floods unless proper maintenance is undertaken. In case study sites maintenance works are being carried out with the annual budget allocation for the implementation of master plan as the maintenance budget is negligible to cope with the recurrent maintenance needs.
Damaged studs and launching apron in West Rapti embankment in Dang district
Damaged spurs in East Rapti dyke in Chitwan district
The Mahakali Model river training works carried out by JICA has been damaged severely since last few years and maintenance is being carried out as part of master plan for the strengthening of existing embankments. The embankment at the head reach was completely washed out in the floods of 2013 which was reconstructed by

Flood Control and Management Manual Appendix – 6
WECS - 8 -
PEP Field Office, Kanchanpur. In addition, almost all of the spurs are eroded partly or fully which are also being repaired by PEP Kanchanpur. In West Rapti river in Dang district launching apron of the embankment is almost eroded and needs repair in addition to heightening of embankment. The most serious issues of maintenance lies at Girwari Khola model site where large part of the embankment has been eroded and repair works are being carried out in an adhoc basis. Despite the active participation of the community the maintenance works are carried out at the piece meal basis due to inadequate budget allocation. In addition, some of the works have been carried out with other financial sources such as budget from Member of Parliament, budget from rural municipality and from NGOs. The issue of maintenance is also severe in Kamala river training works which has about 62 km of embankment on both banks. At several places embankment is unsafe due to flood attack in the last floods. The most severe problem of river attack lies at Basbitta of Siraha district followed by Lakhad of Dhanusha district. In Kamala embankment maintenance of gravel road is also essential which has been damaged due to continuous transport of river bed material by tractors. The human encroachment on valley side of the embankment is also problematic in some cases. In Bagmati embankment and Kamala embankment local people have constructed permanent houses on the toe of the embankments. In addition, cutting the toes for agricultural purpose, grazing of cattle and unwanted approach roads are common in all embankments. Rather than maintaining damaged spurs, new spurs have been constructed in some cases which show the ignorance of repair and maintenance.
Permanent houses on the Kamala river embankment in Siraha district
Banana plantation along the toe of Bagmati embankment in Sarlahi district
6.4 Lessons Learnt
Embankments with spurs/studs are the major river training measures to control flooding, inundation and bank erosion. Embankments constructed with the available river bed material with or without revetment pitching on the riverside slopes and aligned right on the eroded bank of the river are susceptible to flood attack. The gabion spurs and studs are effective to deflect the flow and protect the bank and embankment from floods and erosion. However, embankments should be adequate and appropriately aligned giving adequate waterway for flow passage; number, length and spacing of spurs/studs should also be adequate and appropriate depending upon site condition for getting intended result. In Narayani River training works in Chitwan and Nawalpur the combination of embankment and spurs seems conservative to cope with recurrent floods while in Karnali river the combination of embankment and spurs seems over design. In Narayani river gabion revetments are less effective to protect banks from concentrated flow at critical locations where use of concrete blocks is advisable.
The planning and design on holistic approach for river training measures in small Chure rivers is very essential. The case of Ratuwa and Bakra which originate from Chure hills is very critical due to catchment erosion and heavy sediment transport from uphill catchments. The Bakra River has high gradient in upper reach and carries huge heavy bed loads which get deposited at places. The high sediment deposition has forced to form different loops with concentrated mighty flows. This divided flow having strong driving capacity damages banks (right and left) in Madhumalla almost every monsoon. The positive impacts of watershed management in Girwari Khola have proved the efficacy of holistic approach of river basin management.
The planned river control and management based on Master Plan with adequate provision for regular maintenance of constructed facilities should be strictly followed. The planning and design exercise also

Flood Control and Management Manual Appendix – 6
WECS - 9 -
need periodic updating and strengthening to suit the application of new technology, river morphology and economy. In this aspect frequent transfer of technical manpower and quick response of ongoing activities are the main issues to be dealt with the river training works. Banganga river training works are being implemented on an adhoc basis without feasibility study and master plan. The master plan prepared for Mahakali Darchula also comprised of insufficient information with respect to past flood events and data. In addition, the plan proposed the access road along the bank between two retaining walls where the green belt or park between these two retaining walls would be a better option.
The uses of construction material are also different in different sites. The size of gabions and mesh size of crates also vary significantly across the studied sites. The machine made hexagonal mesh wire crates with diaphragms are found most appropriate for the revetments and launching aprons.
The repair and maintenance are the major issues and challenges in river training works. In most cases maintenance works are negligible rather focusing on new construction. The case of Bakra river embankment, Koshi embankment, Kamala embankment, West Rapti embankment in Dang, East Rapti dyke in Chitwan and Girwari Khola river training works are facing problems to cope with recurrent monsoon floods for want of proper maintenance. Annual budget allocation in Girwari Khola is not sufficient to meet the annual maintenance needs. In addition, the ongoing maintenance works do not follow the initial design concept and workmanship of repair works is also inferior. Kamala and Bagmati embankments constructed under Indian grant assistance with the technical control of Joint Committee on Inundation and Flood Management (JCIFM) need maintenance at several locations inspite of their well performance. Two different locations in Kamala River namely Basbitta in Siraha and Kiratpur in Dhanusha were found vulnerable during field visit and need immediate attention towards repair and maintenance.
The bed level of the river are rising year by year in some cases which jeopardize the irrigation diversion, compel to make multiple channels, and ease to overtop the embankment. The case of Bakra in Morang district, East Rapti in Chitwan district and West Rapti in Dang district are examples of aggrading rivers which has created irrigation diversion problems and also overtops the embankments at different locations. In some intakes on the East Rapti River, the diversion of irrigation water is too complicated due to higher sediment deposition. On the one hand water is necessary for irrigation which attracts river towards the embankment and on the other hand flood water hits the embankment through these irrigation channels.
The rigid islands formed at different locations in the flood plain of the rivers like Bakra River help rivers to overtop and erode the embankments. In addition, uncontrolled excavation of river bed material has created degradation issues in rivers like Tinau, Bakra etc.
The river training works are being implemented by different agencies. The main agency is the DWIDM while secondary agency is DOI. Besides, local government bodies, INGO/NGOs etc. are also involved in this sector. One of the main issues is the coordination between such agencies that plan, design and implement river training works in the same river. In Babai River the plan of DWIDM is to construct river training works for 28 km of the right bank while left bank of the river is being protected by Babai Irrigation Project under DOI. Similarly, river training works on right bank of West Rapti river upto Kamdi Bridge is being implemented by Sikta Irrigation Project while other parts of the river are the responsibility of PEP Lamahi. The right bank of the West Rapti River in Dang district upto Bangaun is the responsibility of PKIP while other parts of the river are the responsibility of PEP Lamahi. The right bank of the Karnali River is being protected by Rani Jamara Irrigation Project while left bank is trained by Karnali River Management Project. Under such circumstances of works setting, co-ordination among the agencies is inevitable for effective river training measures.
The performance of the embankment reinforced with studs has been found positive if constructed as per Master Plan. The patched river training works without planning is not effective as such works carried out in the past have not been observed during the field visit. The bamboo porcupines constructed as emergency safeguards in rivers like Ratuwa and Bakraha are quite effective to control bank erosion. With the construction of RCC bed bars and retaining walls people are feeling secure during monsoon period in Tinau River near Butwal, which carries big rolling boulders during monsoon. The East Rapti dyke constructed as per sound planning and design is also performing excellently to protect its command area from the havoc of recurrent floods.
The river training works in Narayani River are mostly associated with tourism and several hotel business, resorts and picnic spots are along the river banks. Due to river training works these banks are stable and touristic activities are flourishing due to Chitwan National Park. The impacts of integrated approach of

Flood Control and Management Manual Appendix – 6
WECS - 10 -
river management in Girwari Khola consisting of the sabo technology for gully control, forestation in upper catchment, bioengineering, and river training measures has very positive impacts on livelihoods.
People feel safe and secure if river training measures are properly planned, designed and implemented. The farmers of Jhagadiya tole in Banke district have expressed their satisfaction with the construction of the embankment which has protected their lands from being flooded. The farmers demand to continue the embankment to tie with higher land at upstream. The embankment constructed with JICA assistance in Mahakali river of Kanchanpur district has opened the access to Dodhara Chandani area and people are happy due to enhanced livelihood; and feel safe from the threats of Mahakali floods.

Flood Control and Management Manual Appendix -7
WECS - 1 -
Appendix: 7 : Charts and Tables for Design Parameters Table I :Maximum permissible canal velocities (Fortier and Scobey,(1926)
Original material excavated for canals
velocity, for straight canals of small slope, after aging with flow depths less than 0.9 m, fine gravel
Clear Water Water transporting colloidal silts
Water transporting non-colloidal silts, sands, gravels, or rock fragments
Fine sand (non colloidal) 0.46 0.76 0.46
Sandy loam (non-colloidal) 0.53 0.76 0.61
Silt loam (non colloidal) 0.61 0.91 0.61
Alluvial silt (non colloidal) 0.61 1.07 0.61
Ordinary form loam 0.76 1.07 0.69
Volcanic ash 0.76 1.07 0.61
Stiff clay (very colloidal) 1.14 1.52 0.91
Alluvial silt (colloidal) 1.14 1.52 0.91
Shales and hardpans 1.83 1.83 1.52
Fine gravel 0.76 1.52 1.14
Graded, loam to cobbles (when non colloidal)
1.14 1.52 1.52
Graded silt to cobbles (when colloidal)
1.22 1.68 1.52
Coarse gravel(non-colloidal)
1.22 1.83 1.98
Cobbles and shingles 1.52 1.68 1.98
USACE (1991) provides allowable velocity criteria for no scouring flood control channels in table II. Table II: Allowable velocities (USACE (1991)
S.N. Channel material Mean channel velocity (m/s)
Fine sand 0.61
Coarse sand 1.22
Fine gravel 1.83
Earth
Sandy silt 0.61
Silt clay 1.07
Clay 1.83
Grass-lined earth (slopes <5%) Bermuda grass
Sandy silt
1.83
Silt clay 2.44
Kentucky bluegrass
Sandy silt
1.52
Silt clay 2.13
Poor rock (usually sedimentary) 3.05
Soft sandstone 2.44
Soft shale 1.07
Good rock (usually igneous or hard metamorphic) 6.08

Flood Control and Management Manual Appendix -7
WECS - 2 -
Figure I: Actual applied shear stress in bed
Figure II: Actual applied shear stress in sides

Flood Control and Management Manual Appendix -7
WECS - 3 -
Figure III: Applied maximum shear stress on bed and sides of trapezoidal channels in a curved reach
Figure IV: Shield curve

Flood Control and Management Manual Appendix -7
WECS - 4 -
Figure V: The angle of repose for various degree of particle's angularity (Lane 1952).
3