Adrian Flint University of Bristol Adrian Flint School of ...

TSX:FESwww.flintenergy.com
Life-Cycle Energy Services - Price-Cycle Profitability
D.A. Davidson & Co.9th Annual Engineering & Construction ConferenceSan Francisco, Sept 28 & 29, 2010
Incomparable TOUGH AND
TRUSTED ™
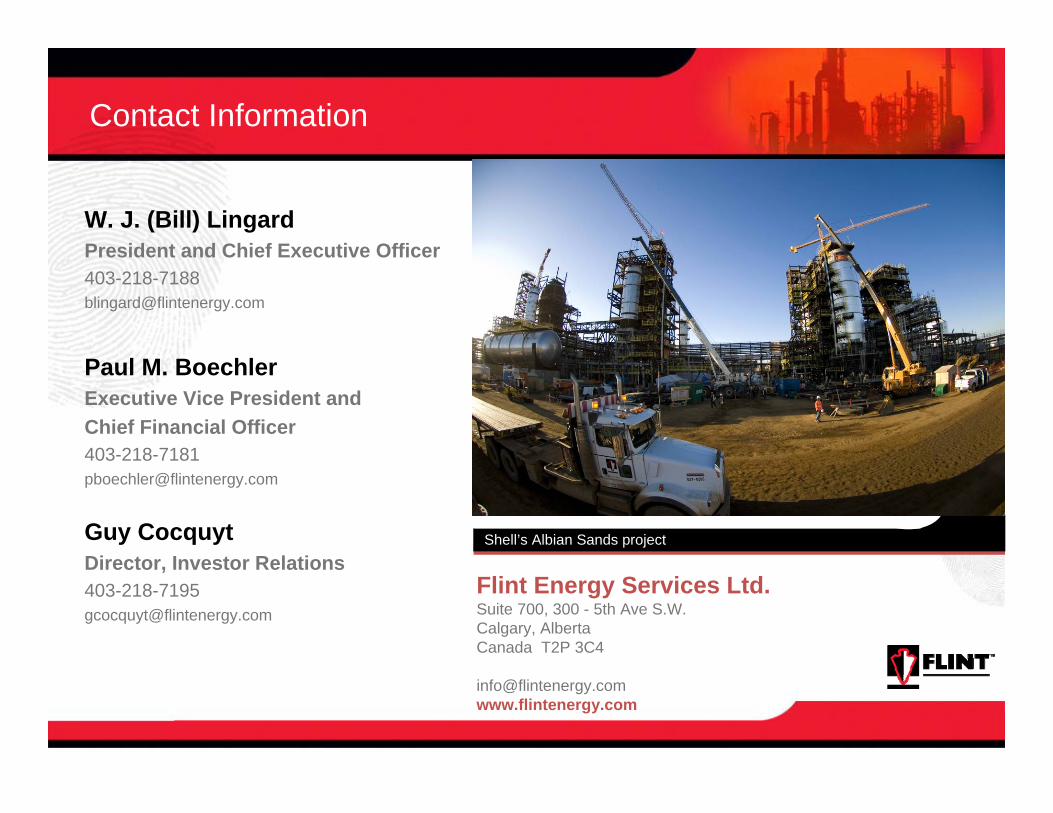
Contact Information
W. J. (Bill) LingardPresident and Chief Executive [email protected]
Paul M. BoechlerExecutive Vice President andChief Financial [email protected]
Guy CocquytDirector, Investor [email protected]
Shell’s Albian Sands project
Flint Energy Services Ltd.Suite 700, 300 - 5th Ave S.W. Calgary, Alberta Canada T2P 3C4

Forward-Looking Information Statement
This presentation contains forward-looking statements concerning the Company’s projected operating results and anticipated capital expenditure trends and drilling activity in the oil and gas industry. Actual events or results may differ materially from those reflected in the Company’s forward-looking statements due to a number of risks, uncertainties and other factors affecting the Company’s business and the oil and gas industry generally.
These risk factors include, but are not limited to risks and uncertainties described under the heading “Risk Factors” and elsewhere in the Company’s Annual Information Form for the year ended December 31, 2009, and other documents filed with Canadian provincial securities authorities, which are available to the public at www.sedar.com.
Unless otherwise indicated, all financial information in this presentation is in Canadian dollars and in accordance with Canadian generally accepted accounting principles.

Trading and Financial Information
Million in Annual Net Earnings (2009)$46.5EBITDA per Share (2009)$3.24
Million in Annual EBITDA(2009)$149.2
Million in Annual Revenue (2009)$1,876.5
Million in Equity (as of June 30, 2010)$543.6Million Basic Shares Outstanding45.6
52 Week High and Low Share Price(high 4/22/10, low 12/30/09)$14.73 - $9.30
Last fiscal year ended Dec. 31, 2009
TSX
:FE
S

Flint’s Strategy - “Build it then Maintain it”
Our focus is on energy production in North America
We are aligned with the best oil and gas producers in their respective markets
Our goal is:to become the most respected energy service company in North America
StatoilHydro’s Leismer Project
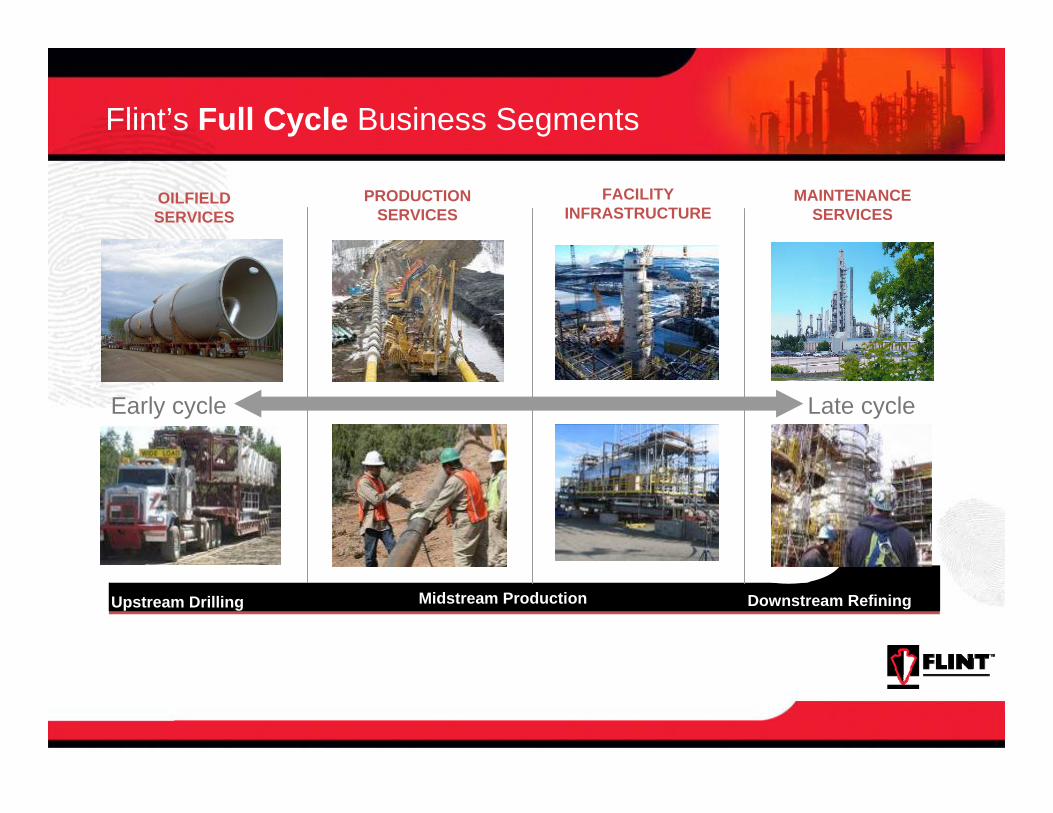
Flint’s Full Cycle Business Segments
OILFIELD SERVICES
PRODUCTIONSERVICES
FACILITY INFRASTRUCTURE
MAINTENANCESERVICES
Upstream Drilling Downstream Refining
Early cycle Late cycle
Midstream Production

Flint’s Construction and Maintenance Activities
Top left - Suncor Firebag 1&2 SAGD facilitiesTop Right – Twin 24” pipelines NE AlbertaBottom Left – Vacuum TruckGathering pipeline installation, USA

2010 Six Month Revenue by Segment
Total Revenues $980.5 MillionEBITDA $75.7 Million
Amounts in C$ millions
Production Services$410.1 million in Revenue
$34.3 million in EBITDA
Facility Infrastructure$250.7 million in Revenue
$28.9 million in EBITDA
Oilfield Services$102.3 million in Revenue
$2.9 million in EBITDA
Maintenance Services$217.5 million in Revenue
$9.6 million in EBITDA
USA
Canada
$263.3 million Revenues$23.4 million EBITDA
$146.8 million Revenues$12.1 million EBITDA
15% of YTD revenuesfrom US operations

2010 Q2 Financial Highlights
3 monthsJun. 30, 2009
3 months Jun. 30, 2010(in C$ Millions, except share amounts)
$0.08$0.18Diluted Net Earnings$0.08$0.18Basic Earnings
Earnings per Share3.88.2Net Earnings
14.827.7Funds Provided by Operations (1)
23.531.7EBITDA$424.2$459.2Revenue
(1) Before changes in non-cash working capital

2010 First Half Financial Highlights
6 monthsJun. 30, 2009
6 months Jun. 30, 2010(in C$ Millions, except share amounts)
$0.48$0.56Diluted Net Earnings$0.49$0.57Basic Earnings
Earnings per Share22.325.9Net Earnings38.659.1Funds Provided by Operations (1)
70.375.7EBITDA$954.4$980.5Revenue
(1) Before changes in non-cash working capital
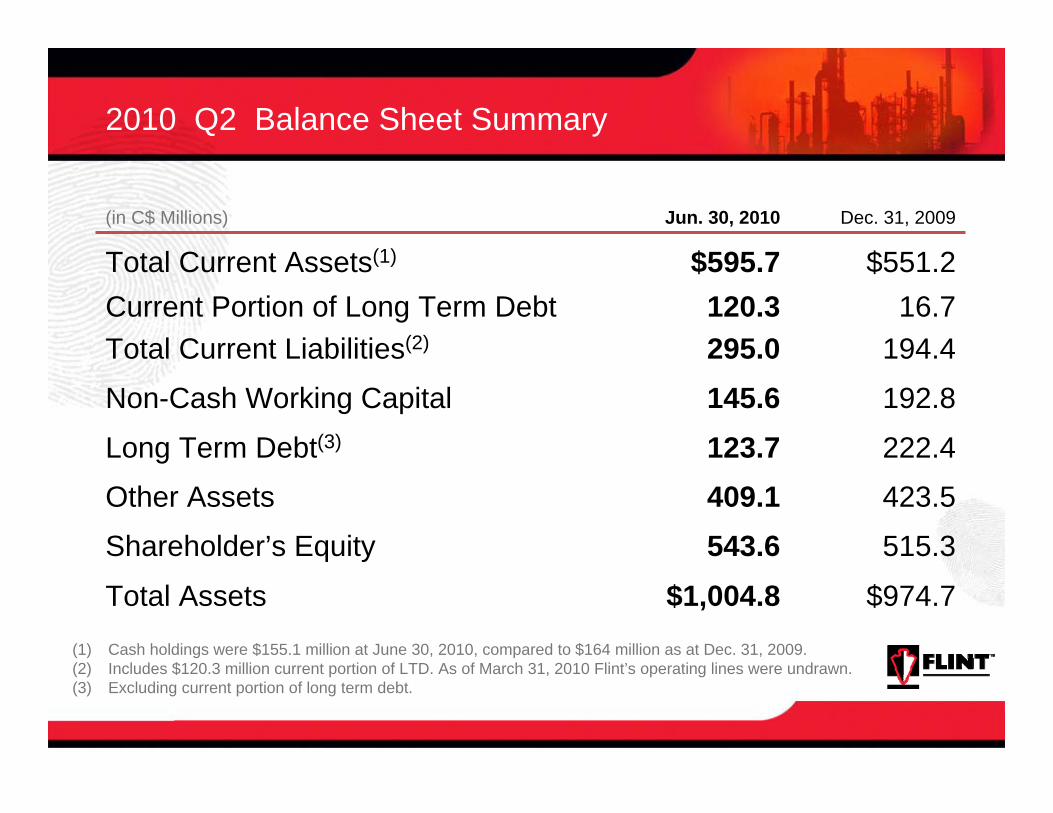
2010 Q2 Balance Sheet Summary
Dec. 31, 2009Jun. 30, 2010(in C$ Millions)
$974.7$1,004.8Total Assets
515.3543.6Shareholder’s Equity
423.5409.1Other Assets
222.4123.7Long Term Debt(3)
192.8145.6Non-Cash Working Capital
16.7194.4
120.3295.0
Current Portion of Long Term DebtTotal Current Liabilities(2)
$551.2$595.7Total Current Assets(1)
(1) Cash holdings were $155.1 million at June 30, 2010, compared to $164 million as at Dec. 31, 2009. (2) Includes $120.3 million current portion of LTD. As of March 31, 2010 Flint’s operating lines were undrawn. (3) Excluding current portion of long term debt.
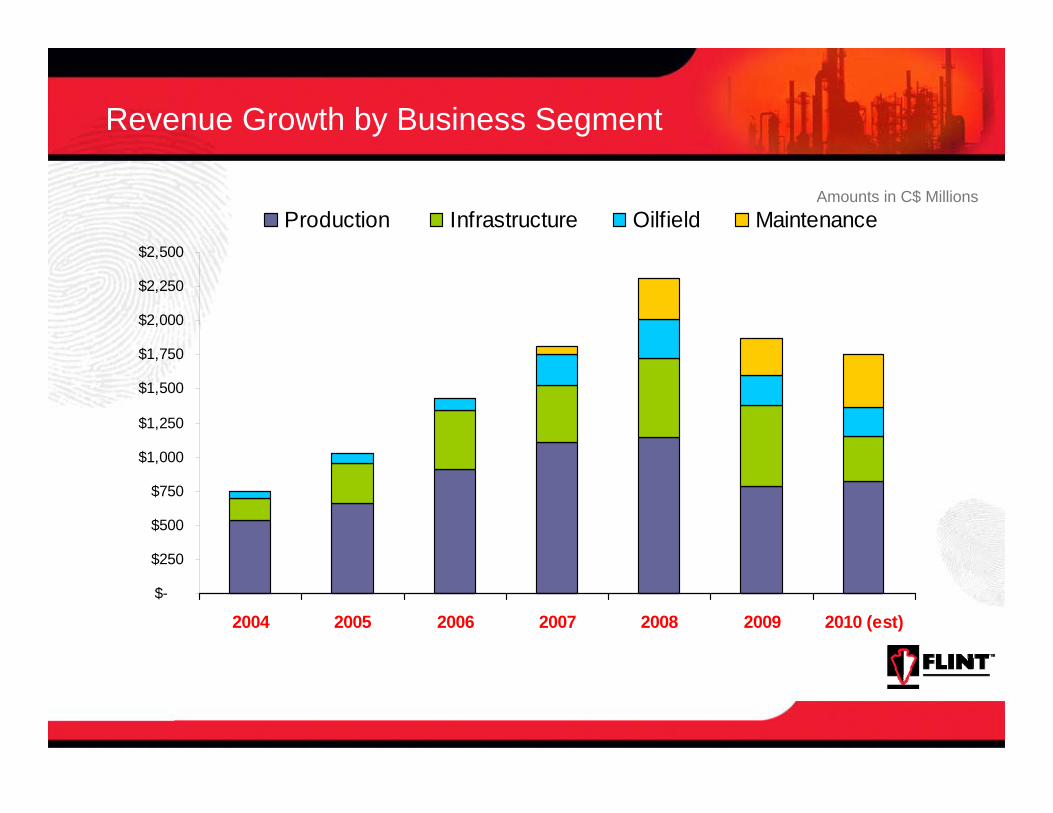
Revenue Growth by Business Segment
$-
$250
$500
$750
$1,000
$1,250
$1,500
$1,750
$2,000
$2,250
$2,500
2004 2005 2006 2007 2008 2009 2010 (est)
Production Infrastructure Oilfield MaintenanceAmounts in C$ Millions

Unconventional Revenue Growth
$-
$250
$500
$750
$1,000
$1,250
$1,500
2004 2005 2006 2007 2008 2009 2010 (est)
Production Infrastructure Oilfield Maintenance
Amounts in C$ Millions

Unconventional Opportunities
Rig MovingBakkenMarcellusNE BC
Pressure & Vacuum, Fluid Hauling
BakkenRockiesMarcellus
Maintenance ContractsOil Sands Eastern RefineriesEast Coast Offshore
.
Woodford, Fayetteville & HaynesvilleShale Gas
Montney & Horn RiverShale Gas
Bakken Shale Oil Marcellus Shale Gas
Heavy Oil & BitumenEast CoastOffshore
Arctic Gas
Barnett, Eagle Ford Shale Gas
60 + operating centres
10,000 + employees

Forecast Conditions at Mid-Year
U.S. & Canadian drilling has increased 39% and 62% respectively in the first 9 months of 2010 on stronger oil prices and increased shale gas activity, we expect activity to remain strong in the second half of 2010
Mid-stream capital spending has picked up in both Canada and the US
Oil sands capital spending is projected to increase to $15 billion in 2010 and 17 billion in 2012 on a number of new project approvals and stable oil pricing
WTI crude oil is forecast in the $75 - $85/bbl range in 2010 and 2011
Natural gas is expected to trade at or below $4/mcf for the balance of 2010 and remain below $5/mcf through in 2011.
Shell’s Albian Sands Project
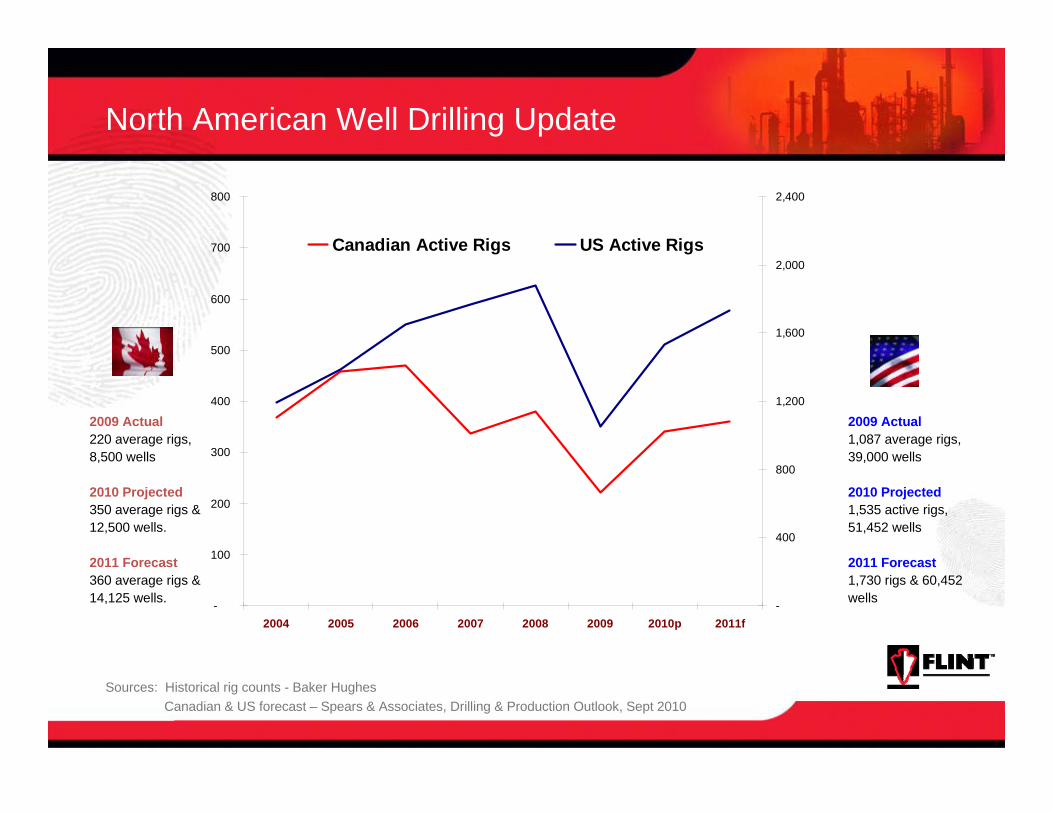
North American Well Drilling Update
2009 Actual220 average rigs, 8,500 wells
2010 Projected350 average rigs & 12,500 wells.
2011 Forecast360 average rigs & 14,125 wells.
Sources: Historical rig counts - Baker HughesCanadian & US forecast – Spears & Associates, Drilling & Production Outlook, Sept 2010
-
100
200
300
400
500
600
700
800
2004 2005 2006 2007 2008 2009 2010p 2011f-
400
800
1,200
1,600
2,000
2,400
Canadian Active Rigs US Active Rigs
2009 Actual1,087 average rigs, 39,000 wells
2010 Projected 1,535 active rigs, 51,452 wells
2011 Forecast1,730 rigs & 60,452 wells
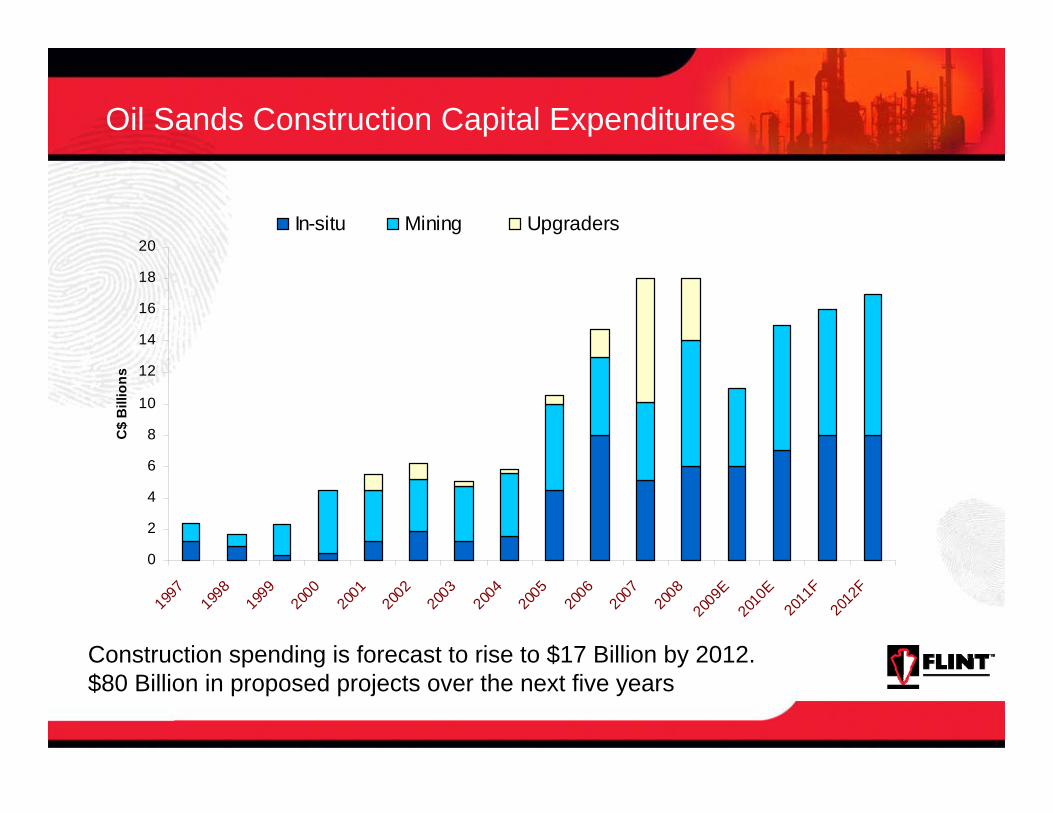
Oil Sands Construction Capital Expenditures
0
2
4
6
8
10
12
14
16
18
20
1997
1998
1999
2000
2001
2002
2003
2004
2005
2006
2007
2008
2009
E20
10E
2011
F20
12F
C$
Bill
ions
In-situ Mining Upgraders
Construction spending is forecast to rise to $17 Billion by 2012.$80 Billion in proposed projects over the next five years
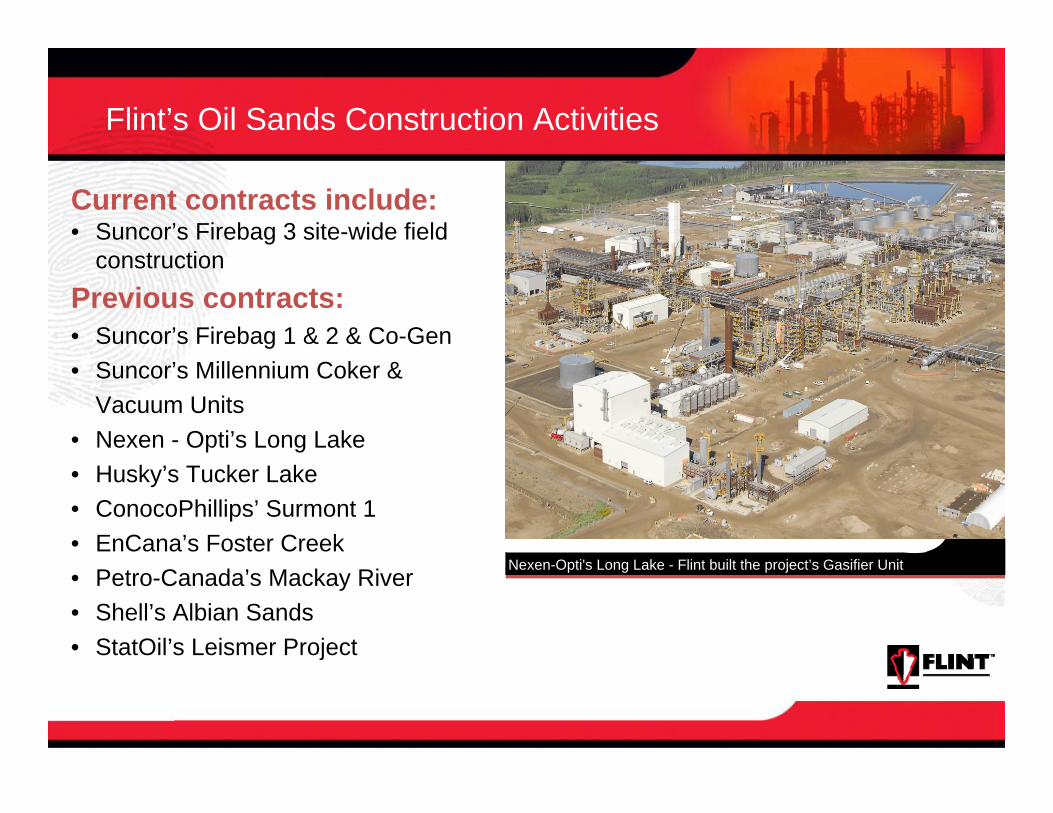
Flint’s Oil Sands Construction Activities
Current contracts include:• Suncor’s Firebag 3 site-wide field
construction Previous contracts:• Suncor’s Firebag 1 & 2 & Co-Gen• Suncor’s Millennium Coker &
Vacuum Units• Nexen - Opti’s Long Lake• Husky’s Tucker Lake• ConocoPhillips’ Surmont 1• EnCana’s Foster Creek• Petro-Canada’s Mackay River• Shell’s Albian Sands• StatOil’s Leismer Project
Nexen-Opti's Long Lake - Flint built the project’s Gasifier Unit

Flint’s Oil Sands Construction Opportunities
0
2
4
6
8
10
12
14
16
18
20
2002 2003 2004 2005 2006 2007 2008 2009 2010 f
Spe
ndin
g ($
bill
ions
)
0
100
200
300
400
500
600
Rev
enue
s ($
mill
ions
)
Oil Sands Capital Spending Facility Infrastructure RevenuesFlint’s Facility Infrastructure revenues have closely tracked oil sands capital spending
Potential additions to backlog:• additional Firebag scope• ConocoPhillips/Total Surmont• Husky – Sunrise• MEG Energy – Christina Lake• additional work at Albian Sands• StatOil Phase 2
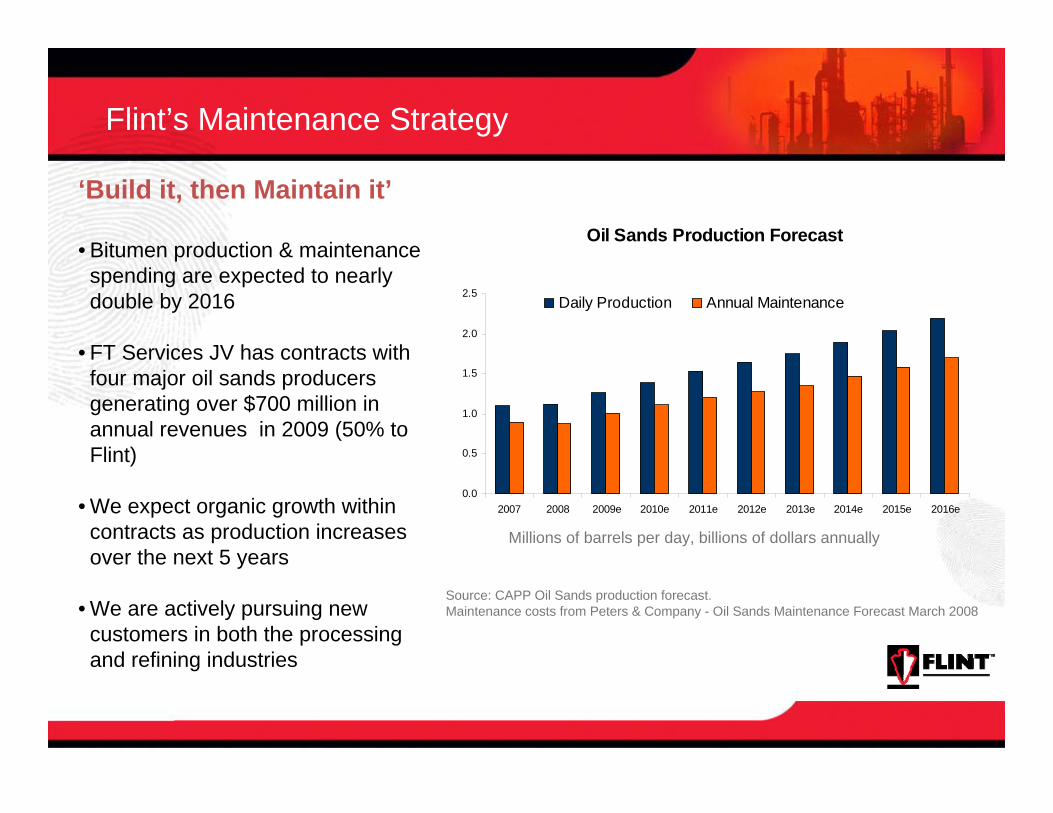
Flint’s Maintenance Strategy
‘Build it, then Maintain it’
• Bitumen production & maintenance spending are expected to nearly double by 2016
• FT Services JV has contracts with four major oil sands producers generating over $700 million in annual revenues in 2009 (50% to Flint)
• We expect organic growth within contracts as production increases over the next 5 years
• We are actively pursuing new customers in both the processing and refining industries
Oil Sands Production Forecast
0.0
0.5
1.0
1.5
2.0
2.5
2007 2008 2009e 2010e 2011e 2012e 2013e 2014e 2015e 2016e
Daily Production Annual Maintenance
Millions of barrels per day, billions of dollars annually
Source: CAPP Oil Sands production forecast.Maintenance costs from Peters & Company - Oil Sands Maintenance Forecast March 2008
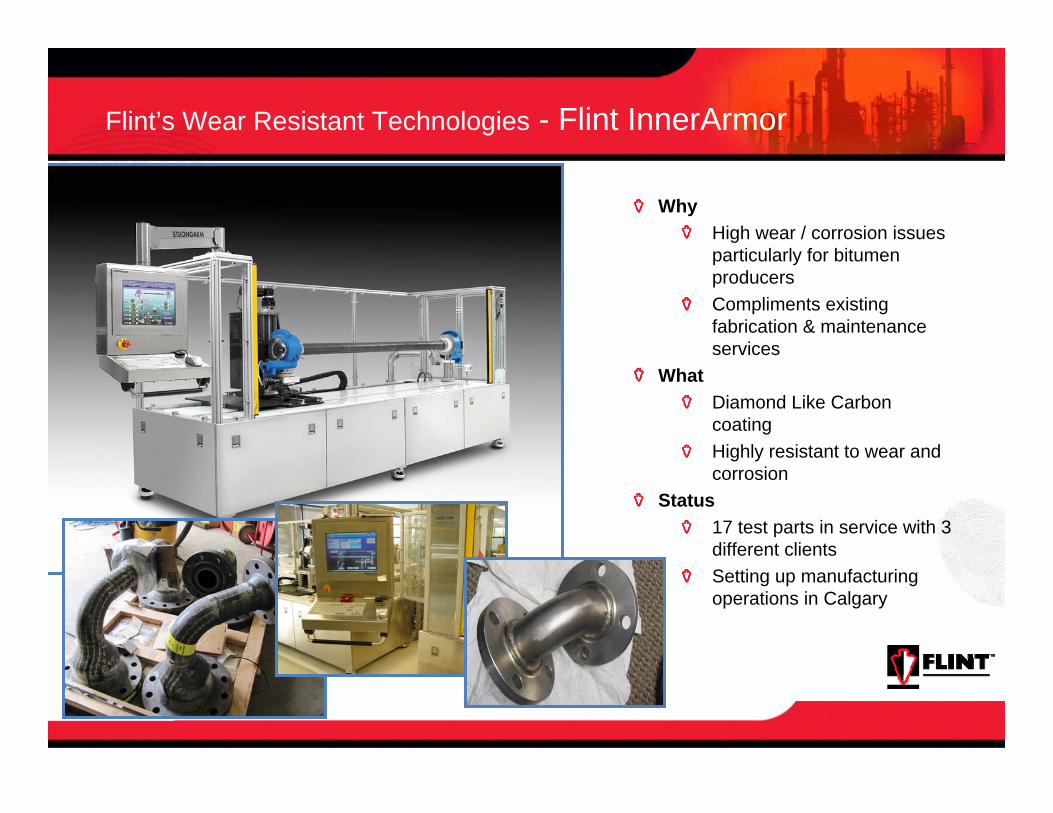
Flint’s Wear Resistant Technologies - Flint InnerArmor
WhyHigh wear / corrosion issues particularly for bitumen producersCompliments existing fabrication & maintenance services
What Diamond Like Carbon coatingHighly resistant to wear and corrosion
Status17 test parts in service with 3 different clientsSetting up manufacturing operations in Calgary

Wear Resistant Technologies – Thermoplastic Elastomer Lining
WhatThermoplastic elastomer lined pipeDevelopment Partnership with DuPont Canada
WhyHydro-slurry pipelines supplying bitumen to the plants and tailings lines have short life cycles and high maintenance costs High level of focus by producersLimited viable solutions available
Status30” elastomer lined test spool for an Oil Sands Producer is ready to install in October 2010

Summary
2010 InitiativesFlint will:• Capture new opportunities/build
backlog • Redeploy capital equipment from
less active areas to more active North American basins
• Reduce costs of delivery to improve operating margins
• Commercialize new technologies• Pursue strategic growth initiatives
77 acre module fabrication yard in Sherwood Park, Alberta

TSX:FESwww.flintenergy.com
Life-Cycle Energy Services - Price-Cycle Profitability
D.A. Davidson & Co.9th Annual Engineering & Construction ConferenceSan Francisco, Sept 28 & 29, 2010
Incomparable TOUGH AND
TRUSTED ™