Flinders In-Pit TSF Groundwater Impact Assessment
59
Flinders In-Pit TSF Groundwater Impact Assessment Report Prepared for Report Prepared by SRK Consulting (Australasia) Pty Ltd FMG007 March 2014
Transcript of Flinders In-Pit TSF Groundwater Impact Assessment

Flinders In-Pit TSF
Groundwater Impact Assessment
Report Prepared for
Report Prepared by
SRK Consulting (Australasia) Pty Ltd
FMG007
March 2014

SRK Consulting Page i
OGIE/HOLM/reay FMG007_Flinders InPit TSF GW Assessment_Rev2.docx 6 March 2014
Flinders In-Pit TSF
Groundwater Impact Assessment
Fortescue Metals Group Ltd Level 2, 87 Adelaide Terrace, East Perth WA 6004
SRK Consulting (Australasia) Pty Ltd
10 Richardson Street, West Perth WA 6005
Tel: 08 9288 2000 Fax: 08 9288 2001
SRK Project Number FMG007
March 2014
Compiled by Peer Reviewed by
Sylvie Ogier-Halim Senior Consultant
David Whiting Principal Consultant Hydrogeology John Chapman Principal Consultant Environment
Email: [email protected]
Authors:
Sylvie Ogier-Halim, Caroline Holmes

SRK Consulting Page ii
OGIE/HOLM/reay FMG007_Flinders InPit TSF GW Assessment_Rev2.docx 6 March 2014
Executive Summary Fortescue Metals Group (FMG) is considering the development of the Flinders in-pit TSF (disposal
into exhausted mining strips FLI_S14 to S19) at the Christmas Creek Mine. SRK has been
appointed to undertake an evaluation of the impact of in-pit disposal below the pre-mining water
table (~ 410 m RL) on the local ground water regime. The objective of the evaluation is to provide
FMG with an opinion on the feasibility of tailings deposition from the base of the pit.
FMG has utilised exhausted pits for tailings disposal at the Christmas Creek operation before, but
tailings disposal in all of these has been above the pre-mining water table (WT). The Flinders in-pit
TSF would be the first to also contain tailings below the WT.
To assess the potential impacts from tailings disposal below the WT, SRK undertook water balance
and salinity load (TDS concentration) modelling using a Dynamic Systems Model (DSM), for three
scenarios:
(i) No backfill (Reference Case);
(ii) Waste rock backfill to WT and tailings backfill above (Permitted Base Case); and
(iii) Complete tailings backfill (Alternative Case).
For the Reference Case (no backfill) the pit void is left open and the modelling results confirm that
a pit lake will form in the void. The pit lake level is predicted to stabilise between 400.8 and 401.8 m
RL for the different climatic scenarios which is well below the regional groundwater elevation (~ 410
m RL). The pit lake should remain a long term groundwater sink as evaporative losses exceed
inputs from runoff, precipitation and groundwater inflows. As a result, the pit water TDS
concentration will increase continually over time. However, the saline pit lake will not impact local
and regional aquifers as the pit will remain a terminal sink. The primary impacts on the groundwater
system will be localised drawdown (i.e. lowering of the water table) and a net loss of about
1.4 Mm3/year which is equivalent to 0.5% of the local groundwater flow through (~ 275 Mm3/year).
No significant impact on the regional groundwater flow and the downstream marsh is therefore
expected.
For the Permitted Base Case (waste rock backfill to WT and tailings backfill above), modelling
results indicate that the water level will rise rapidly and that the waste rock would be inundated as it
is deposited. As soon as the water level in the pit reaches the natural groundwater elevation (~ 410
m RL), the backfilled pit would act as groundwater ‘flow through’ system as the permeability of the
waste rock is very high and exceeds that of the surrounding rock (ranges between 10-4 and 10-3 m/s).
In the absence of increased recharge from the surface, the rate of pore water displacement through
the waste rock would be at the same rate as the local groundwater flow.
In the short term, during waste deposition, the TDS concentrations in the waste rock pore water
would be controlled by the TDS concentrations of the groundwater and the waste rock leaching. In
the longer term, groundwater would displace all of the readily soluble solutes and the pore water
quality would return to local groundwater quality.
During tailing deposition above ~ 410 m RL, seepages would occur at a rapid rate through the pit
walls to the underlying groundwater system. Tailings pore water will also be released through the
contact between the tailings and waste rock backfill. The seepage rates from the pond will be
dictated by the pond elevation and the permeability of the disturbed/blast damaged pit wall, while
seepage rates from the tailings will be driven by the phreatic surface elevation within the tailings, and
the low permeability of the tailings (k ~ 10-9 m/s). This will cause local mounding of the water table
(in the immediate surrounds of the pit) and an increase in groundwater flow.

SRK Consulting Page iii
OGIE/HOLM/reay FMG007_Flinders InPit TSF GW Assessment_Rev2.docx 6 March 2014
At completion of tailings deposition, the modelling results indicate that the groundwater would be
mounded within the tailings due to their low permeability. The raised phreatic surface would
dissipate over a long time (decades to centuries).
The TDS concentration in the tailings pore water would be controlled mainly by the tailings
supernatant water quality (TDS ~ 6,400 mg/L). The TDS of the tailings pore water is well below that
of the local groundwater (10,000 < TDS < 70,000 mg/L). The tailing seepage rates post-deposition
(< 1,000 m3/year) would be less than 0.01 % of the groundwater flow through the waste rock
(about 275 Mm3/year) underlying the tailings. As a result, no impact on the regional groundwater
flow would occur. The seepage would lower the TDS (i.e. provide dilution), however, this would be
insignificant due to the low flow rates. No net impact on the local and regional groundwater system
is indicated.
For the Alternative Case (complete tailings backfill) the pit would be backfilled with tailings to
424 m RL (0.5 m below the lowest pit rim elevation) and the backfilled void would no longer act as a
groundwater sink. Seepage would occur only once tailings deposition exceeds the regional
pre-mining groundwater elevation (~ 410 m RL). Once the regional water table is re-established,
groundwater flows would tend to flow around the tailings deposit rather than through it due to the
significantly lower permeability of the tailings when compared to the surrounding rock. Flows
through the tailings would be expected to be about 2,800 m3/year.
At the completion of tailings deposition, as for the partial tailings backfill case, the modelling results
indicate that the water table will be mounded locally within the tailings deposit. The mound would be
expected to dissipate over a long time (decades to centuries).
Prior to deposition, the quality of the pit water would be controlled by groundwater inflow (10,000 <
TDS < 70,000 mg/L). Once tailings deposition commences, the TDS will decrease to that of the
tailings supernatant (TDS ~ 6,400 mg/L).
For the tailings below the regional water table, due to the slow rate of water displacement, no
significant change in the tailings pore water TDS would be expected to occur within the timeframe of
the modelling. However, as described for the previous case, seepage would occur at a rapid rate
through the pit wall rocks to the underlying groundwater system. The seepage rates from the pond
will be dictated by the pond elevation and the permeability of the disturbed/blast damaged pit wall.
The net impact on groundwater elevations and flows, and groundwater quality would be
indistinguishable from that predicted for the partial waste rock backfill case.
At the regional scale, the groundwater flow will not be detrimentally affected and no change in water
quality (i.e. TDS concentration) of the local and regional groundwater system is expected to occur.
No impact on the downstream marsh is therefore expected.
It is the opinion of SRK that the consequences of the Alternative Case (complete tailings backfill) of
the Flinders pit would be indistinguishable from the partial backfill option (i.e. permitted base case)
and should not have any significant impacts on the regional groundwater system and its groundwater
dependant ecosystems (e.g. the downstream marsh).

SRK Consulting Page iv
OGIE/HOLM/reay FMG007_Flinders InPit TSF GW Assessment_Rev2.docx 6 March 2014
Table of Contents
1 Introduction ..................................................................................................................... 1
2 Study Approach .............................................................................................................. 2
3 Pit Water Balance Model ................................................................................................ 3
4 Model Inputs ................................................................................................................... 6
4.1 Water balance .................................................................................................................................. 6
4.1.1 Pit geometry .......................................................................................................................... 6
4.1.2 Climate data .......................................................................................................................... 8
4.1.3 Surface water inflow .............................................................................................................. 9
4.1.4 Groundwater inflow ............................................................................................................... 9
4.1.5 Groundwater outflow ........................................................................................................... 10
4.1.6 Backfill inflow ...................................................................................................................... 11
4.2 Total dissolved solid ....................................................................................................................... 11
4.2.1 Precipitation ........................................................................................................................ 11
4.2.2 Pit wall runoff ...................................................................................................................... 11
4.2.3 Backfilled tailings ................................................................................................................ 13
4.2.4 Groundwater inflow ............................................................................................................. 13
5 Water Balance and TDS Concentration Results ....................................................... 15
5.1 Scenario 1 - Reference case (no backfill) ....................................................................................... 15
5.2 Scenario 2 - Permitted base case (waste rock backfill to WT, tailings above) ................................ 18
5.3 Scenario 3 - Alternative case (complete tailings backfill) ................................................................ 22
6 Impacts on Groundwater Regime and Mitigation Measures ................................... 25
6.1 Scenario 1 - Reference case (no backfill) ....................................................................................... 25
6.2 Scenario 2 - Permitted base case (waste rock backfill to WT, tailings above) ................................ 25
6.3 Scenario 3 - Alternative case (complete tailings backfill) ................................................................ 25
7 Concluding Remarks ................................................................................................... 26
8 References .................................................................................................................... 27

SRK Consulting Page v
OGIE/HOLM/reay FMG007_Flinders InPit TSF GW Assessment_Rev2.docx 6 March 2014
List of Tables Table 4-1: Monthly average precipitation (mm) ........................................................................................... 8
Table 4-2: Monthly average pan evaporation (mm) .................................................................................... 9
Table 4-3: Summary of groundwater inflow estimations versus elevation ................................................. 10
Table 4-4: Tailings porosity for different dry density .................................................................................. 11
Table 4-5: Average, minimum and maximum EC and TDS values recorded for Flinders Pit monitoring and production wells ................................................................................................................ 13
Table 5-1: Final pit lake levels and equilibrium times ................................................................................ 16
Table 5-2: Simulated water balance at steady state conditions (100 year simulation) .............................. 17
Table 5-3: Waste rock and tailing deposition time, phreatic surface elevation and equilibrium times ........ 18
Table 5-4: Tailing deposition time, phreatic surface elevation and equilibrium times ................................ 22
List of Figures Figure 3-1: Conceptual hydrologic model for reference case (no backfill) .................................................... 4
Figure 3-2: Conceptual hydrologic model for permitted base case (waste rock and tailings backfill) ........... 4
Figure 3-3: Conceptual hydrologic model for alternative case (tailings backfill only) .................................... 5
Figure 4-1: Change in pit surface area versus elevation .............................................................................. 7
Figure 4-2: Change in pit volume versus elevation ...................................................................................... 7
Figure 4-3: pH, EC, alkalinity and TDS of the sample leachates from WRD and tailings ........................... 12
Figure 4-4: 2013 OPF EC record ............................................................................................................... 14
Figure 5-1: Simulated pit lake elevation for 50 year period ........................................................................ 15
Figure 5-2: Simulated water balance for first 10 years (reference case) .................................................... 16
Figure 5-3: TDS concentration for 100 year simulation (reference case) ................................................... 17
Figure 5-4: Pit water level, tailing level, pit water volume and tailing volume for 10 year simulation (permitted base case) .............................................................................................................. 18
Figure 5-5: Pit water level, tailing level, pit water volume and tailing volume for 100 year simulation (permitted base case) .............................................................................................................. 19
Figure 5-6: Transient relationships between water balance components for 10 year simulation (permitted base case) .............................................................................................................. 19
Figure 5-7: Simulated TDS concentration in saturated waste rock for 100 year simulation (permitted base case) ............................................................................................................................... 21
Figure 5-8: Simulated TDS concentration in tailing pore water for 100 year simulation (permitted base case) ........................................................................................................................................ 21
Figure 5-9: Pit water level, tailing level and pit water volume for 20 year simulation (alternative case) ...... 22
Figure 5-10: Pit water level, tailing level, pit water volume and tailing volume for 100 year simulation (alternative case) ..................................................................................................................... 23
Figure 5-11: Transient relationships between water balance components for first 20 years of simulation (alternative case) ..................................................................................................................... 23
Figure 5-12: TDS concentration for 100 year simulation (alternative case) .................................................. 24

SRK Consulting Page vi
OGIE/HOLM/reay FMG007_Flinders InPit TSF GW Assessment_Rev2.docx 6 March 2014
List of Appendices Appendix A: Rainfall Sequences
Appendix B: Water Balance and TDS Concentration Summary Results
Appendix C: Electronic Data

SRK Consulting Page vii
OGIE/HOLM/reay FMG007_Flinders InPit TSF GW Assessment_Rev2.docx 6 March 2014
Disclaimer The opinions expressed in this Report have been based on the information supplied to SRK
Consulting (Australasia) Pty Ltd (SRK) by Fortescue Metals Group Ltd (FMG). The opinions in this
Report are provided in response to a specific request from FMG to do so. SRK has exercised all
due care in reviewing the supplied information. Whilst SRK has compared key supplied data with
expected values, the accuracy of the results and conclusions from the review are entirely reliant on
the accuracy and completeness of the supplied data. SRK does not accept responsibility for any
errors or omissions in the supplied information and does not accept any consequential liability arising
from commercial decisions or actions resulting from them. Opinions presented in this Report apply
to the site conditions and features as they existed at the time of SRK’s investigations, and those
reasonably foreseeable. These opinions do not necessarily apply to conditions and features that
may arise after the date of this Report, about which SRK had no prior knowledge nor had the
opportunity to evaluate.

SRK Consulting Page viii
OGIE/HOLM/reay FMG007_Flinders InPit TSF GW Assessment_Rev2.docx 6 March 2014
List of Abbreviations Abbreviation Meaning
BCM Billion cubic metres
BOM Bureau of Meteorology
CR Runoff coefficient
DSM Dynamic Systems Model
EC Electrical Conductivity
FEFLOW Groundwater modelling software
FMG Fortescue Metals Group Ltd
TSF Tailings Storage Facility
GoldSim Monte Carlo simulation software
GW Groundwater
K Hydraulic conductivity
kPa kilopascal
L Litre
L/s litres per second
m metre
m bgl metres below ground level
m3 Square metres
m3/mon Cubic metres per month
m3/year Cubic metres per annum
mg/kg/month Milligram per kilogram per month
mg/L Milligram per litre
mm millimetre
ml millilitre
m RL metres reduced level
M Million
NAF Non-acid forming
m/s Metre per second
OPF Ore processing facility
SRK SRK Consulting (Australasia) Pty Ltd
SG Specific gravity
TDS Total dissolved solid
TSF Tailings Storage Facility
t/m3 Tonne per cubic metre
us/cm Microsiemens per centimetre
UC Uncertain acid potential
WT Water table

SRK Consulting Page 1
OGIE/HOLM/reay FMG007_Flinders InPit TSF GW Assessment_Rev2.docx 6 March 2014
1 Introduction Fortescue Metals Group Ltd (FMG) appointed SRK Consulting (Australasia) Pty Ltd (SRK) to provide
a short- to medium-term (5 to 10 year) tailings storage strategy for its Christmas Creek operation in
the Pilbara region of Western Australia.
Christmas Creek currently operates two ore processing facilities each with a dedicated Tailings
Storage Facility (TSF). The Vasse In-pit/paddock TSF services Ore Processing Facility 1 (OPF1)
and the Windich In-pit TSF1 (strips 8 and 9) receive tailings from Ore Processing Facility 2 (OPF2).
Additional facilities will be required once the Vasse and Windich TSFs have reached capacity. SRK
identified the development of the Flinders In-pit TSF (disposal into exhausted mining strips FLI_S14
to S19) as the preferred short - to medium-term tailings storage option for OPF1 (i.e. alternate for the
Vasse TSF). This option is subject to further evaluation which is primarily related to the impact of
in-pit disposal on the local ground water regime.
FMG is currently utilising exhausted pits for tailings disposal at the Christmas Creek operation, but
deposition occurs from above the pre-mining water table only. The Flinders In-pit TSF would be the
first partially filled below the water table.
The evaluation scope includes the confirmation of the extent of the groundwater rebound based on
current mining and production schedules, the prediction of the groundwater recovery with tailings
deposition from the base of the pit and the potential impacts and mitigation measures required. The
objective of the evaluation is to provide FMG with an opinion on the feasibility of developing an in-pit
facility with tailings deposition from the base of the pit by assessing the potential impacts for the
backfilling options. An assessment of the reference case (no backfill) was also completed to
determine potential benefits/disadvantages of each option.

SRK Consulting Page 2
OGIE/HOLM/reay FMG007_Flinders InPit TSF GW Assessment_Rev2.docx 6 March 2014
2 Study Approach An indicative assessment of the post-mining pit lake formation (i.e. reference case) has been
conducted as part of the evaluation of the Flinders In-pit TSF options evaluation. This assessment is
based on the results from the regional groundwater model developed by FMG in 2012 (FMG, 2012)
for the Christmas Creek Project.
The groundwater inflows derived from the groundwater model were used to evaluate the potential
groundwater inflow to the Flinders pit lake and water level rebound following mine closure.
Once mining activities cease, dewatering of the open pit will be terminated and the local water table
will rebound from its operational, drawdown (lowered) condition. Water from the surrounding aquifer
and direct precipitation will report to the pit void and a lake will begin to form in the bottom of the
open pit.
The rate at which the various water sources report to the pit will change over time. A Dynamic
Systems Model (DSM) developed in GoldSim™ has been used to simulate the rates of inflow of the
various hydrologic components of the pit over time.
The objectives of the model were to predict:
The post-closure pit water balance over time with and without waste rock backfill and/or
tailings deposition; and
Total dissolved solid (TDS) concentrations in the pit void over time with and without waste rock
backfill and/or tailings deposition.
Three scenarios were considered as follows:
Scenario 1 Leaving the pit as open pit void at closure (reference case).
Scenario 2 Backfilling with waste rock to pre-mining water level (~ 410 m RL) and tailings above
(permitted base case).
Scenario 3 Backfilling from the base of the pit with tailings only (alternative case).
The rise of water level in the pit void would take time to reach its steady state level. Therefore
modelling water inflow over time has been simulated using a series of discreet time steps
(i.e. months).
The following sections outline i) the hydrological and TDS load components derived for the post-
closure pit water balance, ii) the model set-up and iii) summarise the results of the simulations.

SRK Consulting Page 3
OGIE/HOLM/reay FMG007_Flinders InPit TSF GW Assessment_Rev2.docx 6 March 2014
3 Pit Water Balance Model During the post-closure stage of the project, a lake is expected to form in the pit void. The rate of pit
filling and the ultimate level of the pit lake will be controlled by the post-closure water balance.
A conceptual post-closure water balance is as follows:
Change in pit lake volume over time =∑ inflows – ∑(outflows and losses)
which can be expressed as:
pit lake volume = Pprecip + Rrunoff + GWinflow - Epit - BDep
Where:
Pprecip is the inflow from direct precipitation falling on the surface of the lake (m3/time step).
Rrunoff is the inflow from surface runoff consisting of a) upgradient drainage and b) pit wall runoff
(the fraction of precipitation falling on the pit walls that ultimately reports to the pit lake).
GWinflow is the groundwater inflow to the pit lake (m3/time step) and is positive when the water
level of the lake is below the local water table, zero when it is at the same elevation, and
becomes negative (i.e. outflow) when the level rises above the local water table. (Note that
density effects have not been considered herein.).
Epit is the open water evaporation from the pit lake surface based on a modified pan evaporation
rate applied to the pit lake surface area (m3/time step).
BDep is the total volume of backfilled deposited in the pit (m3/timestep).
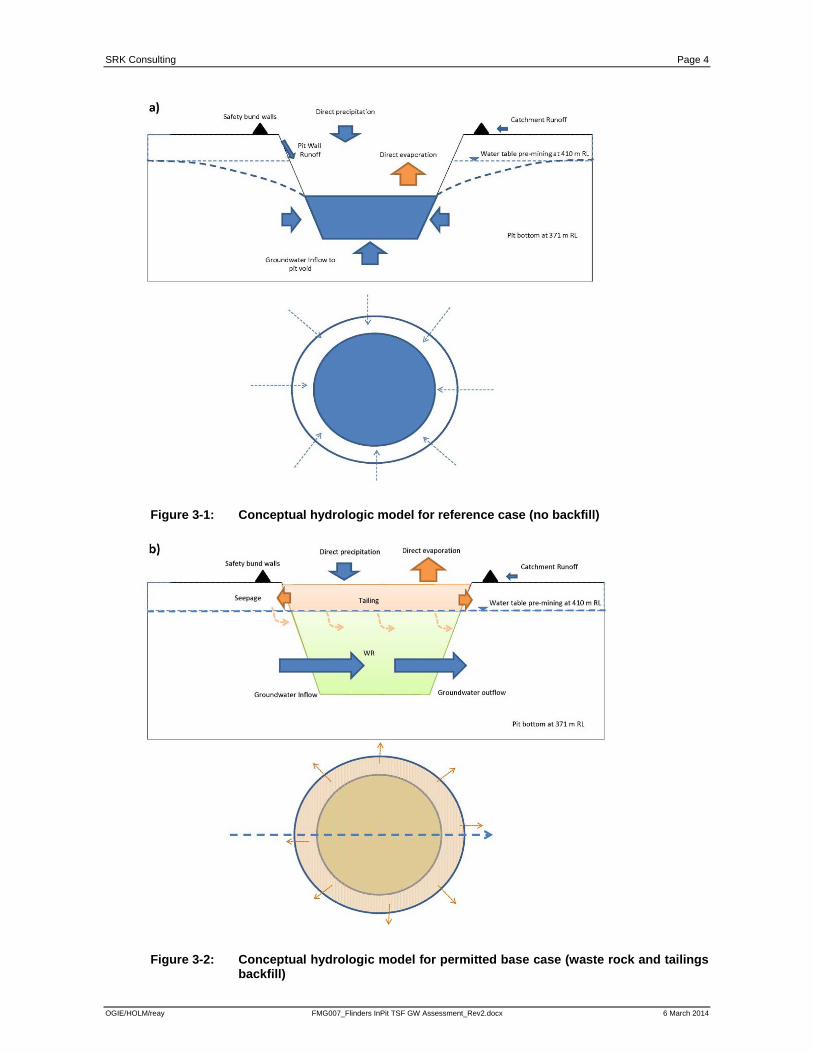
Figure 3-1 to Figure 3-3 presents the interaction between the hydrological components of the
conceptual water balance of the Flinders Pit with and without backfill deposition.
SRK Consulting Page 4
OGIE/HOLM/reay FMG007_Flinders InPit TSF GW Assessment_Rev2.docx 6 March 2014
Figure 3-1: Conceptual hydrologic model for reference case (no backfill)
Figure 3-2: Conceptual hydrologic model for permitted base case (waste rock and tailings backfill)
SRK Consulting Page 5
OGIE/HOLM/reay FMG007_Flinders InPit TSF GW Assessment_Rev2.docx 6 March 2014
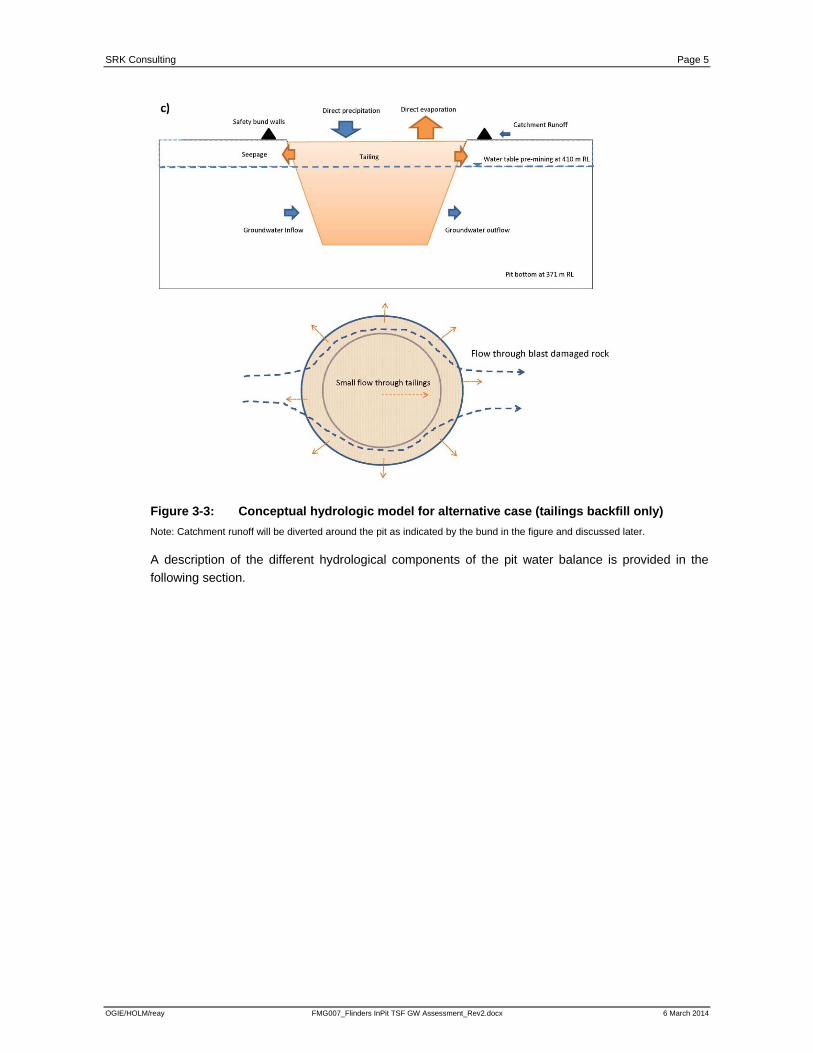
Figure 3-3: Conceptual hydrologic model for alternative case (tailings backfill only)
Note: Catchment runoff will be diverted around the pit as indicated by the bund in the figure and discussed later.
A description of the different hydrological components of the pit water balance is provided in the
following section.

SRK Consulting Page 6
OGIE/HOLM/reay FMG007_Flinders InPit TSF GW Assessment_Rev2.docx 6 March 2014
4 Model Inputs A simple dynamic system computer model for the anticipated Flinders pit was developed in
GoldSim™ to predict the post-closure pit water balance and TDS concentration over time. Each
hydrological component of the pit water balance model was incorporated into the DSM; the
components were organised in different modules:
Pit geometry
Climate data
Surface water inflow
Groundwater inflow
Groundwater outflow
Tailings inflow
The DSM includes only deterministic (fixed) parameters. The model was allowed to run for a
100 year period. In this water balance, monthly time steps were chosen to calculate the changes in
the volume of the pit water.
4.1 Water balance
4.1.1 Pit geometry
The pit geometry was simulated with lookup tables of the mine pit elevation versus area and volume
that were based on the final pit geometry supplied by FMG (referred to as “FLI_14-
19_BOSM_SURFACE”.dxf).
In the simulation, the base of the Flinders Pit was cut at 371 m RL, as a potential mine out and
because the groundwater inflow estimates below 371 m RL may be overestimated. The topology of
the Flinders Pit was used to calculate the pit volume and pit area for each pit water level stage using
Rift TD software. The relationships used in the model between pit water level versus pit area and
elevation versus water volume capacity are shown in in Figure 4-1 and Figure 4-2 respectively. It
can be seen from these plots that the relationship is not linear due to the irregular shape of the open
pit.

SRK Consulting Page 7
OGIE/HOLM/reay FMG007_Flinders InPit TSF GW Assessment_Rev2.docx 6 March 2014
Figure 4-1: Change in pit surface area versus elevation
Figure 4-2: Change in pit volume versus elevation

SRK Consulting Page 8
OGIE/HOLM/reay FMG007_Flinders InPit TSF GW Assessment_Rev2.docx 6 March 2014
4.1.2 Climate data
Simulated rainfall sequences (base case, wet case and dry case) and average monthly evaporation
data were used as inputs in the model (deterministic values).
Direct precipitation to the lake
Precipitation which falls directly onto the lake surface will contribute to the pit water balance.
Monthly average precipitation values from the Newman (Bureau of Meteorology (BOM) station 7176)
climate station are presented in Table 4-1.
Table 4-1: Monthly average precipitation (mm)
Month Precipitation (mm)
January 57.2
February 77
March 40.7
April 19.6
May 18.1
June 14.2
July 14.9
August 7.7
September 3.4
October 4.9
November 10.5
December 37.4
Annual 310.1
Newman (BOM station 7176) climate station (1994-2010)
Most of the summer precipitation is from scattered thunderstorms and occasional tropical cyclones
(FMG, 2012).
Rainfall data from the Newman weather station (Bureau of Meteorology (BOM) station 7176) dating
back to 1971 were used to create three rainfall sequences representing average, wet and dry rainfall
climatic scenarios, respectively. They were used in the regional numerical groundwater flow model
developed by FMG (2012). The three rainfall sequences are provided in Appendix A while method
to generate the synthetic rainfall sequences is provided in the Hydrogeological Assessment Report
for Christmas Creek Life of Mine Water Management Scheme (FMG, 2012). For consistency, the
same rainfall sequences were applied in this study (i.e. base case, dry case and wet case).
Direct precipitation to the lake was calculated for each time step as multiplying the rate of
precipitation by the surface area of the lake.
Evaporation
Direct evaporation from the pit lake surface is the primary cause of water loss. Pan evaporation was
extracted from the BOM 1961-1990 spatial evaporation dataset (Table 4-2; FMG, 2012).
The quantity of water lost to the atmosphere via evaporation is proportional to the area of the pit lake
and varies with time. As indicated in Table 4-2, total annual average evaporation (3,038 mm;
Table 4-2) exceeds the annual average rainfall (310 mm; Table 4-1) by a factor of 10.

SRK Consulting Page 9
OGIE/HOLM/reay FMG007_Flinders InPit TSF GW Assessment_Rev2.docx 6 March 2014
The monthly average pan evaporation is converted to a lake evaporation using a coefficient to
account for the fact that an evaporation pan has far less heat-storage capacity (i.e. shallow depth of
water compared to pit lake). A common value for converting pan evaporation to lake evaporation is
0.7 (Kohler and Parmele, 1967). In the FMG report (2012), a coefficient of 0.75 was used to convert
pan evaporation to lake evaporation when water level was at or above the Fortescue Marsh land
surface. For consistency, the same factor (i.e. 0.75) was applied in this study.
Table 4-2: Monthly average pan evaporation (mm)
Month Pan Evaporation (mm)
January 390
February 310
March 290
April 205
May 138
June 100
July 110
August 165
September 230
October 315
November 380
December 405
Annual 3,038
Extracted from BOM 1961-1990 spatial Evaporation dataset
4.1.3 Surface water inflow
Upgradient runoff According to FMG, surface water runoff from upgradient catchment areas or existing drainages will
be diverted away from the pit. Therefore, no upgradient drainage runoff was incorporated into the
model.
Pit wall runoff
A portion of the precipitation which falls in the pit area will fall on pit walls and contribute to the
development of the pit lake/pond as wall runoff. The amount of runoff depends on temperature,
precipitation rate and duration (on individual storm basis), soil saturation and local slope gradient.
The volume of wall runoff which enters the pit will be proportional to the total area of exposed wall
rock and the precipitation. The contribution of the pit wall runoff to the pit lake/pond will decrease
over time as the water level rises.
The runoff coefficient (ratio between surface runoff to the lake and rainfall over the area) can vary
between 0.25 and 1; it is highly time-variable and uncertain. Runoff coefficients of 0.25 and 1 were
used.
4.1.4 Groundwater inflow
A regional numerical groundwater flow model was developed by FMG (2012) in FEFLOW. The
model simulates dewatering and post-mining pit filling based on the Christmas Creek mine LoM 8.4
plan, July 2011 (Internal Reference Number CC_i8.4b_55Mtpa_LOM_Sequence). The numerical
model set up and results are explained in detail in the FMG report (2012).
SRK Consulting Page 10
OGIE/HOLM/reay FMG007_Flinders InPit TSF GW Assessment_Rev2.docx 6 March 2014
Groundwater inflow will vary as the water level rises since it is a function of the hydraulic gradient
between the pre-mining regional groundwater levels and water level in the pit (or below the pit during
operations). The highest inflows are expected to occur at cessation of mining during the initial
recovery in groundwater levels, when the hydraulic gradient will be at a maximum. The groundwater
inflows will be controlled by aquifer hydraulic conductivity, pressure head and storage.
The pre-mining water table in the area of the pit was at ~410 m RL while the final pit floor is
estimated at ~ 371 m RL.
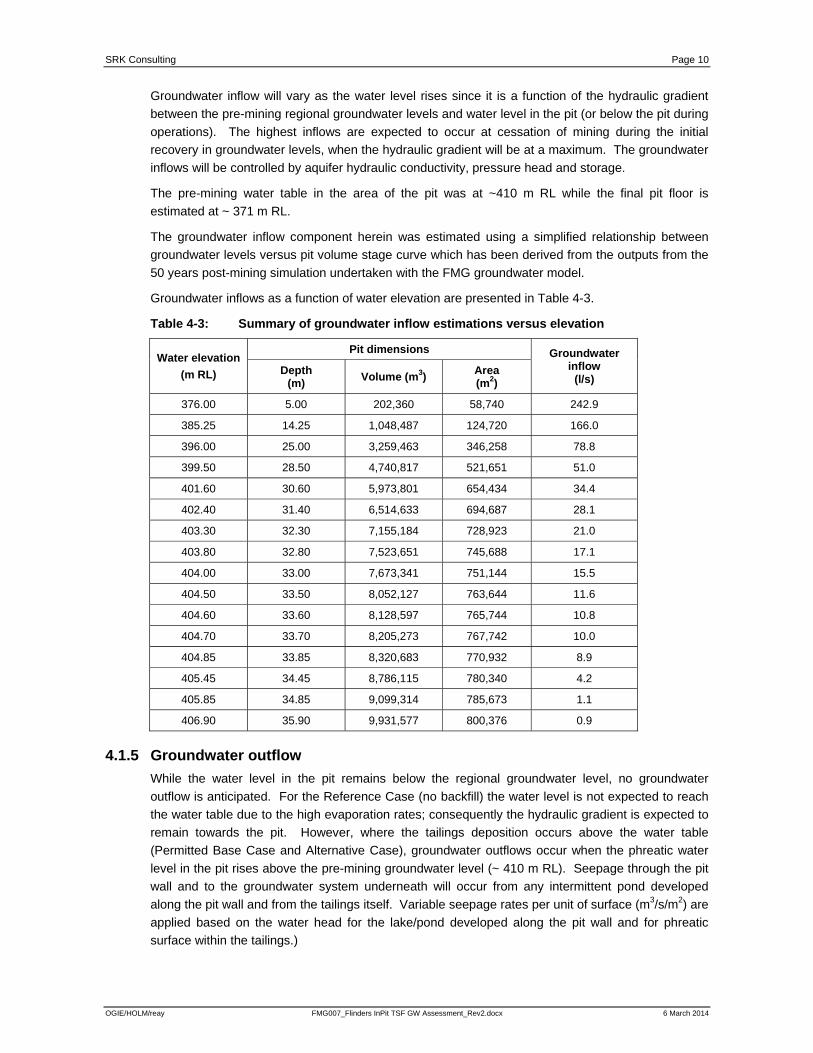
The groundwater inflow component herein was estimated using a simplified relationship between
groundwater levels versus pit volume stage curve which has been derived from the outputs from the
50 years post-mining simulation undertaken with the FMG groundwater model.
Groundwater inflows as a function of water elevation are presented in Table 4-3.
Table 4-3: Summary of groundwater inflow estimations versus elevation
Water elevation
(m RL)
Pit dimensions Groundwater inflow
(l/s) Depth
(m) Volume (m3)
Area (m2)
376.00 5.00 202,360 58,740 242.9
385.25 14.25 1,048,487 124,720 166.0
396.00 25.00 3,259,463 346,258 78.8
399.50 28.50 4,740,817 521,651 51.0
401.60 30.60 5,973,801 654,434 34.4
402.40 31.40 6,514,633 694,687 28.1
403.30 32.30 7,155,184 728,923 21.0
403.80 32.80 7,523,651 745,688 17.1
404.00 33.00 7,673,341 751,144 15.5
404.50 33.50 8,052,127 763,644 11.6
404.60 33.60 8,128,597 765,744 10.8
404.70 33.70 8,205,273 767,742 10.0
404.85 33.85 8,320,683 770,932 8.9
405.45 34.45 8,786,115 780,340 4.2
405.85 34.85 9,099,314 785,673 1.1
406.90 35.90 9,931,577 800,376 0.9
4.1.5 Groundwater outflow
While the water level in the pit remains below the regional groundwater level, no groundwater
outflow is anticipated. For the Reference Case (no backfill) the water level is not expected to reach
the water table due to the high evaporation rates; consequently the hydraulic gradient is expected to
remain towards the pit. However, where the tailings deposition occurs above the water table
(Permitted Base Case and Alternative Case), groundwater outflows occur when the phreatic water
level in the pit rises above the pre-mining groundwater level (~ 410 m RL). Seepage through the pit
wall and to the groundwater system underneath will occur from any intermittent pond developed
along the pit wall and from the tailings itself. Variable seepage rates per unit of surface (m3/s/m2) are
applied based on the water head for the lake/pond developed along the pit wall and for phreatic
surface within the tailings.)

SRK Consulting Page 11
OGIE/HOLM/reay FMG007_Flinders InPit TSF GW Assessment_Rev2.docx 6 March 2014
4.1.6 Backfill inflow
Tailings Deposition
Based on the average production rate for the current mine plan, the tailings deposition rate is
estimated at 270,000 dry tonnes per month.
Geotechnical testing undertaken for the Windich In-Pit TSF (Golder Associates, 2012) indicates that
the tailings permeability range is estimated between 1.5 x 10⁻⁹ and 7.5 x 10⁻⁹ m/s, and that the
tailings are likely to achieve a settle dry density of 1.1 t/m3 upon initial deposition, increasing to a
maximum of 2 t/m³ under a load of ~ 600 kPa. The solids Specific Gravity (SG) is 3.8.
For the purpose of the modelling it was assumed that a settled dry density of 1.1 t/m3 will be
achieved on deposition increasing to average settled dry density of 1.5 t/m3 after deposition. If the
tailings remain saturated, the calculated corresponding tailings porosity values are provided in
Table 4-4.
Table 4-4: Tailings porosity for different dry density
Scenario Settled dry density
(t/m3) Porosity of
saturated tailings
Immediately on deposition 1.1 0.7
Average after deposition 1.5 0.6
Waste rock deposition
Based on a waste placement rate of 600 k BCMs per month, the waste rock deposition rate is
estimated at 780,000 m3 per month, assuming a swelling factor of 30%. A porosity of 40% was used
for modelling purposes.
4.2 Total dissolved solid The concentrations of chemical constituents in the pit represent the combined effects of geochemical
and hydrological processes acting in the system. Total dissolved solid (TDS) is added to the pit from
component inflow inputs. TDS concentration for any given constituent is calculated conservatively
as the product of the flux of water into the pit lake and the TDS concentration in the water source.
Each of the Flinders Pit hydrological components has an associated chemical mass loading
component. In the model, the source waters with their respective TDS concentrations were mixed
together according to their relative proportions. The methods used to define the TDS concentration
associated with each of the hydrological components are described in the following sections.
4.2.1 Precipitation
Incident rainfall can be considered as “distilled water” with negligible solute concentrations and as
such does not introduce any TDS concentration to the system.
4.2.2 Pit wall runoff
Runoff from the pit walls will dissolve chemical mass from the wall rocks. The quality of the total wall
runoff will be proportional to the exposed areas of the various rock types in the pit wall. The TDS
contribution from the wall runoff would be expected to decrease with time, as the pit filling
progresses and less wall rock is above the pit lake or the backfilling, and as reactive mineral phases
on the wall rocks are depleted.
SRK Consulting Page 12
OGIE/HOLM/reay FMG007_Flinders InPit TSF GW Assessment_Rev2.docx 6 March 2014
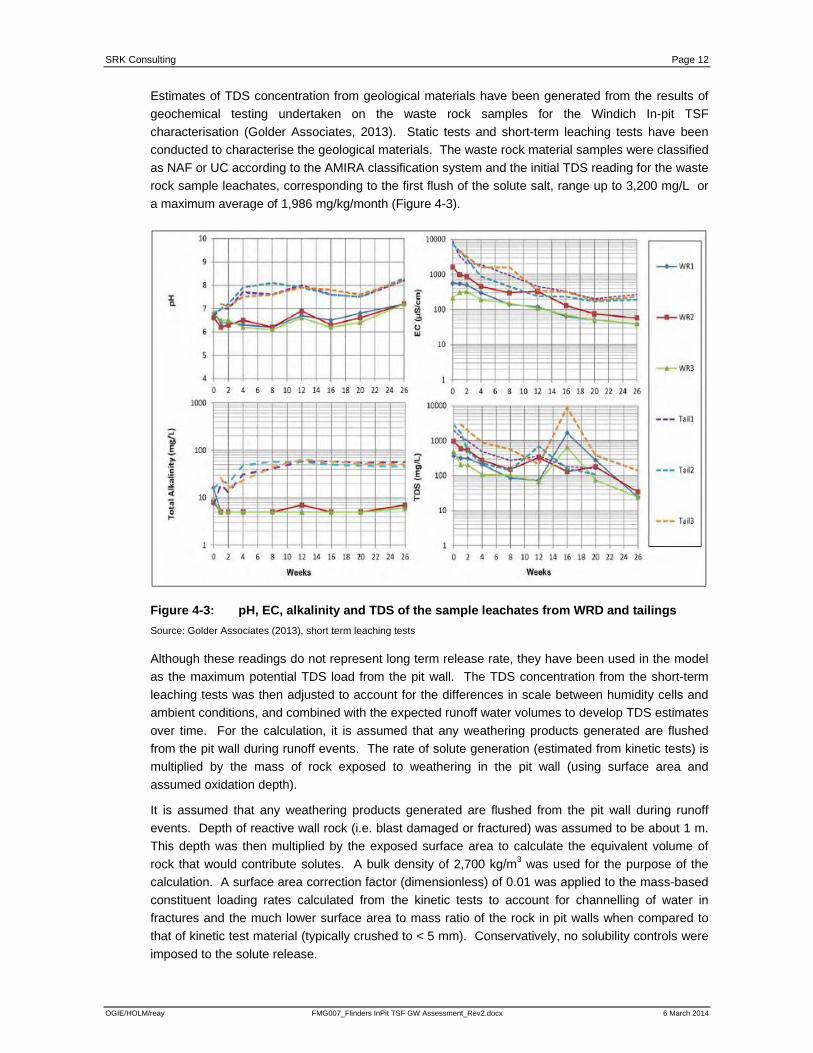
Estimates of TDS concentration from geological materials have been generated from the results of
geochemical testing undertaken on the waste rock samples for the Windich In-pit TSF
characterisation (Golder Associates, 2013). Static tests and short-term leaching tests have been
conducted to characterise the geological materials. The waste rock material samples were classified
as NAF or UC according to the AMIRA classification system and the initial TDS reading for the waste
rock sample leachates, corresponding to the first flush of the solute salt, range up to 3,200 mg/L or
a maximum average of 1,986 mg/kg/month (Figure 4-3).
Figure 4-3: pH, EC, alkalinity and TDS of the sample leachates from WRD and tailings
Source: Golder Associates (2013), short term leaching tests
Although these readings do not represent long term release rate, they have been used in the model
as the maximum potential TDS load from the pit wall. The TDS concentration from the short-term
leaching tests was then adjusted to account for the differences in scale between humidity cells and
ambient conditions, and combined with the expected runoff water volumes to develop TDS estimates
over time. For the calculation, it is assumed that any weathering products generated are flushed
from the pit wall during runoff events. The rate of solute generation (estimated from kinetic tests) is
multiplied by the mass of rock exposed to weathering in the pit wall (using surface area and
assumed oxidation depth).
It is assumed that any weathering products generated are flushed from the pit wall during runoff
events. Depth of reactive wall rock (i.e. blast damaged or fractured) was assumed to be about 1 m.
This depth was then multiplied by the exposed surface area to calculate the equivalent volume of
rock that would contribute solutes. A bulk density of 2,700 kg/m3 was used for the purpose of the
calculation. A surface area correction factor (dimensionless) of 0.01 was applied to the mass-based
constituent loading rates calculated from the kinetic tests to account for channelling of water in
fractures and the much lower surface area to mass ratio of the rock in pit walls when compared to
that of kinetic test material (typically crushed to < 5 mm). Conservatively, no solubility controls were
imposed to the solute release.
SRK Consulting Page 13
OGIE/HOLM/reay FMG007_Flinders InPit TSF GW Assessment_Rev2.docx 6 March 2014
4.2.3 Backfilled tailings
Estimates of TDS concentration from tailings materials were obtained from geochemical testing
undertaken on tailings samples (Golder Associates, 2013). Static tests and short-term leaching tests
have been conducted to characterize the tailings. The tailings solids were classified as NAF
according to the AMIRA classification system and are not expected to be acid generating in the long
term. The TDS concentrations for the initial flush, which in general were the most elevated, were
used to estimate the TDS release from the tailings solids.
The TDS concentrations for the first flush from the tailings were as high as 3,200 mg/L or a
maximum average of 3,620 mg/kg/month. Although, these readings do not represent long term
release rate, they have been used in the model as the maximum potential TDS concentrations that
can be released from the tailings. The rate of solute generation (estimated by kinetic test in units of
mg/kg/month) was multiplied by the quantity of tailings present in the backfilling above the phreatic
surface. Only the non-saturated tailings, exposed to oxidising conditions, would be expected to
generate solutes.
According to the 2013 OPF EC record (Figure 4-4) and the leached concentration of the Christmas
Creek tailings samples (Tetra Tech, 2013), the tailings supernatant water is approximately 10,000
us/cm or about 6,400 mg/L. The rate of solute generation was obtained by multiplying the
concentration with the quantity of supernatant discharged from the facility.
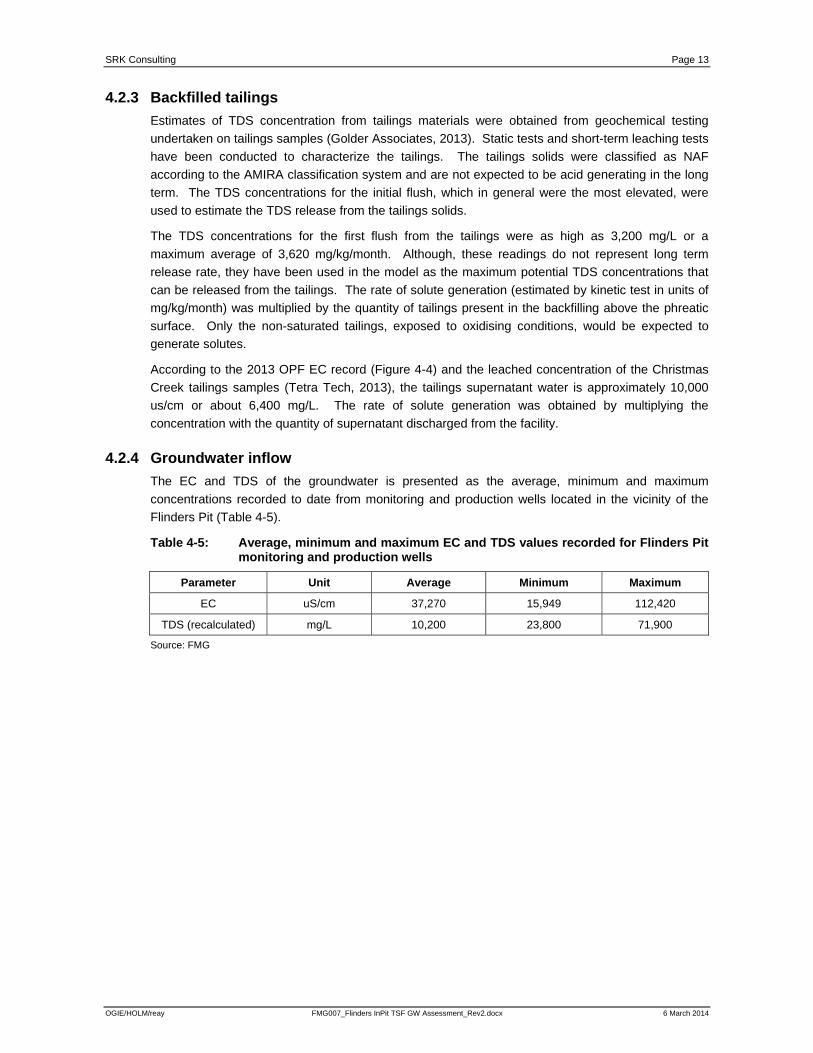
4.2.4 Groundwater inflow
The EC and TDS of the groundwater is presented as the average, minimum and maximum
concentrations recorded to date from monitoring and production wells located in the vicinity of the
Flinders Pit (Table 4-5).
Table 4-5: Average, minimum and maximum EC and TDS values recorded for Flinders Pit monitoring and production wells
Parameter Unit Average Minimum Maximum
EC uS/cm 37,270 15,949 112,420
TDS (recalculated) mg/L 10,200 23,800 71,900
Source: FMG

SRK Consulting Page 14
OGIE/HOLM/reay FMG007_Flinders InPit TSF GW Assessment_Rev2.docx 6 March 2014
Figure 4-4: 2013 OPF EC record
Source: FMG
SRK Consulting Page 15
OGIE/HOLM/reay FMG007_Flinders InPit TSF GW Assessment_Rev2.docx 6 March 2014
5 Water Balance and TDS Concentration Results Based on 100 year simulation period, model results were generated for all flow components of the
water balance. The EC was used to infer the TDS present in each flow when TDS values were not
available. It should however be noted that the correlation between EC and TDS is not absolute and
varies based on actual dissolved species and concentrations. Three scenarios were considered as
follows:
Scenario 1 Leaving the pit as open pit void at closure (reference case).
Scenario 2 Backfilling with waste rock to pre-mining water level (~ 410 m RL) and tailings above
(permitted base case).
Scenario 3 Backfilling from the base of the pit with tailings only (alternative case).
The results of the different scenario are summarised in Appendix B while all model output is
presented in electronic form in Appendix C.
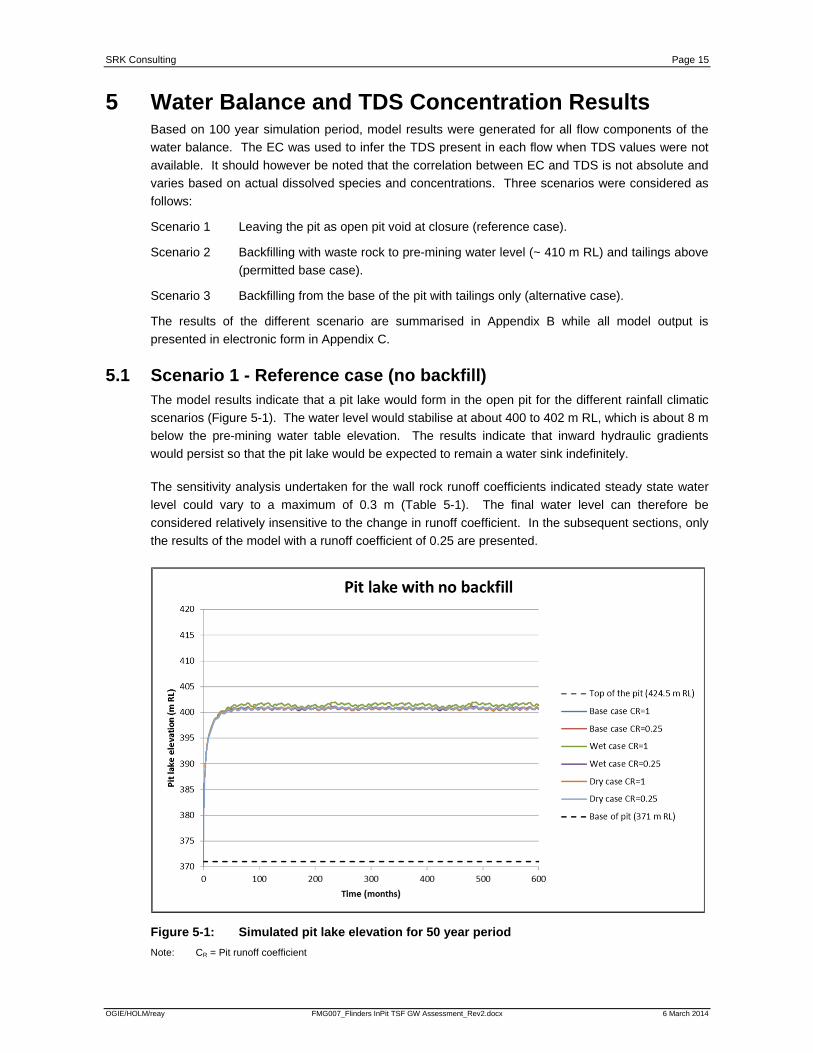
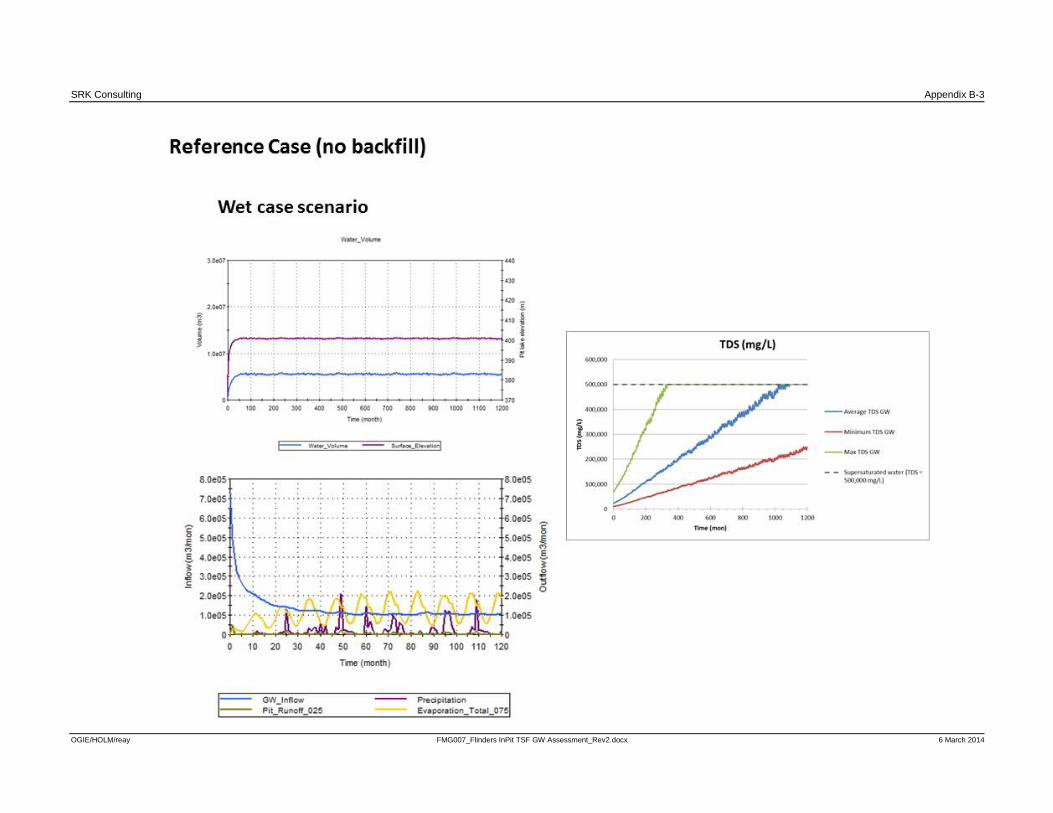
5.1 Scenario 1 - Reference case (no backfill) The model results indicate that a pit lake would form in the open pit for the different rainfall climatic
scenarios (Figure 5-1). The water level would stabilise at about 400 to 402 m RL, which is about 8 m
below the pre-mining water table elevation. The results indicate that inward hydraulic gradients
would persist so that the pit lake would be expected to remain a water sink indefinitely.
The sensitivity analysis undertaken for the wall rock runoff coefficients indicated steady state water
level could vary to a maximum of 0.3 m (Table 5-1). The final water level can therefore be
considered relatively insensitive to the change in runoff coefficient. In the subsequent sections, only
the results of the model with a runoff coefficient of 0.25 are presented.
Figure 5-1: Simulated pit lake elevation for 50 year period
Note: CR = Pit runoff coefficient

SRK Consulting Page 16
OGIE/HOLM/reay FMG007_Flinders InPit TSF GW Assessment_Rev2.docx 6 March 2014
Table 5-1: Final pit lake levels and equilibrium times
Rainfall climatic scenario
Runoff coefficient
Final (equilibrium) pit water elevation (m RL)
Time to reach equilibrium (months)
Base case 1 401.0 92
0.25 400.9 92
Dry case 1 400.9 56
0.25 400.8 56
Wet case 1 401.8 79
0.25 401.1 80
The results indicate that the steady-state lake level would be reached in approximately 90 months
(7.5 years) for the base rainfall climatic scenario, approximately 80 months (6.5 years) for the wet
rainfall climatic scenario, and approximately 55 month (4.5 years) for the dry rainfall climatic
scenario.
Figure 5-2 illustrates the transient relationships between the inflows and water loss through
evaporation for the first 10 years of simulation.
Figure 5-2: Simulated water balance for first 10 years (reference case)
Note: Base case rainfall scenario, CR = 0.25
As a result of the monthly time-step, these relationships vary seasonally.
The lake water balance is largely controlled by the water elevation which dictated the:
Groundwater inflow rate; and
Rate of evaporation.
The volume of pit wall rock runoff is minor in comparison with other inflows.

SRK Consulting Page 17
OGIE/HOLM/reay FMG007_Flinders InPit TSF GW Assessment_Rev2.docx 6 March 2014
The water balance representing steady-state conditions at 100 year for the three rainfall climatic
scenarios (base case, dry case and wet case) is presented in Table 5-2.
Table 5-2: Simulated water balance at steady state conditions (100 year simulation)
Rainfall climatic scenario
Runoff coefficient
Steady state water
elevation (m RL)
Direct precipitation (m3/month)
Pit wall runoff
(m3/month)
Groundwater inflow
( m3/month)
Total inflow(m3/month)
Total outflow /evaporation (m3/month)
Base case 1 401.0 25,675 11,047 1.09 x 10⁵ 1.46 x 10⁵ 1.83 x 10⁵
0.25 400.9 25,576 2,787 1.10 x 10⁵ 1.39 x 10⁵ 1.82 x 10⁵
Dry case 1 400.9 11,203 4,901 1.11 x 10⁵ 1.27 x 10⁵ 1.82 x 10⁵
0.25 400.8 11,175 1,232 1.12 x 10⁵ 1.24 x 10⁵ 1.82 x 10⁵
Wet case 1 401.8 27,509 10,807 1.07 x 10⁵ 1.45 x 10⁵ 1.88 x 10⁵
0.25 401.1 26,853 2,866 1.09 x 10⁵ 1.38 x 10⁵ 1.84 x 10⁵
As noted before, the pit void would remain a long term groundwater sink due to evaporation
exceeding the combined inflows.
As a result water would not leave the pit, and solute concentrations would be expected to increase
over time due to evapo-concentration. Figure 5-3 presents the result of the predicted total dissolved
solute concentrations in the pit lake over time for the base climatic scenario and various groundwater
TDS concentrations (minimum TDS ~ 10,000, average TDS ~ 24,000 mg/L; and maximum TDS
~70,000 mg/L).
Figure 5-3: TDS concentration for 100 year simulation (reference case)
Note: Base case rainfall scenario, CR = 0.25

SRK Consulting Page 18
OGIE/HOLM/reay FMG007_Flinders InPit TSF GW Assessment_Rev2.docx 6 March 2014
5.2 Scenario 2 - Permitted base case (waste rock backfill to WT, tailings above) This scenario represents the current FMG permitted pit void backfilling option. It has the pit
backfilled with waste rock to the pre-mining water level (~ 410 m RL), with tailings placed above the
water table to an elevation of 424.5 m RL. In this scenario waste rock deposition occurs at a rate of
780,000 m3 per month for a swelling factor of 30% and a porosity of 40%.
Details of waste rock and tailings deposition, phreatic surface elevation and time to reach equilibrium
are summarised in Table 5-3. The modelled phreatic surface and tailings elevation with time are
presented in Figure 5-4 and Figure 5-5. Figure 5-6 illustrates the transient relationships between the
components of the water balance for the first 10 years of simulation.
Table 5-3: Waste rock and tailing deposition time, phreatic surface elevation and equilibrium times
Waste rock deposition
time (month)
Tailings deposition
time (month)
Total deposition
time (months)
Water level at end of
deposition (m RL)
Phreatic surface
elevation (m RL) at 100
years
Phreatic surface
elevation at equilibrium
(m RL)
Time to reach
equilibrium (years)
1 to 16 17 to 89 89 424.5 424.42 410 100,000 <
Figure 5-4: Pit water level, tailing level, pit water volume and tailing volume for 10 year simulation (permitted base case)
Note: Base case rainfall scenario, CR = 0.25
SRK Consulting Page 19
OGIE/HOLM/reay FMG007_Flinders InPit TSF GW Assessment_Rev2.docx 6 March 2014
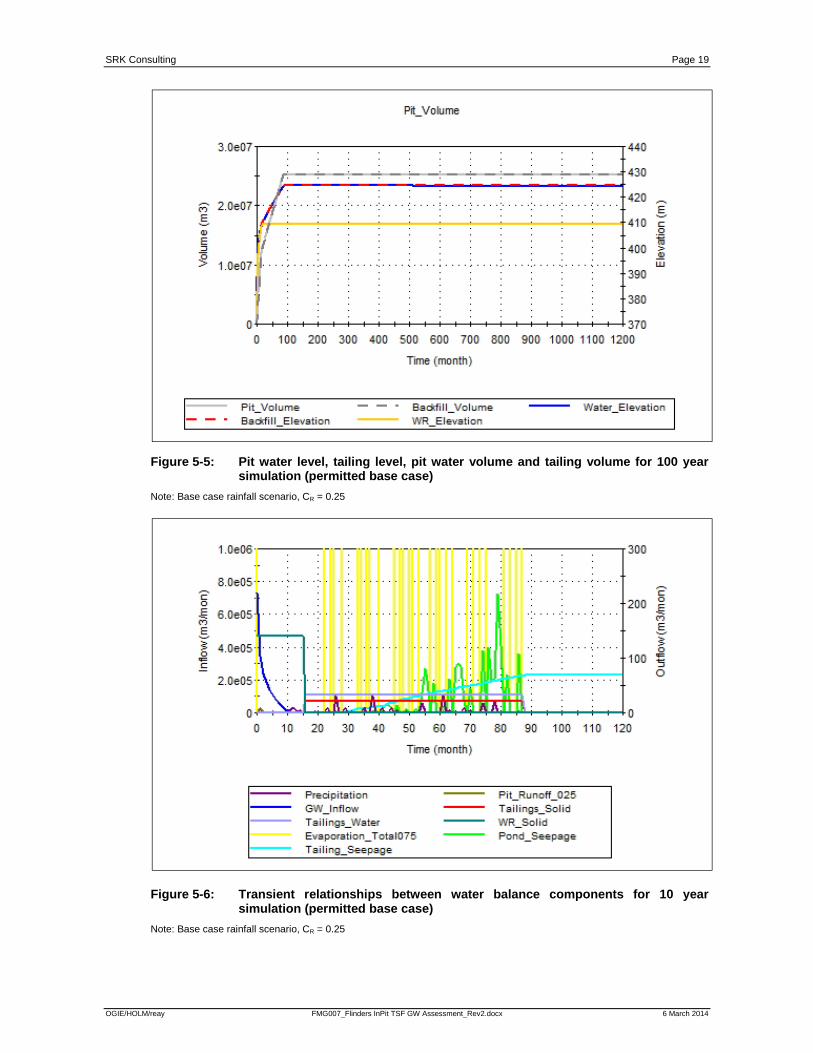
Figure 5-5: Pit water level, tailing level, pit water volume and tailing volume for 100 year simulation (permitted base case)
Note: Base case rainfall scenario, CR = 0.25
Figure 5-6: Transient relationships between water balance components for 10 year simulation (permitted base case)
Note: Base case rainfall scenario, CR = 0.25
SRK Consulting Page 20
OGIE/HOLM/reay FMG007_Flinders InPit TSF GW Assessment_Rev2.docx 6 March 2014
The model results indicate that the waste rock deposition would occur under water as the
groundwater inflow rapidly inundates the pit (Figure 5-4). Waste rock deposition would take
approximately 16 months. As soon as the phreatic surface reaches the natural groundwater
elevation (~ 410 m RL), the pit filled with waste rock would act as a groundwater flow-through
system. The permeability of the waste rock deposit would be expected to be higher than the
surrounding bedrock (10-4 < K Marra Mamba Fmn < 10-3 m/s, FMG, 2012), therefore the pore water
displacement through the waste rock would be at the same rate as the local groundwater flow.
Tailings deposition above ~ 410 m RL would take approximately 72 months (6 years) to reach the
final elevation of 424.5 m RL. During tailings deposition, seepage through the pit wall above the
water table to the groundwater system underneath would occur from intermittent ponds developed
along the pit wall and from the tailings deposit itself. The seepage rates from the pond would be
driven by the pond elevation and the high permeability of the pit wall. The seepage rate from the
tailings would be driven by the elevation of the phreatic surface within the tailings and the low
permeability of the tailings (K ~ 10-9 m/s).
At the end of the tailing deposition, the phreatic surface would be at ~ 424.5 m RL, well above the
regional pre-mining groundwater level (~ 410 m RL) due to the low permeability of the tailings. This
water mound would be expected to dissipate over a long time (decades to centuries) and the
phreatic water level will equilibrate with the regional groundwater level (~ 410m RL) in the very long
term. The seepage rate from the tailings post-deposition is estimated at less than 840 m3/year.
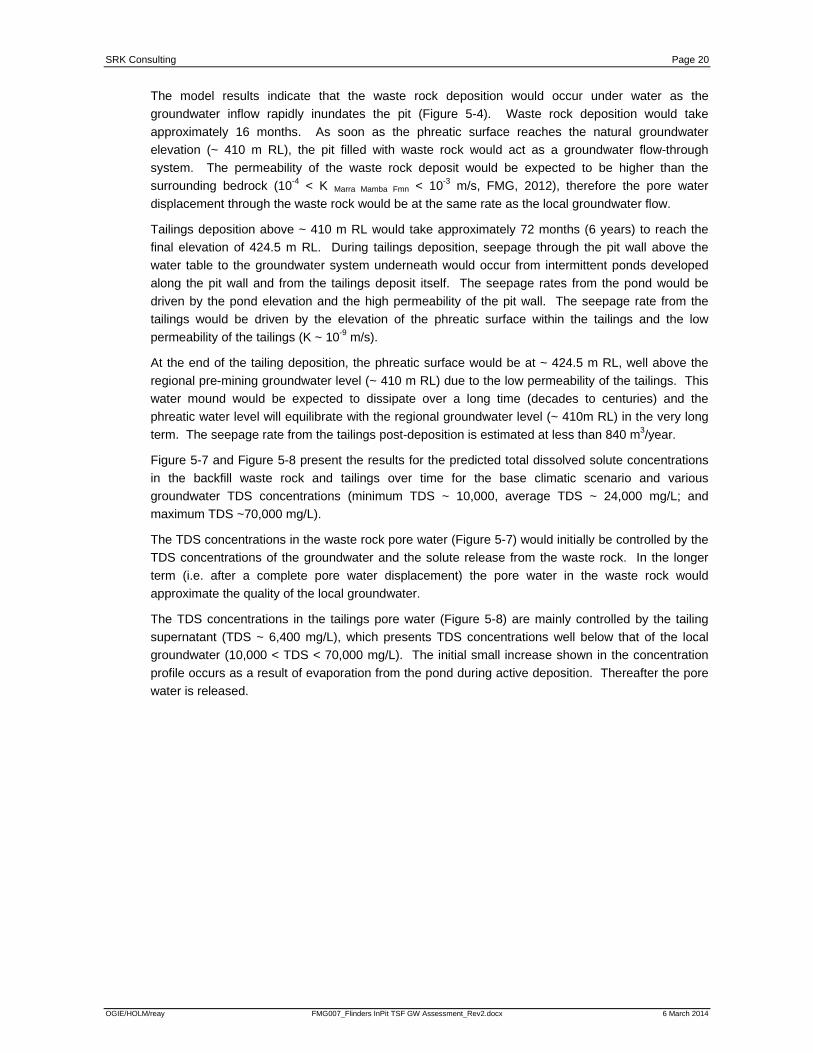
Figure 5-7 and Figure 5-8 present the results for the predicted total dissolved solute concentrations
in the backfill waste rock and tailings over time for the base climatic scenario and various
groundwater TDS concentrations (minimum TDS ~ 10,000, average TDS ~ 24,000 mg/L; and
maximum TDS ~70,000 mg/L).
The TDS concentrations in the waste rock pore water (Figure 5-7) would initially be controlled by the
TDS concentrations of the groundwater and the solute release from the waste rock. In the longer
term (i.e. after a complete pore water displacement) the pore water in the waste rock would
approximate the quality of the local groundwater.
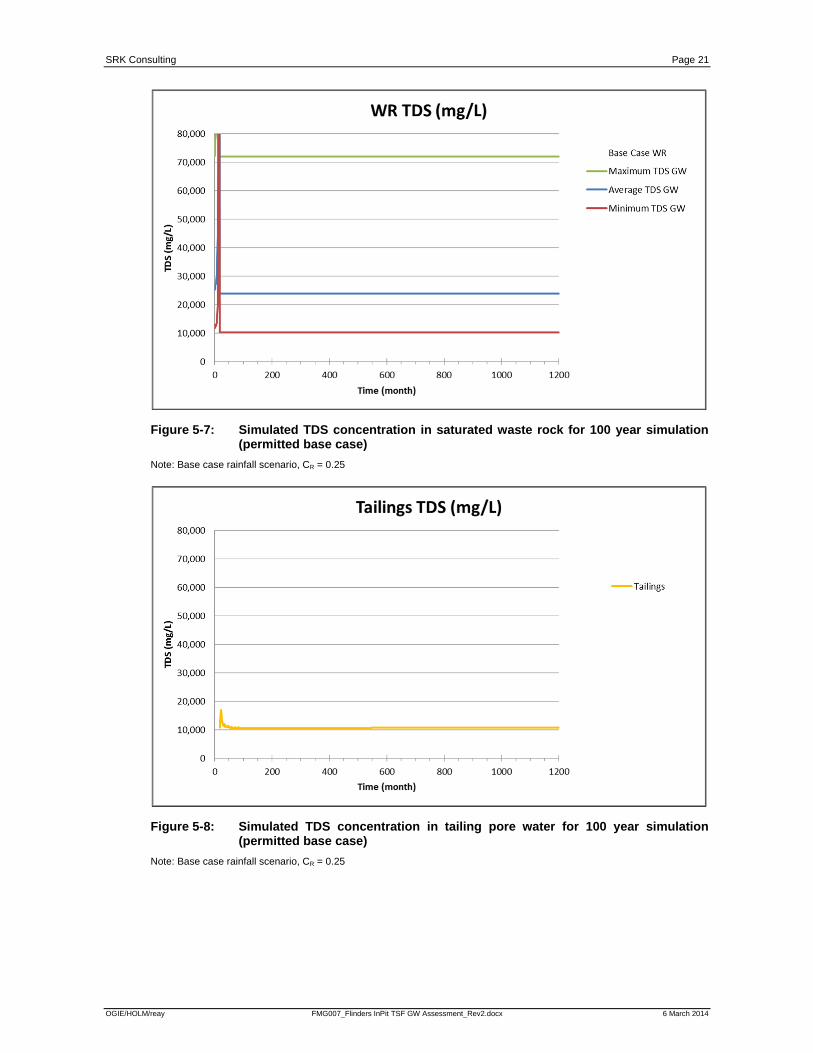
The TDS concentrations in the tailings pore water (Figure 5-8) are mainly controlled by the tailing
supernatant (TDS ~ 6,400 mg/L), which presents TDS concentrations well below that of the local
groundwater (10,000 < TDS < 70,000 mg/L). The initial small increase shown in the concentration
profile occurs as a result of evaporation from the pond during active deposition. Thereafter the pore
water is released.
SRK Consulting Page 21
OGIE/HOLM/reay FMG007_Flinders InPit TSF GW Assessment_Rev2.docx 6 March 2014
Figure 5-7: Simulated TDS concentration in saturated waste rock for 100 year simulation (permitted base case)
Note: Base case rainfall scenario, CR = 0.25
Figure 5-8: Simulated TDS concentration in tailing pore water for 100 year simulation (permitted base case)
Note: Base case rainfall scenario, CR = 0.25
SRK Consulting Page 22
OGIE/HOLM/reay FMG007_Flinders InPit TSF GW Assessment_Rev2.docx 6 March 2014
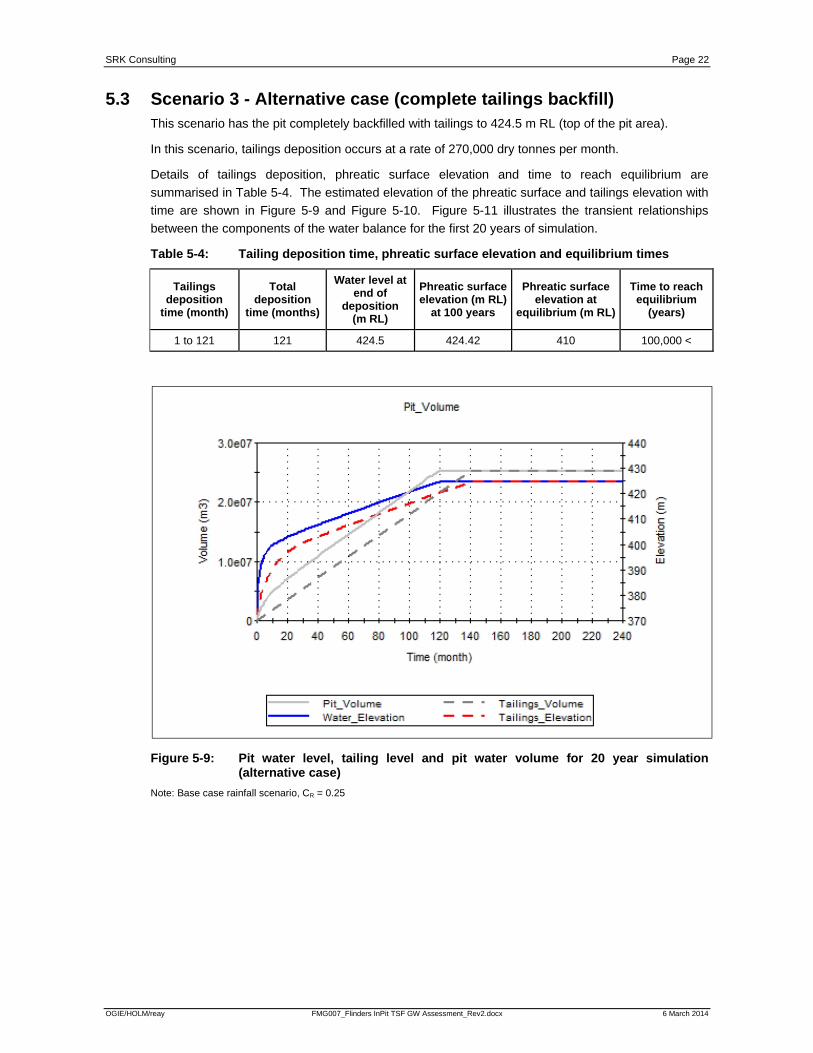
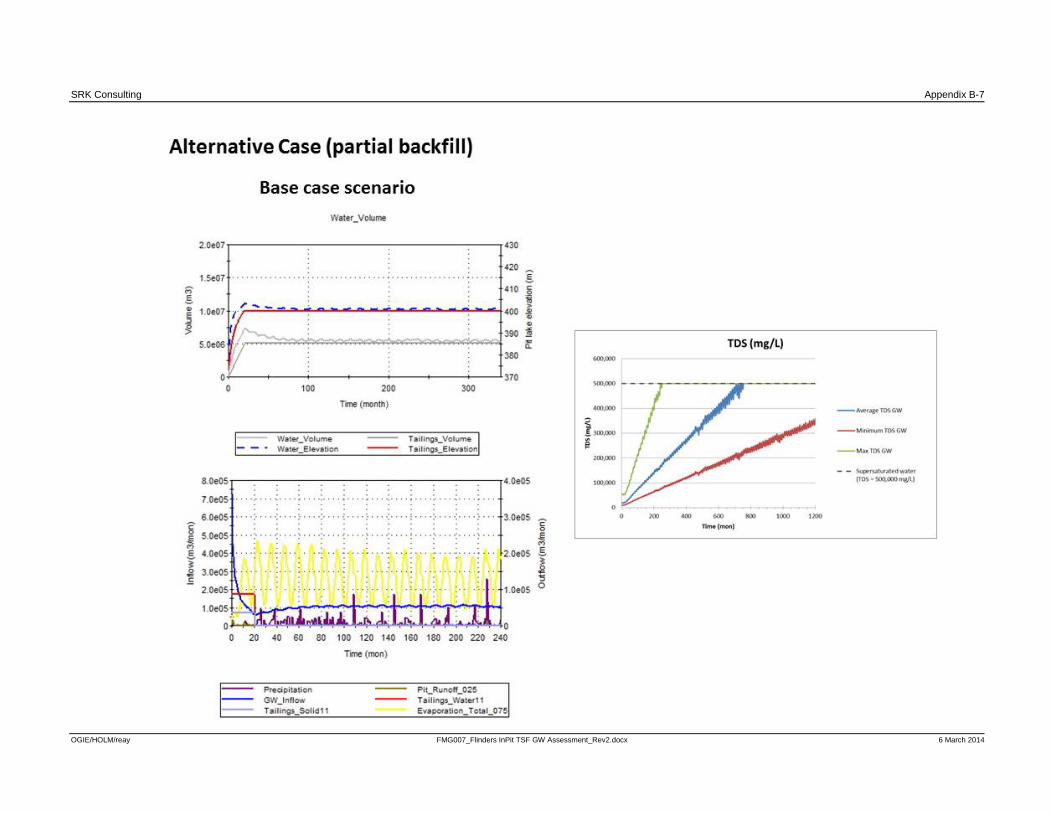
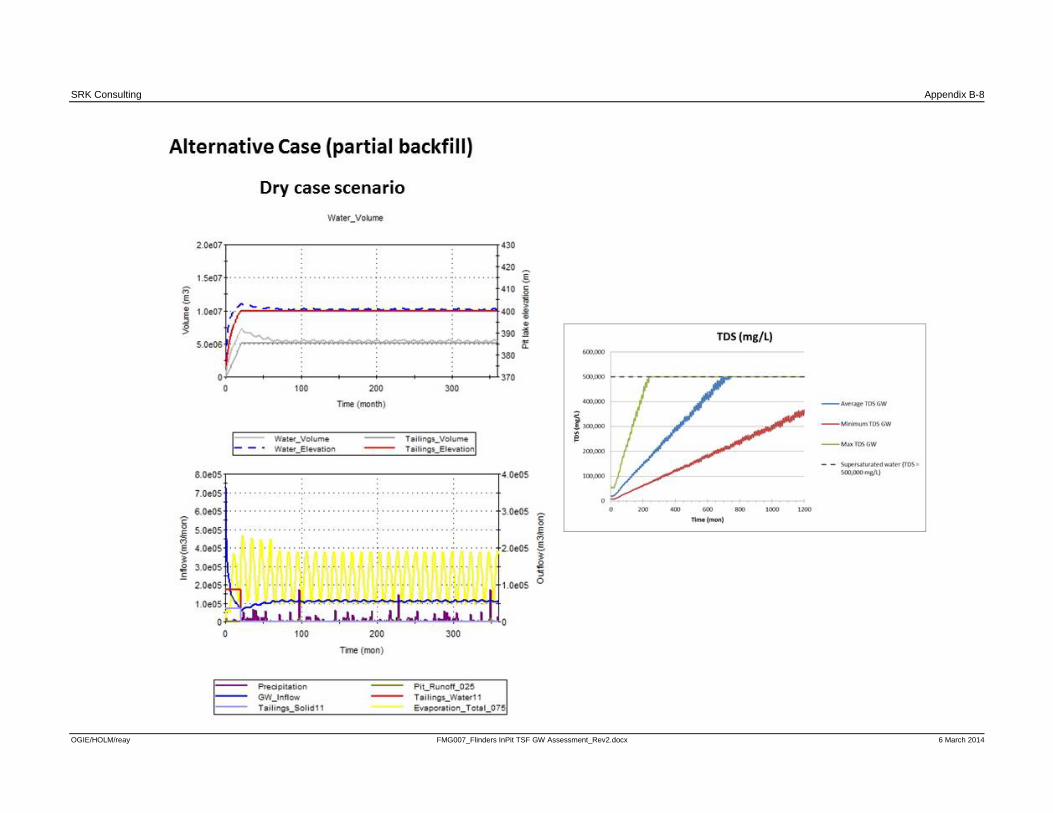
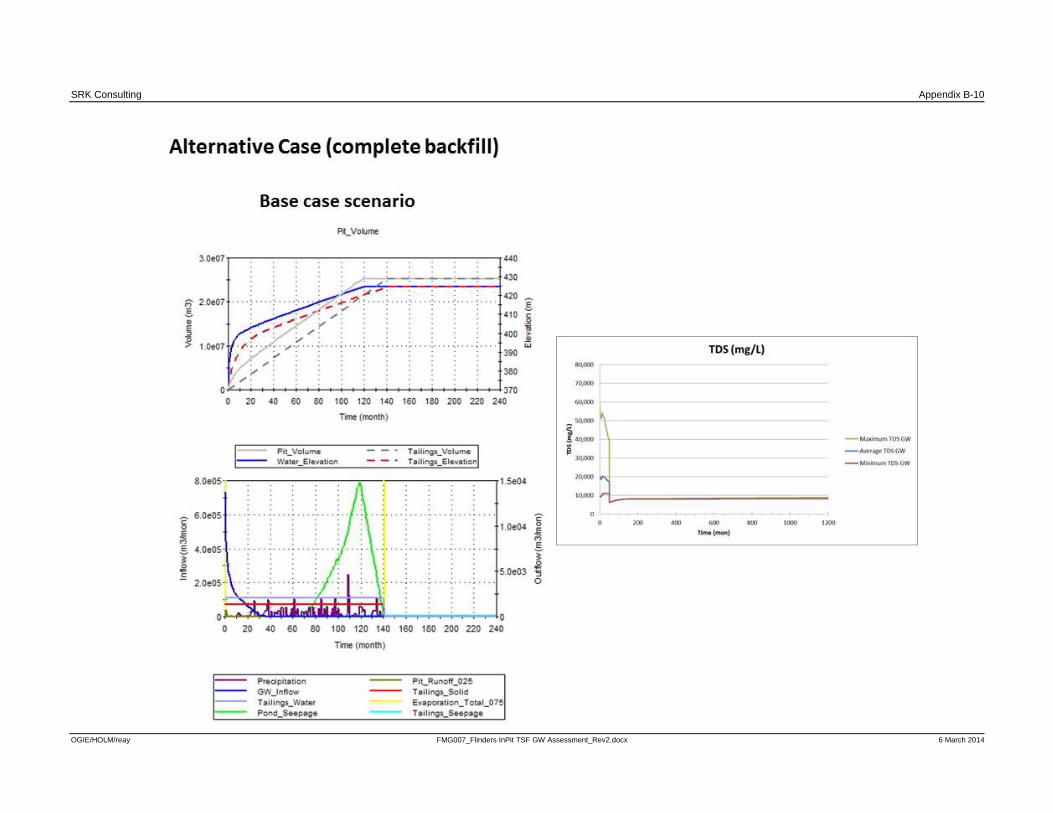
5.3 Scenario 3 - Alternative case (complete tailings backfill) This scenario has the pit completely backfilled with tailings to 424.5 m RL (top of the pit area).
In this scenario, tailings deposition occurs at a rate of 270,000 dry tonnes per month.
Details of tailings deposition, phreatic surface elevation and time to reach equilibrium are
summarised in Table 5-4. The estimated elevation of the phreatic surface and tailings elevation with
time are shown in Figure 5-9 and Figure 5-10. Figure 5-11 illustrates the transient relationships
between the components of the water balance for the first 20 years of simulation.
Table 5-4: Tailing deposition time, phreatic surface elevation and equilibrium times
Tailings deposition
time (month)
Total deposition
time (months)
Water level at end of
deposition (m RL)
Phreatic surface elevation (m RL)
at 100 years
Phreatic surface elevation at
equilibrium (m RL)
Time to reach equilibrium
(years)
1 to 121 121 424.5 424.42 410 100,000 <
Figure 5-9: Pit water level, tailing level and pit water volume for 20 year simulation (alternative case)
Note: Base case rainfall scenario, CR = 0.25

SRK Consulting Page 23
OGIE/HOLM/reay FMG007_Flinders InPit TSF GW Assessment_Rev2.docx 6 March 2014
Figure 5-10: Pit water level, tailing level, pit water volume and tailing volume for 100 year simulation (alternative case)
Note: Base case rainfall scenario, CR = 0.25
Figure 5-11: Transient relationships between water balance components for first 20 years of simulation (alternative case)
Note: Base case rainfall scenario, CR = 0.25

SRK Consulting Page 24
OGIE/HOLM/reay FMG007_Flinders InPit TSF GW Assessment_Rev2.docx 6 March 2014
The modelling results indicate that the tailings deposition would occur under water at all times as,
initially the groundwater inflow rapidly inundates the pit void (Figure 5-9). Tailings deposition would
take approximately 121 months (10 years). As for Scenario 2, at the end of deposition the phreatic
surface would be at 424.5 m RL well above the regional pre-mining groundwater level (~ 410 m RL)
due to the low permeability of the tailings (K ~ 10-9 m/s). Over time (decades to centuries), this
raised phreatic surface would be expected to dissipate and the water level would equilibrate with the
regional groundwater level (~ 410 m RL).
The backfilled void would no longer act as a sink and seepage would occur above the regional pre-
mining groundwater level (~ 410 m RL). The tailings seepage rate post deposition would be
expected to occur at a very low rate (< 840 m3/year) due to the low hydraulic conductivity of the
tailings material (K ~ 10-9 m/s). The groundwater flow would also tend to flow around the tailings
deposit as a result of the low permeability of the tailings. This would continue to occur even after the
phreatic surface reaches the regional groundwater elevation. The estimated flow through the tailings
backfill would occur at a limited rate (about. 2,800 m3/year compared to about 275 Mm3/year through
the waste rock) due to the low permeability of the tailings.
Figure 5-12 presents the predicted total dissolved solute concentrations in the pit backfilled with
tailings over time for the base climatic scenario and various groundwater TDS concentrations
(minimum TDS ~ 10,000, average TDS ~ 24,000 mg/L; and maximum TDS ~70,000 mg/L).
Figure 5-12: TDS concentration for 100 year simulation (alternative case)
Note: Base case rainfall scenario, CR = 0.25
The quality of the water within the confines of the pit (i.e. pond and then pore water in the backfill) is
initially controlled by the groundwater inflow (10,000 < TDS < 70,000 mg/L), after which the quality is
improved through the introduction of tailings supernatant (TDS ~ 6,400 mg/L), surface water runoff
and direct precipitation during deposition. At the end of the tailings deposition, the TDS
concentrations in the backfill pore water has improved to that of the tailings supernatant and the TDS
concentration is below the surrounding groundwater environment. With time the slight displacement
of the pore water from the tailings with local groundwater would increase the TDS concentrations.
SRK Consulting Page 25
OGIE/HOLM/reay FMG007_Flinders InPit TSF GW Assessment_Rev2.docx 6 March 2014
6 Impacts on Groundwater Regime and Mitigation Measures
6.1 Scenario 1 - Reference case (no backfill) In this scenario, the pit void should remain a long term groundwater sink as evaporation outputs are
greater than likely inputs from runoff, rainfall and groundwater inflow. A pit lake will therefore form.
Although the surrounding aquifers are not expected to be impacted in terms of groundwater quality
due to groundwater flowing toward the void, water loss through pit lake evaporation is an irreversible
loss of groundwater in an arid region for the groundwater system and evapo-concentration of the pit
lake water over time would increase the TDS concentration. However, because of the pit would
remain and indefinite sink, none of the TDS would be released to the receiving environment.
Mitigation, if required, could include backfilling of the pit void to above the regional groundwater table
in order to avoid evaporative losses.
6.2 Scenario 2 - Permitted base case (waste rock backfill to WT, tailings above) In this scenario the pit void acts as a flow through facility as soon as the phreatic surface in the
backfill reaches the regional groundwater level (~420 m RL). The groundwater would flow through
the waste rock backfill at the same rate as the local groundwater flow due to the high permeability of
the waste rock.
The pore water displacement through the waste rock is estimated to be at 275 Mm3/year, which
would mean that the TDS concentrations would tend to approximate the groundwater
concentrations. The tailing pore water TDS concentrations would be lower than the surrounding
groundwater (10,000 < TDS < 70,000 mg/L) and the tailing seepage rate post-deposition
(< 840 m3/year) would be far less than the groundwater flow through the waste rock underneath the
tailings. Consequently the impact of the seepage would be minimal.
As a result, no impact on the regional groundwater flow and TDS concentrations would be expected
at a local and regional scale due to low tailing seepage rate, and the fact that evaporative losses
would not be a factor.
6.3 Scenario 3 - Alternative case (complete tailings backfill) As in the previous scenario, the backfilled void would no longer act as a sink and seepage would
occur from the tailings above the regional pre-mining groundwater level (~ 410 m RL). Groundwater
flows though the tailings below 410 m RL would occur at a limited rate (i.e. 2,800 m3/year) due to the
low permeability of the tailings (K ~ 10-9 m/s).
The long-term tailing seepage volume (< 840 m3/year) and quality (~6,400 mg/L) is not expected to
have any impact on the quality of the receiving waters (i.e. regional groundwater systems;
10,000 < TDS < 70,000 mg/L). Only, the very local groundwater flow would be affected, with a
decrease in TDS indicated.
At the regional scale, the groundwater flow would not be affected detrimentally and no change in
water quality (i.e. TDS concentration) of the local and regional groundwater flow system is expected
to occur in the future. No impact on the downstream marsh is therefore expected.

SRK Consulting Page 26
OGIE/HOLM/reay FMG007_Flinders InPit TSF GW Assessment_Rev2.docx 6 March 2014
7 Concluding Remarks Not backfilling the pit would result in the formation of a pit lake that would represent an indefinite
groundwater sink. This would lead to a net loss of groundwater and an increasing saline pit lake.
However, the increased salinity would not impact on the groundwater system as it would be
contained within the drawdown zone. The net loss of groundwater (about 0.5 % of local groundwater
flow) would not be expected to result in any significant impacts on the downstream environment.
In contrast, neither backfill option would cause a long term loss of groundwater. Both backfill options
are expected to cause localised groundwater mounding during operations, with a longer term
dissipation of a phreatic surface that would persist in the tailings deposit above the water table. Due
to the lower TDS concentration of the tailings, the TDS of the groundwater locally may be lowered.
However, the effect is expected to be minimal.
It is the opinion of SRK that the consequences of the Complete Tailings Backfill of the Flinders pit
would be indistinguishable from the partial back fill option (i.e. currently permitted case) and should
not have any significant impacts on the regional groundwater system and its groundwater dependant
ecosystems (e.g. the downstream marsh).
Compiled by
Sylvie Ogier-Halim
Senior Consultant
Peer Reviewed by
David Whiting
Principal Consultant (Hydrogeology)
John Chapman
Principal Consultant (Environment)

SRK Consulting Page 27
OGIE/HOLM/reay FMG007_Flinders InPit TSF GW Assessment_Rev2.docx 6 March 2014
8 References FMG, 2012. Hydrogeological assessment of the Christmas Creek life of mine water management
scheme. June 2012.
FMG, 2012. Hydrogeological assessment of the Christmas Creek life of mine water management scheme. June 2012.
Golder Associates, 2013. Windich In-pit TSF Waste rock and tailings static geochemical characterisation. March 2013.
Golder Associates, 2013. Windich In-pit TSF Waste rock and tailings static geochemical characterisation. March 2013.
Golder, Associates, 2012. Geotechnical Laboratory Testing Results for Windich In-pit TSF, August 2012.
Golder, Associates, 2012. Geotechnical Laboratory Testing Results for Windich In-pit TSF, August 2012.
Kohler, M A and Parmele, L H, 1967. Generalized estimates of free-water evaporation. Water Resources Research, 3 (4): 997-1005.
Niccoli, W L, 2009. Hydrologic characteristics and classifications of pit lakes, in Castendyk D, Eary T, (Eds), 2009 Mine Pit Lakes: Characteristics, Predictive Modeling, and Sustainability, Colorado, USA, Society for Mining Engineering (SME), pp 33-43.
Tetra Tech (2013). Cloudbreak and Christmas Creek Tailings Static Testing Report. December 2013.

SRK Consulting Appendices
OGIE/HOLM/reay FMG007_Flinders InPit TSF GW Assessment_Rev2.docx 6 March 2014
Appendices

SRK Consulting Appendix A
OGIE/HOLM/reay FMG007_Flinders InPit TSF GW Assessment_Rev2.docx 6 March 2014
Appendix A: Rainfall sequences

SRK Consulting Appendix A-1
OGIE/HOLM/reay FMG007_Flinders InPit TSF GW Assessment_Rev2.docx 6 March 2014
Date Base Scenario Dry Scenario Wet Scenario
15/07/2007 7.2 4.176 9.936
15/08/2007 0 0 0
15/09/2007 0 0 0
15/10/2007 2.8 1.624 3.864
15/11/2007 2.2 1.276 3.036
15/12/2007 28.8 16.704 39.744
15/01/2008 49.5 28.71 68.31
15/02/2008 55.5 32.19 76.59
15/03/2008 66 38.28 91.08
15/04/2008 2.5 1.45 3.45
15/05/2008 0 0 0
15/06/2008 49 28.42 67.62
15/07/2008 0 0 0
15/08/2008 0 0 0
15/09/2008 3 1.74 4.14
15/10/2008 11 6.38 15.18
15/11/2008 1 0.58 1.38
15/12/2008 73 42.34 100.74
15/01/2009 31 17.98 42.78
15/02/2009 165.5 95.99 228.39
15/03/2009 23 13.34 31.74
15/04/2009 0 0 0
15/05/2009 3 1.74 4.14
15/06/2009 7.5 4.35 10.35
15/07/2009 2 1.16 2.76
15/08/2009 0 0 0
15/09/2009 0 0 0
15/10/2009 0 0 0
15/11/2009 8 4.64 11.04
15/12/2009 21 12.18 28.98
15/01/2010 41 23.78 56.58
15/02/2010 7.5 4.35 10.35
15/03/2010 17.5 10.15 24.15
15/04/2010 2 1.16 2.76
15/05/2010 4.5 2.61 6.21
15/06/2010 1.5 0.87 2.07
15/07/2010 14 8.12 19.32
15/08/2010 2 1.16 2.76
15/09/2010 29 16.82 40.02
15/10/2010 0 0 0
15/11/2010 15.8 9.164 21.804
15/12/2010 5.5 3.19 7.59
15/01/2011 95.7 55.506 132.066
15/02/2011 178 103.24 245.64
15/03/2011 44 25.52 60.72

SRK Consulting Appendix A-2
OGIE/HOLM/reay FMG007_Flinders InPit TSF GW Assessment_Rev2.docx 6 March 2014
Date Base Scenario Dry Scenario Wet Scenario
15/04/2011 29 16.82 40.02
15/05/2011 17 9.86 23.46
15/06/2011 17.5 10.15 24.15
15/07/2011 22.9 13.282 31.602
15/08/2011 0 0 0
15/09/2011 0 0 0
15/10/2011 0 0 0
15/11/2011 55.2 32.016 76.176
15/12/2011 13 7.54 17.94
15/01/2012 409.1 237.278 564.558
15/02/2012 13 7.54 17.94
15/03/2012 42.5 24.65 58.65
15/04/2012 1.4 0.812 1.932
15/05/2012 0 0 0
15/06/2012 0 0 0
15/07/2012 7.2 4.176 9.936
15/08/2012 0 0 0
15/09/2012 0 0 0
15/10/2012 2.8 1.624 3.864
15/11/2012 2.2 1.276 3.036
15/12/2012 28.8 16.704 39.744
15/01/2013 49.5 28.71 68.31
15/02/2013 55.5 32.19 76.59
15/03/2013 66 38.28 91.08
15/04/2013 2.5 1.45 3.45
15/05/2013 0 0 0
15/06/2013 49 28.42 67.62
15/07/2013 0 0 0
15/08/2013 0 0 0
15/09/2013 3 1.74 4.14
15/10/2013 11 6.38 15.18
15/11/2013 1 0.58 1.38
15/12/2013 73 42.34 100.74
15/01/2014 31 17.98 42.78
15/02/2014 165.5 95.99 228.39
15/03/2014 23 13.34 31.74
15/04/2014 0 0 0
15/05/2014 3 1.74 4.14
15/06/2014 7.5 4.35 10.35
15/07/2014 2 1.16 2.76
15/08/2014 0 0 0
15/09/2014 0 0 0
15/10/2014 0 0 0
15/11/2014 8 4.64 11.04
15/12/2014 21 12.18 28.98

SRK Consulting Appendix A-3
OGIE/HOLM/reay FMG007_Flinders InPit TSF GW Assessment_Rev2.docx 6 March 2014
Date Base Scenario Dry Scenario Wet Scenario
15/01/2015 41 23.78 56.58
15/02/2015 7.5 4.35 10.35
15/03/2015 17.5 10.15 24.15
15/04/2015 2 1.16 2.76
15/05/2015 4.5 2.61 6.21
15/06/2015 1.5 0.87 2.07
15/07/2015 0 1.537 0
15/08/2015 6.2 0.768 8.75
15/09/2015 0.8 0 0
15/10/2015 1 0 0
15/11/2015 17.8 0.22 20.923
15/01/2016 41.6 27.771 18.64
15/01/2016 39 70.123 35.092
15/02/2016 42.2 18.631 260.14
15/03/2016 122.8 16.665 39.294
15/04/2016 8.2 0 18.071
15/05/2016 0 0 10.086
15/06/2016 39.2 27.525 0
15/07/2016 0 0 13.869
15/08/2016 6.2 0 0
15/09/2016 0.8 22.282 2.101
15/10/2016 1 0 16.18
15/11/2016 17.8 0 9.666
15/01/2017 41.6 0.936 56.315
15/01/2017 39 21.252 27.23
15/02/2017 42.2 92.465 62.239
15/03/2017 122.8 3.883 58.683
15/04/2017 8.2 8.378 0
15/05/2017 0 81.942 88.358
15/06/2017 39.2 46.59 0
15/07/2017 0 3.269 76.688
15/08/2017 0 36.373 10.892
15/09/2017 35.6 0 2.779
15/10/2017 32 0 3.557
15/11/2017 17.8 8.174 0
15/01/2018 41.6 7.765 61.128
15/01/2018 41.2 30.251 41.166
15/02/2018 6.6 4.35 338.181
15/03/2018 64.6 29.262 36.518
15/04/2018 66 0.297 35.412
15/05/2018 0 32.03 23.46
15/06/2018 0 76.912 19.034
15/07/2018 69 24.913 24.788
15/08/2018 9.8 0 0
15/09/2018 2.5 0 4.648

SRK Consulting Appendix A-4
OGIE/HOLM/reay FMG007_Flinders InPit TSF GW Assessment_Rev2.docx 6 March 2014
Date Base Scenario Dry Scenario Wet Scenario
15/10/2018 3.2 0 1.328
15/11/2018 0 0 0.443
15/01/2019 55 7.513 1.107
15/01/2019 8.1 0 229.433
15/02/2019 124.5 0 57.307
15/03/2019 7.4 0 105.956
15/04/2019 14.6 0 37.517
15/05/2019 55.6 0 0
15/06/2019 1.2 1.367 1.237
15/07/2019 0 0 0
15/08/2019 0 0 0
15/09/2019 35.6 0 36.693
15/10/2019 32 0 32.982
15/11/2019 17.8 0 18.346
15/01/2020 41.6 61.18 42.877
15/01/2020 41.2 7.599 160.698
15/02/2020 6.6 6.231 123.778
15/03/2020 64.6 14.893 2.988
15/04/2020 66 1.216 95.608
15/05/2020 0 4.59 62.956
15/06/2020 0 0 1.28
15/07/2020 69 1.216 7.683
15/08/2020 9.8 0 2.134
15/09/2020 2.5 0.608 8.963
15/10/2020 3.2 9.058 5.549
15/11/2020 0 0 0
15/12/2020 55 1.185 1.921
15/01/2021 8.1 3.366 31.576
15/02/2021 124.5 89.21 8.037
15/03/2021 7.4 0 2.488
15/04/2021 14.6 0 5.932
15/05/2021 55.6 0 2.488
15/06/2021 1.2 8.416 57.027
15/07/2021 69 0 49.755
15/08/2021 9.8 0 27.94
15/09/2021 2.5 0 0
15/10/2021 3.2 3.179 0.191
15/11/2021 0 0 14.927
15/12/2021 55 1.87 199.213
15/01/2022 8.1 21.938 164.568
15/02/2022 124.5 278.865 171.211
15/03/2022 7.4 12.253 61.689
15/04/2022 14.6 0 17.842
15/05/2022 55.6 4.546 0
15/06/2022 1.2 7.905 0

SRK Consulting Appendix A-5
OGIE/HOLM/reay FMG007_Flinders InPit TSF GW Assessment_Rev2.docx 6 March 2014
Date Base Scenario Dry Scenario Wet Scenario
15/07/2022 22.4 0 0
15/08/2022 0 0 0
15/09/2022 4.2 0 0
15/10/2022 1.2 0 0.19
15/11/2022 0.4 3.162 13.287
15/12/2022 1 40.911 58.083
15/01/2023 22.2 18.535 34.901
15/02/2023 282.2 41.099 286.712
15/03/2023 12.4 20.751 30.96
15/04/2023 0 45.33 30.022
15/05/2023 4.6 0 19.89
15/06/2023 8 1.511 16.137
15/07/2023 17.9 0 21.016
15/08/2023 23.7 0.806 0
15/09/2023 0 1.007 3.94
15/10/2023 2.5 0.604 1.126
15/11/2023 10.1 11.484 0.375
15/12/2023 69.4 57.72 0.938
15/01/2024 62.6 17.657 33.452
15/02/2024 61.6 14.479 8.515
15/03/2024 30.8 34.607 2.636
15/04/2024 45.8 2.825 6.285
15/05/2024 4 10.665 2.636
15/06/2024 0.8 0 60.416
15/07/2024 0 2.825 52.712
15/08/2024 6.2 0 29.6
15/09/2024 0.8 1.413 0
15/10/2024 1 21.047 0.203
15/11/2024 17.8 0 15.814
15/12/2024 41.6 2.754 211.05
15/01/2025 39 0 142.392
15/02/2025 42.2 0 148.14
15/03/2025 122.8 0 53.376
15/04/2025 8.2 0 15.438
15/05/2025 0 0 0
15/06/2025 39.2 0.378 0
15/07/2025 22.4 0 0
15/08/2025 0 0 0
15/09/2025 4.2 0 0
15/10/2025 1.2 0 0.164
15/11/2025 0.4 0 11.496
15/12/2025 1 16.913 50.256
15/01/2026 22.2 3.882 39.092
15/02/2026 282.2 102.877 42.3
15/03/2026 12.4 0 123.09
SRK Consulting Appendix A-6
OGIE/HOLM/reay FMG007_Flinders InPit TSF GW Assessment_Rev2.docx 6 March 2014
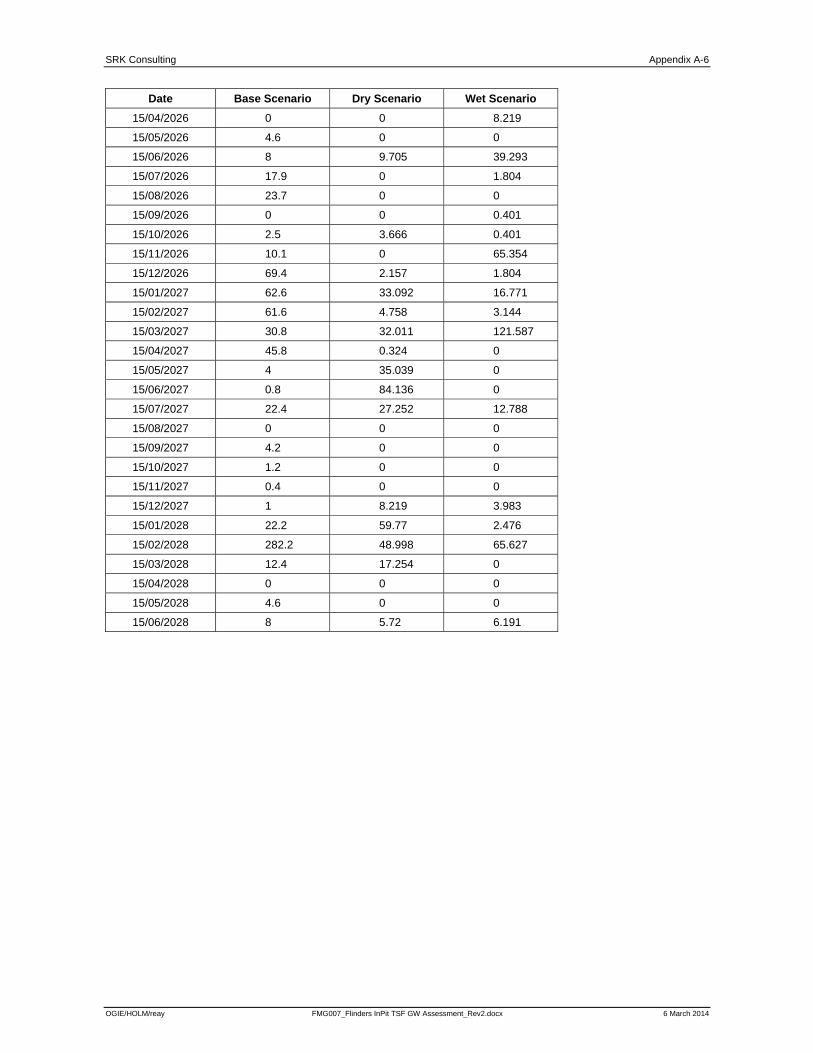
Date Base Scenario Dry Scenario Wet Scenario
15/04/2026 0 0 8.219
15/05/2026 4.6 0 0
15/06/2026 8 9.705 39.293
15/07/2026 17.9 0 1.804
15/08/2026 23.7 0 0
15/09/2026 0 0 0.401
15/10/2026 2.5 3.666 0.401
15/11/2026 10.1 0 65.354
15/12/2026 69.4 2.157 1.804
15/01/2027 62.6 33.092 16.771
15/02/2027 61.6 4.758 3.144
15/03/2027 30.8 32.011 121.587
15/04/2027 45.8 0.324 0
15/05/2027 4 35.039 0
15/06/2027 0.8 84.136 0
15/07/2027 22.4 27.252 12.788
15/08/2027 0 0 0
15/09/2027 4.2 0 0
15/10/2027 1.2 0 0
15/11/2027 0.4 0 0
15/12/2027 1 8.219 3.983
15/01/2028 22.2 59.77 2.476
15/02/2028 282.2 48.998 65.627
15/03/2028 12.4 17.254 0
15/04/2028 0 0 0
15/05/2028 4.6 0 0
15/06/2028 8 5.72 6.191

SRK Consulting Appendix B
OGIE/HOLM/reay FMG007_Flinders InPit TSF GW Assessment_Rev2.docx 6 March 2014
Appendix B: Water Balance and TDS Concentration Summary Results

SRK Consulting Appendix B-1
OGIE/HOLM/reay FMG007_Flinders InPit TSF GW Assessment_Rev2.docx 6 March 2014

SRK Consulting Appendix B-2
OGIE/HOLM/reay FMG007_Flinders InPit TSF GW Assessment_Rev2.docx 6 March 2014
SRK Consulting Appendix B-3
OGIE/HOLM/reay FMG007_Flinders InPit TSF GW Assessment_Rev2.docx 6 March 2014

SRK Consulting Appendix B-4
OGIE/HOLM/reay FMG007_Flinders InPit TSF GW Assessment_Rev2.docx 6 March 2014

SRK Consulting Appendix B-5
OGIE/HOLM/reay FMG007_Flinders InPit TSF GW Assessment_Rev2.docx 6 March 2014

SRK Consulting Appendix B-6
OGIE/HOLM/reay FMG007_Flinders InPit TSF GW Assessment_Rev2.docx 6 March 2014
SRK Consulting Appendix B-7
OGIE/HOLM/reay FMG007_Flinders InPit TSF GW Assessment_Rev2.docx 6 March 2014
SRK Consulting Appendix B-8
OGIE/HOLM/reay FMG007_Flinders InPit TSF GW Assessment_Rev2.docx 6 March 2014

SRK Consulting Appendix B-9
OGIE/HOLM/reay FMG007_Flinders InPit TSF GW Assessment_Rev2.docx 6 March 2014
SRK Consulting Appendix B-10
OGIE/HOLM/reay FMG007_Flinders InPit TSF GW Assessment_Rev2.docx 6 March 2014

SRK Consulting Appendix B-11
OGIE/HOLM/reay FMG007_Flinders InPit TSF GW Assessment_Rev2.docx 6 March 2014

SRK Consulting Appendix B-12
OGIE/HOLM/reay FMG007_Flinders InPit TSF GW Assessment_Rev2.docx 6 March 2014

SRK Consulting Appendix C
OGIE/HOLM/reay FMG007_Flinders InPit TSF GW Assessment_Rev2.docx 6 March 2014
Appendix C: Electronic data

SRK Consulting Distribution Record
OGIE/HOLM/reay FMG007_Flinders InPit TSF GW Assessment_Rev2.docx 6 March 2014
SRK Report Client Distribution Record
Project Number: FMG007
Report Title: Flinders In-Pit TSF Groundwater Impact Assessment
Date Issued: 6 March 2014
Name/Title Company
Laila Burger FMG
Rev No. Date Revised By Revision Details
0 10/02/2014 Caroline Holmes Draft Report
1 11/02/2014 Caroline Holmes Updated Draft Report
2 06/03/2014 Caroline Holmes Final Report
This Report is protected by copyright vested in SRK Consulting (Australasia) Pty Ltd. It may not be
reproduced or transmitted in any form or by any means whatsoever to any person without the written
permission of the copyright holder, SRK.