Flight and Static Exhaust Flow Properties of an F110-GE ... Langley Research Center, Hampton,...
32
NASA Technical Memorandum 104326 Flight and Static Exhaust Flow Properties of an F110-GE-129 Engine in an F-16XL Airplane During Acoustic "rests Jon K. Holzman, Lannie D. Webb, and Frank W. Burcham, Jr. NASA Dryden Flight Research Center Edwards, Cafifornia 1996 National Aeronautics and Space Administration Dryden Flight Research Center Edwards, California 93523-0273 https://ntrs.nasa.gov/search.jsp?R=19970003552 2018-07-17T07:24:07+00:00Z
Transcript of Flight and Static Exhaust Flow Properties of an F110-GE ... Langley Research Center, Hampton,...
NASA Technical Memorandum 104326
Flight and Static Exhaust FlowProperties of an F110-GE-129Engine in an F-16XL AirplaneDuring Acoustic "rests
Jon K. Holzman, Lannie D. Webb, and Frank W. Burcham, Jr.NASA Dryden Flight Research CenterEdwards, Cafifornia
1996
National Aeronautics and
Space Administration
Dryden Flight Research CenterEdwards, California 93523-0273
https://ntrs.nasa.gov/search.jsp?R=19970003552 2018-07-17T07:24:07+00:00Z

CONTENTS
F-16XL AIRCRAFT DESCRIPTION ................................................... 3
Inlet Description ................................................................. 3
Engine Description ............................................................... 6
MEASUREMENTS ................................. . ............................... 6Aircraft
........................................................................
Engine ........................................................................ 7Acoustics Measurements ..........................................................
Flyover Tests ................................................................
Flyover Space Positioning ...................................................... 8Static Acoustic Tests
......................... ° ................................ 8
Meteorology .................................................................... 9
TEST PROCEDURES................................. . ............................. 9
Climb-To-Cruise Tests........................................................... 0
ANOPP Tests.................................................................. 0
Static Tests.................................................................... 11
ANALYTICAL TECHNIQUES ...................................................... 11
Engine Exhaust Flow Properties ................................................... 11
F110-GE-129 Digital Engine Model ' ............................................... 12
Engine Model Description ..................................................... 12Data Selection Procedure ...................................................... 2
Engine Model Inputs ......................................................... 12
Engine Model Output ......................................................... 14
Exhaust Flow Properties ...................................................... 14
Ideal or Jet Expansion Parameters ........................... • ................... 14Area Ratio Parameters ........................................................ 4
Exhaust Static Temperature .................................................... 14
Local Speed of Sound and Exhaust Velocities ..................................... 15
RESULTS AND DISCUSSION" ° ' " " " ° " " * ............................. * .... ° ......... _5
Verification of F 110-GE- 129 Engine Deck ........................................... 19Ground Static Test Results
........................ • ............................... 23
°,.
nl
Flyover Exhaust Flow Properties Results ............................................ 23
CTC Test Results ............................................................... 23
ANOPP Test Results ............................................................ 24
CONCLUDING REMARKS ......................................................... 25
26REFERENCES ...................................................................
TABLES
1. Climb-to-cruise test points ....................................................... 10
2. ANOPPtest points ............................................................. 10
3. Acoustics flight tests for the F-16XL, ship 2 ......................................... 11
4. F-16XL, ship 2, ground run test ................................................... 15
5. CTC test data ................................................................. 17
6. ANOPP flyover test data ......................................................... 18
FIGURES
1. The F-16XL, ship 2, airplane ...................................................... 4
2. The F-16XL, ship 2, inlet (893 in 2 capture area) ....................................... 5
3. Cutaway view of the F110-GE-129 engine and station designations ....................... 6
4. Ground track and array layout on Rogers Dry Lake, Edwards, CA ................. , ...... 7
5. Microphone array for the F-16XL, ship 2, ground static acoustic survey .................... 8
6. Photograph of the F-16XL, ship 2, ground acoustic test showing 3 microphones
in foreground .................................................................. 9
7. Ambient temperature and standard day temperature for the acoustics flyover tests ........... 13
8. Comparison of measured and deck-calculated parameters, ground run .................... 20
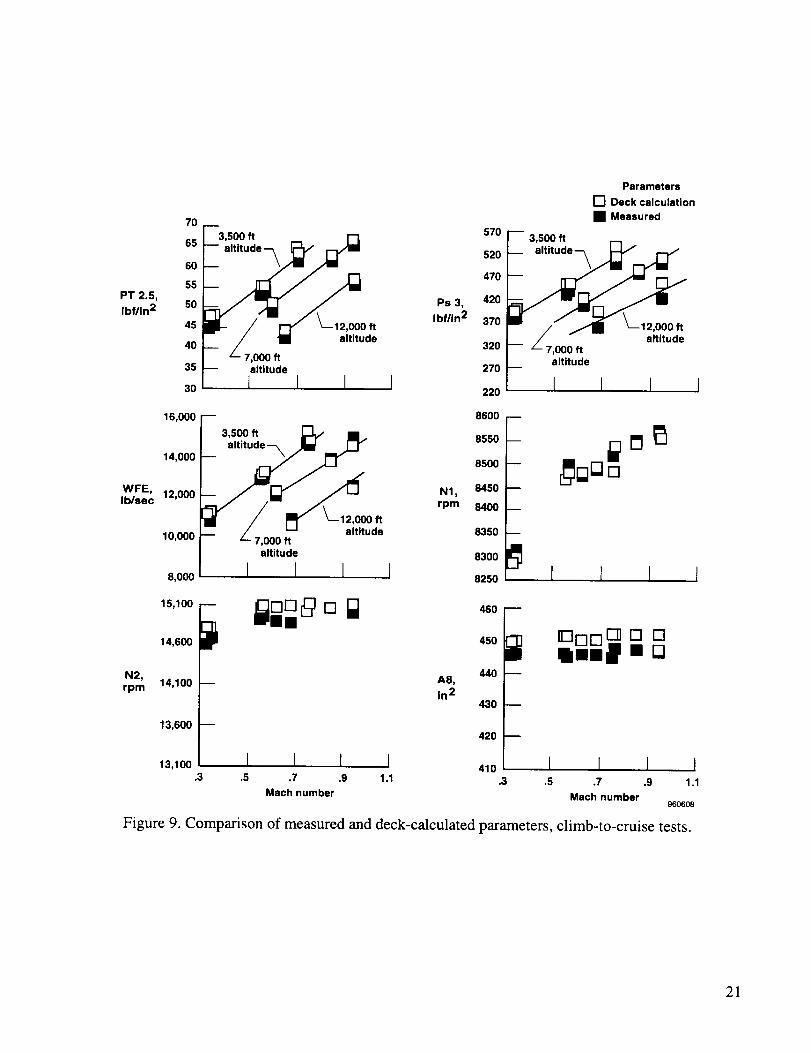
9. Comparison of measured and deck-calculated parameters, climb-to-cruise tests ............. 21
10. Comparison of measured and deck-calculated parameters, ANOPP tests ................... 22
11. Exhaust flow properties, F110-GE-129 engine in F-16XL, ship 2, ground run .............. 23
12. Exhaust flow properties, F110-GE-129 engine in F-16XL, ship 2, climb-to-cruise
tests, all tests at intermediate power, for altitudes, see table 5 ............................ 24
13. Exhaust flow properties, F110-GE-129 engine in F-16XL, ship 2, ANOPP tests,3800 ft altitude ................................................................ 25
iv

ABSTRACT
The exhaust flow properties (mass flow, pressure, temperature, velocity, and Mach number) of the
F 110-GE-129 engine in an F-16XL airplane were determined from a series of flight tests flown at NASA
Dryden Flight Research Center, Edwards, California. These tests were performed in conjunction with
NASA Langley Research Center, Hampton, Virginia (LaRC) as part of a study to investigate the acoustic
characteristics of jet engines operating at high nozzle pressure conditions. The range of interest for both
objectives was from Mach 0.3 to Mach 0.9. NASA Dryden flew the airplane and acquired and analyzed
the engine data to determine the exhaust characteristics. NASA Langley collected the flyover acoustic
measurements and correlated these results with their current predictive codes. This paper describes the
airplane, tests, and methods used to determine the exhaust flow properties and presents the exhaust flowproperties. No acoustics results are presented.
NOMENCLATURE
A8
A9
AE8
AE9
AFFI'C
AGL
ANOPP
CTC
EGT
Vg
GAM7
jet
M9
M jet
Mach
Meas
NPR
N1
N2
OH
P1
Ps3
PT2.5
exhaust nozzle physical area at the throat, in 2
exhaust nozzle physical area at the exit plane, in 2
exhaust nozzle effective throat area, in 2
exhaust nozzle effective exit-plane area, in 2
Air Force Flight Test Center, Edwards AFB, California
above ground level
Aircraft Noise Prediction Program
climb to cruise
exhaust gas temperature downstream of the turbine, °R
gross thrust, lbf
specific heat ratio of exhaust gas at nozzle entrance
location where exhaust flow has expanded to ambient pressure
nozzle exit Mach number based on nozzle expansion ratio
fully expanded jet Mach number
Mach number
measured
nozzle pressure ratio (P8/Pamb)
fan rotor speed, rpm
core rotor speed, rpm
overhead
engine face total pressure, lbf/in 2
compressor discharge static pressure, lbf/in 2
fan discharge total pressure, lbf/in 2

P7
P8
Pamb
PLA
PLF
Ps9
Tamb
T1
T8
Ts9
Tsjet
V9
Vjet
WFE
W8
exhaust nozzle entrance total pressure, lbf/in 2
exhaust nozzle throat total pressure, lbf/in 2 '
ambient static pressure, lbffin 2
power lever angle, deg
power for level flight
exit plane static pressure, lbffin 2
ambient temperature, deg
engine face total temperature, °R
exhaust-nozzle rnixedjet total temperature at the throat, °R
exhaust nozzle exit static temperature, °R
fully expanded jet static temperature, °R
velocity at nozzle exit, from M9, ft/sec
fully expanded nozzle jet velocity, ft/sec
core engine fuel flow, lb/h
mass flow rate at the exhaust nozzle throat, lb/sec
INTRODUCTION
Exhaust flow properties (mass flow, temperature, pressure, velocity, and Mach number) of an engine
are key in determining the acoustic characteristics. Airport noise is one of the key issues in determining
the environmental acceptability of proposed supersonic transport airplanes. These airplanes will probably
be powered by engines operating at high nozzle pressure ratios (NPR) and high exhaust jet velocities.
Concern exists not only for noise produced during takeoff and landing but also for noise produced along
the flightpath of the airplane during the subsonic portion of the climb out for a distance of up to 50 miles.
To determine the engine noise for these transport designs, acoustic codes, such as the Aircraft
Noise Prediction Program (ANOPP), are used. 1 These codes were developed and validated using data
acquired from engines with NPR's and flight speeds lower than that planned for supersonic transports.
Doppler amplification of the shock noise in the forward approach arc of the vehicle flightpath was of
particular concern.
For these reasons, NASA Langley Research Center, Hampton, Virginia (LaRC), and Dryden Flight
Research Center, Edwards, California, jointly conducted tests to acquire in-flight acoustic data for high
NPR engines. Results of these tests would be used to update and validate the current noise predictive
codes. The two main flight test objectives were to assess subsonic climb-to-cruise (CTC) noise using an
aircraft with high NPR engines and to obtain an improved noise database to validate the ANOPP and other
noise predictive codes. The test airplanes included an F-18 powered by two F404-GE-400 engines,
(General Electric Company, Lynn, Massachusetts) and an F-16XL, ship 2, powered by a single F110-GE-
l 29 engine (General Electric Company, Evendale, Ohio). The F-18 exhaust characteristics were presented
in reference 2. NASA Dryden responsibilities for the F- 18 airplane are discussed in reference 3. For the
F- 16XL, ship 2 tests, the responsibilities were to plan and conduct the flyover tests, record and analyze the
2

flight data, determine the airplane space position, determine the engine exhaust gas flow properties, and
conduct a ground static acoustic survey. NASA Langley responsibilities were to setup the microphone
array, record the noise measurements, merge the acoustic and space position data, analyze and evaluate
the acoustic data, and correlate these data with Dryden-determined engine exhaust properties. The prelim-
inary acoustic results are presented in the footnoted report.
The F-16XL, ship 2, study consisted of flights over a microphone array at varying speeds and
altitudes. Two types of flight tests were conducted: subsonic CTC noise determination and ANOPP pre-
dictive code validation. In the subsonic CTC portion of the study, flyovers were conducted at altitudes
from 3,800 to 12,300 ft and from Mach 0.3 to Mach 0.95 all at an intermediate (maximum nonafterburn-
ing) power setting. For the ANOPP evaluation flyovers, the tests were flown at 3,800 ft and from
Mach 0.3 to Mach 0.95. A static ground-level engine-run test was also conducted over the power settingrange from idle to intermediate power in order to establish baseline exhaust acoustic noise levels with no
forward airplane velocity.
This paper describes the F-16XL airplane and Fl10-GE-129 engine, presents the flight tests per-
formed using the F-16XL airplane, documents the test and analysis techniques used to calculate the
engine flow properties, and presents the engine exhaust flow properties. Acoustics data are not presented.Use of trade names or names of manufacturers in this document does not constitute an official endorse-
ment of such products or manufacturers, either expressed or implied, by the National Aeronautics andSpace Administration.
F-16XL AIRCRAFT DESCRIPTION
The F-16XL airplane has a "cranked" delta wing and is an extensive modification of the F-16 airplane
(fig. 1). Two aircraft were built by Lockheed-Martin (formerly General Dynamics, Fort Worth, Texas).
The F-16XL, ship 2, a two-seat aircraft, has a length of 54.2 ft, a wingspan of 34.3 ft, and a maximum
weight of approximately 36,000 lb. Figure l(a) shows an in-flight photograph and figure l(b) shows a
three-view drawing with key dimensions of this airplane. It has a maximum Mach number of
approximately 2.05 and a nominal design load factor of 9 g which provides a large performance envelope
for flight research. The F-16XL, ship 2, aircraft is powered by a single F 110-GE-129 afterburning turbo-fan engine mounted in the rear fuselage.
Inlet Description
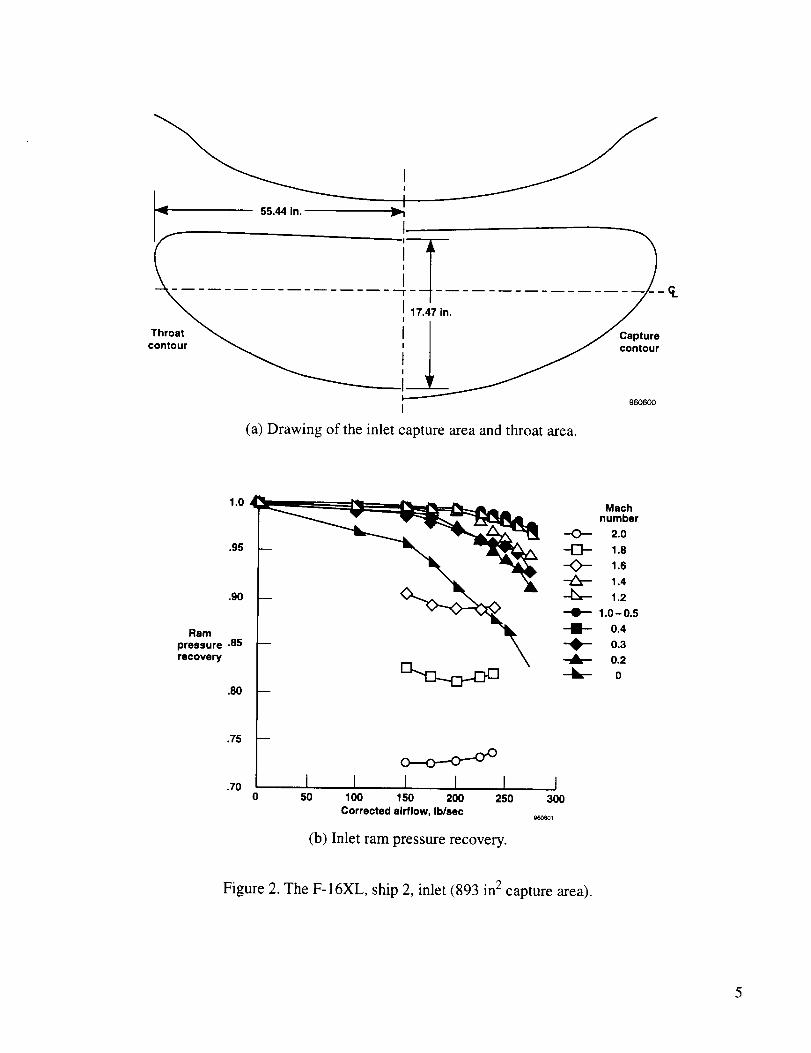
The F-16XL, ship 2, air inlet consists of a normal shock inlet mounted below the front fuselage
followed by an S duct to the engine. Inlet size and pressure recovery characteristics are important in
determining the engine exhaust flow conditions. A front view of the inlet is shown in figure 2(a). The
inlet has a geometric capture area of 893 in 2. This area is 56 in 2 larger than the F-16 A/B small inlet but
slightly smaller than the F- 16 C/D big inlet. Figure 2(b) shows the total pressure recovery of this inlet, as
determined from wind-tunnel tests, for a range of engine-corrected airflows and Mach numbers.
*Jeffrey J. Kelly, Mark R. Wilson, John Rawls Jr., Thomas D. Norum, and Robert A. Golub, F-16XL and F-18 High
Speed Acoustic Flight Test Data Base, NASA CD TM-10006, 1996. (This is a controlled distribution document. Direct
inquiries to the author of this document at NASA Langley Research Center Aeroacoustics Division.)
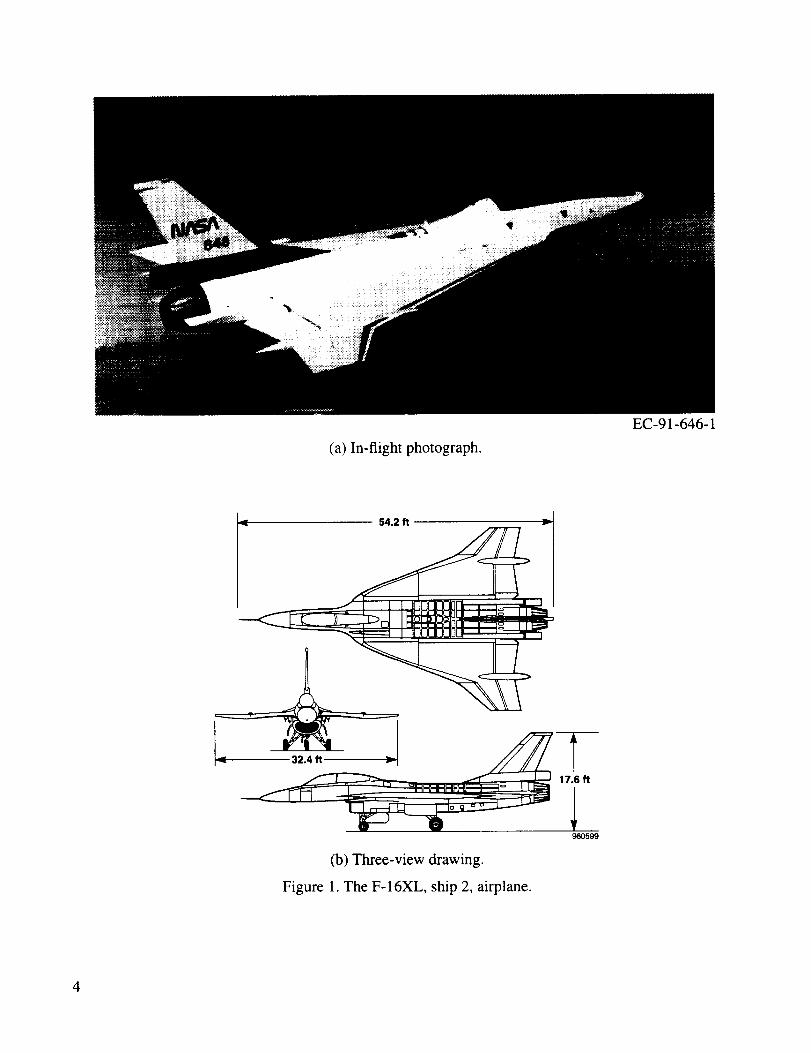
(a) In-flight photograph.
EC-91-646-1
[-- 54.2 _ _,
_.-.-_, _ IUULII.JJU_ '
(b) Three-view drawing.
Figure 1. The F-16XL, ship 2, airplane.
17.6 ft
960599
4
I
55.44 in. _'2
17.47 in.
Throat _ I
contour ___ contour
9606O0
(a) Drawing of the inlet capture area and throat area.
q.
1.0
.95
.90
Ram
pressure .85recovery
,8O
.75
.70 I I I I I I50 1O0 150 200 250 300
Corrected airflow, Iblsec_D601
(b) Inlet ram pressure recovery.
-o--
-El--
-N-
-Q-
Machnumber
2.0
1.8
1.6
1.4
1.2
1.0 - 0.5
0.4
0.3
0.2
0
Figure 2. The F-16XL, ship 2, inlet (893 in 2 capture area).
Engine Description
For the acoustic tests, the F-16XL, ship 2, was powered by the F 110-GE-129 increased performance
engine. This two-spool, low-bypass, axial-flow turbofan engine with afterburner has a maximum thrust of
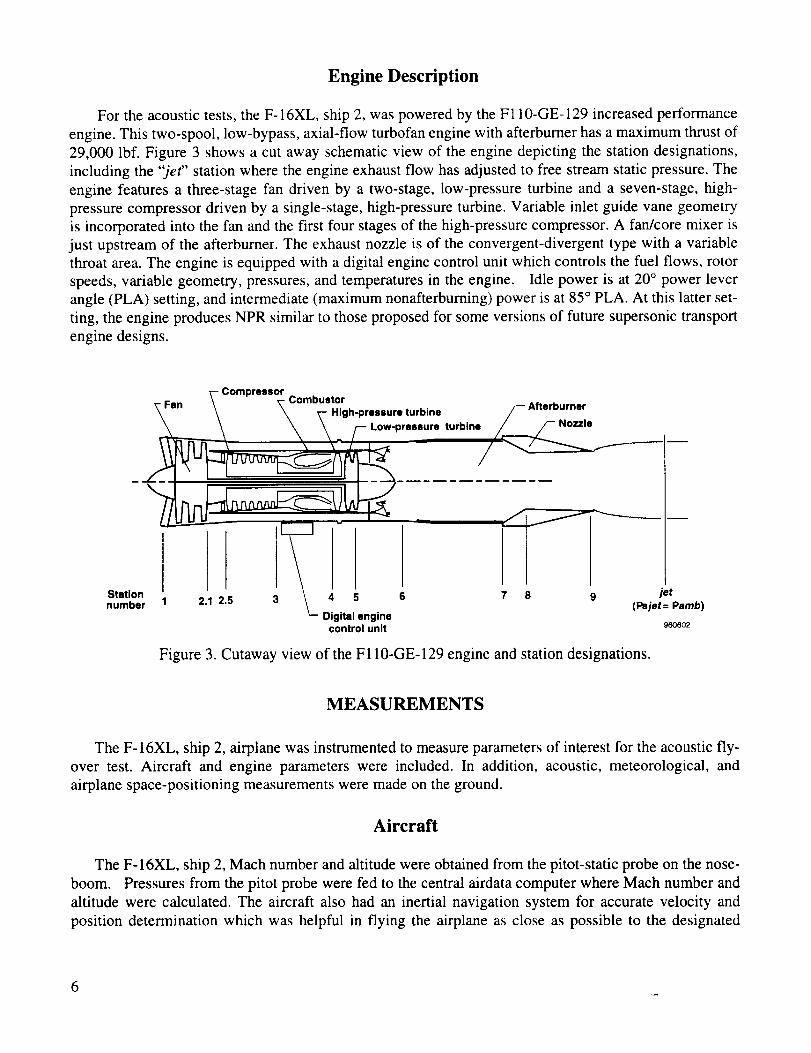
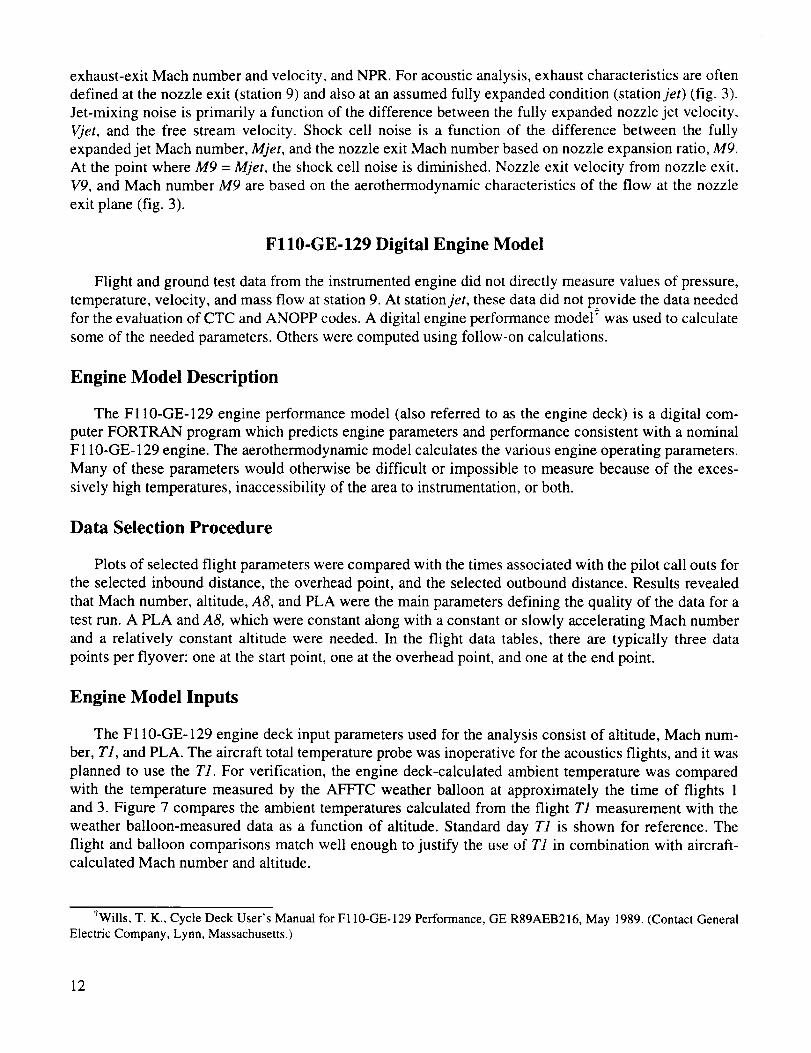
29,000 lbf. Figure 3 shows a cut away schematic view of the engine depicting the station designations,
including the "jet" station where the engine exhaust flow has adjusted to free stream static pressure. The
engine features a three-stage fan driven by a two-stage, low-pressure turbine and a seven-stage, high-
pressure compressor driven by a single-stage, high-pressure turbine. Variable inlet guide vane geometry
is incorporated into the fan and the first four stages of the high-pressure compressor. A fan/core mixer is
just upstream of the afterburner. The exhaust nozzle is of the convergent-divergent type with a variable
throat area. The engine is equipped with a digital engine control unit which controls the fuel flows, rotor
speeds, variable geometry, pressures, and temperatures in the engine. Idle power is at 20 ° power lever
angle (PLA) setting, and intermediate (maximum nonafterburning) power is at 85 ° PLA. At this latter set-
ting, the engine produces NPR similar to those proposed for some versions of future supersonic transport
engine designs.
_- Compressor- Fen \ ,- Combustor_r \ _ _-- High-pressure turbine F Afterburner
\ _ \ /--Low'pressure turbine /___ N°zzle
I ' /L ---- 'Jl I
Station __ jetnumber 2.1 2.5 3 4 5 6 7 8 9 (l_jet= Pamb)
Digital enginecontrol unit 9so602
Figure 3. Cutaway view of the F110-GE-129 engine and station designations.
MEASUREMENTS
The F-16XL, ship 2, airplane was instrumented to measure parameters of interest for the acoustic fly-
over test. Aircraft and engine parameters were included. In addition, acoustic, meteorological, and
airplane space-positioning measurements were made on the ground.
Aircraft
The F-16XL, ship 2, Mach number and altitude were obtained from the pitot-static probe on the nose-
boom. Pressures from the pitot probe were fed to the central airdata computer where Mach number and
altitude were calculated. The aircraft also had an inertial navigation system for accurate velocity and
position determination which was helpful in flying the airplane as close as possible to the designated
6

ground-track profile over the Edwards, California, fly-by line. Angle of attack and angle of sideslip were
measured by vanes on the noseboom. These data were recorded at 10 samples/sec onboard on a lO-bit
pulse code modulation (PCM) data system and were also transmitted to the ground. The airplane was
equipped with a C-band radar beacon to aid in precise space positioning.
Engine
The F110-GE-129 engine was extensively instrumented. For this paper, the parameters of interest are
those used as inputs to and for comparison with the F 110-GE-129 engine deck and for the acoustic analy-
sis. These parameters include PLA; engine face total temperature, T1; fan discharge total pressure, PT2.5;
compressor discharge static pressure, Ps3; core engine fuel flow, WFE; fan rotor speed, N1; core rotor
speed, N2; engine exhaust gas temperature (EGT); and exhaust nozzle physical area at the throat, AS.
Acoustics Measurements
Flyover Tests
For the CTC and ANOPP tests, the acoustic data were measured with an analog and digital micro-
phone array positioned along the flyby line on Rogers Dry Lakebed (fig. 4). This location provided a
good proximity to the tracking radar, an adequate distance from the Edwards, California, main runway,
and a large flat area suitable for acoustics measurements. The analog microphone setup was similar to the
setup used by NASA Dryden during the static ground-run engine acoustic test.
Typical ground
NASA
/
North
Array location
Radar site
Fly-by-line
960603
Figure 4. Ground track and array layout on Rogers Dry Lake, Edwards, CA.

Flyover Space Positioning
The NASA Dryden FPS-16 radar was used to track the radar beacon on F-16XL, ship 2, airplane dur-
ing the acoustic flyovers. These data were used in the control room to assist the pilot in lineup, establish
the time for beginning and completing data runs, and determine the validity of the track for each flyover.
These data were also used by NASA Langley in the postflight analysis to determine the position of the
airplane for correlation with the microphone data.
Static Acoustic Tests
For the static tests conducted by NASA Dryden, a 24-microphone array was located on a large flat
taxiway area (fig. 5). Nominal microphone placement was every 7.5 ° on an arc 99 ft from the engine
exhaust centerline. Inverted microphones were mounted inside windscreens with the diaphragms 0.5 in.
above a thin aluminum plate which was taped to the concrete or asphalt surface. This setup allowed for
measuring acoustic exhaust noise free of ground reflections.
Asphalt O
oConcrete
Concrete
Asphalt
0 00
0
0 ) 0 00
0Nominal spacing
every 7.5 °
OO
O
O
O
O
96O604
Figure 5. Microphone array for the F-16XL, ship 2, ground static acoustic survey.
Figure 6 shows the airplane positioned for the static test. Three of the microphones are visible. The
NASA Dryden acoustics van was used to record the 24 channels of microphone data. Two 14-track taperecorders were installed in the mobile trailer. Twelve channels of acoustic data were recorded on each of
the two recorders; meanwhile, the remaining two channels were used to record the time and the pilot's
event marker. Each of the 24 microphone stations was battery powered and consisted of a condenser
microphone, a preamplifier, and a line driver amplifier. Each station was connected to a separate line
driver by 1000 ft of shielded, coaxial signal cable. The line driver signal was in turn connected to one of
the recorder data channels in the trailer, using a 1000-ft length of neoprene-covered cable containing a
shielded, twisted pair of copper signal wires. The trailer also contained a weather station for recording

local temperatures as well as wind velocity and direction in the area of the microphone array and radios
for communication with the airplane.
Figure 6. Photograph of the F-16XL, ship 2, ground acoustic test showing 3 microphones in foreground.
Meteorology
Atmospheric properties affect the propagation of acoustics and are one of the inputs into the ANOPP.
Conditions for the flight data were determined from four sources:
1. The F-16XL, ship 2, onboard measurements
2. The weather balloons
3. A ground weather station at the acoustics van
4. A tethered balloon located near the flyover array
The onboard measurements were primarily winds aloft data readout from the airplane inertial system and
T1. The tethered balloon was raised and lowered periodically during the tests using a 1500-ft tether.
TEST PROCEDURES
To satisfy dual objectives of the program, two flight tests were conducted: subsonic CTC noise deter-
mination and ANOPP predictive code validation. In both cases, obtaining acoustic data during the period
when the airplane was more than 10° to 15 ° above the horizon as measured from the center of the acous-
tic array was desired. Distances of the start and end points away from the acoustic array were, therefore, a
function of the test altitude. At the lowest test altitude, 1500 ft above ground level (AGL), this distance
was approximately 1 mile. The pilot flew along the fly-by line using a combination of visual navigation,
onboard inertial navigation, and callouts from the control room.
9

Climb-To-Cruise Tests
The flight matrix for the CTC runs consisted of level flight accelerations over the acoustic array at
various Mach numbers and altitudes. During these runs, the engine power setting was constant at 85 °
(intermediate) in order to obtain the maximum engine NPR. Table 1 lists the CTC desired test conditions.
Test altitudes desired varied from an altitude of 3,800-32,300 ft, and the Mach numbers ranged from 0.30to 0.90.
Table 1. Climb-to-cruise test points.
Mach Altitude,
number fl
0.3 3,8000.6 7,3000.65 12,3000.75 22,3000.9 32,300
For the CTC condition, the pilot first stabilized the aircraft at the desired altitude and just below the
desired Mach number. As the airplane approached the acoustic start point, based on a radio call from the
control room, the throttle was advanced to the intermediate power setting. Then the engine was allowed
to stabilize for approximately 5 sec before the start of the test run. The aircraft would accelerate depend-
ing on the degree of excess thrust through the desired test conditions in level flight. Some acoustic runs
were initiated directly over the center of the array with the run terminating when the elevation angle was
again 15 ° above the horizon. At some flight test conditions, the aircraft speed brakes were deployed to
reduce the acceleration during the acoustic data acquisition. Because of aircraft acceleration no data were
obtained at the 22,300 and 32,300 ft altitudes for the F-16XL, ship 2, tests.
ANOPP Tests
The ANOPP code evaluation tests were flown at constant Mach number and at an altitude of 3800 ft
(1500 ft above the local ground level). Test Mach numbers ranged from 0.30 to 0.95 (table 2). For the
ANOPP tests, the throttle setting was the power level flight (PLF) at constant speed and varied from
about 35 ° to 57 ° . For these runs, the pilot was vectored over the microphone array in similar fashion to
the CTC tests. Once power was set, it was not changed during the flyover, so small changes in Mach
number occurred. Speed brakes were not used for ANOPP tests.
Table 2. ANOPP test points.
Mach Altitude, Power setting,
number ft deg
0.3 3800 - 48 °0.6 3800 - 35 °0.8 3800 - 47 °0.95 3800 - 56 °
Table 3 shows the CTC and ANOPP tests that were flown during three flights. Note that all of the
CTC tests resulted in a significant change in Mach number during the run, which was caused by the
10
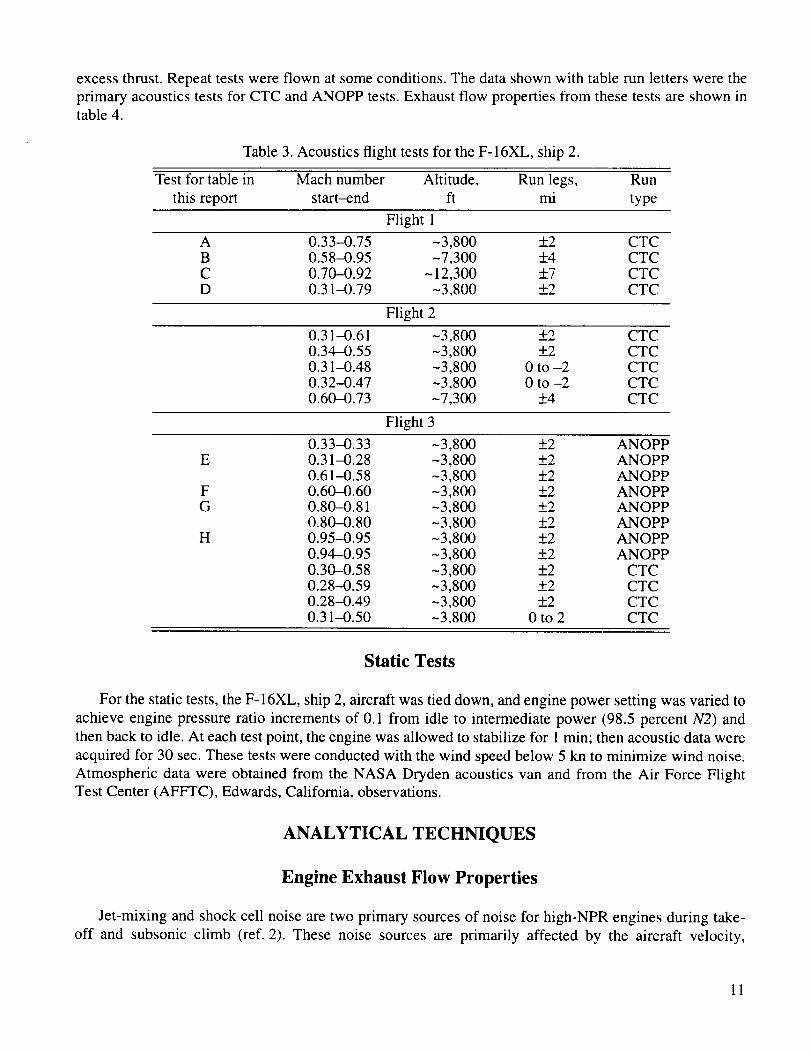
excessthrust.Repeattestswereflown at someconditions.Thedatashownwith tablerun lettersweretheprimary acousticstestsfor CTCandANOPPtests.Exhaustflow propertiesfrom thesetestsareshownintable4.
Table3.Acousticsflight testsfor theF-16XL, ship2.
Testfor tablein Machnumber Altitude, Runlegs, Runthisreport start-end ft mi type
Flight 1A 0.33-0.75 -3,800 +_2 CTCB 0.58-0.95 -7,300 +_4 CTCC 0.70-0.92 - 12,300 +7 CTCD 0.31-0.79 -3,800 +2 CTC
Flight 2
0.31-0.61 -3,800 +-2 CTC0.34-0.55 -3,800 +-2 CTC0.31-0.48 -3,800 0 to -2 CTC0.32-0.47 -3,800 0 to -2 CTC0.60-0.73 -7,300 +4 CTC
Flight 3
E
FG
H
0.33-0.330.31-0.280.61-0.580.60-0.600.80-0.810.80-0.800.95-0.950.94-0.950.30-0.580.28-0.590.28-0.490.31-0.50
-3 800-3 800-3 800-3 800-3 800-3 800-3 800-3 800-3800-3 800-3 800-3 800
+_2 ANOPP+2 ANOPP+2 ANOPP+2 ANOPP+-2 ANOPP+2 ANOPP+2 ANOPP+2 ANOPP+2 CTC+-2 CTC+_2 CTC
0 to 2 CTC
Static Tests
For the static tests, the F- 16XL, ship 2, aircraft was tied down, and engine power setting was varied to
achieve engine pressure ratio increments of 0.1 from idle to intermediate power (98.5 percent N2) and
then back to idle. At each test point, the engine was allowed to stabilize for 1 min; then acoustic data were
acquired for 30 sec. These tests were conducted with the wind speed below 5 kn to minimize wind noise.
Atmospheric data were obtained from the NASA Dryden acoustics van and from the Air Force FlightTest Center (AFFTC), Edwards, California, observations.
ANALYTICAL TECHNIQUES
Engine Exhaust Flow Properties
Jet-mixing and shock cell noise are two primary sources of noise for high-NPR engines during take-
off and subsonic climb (ref. 2). These noise sources are primarily affected by the aircraft velocity,
11
exhaust-exitMachnumberandvelocity, andNPR.For acousticanalysis,exhaustcharacteristicsareoftendefinedatthenozzleexit (station9) andalsoat anassumedfully expandedcondition(stationjet) (fig. 3).
Jet-mixing noise is primarily a function of the difference between the fully expanded nozzle jet velocity,
Vjet, and the free stream velocity. Shock cell noise is a function of the difference between the fully
expanded jet Mach number, Mjet, and the nozzle exit Mach number based on nozzle expansion ratio, M9.
At the point where M9 = Mjet, the shock cell noise is diminished. Nozzle exit velocity from nozzle exit,
V9, and Mach number M9 are based on the aerothermodynamic characteristics of the flow at the nozzle
exit plane (fig. 3).
Fl10-GE-129 Digital Engine Model
Flight and ground test data from the instrumented engine did not directly measure values of pressure,
temperature, velocity, and mass flow at station 9. At station jet, these data did not provide the data needed
for the evaluation of CTC and ANOPP codes. A digital engine performance model t was used to calculate
some of the needed parameters. Others were computed using follow-on calculations.
Engine Model Description
The F110-GE-129 engine performance model (also referred to as the engine deck) is a digital com-
puter FORTRAN program which predicts engine parameters and performance consistent with a nominal
F 110-GE-129 engine. The aerothermodynamic model calculates the various engine operating parameters.
Many of these parameters would otherwise be difficult or impossible to measure because of the exces-
sively high temperatures, inaccessibility of the area to instrumentation, or both.
Data Selection Procedure
Plots of selected flight parameters were compared with the times associated with the pilot call outs for
the selected inbound distance, the overhead point, and the selected outbound distance. Results revealed
that Mach number, altitude, A8, and PLA were the main parameters defining the quality of the data for a
test run. A PLA and A8, which were constant along with a constant or slowly accelerating Mach number
and a relatively constant altitude were needed. In the flight data tables, there are typically three data
points per flyover: one at the start point, one at the overhead point, and one at the end point.
Engine Model Inputs
The F110-GE-129 engine deck input parameters used for the analysis consist of altitude, Mach num-
ber, T1, and PLA. The aircraft total temperature probe was inoperative for the acoustics flights, and it was
planned to use the T1. For verification, the engine deck-calculated ambient temperature was compared
with the temperature measured by the AFFTC weather balloon at approximately the time of flights 1
and 3. Figure 7 compares the ambient temperatures calculated from the flight T1 measurement with the
weather balloon-measured data as a function of altitude. Standard day T1 is shown for reference. The
flight and balloon comparisons match well enough to justify the use of T1 in combination with aircraft-calculated Mach number and altitude.
*Wills, T. K., Cycle Deck User's Manual for F110-GE-129 Performance, GE R89AEB216, May 1989. (Contact GeneralElectric Company, Lynn, Massachusetts.)
12

Ambient
temperature,°C
Ambient
temperature,°C
14
12
10
8
• Flight 1Temperatures
Standard day
• Weather ballon
[] Calculatedfrom airplanemeasured T1
6 D"4
o -- ___ []-2
-4 I I 1 I I m I
20 -- Flight 3
15 -- • •__33 ANOPP points
10
5
0
-s I I I I I I • I3 5 7 9 11 13 15 x 103
Altitude, ft 9soso6
Figure 7. Ambient temperature and standard day temperature for the acoustics flyover tests.
The engine deck uses Mach number and ambient pressure based on altitude to compute the free
stream total pressure. The inlet pressure recovery curve for the F-16XL, ship 2 (fig. 2(b)), was input into
the engine deck to provide the correct engine face pressure recovery.
13
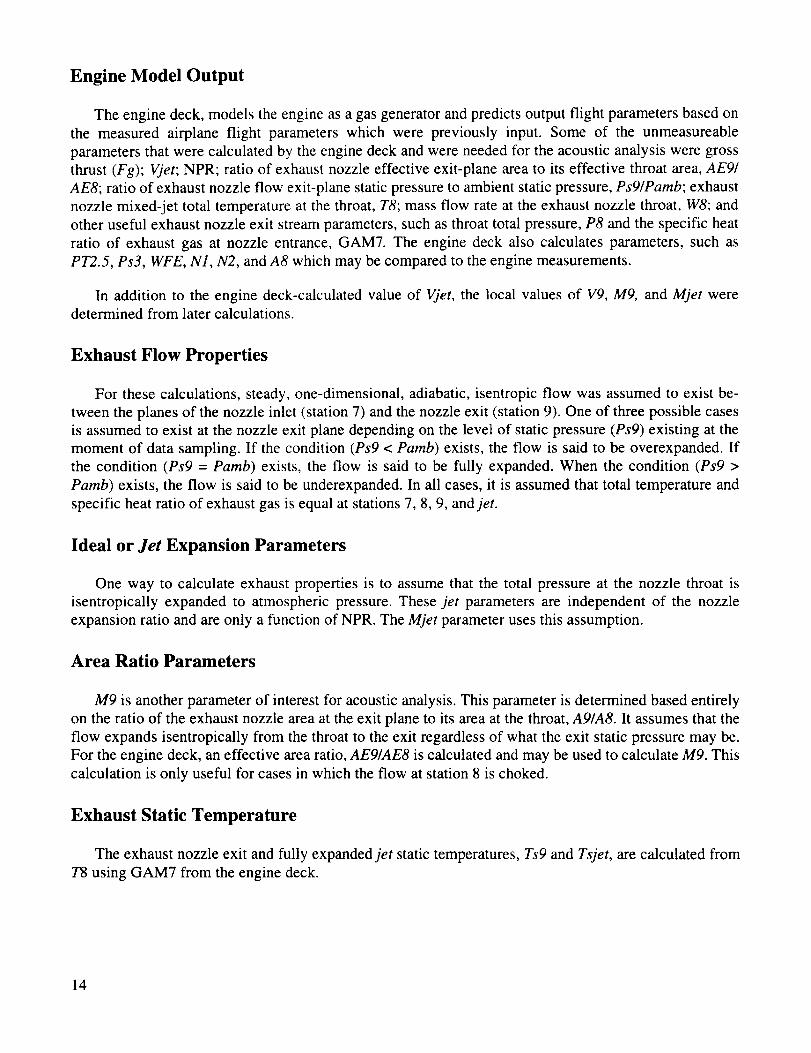
Engine Model Output
The engine deck, models the engine as a gas generator and predicts output flight parameters based on
the measured airplane flight parameters which were previously input. Some of the unmeasureable
parameters that were calculated by the engine deck and were needed for the acoustic analysis were gross
thrust (Fg); Vjet; NPR; ratio of exhaust nozzle effective exit-plane area to its effective throat area, AE9/
AE8; ratio of exhaust nozzle flow exit-plane static pressure to ambient static pressure, Ps9/Pamb; exhaust
nozzle mixed-jet total temperature at the throat, T8; mass flow rate at the exhaust nozzle throat, W8; and
other useful exhaust nozzle exit stream parameters, such as throat total pressure, P8 and the specific heat
ratio of exhaust gas at nozzle entrance, GAM7. The engine deck also calculates parameters, such as
PT2.5, Ps3, WFE, N1, N2, and A8 which may be compared to the engine measurements.
In addition to the engine deck-calculated value of Vjet, the local values of V9, M9, and Mjet were
determined from later calculations.
Exhaust Flow Properties
For these calculations, steady, one-dimensional, adiabatic, isentropic flow was assumed to exist be-
tween the planes of the nozzle inlet (station 7) and the nozzle exit (station 9). One of three possible cases
is assumed to exist at the nozzle exit plane depending on the level of static pressure (Ps9) existing at the
moment of data sampling. If the condition (Ps9 < Pamb) exists, the flow is said to be overexpanded. If
the condition (Ps9 = Pamb) exists, the flow is said to be fully expanded. When the condition (Ps9 >
Pamb) exists, the flow is said to be underexpanded. In all cases, it is assumed that total temperature and
specific heat ratio of exhaust gas is equal at stations 7, 8, 9, and jet.
Ideal or Jet Expansion Parameters
One way to calculate exhaust properties is to assume that the total pressure at the nozzle throat is
isentropically expanded to atmospheric pressure. These jet parameters are independent of the nozzle
expansion ratio and are only a function of NPR. The Mjet parameter uses this assumption.
Area Ratio Parameters
M9 is another parameter of interest for acoustic analysis. This parameter is determined based entirely
on the ratio of the exhaust nozzle area at the exit plane to its area at the throat, A9/A8. It assumes that the
flow expands isentropically from the throat to the exit regardless of what the exit static pressure may be.
For the engine deck, an effective area ratio, AE9/AE8 is calculated and may be used to calculate M9. This
calculation is only useful for cases in which the flow at station 8 is choked.
Exhaust Static Temperature
The exhaust nozzle exit and fully expanded jet static temperatures, Ts9 and Tsjet, are calculated from
7'8 using GAM7 from the engine deck.
14
Local Speed of Sound and Exhaust Velocities
The speed of sound propagation in the hot gas stream was calculated using conventional gas dynam-
ics relationships, then multiplied by the Mach number to arrive at the exhaust velocities. These calcula-
tions were performed in a follow-on program to supplement the engine deck outputs.
RESULTS AND DISCUSSION
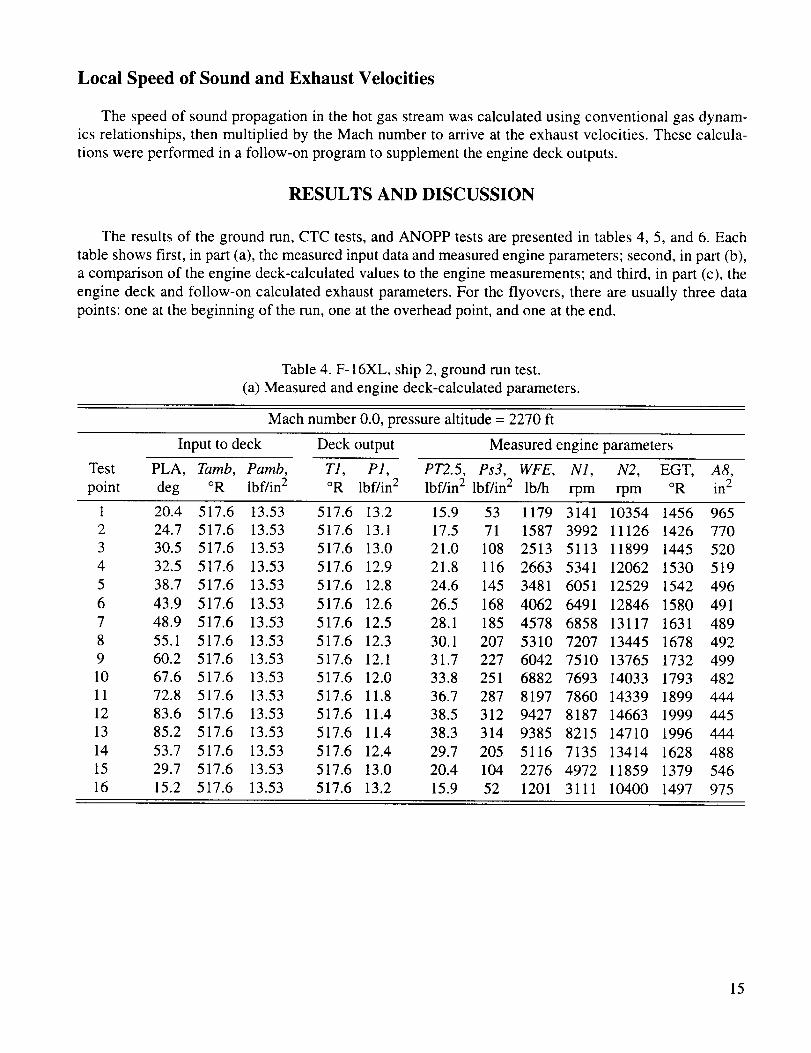
The results of the ground run, CTC tests, and ANOPP tests are presented in tables 4, 5, and 6. Each
table shows first, in part (a), the measured input data and measured engine parameters; second, in part (b),
a comparison of the engine deck-calculated values to the engine measurements; and third, in part (c), the
engine deck and follow-on calculated exhaust parameters. For the flyovers, there are usually three data
points: one at the beginning of the run, one at the overhead point, and one at the end.
Table 4. F-16XL, ship 2, ground run test.
(a) Measured and engine deck-calculated parameters.
Mach number 0.0, pressure altitude = 2270 ft
Input to deck Deck output
Test PLA, Tamb, Pamb, T1, P1,
point deg °R lbf/in 2 °R lbffin 2
Measured engine parameters
PT2.5, Ps3, WFE, N1, N2, EGT, A8,
lbf/in 2 lbf/in 2 lb/h rpm rpm °R in 2
1 20.4 517.6 13.53 517.6 13.2 15.9 53 1179 3141 10354 1456 965
2 24.7 517.6 13.53 517.6 13.1 17.5 71 1587 3992 11126 1426 770
3 30.5 517.6 13.53 517.6 13.0 21.0 108 2513 5113 11899 1445 520
4 32.5 517.6 13.53 517.6 12.9 21.8 116 2663 5341 12062 1530 519
5 38.7 517.6 13.53 517.6 12.8 24.6 145 3481 6051 12529 1542 496
6 43.9 517.6 13.53 517.6 12.6 26.5 168 4062 6491 12846 1580 491
7 48.9 517.6 13.53 517.6 12.5 28.1 185 4578 6858 13117 1631 489
8 55.1 517.6 13.53 517.6 12.3 30.1 207 5310 7207 13445 1678 492
9 60.2 517.6 13.53 517.6 12.1 31.7 227 6042 7510 13765 1732 499
10 67.6 517.6 13.53 517.6 12.0 33.8 251 6882 7693 14033 1793 482
11 72.8 517.6 13.53 517.6 11.8 36.7 287 8197 7860 14339 1899 444
12 83.6 517.6 13.53 517.6 11.4 38.5 312 9427 8187 14663 1999 445
13 85.2 517.6 13.53 517.6 11.4 38.3 314 9385 8215 14710 1996 444
14 53.7 517.6 13.53 517.6 12.4 29.7 205 5116 7135 13414 1628 488
15 29.7 517.6 13.53 517.6 13.0 20.4 104 2276 4972 11859 1379 546
16 15.2 517.6 13.53 517.6 13.2 15.9 52 1201 3111 10400 1497 975
15
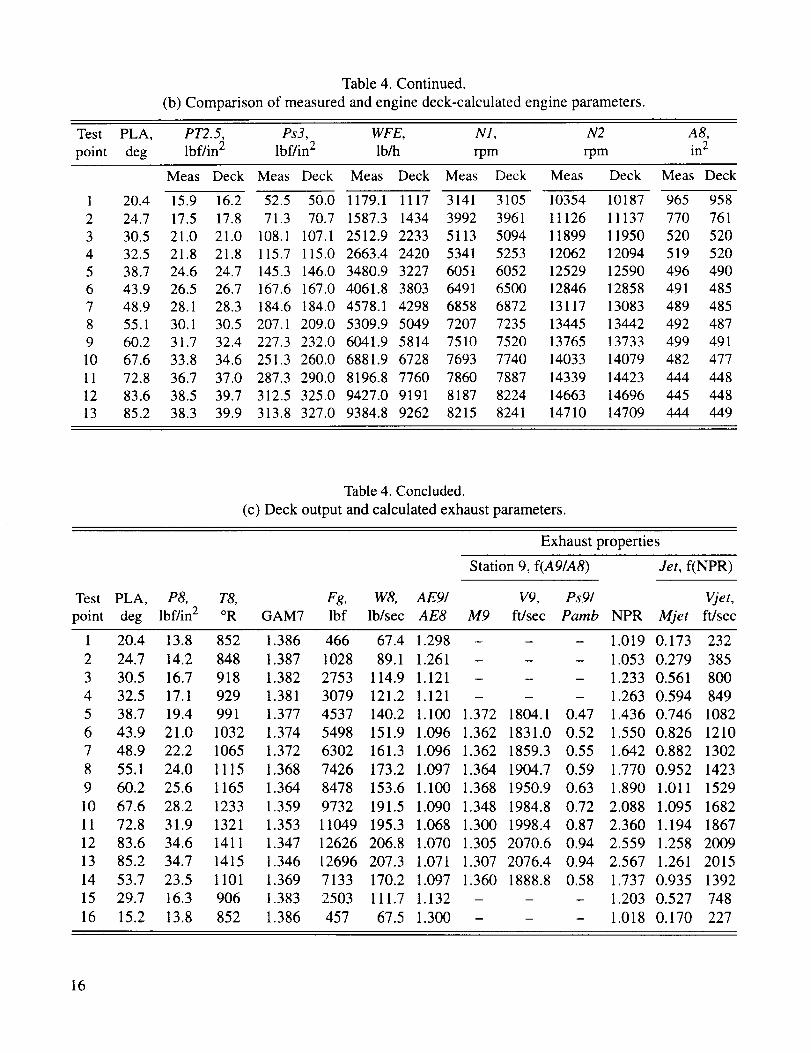
Table 4. Continued.
(b) Comparison of measured and engine deck-calculated engine parameters.
Test PLA, PT2.5, Ps3, WFE, N1, N2 A8,
point deg lbf/in 2 lbf/in 2 lb/h rpm rpm in2
Meas Deck Meas Deck Meas Deck Meas Deck Meas Deck Meas Deck
20.4 15.9 16.2 52.5 50.0 1179.1 1117 3141 3105 965 958
24.7 17.5 17.8 71.3 70.7 1587.3 1434 3992 3961 770 761
30.5 21.0 21.0 108.1 107.1 2512.9 2233 5113 5094 520 520
32.5 21.8 21.8 115.7 115.0 2663.4 2420 5341 5253 519 520
38.7 24.6 24.7 145.3 146.0 3480.9 3227 6051 6052 496 490
1
2
3
4
5
6
7
8
9
10
11
12
13
43.9
48.9
55.1
60.2
67.6
72.8
83.6
85.2
26.5 26.7 167.6 167.0 4061.8 3803 6491 6500
28.1 28.3 184.6 184.0 4578.1 4298 6858 6872
30.1 30.5 207.1 209.0 5309.9 5049 7207 7235
31.7 32.4 227.3 232.0 6041.9 5814 7510 7520
33.8 34.6 251.3 260.0 6881.9 6728 7693 7740
36.7 37.0 287.3 290.0 8196.8 7760 7860 7887
38.5 39.7 312.5 325.0 9427.0 9191 8187 8224
38.3 39.9 313.8 327.0 9384.8 9262 8215 8241
10354 10187
11126 11137
11899 11950
12062 12094
12529 12590
12846 12858 491 485
13117 13083 489 485
13445 13442 492 487
13765 13733 499 491
14033 14079 482 477
14339 14423 444 448
14663 14696 445 448
14710 14709 444 449
Table 4. Concluded.
(c) Deck output and calculated exhaust parameters.
Test PLA, P8, T8,
point deg lbffin 2 °R
Fg, W8, AE9/
GAM7 lbf lb/sec AE8
Exhaust properties
Station 9, f(A9/A8) Jet, f(NPR)
vg, Psg/ Vjet,
M9 ft/sec Pamb NPR Mjet ft/sec
1 20.4 13.8 852
2 24.7 14.2 848
3 30.5 16.7 918
4 32.5 17.1 929
5 38.7 19.4 991
6 43.9 21.0 1032
7 48.9 22.2 1065
8 55.1 24.0 1115
9 60.2 25.6 1165
10 67.6 28.2 1233
11 72.8 31.9 1321
12 83.6 34.6 1411
13 85.2 34.7 1415
14 53.7 23.5 1101
15 29.7 16.3 906
16 15.2 13.8 852
1.386
1.387
1.382
1.381
1.377
1.374
1.372
1.368
1.364
1.359
466 67.4 1.298 - - - 1.019 0.173 232
1028 89.1 1.261 - - - 1.053 0.279 385
2753 114.9 1.121 - - - 1.233 0.561 800
3079 121.2 1.121 - - - 1.263 0.594 849
4537 140.2 1.100 1.372 1804.1 0.47 1.436 0.746 1082
5498 151.9 1.096 1.362 1831.0 0.52 1.550 0.826 1210
6302 161.3 1.096 1.362 1859.3 0.55 1.642 0.882 1302
7426 173.2 1.097 1.364 1904.7 0.59 1.770 0.952 1423
8478 153.6 1.100 1.368 1950.9 0.63 1.890 1.011 1529
9732 191.5 1.090 1.348 1984.8 0.72 2.088 1.095 1682
1.353 11049 195.3 1.068 1.300 1998.4 0.87 2.360 1.194 1867
1.347 12626 206.8 1.070 1.305 2070.6 0.94 2.559 1.258 2009
1.346 12696 207.3 1.071 1.307 2076.4 0.94 2.567 1.261 2015
1.369 7133 170.2 1.097 1.360 1888.8 0.58 1.737 0.935 1392
1.383 2503 111.7 1.132 - - - 1.203 0.527 748
1.386 457 67.5 1.300 - - - 1.018 0.170 227
16

Table5. CTCtestdata.(a)CTCmeasuredandinput to deckdata.
Measuredandcalculatedinputstodeck Calculatedbydeck Measured engine data
PLA, Mach Altitude, T1, Tamb, Pamb, P1, PT2.5, Ps3, WFE, N1, N2, EGT, A8,
Test Segment deg number ft °R °R lbf/in 2 lbf/in 2 lbf/in 2 lbf/in 2 lb/h rpm rpm °R in2
A Start 85.0 0.344A OH 85.0 0.557A End 85.0 0.758B Start 85.1 0.622
B OH 85.0 0.852B End 85.0 0.945C OH 85.0 0.684
C End 85.0 0.946D Start 85.1 0.329D OH 85.1 0.563
D End 85.1 0.755
3565 520.9 508.9 12.90 13.72 45.6 381 10789 8305 14686 1846 4463610 538.5 507.1 12.88 15.58 53.2 440 12911 8470 14936 2153 4463603 563.4 505.3 12.89 18.47 61.8 500 14654 8536 15060 2027 4477042 540.1 501.3 11.32 14.18 49.3 410 12071 8470 14887 1920 446
7040 569.6 497.4 11.32 17.83 58.9 477 13869 8547 15044 2156 4477035 585.5 496.8 11.33 19.73 63.1 501 14853 8566 15029 2190 44711975 543.4 496.9 09.36 12.54 42.6 356 10724 8486 14866 1998 445
12060 581.3 493.1 09.32 16.26 52.5 422 12442 8556 15044 2160 4473498 521.3 510.3 12.93 13.66 44.9 376 11033 8300 14607 1821 4463540 541.6 509.3 12.91 15.69 53.7 447 13005 8492 14960 2130 446
3558 563.6 486.1 12.90 18.45 61.4 499 12957 8520 15094 2136 446
Table 5. Continued.
(b) Comparison of measured and deck-calculated engine parameters.
PLA, Mach PT2.5, Ps3, WFE,Test Segment deg number lbf/in 2 lbf/in 2 lb/h
N1, N2, A8,rpm rpm in2
A StartA OH
A EndB Start
B OHB End
C OH
C End
D Start
D OHD End
Meas Deck Meas Deck Meas Deck Meas Deck Meas Deck Meas Deck
85.0 0.344 45.6 47.9 381 395 10789 11099 8305 8295 14686 14775 446 450
85.0 0.557 53.2 55.0 440 456 12911 13161 8470 8469 14936 15034 446 451
85.0 0.758 61.8 63.0 500 511 14654 14797 8536 8535 15060 15098 447 452
85.1 0.622 49.3 50.9 410 420 12071 12173 8470 8476 14887 15049 446 45085.0 0.852 58.9 59.9 477 482 13869 13834 8547 8542 15044 15039 447 452
85.0 0.945 63.1 64.2 501 508 14853 14609 8566 8561 15029 15078 447 452
85.0 0.684 42.6 44.1 356 392 10724 10577 8486 8490 14866 15066 445 450
85.0 0.946 52.5 53.7 422 456 12442 12357 8556 8556 15044 15074 447 447
85.1 0.329 44.9 47.6 376 392 11033 11020 8300 8287 14607 14772 446 449
85.1 0.563 53.7 55.3 447 456 13005 13208 8492 8482 14960 15057 446 451
85.1 0.755 61.4 64.4 499 529 14700 15215 8520 8482 15094 15009 446 452
17

Table 5. Concluded.
(c) CTC deck and calculated parameters.
PLA, Mach P8, T8, W8, Fg, AE9/
Test Segment deg number Ibf/in 2 °R GAM7 Ib/sec lb AE8
Exhaust characteristics
Station 9, f(AE9/AE8) Jet, f(NPR)
V9, Ps9/ Vjet,
M9 ft/sec Pamb NPR Mjet ft/sec
A
A
A
B
B
B
C
C
D
D
D
Start 85.0 0.344 41.8 1422 1.346 248.5 16793 1.199 1.520 2328 0.88 3.24 1.428 2223
OH 85.0 0.557 48.2 1480 1.342 280.5 20401 1.224 1.553 2412 0.96 3.74 1.528 2382
End 85.0 0.758 54.4 1488 1.342 319.3 24189 1.224 1.553 2419 1.09 4.22 1.610 2478
Start 85.1 0.622 44.5 1484 1.342 258.7 19145 1.223 1.553 2415 1.01 3.93 1.562 2422
OH 85.0 0.852 51.2 1481 1.343 304.2 23416 1.224 1.553 2413 1.17 4.52 1.656 2519
End 85.0 0.945 54.4 1484 1.342 325.2 25462 1.224 1.553 2416 1.24 4.80 1.696 2562
OH 85.0 0.684 38.5 1489 1.342 224.2 16852 1.223 1.552 2418 1.06 4.11 1.593 2460
End 85.0 0.946 46.0 1496 !.342 269.9 21343 1.221 1.549 2421 1.28 4.93 1.713 2590
Start 85.1 0.329 41.6 1421 1.346 247.1 16647 1.194 1.510 2317 0.88 3.22 1.423 2216
OH 85.1 0.563 48.3 1493 !.342 281.2 20488 1.224 1.553 2423 0.97 3.74 1.529 2386
End 85.1 0.755 55.7 1466 1.343 330.8 25016 1.224 1.553 2401 1.11 4.32 1.625 2474
Table 6. ANOPP flyover test data.
(a) ANOPP flyover measured input data to deck.
Engine data
Measured and calculated
inputs to deck Calculated by deck Measured engine parameters
PLA Mach Altitude, T1, Tamb, Pamb, P1, PT2.5, Ps3, WFE, N1, N2, EGT, A8,
Test Segment deg number ft °R °R lbf/in 2 lbf/in 2 lbf/in 2 lbf/in 2 lb/h rpm rpm °R in 2
E Start 48.5 0.308
E OH 48.5 0.300
E End 48.5 0.282
F Start 35.1 0.603
F OH 35.1 0.601
F End 34.8 0.605
G Start 46.6 0.793
G OH 46.6 0.804
G End 46.6 0.814
H Start 55.5 0.946
H OH 55.6 0.955
H End 55.5 0.947
3783 530.0 520.1 12.79 13.40 30.3 201.1 4736 6948 13314 1620 478
3730 530.3 520.9 12.82 13.37 30.1 200.0 5285 6936 13304 1608 480
3648 529.1 520.8 12.86 13.31 29.9 198.5 4619 6937 13290 1607 478
3780 558.6 520.7 12.80 16.03 31.8 194.2 4360 6396 13321 1576 463
3740 559.0 521.3 12.82 16.03 31.8 193.8 4332 6388 13316 1579 463
3750 561.3 523.0 12.81 16.08 31.8 194.0 4332 6381 13318 1565 459
3728 584.5 519.2 12.82 19.02 43.5 289.3 7148 7317 14069 1741 469
3735 586.5 519.4 12.82 19.23 43.8 291.1 7221 7306 14064 1741 469
3770 589.1 520.2 12.80 19.39 43.8 293.2 7185 7308 14079 1757 468
3753 610.9 518.2 12.81 22.34 54.8 379.8 9992 7815 14576 1882 471
3745 611.8 517.5 12.81 22.57 55.3 382.0 9864 7823 14590 1747 474
3742 611.8 518.8 12.82 22.37 54.8 379.5 9864 7806 14576 1719 472
18
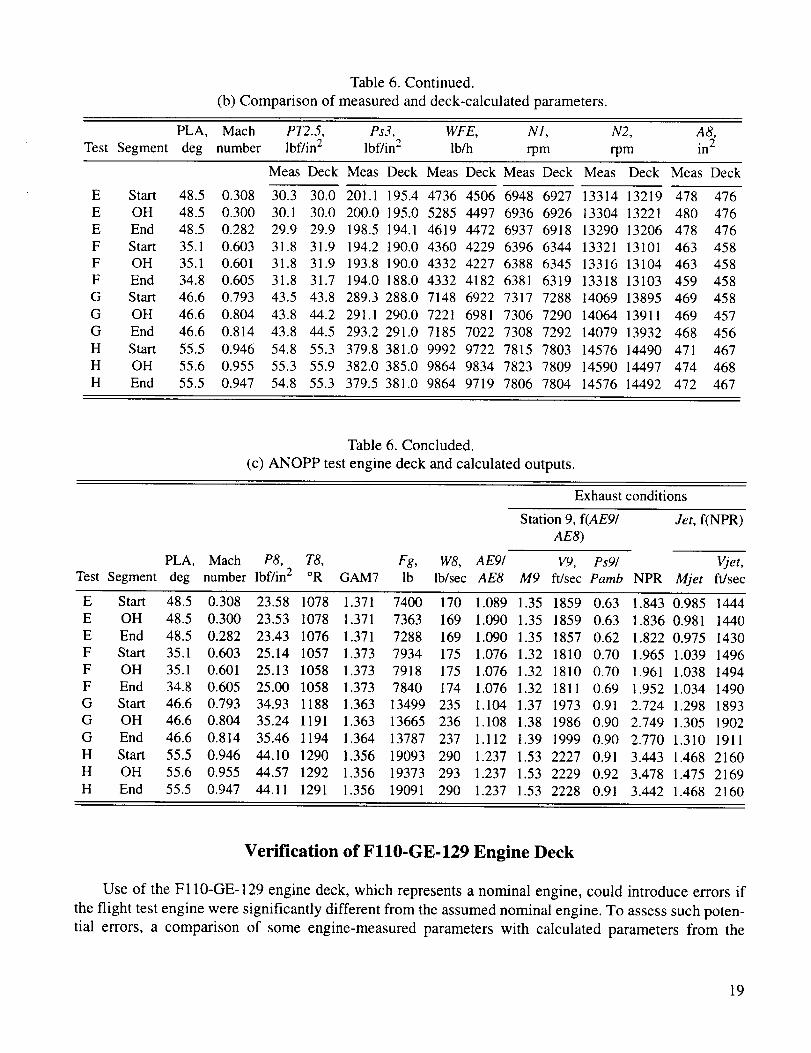
Table 6. Continued.
(b) Comparison of measured and deck-calculated parameters.
PLA, Mach PT2.5, Ps3, WFE, N1, N2, A8,
Test Segment deg number lbf/in 2 lbf/in 2 lb/h rpm rpm in 2
E Start
E OH
E End
F StartF OH
F End
G Start
G OH
G End
H StartH OH
H End
Meas Deck Meas Deck Meas Deck Meas Deck Meas Deck Meas Deck
48.5 0.308 30.3 30.0 201.1 195.4 4736 4506 6948 6927 13314 13219 478 476
48.5 0.300 30.1 30.0 200.0 195.0 5285 4497 6936 6926 13304 13221 480 476
48.5 0.282 29.9 29.9 198.5 194.1 4619 4472 6937 6918 13290 13206 478 476
35.1 0.603 31.8 31.9 194.2 190.0 4360 4229 6396 6344 13321 13101 463 45835.1 0.601 31.8 31.9 193.8 190.0 4332 4227 6388 6345 13316 13104 463 458
34.8 0.605 31.8 31.7 194.0 188.0 4332 4182 6381 6319 13318 13103 459 458
46.6 0.793 43.5 43.8 289.3 288.0 7148 6922 7317 7288 14069 13895 469 458
46.6 0.804 43.8 44.2 291.1 290.0 7221 6981 7306 7290 14064 13911 469 457
46.6 0.814 43.8 44.5 293.2 291.0 7185 7022 7308 7292 14079 13932 468 456
55.5 0.946 54.8 55.3 379.8 381.0 9992 9722 7815 7803 14576 14490 471 467
55.6 0.955 55.3 55.9 382.0 385.0 9864 9834 7823 7809 14590 14497 474 46855.5 0.947 54.8 55.3 379.5 381.0 9864 9719 7806 7804 14576 14492 472 467
Table 6. Concluded.
(c) ANOPP test engine deck and calculated outputs.
PLA, Mach P8, T8, Fg,Test Segment deg number lbf/in 2 °R GAM7 lb
Exhaust conditions
Station 9, f(AE9/ Jet, f(NPR)
AE8)
W8, AE9/ V9, Ps9/ Vjet,
lb/sec AE8 M9 ft/sec Pamb NPR Mjet ft/sec
E Start
E OHE End
F Start
F OH
F EndG Start
G OH
G End
H Start
H OH
H End
48.5 0.308 23.58 1078 1.371 7400 170 1.089 1.35 1859 0.63 1.843 0.985 1444
48.5 0.300 23.53 1078 1.371 7363 169 1.090 1.35 1859 0.63 1.836 0.981 1440
48.5 0.282 23.43 1076 1.371 7288 169 1.090 1.35 1857 0.62 1.822 0.975 1430
35.1 0.603 25.14 1057 1.373 7934 175 1.076 1.32 1810 0.70 1.965 1.039 1496
35.1 0.601 25.13 1058 1.373 7918 175 1.076 1.32 1810 0.70 1.961 1.038 149434.8 0.605 25.00 1058 1.373 7840 174 1.076 1.32 1811 0.69 1.952 1.034 1490
46.6 0.793 34.93 1188 1.363 13499 235 1.104 1.37 1973 0.91 2.724 1.298 1893
46.6 0.804 35.24 1191 1.363 13665 236 1.108 1.38 1986 0.90 2.749 1.305 190246.6 0.814 35.46 1194 1.364 13787 237 1.112 1.39 1999 0.90 2.770 1.310 1911
55.5 0.946 44.10 1290 1.356 19093 290 1.237 1.53 2227 0.91 3.443 1.468 2160
55.6 0.955 44.57 1292 1.356 19373 293 1.237 1.53 2229 0.92 3.478 1.475 216955.5 0.947 44.11 1291 1.356 19091 290 1.237 1.53 2228 0.91 3.442 1.468 2160
Verification of F110-GE-129 Engine Deck
Use of the F 110-GE-129 engine deck, which represents a nominal engine, could introduce errors if
the flight test engine were significantly different from the assumed nominal engine. To assess such poten-
tial errors, a comparison of some engine-measured parameters with calculated parameters from the
19

engine deck was made. Tables 4(b), 5(b), and 6(b) compare the airplane-measured parameters with the
engine deck-calculated parameters. There are six measured engine parameters (in addition to the PLA,
T1, altitude, and Mach number that are inputs to the engine deck) that may be compared with engine
deck-calculated parameters. These are N1, N2, PT2.5, Ps3, WFE, and A8. Inspection of these tables
shows very good agreement for these comparisons, indicating that the engine deck is a good representa-
tion of the engine flown in the F-16XL, ship 2. Plots of the comparisons are shown in figure 8 for the
ground run, figure 9 for the CTC tests, and fig 10 for the ANOPP tests. The ground run, CTC, and
ANOPP flyover data show good to excellent agreement between measured and calculated
engine parameters.
PT2.5,
Ibf/in 2
40 400
3O
2O
I0
300
Ps3, 200Ibf/in 2
100
I I o
Parameters
[] Deck calculation
• Measured
Fuel flow,Ib/hr
10,000
8,000
6,000
4,000
2,000
0 i I
N1,rpm
10,000
8,000
6,000
4,000
2,000
0 I I
15,000 1000800f __;
14,000
600
rpm 12,000 A8, I Iin2 400 --
10,000200
8,ooo I I I0 50 100 0 50 100
PLA, dag PLA, deg 9_oo7
Figure 8. Comparison of measured and deck-calculated parameters, ground run.
20
PT 2.5,Ibf/in 2
70
65
60
55
5O
45
40
35
30
_3,500 ft r-_
altitude --_
-- altitude
I f I
570
520
470
Ps 3, 420
Ibf/in2 370
320
27O
220
Parameters
D Deck calculation
• Measuredm
3,500 ft
altitude__
-- _7,000"_ ! _ l:;O0:dfte
altitude
I 1 I I
16,000
14,000
WFE, 12,000Ib/sec
10,000
8,000
r 3,500 ft _ •
altitude--_
N1,rpm
8600 --
8550 --
8500 --
8450 --
8400 --
8350 --
8300 _
8250 I I I I
N2,rpm
15,100 _ _['-][-'][_]mm[] _14,600
14,1 O0
13,600
A8,
in 2
48o450
440
430 n
420 --
410.3
13,100 I I I I I I I I.3 .5 .7 .9 1.1 .5 .7 .9 1.1
Mach number Mach number960608
Figure 9. Comparison of measured and deck-calculated parameters, climb-to-cruise tests.
21

PT2.5,
Ibf/in 2
WFE,Ib/hr
60
50
40
30
20
10
0
10,000
8,000
6,000
4,000
2,000
0
!
B
@
Ps3,Ibf/in 2
N1,
_ rpm
I I
400 --
300--
200 --
100 --
0
8000--
6000 --
4000 --
2000--
0
Parameters
[] Deck calculation
• Measured
I I
I I
N2,rpm
15,000
14,500
14,000
13,500 m
A8,in 2
5O(:)
480
460
440
420
4OO
D
e, e
13,ooo I I I0 .50 1.0 0 .50 1.0
Mach number Mach number96o6o9
Figure 10. Comparison of measured and deck-calculated parameters, ANOPP tests.
Another indication of the quality of these engine deck data may be inferred from figure 7 whichshows temperatures of no more than 10 °C from standard day temperature and not much variation for the
2 test days. Cycle decks tend to be less accurate as deviations from standard day temperature (where
much of the cycle deck data were obtained) increase.
22
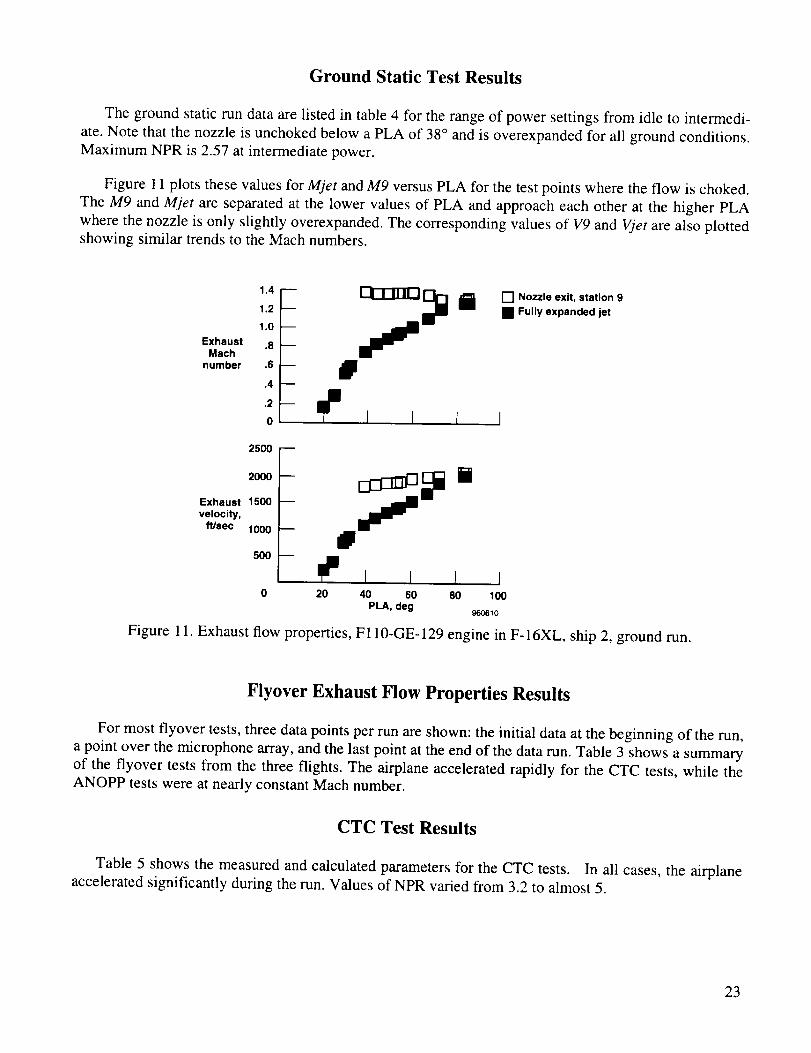
Ground Static Test Results
The ground static run data are listed in table 4 for the range of power settings from idle to intermedi-
ate. Note that the nozzle is unchoked below a PLA of 38 ° and is overexpanded for all ground conditions.Maximum NPR is 2.57 at intermediate power.
Figure 11 plots these values for Mjet and M9 versus PLA for the test points where the flow is choked.
The M9 and Mjet are separated at the lower values of PLA and approach each other at the higher PLA
where the nozzle is only slightly overexpanded. The corresponding values of V9 and Vjet are also plottedshowing similar trends to the Mach numbers.
Exhaust
Mach
number
1.4
1.2
1.0
.8
k
m
m
B6 B.2
0
[] Nozzle exit, station 9
• Fully expanded jet
2500
2OOO
Exhaust 1500
velocity,ft/sec
m
m
1000 -- O
I I0 20 40 60 80 100
PLA, deg _o61o
Figure 11. Exhaust flow properties, F110-GE-129 engine in F-16XL, ship 2, ground run.
Flyover Exhaust Flow Properties Results
For most flyover tests, three data points per run are shown: the initial data at the beginning of the run,
a point over the microphone array, and the last point at the end of the data run. Table 3 shows a summaryof the flyover tests from the three flights. The airplane accelerated rapidly for the CTC tests, while theANOPP tests were at nearly constant Mach number.
CTC Test Results
Table 5 shows the measured and calculated parameters for the CTC tests. In all cases, the airplaneaccelerated significantly during the run. Values of NPR varied from 3.2 to almost 5.
23
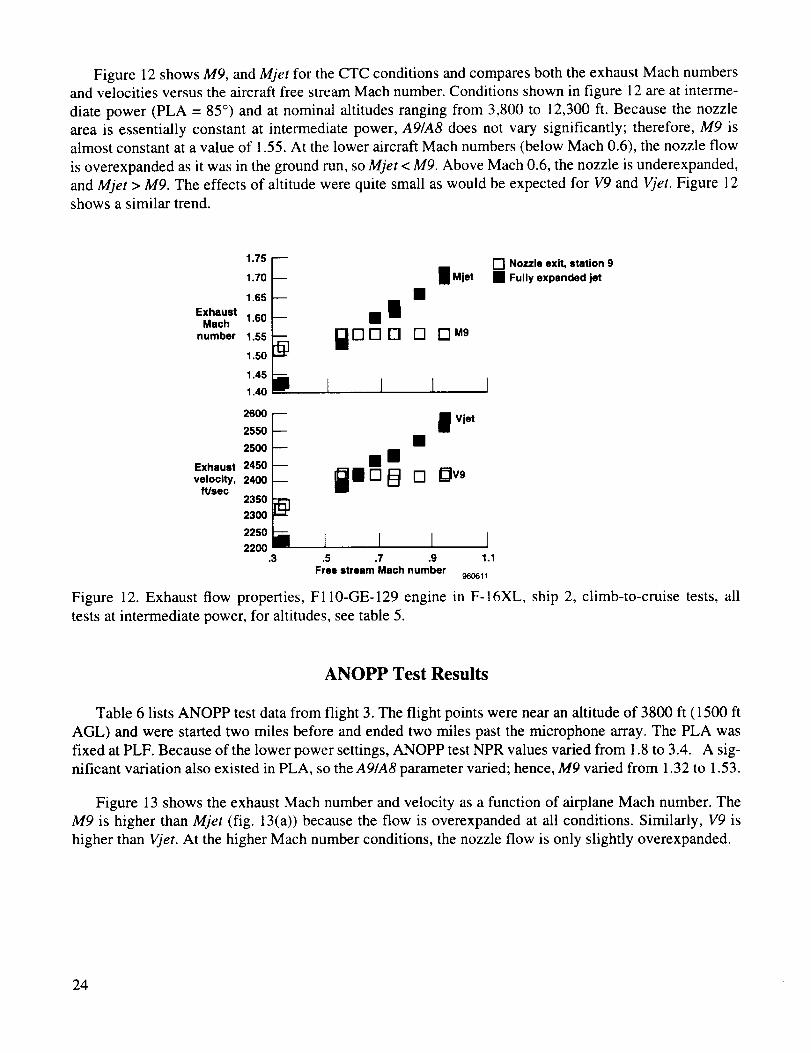
Figure12showsM9, and Mjet for the CTC conditions and compares both the exhaust Mach numbersand velocities versus the aircraft free stream Mach number. Conditions shown in figure 12 are at interme-
diate power (PLA = 85 °) and at nominal altitudes ranging from 3,800 to 12,300 ft. Because the nozzle
area is essentially constant at intermediate power, A9/A8 does not vary significantly; therefore, M9 is
almost constant at a value of 1.55. At the lower aircraft Mach numbers (below Mach 0.6), the nozzle flow
is overexpanded as it was in the ground run, so Mjet < M9. Above Mach 0.6, the nozzle is underexpanded,
and Mjet > M9. The effects of altitude were quite small as would be expected for V9 and Vjet. Figure 12
shows a similar trend.
1.75 --
1.70 --
1.65
ExhaustMach 1.60 --
number 1.55-
1.50 _]
1.45 --
1.40 •
2600 --
2550 --
2500 --
Exhaust 2450 --velocity, 2400 --
Wsec23502300 _]
2250 i2200
.3
l Mjet
[] rlM9
L I I I
V jet
ii B
[] Cjv,
[] Nozzle exit, station 9• Fully expanded jet
1 I I I.5 .7 .9 1.1
Free stream Mach number960611
Figure 12. Exhaust flow properties, F110-GE-129 engine in F-16XL, ship 2, climb-to-cruise tests, all
tests at intermediate power, for altitudes, see table 5.
ANOPP Test Results
Table 6 lists ANOPP test data from flight 3. The flight points were near an altitude of 3800 fl (1500 ft
AGL) and were started two miles before and ended two miles past the microphone array. The PLA was
fixed at PLF. Because of the lower power settings, ANOPP test NPR values varied from 1.8 to 3.4. A sig-
nificant variation also existed in PLA, so the A9/A8 parameter varied; hence, M9 varied from 1.32 to 1.53.
Figure 13 shows the exhaust Mach number and velocity as a function of airplane Mach number. The
M9 is higher than Mjet (fig. 13(a)) because the flow is overexpanded at all conditions. Similarly, V9 is
higher than Vjet. At the higher Mach number conditions, the nozzle flow is only slightly overexpanded.
24

Exhaust
Mach
number
1.6
1.5
1.4
1.3
1.2
1.1
1.0
.9
.8
n_
I I I I
• Nozzle exit, station 9[] Fully expanded jet
2400
2200
2000
Exhaust 1800
velocity,ft/sec 1600
1400
1200
1000
[]
--ira •
I I.2 .4 .6 .8 1.0
Free stream Mach number960612
I I
Figure 13. Exhaust flow properties, F110-GE-129 engine in F-16XL, ship 2, ANOPP tests, 3800 ft altitude.
CONCLUDING REMARKS
Flyover and static tests of the F-16XL, ship 2, airplane, powered by the GE F110-GE-129 engine,
were conducted as part of a joint NASA Dryden and NASA Langley program to study the acoustics of
high nozzle pressure ratio engines. An engine cycle deck was used to calculate parameters for compari-son with measured parameters. The engine deck and follow-on calculations were also used to calculate
exhaust properties where measurements were not possible. Very good agreement was found between
cycle deck-calculated and measured engine parameters. Such agreement gives good confidence in the
calculated exhaust properties. Nozzle pressure ratios up to almost 5 occurred at intermediate power, with
a maximum jet Mach number of 1.7 and maximum jet velocity of nearly 2600 ft/sec. Nozzle conditions
ranged from underexpanded to overexpanded, depending on flight conditions.
Dryden Flight Research Center
National Aeronautics and Space Administration
Edwards, California, August 1996
25
REFERENCES
1. Zorumski, William E., Aircraft Noise Prediction Program Theoretical Manual, NASA TM-83199,
Part 1, 1982.
2 Ennix, Kimberly A., Burcham, Frank W., and Webb, Lannie D., Flight-Determined Engine Exhaust
Characteristics of an F404 Engine in an F-18 Airplane, NASA TM-4538, 1993.
3 Ennix, Kimberly A., Engine Exhaust Characteristics Evaluation in Support of Aircraft Acoustic
Testing, NASA TM-104263, 1993.
26

R E PO RT DOCU M E NTATIO N PAG E FormApprovedOMB No. 0704-0188
Pubhc reporting burden for this collection of information is eslimated to average I hour per response, including the time for reviewing instructions, searching existing data sources
gatheringand maintainingthe data needed, and completingand reviewingthecollectionofinformation.Send comments regardingthisburden estimateor any otheraspect ofthiscol-lectionof information,includingsuggestionsforreducingthisburden, IoWashington Headquarters Services,DirectorateforInfqrmationOperations and Reports. t215 JeffersonDavis
Highway, Suite 1204, Arlington, VA 22202-4302. and to the Office of Managemenl and Budget. Paperwork Reduction Proiect (0704-01B8), Washington, DC 20503.
1. AGENCY USE ONLY (Leave blank) 2. REPORT DATE 3. REPORTTYPE AND DATES COVERED
November 1996 Technical Memorandum
4. TITLE AND SUBTITLE
Flight and Static Exhaust Flow Properties of an F110-GE-129 Engine in anF-16XL Airplane During Acoustic Tests
6. AUTHOR(S)
Jon K. Holzman, Lannie D. Webb, and Frank W. Burcham, Jr.
7.PERFORMINGORGANIZATIONNAME(S)ANDADDRESS(ES)
NASA Dryden Flight Research CenterP.O. Box 273
Edwards, California 93523-0273
9.SPONSORING/MONITORINGAGENCYNAME(S)ANDADDRESS(ES)
National Aeronautics and Space AdministrationWashington, DC 20546-0001
5. FUNDING NUMBERS
WU 505-68-10
8. PERFORMING ORGANIZATION
REPORT NUMBER
H-2122
10. SPONSORING/MONITORING
AGENCY REPORT NUMBER
NASA TM- 104326
11.SUPPLEMENTARYNOTES
12a. DISTRIBUTION/AVAILABILITY STATEMENT
Unclassified--Unlimited
Subject Category 07
12b. DISTRIBUTION CODE
13. ABSTRACT (Maximum 200 words)
The exhaust flow properties (mass flow, pressure, temperature, velocity, and Mach number) of the
F110-GE-129 engine in an F-16XL airplane were determined from a series of flight tests flown at
NASA Dryden Flight Research Center, Edwards, California. These tests were performed in conjunc-
tion with NASA Langley Research Center, Hampton, Virginia (LaRC) as part of a study to investigate
the acoustic characteristics of jet engines operating at high nozzle pressure conditions. The range of
interest for both objectives was from Mach 0.3 to Mach 0.9. NASA Dryden flew the airplane andacquired and analyzed the engine data to determine the exhaust characteristics. NASA Langley col-
lected the flyover acoustic measurements and correlated these results with their current predictive
codes. This paper describes the airplane, tests, and methods used to determine the exhaust flow prop-
erties and presents the exhaust flow properties. No acoustics results are presented.
14. suaJ ECT TERMS
Acoustics; F110 engine; F-16XL airplane; Flyover noise
17. SECURITY CLASSIFICATION 18. SECURITY CLASSIFICATION 19. SECURITY CLASSIFICATION
OF REPORT OFTHIS PAGE OF ABSTRACT
Unclassified Unclassified Unclassified
NSN 7540-01-280-5500 Available from the NASA Center for AeroSpace Information, 800 Elkridge Landing Road,
Linthicum Heights, MD 21090; (301)621-0390
15. NUMBER OF PAGES
32
16. PRICE CODE
A0320.LIMITATIONOFABSTRACT
Unlimited
Standard Form 298 (Rev. 2-89)Prelci_)ed by ANSI Std Z3S-I 8
298-102