Selective Flexibility: Breaking the Rigidity of Datapath Merging
Flexibility-Rigidity Index for Protein-Nucleic Acid Flexibility andFluctuation Analysis
Kristopher Opron1, Kelin Xia2, Zach Burton1 and Guo-Wei Wei3 ∗†1 Department of Biochemistry and Molecular Biology
Michigan State University, MI 48824, USA2 Department of Mathematics
Michigan State University, MI 48824, USA3 Mathematical Biosciences Institute
The Ohio State University, Columbus, Ohio 43210, USA
September 7, 2018
Abstract
Protein-nucleic acid complexes are important for many cellular processes including the most essential func-tion such as transcription and translation. For many protein-nucleic acid complexes, flexibility of both macro-molecules has been shown to be critical for specificity and/or function. Flexibility-rigidity index (FRI) has beenproposed as an accurate and efficient approach for protein flexibility analysis. In this work, we introduce FRIfor the flexibility analysis of protein-nucleic acid complexes. We demonstrate that a multiscale strategy, whichincorporates multiple kernels to capture various length scales in biomolecular collective motions, is able to signif-icantly improve the state of art in the flexibility analysis of protein-nucleic acid complexes. We take the advantageof the high accuracy and O(N) computational complexity of our multiscale FRI method to investigate the flex-ibility of large ribosomal subunits, which is difficult to analyze by alternative approaches. An anisotropic FRIapproach, which involves localized Hessian matrices, is utilized to study the translocation dynamics in an RNApolymerase.
Key words: Thermal fluctuation, Atomic flexibility, protein-nucleic acid complex, Multiscale.∗On leave from the Department of Mathematics, Michigan State University†Address correspondences to Guo-Wei Wei. E-mail:[email protected]
1
arX
iv:1
510.
0772
5v1
[q-
bio.
BM
] 2
6 O
ct 2
015
I IntroductionProteins and the nucleic acids, which include deoxyribonucleic acid (DNA) and ribonucleic acid (RNA), areamong the most essential biomolecules for all known forms of life. In cells, proteins have a wide variety ofimportant functions, including supporting organism structure, catalyzing reactions involved in transcription andthe cell cycle, participating in signal transduction, and working as immune agents. Nucleic acids typically functionin association with proteins and play a crucial role in encoding, transmitting and expressing genetic information.Genetic information is stored through the nucleic acid sequence, i.e., the order of nucleotides within a DNAor RNA molecule and transmitted via transcription and translation processes. Protein rigidity, flexibility andelectrostatics strongly correlate to protein structure and function.2 The impact of biomolecular electrostaticsto their structure, function and dynamics has been a subject of intensive study. However the importance ofbiomolecular flexibility and rigidity to their structure and function has been overlooked. In general, protein rigidityis responsible for protein three-dimensional (3D) equilibrium geometric shapes and structural function in forms oftubulin, collagen, elastin, and keratin, while protein flexibility is an important factor in all other protein functions.18
DNA flexibility is an important effect in DNA packing. Although the flexibility of biomolecules is often associatedwith their motion and dynamics, which are their response to the external stimuli and die out at the absolute zerotemperature, flexibility is an intrinsic property.
Biomolecular flexibility and rigidity can be measured directly or indirectly by many experimental approaches,such as X-ray crystallography, nuclear magnetic resonance (NMR) and single-molecule force experiments.11
In single-molecule force experiments, including optical tweezers and nanopore force spectroscopy, the intrinsicrupture rate can be a direct measure of the flexibility and rigidity. In the X-ray structure, Debye-Waller factors, alsoknown as B-factors or temperature factors, are computed as the uncertainty for each atom in the least squarefitting of between the X-ray diffraction data and the theoretical model. Debye-Waller factors are interpreted asatomic mean-square-fluctuations at the given experimental temperature, and are associated with biomolecularflexibility and rigidity. NMR is known for its ability to analyze biomolecular flexibility and rigidity under physiologicalconditions, and at various timescales.
The availability of experimental data makes the theoretical study of biomolecular flexibility and rigidity an in-teresting and important topic, in which quantitative models can be calibrated and validated. Molecular dynamics(MD)38 can be used to elucidate biomolecular collective motion and fluctuation. MD is a powerful technique forthe understanding of the conformational landscapes of biomolecules. However, biomolecular flexibility and rigid-ity are intrinsic properties that are better measured at the motionless and fluctuation free state. Therefore, MD isnot efficient for biomolecular flexibility and rigidity analysis. Alternative approaches including normal mode anal-ysis (NMA),6,20,32,50 graph theory26 and elastic network model (ENM)3–5,22,34,48 become the main workhorses forbiomolecular flexibility and rigidity analysis during the past two decades. In analogy to the time-dependent andtime-independent Schrödinger’s equations, these approaches are designed as time-independent counterparts ofthe corresponding MD methods.41 Consequently, a diagonalization of the interaction matrix or Hamiltonian of abiomolecule is a required procedure to obtain biomolecular eigenmodes and associated eigenvalues, which arefurther organized to predict the biomolecular temperature factors. The low order eigenmodes computed from di-agonalizing the Kirchhoff matrix or the Hessian matrix can be interpreted as the slow motions of the biomoleculearound the equilibrium state and thus shed light on the long-time behavior of the biomolecular dynamics beyondthe reach of MD simulations.6,32,50 Tirion argued that the potential in the NMA can be simplified to retain only theharmonic potential for elasticity, which is the dominant term in the MD Hamiltonian.51 Network theory17 has hadconsiderable impact in flexibility analysis. The combination of elasticity and coarse-grained network gives riseto elastic network model (ENM).22 Many other network based approaches, including Gaussian network model(GNM)4,5 and anisotropic network model (ANM),3 have been developed for biomolecular flexibility analysis.
It has been demonstrated by Yang et al.67 that GNM is about one order more efficient than most otherflexibility approaches. GNM is also typically more accurate than ANM in B-factor prediction.39,41 Applicationshave been demonstrated in stability36 analysis, docking simulation,19 viral capsids42,46 and domain motions ofhemoglobin,65 F1 ATPase,9,70 chaperonin GroEL28,69 and the ribosome.49,56 More details can be found in a fewrecent reviews.8,37,44,67 A common feature of the above mentioned time-independent methods is that they resortto the matrix diagonalization procedure. The computational complexity of the matrix diagonalization is typicallyof the order of O(N3), where N is the number of elements in the matrix. Such a computational complexity callsfor new efficient strategies for the flexibility analysis of large biomolecules.
It is well known that NMA and GNM offer poor flexibility analysis for many macromolecules.23,29,31,45 Parket al. had studied the performance of NMA and GNM methods for three sets of structures.41 They found that
2
both methods fail to work and deliver negative correlation coefficients (CCs) for many structures.41 They haveshown that mean correlation coefficients (MCCs) for the NMA B-factor prediction of small-sized, medium-sizedand large-sized sets of structures are about 0.480, 0.482 and 0.494, respectively.39,41 The GNM is consider-ably more accurate and delivers MCCs of 0.541, 0.550 and 0.529 for the above test sets.39,41 Indeed, variousimprovements, including crystal environment, solvent type and co-factors, are proposed.23,29,31,45 Additionally,density - cluster rotational - translational blocking has been considered.10,47 Alternative approaches have beenproposed for the flexibility analysis of hinges in proteins using bioinformatics,16 graph theory12,27,43 and energet-ics.15 Moreover, low quality experimental data due to collection conditions and structural refinement proceduresmay also contribute to poor flexibility predictions.
From observation of the relationship between flexibility and local packing density, Halle21 proposed a muchsimplified model called local density model (LDM), and bypassed the whole eigenmode analysis for protein B-factor prediction. In this method, the inverse of contact density, defined as the number of noncovalent neighboratoms within a local region, is found to be proportional to atomic mean-square displacements, thus can bedirectly used to predict the experimental B-factors. Another interesting method is the local contact model (LCM)proposed by Zhang et al.68 In this approach, the generalized order parameter of the atom is approximated bythe summation of a series of exponential functions of atomic distances. Both LDM and LCM demonstrate greatpotential for protein flexibility prediction. Based on these approaches, many modifications have been proposedin the literature.24,33,35 Among them, the weighted contact number (WCN) is able to deliver a better accuracythan GNM using an inverse square distance function.35
Recently, we have proposed a few matrix-decomposition-free methods for flexibility analysis, including molec-ular nonlinear dynamics,62 stochastic dynamics61 and flexibility-rigidity index (FRI).39,60 Among them, flexibility-rigidity index (FRI) has been introduced to evaluate protein flexibility and rigidity, that are further required in amultiscale formalism called continuum elasticity with atomic rigidity (CEWAR) for macromolecular the elasticityanalysis.60 The FRI method appears to be akin to the “flexibility index” proposed independently by von der Liethet al.54 and Jacobs et al.26 to describe bond strengths. However, these flexibility indices have little in commonwith FRI, which does not resort to any protein interaction Hamiltonian for predicting protein flexibility and rigidity.Instead, the FRI is a structure based approach. The fundamental assumptions of the FRI method are as follows.Protein functions, such as flexibility, rigidity, and energy, are fully determined by the structure of the protein andits environment, and the protein structure is in turn determined by the relevant interactions. Therefore, wheneverthe protein structure is available, there is no need to analyze protein flexibility and rigidity by tracing back to theprotein interaction Hamiltonian. Consequently, the FRI bypasses the O(N3) matrix diagonalization. In fact, FRIdoes not even require the 3D geometric information of the protein structure. It assesses topological connectivityof the protein distance geometry and analyzes the geometric compactness of the protein structure. It can be re-garded as a kernel generalization of the local density model.21 Our initial FRI60 has the computational complexityof of O(N2) and our fast FRI (fFRI)39 based on a cell lists algorithm1 is of O(N). The FRI and the fFRI have beenextensively validated by a set of 365 proteins for parametrization, accuracy and reliability. The parameter freefFRI is about ten percent more accurate than the GNM on the 365 protein test set and is orders of magnitudefaster than GNM on a set of 44 proteins. FRI is able to predict the B-factors of an HIV virus capsid (313 236residues) in less than 30 seconds on a single-core processor, which would require GNM more than 120 years toaccomplish if the computer memory is not a problem.39
However, earlier FRI methods do not work for many protein structures that NMA and GNM are unable todeliver good predictions. In addition to problems mentioned above, the neglecting of multiple characteristiclength scales in protein structures is another drawback of present flexibility analysis. Indeed, biomoleculeshave many characteristic length scales, ranging from covalent bond scale, hydrogen bond scale, wan der Waalsbond scale, intraresidue scale, interresidue scale, alpha helix and beta sheet scale, domain scale and proteininteraction scale. When GNM or FRI is parametrized at a given cutoff or scale parameter, it captures only asubset of the characteristic length scales but inevitably misses other characteristic length scales of the protein.Consequently, these methods fail to offer accurate B-factor prediction for many multiscale biomolecules. Amultiscale strategy has been proposed to resolve this problem by introducing two or three kernels that areparametrized at relatively small, medium and/or large length scales in the FRI formulation.40 We demonstratethat the resulting multiscale FRI (mFRI) works extremely well for many proteins that the GNM method fails tooffer accurate flexibility analysis.40 Based on a set of 364 proteins, mFRI is 20% more accurate than GNM. It isinteresting to note that there is no obvious way to incorporate multiple length scales in the aforementioned matrixdiagonalization based approaches.
3
Although being developed independently, our FRI methods are akin to LDM, LCM and WCN in terms ofmatrix diagonalization free. However, our FRI methods differ from LDM, LCM and WCN in the following aspects.First, our original FRI methods were motivated from continuum mechanics, the CEWAR.39,60 As a result, ourFRI methods offer not only discrete flexibility index and discrete rigidity index, but also continuous flexibilityfunction and continuous rigidity function. The latter is equivalent to volumetric biomolecular density distribution.Consequently, one can use the FRI rigidity function to fit electron microscope (EM) density maps.52,58,63 Abyproduct of our FRI rigidity function is the smooth biomolecular surface extracted by setting an isosurfacevalue, including the Gaussian surface as a special case.30,64 In contrast, LDM, LCD and WCN do not admitany continuum representation. Additionally, the discrete FRI formulations differ from those of LDM, LCD andWCN by admitting the diagonal term in the summation. Moreover, we have considered the multiscale effects inbiomolecules. Our mFRI captures biomolcular thermal fluctuations at various length scales and thus substantiallyimproves the accuracy of the original FRI method. Finally, we have proposed an anisotropic FRI (aFRI) methodto describe biomolecular collective motions. A unique feature of our aFRI method is that it allows adaptiveHessian matrices, from a completely global 3N × 3N matrix to completely local 3 × 3 matrices. Therefore, onecan use aFRI to pinpoint one’s flexibility analysis to a given domain or region.
The objective of the present work is to develop FRI methods for the flexibility analysis of protein-nucleicacid complexes. Protein and nucleic acid are dramatically different biomolecules. Amino acid residues andnucleotides have different length scales and interaction characteristics. Therefore, a good model should not onlyallow residues and/or nucleotides to be treated with different length scales, but also adapt a multiscale descriptionof each residue and/or nucleotide. Unlike elastic network models that are parametrized in only one length scalefor each particle, the mFRI provides a simultaneous multiscale description. Therefore, the present mFRI is ableto better capture multiscale collective motions of protein-nucleic acid complexes. Additionally, many protein-nucleic acid complexes are very large biomolecules and pose difficulty to conventional mode decompositionbased methods. The O(N) scaling FRI methods provide an efficient approach to the flexibility analysis of largeprotein-nucleic acid complexes.
The rest of this paper is organized as follows. Section II is devoted to methods and algorithms. To estab-lish notation and facilitate further discussion, the basic FRI approach is briefly discussed. We then present themultikernel based mFRI method to improve the accuracy of biomolecular flexibility analysis. The basic formula-tion of the aFRI is discussed. In Section III, we first analyze the benefit of adding an additional kernel with anappropriate length scale by comparing the performance of the B-factor prediction for a set of 64 protein-nucleicacid complexes introduced by Yang et al.66 and a larger database of 203 high resolution protein-nucleic acidstructures. Three different coarse-grain representations of protein-nucleic acid complexes introduced by Yang etal66 are examined. Section IV is devoted to the application of the mFRI and aFRI methods. We consider a largeribosomeal structure to explore the utility and demonstrate the performance of the proposed mFRI. Further, weexplore the use of aFRI for the prediction of collective motions of bridge helix, trigger loop and nucleic acids inan RNA polymerase.II Methods and algorithmsII.A Flexibility-rigidity indexIn FRI, the topological connectivity of a biomolecule is measured by rigidity index and flexibility index. In particu-lar, the rigidity index represents the protein density profile. Consider an N -atom representation of a biomolecule.The coordinates of these atoms are given as {rj |rj ∈ R3, j = 1, 2, · · · , N}. We denote ‖ri − rj‖ the Euclideanspace distance between the ith atom and the jth atom. A general correlation kernel, Φ(‖r − rj‖; ηj), is a real-valued monotonically decreasing radial basis function satisfying
Φ(‖r− rj‖; ηj) = 1 as ‖r− rj‖ → 0 (1)Φ(‖r− rj‖; ηj) = 0 as ‖r− rj‖ → ∞, (2)
where ηj is an atomic type dependent scale parameter. The correlation between the ith and jth particles is givenby
Cij = Φ(‖ri − rj‖; ηj). (3)
The correlation matrix {Cij} can be computed to visualize the connectivity among protein particles.
4
We define a position (r) dependent (continuous) rigidity function or density function39,60
µ(r) =
N∑j=1
wjΦ(‖r− rj‖; ηj), (4)
where wj is an atom type dependent weight. For example, carbon, nitrogen and phosphorus atoms can havedifferent weights. Equation (4) can be understood as a discrete to continuum mapping. It maps a set of discretevalues {wj} at {rj} to the continuum domain. Although Delta sequences of the positive type discussed in anearlier work57 are all good choices, generalized exponential functions
Φ(‖r− rj‖; ηj) = e−(‖r−rj‖/ηj)κ
, κ > 0 (5)
and generalized Lorentz functions
Φ(‖r− rj‖; ηj) =1
1 + (‖r− rj‖/ηj)υ, υ > 0 (6)
have been commonly used in our recent work.39,40,60 Since the rigidity function can be directly interpreted asa density distribution, it can been used to define the rigidity surface of a biomolecule by taking an isovalue. Bytaking κ = 2 in Eq. (5), we result in a formula for a Gaussian surface from Eq. (4).
Similarly, we define a position (r) dependent (continuous) flexibility function39,60
F (r) =1∑N
j=1 wjΦ(‖r− rj‖; ηj). (7)
This function is well defined in the computational domain containing the biomolecule. The flexibility function canbe visualized by its projection on a given surface, such as the solvent excluded surface of a biomolecule.
The (discrete) rigidity index for the ith particle is obtained by restricting r to a given atomic position ri
µi =
N∑j=1
wjΦ(‖ri − rj‖; ηj). (8)
Here µi measures the total density or rigidity at the ith particle. In a similar manner, we define a set of (discrete)flexibility indices by
fi =1∑N
j=1 wjΦ(‖ri − rj‖; ηj). (9)
The flexibility index fi is directly associated with the B-factor of ith particle
Bti = afi + b, ∀i = 1, 2, · · · , N (10)
where {Bti} are theoretically predicted B-factors, and a and b are two constants to be determined by a simplelinear regression. This allows us to use experimental data to validate the FRI method. In our earlier work,39,40,60
we set wj = 1 for the coarse-grained Cα representation of proteins. We have also developed parameter free FRI(pfFRI), such as (κ = 1, η = 3) and (υ = 3, η = 3), to make our FRI robust for protein Cα B-factor prediction.II.B Multiscale Flexibility-rigidity indexThe basic idea of multiscale FRI or multi-kernel FRI (mFRI) is quite simple. Since macromolecules are inherentlymultiscale in nature, we utilize multiple kernels that are parametrized at multiple length scales to characterizethe multiscale thermal fluctuations of macromolecules
fni =1∑N
j=1 wnj Φn(‖ri − rj‖; ηnj )
, (11)
where wnj , Φn(‖ri − rj‖; ηnj ) and ηnj are the corresponding quantities associated with the nth kernel. We seekthe minimization of the form
Minan,b
∑i
∣∣∣∣∣∑n
anfni + b−Bei
∣∣∣∣∣2 (12)
5
where {Bei } are the experimental B-factors. In principle, all parameters can be optimized. For simplicity andcomputational efficiency, we only determine {an} and b in the above minimization process. For each kernel Φn,wnj and ηnj will be selected according to the type of particles.
Specifically, for a simple Cα network, we can set wnj = 1, ηnj = ηn and choose a single kernel functionparametrized at different scales. The predicted B-factors can be expressed as
BmFRIi = b+
∑n=1
an∑Nj=1 Φ(‖ri − rj‖; ηn)
. (13)
The difference between Eqs. (11) and (13) is that, in Eqs. (11), both the kernel and the scale can be changedfor different n. In contrast, in Eq. (13), only the scale is changed. One can use a given kernel, such as
Φ(‖r− rj‖; ηn) =1
1 + (‖r− rj‖/ηn)3 , (14)
to achieve good multiscale predictions.40
II.C Anisotropic flexibility-rigidity indexThe anisotropic flexibility-rigidity index (aFRI) model was built in a very unique manner. Different from the existingnormal mode analysis or anisotropic elastic network models, in which the Hessian matrix is always global, ouraFRI model delivers a local and adaptive Hessian matrix. This means that for a molecule with N particles, theHessian matrix is always 3N×3N for ANM, whereas, our Hessian matrix may vary from a set of N 3×3 matricesfor a completely local aFRI to 3N×3N for a complete global aFRI, depending on the need of a physical problem.For instance, if one is particularly interested in certain structures like alpha helices, domains, or binding sitesof a protein, or certain subunits of a biomolecular complex, one design and an aFRI for these portions of themolecule. We partition all the N particles in a molecule or a biomolecular complex into a total of M clusters{c1, c2, · · · , ck, · · · , cM}. Cluster ck has Nk particles or atoms so that N =
∑Mk=1Nk. We choose clusters based
on our physical interest as mentioned above. In this way, two very special situations can be found. The first onecorresponds to the completely local situation, i.e., N clusters and each cluster has only one atom. The othersituation contains only one cluster, which is then completely global. It is straightforward to construct a 3N × 3NHessian matrix and analyze the collective motion. The problem arises when we consider the global motion of aselected cluster, at the same time include the influence from the rest clusters. The essential idea is to constructa cluster Hessian matrix for each cluster individually and then incorporate the information from nearby clustersinto its diagonal terms.
For example, if we want to know the thermal fluctuation of a particular cluster ck with Nk particles or atoms,we need to find 3Nk eigenvectors for the cluster. Let us keep in mind that each position vector in R3 has threecomponents, i.e., r = (x, y, z). For each given pair of particles i and j, we can define a local anisotropic matrixΦij =
(Φijuv
)as
Φij =
Φijxx Φijxy ΦijxzΦijyx Φijyy ΦijyzΦijzx Φijzy Φijzz
, (15)
where Φijuv are defined as
Φijuv =∂
∂ui
∂
∂vjΦ(‖ri − rj‖; ηj), u, v = x, y, z; i, j = 1, 2, · · · , N. (16)
Due to the inner connection between rigidity and flexibility, we have two different aFRI algorithms. The speciallydesigned cluster Hessian matrix with a smaller size can incorporate nonlocal geometric impact and predictcollective thermal motions of the cluster. The details are presented below.II.C.1 Anisotropic rigidityIn anisotropic rigidity based aFRI, a rigidity Hessian matrix is needed. For a cluster ck, if we denote its rigidityHessian matrix as
(µijuv(ck)
)with elements,
µijuv(ck) = −wjΦijuv, i, j ∈ ck; i 6= j;u, v = x, y, z (17)
µiiuv(ck) =∑Nj=1 wjΦ
ijuv, i ∈ ck;u, v = x, y, z (18)
µijuv(ck) = 0, i, j /∈ ck;u, v = x, y, z. (19)
6
C2
O4'
C4'
P
C2
O4'
C4'
P
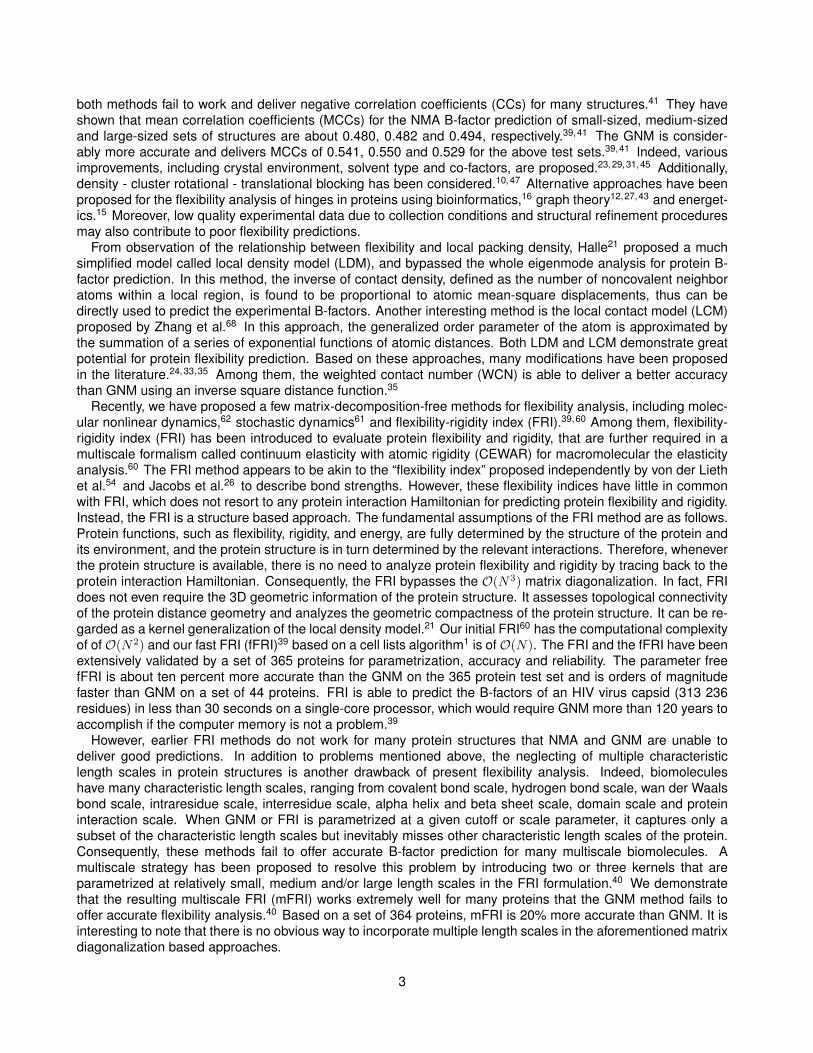
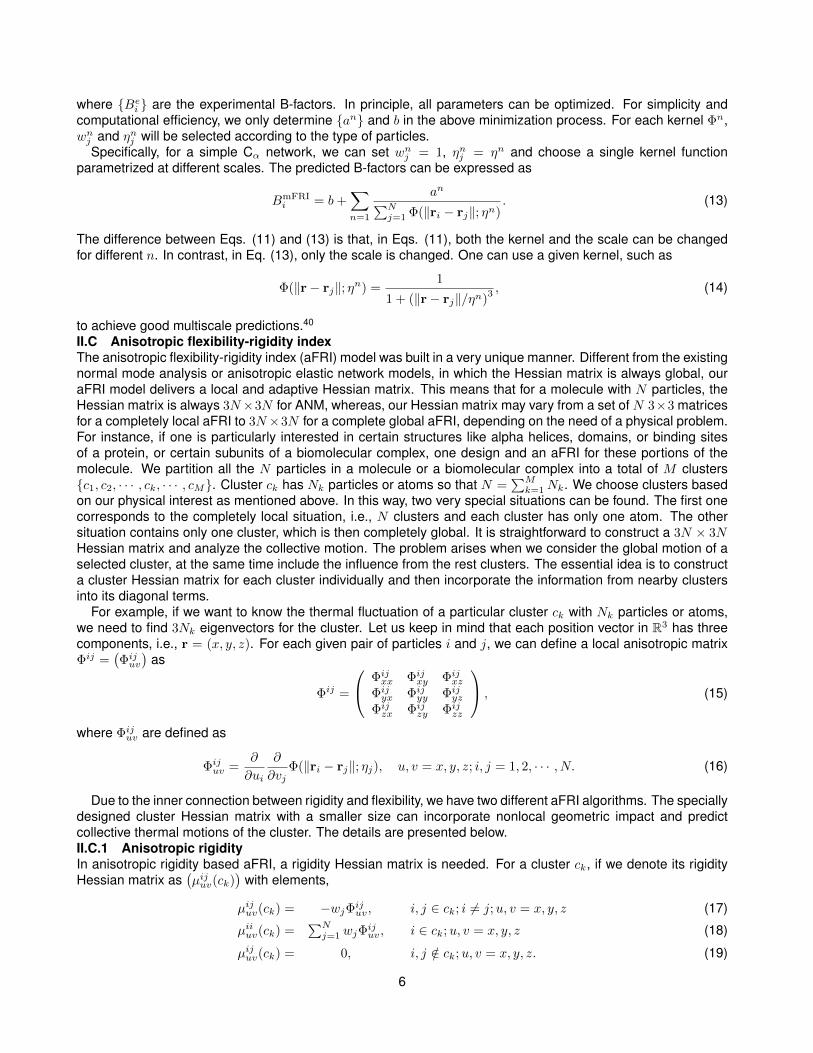
Figure 1: Illustration highlighting atoms used for coarse-grained representations in protein-nucleic acid complexes for FRI and GNM. Inaddition to protein Cα atoms, Model M1 considers the backbone P atoms for nucleotides. Model M2 includes M1 atoms and adds the sugarO4’ atoms for nucleotides. Model M3 includes M1 atoms and adds the sugar C4’ atoms and the base C2 atoms for nucleotides.
In this way, the rigidity Hessian matrix is of 3Nk × 3Nk dimensions. More importantly, the information from allother clusters are built into diagonal terms, even if the cluster itself is completely localized, i.e., Nk = 1, ∀k.
For B-factor prediction, we define a set of anisotropic rigidity (AR) based flexibility indices by
fARi =
1
µidiag, (20)
where the ith diagonal term µidiag is of the form,
µidiag = Tr(µiuv)
(21)
=
N∑j=1
wj[Φijxx + Φijyy + Φijzz
]. (22)
Here, fARi is employed in the linear regression to determine B-factors.
II.C.2 Anisotropic flexibilityThe other way to construct aFRI is to construct a flexibility Hessian matrix, which is denoted as F(ck) for clusterck with elements,
Fij(ck) = − 1wj
(Φij)−1, i, j ∈ ck; i 6= j;u, v = x, y, z (23)
Fii(ck) =∑Nj=1
1wj
(Φij)−1, i ∈ ck;u, v = x, y, z (24)
Fij(ck) = 0, i, j /∈ ck;u, v = x, y, z. (25)
Note that (Φij)−1 represents the unscaled inverse of matrix Φij such that Φij(Φij)−1 = |Φij |. The diagonalizationof F(ck) gives rise to eigenmodes, which represent the cluster motions. Additionally, the diagonal part Fii(ck)has built in information from all particles in the system. In this way, we deliver a cluster Hessian matrix. Bydiagonalizing F(ck), we obtain 3Nk eigenvectors for the Nk particles in the cluster ck of interest. Furthermore,instead of predicting the B-factors via the eigenvalues and eigenmodes, we directly predict the B-factors by usingour anisotropic flexibility (AF) based flexibility indices defined as,
fAFi = Tr (F(ck))
ii, (26)
= (F(ck))iixx + (F(ck))
iiyy + (F(ck))
iizz . (27)
Finally, we employ fAFi to predict B-factors.
III Implementation and validationIn this section, we parametrize and test the previously described mFRI on protein-nucleic acid structures. Aimmediate concern is whether the proposed mFRI is as efficient on protein-nucleic structures as it is on protein-only structures as shown in a previous study.59 The accuracy of the mFRI method is tested by the B-factorprediction of two sets of protein-nucleic acid structures, including a set of 64 molecules used in a recent GNMstudy66 and a set of 203 molecules for more accurate parametrization of mFRI.
7
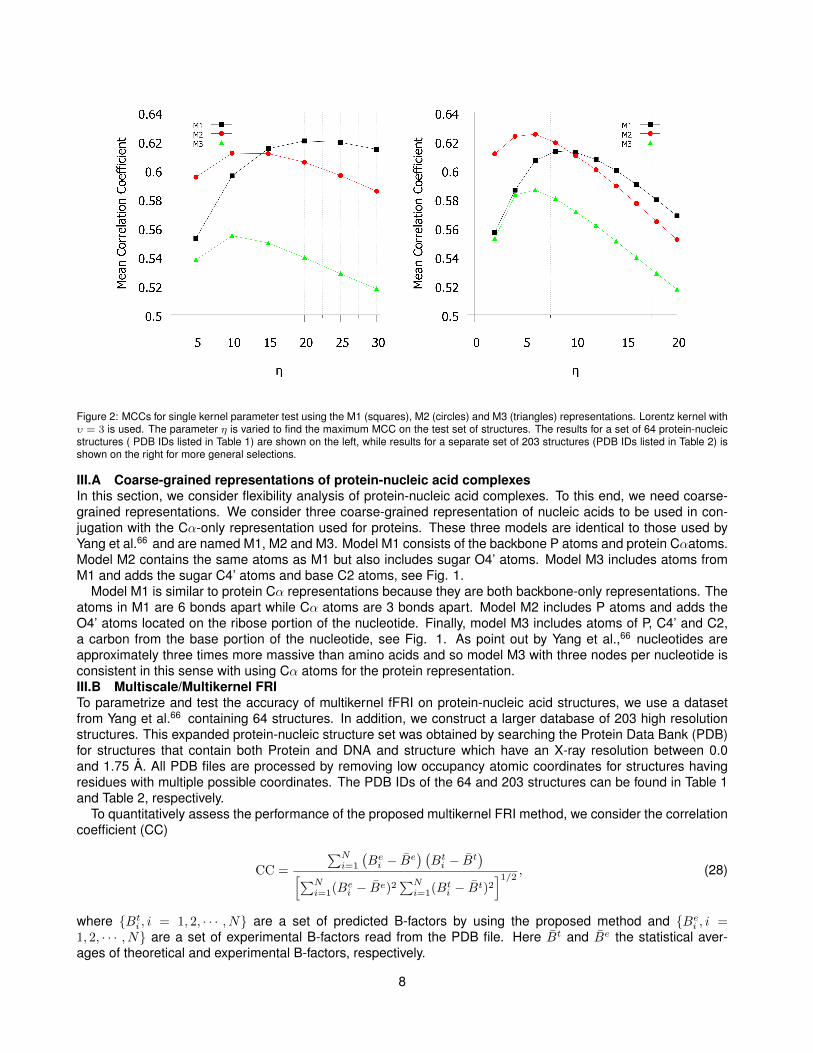
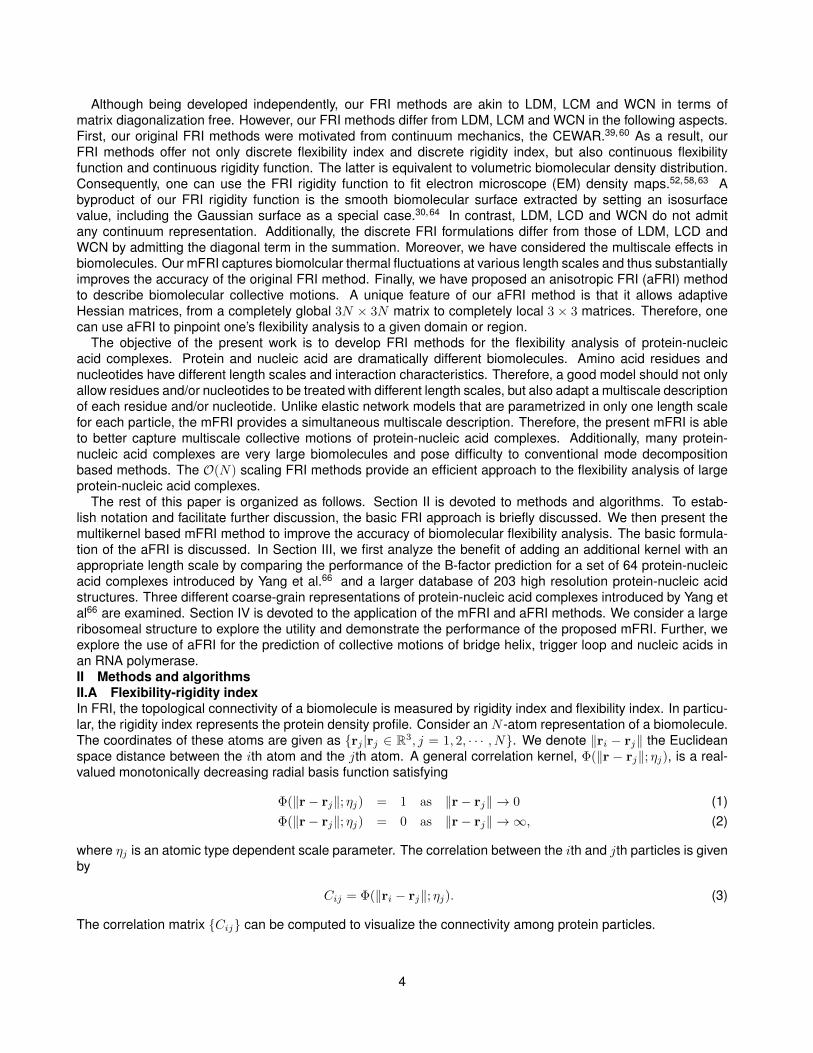
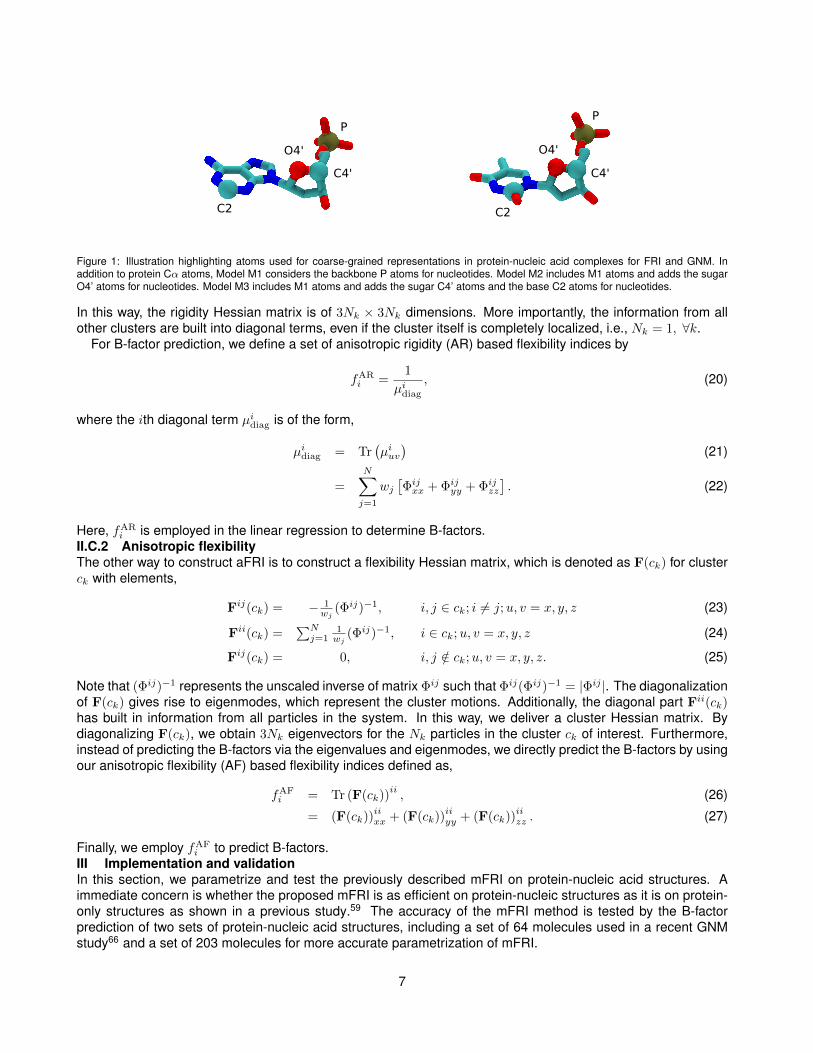
Figure 2: MCCs for single kernel parameter test using the M1 (squares), M2 (circles) and M3 (triangles) representations. Lorentz kernel withυ = 3 is used. The parameter η is varied to find the maximum MCC on the test set of structures. The results for a set of 64 protein-nucleicstructures ( PDB IDs listed in Table 1) are shown on the left, while results for a separate set of 203 structures (PDB IDs listed in Table 2) isshown on the right for more general selections.
III.A Coarse-grained representations of protein-nucleic acid complexesIn this section, we consider flexibility analysis of protein-nucleic acid complexes. To this end, we need coarse-grained representations. We consider three coarse-grained representation of nucleic acids to be used in con-jugation with the Cα-only representation used for proteins. These three models are identical to those used byYang et al.66 and are named M1, M2 and M3. Model M1 consists of the backbone P atoms and protein Cαatoms.Model M2 contains the same atoms as M1 but also includes sugar O4’ atoms. Model M3 includes atoms fromM1 and adds the sugar C4’ atoms and base C2 atoms, see Fig. 1.
Model M1 is similar to protein Cα representations because they are both backbone-only representations. Theatoms in M1 are 6 bonds apart while Cα atoms are 3 bonds apart. Model M2 includes P atoms and adds theO4’ atoms located on the ribose portion of the nucleotide. Finally, model M3 includes atoms of P, C4’ and C2,a carbon from the base portion of the nucleotide, see Fig. 1. As point out by Yang et al.,66 nucleotides areapproximately three times more massive than amino acids and so model M3 with three nodes per nucleotide isconsistent in this sense with using Cα atoms for the protein representation.III.B Multiscale/Multikernel FRITo parametrize and test the accuracy of multikernel fFRI on protein-nucleic acid structures, we use a datasetfrom Yang et al.66 containing 64 structures. In addition, we construct a larger database of 203 high resolutionstructures. This expanded protein-nucleic structure set was obtained by searching the Protein Data Bank (PDB)for structures that contain both Protein and DNA and structure which have an X-ray resolution between 0.0and 1.75 Å. All PDB files are processed by removing low occupancy atomic coordinates for structures havingresidues with multiple possible coordinates. The PDB IDs of the 64 and 203 structures can be found in Table 1and Table 2, respectively.
To quantitatively assess the performance of the proposed multikernel FRI method, we consider the correlationcoefficient (CC)
CC =
∑Ni=1
(Bei − B̄e
) (Bti − B̄t
)[∑Ni=1(Bei − B̄e)2
∑Ni=1(Bti − B̄t)2
]1/2 , (28)
where {Bti , i = 1, 2, · · · , N} are a set of predicted B-factors by using the proposed method and {Bei , i =1, 2, · · · , N} are a set of experimental B-factors read from the PDB file. Here B̄t and B̄e the statistical aver-ages of theoretical and experimental B-factors, respectively.
8
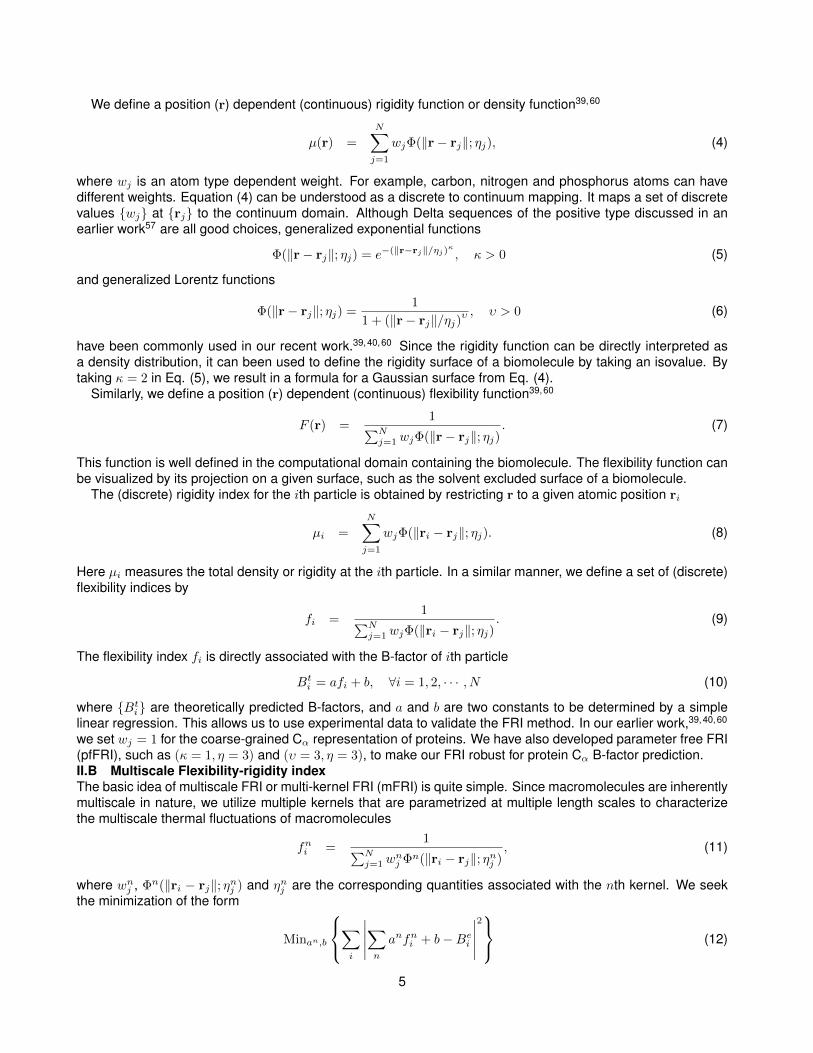
Figure 3: Mean correlation coefficients (MCCs) for two-kernel FRI models on a set of 203 protein-nucleic structures. From left to right, MCCvalues are shown for M1, M2 and M3 representations. We use one Lorentz kernel with υ = 3.0 and one exponential kernel with κ = 1.0.The values of parameter η for both kernels are varied from 2 to 20 Å.
III.B.1 Multikernel FRI testing on protein-nucleic structuresPrevious tests of single kernel FRI indicate that the Lorentz type and exponential type correlation kernels are thetwo most accurate kernel types. This leads us to try the combination of these two types of kernels. The resultingmultikernel FRI method requires four parameters, namely, κ and η for the exponential kernel and υ and η for theLorentz kernel.III.B.2 Single kernel FRI testingIn order to compare FRI and GNM methods for protein-nucleic acid structures, we test our single kernel FRI ata range of η values. For this test we use the Lorentz kernel with υ = 3 for B-factor prediction on both structuressets and all three representations (M1, M2 and M3). The results are shown in Figure 2. For the 64 structure set,single kernel FRI has a maximum mean correlation coefficient (MCC) to experimental B-factors for M1, M2 andM3 representations of 0.620, 0.612 and 0.555. Comparatively, GNM had a MCC of approximately 0.59, 0.58 and0.55 for M1, M2 and M3 for the same data set.66 The maximum MCCs for FRI on the larger data set for M1, M2and M3 are 0.613, 0.625 and 0.586, respectively. The M1 and M2 representations perform better than the M3representation.III.B.3 Parameter-free multikernel FRIAs with protein-only structures, we develop multikernel FRIs with multiple kernels to improve accuracy of pre-diction on protein-nucleic acid structures. In order to simplify the FRI method, we try to develop an accurateparameter-free version for a two-kernel mFRI. We use a combination of one Lorentz and one exponential kernel.Values for parameters υ and κ are set to 3.0 and 1.0 respectively based on the results of previous FRI studies.39
The optimal values for η in both kernels are determined by testing a range of possible values from 2 to 20 Å. Allthree representations (M1, M2 and M3) described previously are considered. The results of these tests on theset of 203 protein-nucleic acid structures are shown in Figure 3.
As expected, the addition of another kernels results in an overall increase in accuracy for the 203 complex set.For two-kernel mFRI, the MCCs increase up to 0.68 for M1, 0.67 for M2 and 0.63 for M3. The choice of η turnsout to be very robust based on results shown in Figure 3.
We have also carried out a similar test of two-kernel mFRI (υ = 3.0 and κ = 1.0) for the set of 64 protein-nucleic acid structures. Note that this has many large complexes. The MCCs for M1, M2 and M3 models are0.668, 0.666 and 0.620, respectively, which are similar to what we have found for the set of 203 structures. Theset of 64 structures includes 19 structures composed of nucleic acids and no amino acids. The MCCs for thisnucleic acid-only subset 0.608, 0.617 and 0.603 for M1, M2 and M3 models. The correlation coefficients for all64 individual molecular complexes are listed in Table 1.
To summarize the performance of Gaussian network model, single kernel FRI, and two-kernel mFRI, we listtheir MCCs for the 64 protein-nucleic acid structures in Table 3. It can be seen that, the FRI outperforms GNMin all three representations, and two-kernel mFRI further significantly improves the accuracy of our method andachieves up to 15% improvement compared with GNM.66 Based on our earlier test,40 we believe that our three-kernel mFRI can deliver a better prediction.
9
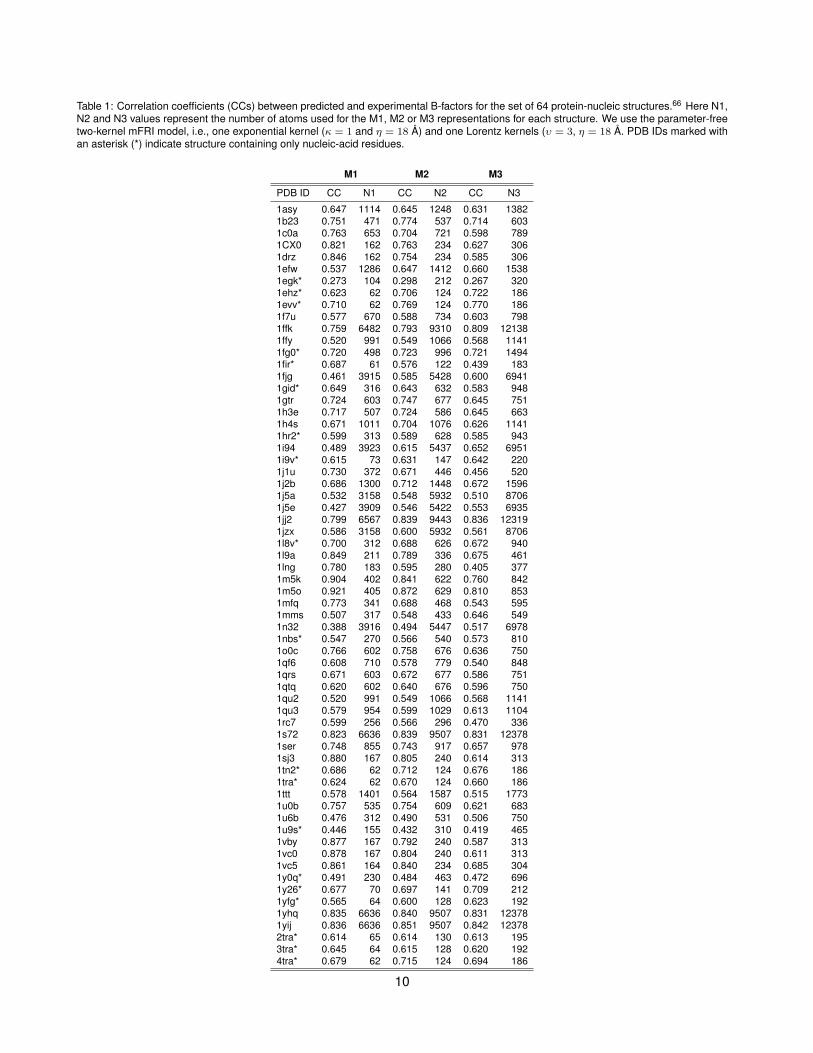
Table 1: Correlation coefficients (CCs) between predicted and experimental B-factors for the set of 64 protein-nucleic structures.66 Here N1,N2 and N3 values represent the number of atoms used for the M1, M2 or M3 representations for each structure. We use the parameter-freetwo-kernel mFRI model, i.e., one exponential kernel (κ = 1 and η = 18 Å) and one Lorentz kernels (υ = 3, η = 18 Å. PDB IDs marked withan asterisk (*) indicate structure containing only nucleic-acid residues.
M1 M2 M3
PDB ID CC N1 CC N2 CC N3
1asy 0.647 1114 0.645 1248 0.631 13821b23 0.751 471 0.774 537 0.714 6031c0a 0.763 653 0.704 721 0.598 7891CX0 0.821 162 0.763 234 0.627 3061drz 0.846 162 0.754 234 0.585 3061efw 0.537 1286 0.647 1412 0.660 15381egk* 0.273 104 0.298 212 0.267 3201ehz* 0.623 62 0.706 124 0.722 1861evv* 0.710 62 0.769 124 0.770 1861f7u 0.577 670 0.588 734 0.603 7981ffk 0.759 6482 0.793 9310 0.809 121381ffy 0.520 991 0.549 1066 0.568 11411fg0* 0.720 498 0.723 996 0.721 14941fir* 0.687 61 0.576 122 0.439 1831fjg 0.461 3915 0.585 5428 0.600 69411gid* 0.649 316 0.643 632 0.583 9481gtr 0.724 603 0.747 677 0.645 7511h3e 0.717 507 0.724 586 0.645 6631h4s 0.671 1011 0.704 1076 0.626 11411hr2* 0.599 313 0.589 628 0.585 9431i94 0.489 3923 0.615 5437 0.652 69511i9v* 0.615 73 0.631 147 0.642 2201j1u 0.730 372 0.671 446 0.456 5201j2b 0.686 1300 0.712 1448 0.672 15961j5a 0.532 3158 0.548 5932 0.510 87061j5e 0.427 3909 0.546 5422 0.553 69351jj2 0.799 6567 0.839 9443 0.836 123191jzx 0.586 3158 0.600 5932 0.561 87061l8v* 0.700 312 0.688 626 0.672 9401l9a 0.849 211 0.789 336 0.675 4611lng 0.780 183 0.595 280 0.405 3771m5k 0.904 402 0.841 622 0.760 8421m5o 0.921 405 0.872 629 0.810 8531mfq 0.773 341 0.688 468 0.543 5951mms 0.507 317 0.548 433 0.646 5491n32 0.388 3916 0.494 5447 0.517 69781nbs* 0.547 270 0.566 540 0.573 8101o0c 0.766 602 0.758 676 0.636 7501qf6 0.608 710 0.578 779 0.540 8481qrs 0.671 603 0.672 677 0.586 7511qtq 0.620 602 0.640 676 0.596 7501qu2 0.520 991 0.549 1066 0.568 11411qu3 0.579 954 0.599 1029 0.613 11041rc7 0.599 256 0.566 296 0.470 3361s72 0.823 6636 0.839 9507 0.831 123781ser 0.748 855 0.743 917 0.657 9781sj3 0.880 167 0.805 240 0.614 3131tn2* 0.686 62 0.712 124 0.676 1861tra* 0.624 62 0.670 124 0.660 1861ttt 0.578 1401 0.564 1587 0.515 17731u0b 0.757 535 0.754 609 0.621 6831u6b 0.476 312 0.490 531 0.506 7501u9s* 0.446 155 0.432 310 0.419 4651vby 0.877 167 0.792 240 0.587 3131vc0 0.878 167 0.804 240 0.611 3131vc5 0.861 164 0.840 234 0.685 3041y0q* 0.491 230 0.484 463 0.472 6961y26* 0.677 70 0.697 141 0.709 2121yfg* 0.565 64 0.600 128 0.623 1921yhq 0.835 6636 0.840 9507 0.831 123781yij 0.836 6636 0.851 9507 0.842 123782tra* 0.614 65 0.614 130 0.613 1953tra* 0.645 64 0.615 128 0.620 1924tra* 0.679 62 0.715 124 0.694 186
10
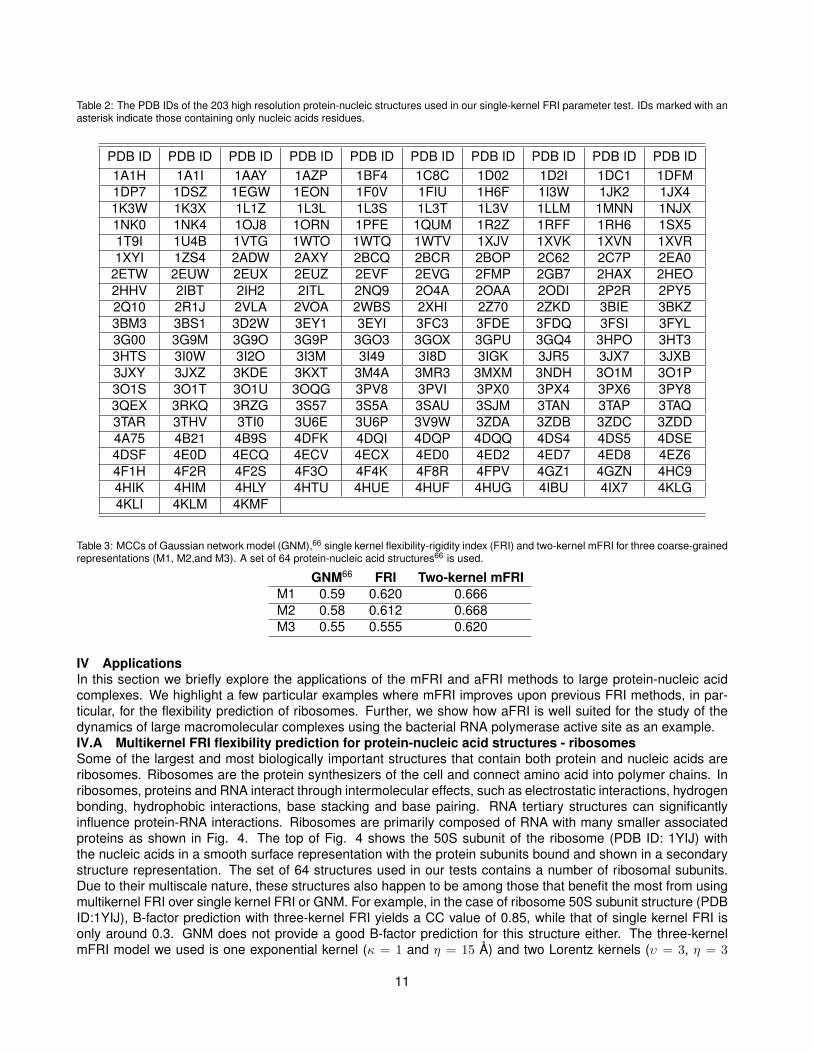
Table 2: The PDB IDs of the 203 high resolution protein-nucleic structures used in our single-kernel FRI parameter test. IDs marked with anasterisk indicate those containing only nucleic acids residues.
PDB ID PDB ID PDB ID PDB ID PDB ID PDB ID PDB ID PDB ID PDB ID PDB ID1A1H 1A1I 1AAY 1AZP 1BF4 1C8C 1D02 1D2I 1DC1 1DFM1DP7 1DSZ 1EGW 1EON 1F0V 1FIU 1H6F 1I3W 1JK2 1JX41K3W 1K3X 1L1Z 1L3L 1L3S 1L3T 1L3V 1LLM 1MNN 1NJX1NK0 1NK4 1OJ8 1ORN 1PFE 1QUM 1R2Z 1RFF 1RH6 1SX51T9I 1U4B 1VTG 1WTO 1WTQ 1WTV 1XJV 1XVK 1XVN 1XVR1XYI 1ZS4 2ADW 2AXY 2BCQ 2BCR 2BOP 2C62 2C7P 2EA0
2ETW 2EUW 2EUX 2EUZ 2EVF 2EVG 2FMP 2GB7 2HAX 2HEO2HHV 2IBT 2IH2 2ITL 2NQ9 2O4A 2OAA 2ODI 2P2R 2PY52Q10 2R1J 2VLA 2VOA 2WBS 2XHI 2Z70 2ZKD 3BIE 3BKZ3BM3 3BS1 3D2W 3EY1 3EYI 3FC3 3FDE 3FDQ 3FSI 3FYL3G00 3G9M 3G9O 3G9P 3GO3 3GOX 3GPU 3GQ4 3HPO 3HT33HTS 3I0W 3I2O 3I3M 3I49 3I8D 3IGK 3JR5 3JX7 3JXB3JXY 3JXZ 3KDE 3KXT 3M4A 3MR3 3MXM 3NDH 3O1M 3O1P3O1S 3O1T 3O1U 3OQG 3PV8 3PVI 3PX0 3PX4 3PX6 3PY83QEX 3RKQ 3RZG 3S57 3S5A 3SAU 3SJM 3TAN 3TAP 3TAQ3TAR 3THV 3TI0 3U6E 3U6P 3V9W 3ZDA 3ZDB 3ZDC 3ZDD4A75 4B21 4B9S 4DFK 4DQI 4DQP 4DQQ 4DS4 4DS5 4DSE4DSF 4E0D 4ECQ 4ECV 4ECX 4ED0 4ED2 4ED7 4ED8 4EZ64F1H 4F2R 4F2S 4F3O 4F4K 4F8R 4FPV 4GZ1 4GZN 4HC94HIK 4HIM 4HLY 4HTU 4HUE 4HUF 4HUG 4IBU 4IX7 4KLG4KLI 4KLM 4KMF
Table 3: MCCs of Gaussian network model (GNM),66 single kernel flexibility-rigidity index (FRI) and two-kernel mFRI for three coarse-grainedrepresentations (M1, M2,and M3). A set of 64 protein-nucleic acid structures66 is used.
GNM66 FRI Two-kernel mFRIM1 0.59 0.620 0.666M2 0.58 0.612 0.668M3 0.55 0.555 0.620
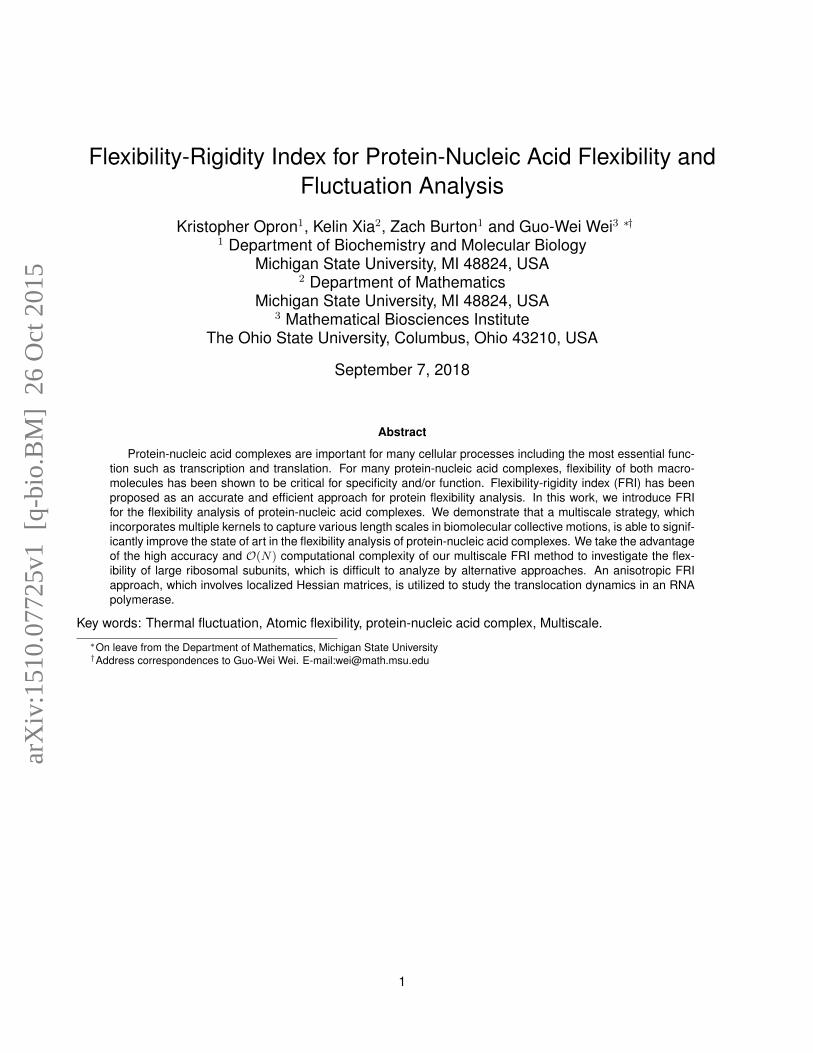
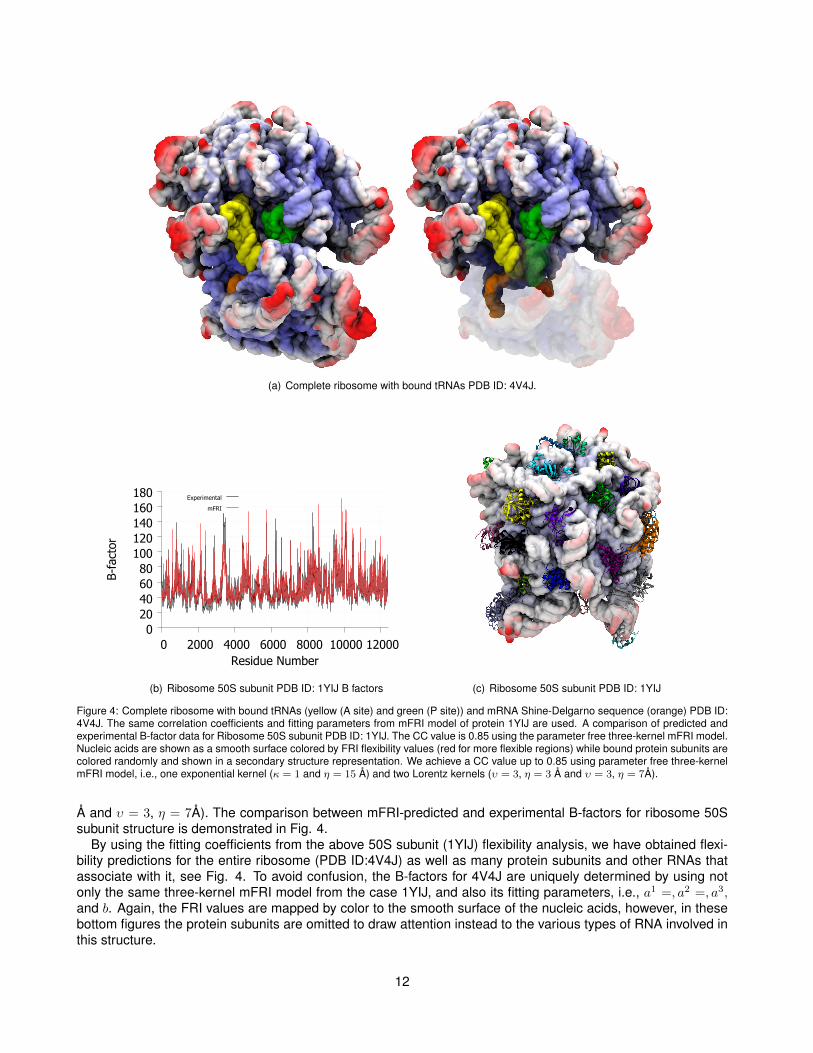
IV ApplicationsIn this section we briefly explore the applications of the mFRI and aFRI methods to large protein-nucleic acidcomplexes. We highlight a few particular examples where mFRI improves upon previous FRI methods, in par-ticular, for the flexibility prediction of ribosomes. Further, we show how aFRI is well suited for the study of thedynamics of large macromolecular complexes using the bacterial RNA polymerase active site as an example.IV.A Multikernel FRI flexibility prediction for protein-nucleic acid structures - ribosomesSome of the largest and most biologically important structures that contain both protein and nucleic acids areribosomes. Ribosomes are the protein synthesizers of the cell and connect amino acid into polymer chains. Inribosomes, proteins and RNA interact through intermolecular effects, such as electrostatic interactions, hydrogenbonding, hydrophobic interactions, base stacking and base pairing. RNA tertiary structures can significantlyinfluence protein-RNA interactions. Ribosomes are primarily composed of RNA with many smaller associatedproteins as shown in Fig. 4. The top of Fig. 4 shows the 50S subunit of the ribosome (PDB ID: 1YIJ) withthe nucleic acids in a smooth surface representation with the protein subunits bound and shown in a secondarystructure representation. The set of 64 structures used in our tests contains a number of ribosomal subunits.Due to their multiscale nature, these structures also happen to be among those that benefit the most from usingmultikernel FRI over single kernel FRI or GNM. For example, in the case of ribosome 50S subunit structure (PDBID:1YIJ), B-factor prediction with three-kernel FRI yields a CC value of 0.85, while that of single kernel FRI isonly around 0.3. GNM does not provide a good B-factor prediction for this structure either. The three-kernelmFRI model we used is one exponential kernel (κ = 1 and η = 15 Å) and two Lorentz kernels (υ = 3, η = 3
11
(a) Complete ribosome with bound tRNAs PDB ID: 4V4J.
0 20 40 60 80
100 120 140 160 180
0 2000 4000 6000 8000 10000 12000
B-fa
ctor
Residue Number
Experimental
mFRI
(b) Ribosome 50S subunit PDB ID: 1YIJ B factors (c) Ribosome 50S subunit PDB ID: 1YIJ
Figure 4: Complete ribosome with bound tRNAs (yellow (A site) and green (P site)) and mRNA Shine-Delgarno sequence (orange) PDB ID:4V4J. The same correlation coefficients and fitting parameters from mFRI model of protein 1YIJ are used. A comparison of predicted andexperimental B-factor data for Ribosome 50S subunit PDB ID: 1YIJ. The CC value is 0.85 using the parameter free three-kernel mFRI model.Nucleic acids are shown as a smooth surface colored by FRI flexibility values (red for more flexible regions) while bound protein subunits arecolored randomly and shown in a secondary structure representation. We achieve a CC value up to 0.85 using parameter free three-kernelmFRI model, i.e., one exponential kernel (κ = 1 and η = 15 Å) and two Lorentz kernels (υ = 3, η = 3 Å and υ = 3, η = 7Å).
Å and υ = 3, η = 7Å). The comparison between mFRI-predicted and experimental B-factors for ribosome 50Ssubunit structure is demonstrated in Fig. 4.
By using the fitting coefficients from the above 50S subunit (1YIJ) flexibility analysis, we have obtained flexi-bility predictions for the entire ribosome (PDB ID:4V4J) as well as many protein subunits and other RNAs thatassociate with it, see Fig. 4. To avoid confusion, the B-factors for 4V4J are uniquely determined by using notonly the same three-kernel mFRI model from the case 1YIJ, and also its fitting parameters, i.e., a1 =, a2 =, a3,and b. Again, the FRI values are mapped by color to the smooth surface of the nucleic acids, however, in thesebottom figures the protein subunits are omitted to draw attention instead to the various types of RNA involved inthis structure.
12
IV.B Anisotropic FRI for conformational motion prediction of an RNA polymeraseRNA polymerase is one of the essential enzymes for all life on Earth as we know it today and possibly fromthe very beginning of life.7,25 Despite this importance, the mechanisms for many of the polymerase’s functionsare still not well understood on the atomic level. Considerable effort has been spent both experimentally andcomputationally to understand RNAP polymerase function in more detail but many questions remain. The studyof RNA polymerase experimentally or computationally is difficult and often expensive due to the size of thesystem and variety of molecules involved. The minimal required elements for a bacterial or eukaryotic RNApolymerase include multiple protein subunits, a double stranded DNA molecule, a single stranded RNA molecule,free nucleotides, various ions (Mg2+, Zn2+, Na+ etc.) and solvent. A typical setup for this system in all-atommolecular dynamics includes 300,000 atoms when solvated. With this number of atoms and current computerpower, it is often not feasible to simulate these molecules on biologically relevant timescales using MD. Perhapsthe most popular tool for studying long time dynamics of biomolecules is normal mode analysis (NMA) andits related methods such as the anisotropic network model (ANM). These methods have been successfullyused to study protein dynamics for many proteins, however, at their maximum accuracy, their computationalcomplexity is of O(N3), where N is the number of atoms. This is a problem because many cellular functionsinvolve a large number of macromolecules with many thousands to millions of residues to consider. Therefore,future computational studies of biomolecules beyond the protein scale will require methods with better scalingproperties such as FRI and aFRI.
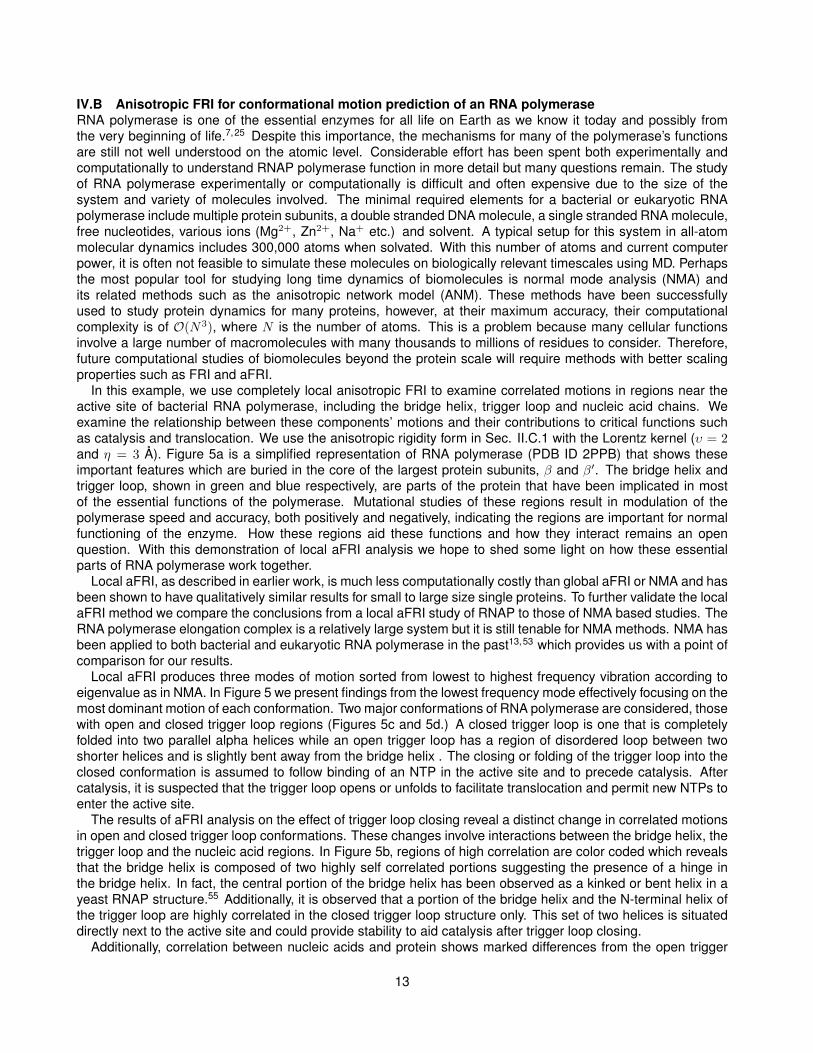
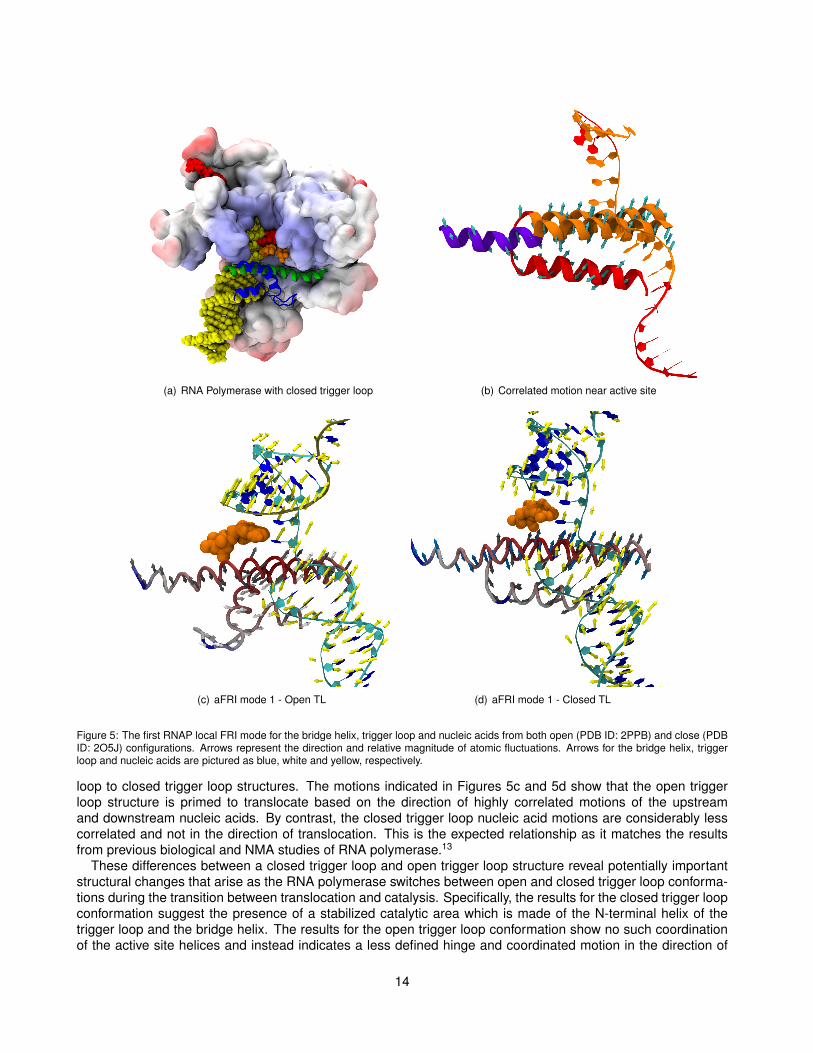
In this example, we use completely local anisotropic FRI to examine correlated motions in regions near theactive site of bacterial RNA polymerase, including the bridge helix, trigger loop and nucleic acid chains. Weexamine the relationship between these components’ motions and their contributions to critical functions suchas catalysis and translocation. We use the anisotropic rigidity form in Sec. II.C.1 with the Lorentz kernel (υ = 2and η = 3 Å). Figure 5a is a simplified representation of RNA polymerase (PDB ID 2PPB) that shows theseimportant features which are buried in the core of the largest protein subunits, β and β′. The bridge helix andtrigger loop, shown in green and blue respectively, are parts of the protein that have been implicated in mostof the essential functions of the polymerase. Mutational studies of these regions result in modulation of thepolymerase speed and accuracy, both positively and negatively, indicating the regions are important for normalfunctioning of the enzyme. How these regions aid these functions and how they interact remains an openquestion. With this demonstration of local aFRI analysis we hope to shed some light on how these essentialparts of RNA polymerase work together.
Local aFRI, as described in earlier work, is much less computationally costly than global aFRI or NMA and hasbeen shown to have qualitatively similar results for small to large size single proteins. To further validate the localaFRI method we compare the conclusions from a local aFRI study of RNAP to those of NMA based studies. TheRNA polymerase elongation complex is a relatively large system but it is still tenable for NMA methods. NMA hasbeen applied to both bacterial and eukaryotic RNA polymerase in the past13,53 which provides us with a point ofcomparison for our results.
Local aFRI produces three modes of motion sorted from lowest to highest frequency vibration according toeigenvalue as in NMA. In Figure 5 we present findings from the lowest frequency mode effectively focusing on themost dominant motion of each conformation. Two major conformations of RNA polymerase are considered, thosewith open and closed trigger loop regions (Figures 5c and 5d.) A closed trigger loop is one that is completelyfolded into two parallel alpha helices while an open trigger loop has a region of disordered loop between twoshorter helices and is slightly bent away from the bridge helix . The closing or folding of the trigger loop into theclosed conformation is assumed to follow binding of an NTP in the active site and to precede catalysis. Aftercatalysis, it is suspected that the trigger loop opens or unfolds to facilitate translocation and permit new NTPs toenter the active site.
The results of aFRI analysis on the effect of trigger loop closing reveal a distinct change in correlated motionsin open and closed trigger loop conformations. These changes involve interactions between the bridge helix, thetrigger loop and the nucleic acid regions. In Figure 5b, regions of high correlation are color coded which revealsthat the bridge helix is composed of two highly self correlated portions suggesting the presence of a hinge inthe bridge helix. In fact, the central portion of the bridge helix has been observed as a kinked or bent helix in ayeast RNAP structure.55 Additionally, it is observed that a portion of the bridge helix and the N-terminal helix ofthe trigger loop are highly correlated in the closed trigger loop structure only. This set of two helices is situateddirectly next to the active site and could provide stability to aid catalysis after trigger loop closing.
Additionally, correlation between nucleic acids and protein shows marked differences from the open trigger
13
(a) RNA Polymerase with closed trigger loop (b) Correlated motion near active site
(c) aFRI mode 1 - Open TL (d) aFRI mode 1 - Closed TL
Figure 5: The first RNAP local FRI mode for the bridge helix, trigger loop and nucleic acids from both open (PDB ID: 2PPB) and close (PDBID: 2O5J) configurations. Arrows represent the direction and relative magnitude of atomic fluctuations. Arrows for the bridge helix, triggerloop and nucleic acids are pictured as blue, white and yellow, respectively.
loop to closed trigger loop structures. The motions indicated in Figures 5c and 5d show that the open triggerloop structure is primed to translocate based on the direction of highly correlated motions of the upstreamand downstream nucleic acids. By contrast, the closed trigger loop nucleic acid motions are considerably lesscorrelated and not in the direction of translocation. This is the expected relationship as it matches the resultsfrom previous biological and NMA studies of RNA polymerase.13
These differences between a closed trigger loop and open trigger loop structure reveal potentially importantstructural changes that arise as the RNA polymerase switches between open and closed trigger loop conforma-tions during the transition between translocation and catalysis. Specifically, the results for the closed trigger loopconformation suggest the presence of a stabilized catalytic area which is made of the N-terminal helix of thetrigger loop and the bridge helix. The results for the open trigger loop conformation show no such coordinationof the active site helices and instead indicates a less defined hinge and coordinated motion in the direction of
14
translocation. Taken together these results provide a potential explanation for how trigger loop opening andclosing is correlated with translocation and catalysis respectively.V Concluding remarksProtein-nucleic acid complexes are essential to all living organisms. The function of these complexes dependscrucially on their flexibility, an intrinsic property of a macromolecule. However, for many large protein-nucleicacid complexes, such as ribosomes and RNA polymerases, the present flexibility analysis approaches can beproblematic due to their computational complexity scaling of O(N3) and neglecting multiscale effects.
This work introduces the flexibility-rigidity index (FRI) methods39,40,60 for the flexibility analysis of protein-nucleic acid structures. We show that a multiscale FRI (mFRI) realized by multiple kernels parametrized atmultiple length scales is able to significantly outperform the Gaussian network model (GNM) for the B-factorprediction of a set of 64 protein-nucleic acid complexes.66 The FRI methods are not only accurate, but alsoefficient, as their computational complexity scales as O(N). Additionally, anisotropic FRI (aFRI), which hascluster Hessian matrices, offers collective motion analysis for any given cluster, i.e, subunit or domain in abiomolecular complex.
We apply FRI methods to a large ribosomal subunit (1YIJ) with multiple subunits. We note that both originalsingle-scale FRI and GNM do not work well for this structure. It is found that that the multiscale strategy is crucialfor the flexibility analysis of multi-subunit structures. The correlation coefficients between FRI predictions andexperimental B-factors for 1YIJ improve from 0.3 for single-scale FRI to 0.85 for multiscale FRI. We further usethe fitting coefficients obtained from 1YIJ to predict the flexibility of a entire ribosome, 4V4J. We found that mFRIhas an advantage for analyzing large biomolecular complexes due to both higher speeds and accuracy.
We have also demonstrated the utility of the anisotropic FRI (aFRI) for analyzing the translocation of an RNApolymerase, which involves protein, DNA, RNA, nucleotide substrates and various ions. Both experimentaland computational studies of RNA polymerases are difficult and expensive due to the size and complexity ofthe biomolecular complex. The molecular mechanism of RNA polymerase translocation is an interesting, openresearch topic. The present work makes use of localized aFRI to elucidate the synergistic local motions ofa bacterial RNA polymerase. Our findings are consistent with those from much more expensive moleculardynamics simulations and normal mode analysis.13,14
The study of hinges has been an important topic and much research has been done in the past.12,15,16,27,43
Identification of hinge residues is useful for inferring motion and function when molecules are too large for MDsimulation on relevant timescales. Other methods, such as GNM and NMA have been utilized. FRI-basedmethods could place a significant role in hinge analysis. This aspect will be carefully analyzed in our futurework.
AcknowledgmentsThis work was supported in part by NSF grants, IIS-1302285, and DMS-1160352, NIH Grant R01GM-090208and Michigan State University Center for Mathematical Molecular Biosciences Initiative. The authors acknowl-edge the Mathematical Biosciences Institute for hosting valuable workshops.
References[1] M. P. Allen and D. J. Tildesley. Computer Simulation of Liquids. Oxford: Clarendon Press, 1987.
[2] C. B. Anfinsen. Einfluss der configuration auf die wirkung den. Science, 181:223 – 230, 1973.
[3] A. R. Atilgan, S. R. Durrell, R. L. Jernigan, M. C. Demirel, O. Keskin, and I. Bahar. Anisotropy of fluctuationdynamics of proteins with an elastic network model. Biophys. J., 80:505 – 515, 2001.
[4] I. Bahar, A. R. Atilgan, M. C. Demirel, and B. Erman. Vibrational dynamics of proteins: Significance of slowand fast modes in relation to function and stability. Phys. Rev. Lett, 80:2733 – 2736, 1998.
[5] I. Bahar, A. R. Atilgan, and B. Erman. Direct evaluation of thermal fluctuations in proteins using a single-parameter harmonic potential. Folding and Design, 2:173 – 181, 1997.
15
[6] B. R. Brooks, R. E. Bruccoleri, B. D. Olafson, D. States, S. Swaminathan, and M. Karplus. Charmm: Aprogram for macromolecular energy, minimization, and dynamics calculations. J. Comput. Chem., 4:187–217, 1983.
[7] Z. F. Burton. The old and new testaments of gene regulation: Evolution of multi-subunit rna polymerasesand co-evolution of eukaryote complexity with the rnap ii ctd. Transcription, 5(3), 2014.
[8] Q. Cui and I. Bahar. Normal mode analysis: theory and applications to biological and chemical systems.Chapman and Hall/CRC, 2010.
[9] Q. Cui, G. J. Li, J. Ma, and M. Karplus. A normal mode analysis of structural plasticity in the biomolecularmotor f(1)-atpase. J. Mol. Biol., 340(2):345 – 372, 2004.
[10] O. N. A. Demerdash and J. C. Mitchell. Density-cluster NMA: A new protein decomposition technique forcoarse-grained normal mode analysis. Proteins:Structure Function and Bioinformatics, 80(7):1766–1779,JUL 2012.
[11] O. K. Dudko, G. Hummer, and A. Szabo. Intrinsic rates and activation free energies from single-moleculepulling experiments. Phys. Rev. Lett., 96:108101, 2006.
[12] U. Emekli, S. Dina, H. Wolfson, R. Nussinov, and T. Haliloglu. HingeProt: automated prediction of hinges inprotein structures. Proteins, 70(4):1219–1227, 2008.
[13] M. Feig and Z. F. Burton. Rna polymerase ii flexibility during translocation from normal mode analysis.Proteins: Structure, Function, and Bioinformatics, 78(2):434–446, 2010.
[14] M. Feig and Z. F. Burton. Rna polymerase ii with open and closed trigger loops: active site dynamics andnucleic acid translocation. Biophysical journal, 99(8):2577–2586, 2010.
[15] S. Flores and M. Gerstein. FlexOracle: predicting flexible hinges by identification of stable domains. BMCbioinformatics, 8(1), 2007.
[16] S. Flores, L. Lu, J. Yang, N. Carriero, and M. Gerstein. Hinge atlas: relating protein sequence to sites ofstructural flexibility. BMC bioinformatics, 8, 2007.
[17] P. J. Flory. Statistical thermodynamics of random networks. Proc. Roy. Soc. Lond. A,, 351:351 – 378, 1976.
[18] H. Frauenfelder, S. G. Slihar, and P. G. Wolynes. The energy landsapes and motion of proteins . Science,254(5038):1598–1603, DEC 13 1991.
[19] Z. N. Gerek and S. B. Ozkan. A flexible docking scheme to explore the binding selectivity of pdz domains.Protein Science, 19:914–928, 2010.
[20] N. Go, T. Noguti, and T. Nishikawa. Dynamics of a small globular protein in terms of low-frequency vibra-tional modes. Proc. Natl. Acad. Sci., 80:3696 – 3700, 1983.
[21] B. Halle. Flexibility and packing in proteins. PNAS, 99:1274–1279, 2002.
[22] K. Hinsen. Analysis of domain motions by approximate normal mode calculations. Proteins, 33:417 – 429,1998.
[23] K. Hinsen. Structural flexibility in proteins: impact of the crystal environment. Bioinformatics, 24:521 – 528,2008.
[24] S. W. Huang, C. H. Shih, C. P. Lin, and J. K. Hwang. Prediction of nmr order parameters in proteins usingweighted protein contact-number model. Theoretical Chemistry Accounts, 121(3-4):197–200, 2008.
[25] L. M. Iyer, E. V. Koonin, and L. Aravind. Evolutionary connection between the catalytic subunits of dna-dependent rna polymerases and eukaryotic rna-dependent rna polymerases and the origin of rna poly-merases. BMC structural biology, 3(1):1, 2003.
16
[26] D. J. Jacobs, A. J. Rader, L. A. Kuhn, and M. F. Thorpe. Protein flexibility predictions using graph theory.Proteins-Structure, Function, and Genetics, 44(2):150–165, AUG 1 2001.
[27] K. S. Keating, S. C. Flores, M. B. Gerstein, and L. A. Kuhn. StoneHinge: hinge prediction by networkanalysis of individual protein structures. Protein Science, 18(2):359–371, 2009.
[28] O. Keskin, I. Bahar, D. Flatow, D. G. Covell, and R. L. Jernigan. Molecular mechanisms of chaperoningroel-groes function. Biochem., 41:491 – 501, 2002.
[29] D. A. Kondrashov, A. W. Van Wynsberghe, R. M. Bannen, Q. Cui, and J. G. N. Phillips. Protein structuralvariation in computational models and crystallographic data. Structure, 15:169 – 177, 2007.
[30] M. Krone, J. E. Stone, T. Ertl, and K. Schulten. Fast visualization of Gaussian density surfaces for moleculardynamics and particle system trajectories. EuroVis-Short Papers, 2012:67–71, 2012.
[31] S. Kundu, J. S. Melton, D. C. Sorensen, and J. G. N. Phillips. Dynamics of proteins in crystals: comparisonof experiment with simple models. Biophys. J., 83:723 – 732, 2002.
[32] M. Levitt, C. Sander, and P. S. Stern. Protein normal-mode dynamics: Trypsin inhibitor, crambin, ribonucle-ase and lysozyme. J. Mol. Biol., 181(3):423 – 447, 1985.
[33] D. W. Li and R. Brüschweiler. All-atom contact model for understanding protein dynamics from crystallo-graphic b-factors. Biophysical journal, 96(8):3074–3081, 2009.
[34] G. H. Li and Q. Cui. A coarse-grained normal mode approach for macromolecules: an efficient implemen-tation and application to Ca(2+)-ATPase. Bipohys. J., 83:2457 – 2474, 2002.
[35] C. P. Lin, S. W. Huang, Y. L. Lai, S. C. Yen, C. H. Shih, C. H. Lu, C. C. Huang, and J. K. Hwang. Derivingprotein dynamical properties from weighted protein contact number. Proteins: Structure, Function, andBioinformatics, 72(3):929–935, 2008.
[36] D. R. Livesay, S. Dallakyan, G. G. Wood, and D. J. Jacobs. A flexible approach for understanding proteinstability. FEBS Letters, 576:468–476, 2004.
[37] J. P. Ma. Usefulness and limitations of normal mode analysis in modeling dynamics of biomolecular com-plexes. Structure, 13:373 – 180, 2005.
[38] J. A. McCammon, B. R. Gelin, and M. Karplus. Dynamics of folded proteins. Nature, 267:585–590, 1977.
[39] K. Opron, K. L. Xia, and G. W. Wei. Fast and anisotropic flexibility-rigidity index for protein flexibility andfluctuation analysis. Journal of Chemical Physics, 140:234105, 2014.
[40] K. Opron, K. L. Xia, and G. W. Wei. Communication: Capturing protein multiscale thermal fluctuations.Journal of Chemical Physics, 142(211101), 2015.
[41] J. K. Park, R. Jernigan, and Z. Wu. Coarse grained normal mode analysis vs. refined gaussian networkmodel for protein residue-level structural fluctuations. Bulletin of Mathematical Biology, 75:124 –160, 2013.
[42] A. J. Rader, D. H. Vlad, and I. Bahar. Maturation dynamics of bacteriophage hk97 capsid. Structure, 13:413– 421, 2005.
[43] M. Shatsky, R. Nussinov, and H. J. Wolfson. FlexProt: alignment of flexible protein structures without apredefinition of hinge regions. Journal of Computational Biology, 11(1):83–8106, 2004.
[44] L. Skjaerven, S. M. Hollup, and N. Reuter. Normal mode analysis for proteins. Journal of MolecularStructure: Theochem., 898:42 – 48, 2009.
[45] G. Song and R. L. Jernigan. vgnm: a better model for understanding the dynamics of proteins in crystals.J. Mol. Biol., 369(3):880 – 893, 2007.
[46] F. Tama and C. K. Brooks III. Diversity and identity of mechanical properties of icosahedral viral capsidsstudied with elastic network normal mode analysis. J. Mol. Biol., 345:299 – 314, 2005.
17
[47] F. Tama, F. X. Gadea, O. Marques, and Y. H. Sanejouand. Building-block approach for determining low-frequency normal modes of macromolecules. Proteins: Structure, Function, and Bioinformatics, 41(1):1–7,2000.
[48] F. Tama and Y. H. Sanejouand. Conformational change of proteins arising from normal mode calculations.Protein Eng., 14:1 – 6, 2001.
[49] F. Tama, M. Valle, J. Frank, and C. K. Brooks III. Dynamic reorganization of the functionally active ribosomeexplored by normal mode analysis and cryo-electron microscopy. Proc. Natl Acad. Sci., 100(16):9319 –9323, 2003.
[50] M. Tasumi, H. Takenchi, S. Ataka, A. M. Dwidedi, and S. Krimm. Normal vibrations of proteins: Glucagon.Biopolymers, 21:711 – 714, 1982.
[51] M. M. Tirion. Large amplitude elastic motions in proteins from a single-parameter, atomic analysis. Phys.Rev. Lett., 77:1905 – 1908, 1996.
[52] M. Topf, K. Lasker, B. Webb, H. Wolfson, and W. C. A. Sali. Protein structure fitting and refinement guidedby cryo-em density. Structure, 16:295–307, 2008.
[53] A. Van Wynsberghe, G. Li, and Q. Cui. Normal-mode analysis suggests protein flexibility modulationthroughout rna polymerase’s functional cycle. Biochemistry, 43(41):13083–13096, 2004.
[54] C. W. von der Lieth, K. Stumpf-Nothof, and U. Prior. A bond flexibility index derived from the constitution ofmolecules. Journal of Chemical Information and Computer Science, 36:711–716, 1996.
[55] D. Wang, D. A. Bushnell, K. D. Westover, C. D. Kaplan, and R. D. Kornberg. Structural basis of transcription:role of the trigger loop in substrate specificity and catalysis. Cell, 127(5):941–954, 2006.
[56] Y. Wang, A. J. Rader, I. Bahar, and R. L. Jernigan. Global ribosome motions revealed with elastic networkmodel. J. Struct. Biol., 147:302 – 314, 2004.
[57] G. W. Wei. Wavelets generated by using discrete singular convolution kernels. Journal of Physics A:Mathematical and General, 33:8577 – 8596, 2000.
[58] W. Wriggers, R. A. Milligan, and J. A. McCammon. Situs: A package for docking crystal structures intolow-resolution maps from electron microscopy. Journal of Structure Biology, 125:185–195, 1999.
[59] K. L. Xia, X. Feng, Y. Y. Tong, and G. W. Wei. Persistent homology for the quantitative prediction of fullerenestability. Journal of Computational Chemsitry, 36:408–422, 2015.
[60] K. L. Xia, K. Opron, and G. W. Wei. Multiscale multiphysics and multidomain models — Flexibility andrigidity. Journal of Chemical Physics, 139:194109, 2013.
[61] K. L. Xia and G. W. Wei. A stochastic model for protein flexibility analysis. Physical Review E, 88:062709,2013.
[62] K. L. Xia and G. W. Wei. Molecular nonlinear dynamics and protein thermal uncertainty quantification.Chaos, 24:013103, 2014.
[63] K. L. Xia and G. W. Wei. Persistent topology for cryo-EM data analysis. International Journal for NumericalMethods in Biomedical Engineering, 31:e02719, 2015.
[64] K. L. Xia, Z. X. Zhao, and G. W. Wei. Multiresolution topological simplification. Journal ComputationalBiology, 22:1–5, 2015.
[65] C. Xu, D. Tobi, and I. Bahar. Allosteric changes in protein structure computed by a simple mechanicalmodel: hemoglobin t <–> r2 transition. J. Mol. Biol., 333:153 – 168, 2003.
18
[66] L. Yang, A. Rader, X. Liu, C. Jursa, S. Chen, H. Karimi, and I. Bahar. oGNM: online computation of structuraldynamics using the gaussian network model. Nucleic acids research, 34(Web Server issue):W24–W31,2006.
[67] L. W. Yang and C. P. Chng. Coarse-grained models reveal functional dynamics–I. elastic network models–theories, comparisons and perspectives. Bioinformatics and Biology Insights, 2:25 – 45, 2008.
[68] F. L. Zhang and R. Brüschweiler. Contact model for the prediction of nmr nh order parameters in globularproteins. Journal of the American Chemical Society, 124(43):12654–12655, 2002.
[69] W. Zheng, B. R. Brooks, and D. Thirumalai. Allosteric transitions in the chaperonin groel are captured by adominant normal mode that is most robust to sequence variations. Biophys. J., 93:2289 – 2299, 2007.
[70] W. J. Zheng and S. Doniach. A comparative study of motor-protein motions by using a simple elastic-network model. Proc. Natl. Acad. Sci. USA., 100(23):13253 – 13258, 2003.
19