FLEET ASSET MANAGEMENT STRATEGY PLAN FY · PDF fileFLEET ASSET MANAGEMENT STRATEGY PLAN FY...
40
FLEET ASSET MANAGEMENT STRATEGY PLAN FY 2013 through FY 2022 Prepared by: Sean Joyce Fleet Manager 2 August 2013 This asset strategy was prepared before BPA’s proposal to reduce costs. Spending levels in this document may not tie to proposed reductions. The strategy will be revised upon conclusion of the CIR and the IPR.
Transcript of FLEET ASSET MANAGEMENT STRATEGY PLAN FY · PDF fileFLEET ASSET MANAGEMENT STRATEGY PLAN FY...

FLEET ASSET MANAGEMENT STRATEGY PLAN
FY 2013 through FY 2022
Prepared by: Sean Joyce
Fleet Manager
2 August 2013
This asset strategy was prepared before BPA’s proposal to reduce costs. Spending levels in this document
may not tie to proposed reductions. The strategy will be revised upon conclusion of the CIR and the IPR.

2
Table of Contents
Executive Summary……………………………………………………………… pg. 3
1. Introduction………………………………………………………………… pg. 4
1.1 Purpose…………………………………………………………….…… pg. 6
1.2 Scope…………………………………………………………….…...... pg. 6
2. Fleet Management Objectives & Strategies…………………………….….. pg. 7
3. Key Factors for Agency Fleet Requirements…………………………….... pg. 10
4. Fleet Management Department Organizational Structure……………........ pg. 10
4.1 The Fleet Procurement, Policy & Analysis Division…………..………. pg. 11
4.2 The Equipment & Tool Loan Pool Division….……………................. pg. 11
4.3 The Mobile Equipment Maintenance Division………………………… pg. 12
5. Age & Condition Assessment of BPA Owned Fleet………………...…… pg. 12
5.1 BPA GSA Leased Fleet………………………………………………. pg. 17
5.2 Average Cost per Class Code for Over-The-Road Assets…………… pg. 18
6. Heavy Mobile Equipment Maintenance Facilities……………………..…. pg. 19
6.1 Maintenance Infrastructure Functionality Ratings…………….……... pg. 20
6.2 Maintenance Capabilities and Priorities……………………….……... pg. 22
7. Key Fleet Management Department Accomplishments……………........... pg. 24
8. Risk Management……………………………………………………….… pg. 26
9. Prioritization of Repairs/Refurbishment vs. Replacement………..…..….. pg. 33
9.1 Prioritization of Capital Replacements…………………………….… pg. 34
9.2 Fleet Capital Replacement Costs……………………………….……. pg. 35
9.3 Other Capital Costs……………………………………………….….. pg. 35
9.4 Fleet Management Expense Forecast…………………………….….. pg. 36
10. Alternative Strategies/Scenarios Considered and Business Model
Chosen………………………………………………………………..…… pg. 36
10.1 Key Factors that Showcase the Chosen BPA Business Model….….. pg. 37
10.2 FMDs Asset Strategy………………………………………………… pg. 38
11. Summary……………………………………………………………..…… pg. 38
3
EXECUTIVE SUMMARY
The goal of any Fleet Asset Management process is to use a system-wide approach in
order to improve operations and make the organization more effective by considering the
full investment and life cycle of assets. The Fleet Management Department (FMD) is
committed to managing its fleet assets in a manner that is sustainable and economical, in
unison, to ensure the agency is equipped with the vehicles and equipment it requires to
perform mission-critical assignments.
In October 2011, the inception of the centralized FMD emerged as a result of two
independent studies, conducted by KEMA and Fleet Counselor Services (FCS). It
became apparent that significant changes in the current decentralized management
practices for fleet assets required prompt attention, and the majority of maintenance
infrastructures entailed refurbishment to meet their recommended functionality rating.
This dictated the need for improvements in managing and maintaining a sizeable fleet of
vehicles/equipment and facility enhancements.
Therefore, the objective of this Fleet Asset Management Strategy Plan is to identify past,
current/future operations and maintenance practices focusing on the strategic processes
required, enabling the FMD to continue to provide effective and efficient services to all
its internal customers.
The fleet is comprised of 2197 assets ranging from light to heavy duty vehicles,
construction/mobile and material handling equipment, of which 1312 are BPA owned,
and 885 are GSA leased. The net value of these owned assets is approximately $70
million. Currently, the annual operations and maintenance expenses for owned assets are
budgeted at $10.1 million ($3.4M Operations/Support and $6.7M Maintenance).
Recently, annual capital replacements have averaged $5.5 - $7 million. GSA lease
expenses add an additional $6.5 million.
With this large inventory, FMD will work towards right-sizing its fleet and optimizing
the lifecycle of the various vehicles and equipment to ensure proper fleet management
responsibilities. Replacing vehicles at the optimal time, planning proper maintenance,
reducing downtime and unplanned repairs, disposing of assets that are under-utilized,
reducing annual rental rates and ensuring proper fiscal management are paramount to
providing effective Fleet management. Additionally, FMD will continue to work closely
with its customers to understand their needs and assure effective, timely communication
and service.
The FMD will continue to improve to ensure operational requirements are met,
Governmental mandates are adhered to, risks are minimized, reliability is increased and
costs are reduced. Through planning and proper project management, the FMD is
confident in making this transition a success.

4
Fleet Asset Management Strategy
FY 2013 through FY 2022
1. Introduction
The Bonneville Power Administration‟s (BPA‟s) Fleet Management Department (FMD)
is committed to managing its fleet assets in a manner that is sustainable and economical,
in unison with ensuring the agency is equipped with the vehicles and equipment it
requires to perform mission-critical assignments.
As a result of two independent reviews, conducted by KEMA and Fleet Counselor
Services (FCS), it was apparent that significant changes in the management practices for
fleet assets needed to be addressed. The first study was conducted in 2006 by KEMA
whom found that fleet management at BPA was highly fragmented, resulting in differing
and conflicting priorities. In addition, KEMA determined that maintenance practices
were not standardized, and that replacement criteria were not in place to optimize vehicle
purchases. The Heavy Mobile Equipment Mechanic (HMEM) staff operations were
largely reactive and emergency response-driven, rather than proactive and preventive
maintenance strategy-driven.
The second study performed in 2009 by FCS assessed BPA‟s current state of operations
against 20 categories of basic fleet management best practices. As illustrated below,
BPA scored poorly passing only three of the 20 categories; Contract Work, Policies and
Procedures and Parts Inventory.

5
Measurements and Standards Categories FSC
Standard
BPA’s
Score
Result
1. Employee Goals, Mission Statement and
Business Plan (Foundation Category)
8 0 Not
Pass
2. Facilities 7 0 Not
Pass
3. Computer Systems 7 6 Not
Pass
4. Shop Equipment 7 3 Not
Pass
5. Staffing and Qualifications (Foundation
Category)
8 0 Not
Pass
6. Activity Based Costing and Productivity
Analysis
8 0 Not
Pass
7. Contract Work 6 8 Pass
8. Policies and Procedures (Foundation
Category)
8 9 Pass
9. PM Program (Foundation Category) 8 2 Not
Pass
10. Predictive Maintenance 8 0 Not
Pass
11. Work Flow and Communication 6 4 Not
Pass
12. Utilization Management (Foundation Category) 8 2 Not
Pass
13. Replacement Program (Foundation Category) 8 0 Not
Pass
14. Accounting and Billing 7 3 Not
Pass
15. Customer Service Downtime and Performance
Contract (Foundation Category)
8 0 Not
Pass
16. Parts Inventory (Foundation Category) 8 10 Pass
17. Fuel Management and Alternative Fuel 8 6 Not
Pass
18. Vehicle Procurement 8 7 Not
Pass
19. Emergency Management and Disaster
Preparedness
7 1 Not
Pass
20. Safety and Environmental Policy 9 8 Not
Pass
PERFORMANCE SCORE 153 = 76% 69 = 35% Not
Pass
6
It was these two studies, coupled with an internal agency analysis that piloted the
centralization of BPA‟s Fleet Management functions and the industrious effort to mold
BPA‟s Fleet Management practices into a group focused on industry best practices. These
recent efforts have laid the groundwork for fleet asset management. Accountability has
been established through the centralization of fleet related procurement, analysis,
licensing, maintenance, rentals, loan pool operations and reporting.
This newly formed FMD has been focused on implementing a number of the KEMA and
FCS recommendations, as well as identifying industry best practices that pertain to
BPA‟s specific, yet unique operational requirements. The FMD will continue to improve
to ensure operational requirements are met, Governmental mandates are adhered to, risks
are minimized, reliability is increased and costs are minimized.
1.1 Purpose
With the assistance of both KEMA and FCS reviews, BPA conducted a detailed analysis
of its fleet operations and evaluated them against industry best practices Upon
completion of these reviews it was decided that in order to maximize the efficient use of
the agency‟s fleet and personnel assets, BPA‟s fleet-related functions should be
centralized into one FMD. Therefore, the inception of the centralized FMD emerged in
October 2011.
1.2 Scope
The FMD is responsible for the acquisition, maintenance, and overall asset management
of BPA‟s fleet and the engine generators that support unmanned sub-maintenance
facilities and system protection/communications functions. BPA owns, operates and
maintains a wide variety of vehicles and equipment. The owned assets are comprised of
trailers and mobile equipment such as cranes, man-lifts of various sizes (from 33' up to
and including 180'), digger derrick trucks, pole trucks, substation maintenance route vans,
small boom trucks, and man-lifts, along with other specialized equipment for stringing of
conductor and overall maintenance of the transmission system. Other equipment consists
of bulldozers, backhoes and snow cats.
Additionally, BPA leases GSA vehicles that range from sedans used by the agency‟s
management and finance/support staff, to heavy duty pickups utilized by the agency‟s
electrical, construction and field crews.
The fleet consists of 2197 assets, of which 1312 are BPA owned, and 885 are GSA
leased. Of these assets, the mission critical equipment are the majority of BPA owned
man-lifts, cranes, derricks, wire stringing equipment, work/crew trucks, pole trucks, and
equipment/material hauling trucks (semi trucks/flatbed trucks) for maintaining and
restoring BPA‟s electrical systems. The less critical, but support equipment, that

7
becomes mission critical and is dependent on inclement weather, are the snow cats,
mobile generator, dozers, excavators, backhoes, and other specialized equipment.
Currently, the annual operations and maintenance expenses for owned assets are
budgeted at $10.1 million ($3.4M Operations/Support and $6.7M Maintenance).
Recently, annual capital replacements have averaged $5.5 - $7 million. GSA lease
expenses add an additional $6.5 million.
Count & Percentage of Fleet Vehicles
(Total BPA Owned and GSA Leased)
2012
Off Road &
Construction, 289,
13%
Over the
Road>26,000
GVWR, 214, 10%
Over the
Road<26,000
GVWR, 1021, 46%
Non Self Propelled,
673, 31%
Non Self Propelled
Over the Road<26,000 GVWR
Over the Road>26,000 GVWR
Off Road & Construction
2. Fleet Management Objectives and Strategies
The asset management objectives and strategies for fleet equipment are:
Reduce use of fossil fuels by right-sizing the fleet through a systematic
analysis identifying compulsory requirements to conduct the agency’s
mission. Evaluate the business case of each asset to determine whether
reassigning, replacing, or eliminate the vehicle would reduce fossil fuel usage and
costs without compromising fleet activities. A cross functional sustainability team
has been established to conduct internal customer interviews and determine the
minimum level of assets required to support mission requirements. Right-sizing
the fleet will allow for more efficient operations practices by reducing GHG
emissions and related pollutants, reduce fossil fuel consumption, reduce operating
costs and free up capital funds. Expected completion is 4th
quarter of FY-14.
8
Establish policy on the types of equipment that should be agency-owned
versus locally rented, while leveraging the use of local rental sources. Routinely review BPA assets percentage of usage to determine retention, cost
comparison, as well as assess local rentals to determine proper mix and best value
to BPA and the FMD. The current Fleet Management System (FMS) makes this
task daunting and labor intensive with incomplete but actionable results.
Continual review will generate the proper mix and cost saving realizations. This
strategy is on-going and under continuous scrutiny and will provide significantly
better results upon fielding of a new FMS.
Focus on preventive/predictive maintenance to reduce the amount of
emergency response and corrective maintenance. Ensure scheduled
maintenance is in accordance with manufacturer‟s recommended intervals and
identify those predictive assets that require additional review due to high usage.
As stated previously and will be stated again, the current FMS makes this task
more difficult to carry out and much more labor demanding with marginal results.
Adhering to being focused on preventive/predictive maintenance will ensure
equipment availability and reduce downtime. This approach is continual and
specific to the asset being maintained.
Develop and implement a professional training and certification program for
the FMD maintenance technicians. Identify gaps and determine/establish a
training plan to meet maintenance technicians required skill-sets. Dedicated
funding will determine success and deliverable of this objective. The institution
of a professional training/certification program will enhance maintenance skill-
sets and promote awareness of maintenance issues and implement solutions to
ever-changing technologies. This is scheduled to commence late FY-14, but no
later than mid FY-15.
Standardize to reduce acquisition, maintenance and inventory costs, and
thereby possessing additional funds for recruitment/training. Conduct right-
sizing review to determine minimum level of assets required to meet mission
needs and standardize assets performing the same trade by numbers and types. A
team has been created to tackle the right-sizing initiative to include internal
customer engagement and buy-in. Establishing standardization will lead to
reduced inventory, acquisition, maintenance and costs, thus allowing additional
allocation of funds for improvements and training. This process is recurring.
Develop competency to prepare a life cycle analysis considering vehicle
usage, condition, failure rates, maintenance costs, overall costs, etc.
Determine net acquisition costs, establish estimated depreciation rates, identify
other fixed costs, calculate estimated lifetime operating costs and add the
estimated lifetime holding/operating costs to arrive at the estimated lifecycle. The
existing FMS impedes this preparation and requires many man-hours to launch a
life cycle analysis. Ongoing analysis of key factors that drive efficiency –
maintenance, downtime, and fuel efficiency trends – are a must to uncover cost

9
savings/carbon reduction and create a concrete life cycle analysis. This method of
analysis is quarterly and steady.
Improve tracking and reporting of expenditures. Assess the progress, set
specific targets and monitor the sustainability performance over a monthly,
quarterly and annual basis. Improvement will require a new FMS (scheduled for
FY 2014 per ACPRT approval in FY 2013) and/or additional staffing.
Tracking and reporting is the periodic scrutiny of FMDs success towards the goal
of improving expenditures. This process is a daily function of the FMD.
Enhance data quality associated with vehicle cost and maintenance. Examine
effects of asset component selection to determine cost and cost triggers, and then
visually graph to depict “cradle to grave” history to determine optimal retention.
An inapt FMS complicates the FMD‟s ability to enhance data quality. Improved
data quality allows for efficient and effective management of fleet assets, and
justifies decision-based actions regarding vehicle cost and maintenance. This task
is a daily undertaking.
Improve capabilities for emergency response, while reducing frequency
through implementation of a planned maintenance strategy. Schedule
maintenance as recommended by the manufacture, and target those assets that are
historically known to required additional maintenance due to volume of usage.
Additional funding will be required to develop and implement a professional
training/certification program for the FMD maintenance technicians to augment
the required skill-sets, together with the modernization of the existing FMS. The
improved capabilities will ensure asset availability for emergency responses that
have been implemented by an effective maintenance strategy. This effort is
underway, but will continue to be revisited as technology changes.
Enhance internal and external reporting capability. Identify reporting
deficiencies between input versus output and label shortfalls to improve reporting
function. The purchase of a new FMS or significant upgrades to the existing FMS
are required, otherwise manual report compilation is the sole avenue of acquiring
desired reporting. The foundation to a sound FMD is the ability to produce
reports that provide value and assist with business making decisions. Estimated
timeframe is 2015 - 2016 due to current ACPRT approval for a Fleet Management
System in 2014.
Foster business driven decisions using analytics and metrics, measured
against risk, to ensure agency needs are met in a cost-effective manner. Track and align core strategies and processes of transportation activities and
metrics with business goals by creating a metrics framework to monitor and then
develop/utilize the balance score card to manage/gage performance to maximize
effectiveness and optimize the return of investment for the FMD. This process is
attainable though labor intensive due to an inapt FMS. Promoting business driven
decisions using analytics and metrics, to mitigate risk, provides actionable

10
business insights to improve Transportation‟s effectiveness and efficiency which
enables the FMD to justify budgets based on returns and to drive organizational
growth and innovation. This objective has commenced and will continue to
evolve.
3. Key Factors for Agency Fleet Requirements
Key factors to the agency‟s fleet requirements are primarily centered on transmission
system maintenance and reliability. However, when practical, secondary elements that
aid these decisions are environmental stewardship and the assurance that the FMD has
the necessary assets at the lowest life cycle cost.
Specific key factors are:
The necessity to manage the mobile equipment and EG maintenance workload
system wide
The necessity to ensure the agency‟s maintenance technicians are a workforce
comprised of highly skilled and trained technicians that possess a directed focus
and skill-set designed to work on the myriad of equipment types the agency
operates
The necessity to right-sizing the fleet to ensure appropriate mix and quantity
The necessity for a strategic plan, from a business and risk perspective, whereby
equipment is rented as warranted versus identification of assets in the best interest
of BPA that should be retained on hand either by GSA leased or owned assets
The necessity to develop a life cycle analysis and optimal replacement criterion
in order to construct comprehensive and detailed capital purchase plans
In order to achieve these key factors, the FMD must operate in accordance with a well-
defined, proactive strategic workload management plan. Additionally, a concentrated
effort on the development and execution of a robust continual training
curriculum/program must materialize to ensure BPA HMEM technicians have the skill-
sets and tools to perform work on BPA‟s mobile equipment assets located in improved
and properly equipped HMEM facilities, as well as field locations.
4. Fleet Management Department Organizational Structure
In October 2011, BPA consolidated fleet operations into one organization designed to
support, manage and oversee the agency‟s fleet requirements. This new organization is
located in the Supply Chain portion of Internal Business Services. Major elements of the
new FMD are the Fleet Analysis & Policy Division, the Equipment and Tool Loan Pool
Division and the Mobile Equipment Maintenance Division.

11
BPA’s Fleet Management Department
Organization Chart
(52 Total FTE)
4.1 The Fleet Procurement, Policy & Analysis Division is responsible for the
acquisition of owned assets, as well as GSA leased vehicles. This includes data
management and analysis, licensing and registration of BPA vehicles, the development
and documentation of policies related to motor vehicles and equipment, the development
and submission of reports and the basic life cycle analysis essential to execute Fleet
Management.
4.2 The Equipment & Tool Loan Pool Division is responsible for meeting the
equipment shortfall needs of the agency. This is accomplished by utilizing centrally
managed assets that are operated, tracked and controlled by the loan pool personnel, or
through the use of third party rentals. The Loan Pool ensures that the agency‟s field
personnel have the tools and motor equipment necessary to perform the tasks at hand.
Prior to the development of this centralized office, agency equipment rentals were not
centrally captured, subsequently little historical data on the quantities and types of prior
rentals are accessible. Conversely, from Oct 1, 2011 through May 23, 2012 the FMD has
tracked and rented 108 pieces of equipment at a cost of approximately $290,000. It is
projected that BPA‟s annual rentals will exceed 160 assets at an estimated cost of
$600,000.
The goals of the FMD, through means of annual agreements, and more efficient use of
local assets, are to reduce the average price and annual cost of agency‟s rentals. Notable
success has materialized in the first eight months of this new organization with the
establishment of standardized rental agreements equating to approximately a 20% savings
with three major equipment providers.
BPA Fleet
Management
Department
[1 FTE]
Fleet Procurement,
Policy & Analysis
Division
(8 FTE)
Equipment and Tool
Loan Pool
Division
(5 FTE)
Mobile Equipment
Maintenance
Division
(North and South)
(17 and 21 FTE)
[17 and 21 FTE]

12
4.3 The Mobile Equipment Maintenance Division is responsible for the maintenance
and repairs of the agency‟s fleet assets and the engine generators. Split between a
Northern and a Southern group these technicians support the agency‟s operations by
managing outsourced activities, mobile and in-shop maintenance. Maintenance levels
range from basic lube and oil filter work, to major overhauls performed on chassis and
aerial equipment/cranes. These technicians are also responsible for providing subject
matter expertise related to GSA vehicle maintenance and vehicle up-fitting requirements,
as well as damage assessments. In addition to vehicle maintenance, these technicians
service the agency‟s 150 plus engine generators, some of which provide critical power
needs at remote sites, ensuring substation and communication network systems remain
operational year-round.
5. Age and Condition Assessment of BPA Owned Fleet
BPA‟s average fleet age ranges from approximately four to five years for owned pickups,
to approximately 15 years for the cranes, man-lifts and digger derricks. In comparison,
the average age of the aerial equipment supporting the utility industry is approximately
ten years. The average age of earthmoving and construction equipment is 10-15 years.
This has improved significantly with the recent updating of approximately half the fleet
of backhoes, material handlers and bull dozers that until now averaged 25-30 years. In
comparison, the average age for bulldozers and backhoes in the construction industry is
ten years or less. The trend appears to be that BPA assets are five years older than the
utilities and construction industries. As for BPA‟s fleet of trailers, these assets average
well over 20 years and in some cases over 40 years.
The graph below reflects the average age of BPA owned assets by class code excluding
102 utility terrain vehicles (UTVs) that were procured in 2010 in order to meet agency
field and safety requirements. The second graph illustrates the overall percent of BPA
owned assets that are within, vice those that exceed average life expectancy. The
remaining five charts are broken out by each class code and compare the current
equipment age against the average life expectancy by quantities.
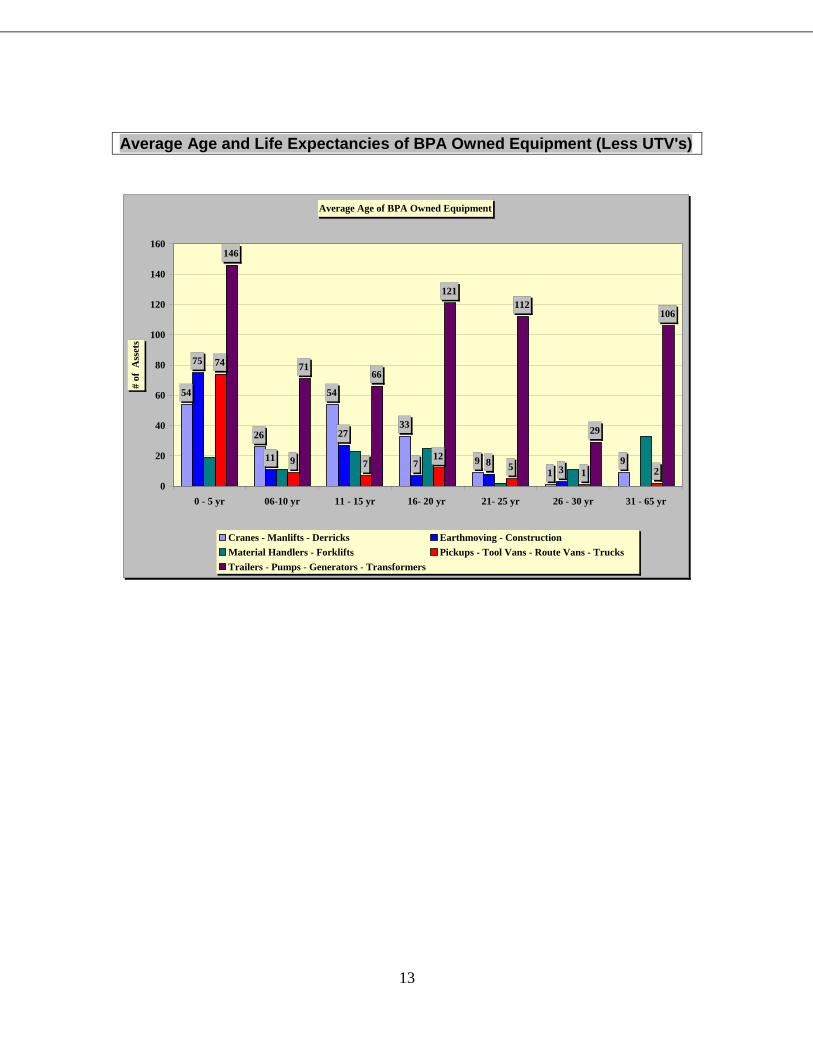
13
Average Age and Life Expectancies of BPA Owned Equipment (Less UTV's)
Average Age of BPA Owned Equipment
54
26
54
33
9
1
9
75
11
27
7 83
74
9 712
51 2
146
7166
121
112
29
106
0
20
40
60
80
100
120
140
160
0 - 5 yr 06-10 yr 11 - 15 yr 16- 20 yr 21- 25 yr 26 - 30 yr 31 - 65 yr
# o
f A
sset
s
Cranes - Manlifts - Derricks Earthmoving - Construction
Material Handlers - Forklifts Pickups - Tool Vans - Route Vans - Trucks
Trailers - Pumps - Generators - Transformers

14
72%
28%
86%
14%
43%
57%
82%
18%
62%
38%
0
0.1
0.2
0.3
0.4
0.5
0.6
0.7
0.8
0.9
Per
cen
tage
Cranes -
Manlifts -
Derricks
Earthmoving -
Construction
Material
Handlers -
Forklifts
Pickups - Tool
Vans - Route
Vans - Trucks
Trailers -
Pumps -
Generators -
Transformers
Asset Class Code
Percentage of BPA Owned Assets That Are Within vs. Exceed Average Life Expectancy
Within Average Life Expectancy
Exceeds Average Life Expectancy
Cranes - Manlifts - Derricks (Average Life Expectancy 14 Years)
Asset Age QUANTITY STATUS
00 -05 yr 54 Good - Within
06-10 yr 26 Good - Within
11 - 15 yr 54 Good - Within
16- 20 yr 33 Bad - Exceeds
21- 25 yr 9 Bad - Exceeds
26 - 30 yr 1 Bad - Exceeds
31 - 65 yr 9 Bad - Exceeds

15
Earthmoving - Construction (Average Life Expectancy 11 Years)
Asset Age QUANTITY STATUS
00 -05 yr 75 Good - Within
06-10 yr 11 Good - Within
11 - 15 yr 27 Good - Within
16- 20 yr 7 Bad - Exceeds
21- 25 yr 8 Bad - Exceeds
26 - 30 yr 3 Bad - Exceeds
31 - 65 yr 0 N/A
Material Handlers - Forklifts (Average Life Expectancy 12 Years)
Asset Age QUANTITY STATUS
00 -05 yr 19 Good - Within
06-10 yr 11 Good - Within
11 - 15 yr 23 Good - Within
16- 20 yr 25 Bad - Exceeds
21- 25 yr 2 Bad - Exceeds
26 - 30 yr 11 Bad - Exceeds
31 - 65 yr 33 Bad - Exceeds
16
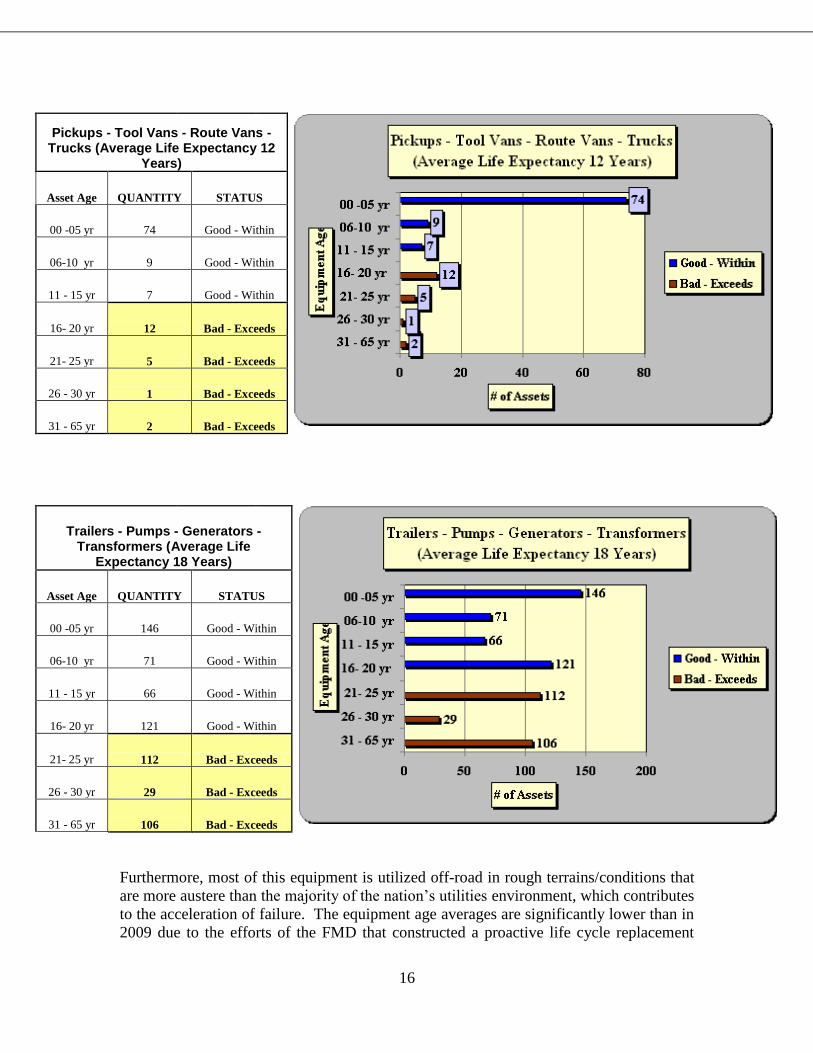
Pickups - Tool Vans - Route Vans - Trucks (Average Life Expectancy 12
Years)
Asset Age QUANTITY STATUS
00 -05 yr 74 Good - Within
06-10 yr 9 Good - Within
11 - 15 yr 7 Good - Within
16- 20 yr 12 Bad - Exceeds
21- 25 yr 5 Bad - Exceeds
26 - 30 yr 1 Bad - Exceeds
31 - 65 yr 2 Bad - Exceeds
Trailers - Pumps - Generators - Transformers (Average Life
Expectancy 18 Years)
Asset Age QUANTITY STATUS
00 -05 yr 146 Good - Within
06-10 yr 71 Good - Within
11 - 15 yr 66 Good - Within
16- 20 yr 121 Good - Within
21- 25 yr 112 Bad - Exceeds
26 - 30 yr 29 Bad - Exceeds
31 - 65 yr 106 Bad - Exceeds
Furthermore, most of this equipment is utilized off-road in rough terrains/conditions that
are more austere than the majority of the nation‟s utilities environment, which contributes
to the acceleration of failure. The equipment age averages are significantly lower than in
2009 due to the efforts of the FMD that constructed a proactive life cycle replacement

17
plan that differs significantly from the previously decentralized management structure
which was primarily based on the end-user‟s desires.
Consequently, this recent capital investment has increased the reliability of equipment
utilized by the crews in their daily/emergency work, and has reduced the risk of delayed
outage and/or negative impacts to daily work schedules. Fleet Management‟s objective is
to develop a long-term systematic procurement effort that is projected to stabilize the
procurement funding required to maintain an efficient and effective fleet. As the FMD
works toward a long-term systematic procurement plan, these efforts are expected to
level out the capital dollars necessary to maintain an updated and efficient fleet of
vehicles. This will enable the FMD to successfully forecast upcoming replacement costs,
while reducing maintenance costs long-term.
As stated above, in regards to BPA‟s owned assets, the FMD is working diligently to
develop and refine an effective vehicle replacement plan that is based upon functional
need and best cost/return, thereby optimizing the value of these assets. This life cycle
analysis and replacement plan is projected to be developed by 2014. However, it
continues to be a challenge due to the lack of accurate fleet management data, historically
inaccurate reporting, as well as an inefficient FMS which is unable to provide accurate
and easily retrievable maintenance trends and costs.
Although these constraints exist, it is apparent that numerous assets are either
approaching the end of their useful life, or have surpassed it. It is evident that the FMD
needs to determine what avenues to pursue, and the impact of these decisions. These
avenues are as follows: Is it more cost-effective to replace the assets? Continue to
operate and maintain an aging fleet? Or, dispose of and not replace under-utilized assets?
The outcome of these decisions will weigh upon their impacts to the agencies mission.
The criteria for earmarking an asset for replacement will be: is it unreliable for routine or
emergency response, difficult to operate due to lack of operator proficiency (caused by
equipment age and lack of standardization), or difficult to maintain due to obsolete parts
and a subsequent gap in employee skill-sets.
In order to develop and execute an effective fleet replacement plan, a key component is
the need for an extensive “right-sizing” analysis. Right-sizing is a management practice
that builds and maintains sustainable, fuel-efficient fleet by optimizing fleet size and
composition. As such, the FMD can minimize vehicle use, conserve fuel, save money
and ensure the proper equipment replacement.
There are three major components that have driven this need to right-size BPA‟s fleet.
One is the direction from the Secretary of Energy to reduce the Department of Energy‟s
fleet of over the road vehicles by 35%. Secondly, Executive Order 13514, “Federal
Leadership in Environmental, Energy, and Economic Performance,” which states to
establish an integrated strategy towards sustainability in the Federal Government and to
make reductions of green house gas emissions a priority for Federal agencies. And
thirdly and most importantly, are BPA‟s business goals, regulatory requirements and the
functional needs of the agency‟s maintenance crews.
18
The focus of this right-sizing initiative is two-fold. One is the development of vehicle
standards, ensuring that the limited number of agency vehicular assets are appropriately
allocated and out-fitted to support current and future business requirements of BPA.
Secondly, the assurance that vehicles meet the functional needs of the associated work
centers, while identifying reductions and reassignments of under-utilized assets.
5.1 BPA GSA Leased Fleet
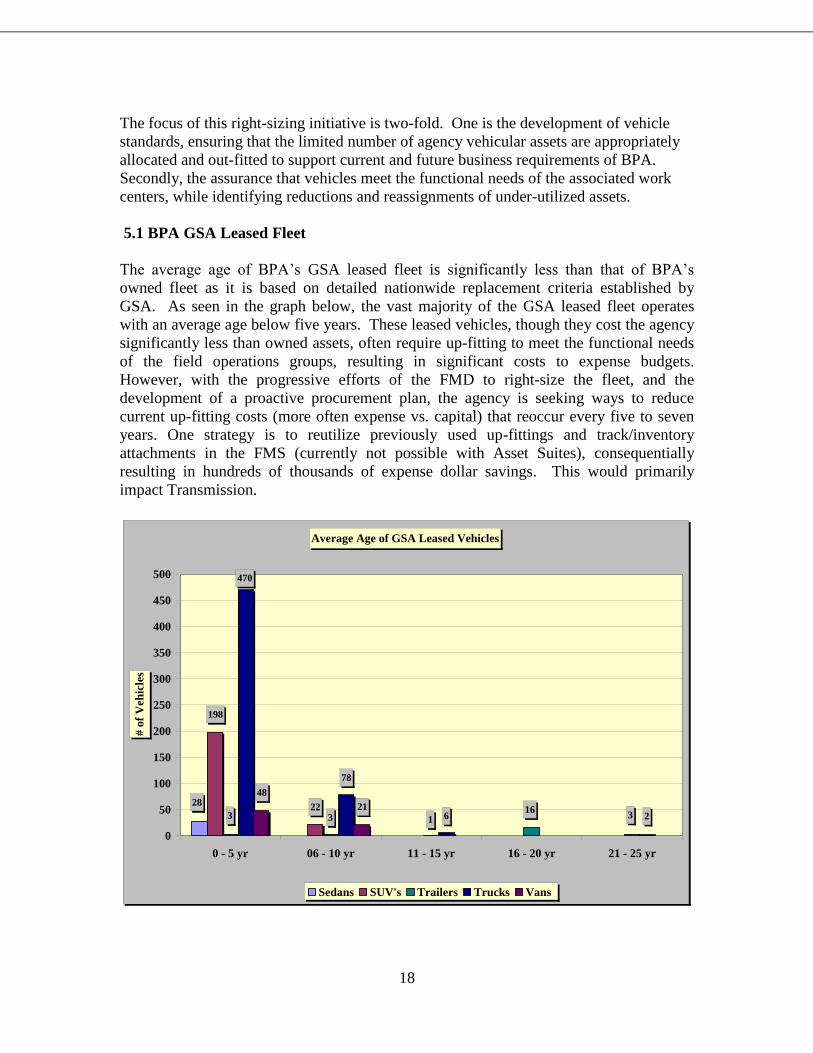
The average age of BPA‟s GSA leased fleet is significantly less than that of BPA‟s
owned fleet as it is based on detailed nationwide replacement criteria established by
GSA. As seen in the graph below, the vast majority of the GSA leased fleet operates
with an average age below five years. These leased vehicles, though they cost the agency
significantly less than owned assets, often require up-fitting to meet the functional needs
of the field operations groups, resulting in significant costs to expense budgets.
However, with the progressive efforts of the FMD to right-size the fleet, and the
development of a proactive procurement plan, the agency is seeking ways to reduce
current up-fitting costs (more often expense vs. capital) that reoccur every five to seven
years. One strategy is to reutilize previously used up-fittings and track/inventory
attachments in the FMS (currently not possible with Asset Suites), consequentially
resulting in hundreds of thousands of expense dollar savings. This would primarily
impact Transmission.
Average Age of GSA Leased Vehicles
470
2822
198
316
133 26
78
21
48
0
50
100
150
200
250
300
350
400
450
500
0 - 5 yr 06 - 10 yr 11 - 15 yr 16 - 20 yr 21 - 25 yr
# o
f V
ehic
les
Sedans SUV's Trailers Trucks Vans

19
5.2 Average Cost per Class Code for Over-The-Road Assets
The below table exhibits 2011 calendar year‟s average cost per mile/vehicle per class
code for over-the road for both BPA owned and GSA leased assets.
Class
Code Description Count
Cost
Per
Mile Cost Per Vehicle
3.2 Mid-Size Car 24 $0.31 $4,560.87
3.3 Full-Size Car 5 $0.44 $5,191.63
6 Compact Pickup 26 $0.50 $6,249.97
7 Light Duty Pickup 116 $0.51 $7,540.06
8 Medium Duty Pickup 46 $0.70 $9,809.34
9 Heavy Duty Pickup 93 $1.04 $13,926.32
10.1 Compact SUV 27 $0.52 $7,191.98
10.2 Mid-Size SUV 36 $0.65 $7,012.19
10.3 Full-Size SUV 112 $0.62 $8,418.21
11 Van - Passenger 45 $0.66 $4,685.87
11.1 Van - Mini Cargo 14 $8.23 $3,697.47
11.2 Van - Cargo 150 7 $0.79 $4,287.42
11.3 Van - Cargo 250 2 $0.52 $6,509.91
11.4 Van - Cargo 350 10 $1.48 $5,115.46
11.5 Van - Cargo 450 2 $4.68 $5,573.86
12 Van - Cube / Walk-in etc. 24 $2.98 $13,799.22
13.1 Dump - Single Axle
Truck
20 $3.43 $18,679.21
13.2 Dump - Tandem Axle
Truck
3 $3.56 $19,421.54
14.1 Light Duty Service Truck 137 $1.16 $14,954.84
14.2 Medium Duty Service
Truck
1 $13.80 $2,277.63

20
15 Stake Truck 60 $2.51 $13,201.75
16 Light Duty Aerial 52 $4.78 $14,807.23
17 Medium Duty Aerial 11 $3.06 $15,142.63
18 Heavy Duty Aerial 3 $7.38 $13,523.76
18.1 Super Heavy Duty Aerial 17 $16.75 $61,210.11
19 Digger Derrick 24 $12.22 $15,215.73
19.1 Super HD Diggers 17 $23.93 $54,668.69
20 Tankers 2 $15.77 $10,362.07
21 Semi-Tractor 12 $1.16 $31,793.75
22 Mobile Crane 19 $9.60 $21,073.07
99.1 Misc Vehicle 4 $7.43 $13,263.68
Total 971
6. Heavy Mobile Equipment Maintenance Facilities
In general, the newly formed FMD has a proactive maintenance program focused on fleet
asset preventive/corrective maintenance, as well as stationary engine generator repairs.
Work such as vehicle modifications, temporary workload spikes and overly complex
repairs are typically sent to vendors for maintenance support.
BPA‟s fleet mobile technicians operate out of 16 separate Heavy Mobile Equipment
Maintenance (HMEM) facilities with varied capabilities that either support basic
preventive and corrective maintenance tasks, as in the case of one-man shops; to major
overhauls, at Vancouver, Spokane and The Dalles maintenance headquarters. The
HMEM facilities are a mix of relatively new and capable facilities, to a number of
drastically inefficient and antiquated infrastructures that lack the production capability
required for today‟s larger, more complex, utility equipment. In some instances, it is
more efficient to perform vehicle maintenance external to the dedicated maintenance
facility utilizing the technician‟s service truck, rather than the antiquated and/or
inadequate facility.
The FCS study included an analysis of the capabilities and limitations of BPA HMEM
facilities. As illustrated in the graph below (Section 6.1), the majority of BPA‟s facilities
are below accepted industry standards and in some cases well below the threshold of
functional efficiency required to perform sound operations. Although the report truly
calls for the upgrade or replacement of a number of facilities, it specifically addresses the
need to “remodel the Ross facility, to accommodate major work and inspections on most
of the bucket trucks in the area.” This statement is founded on the belief that with the
mix of its centralized location, and the Portland/Vancouver metro areas strong vendor
support, the Ross facility upgrade will have the single biggest impact on an improved
mobile fleet equipment maintenance capability. Our internal functional assessments
concur with FCS findings.
6.1 Maintenance Infrastructure Functionality Ratings

21
The below graph reflects FCS‟s rating of BPA‟s maintenance facilities. Only five (six
since the completion of the new Bell HMEM facility in 2011) of the agencies 16
infrastructures meet their recommended functionality rating. Four facilities (shaded in
gray) have been identified as requiring immediate replacement or refurbishment.
The professional, yet subjective criterion, used to develop these ratings is designed to
allow a direct comparison of each BPA Fleet maintenance facility and includes but is not
limited to: size, condition, age, and the ability to meet current maintenance needs and
functionality.
The most obvious concerns were with facilities whose design and functional capability
were built around the agencies needs in the 1940s and 1950s. Deficiencies included
items such as the shops not having sufficient overhead crane capabilities, and inadequate
overhead height to deal with today‟s man-lifts, dump trucks, cranes, etc. Also,
rudimentary work-based efficiency items such as drive-through bays, overhead lube racks
and vehicle lifts are generally the exception versus the rule. Although great
The Bell facility replaced in
2011 would rate a 9-10.

22
improvements have been recognized over the last few years with newer facilities in Bell
(Spokane), Ellensburg and The Dalles, internal expertise as well as this third party
consultant review, have deemed facilities in Vancouver, Covington, Idaho Falls and
Grand Coulee to be at a minimum a hindrance to effective productivity, with the Ross
facility identified as the most critical. In addition, these reviews have found a number of
the agency‟s facilities lack the tools, training and systems necessary to fully perform the
task of heavy vehicle maintenance. To understand the varying types of maintenance BPA
equipment technicians must perform, the graph below depicts the complexity and
variance of jobs executed by the average HMEM facility.
2011 Work Hours
MO BILE ENGINE
GENERATO RS, 16.2, 1%
GSA TRAILERS, 0.2, 0%
O THER (Admin, O SHA
Inspections, Job
Planning/Briefings),
554.1, 33%
AIR CO MPRESSO RS &
CHIPPERS, 3.9, 0%CRANES & MANLIFTS,
326.6, 19%
BACKHO ES &
EXCAVATO RS, 79.6, 5%
STRINGING
EQ UIPMENT, 13.3, 1%SNO W VEHICLES, 66.4,
4%
TRAILERS, 155.4, 9%
GSA O VER THE RO AD
VEHICLES, 188.5, 11%
ENGINE GENERATO RS
& HO ISTS, 101.1, 6%
MISC. EQ UIPMENT, 34.3,
2%
O VER THE RO AD
VEHICLES, 73.5, 4%
FO RKLIFTS &
MATERIAL HANDLERS,
86.3, 5%
AIR CO MPRESSO RS & CHIPPERS
CRANES & MANLIFTS
BACKHO ES & EXCAVATO RS
ENGINE GENERATO RS & HO ISTS
MO BILE ENGINE GENERATO RS
FO RKLIFTS & MATERIAL
HANDLERS
MISC. EQ UIPMENT
O VER THE RO AD VEHICLES
SNO W VEHICLES
STRINGING EQ UIPMENT
TRAILERS
GSA O VER THE RO AD VEHICLES
GSA TRAILERS
O THER (Admin, O SHA Inspections,
Job Planning/Briefings)
Looking ahead, BPA‟s Fleet Management strategy regarding facilities and tools is to
identify core maintenance responsibilities for the agency‟s mechanics and develop a
prioritized focus on tool shortfalls, as well as facility needs. BPA Fleet Management is
working with Facility Asset Management to develop and execute a feasibility study on a
new Ross HMEM facility, as well as the design of the soon to be built Pasco
Maintenance facility. Subsequent to that, an analysis to BPA‟s maintenance facility
needs regarding quantity and location will be conducted to identify whether to
recommend to Facility Asset Management the need to upgrade the Covington, Idaho
Falls and Grand Coulee locations (and others), or to purse other alternatives for either
facilities or vehicle maintenance
In regards to tools that are used in these facilities, an analysis of shortfalls and capability
gaps have been conducted and Fleet Management has taken aggressive steps to ensure
each shop has the tools required to perform their function. In addition, progress has been
made on the development of a sustainable tool replacement program that ensures shop
tools at all 16 locations are being replaced when no longer functional.
6.2 Maintenance Capabilities and Priorities

23
BPA‟s HMEMs are comprised of 35 (Government and contractor) highly experienced
technicians who until recently lacked a systematic focus on technician training,
maintenance priorities, maintenance practices and desired efforts. The newly formed
FMD is equipped to identify what maintenance tasks should be performed by BPA
technicians, and in general what work should be contracted out to third party vendors.
This committed focus will successively provide a transparent path for technician training,
manpower decisions and workload.
Historically, BPA has contracted out over $500,000 of preventive and corrective
maintenance with each contracting decision being made at the discretion of the local
mechanic. Discretion factors included the local mechanic‟s comfort level with the work
to be performed, workload schedule, personal preference and lack of coordination
between HMEM facilities, vice being evaluated upon a systematic analysis of the
agency‟s workload and available resources.
Due to limited data availability, it is believed that the general trend of maintenance work
being outsourced was major overhauls, acoustic type inspections for aerial equipment,
and workload backlogs. Historically, maintenance performed on up-fittings/modifications
of new GSA assets, remote site emergency generators, on-site electrical crew support and
minor preventive maintenance (PM) work were performed by internal resources vice
vendors.
With renewed emphasis on improved workload scheduling, and the leveraging of the
entire cadre of mechanics into one group of HMEM technicians, BPA‟s FMD now has
the improved visibility of system wide maintenance requirements as well as the flexibility
to move technicians to where the workload is independent of their duty station. These
efforts will improve system reliability through a reduction of past due/overdue
maintenance, furthermore, reducing costs related to outsourcing preventive and corrective
maintenance. In the future, the use of vendors should only be considered when
unforeseeable workload surges occur and vehicle modifications/specialized maintenance
needs are well outside the technical scope of the technicians, such as acoustic inspections.
Below is the average workload breakdown of BPA‟s technicians with the “Other”
category accounting for employee breaks, job briefings and other tasks that were difficult
to breakout due to previous data capturing practices.

24
2011 Mechanic Work Hours
BPA EQ Hours,
1145.2, 61%
Other
Admin/Travel/
Standby, 554.1,
29%
GSA EQ Hours,
188.68, 10%
BPA EQ Hours
GSA EQ Hours
Other Admin/Travel/Standby
As can be seen in the graph above, BPA technicians spend approximately 1334 hours a
year, or just under 70% of their time, performing work directly attributed to mobile
equipment, as well as engine generators. The remaining 30% of their time was executing
the “other” tasks required to do their jobs. As provided through recent benchmarking
efforts, BPA technicians‟ direct work compares to the utility industries estimated average
of 1382 hours.
7. Key Fleet Management Department Accomplishments
The KEMA and FCS studies concluded that there were significant opportunities to
improve BPA fleet management operations. Thus far, a number of moves have been
made to lay the foundation for a BPA FMD built on industry best practices and the ability
to capitalize on these opportunities.
Effective October 1, 2011, BPA‟s Fleet Operations (that include Procurement, Analysis,
Licensing, Maintenance, Rentals and Loan Pool operations) was consolidated into a
centralized department focused on managing fleet personnel and equipment as systematic
assets. Lead by the Fleet Manager, the FMD, oversees vehicle maintenance and
technicians, Loan Pool, as well as management/administrative staff throughout the
agency‟s service region. The maintenance group works, in unison with the eight
administrative staff, to manage the procurement of owned/leased equipment, ensure
regulatory compliance, administer data needs and conduct the mandatory/discretionary
reporting requirements of the agency. Additionally, there are five personnel who support
the agency‟s temporary equipment requests through internal asset availability, or through
third party rentals.
BPA‟s new FMD has commenced to standardize vehicle maintenance practice/priorities,
in conjunction with launching/developing equipment life cycle analysis and utilization
parameters. Over the last year and a half, the FMD has captured some of the data
necessary to construct an analysis of usage trends, rental requests, opportunities for right-
sizing, and vehicle sharing, in conjunction with the development of vehicle platforms
capable of multiple functions. Through these basic levels of effort in 2010 and 2011,
FMD has been able to realize positive financial results with fleet right-sizing savings of

25
over $200,000 in annual operational costs (expense), and approximately $3 million in
avoided vehicle capital replacements.
In addition to recent improvements in the organizational structure and asset management
of BPA‟s mobile equipment fleet, the agency has made significant investments in the
upgrading of its fleet assets. In 2010, BPA spent $8.2 million to purchase 153 vehicles/
equipment; and in 2011, another $8.6 million was obligated to procure 72 more assets. In
2012, BPA spent an additional $5.2 million purchasing 67 mobile equipment assets. This
is a vast transformation, when compared to the previous four to five years when BPA
annually spent roughly $2-4 million to procure approximately 25-35 vehicles/equipment.
This previous practice produced an aging fleet, descending into technical obsolescence.
Recent procurement efforts have been geared towards the replacement of aging and
antiquated aerial devices ranging from small manlifts, digger derricks and heavy cranes
to transportation tractors and line stringing equipment. The substantial investments over
the past three years, coupled with the planned procurement expenditures for 2013-2015,
will transition BPA‟s fleet out of a backlogged replacement cycle for aging and obsolete
equipment, to a significantly improved operationally efficient, effective and reliable one.
These new assets will result in reduced operational costs when considering the full life-
cycle cost of ownership and operations. Furthermore, the new assets should significantly
reduce the Green House Gas emissions/Carbon footprint, thereby facilitating BPA‟s
ability to achieve targeted governmentally directed compliance goals.
These advancements allow for further concentration to be placed on vehicle technician
training, diagnostic equipment upgrades, and tool purchases as the FMD works toward
standardizing its fleet. Moreover, it will eliminate the skill-level and technology gap that
exists today between our 1970s, „80s and „90s vintage vehicles when compared to the
improvements that have occurred in equipment technology over the last 20 plus years.

26
Average Equipment Age
(2009 to Present)
16
25 25
11.5
15
19
0
5
10
15
20
25
30
Aerial Power Operated Trailers
Equipment Type
Yea
rs (
Ag
e)
2009
2012
As previously discussed, BPA‟s FMD has recently made significant efforts to improve
the material condition of the agency‟s Fleet/Mobile Equipment assets. In the last two
years, BPA has replaced a significant number of legacy vehicles in excess of 20-30 years
in age, in poor condition and cost prohibited to operate/maintain. BPA‟s efforts to
improve the agency‟s mobile equipment capability and reliability have reduced the
average age of the aerial equipment, cranes and trucks; and approximately 150 vehicles,
from an average age of 16 years old to 11.5 years. These efforts have also reduced the
average age of power operated equipment (dozers, backhoes, snow cats, skid steer
loaders, etc.) from 25 to 15 years old and trailers down to 19 years old from an estimated
average of 25 years. In comparison, utility industry averages for aerial equipment are
approximately 7.5 years, approximately 11 years for power operated equipment and
around 15 years for trailers. This does not take into account approximately 900 BPA‟s
GSA leased vehicles that average a younger age of roughly three to four years due to
GSA‟s robust lease rotation cycle.

27
11.5
1519
7.511
15
0
5
10
15
20
Yea
rs
Aerial Power O P Trailers
Industry
BPA
2012
BPA vs. Industry Standards
The expectation of the newly centralized FMD is to develop standards, as well as life
cycle analysis, that will enhance managing the fleet based upon asset management
principles, and treating the agency‟s fleet as a “Systematic Asset,” vice over 2,000
individual items. This will entail identifying optimum replacement windows for
equipment based on operational and maintenance costs, working with end-user groups to
develop vehicle standards to maximize the efficient use of existing assets, capitalize on
the usage of the current fleet inventory and right-sizing where feasible. This asset
management approach will launch the creation of a leaner, safer, more cost-effective and
efficient fleet of vehicles and mobile equipment.
8. Risk Management
There are numerous risks that impact the implementation of the Fleet Asset Management
Strategy. These management risks center around BPA‟s aging fleet, increased operational
timelines/maintenance costs realized, antiquated facilities and/or tools, inapt Fleet
Management Software system, limited access to short-term rentals and long-term leases
or purchases, inconsistency of vehicle maintenance and process standardization, lack of
adequate staffing, limited funding allocated for procurement plan, right-sizing issues and
the ability to meet Government mandates of Green House Gas (GHG) emission and fossil
fuel reductions.
All these risks will be identified, to include the source of each the risk, elements of the
risk, and consequences/likelihood of the risk and recommendations for mitigating these
issues:
o Inapt Fleet Management Software System

28
Risk Identification: There is a risk that data management system
requirements may not be met by current enterprise system.
Source of Risk: Asset Suite is an inapt Fleet Management Software
System that limits FMD‟s ability to properly manage and maintain its
fleet.
Elements of Risk: This software system impedes FMD‟s ability to
fully capture current and historical data used to monitor the lifecycle
of a vehicle, and establish guidelines for its maintenance and
utilization. Additionally, there are no restricted security mechanisms
in place to limit user access.
Consequences: If Asset Suite Fleet Management continues to be the
software of choice, then cost-effective and efficient fleet management
operations will remain challenging.
Likelihood: This circumstance is recognized now and contributes to
sketchy present and limited historical data critical for a functional
FMD to operate.
Mitigation: Rectifying this problem will entail funding be set aside to
either replace current fleet software, or annually procuring system
upgrades as new reporting requirements and missions evolve over the
years. A good FMS is essential and the most efficient way to maintain
fleet records so information can be routinely analyzed and delivered to
meet any reporting requirement in a timely manner. However, the
FMD is unable to be more efficient with Asset Suite due to the huge
risks associated with its reporting accuracy and capabilities.
o BPA’s Aging Fleet
Risk Identification: There is a risk of not meeting agency‟s mission
and needs of its customers in a timely manner.
Source of Risk: BPA‟s fleet is over age in many categories, resulting
in frequent breakdowns, excessive repairs, and increased costs that
could delay scheduled and/or unscheduled work requests.
Elements of Risk: The lack of reliable assets and frequent
breakdowns, due to aging assets, directly contribute to the agency‟s
field electric crews (as well as its support group) inability to ensure the
transmission of safe and reliable power to its customer base.
29
Consequences: Response time to a line outage for BPA customers is
delayed significantly due to the unexpected breakdown of a BPA asset.
Likelihood: The potential for this scenario to occur is inevitable. As
BPA‟s fleet continues to age, the likelihood of increased breakdowns
will contribute to further delays and lengthy power outages.
Mitigation: To lessen or eliminate this risk is to develop an
empirically validated vehicle replacement cycle with a sound 15 year
procurement plan, by means of a three year budgeted procurement
cycle, that identifies critical priority assets that have the most impact to
the agency‟s mission, and begin to renew the fleet.
o Increased Operational Timelines and Maintenance Costs Realized
Risk Identification: There is a risk of significant increases to
operational timelines and increased maintenance costs.
Source of Risk: The FMD is operating with over-aged and inefficient
assets that have exceeded their useful life.
Elements of Risk: This deficiency contributes to substantial
operational, fuel and maintenance costs in an effort to continue to
maintain this aging fleet, where in some instances parts required are
obsolete.
Consequences: Asset availability and maintenance downtime will
continue to increase, as well as operational and rental costs, which
directly impact the agency mission capability.
Likelihood: The probability of this risk is already apparent and is
continuing to hinder Fleet Management‟s ability to provide reliable,
fuel-efficient, assets to its customers and field crews.
Mitigation: Eradicating this known risk is as stated previously, to
construct a sound 15 year procurement plan, with three year funded
procurement cycle plan, that identifies critical priority assets that have
the most impact to the agency‟s mission, and begin to renew the fleet
thereby reducing operational, rental, fuel and maintenance costs. This
will enable the FMD to provide reliable, fuel-efficient assets at a
reduced rental rates.
o Antiquated Facilities and/or Tools
Risk Identification: There is a risk of inhibiting the timely completion
of equipment maintenance as well as increased costs, either through

30
labor hours or through vendor maintenance requirements.
Source of Risk: Mobile equipment maintenance is being performed
in numerous antiquated facilities, with inadequate tools that contribute
to some vendor repairs. These deficiencies include insufficient facility
size, roof heights, tools, overhead cranes, layouts, etc.
Element of Risk: These defects obstruct the FMDs ability to transition
towards a more modernized operation founded on both industry and
mobile equipment maintenance best practices.
Consequences: If funding is not provided to improve mobile
equipment maintenance infrastructures and updating of tools, the
issues identified under “Risk Identification,” will remain status quo.
Likelihood: The odds of this risk already exist and have been
documented by an independent study performed by FCS.
Mitigation: Eliminating this risk will not be an effortless task.
Funding availability will be the key component in order to raise BPA
HMEM facilities to accepted industry standards, which subsequently
will reduce all associated maintenance cost.
o Limited Access to Short-Term Rentals and Long-Term Leases or Purchases
Risk Identification: There is a risk of not having the means to acquire
equipment either by short-term rentals, long-term leases or immediate
purchases to support BPA‟s Transmission department‟s daily crew
work or when major damage/unforeseen repairs transpire.
Source of Risk: Limited loan pool assets, the absence of pre-existing
vehicle/equipment contracts, a shortage of local outside sources and
inadequate procurement funds are all key components contributing to
the struggles faced by the FMD to supply BPA‟s Transmission crew
the vehicles/equipment required to support their mission, as well as all
BPA customers.
Elements of Risk: The limitations addressed under “Source of Risk,”
section impedes the FMD‟s ability to expeditiously provide desired
replacement assets when major equipment damage occurs resulting in
extensive downtime or unanticipated repairs emerge.
Consequences: If these major concerns are not remedied, it affects
BPA‟s Transmission department‟s ability to perform scheduled and
unscheduled work.

31
Likelihood: The chance of a work stoppage occurring due to the lack
of alternative means of acquiring assets is plausible.
Mitigation: Resolving this predicament will necessitate the need to
right-size the loan pool, draft concrete vehicle/equipment contracts
with vendors that are in the best interest of BPA, and budget
appropriately for procurement to support these unforeseen
contingencies. The FMD will be setup to rent, but historical data will
primarily dictate owned assets. At this time, the limited availability of
local outside sources is beyond our control, but shall be researched
further.
o Inconsistency of Vehicle Maintenance and Process Standardization
Risk Identification: There is a risk of inconsistency in vehicle
maintenance, process standardization, and fleet technician skill-sets,
which collectively have a profound impact on vehicle maintenance.
Source of Risk: Conflicting maintenance practices and procedures
throughout 16 maintenance facilities, the lack of established vehicle
maintenance processes, non-existent Standard Operating Procedures
(SOPs), and historically meager technical training result in
maintenance repair not being performed, and/or not getting done
correctly which contribute to excessive vendor use, rework and
additional downtime.
.
Elements of Risk: These disparities lack a systemic focus on
maintenance priorities, procedures, practices and the desired
concentration of effort which leads to poor maintenance planning,
equipment failure, delayed turn around time and possible harm to
employees or property.
Consequences: These inconsistencies of the 16 maintenance facilities,
the absence of SOPs, limited technical training and the de-centralized
organizational structure will foster this cycle of discrepancies resulting
in additional costs for BPA and disgruntle customers.
Likelihood: This risk is transient due to the recent formation of the
centralized FMD whom is tasked to correct these issues.
Mitigation: With the inception of the newly established FMD and the
centralization of these facilities, this risk is in the process of being
resolved. The FMD emphasis is to standardize maintenance
practices/procedures and develop SOPs that clearly identify
performance processes to improve visibility of system wide
maintenance needs, in tandem with the flexibility of relocating
32
maintenance technicians where workload dictates. Furthermore, the
FMD will pilot a robust training plan that will provide BPA‟s
technician‟s the skill-sets necessary to effectively and efficiently
perform work on the agencies varied fleet assets. These efforts will
enhance system reliability through a reduction in past due and/overdue
maintenance, as well as reduce overall maintenance costs, limit vendor
usage and please FMD customers.
o Lack of Adequate Staffing
Risk Identification: There is a risk of not achieving the milestones of
FMD Strategy Plan due to the lack of dedicated resources for leading
implementation charters and steering change based results. Staffing
requirements and skill-sets now may differ once the FMD is well
established.
Source of Risk: Undefined FMD organizational staffing requirements
for the short and long term are the consequence of a newly established
organization still in the process of structuring its business and
determining the appropriate staffing level, combined with resource
funding restraints and the required skill-sets that could obstruct some
performance indictor goals of the strategic plan
Elements of Risk: These predicaments place restraints on the FMD in
its ability to fully execute an efficient and effective FMD Strategy Plan
when adequate staffing level requirements are not yet determined,
desired skill-set resources and additional funding for current/future
staffing levels are unknown.
Consequences: If staffing and skilled resources are not defined for
the short/long term and billet funding is not pre-determined, the FMD
Strategy Plan will struggle to achieve all its intended milestones.
Likelihood: The prospect of this risk materializing is favorable if
these issues are not addressed promptly.
Mitigation: Remedying the potential for failure in certain phases of
the FMD Strategy Plan can be achieved by conducting a staffing study
to determine appropriate level of personnel required (short and long
term), performing desk audits on each position, and identifying
candidates with the desired skill-sets. Foremost, compile and
document all phases of these processes to justify to management that
funding for additional billets, if required, is advantageous to the
success of all phases of the FMD Strategy Plan.
o Right-Sizing Issues

33
Risk Identification: There is a risk of not possessing the appropriate
standardization, configurations and size of fleet assets to meet the
compilation of tasks being accomplished on a regular basis.
Source of Risk: The lack of a comprehensive transportation review
with all end-users to fully understand their mission and properly
identify vehicle/equipment requirements. And, the dilemmas of
investigating ways to address vehicle shortfalls and fleet downsizing
that achieve a transformation of behavior within the organization.
Elements of Risk: These issues impede the FMD from optimizing its
assets for building and maintaining a sustainable, fuel-efficient fleet.
The retention of aged assets, specialized units that are rarely utilized
and improper assets assignments all contribute to inefficient operating
practices, increased maintenance and fuel costs, in conjunction with
the inability to meet Governmental alternative fuel mandates.
Consequences: If an across-the-board transportation review is not
performed, along with the concurrence of all participants buying into
the recommended changes, the attempt to right-size the fleet will not
evolve.
Likelihood: The possibility of right-sizing failure is depended upon
the methods of choice used to determine data collection for changing
fleet makeup. If a comprehensive transportation review is performed
the likelihood of an ideal fleet is achievable.
Mitigation: Right-sizing must be a fact-based, rational and defensible
to all parties. This process involves analyzing and understanding the
collection of tasks that the agency needs the fleet to accomplish.
Conducting a thorough transportation review, with concurrence from
all customers/in-house personnel, will mitigate right-sizing efforts.
This review should account for the daily needs of the agency‟s
personnel and mission and should also drive the replacement or
disposal of assets that are technologically obsolete, have un-
necessarily low utilization or can be more effectively sourced through
third party rentals. The benefits of vehicle and fleet right-sizing
include: more efficient operating practices, standardization, reduced
fuel consumption and operating costs, and freed up expense and
capital.
o Meeting Government Mandates of GHG Emission Reductions and Fossil
Fuel Reductions

34
Risk Identification: There is a risk in the ability to meet federal
regulations, to include EO 13514 mandating GHG emission and fossil
fuel reductions.
Source of Risk: With the absence of a sound right-sizing plan, a
strategic emission/fossil fuel reduction plan and limited AFV
infrastructures, the GHG target and fossil fuel reductions may not be
realized. This could require the FMD to weigh the potential impact on
BPA‟s missions, considering available technology and the timeframe
needed for complying. Conflicting priorities may emerge in
implementing the goals of the new executive order.
Elements of Risk: These setbacks inhibit the FMD in meeting EO
13514 requiring federal agencies to set GHG emissions reduction
targets, increase energy efficiency, and reduce fleet petroleum
consumption 30% by 2020.
Consequences: If a right-sizing, GHG emission/fossil fuel reduction
plan is not implemented, then all efforts in meeting federal regulations
and EO 13514 are unattainable.
Likelihood: Portions of this risk are unlikely to materialize. The FMD
has taken action to specifically address the right-sizing issue and EO
13514 by developing a plan of action. Recently, the FMD has
modernized some of its older fleet, thereby, reducing GHG emissions
and petroleum usage. However, the availability of AFV infrastructures
will continue to be an issue.
Mitigation: Right-sizing the fleet and a strategic strategy for meeting
EO 13514 must be executed. Fleet right-sizing will reduce the amount
of capital investment in vehicles and lowered GHG emissions.
Alternative fuel and fuel-efficient advanced vehicles will reduce
petroleum use and can be economical options for the FMD. Cost
savings from vehicle maintenance, operations, and fuel use typically
offset higher purchase prices.
9. Prioritization of Repairs/Refurbishment vs. Replacement
Life cycle costing plays a huge role when determining whether to maintain and repair or
to replace an asset. Seldom is it more economical to replace an asset prior to its life
expectancy unless it has failed or additional capacity or capability is requirement. In
general, it is more economical to maintain and repair an asset in order to extend the life
cycle were feasible. The criteria listed below are designed to facilitate sound repair
versus replace decisions.
It is BPA‟s policy that assets be considered for replacement when:
35
o An asset is near or beyond its expected life;
o The asset reliability and the consequences of failure poses an unacceptable risk;
o The repair/refurbishment costs exceed the life cycle cost of an asset replacement;
o The asset‟s performance has been unacceptable and corrective maintenance
measures will not lead to acceptable performance;
o Additional asset capability is required and the replacement equipment provides
that additional capability while improving operations, reducing costs, and making
it easier to maintain;
o The existing equipment is technologically obsolete, spare parts are expensive or
hard to get, and skill requirements to properly repair and maintain are difficult to
find;
o The existing equipment poses an unacceptable security risk, health and safety
risk, or environmental risk and the cost to mitigate the risk exceeds the asset life
cycle replacement cost.
Due to limitations associated with BPA‟s informational resources and FMS shortfalls,
priority repair/refurbish vs. replacement management decisions are based upon the
following estimates: cost information, age, estimates on efficiency gained with new
equipment, ease of maintenance, parts availability, and anticipated future maintenance
costs. In general, the majority of equipment replaced over the last two years and planned
for the next several years have exceeded optimal life cycle for reliable and cost-effective
operations. Efforts are underway to justify the need for improving the fleet management
tracking system, develop utilization standards, benchmark with like utilities (through
nationally recognized organizations such as Utilimarc), and build the capability to
execute a robust vehicle life cycle analysis.
9.1 Prioritization of Capital Replacements
As for prioritization of capital replacements, the FMD usually places the first priority on
those operational assets necessary to maintain system reliability and maintenance, or
equipment required for regulatory compliance. Difficult to rent items such as manlifts,
digger derricks and cranes get first priority, followed by other mission essential items
such as tool vans and line stringing equipment that are needed to maintain the systems
operating during normal time, in addition to emergencies.
The second capital replacement priority is on assets essential for operational support
functions such as Fleet Management, Transportation, Transmission Engineering,
Facilities Management, etc. Introduction of decisions that pertain to new capability to the
FMD fleet are vetted through BPA‟s Fleet Council for review and approval to ensure
agency fleet assets only increase due to changes in mission or agency direction.

36
9.2 Fleet Capital Replacement Costs
The fleet budget is comprised of capital for equipment replacements and operations
support, as well as expense dollars for maintaining/operating and supporting fleet assets
needs. In regards to capital replacement, recent FMD efforts are keenly focused on
updating BPA‟s fleet to approach utility industry standards which have evaluated
lifecycles and costs. Through these efforts, combined with the introduction of a fleet-
wide life cycle analysis capability, the FMD foresees a reduction in annual capital
expenditures for vehicle replacement. The projected end results are the stabilization of
expenditures/ replacement, in concert with an evenly distributed replacement program for
the long-term.
For the first time these numbers will account for the sizeable costs of up-fitting both the
line patrol and mobile technician vehicles that were previously charged to the
Transmission Field District expense budgets with vast variances in dollars and capability
between locations. The efforts of the FMD are expected to reduce overall agency wide
fleet costs by hundreds of thousands of dollars associated with these vehicles though
standardizing costs, ensuring multiple usage of the equipment being installed and
managing the installation process.
2013-2022 Fleet Capital Replacement Plan
FY 13 FY 14 FY 15 FY 16 FY 17 FY 18 FY 19 FY 20 FY 21 FY 22
Capital
funds $7.5M $5.5M $5.5M $6.0M $6.2M $6.7M $7.2M $7.5M $8.0M $8.2M
# units 64 45 52 47 55 46 55 43 57 60
The fleet replacement forecast, and associated capital cost estimates, are based upon
actual costs to replace aerial and boom equipment prior to the third major overhaul (D-
Service). Other equipment replacements are based upon estimated end-of-life decisions
determined by age and obsolescence. As the centralized FMD matures and proceeds with
the implementation of new vehicle and maintenance standard processes, a more
comprehensive, transparent and robust vehicle replacement/acquisition plan will emerge.
9.3 Other Capital Costs
Other Capital is defined as operational costs, primarily travel, labor and vehicle use rate
charges that are incurred by the Loan Pool support personnel and vehicle
technicians/mechanics while supporting specific capital projects not associated with a
specific vehicle, i.e. supporting a TLM crew on a wood replacement project.
FY 13 FY 14 FY 15 FY 16 FY 17 FY 18 FY 19 FY 20 FY 21 FY 22
Other $1.2M $1.3M $1.4M $1.5M $1.6M $1.7M $1.8M $1.9M $2.0M $2.1M

37
Capital
9.4 Fleet Management Expense Forecast
Assumptions in Fleet Management Expense forecast: Fleet operational costs that are
primarily expensed are budgeted for $9.2 million in FY 2013. The budget includes costs
for personnel, travel and training costs for 52 employees (42 BFTE and 10 CFTE), the
management of the equipment and Tool Loan Pools, as well as the functional costs
associated with vehicle maintenance.
2013-2022 Fleet management - Expense
FY 13 FY 14 FY 15 FY 16 FY 17 FY 18 FY 19 FY 20 FY 21 FY 22 Loan Pool $1.7M $1.8M $1.85M $1.85M $1.85M $1.9M $1.9M $1.95M $1.95M $1.95M Vehicle Maintenance $6.8M $7.3M $7.45M $7.6M $7.75M $7.9M $8.1M $8.25M $8.4M $8.55M Procurement,
Policy, Analysis $0.7M $0.75M $0.8M $0.8M $0.85M $0.9M $0.95M $1.0M $1.0M $1.5M TOTAL $9.2M $9.85M $10.1M $10.25M $10.45M $10.7M $10.95M $11.25M $11.35M $12M
Assumptions employed to develop capital and expense cost forecast were based on
historical experience and anticipated savings attained through the centralization of fleet
operations. The expenses associated with vehicle maintenance include major overhaul
services (D-services) of the agency‟s aerial and boom equipment. Cost to perform these
overhauls are highly variable (estimated range of $100-$200K) due to limited historical
data. It is anticipated that D-Service costs will increase substantially from $250k in 2012
to an estimated $600k in FY 14-15. However, D-Service costs are projected to decrease
to a steady-state of approximately $300K annually (adjusted for inflation) until 2020
when it is likely to increase, yet again, due to the volume of assets entering the D-Service
window. However, efforts are underway to level these out and improve forecasting these
costs.
These cost estimates do not capture GSA lease and fuel costs associated with assets that
are not assigned to the FMD. These costs are captured in monthly charges and use rates
collected from the user group‟s individual department budget.
10. Alternative Strategies/Scenarios Considered and Business Model Strategy
Chosen
To determine the best avenue for managing BPA‟s fleet assets long-term, three
alternatives were examined with one being adopted: 1) Status Quo; 2) Outsourcing of
Fleet Operation; and 3) Centralize Fleet Operations.
The Status Quo alternative was to remain a decentralize fleet with no uniformity. As a
result of two recent independent studies conducted by KEMA and FCS, it was quite
apparent that BPA‟s fleet management practices were flawed and not in compliance with
industry best practices. Moreover, internally, it was evident that BPA‟s fleet was being
replaced in an improvised manner not taking into consideration analysis of operational

38
needs, coupled with lack of focus on life cycle analysis or current/future maintenance
capabilities. Subsequent to some preliminary analysis, it was deemed that if Fleet
Management continued these methods of management practices, the consequences would
impact negatively on BPA policy and regulatory compliance, equipment reliability and
financial efficiency. Therefore, in the best interest of BPA mission, and its fleet, this
alternative was not chosen.
The second alternative was to outsource the entire BPA Fleet function. The risk of
turning over fleet management to a third party was a real concern, and the question of
“Will the transportation business still meet BPA‟s productivity and quality goals,” was
uncertain. Though these issues were valid, two contributing factors to eliminate this
alternative was the A-76 study that concluded the agency should retain the maintenance
function in-house, and outsourcing BPA fleet function would cost approximately $1
million more annually than retaining the entire transportation function in-house.
Another factor was that the internally resourced transportation model generally tends to
be more efficient and reliable. Nonetheless, the major component for eliminating this
alternative was the notion that if Fleet Management was managed efficiently and
effectively focusing efforts on performing core work, then BPA technicians would be
more cost-effective and responsive. Though, BPA technician‟s hourly wages are at the
upper end, compared to other corporations, this is quickly offset by benefits loading and
corporate profit margins. It takes subject matter expertise and unique skill-sets which
demands competitive wages, in order to maintain equipment ranging from stationary
engine generators to bulldozers and man-lifts.
These technical skill-sets and subject matter expertise, as highlighted by FCS study, are
diminishing commercially due to retirements. And, the current industry trend is to retain
heavy equipment maintenance in-house. Finally, the increased reliability afforded with
internally managed and systematically focused technicians reduces the agency‟s risks
associated with downtime of equipment thereby outsourcing the transportation function
was rejected.
The third and chosen BPA business model alternative was to retain in-house
transportation functions by centralizing fleet operations. This alternative was adopted and
deemed to be more efficient than a decentralized approach and consistent with industry
best practice.
10.1 Key Factors that Showcase the Chosen BPA Business Model
A few key success factors that are believed to showcase this centralized BPA business
model and have proven to be successful are: reduction in vehicle modification costs;
reductions in corrective maintenance actions and costs; and a by-asset life cycle analysis
that predicts vehicle replacement years in advance and reduces vehicle downtime as
technicians become more knowledgeable and trained in the variable equipment types
BPA operates.

39
Based upon recent benchmarking efforts, BPA FMD believes that the accepted
centralized fleet management BPA business model will reduce total agency fleet costs
associated with GSA leases, contracted maintenance, fleet right-sizing, fuel use
reductions, and other efficiency measures resulting in a savings of approximately $1
million in annual expense, as well as capital savings.
10.2 FMDs Asset Strategies
Below is a synopsis of the FMDs asset strategies that have been addressed and elaborated
on in Sections Two and Eight of this strategic plan:
Develop an pragmatic validated vehicle replacement cycle with a sound 15 year
procurement plan, by means of a three year budgeted procurement cycle;
Right-size through a systematic analysis in conjunction with reducing fossil fuel;
Establish policy on the types of equipment that should be agency-owned versus
locally rented;
Focus on preventive/predictive maintenance;
Develop and implement a professional training and certification program;
Standardize to reduce acquisition, maintenance and inventory costs;
Develop competency to prepare an asset life cycle;
Improve tracking and reporting of expenditures;
Enhance data quality associated with vehicle cost and maintenance;
Improve capabilities for emergency response through implementation of a
planned maintenance strategy;
Enhance internal and external reporting capability;
Foster business driven decisions using analytics and metrics, measured against
risk;
Achieve funding to raise BPA HMEM facilities to accepted industry standards;
Attain funding for a new FMS;
Limit access to short-term rentals and long-term leases/purchases;
Standardize maintenance practices/procedures and develop SOPs;
Conduct staffing study;
Strive to meet Government mandates of GHG emission/fossil fuel reductions
without comprising our customers and BPA‟s mission.
11. Summary
Overall, BPA‟s FMD‟s strategic goal is to increase reliability, standardize and right-size
the fleet, increase equipment availability, in conjunction with reducing operational and
capital costs. Furthermore, to address facility requirements in order to meet
recommended functionality ratings while enhancing the skill-sets of HMEM technicians.
Efforts are underway to achieve these goals, and the entire FMD staff is confident that
this transition will be successful.

40
Financial Disclosure
This information has been made publicly available by BPA on February 18, 2014 and
contains information not reported in BPA financial statements.