FLAVOUR FORMATION IN GHEE - University of Canterbury
207
FLAVOUR FORMATION IN GHEE A thesis submitted in partial fulfilment of the requirements for the degree of Doctor of Philosophy in Biochemistry at the University of Canterbury Angela E. Newton 2013
Transcript of FLAVOUR FORMATION IN GHEE - University of Canterbury

FLAVOUR FORMATION IN GHEE
A thesis submitted in partial fulfilment of the requirements for the
degree
of Doctor of Philosophy in Biochemistry
at the University of Canterbury
Angela E. Newton
2013


i | P a g e A n g e l a E . N e w t o n
Abstract
Consumers place a high level of importance on flavour when assessing the acceptability of
food. The flavour of dairy products can be affected by heating both during processing and
by consumers during food preparation. Of particular importance to the flavour of heated
dairy products is the highly complex network of Maillard reactions. Previously, emphasis has
been placed on undesirable flavours generated through the Maillard reaction in dairy
products and efforts have been made to minimise the formation of these flavours. However,
beneficial flavours are also formed by the Maillard reaction. Dairy products such as ghee are
formed by heating and are characterised by their unique flavours; these flavours are
generated by the Maillard reaction.
The objective of this thesis was to unravel the factors that influence the Maillard and
caramelisation reactions that occur during the cooking of ghee. Particular focus was placed
on the impact that the structure of the cream had on the reaction, and how manipulation of
these parameters could provide an avenue for the control of the Maillard reaction.
The development and validation of model reaction systems for the Maillard and
caramelisation reactions involved the variation of parameters including cooking time,
temperature, pH, phosphate buffers and salt. A group of eleven compounds including acetic
acid, furfural, 2-acetylfuran, butyrolactone, 2(5H)-furanone, furfuryl alcohol, maltol, 2-
acetylpyrrole, hydroxymaltol, hydroxymethylfurfural (HMF) and dihydro-4-hydroxy-2(3H)-
furanone (DHHF) were monitored to determine the impact of these parameter changes.
These results provided a starting point to assess the impact of food structure on these
reactions. To assess the impact of food structure a series of matrix structures were designed
starting from an aqueous matrix. The first component that was added to the aqueous matrix
was fat to generate a two phase structure. Emulsion structures were then formed from the
two phase structure using emulsifiers and high pressure homogenisation.
Analysis of the volatile compounds formed as the matrix structures were altered was carried
out using headspace solid phase microextraction/ gas chromatography mass spectrometry
(SPME/GCMS). Results indicated that fat is a key structural component in flavour generation
via the Maillard reaction. This could have implications for low fat foods where the flavour

ii | P a g e A n g e l a E . N e w t o n
developed during cooking is important. The addition of fat indicated a significant impact on
the Maillard reaction with a less significant impact seen on the caramelisation reaction.
The formation of two emulsions with inverted structures provided a means to alter the ratio
of volatile compounds in the cooked samples. The oil in water emulsion generated a volatile
compound profile similar to that of the fat containing matrix, whereas the water in oil
emulsion produced a different ratio of these same compounds.
The results reported in this thesis shed some light on the relationship between food
structure and flavour formation during the cooking of milk fat emulsions. These structures
will create future opportunities to manipulate the structure of food to control flavour
formation.

iii | P a g e A n g e l a E . N e w t o n

iv | P a g e A n g e l a E . N e w t o n
Acknowledgments
I would like to thank my supervisors for their constant help, encouragement and wonderful
supervision throughout my PhD. Thank you to Dr Juliet Gerrard for her prompt email responses,
awesome suggestions, superb proof reading and positive reassurances when I was having moments
of doubt and reminding me that it was ok to go on holiday without my thesis. A huge thank you to
Dr Paul Andrewes for putting up with me on a daily basis, answering my endless questions, helping
to fix/troubleshoot the GCMS when things didn’t go to plan, and for reminding me of the big picture
when I was heading off on a tangent. Thank you also to Dr Antony Fairbanks for your mechanistic
brilliance and patience answering my questions and to Dr Matt Golding for your expert emulsions
knowledge and valuable answers to my many questions.
To everyone who was part of the former biotransformations and flavour team, and the current food
chemistry team, thank you for your support. Special thanks to Andrew Broome, Michael Loh, Ivan
Simpson, and Skelte Anema for your assistance with lab equipment and ensuring experiments ran
smoothly. Thank you to Tim Coolbear for his excellent proof reading skills and to Lucy Justice for
your statistics assistance.
Thank you to the Gerrard research group at the University of Canterbury for accepting me as one of
the group even though you probably all wondered at one time or another if I actually existed. Thank
you to Dr Justine Cottam who has become a great friend over the course of my PhD: thank you for all
of your advice, encouragement and time passing conversations when we were sharing an office
space (corner of the lab). I am grateful for the assistance from Dr Susie Meade with travel
arrangements, accommodation bookings and paperwork wrangling to ensure that working across
two locations ran smoothly.
Of course this PhD would not have been possible without the support and understanding of my
friends and family. Thank you to my Fightshop family particularly Stew, Tash, Paula, Caitlin and Sue,
for accommodating my ever changing schedule, missed training sessions, my often distracted state
of mind and for listening to me ramble about things you didn’t understand!!! I could never have
won a New Zealand title while doing my PhD without you!! To all my other friends, thank you for
always being there when I needed a laugh, a wine and a mental break from my PhD.
I am extremely grateful for the constant support of my parents, Vicki and Colin. Thank you for always
encouraging me to set high goals and chase my dreams, the newspaper clippings, cups of tea, for
being interested in things you don’t understand and finding mistakes others had missed. Everything

v | P a g e A n g e l a E . N e w t o n
you have done for me was greatly appreciated. Thank you to my in-laws, Ian and Jan for
understanding when I stayed at home to work or I brought my PhD to stay.
Finally, to my darling Mike who always understood when I was tired, busy, cranky and horrible to
live with, and thank you for telling me that I was none of those things! Thank you for always listening
and putting things in perspective when I thought the world was ending, for our wonderful weekends
away without my thesis and for agreeing to honeymoon in Europe so I could present at a
conference, it was the most amazing trip!! I could not have survived my PhD without your love and
support. ‘Love you always’
This work was co-funded by Fonterra Co-operative Group Ltd and the New Zealand Ministry for
Science and Innovation (Project DRIX0801, Dairy Ingredient Solutions for Nutritional Vitality).

vi | P a g e A n g e l a E . N e w t o n
Table of Contents
Abstract i
Acknowledgements iv
List of abbreviations x
Chapter 1 Flavour formation in ghee – background information 1
1.1 Introduction 1
1.2 Maillard reaction 2
1.3 Factors influencing the Maillard reaction 5
1.4 Studying the Maillard reaction with a view to flavour control 13
1.5 Flavours in dairy products 17
1.6 Mechanistic pathways 23
1.7 Conclusion 25
1.8 Thesis aims/chapter outline 26
1.9 References 28
Chapter 2 Volatile compound analysis 37
2.1 Introduction 37
2.2 Analysis of volatile compounds 37
2.3 Standard samples 40
2.4 Gas chromatography optimisation 42
2.5 Solid phase micro extraction (SPME) optimisation 48
2.6 Mass spectrometry 51
2.7 Data analysis 52
2.8 Compound identification 55
2.9 Reproducibility 56
2.10 Error calculations 57
2.11 Matrix interferences 58
2.12 Conclusion 61
2.13 References 62

vii | P a g e A n g e l a E . N e w t o n
Chapter 3 Ghee 65
3
3.1 Introduction 65
3.2 Traditional ghee cooking methods 65
3.3 Modelling the cooking of ghee 68
3.4 Influence of time and temperature 69
3.5 Comparing high throughput cooking to wok ghee 73
3.6 Structure of starting materials 75
3.7 Conclusion 77
3.8 References 78
Chapter 4 An experimental model for the Maillard and caramelisation reactions 79
4
4.1 Introduction 79
4.2 Modelling the Maillard and caramelisation reaction in cream 79
4.3 The differences between the Maillard and caramelisation reactions 81
4.4 Influence of time and temperature 85
4.5 Influence of pH on the Maillard and caramelisation reactions 89
4.6 Other components of cream that influence the Maillard reaction 95
4.7 Conclusion 99
4.8 References 100

viii | P a g e A n g e l a E . N e w t o n
Chapter 5 The role of fat in the Maillard and caramelisation reactions 103
5
5.1 Introduction 103
5.2 The influence of fat on the Maillard reaction 104
5.3 The influence of fat on the caramelisation reaction 107
5.4 Aqueous concentration effect 111
5.5 Reaction temperature and evaporation 112
5.6 Participation of fat in the Maillard reaction 114
5.7 The partitioning effect of the two phase reaction matrix 115
5.8 Conclusion 116
5.9 References 118
Chapter 6 The role of emulsion structure in the caramelisation and Maillard reactions 120
6
6.1 Introduction 120
6.2 Formation of emulsions 122
6.3 Impact of emulsifiers 123
6.4 Influence of emulsion structure 126
6.5 Conclusion 139
6.6 References 141
Chapter 7 Conclusion 143
7
7.1 Future work 147
7.2 References 148

ix | P a g e A n g e l a E . N e w t o n
Chapter 8 Materials and methods 152
8
8.1 Materials 152
8.2 Gas chromatography mass spectrometry 152
8.3 General methods 158
8.4 Ghee 158
8.5 Aqueous experimental model system 160
8.6 The addition of fat to the aqueous model system 163
8.7 The influence of emulsion structure 164
8.8 References 168
Appendix A Proposed mechanisms 171
Appendix B Fonterra product bulletins 180
Appendix C Statistical analysis and tables 186

x | P a g e A n g e l a E . N e w t o n
List of Abbreviations °C
degrees Celsius
°Cmin-1
degrees Celsius per minute
µg/kg
micrograms per kilogram
µm
micrometre
AMF
anhydrous milkfat
ANOVA
analysis of variance
Aq aqueous
AS
autosampler
aw
water activity
B/B
butter/buttermilk
C18
eighteen carbon length chain
C4
four carbon length chain
CB
cream butter
CE
capillary electrophoresis
d(0.1)
the diameter under which 10 % of particles exist in the sample
d(0.5)
median particle diameter
d(0.9)
the diameter under which 90 % of the particles exist in the sample
D[3,2]
surface area moment mean
D[4,3]
volume moment mean
DC
direct cream
DF300
dairy flavour 300 (standard reference compound)
DHHF
dihydro-4-hydroxy-2(3H)furanone
EI
electron ionisation
eV
electron Volts
FAME
fatty acid methyl ester
gal
galactose
GC
gas chromatography
GCMS
gas chromatography mass spectrometry
HLB
hydrophilic lipophilic balance
HMF
hydroxymethylfurfural
Hz
hertz
LCMS
liquid chromatography mass spectrometry

xi | P a g e A n g e l a E . N e w t o n
logP
partitioning coefficient
M
molar
MB
milk butter
mg
milligrams
Min
minutes
ml
millilitre
mM
millimolar
mm
millimetre
mML-1
millimoles per litre
MS
mass spectrometry
N
refractive index
n/a
not applicable
NMR
nuclear magnetic resonance
o/w
oil in water emulsion
P
partial pressure of water in the system
PCA
principle components analysis
PDMS/DVB polydimethysiloxane/divinylbenzene
PGPR
polyglycerol polyrinocleate
pKa
acid dissociation constant
Po
partial pressure of pure water
PS
prestratification
Psi
pounds per square inch
rpm
revolutions per minute
SDS-PAGE sodium dodecyl sulfate – polyacrylamide gel electrophoresis
SIM
single ion monitoring
SPME
solid phase microextraction
TP two phase
UT13500
ultraturrax at 13,500 rpm
UT20000
ultraturrax at 20,000 rpm
UT8000
ultraturrax at 8,000 rpm
UV
ultraviolet
w/o
water in oil emulsion
w/v
weight for volume
w/w
weight for weight

xii | P a g e A n g e l a E . N e w t o n
1 | P a g e A n g e l a E . N e w t o n
1. Flavour formation in Ghee
This thesis investigates the role of emulsion structure on the Maillard and caramelisation reactions
that occur during the cooking of ghee, with a view to controlling these reactions in order to
manipulate flavour formation.
The introduction provides an overview of the Maillard reaction occurring between a reducing sugar
and an amino group of a protein or amino acid and the caramelisation reaction of the reducing sugar
alone in dairy products and model systems, along with various factors that can influence these two
reactions.
1.1 Introduction
The flavour of dairy products can be particularly important to consumers (1). Milk that is fresh and of
high quality typically has a characteristically mild flavour, and consequently any deviation in flavour
will be obvious. Whilst a major source of flavour components is the milk itself, the degradation of
milk constituents during processing can also have a significant impact on the final flavour profile of
dairy products.
The quality of many foods, including dairy products, is affected by the Maillard reaction (2), which
becomes more significant when those foods are heated (3). This highly complex network of reactions
can produce an attractive taste, appearance and aroma for the consumer (2, 3) or it can develop
undesirable colours, off-flavours and potentially harmful reaction products (2, 4-6). Changes to the
functional properties of milk proteins can also occur (7). In the context of dairy foods, these
undesirable flavours are of concern in both the production and storage of UHT milks and dried milk
powders (6): for this reason minimisation of Maillard chemistry in dairy products has been a priority
in the field. However, these same flavours are desirable in ghee (8, 9), brown butter, Ryazhenka
Kefir (10), grilled cheese, condensed milk, toffees, fudges, dulce de leche (11) and milk chocolate
crumb (12, 13). Thus, depending on the desired product quality, both minimising and enhancing the
progress of the Maillard reaction is of interest to dairy food processors.
Model systems have been employed to understand the chemistry of the Maillard and caramelisation
reactions and how the environment in which the reaction occurs can influence the reaction
outcomes. There has been a focus has been on microemulsions that could provide avenues for the
control of volatile flavours (14-19).

2 | P a g e A n g e l a E . N e w t o n
1.2 Maillard reaction
The Maillard reaction is named after Louis Camille Maillard, who first described the reaction that
occurs between an amino group and a carbonyl moiety (20, 21) in 1912. The amino group can be
part of an amino acid, peptide or protein, any of which can react with a variety of carbonyl-
containing compounds, typically sugars (such as glucose, fructose or lactose) or their derivatives, or
fat breakdown products (22, 23). The Maillard reaction is a thermally-induced reaction occurring
most often at high temperatures. In most dairy products the most abundant carbonyl compound will
initially be the reducing sugar lactose (or its hydrolysis products, glucose and galactose) and the
amino groups could be derived from either casein or whey proteins, which contain amino acid
residues that have been shown to be reactive to Maillard chemistry (22) , e.g., lysine. Other sources
of amine groups could include amino phospholipids (24) or free amino acids (25), whilst milk fat
provides another source of carbonyl compounds (23).
There are multiple stages to the Maillard reaction (figure 1.1). The initial stage (figure 1.2) is typically
a condensation reaction between the sugar and an amine to form an unstable glycosylamine (imine).
This glycosylamine can then undergo rearrangement to form the Amadori compound, an
aminodeoxyketose. This Amadori compound can react along multiple parallel pathways to form
advanced Maillard reaction products, a selection of which are illustrated in figure 1.3 (21, 26).
Compounds formed by the Maillard reaction in dairy products commonly include furfural, 2-
acetylfuran, furfuryl alcohol, hydroxymethylfurfural (HMF) and maltol (figure 1.4). For a detailed
treatment of the many and varied reaction pathways of Maillard chemistry see Ledl and Schleicher
(20), Nursten (21), and Gerrard (27).

3 | P a g e A n g e l a E . N e w t o n
Sugar + Amino group
Glycosylamine
Amadori/Heyns rearrangement
Amadori rearrangement product/Heyns rearrangement product
Amino group
Deoxysones
Furfural (pentoses)
Hydroxymethylfurfural(hexoses)
Sugar fragmentation
Reductones + Dehydroreductones
Retro-aldolisation
NH3 H2S
FuranonesPyranonesPyrrolesThiophenes
HydroxyacetoneCycloteneDihydroxyacetoneHydroxyacetyl
GlyoxalMethylglyoxalGlycolaldehydeGlyceraldehyde
Aldehydes + Aminoketones
PyridinesPyrazinesOxazoles
ThiazolesPyrrolesImidazoles
Acetoin
Heterocyclisation
Amino acid
Strecker reaction
Figure 1.1 Overall Maillard reaction schematic. Adapted from van Boekel (2006) (3).

4 | P a g e A n g e l a E . N e w t o n
H
HC
OH
HO H
H O-gal
H OH
CH2OH
NH2(CH2)4R H
HC
OH
HO H
H O-gal
H OH
CH2OH
H2C
O
HO H
H O-gal
H OH
CH2OH
Lactoseopen ring form
+ Lysine groupof protein Imine
Amadori product(lactulosyllysine)
+
Lactoseclosed ring form
OO
O
HO
OH
HO
OH
HOOH OH
OH
O N(CH2)4RNH(CH2)4R
Figure 1.2 Early Maillard reaction products of lactose (6) (gal, galactose; R, protein chain).
CH2NH(CH2)4R
O
HO H
H O-gal
H O
CH2OH
CHNH(CH2)4R
OH
HO H
H O-gal
H OH
CH2OH
CH2NH(CH2)4R
OH
OH
H O-gal
H OH
CH2OH
Amadori product
1,2-enolisation
2,3-Enolisation
Furanone
O
H
O
Furfural
OO
HO
HMF
O O
Low pH
High pH
O
HO
O
Maltol
O
HO
O
OH
Hydroxymaltol
O
OH
Furfuryl alcohol
Figure 1.3 Influence of pH on the enolisation pathways (6) (gal, galactose; R, protein chain).
O
O
HO
O
OH
O
O
H
O
OOH
O
O
HMF (Hydroxymethylfurfural)
Maltol(3-Hydroxy-2-methyl-4(H)-pyran-4-one)
Furfural Furfuryl alcohol2-Acetylfuran
Buttery, caramel flavour Malt, caramel, butterscotch, slightly burnt flavour
Burnt, sweet, caramel flavourSweet, almond, caramel flavour Sweet, nutty, balsamic flavour
Figure 1.4 Common Maillard reaction compounds responsible for flavour in dairy products (1,
3, 6, 10, 28-31).

5 | P a g e A n g e l a E . N e w t o n
1.3 Factors influencing the Maillard reaction
The Maillard reaction system is comprised of multiple reaction pathways, each of which can be
favoured relative to alternate pathways under different conditions, making optimisation of the
reaction under a given set of conditions very challenging (32). In a food system, the Maillard reaction
is dependent on several factors: the type of sugar, the type of amino acid residue, the temperature,
the pH, the water activity, the presence of any buffers, the oxygen availability and the nature of the
food matrix (2, 3, 27, 32). These factors need to be considered during both food processing and food
storage (3).
The following sections outline the impact of these different factors with reference to dairy systems.
1.3.1 Type and identity of sugar
One of the reactant factors affecting the Maillard reaction is the type of sugar and the nature of its
breakdown products. Aldose sugars will react differently from ketose sugars (33). Aldoses such as
glucose, mannose, galactose and ribose give rise to the Amadori intermediate, whilst the ketoses
such as fructose, tagatose, ribulose and piscose give rise to the corresponding Heyns compound (33).
Each individual sugar will exhibit a different rate of reaction (34) with monosaccharides reacting
faster than disaccharides. This is in part due to the kinetics of the ring opening equilibrium. From
each of these intermediate products (Heyns and Amadori) the mechanism moves towards different
carbonyl compounds (35) and advanced reaction products, the formation of which can significantly
alter the flavour and aroma profile. The yields, product compositions and rates of these steps are
largely dependent on the pH (35): slightly acidic, neutral and/or slightly basic conditions will all yield
different products. Most dairy products will contain significant quantities of lactose, a disaccharide
of glucose and galactose (6), but ascorbic acid is also present that can itself react with amines to
form Maillard compounds (36, 37). The addition of other sugars to a dairy food product might
significantly alter the flavour profile.
Lactose participates not only in the Maillard reaction as a reducing sugar but also undergoes
degradation by a second pathway. At high temperatures (usually >100 °C) lactose is isomerised to
lactulose (figure 1.5) that subsequently degrades to galactose, formic acid and a range of C5/C6
compounds (38, 39). These transformations, in which amino compounds are not involved, form a
subset of chemical browning reactions referred to as caramelisation reactions (figure 1.6). The rate
of transformation and the rate of the caramelisation reaction are dependent on the type of sugar in
a similar manner to the Maillard reaction (39).

6 | P a g e A n g e l a E . N e w t o n
Figure 1.5 Isomerisation of lactose to lactulose via the Lobry-de Bruyn van Ekenstein
transformation (38, 40, 41).
H OH
HO H
H O-gal
H OH
CH2OH
H O
OH
HO H
H O-gal
H OH
CH2OH
H OH
OH
H
H O-gal
H OH
CH2OH
H O
O
H
H OH
H OH
CH2OH
H O
CH2OH
O
HO H
H O-gal
H OH
CH2OH
CH2OH
OH
HO
H O-gal
H OH
CH2OH
CH2OH
O
HO
H
H OH
CH2OH
CH2OH
O
CH2
H OH
CH2OH
O
OO
HO
OOH
Lactose 1,2-Enediol 3-Deoxyglucosone
Lactulose 2,3-Enediol 4-Deoxyosone
HMF
Furfuryl alcohol
+ galH
-H2O
Figure 1.6 Initial stages of the caramelisation reaction leading to the formation of 4-
deoxyosone and 3-deoxyoglucosone. The caramelisation reaction of lactose can form a range of
compounds including HMF and furfuryl alcohol (38) (gal = galactose).
1.3.2 Type and identity of amine
The involvement of different amino groups in the Maillard reaction will lead to a range of alternate
flavour profiles as a result of the different compounds that can be formed. To illustrate this table 1.1
(42) shows the range of flavours possible by changing the amino acid heated with glucose, and a
selection of compounds that are responsible for these flavour profiles is shown in figure 1.4. Dairy
proteins contain a range of amino acids, some of which have residues able to participate in the
H
HC
OH
HO H
H O-gal
H OH
CH2OH
HC
OH
HO H
H O-gal
H OH
CH2OH
OHO
HC
OH
HO H
H O-gal
H OH
CH2OH
OHH2C
O
HO H
H O-gal
H OH
CH2OH
OH
Lactose Lactulose

7 | P a g e A n g e l a E . N e w t o n
Maillard reaction without breakdown of the protein. Hydrolysis of the protein also results in
increased amino group availability for the Maillard reaction.
Table 1.1: Possible flavours arising from heating different amino acids with glucose under various
conditions (42).
Amino acid Flavour of product formed on heating with glucose
Alanine Fruity, flowery, sweet
Arginine Bitter, sour, fruity
Aspartic acid Fruity, sweet
Cysteine Sulfur, meaty
Glutamic acid Sour
Glycine Caramel, sweet, flowery
Histidine Sour
Isoleucine Burnt, caramel
Leucine Burnt, caramel
Lysine Pleasant/sweet, caramel, cardboard, herbal tea
Methionine Potatoes, prawn crackers
Threonine Sweet, fruity, astringent
Serine Fruity, sweet
Proline Fruity, bitter
Phenylalanine Flowery, almond, bitter
Tyrosine Fruity, flowery, tea-like
Valine Caramel, biscuit, malty, chocolate, bitter
1.3.3 pH and buffers
The yields, product compositions and rates of many of the Maillard and caramelisation steps are
influenced by the pH of the reaction system (35). Reaction of the same components under slightly
acidic, or neutral, or slightly basic conditions will all yield different products. The ring opening of
reducing sugars is one variable that explains this dependence. The concentration of the open chain
form of the sugar can play a role in the overall reaction rate as it affects the reactivity of the sugar
(32). In cases where the equilibration to the open chain form of the sugar is the rate limiting step
(32), the rate of the initial stages of the Maillard reaction will correlate with higher equilibrium
concentrations of the open chain form of the sugar (figure 1.7). The sugar can also isomerise (41, 43-
8 | P a g e A n g e l a E . N e w t o n
45) and degrade to Maillard-reactive dicarbonyl compounds, such as methylglyoxal (46), carboxylic
and organic acids (38).
lactoseopen ring form
lactoseclosed ring form
OO
O
HO
OH
HO
OH
HOOH OH
OHO
OOH
HO
OH
HO
OH
HO
OH O
OH
H
Figure 1.7 Ring opening equilibrium of lactose.
The pH of the solution also determines the protonation state of the amine group (figure 1.8), which
in turn will alter the rate of the initial reaction, that yields the Amadori product (figure 1.2). The
protonated and non-protonated forms of the amine compound are in a pH dependent equilibrium,
with a higher portion being protonated at low pH. The pKa of the protonated form of the reacting
amino compounds will therefore also influence the optimal pH for the early Maillard reaction, since
only the non-protonated form is reactive. At pH 7, only approximately 1% of amine groups are non-
protonated, which explains one facet of the dependence of reaction rate on the pH of the system
(32).
The pH is also important after the formation of the Amadori compound, as it can determine which
pathway the reaction then predominantly follows: e.g., 1,2-enolisation has been found to
predominate at low pH, whereas a 2,3-enolisation pathway is preferred at a high pH (figure 1.3) (6).
These different pathways then give rise to different products, e.g., furanone via 2,3-enolisation and
furfural and HMF via 1,2-enolisation (6). Various mechanisms have been proposed that lead to a
range of Maillard reaction compounds from the Amadori compound, as summarised in figure 1.3.

9 | P a g e A n g e l a E . N e w t o n
O
O
NH2
O
O
NH2
O
O
NH3
OH
O
NH3
pH 2.18
pH 9.74
pH 10.53
pH 8.95
H3N
H3N
H3N
H2N
Figure 1.8 Changes in protonation of lysine with changes in pH (47).
The presence of buffering agents in the reaction system will alter the rate of the Maillard reaction
(48). Phosphate buffers have been seen to have a catalytic effect, leading to an increase in reaction
rate. The interaction of the phosphate buffer increases the rate of reaction through the initial stages
of the Maillard reaction as shown in figure 1.9. Other buffers, including citrate buffers, do not have
this same effect (48). The concentration of the buffer is also important (49).
The influence of phosphates on the Maillard reaction has been studied using phosphorylated glucose
(50). Phosphorylation of the glucose leads to an increased rate of reaction due to the phosphate
providing a good leaving group. The presence of the phosphate group also allowed for some degree
of control over the Maillard reaction as the phosphate group provided additional stabilisation for
some reaction intermediates and prevented some nucleophilic pathways by blocking and sterically
hindering the required reaction sites (50).

10 | P a g e A n g e l a E . N e w t o n
H
HC
OH
HO H
H O-gal
H OH
CH2OH
H
C
OH
HO H
H O-gal
H OH
CH2OH
O
H
NHH
O
PO O
OO
H
C
OH
HO H
H O-gal
H OH
CH2OH
H
NH
HOP
O OH
OO
H
Lactose Lysine
O
O
R
H2N
R
O
O
R
O
O
Figure 1.9: Proposed catalytic effect of the phosphate anion on the Maillard reaction of lactose
and lysine (50).
1.3.4 Temperature
The reaction temperature is an important parameter, particularly above 100 °C. It is the driver
behind the initiation of the Maillard reaction that is most often seen in food systems cooked at
elevated temperatures (6). Not only the overall reaction rate, but the relative rates of different
reaction pathways are also dependent on temperature (32). Generally, the amount of volatile
compounds found in a sample increases with an increase in temperature (51). Pasteurisation and
UHT processes are conducted at elevated temperatures, as is the manufacture of products such as
ghee and dulce de leche. Other cooking requirements such as for pizza cheese and grilled products,
also results in exposure to elevated temperatures (9, 11, 52-54).
Consideration should also be given to the difference between the cooking temperature and the
actual food temperature (55). Due to water evaporation, temperature gradients, and thermal
conductivity, the temperature of the food can be significantly less than the cooking temperature
during the early heating stages. For example, this difference between the set temperature and the
actual temperature means that while an oven may be set to cook at 130 °C for 30 minutes, the
actual temperature of the food may only be 90-100 °C until the water has evaporated, at which
point the temperature may rise to the set temperature. This also implies that the temperature
11 | P a g e A n g e l a E . N e w t o n
throughout a food may not be uniform (55). This means that the extent of the Maillard reactions in a
cooking process may be less than expected from simple considerations of the cooking temperature.
When food is cooked in an open system, flavour loss, with vapours coming off the food, is apparent
from the strong aromas of cooking foods. As the temperature is increased more vapour is likely to be
driven from the food (especially steam). The net effect on the loss of individual flavour compounds is
complex. However, it is the volatile compounds remaining in the food that are contributing to the
flavour of food. In general, the compounds remaining in the food, after cooking, increase with higher
cooking temperatures regardless of an open or closed system is used.
1.3.5 Lipid degradation compounds
All dairy products contain lipid components as either part of the matrix (cream, milk, cheese) or as a
major component (butter, ghee), placing potentially different levels of importance on the flavour
imparted by the lipid. Carbonyl compounds are formed during the oxidation of lipids and are also
intermediates of Maillard reaction products (56). The degradation and oxidation of lipids are
important to the flavour of food (23, 57), as these breakdown products can react with other Maillard
reactants, leading either to deterioration or to improvement of food quality. Compounds such as
methyl ketones, aldehydes and free fatty acids (23) are formed when fats are heated. These volatile
compounds can then go on to react with amino acids and/or Maillard reaction products. A greater
degree of browning and volatile compound formation was seen in model systems that contained
lipid oxidation products when compared with a model system in which there were no lipid oxidation
products (58), demonstrating that the lipid oxidation products took part in the Maillard reaction.
Lipid oxidation reactions can also occur prior to the heat treatment and are usually favoured under
acidic conditions in the presence of oxygen (59).
Lipid degradation can lead to the production of rancid flavours that can be of particular concern in
dairy products, especially those with limited shelf life or a high fat content. However, the Maillard
reaction may reduce this phenomenon by removing rancid compounds via both the reaction itself
and the ability of some Maillard reaction products to exert an antioxidant effect, which could
prevent rancid flavour compounds from being produced (23, 60, 61).

12 | P a g e A n g e l a E . N e w t o n
1.3.6 Water Activity
The water activity (aw) of a reaction system is an index that describes the availability of water to
participate in reactions. It is defined by the equation aw = P/Po, where P is the partial pressure of the
water in the system and Po is the partial pressure of pure water (62). The Maillard reaction occurs
optimally when aw values are between 0.5 and 0.8 (63, 64).
Water activity varies widely between dairy products, ranging from very high values in products such
as milk (aw>0.95) (65), to very low values in products with low water content such as milk powder
(aw<0.1-0.4) (66) and ghee. There are multiple possible dehydration processes along with many of
the Maillard reaction pathways that will each generate additional water molecules. In a system with
excess water (dilute solution) a high aw will reduce the rate of the biomolecular steps of the Maillard
reaction due to reactant dilution. If the water activity (aw) is lowered, reactants may begin to lose
mobility that is essential for the reaction to occur, thus resulting in a lower rate of reaction (64). The
low water activity of milk powder slows the Maillard reaction to minimise the formation of
detrimental flavour compounds during storage (67).
1.3.7 Influence of metals
The Maillard reaction can also be influenced by the formation of metal complexes between amino
acids and available metal ions. The reaction can be catalysed by copper (Cu2+) and iron (Fe2+/3+) but
inhibited by manganese (Mn2+) and zinc (Zn2+). Calcium (Ca2+) has also been shown to delay the
Maillard reaction by forming complexes with certain sugars (68). Dairy products contain calcium and
traces of other metals that can complex with the amino acids and so influence the reaction rate.
Lipid oxidation can also be catalysed by copper and iron (69) to generate reactive dicarbonyl
compounds.
1.3.8 The impact of emulsion structure
Cream and butter have emulsion structures consisting of either water or oil droplets dispersed in a
continuous phase. The emulsion structures are described as water in oil (w/o) or oil in water (o/w)
emulsions and are characterised by a large particle size, lack of transparency and are kinetically
stable (70). In contrast, microemulsions have a uniform structure, a low viscosity and are
thermodynamically stable. Typically, they have a particle size in the order of nanometres (5-100 nm)
(70).

13 | P a g e A n g e l a E . N e w t o n
In an aqueous reaction system the reactants are free to interact with each other; whereas in a
structured fluid they are confined to droplets (emulsions/microemulsions) or channels (a
bicontinuous phase) (19). When the concentration of reactants was kept constant across aqueous,
emulsion and cubic (bicontinuous) systems, the rates of product formation were found to be
different (14-18). It was proposed that the effective partitioning of the reactants within the
emulsion structure created a localised concentration gradient that increased the proximity of
reactants in certain system locations, thereby increasing the frequency of collisions between
reactants and so the overall reaction rate (19). The localised concentration gradient arose because
although the overall amount of each reactant had been kept the same, the phase that it occupied
had a smaller volume and therefore the reactant concentration was increased within that phase.
1.4 Studying the Maillard reaction with a view to flavour control
1.4.1 Model studies
A considerable amount of information about the Maillard reaction has been collected using model
studies, rather than within the complexity of the reaction systems in food (3, 20). The food matrix
itself can have a large effect due to pH, water content/activity and other influencing factors, as
discussed above. Models attempt to predict the rates of formation of Maillard reaction products as a
function of these influencing factors and can be empirical (mathematical) or mechanistic (based on
the knowledge of the chemical reaction and system) (71). The use of a model can allow testing of
mechanistic predictions and provide insights by simplifying a problem to its basic components (71).
However, the translation to real food systems can be problematic. When the experiments are
carried out on real food the results can be conflicting as there are confounding factors influencing
the results (71). Typical model systems for the Maillard reaction contain an individual amino acid
and sugar – the simplest starting materials. Such studies/models can be extended to proteins and
sugars (26) and further layers of complexity such as emulsion structure can be added to the model
system in a controlled manner as the complexity begins approaching that present in the actual food
system.
There are various parameters to consider when setting up a model system: the sugar, the amino
compound, the reaction matrix (aqueous, lipids, emulsion) and the reaction conditions (pH, water
activity, time, and temperature). Various experimental temperatures and times have been used in
model studies: low (37-80 °C) (14, 51, 64) moderate (100-150 °C) (34, 37, 72-74) and high (>200 °C)
(73), with times for experiments ranging from minutes to hours (17, 72, 75, 76).

14 | P a g e A n g e l a E . N e w t o n
1.4.2 Examples of models and their uses
There are a wide range of model systems that could be applied to dairy products, depending on the
nature of the study being carried out (33, 61, 77-80). These studies typically focus on how the
reaction compounds resulting from the Maillard reaction change when parameters associated with
the system are changed rather than addressing the impact on flavour of the products (81-84).
A simple model that has been used to study the Maillard reaction in dairy systems was comprised of
a monosaccharide (e.g. glucose, galactose, fructose, tagatose) with casein (33) in an aqueous
phosphate buffer. This system contained the sugar (150 mM) with sodium caseinate (3% w/w) in
aqueous phosphate buffer (0.1 M, pH 6.8), giving a molar ratio of sugar to lysine residues of 10:1.
The model reaction system was heated to 120 °C. The purpose of this model was to demonstrate
the differences in reaction mechanisms between an aldose sugar (glucose, galactose) and a ketose
sugar (fructose, tagatose) in the same system, under the same conditions (33). The sugars were also
heated in the system in the absence of sodium caseinate to allow the separation of caramelisation
products and pathways from those that were Maillard products and pathways. The study
demonstrated that there was a difference in the results for aldose sugars and ketose sugars. The
researchers observed that the ketoses had a faster rate of reaction than the aldoses (33) and that
these sugars also followed different Maillard reaction pathways that led to different colours, flavours
and nutritive damage in the final products. This model system and the reaction conditions are similar
to those involved in heating milk (pH 6.7), with caseins, sugars, and high temperature leading to
coloured and flavoured products. Thus there are similarities between the products formed in this
system and those reportedly formed in heated milk (33, 38). These product similarities include
furfuryl alcohol, acetic acid, formic acid and various Maillard intermediates (33) identified in the
model system that were identified in milk alongside HMF and furfural (38). The addition of lactose
to the list of sugars studied would provide a better model of the reaction occurring in dairy products
at high temperatures. The degradation of lactose in milk was studied using a model system
consisting of lactose and sodium caseinate dissolved in a milk salt solution to establish the
degradation pathways (38).
Model systems have been developed to allow the identification of compounds and development of
methods for tracking heat treatment markers in milk. A homogenised lactose and sodium caseinate
solution has been used to model milk in an effort to develop an assay to detect HMF formed during
heat treatment (85). This study was also used to look at the impact of fat content on formation of
HMF as a heat marker in milk in the same study.

15 | P a g e A n g e l a E . N e w t o n
A simple model system of lactose and lysine has also been used to develop a method to identify heat
treatment markers in milk products (35, 85). The yield, composition and rates of the initial Amadori
compound formation depended mainly on the system pH. To allow control over the pH, buffers
such as sodium bicarbonate (NaHCO3) (76) are often used. The desired pH influences which buffer is
used; care must be taken to avoid using buffers that contain reactive amine moieties (such as Tris),
but sodium acetate and sodium phosphate can successfully be used in conjunction with HCl or NaOH
to adjust the final pH (86). The lactose-lysine model system (35) utilised aqueous solutions of lactose
and lysine without pH control. The change in pH was used to monitor the progress of the reaction,
together with relative antioxidative efficiency and optical density as the brown colour developed
(35). Relative antioxidative efficiency is a parameter that has been measured in numerous studies
involving the Maillard reaction (75, 76, 87, 88) and has potential relevance in dairy systems, such as
chocolate, grilled cheese and ghee, where advanced Maillard chemistry is likely to generate a large
number of anti-oxidant compounds. These studies were focused on finding the flavour compounds
that form and discovering markers for the Maillard reaction, rather than the impact of these
compounds on the flavour of the product.
Models have also been used to study specific compounds generated by the Maillard reaction and the
mechanistic pathways by which they are formed, using isotope-labelled starting materials. In a dairy
system this method could be used to investigate formation pathways of flavour compounds found in
heated dairy products such as furfural, and flavours associated with off-flavours. Figure 1.10
illustrates the formation of furan and the different positions of the label in the final product. Isotope
positions in the final product are dependent on the mechanism of formation (72). The formation of
furan and methylfuran in model systems and food systems has been studied using isotopically
labelled ascorbic acid (37) and 13C labelled sugars (72). These models were used both under dry
roasting conditions and aqueous conditions, and food systems were monitored by spiking pumpkin
puree with the labelled compounds and then heating under the same conditions as were used in the
model system (72). This allowed the influence of a food matrix on the formation mechanisms to be
assessed and clearly demonstrated the relative importance of the pathways highlighted below and
that the furan formation from sugars and amino acids represented only a minor route. Other routes
involve recombination of fragments originating from sugar and protein fragments (72).

16 | P a g e A n g e l a E . N e w t o n
H
C
C OH
HHO
OHH
OHH
CH2OH
H
C
C OH
HHO
OHH
OHH
CH2OH
H
H
C
C OH
HHO
OHH
OHH
CH2OH
H
H
C
C O
HH
OHH
OHH
CH2OH
H
H
C
C O
HH
OHH
OHH
CH2OH
H
HO OH
OOHO
C
C OH
H
OH
OHH
CH2OH
HOH
C
C
O
C
O OC
O
D-[1,2-13
C2]-Glucose
13
13
13
13
13
13
13
13
13
13
13
13
13
13
13
13
Figure 1.10: Summary schematic of potential mechanistic routes to furan from glucose (72).
The use of labelled sugars has also been applied to the study of specific pathways such as enolisation
(89) by analysing where the labelled fragments are located at the end of the reaction. The formation
of acetic acid during the Maillard reaction under various conditions has been studied in this way (89)
as it is a common product formed by the reaction of hexose sugars in alkaline conditions. The
amount of acetic acid formation was studied to establish the effect of pH, temperature and reaction
time for a glucose-glycine phosphate buffered system (89). It appears that such studies have not yet
been applied in dairy systems (or model systems based on dairy products), but these would provide
valuable information about the mechanisms of formation of flavour in dairy food.
There are various dairy products that contain an emulsion structure; cream is an oil in water
emulsion, inversely butter is a water in oil emulsion, and processed cheeses can be formed using
emulsions (90). Different emulsion or microemulsion structures for a reaction system can also be
modelled. These studies have been used to demonstrate the different outcomes of the reaction that
could be achieved by changing the structure of dairy foods. Structured fluids were investigated (19)
as microreactors for Maillard reaction chemistry. Reactions were carried out in three different
systems: an aqueous phase consisting of 100% water; a traditional water-in-oil microemulsion with
discrete and continuous phases; and a unique cubic phased system, that had an interesting structure
consisting of an interpenetrating network of channels of the two phases, each of which is continuous
(19). When the reaction was carried out in the cubic phase, a wider product profile was produced

17 | P a g e A n g e l a E . N e w t o n
along with an increase in observed product yields. The transition between microemulsion structures
is continuous, allowing bicontinous microemulsion structures to form (18). These structures can be
transitioned between with adjustment of the water content of the system. Since the rate of reaction
was altered with changes to the structure, it could therefore be altered by adjusting the amount of
water in the system. The same cannot be said for emulsions whose structures are discrete from one
another; to transition from o/w to w/o there must be a phase inversion that is transitional rather
than catastrophic (91).
With the exception of using novel double emulsions to form processed cheeses (90) there has been
little research published on the possibilities of altering the structures of dairy products such as milk,
cream and butter or the impact that such structures have on final flavour properties of the products.
1.4.3 Analysis of flavours
The analysis of the products formed is an important aspect of the model studies and studies
involving real food systems. A range of techniques are available to study the end products of the
reactions depending on the questions being asked: chemical analysis (92-96) is used to identify the
reaction compounds that form during the course of the reaction, physical analysis has been used to
study the texture, rheology (97) and colour, while sensory analysis (42, 98-100) is used to determine
the flavour and texture along with the acceptability of these parameters by the consumer. Most
studies focus on one form of analysis, either identifying what the reaction products are, or how the
colour changed over the course of the reaction, or whether the consumer finds the product
acceptable. To gain a full understanding of dairy product flavour more than one set of analysis is
required.
1.5 Flavours in dairy products
In addition to the mild dairy flavours derived from the milk itself, specific dairy products will have
characteristic flavours derived from their method of manufacture; the method may influence either
the pathways of the Maillard reaction, or the subsequent perception of any Maillard reaction
products. The heating processes used in dairy food processing are generally for pasteurisation or
water removal. This application of heat initiates the Maillard reaction, which generates additional
flavour compounds, resulting either in flavours being produced or in the generation of flavour
precursor compounds that go on to react during subsequent cooking. In either scenario, these
compounds may be off-flavours or beneficial to product quality.

18 | P a g e A n g e l a E . N e w t o n
1.5.1 Fluid milks
In milk, there are over 200 volatile components that contribute to the overall flavour (43). Several of
these components are present in very small amounts (<400 µg/kg) but still impact the overall flavour
profile. Maillard reaction products have been identified in heat damaged milk (101, 102) as a result
of pasteurisation. The presence of these products even at small levels can alter the flavour of the
milk producing an off-flavour. There have been many analytical studies focusing on identifying the
flavour compounds of milk (28, 103).
UHT milk is heat treated at ultra-high temperatures (54). This brief but intense heating occurs in a
temperature range of 135-140 °C. The heating can be either direct (steam injection or milk infusion
into steam) or indirect (heating and cooling using heat exchangers). This heat treatment destroys
pathogens, but can also cause chemical changes in the milk leading to off-flavours. Ideally, UHT milk
would have the same flavour as fresh milk: namely only a minimal aroma, with a slightly sweet but
relatively bland flavour. This flavour profile can be greatly influenced by the presence of volatile
compounds, in particular sulfur containing compounds. While adding desirable flavour to cheeses
and butter, these sulfur compounds, including hydrogen sulphide, dimethyl sulphide and
methanethiol, which can all be derived from Maillard chemistry, are often responsible for the off-
flavours in UHT milk (53).
1.5.2 Milk powders
Whilst most Maillard reactions are initiated by heat, it has also been demonstrated that Maillard
chemistry is an important factor in the development of off-flavours and browning in milk powders
during storage (28, 64, 103). These reactions also result in nutritive damage to the product (104) and
therefore the conditions of storage are important to minimise these deleterious effects. Any off-
flavours, such as nitrogen containing indole compounds, are very noticeable and objectionable in the
final product (28, 103).
Likewise, the temperature of milk powder storage can influence the Maillard reaction; samples
stored at a higher temperature (50 °C) exhibit accelerated Maillard reaction product formation
(104). Increased humidity has also been observed to accelerate the Maillard reaction during storage,
if the aw was increased into the range appropriate for this chemistry to become significant (30). The
formation of compounds such as HMF (figure 1.4) and furosine along with browning of the powders
are indicators of the Maillard reaction during storage (105, 106). HMF is commonly used as a

19 | P a g e A n g e l a E . N e w t o n
Maillard indicator in dairy products, but is not suitable for all food types. The monitoring of HMF is
often done using colorimetric techniques (105, 106) or fluorescence (104). An enzyme linked
immunoabsorbant assay is currently being developed to monitor HMF in a wide range of
carbohydrate containing foods (107).
The furan derivatives furfural and furfuryl alcohol (figure 1.4) are Maillard reaction products
produced by sugar degradation and dehydration. These compounds were identified in skim milk
powder, but their levels were below the perception threshold. However, they have a sweet, nutty,
caramel odour that could be important for condensed milk (28). The Maillard reaction also leads to
the development of colour in sweetened condensed milk (106, 108).
1.5.3 Cheese
The flavour of cheese is derived from the activities and interactions of starter bacteria, rennet, milk
enzymes and also from any secondary flora present (109). The flavour compounds of impact (64)
include methyl ketones formed via fat oxidation that is initiated by bacteria, fatty acids formed from
the lipolysis of the milk fat, sulfur compounds generated by bacteria, α-dicarbonyl and related
compounds that can also react with amino acids to generate Strecker aldehydes (a known Maillard
reaction pathway (21)) and amine compounds (64), e.g., the amino termini of peptides generated by
enzymatic hydrolysis, which may also participate in Maillard chemistry.
The use of cheese on pizza and in prepared foods requires a cheese with desirable attributes,
including colour, after cooking (110). The browning of cheese during baking can be attributed to the
Maillard reaction. When tested by sensory panellists, the cooked brown colour and flavour of the
cooked cheese were not seen as undesirable, although a less coloured cooked cheese was favoured
by pizza manufacturers surveyed (111).
The manufacture of processed cheese involves heating the cheese products with other materials
(112) to yield a homogeneous product. The temperature of the processing steps can cause colour
defects (browning) that have been linked to the Maillard reaction. Aroma defects are also generated
giving rise to an ‘overcooked’ aroma. These defects depend on the heating time and temperature
and the product composition (112). There were several compounds identified in a model cheese
system that are known Maillard reaction products: furfuryl alcohol, furfural, furaneol and maltol
(112). This model system demonstrated that these compounds played a major role in the
‘overcooked’ defect (112).
20 | P a g e A n g e l a E . N e w t o n
1.5.4 Flavours in cooked dairy products
The heating of dairy products is not limited to manufacturing, as it is also a common household
process (113). Flavour is an important attribute of food, both prior to and after heating. Many dairy
products are cooked, such as cheeses, cream and butter. There are also products that are made by
cooking other dairy ingredients, including ghee, milk chocolate crumb, Ryazhenka kefir (10) and
browned butter. The effects of the Maillard reaction are often seen when these products are
cooked, providing a desired change to the product, including grilled cheese such as on pizza,
browned butter often used in making roux or baking, milk chocolate crumb or block milk (12, 13).
Halloumi is a cheese that is eaten after frying or grilling, developing a browned outer layer. Although
little sensory analysis has been carried out on this cheese, it is known that the volatile flavour
compounds differ between the raw and cooked cheese (98). Moreover, given that this cheese is
most commonly consumed in cooked form, the change in flavour can be assumed to be desirable.
Another cheese commonly cooked for consumption is mozzarella; there were no undesirable
flavours noted when mozzarella was cooked (111).
Cream, milk and butter are also commonly used in baked goods such as scones, shortbreads and
other sweet items, where they are subjected to high temperatures, in the presence of sugar, for
cooking; many Maillard reaction products are thus generated that are associated with the
favourable aroma of these products. A further use of the Maillard reaction in cooking is during the
making of ghee. Ghee is an example of a product in which the flavour compounds generated via the
Maillard reaction are desirable. The flavour in ghee is generated from multiple sources: compounds
found naturally in the starting material, Maillard browning reaction compounds, free fatty acids,
lipid oxidation and fermentation (9). Dulce de leche is another product that requires the Maillard
reaction to generate the characteristic colour and flavour. The consumer acceptability relies on the
flavour and colour (99).
1.5.5 Low fat dairy products
The current consumer driven market is searching for low fat food alternatives, including dairy
products, without compromising on food flavour; however, low fat versions of products such as
cheeses, milk, ice cream and yoghurts often lack flavour. Fat can be replaced with protein,
carbohydrates, other fat based products, or a combination of all three (100, 114). Low fat cheese can
lose up to 50% of its flavour with a reduction in fat (81), which, coupled with associated changes in
texture and other sensory attributes (81, 100), can lead to an inferior product. For example, low fat

21 | P a g e A n g e l a E . N e w t o n
chocolate ice-cream made with 2.5% milk fat plus low fat cocoa powder instead of cocoa butter had
a less intense flavour (100).
Ghee is a fat product with potential for use in flavour replacement. The highly flavoured nature of
ghee relative to products such as butter oil or anhydrous milk fat (AMF) makes it an alternative that
would add flavour, even at low fat content.
1.5.6 Ghee
Ghee is a product that is made by indigenous methods (9) in many countries around the world,
largely in Asia, the Middle East and Africa. It is known by various other names such as maslee in the
Middle East where ghee is derived from goat, sheep or camel milk (9, 29, 115) and roghan in Iran.
Ghee is used in cooking, as a condiment and for religious purposes (116). The cooking methods vary
along with the unique individual flavours (9).
By definition, ghee is ‘a product exclusively obtained from milk, cream or butter by means of
processes which result in almost total removal of water and non-fat solids, with an especially
developed flavour and physical structure’ (117); the flavour is ‘acceptable for market requirements
after heating a sample to 40-45 °C’ (117). A good ghee has been defined (117) as having a pleasant,
nutty, lightly cooked or caramelised flavour. It was said that the flavour can best be described as a
lack of oiliness or blandness, sweetly rather than sharply acidic (8), but it is objectionable to have
any suggestion of rancidity. The flavour of ghee cannot be attributed to a single compound, but
rather to a large range of compounds (8). This group of compounds includes aldehydes, ketones,
fatty acids, carboxylic acids, lactones and alcohols (29, 116). These flavours are generated during the
heating process by reactions between protein and lactose, protein and lactose degradation
products, lipid oxidation and degradation of free fatty acids (9).
There are several methods of making indigenous ghee; all have a common element of heating to
high temperature (110-140 °C).The different methods of making ghee all start from fermented milk,
cream (often soured to 0.5-1% acidity), butter or a combination of butter and buttermilk (9, 118).
After the heat clarification, the remaining product is filtered to remove any remaining solids (section
3.2).
The presence of maltol and furans has been linked to significant differences in flavours (116). These
products, along with other pyrans, various ketones and aldehydes are known Maillard reaction
products (21, 116). Maltol and various furans are products of sugar degradation, and the initial

22 | P a g e A n g e l a E . N e w t o n
reducing sugar concentration can greatly influence the amount of each compound formed (116).
Important flavour compounds are considered to be aldehydes, ketones and lactones (9, 119).
There are commercial products that fit the definition of ghee based solely on physical characteristics.
These products include AMF (anhydrous milk fat), butter ghee and butter oil (120). Whilst they are
similar with respect to some of their characteristics, these products do not display the same flavour
profile as traditional indigenous ghee; butter oil and AMF are particularly lacking in flavour. The
production of synthetic ghee flavours (8, 118) has been attempted in the past using a formulation of
synthetic flavouring compounds to create a ghee flavour in butter oil. The synthetic flavourings used
were based on analytical data for ghee flavour constituents (8). Efforts made to reconstitute the
flavours focussed on a mixture of lactones, free fatty acids and carbonyl compounds (8); however, as
not all of the ghee constituents had been identified, and their exact proportions were not known, it
was difficult to formulate a synthetic ghee flavour in the butteroil (8).
There are several papers (9, 29, 115, 116, 121) that outline the flavour constituents that have been
identified in ghee. The compounds identified are generally grouped into aldehydes, ketone
(including methyl ketones), esters, acids, alcohols and lactones with any compounds not fitting these
groups identified as ‘other’. Within these groups there are several compounds that can be
attributed to formation via the Maillard reaction. These compounds (figure 1.11) include HMF, acetic
acid, maltol (larixinic acid), furfuryl alcohol, furfural, hydroxymaltol (8, 9, 29, 116). A better
understanding of high temperature Maillard chemistry may therefore inform the development of
this type of product and allow the manipulation of flavour.
O
OH
O
OH
O
O
O
HO
O
O
HO OH
OH
O OH
O
Furfuryl alcohol Maltol
Hydroxymaltol Acetic acid Furfural
HMF
Figure 1.11 Maillard reaction compounds identified in ghee (8, 9, 29, 116).

23 | P a g e A n g e l a E . N e w t o n
1.6 Mechanistic pathways
The use of model studies to investigate the pathways of the Maillard and caramelisation reactions
has led to the elucidation of mechanisms of formation of a variety of compounds, some of which are
found in the dairy products above (such as those depicted in figures 1.4 and 1.11).
The formation of the Amadori compound and its degradation along the 1,2-enolisation and 2,3-
enolisation pathways have been studied in detail (figures 1.2 and 1.3) (1, 20, 21, 27) up to the
formation of the keto and enol derivatives. However, the elucidation of mechanisms for compound
formation after this point has been limited to studies focusing on a single or related group of
compounds. The published mechanisms are not always complete, with some containing missing
steps where only the intermediates detected through analysis are presented in the mechanisms.
There have been a wide range of compounds studied, of which only some are found in dairy
products.
Important flavour compounds for dairy products, particularly those with caramel flavours, are maltol
and hydroxymaltol (figures 1.12 and 1.13). These two compounds can be formed from the 2,3-
enolisation pathway of the Maillard reaction cascade and, in turn, have been shown to degrade
further under certain conditions (10, 57, 122-126).
O
HO
OHH
CH2OH
H
H
H
ORO
OR
O OH
HO
H
O
O
HO OH
O
O
H
CH2OH
H
H
H
OR O
OR
O
HHO
O
OR
HO
HO O
O
HO
1-Deoxyglucosone
Maltol
Hydroxymaltol
Figure 1.12 Formation of hydroxymaltol and maltol from the 1-deoxyosone intermediate formed
along the 2,3-enolisation pathway (57, 126).

24 | P a g e A n g e l a E . N e w t o n
Figure 1.13 Degradation of hydroxymaltol (1) to maltol (2) as described by Bates and Kim (122).
Along the 2,3-enolisation pathway acetic acid is also formed with several hypothesised mechanisms
(89, 127), from the 1-deoxy-2,3-hexodiulose structure. The mechanisms were determined for
reactions using glucose as the sugar rather than lactose. The C4 fragment formed (figure 1.14) can
then react further to generate C4 furanone compounds (21).
CH3
O
O
H OH
H OH
CH2OH
OH
OH
CH2OH
H
H OH
Deoxy-2,3-hexodiulose Acetic acid C4 fragment
OH
O
Figure 1.14 Formation of acetic acid and C4 reactive fragment (89, 127).
The deoxy-2,3-hexodiulose compound also provides a pathway to 2-acetylfuran (31) via the 1,4-
dideoxyosone compound as shown in figure 1.15. The 2-acetylfuran was formed from glucose and
glycine but could also be formed from glucose via a similar pathway from the 1,4-dideoxyosone
compound.
CH3
O
O
H
OHH
CH2OH
HO
HO
OH
O
O
O
CH3
O
O
H OH
H OH
CH2OH
1-Dideoxyosone 2-AcetylfuranDeoxy-2,3-hexodiulose
Figure 1.15 Formation of 2-acetylfuran via 2,3-enolisation pathway (31).
The Amadori compound can also degrade via a 1,2-enolisation mechanism (figure 1.3) to form
furfural, furfuryl alcohol and HMF (21, 57). The 3-deoxyhexosone (figure 1.16) is formed via the 1,2-
enolisation pathway en route to the formation of HMF.
O
O
HO OH
O
OH
HO OH
OH
H2O O
O
O
O
HO OH
OH
HO
MaltolHydroxymaltol

25 | P a g e A n g e l a E . N e w t o n
HC
O
H
H OH
H OH
CH2OH
O
H
HC
O
H
H OH
CH2OH
O
H
O
OHO
HMF3-Deoxyhexosone
Figure 1.16 Formation of HMF (57).
The formation of furfuryl alcohol (figure 1.17) can take place through a deoxy-pentose compound
(38, 128) that forms via a retro-Claisen mechanism from the 1-amino-1,4-dideoxyhexosulose
compound to a pentose intermediate compound. The pentose intermediate is formed along the 1,2-
enolisation pathway from the Amadori compound.
O
OH
OH
HO
O
OH
H
OH
H
H OH
CH2OH
O
H
H
C
OH
H
H OH
CH2OH
N
R
H
O
H
H
O CHN R
H
Furfuryl alcohol2-Deoxypentose
retro-Claisen
Figure 1.17 Furfuryl alcohol formation via 2-deoxypentose compound formed by a retro-Claisen
reaction of an aminoreductone (128, 129).
Each of the reaction pathways have been studied using various sugar and amino acid combinations.
These mechanisms can be used in to form a hypothetical map of pathways that explains the
formation of volatile compounds in dairy products via the Maillard and caramelisation reactions and
may help guide experiments to manipulate their relative concentrations. Some postulated
mechanisms are described in Appendix A.
1.7 Conclusion
In the majority of dairy products the Maillard reaction is often an undesirable source of flavours,
which has led to a focus by the dairy industry on reducing the extent of the reaction. However, in
cooked cream products, such as ghee and dulce de leche, Maillard reactions are desirable and
indeed essential.
Some dairy foods actually have very little in common with the model systems that have been used to
study the Maillard reaction. Although the use of models to study the influence of microemulsion
structures on the Maillard reaction has demonstrated that different microemulsion structures can

26 | P a g e A n g e l a E . N e w t o n
lead to different reaction product profiles, many food systems are emulsions (cream and butter)
rather than microemulsions, leaving a significant gap between models and food, which needs to be
bridged.
Many of the flavour studies have been conducted with the purpose of identifying marker
compounds found in the products. There has been a lack of studies that systematically identify the
flavour compounds in dairy products and link the formation of these compounds to the food system
variables such as emulsion structure. Information from such studies could be used to control
compound formation and so control the flavour profile.
Numerous flavour compounds have been found in ghee, but little work has been done to determine
the origin of these compounds, the mechanisms by which they form, and the influence of the
emulsion structure on the final product ratios. More work is required to understand the mechanisms
of flavour formation in cooked cream products, in particular, so that the flavour can be manipulated
to enhance it and make the final product more desirable.
1.8 Thesis aims/Chapter outlines
The aim of this thesis was to determine the influence of emulsion structure in ghee, on the
formation of flavour compounds through the Maillard and related reactions. To achieve the aim the
following objectives needed to be completed:
1. To develop a SPME/GCMS method for screening of Maillard reaction compounds formed in
ghee and model reaction systems.
2. To develop a high throughput method for cooking ghee.
3. To develop a model reaction system and a model matrix system to study the influence of
emulsion structure on the Maillard reaction.
4. To determine the influence of different emulsion structures on the Maillard reaction.
Chapter two discusses the development of the SPME/GCMS analysis method.
Chapter three introduces ghee, its traditional manufacture and a high throughput method of
cooking.
Chapter four presents the experimental model reactions for the caramelisation reaction and the
Maillard reactions along with a study of the influence of pH, salts and buffers.

27 | P a g e A n g e l a E . N e w t o n
Chapter five discusses the addition of fat to the reaction matrix, describes the influence of fat on the
reaction models and looks at the impact of different types of fat.
Chapter six presents the development of different emulsion structures and an assessment of their
influence on the Maillard and caramelisation reaction models.
Chapter seven provides the final conclusions and important findings of the thesis.
Chapter eight discusses the materials and methods used throughout the thesis.
Appendix A includes plausible reaction mechanisms by which the compounds monitored during the
experiments may be formed.
Appendix B includes Fonterra Cooperative Group product bulletins.
Appendix C provides information regarding statistical methods and statistical data.

28 | P a g e A n g e l a E . N e w t o n
1.9 References
1. Nursten, H. E., The flavour of milk and dairy products. 1. Milk of different kinds, milk powder, butter and cream. International Journal of Dairy Technology 1997, 50, 48-56.
2. Ames, J. M., Applications of the Maillard reaction in the food industry. Food Chemistry 1998, 62, 431-439.
3. van Boekel, M. A. J. S., Formation of flavour compounds in the Maillard reaction. Biotechnology Advances 2006, 24, 230-233.
4. Keramat, J.; LeBail, A.; Prost, C.; Soltanizadeh, N., Acrylamide in foods: chemistry and analysis. A review. Food and Bioprocess Technology 2011, 4, 340-363.
5. Van Nguyen, C., Toxicity of the AGEs generated from the Maillard reaction: On the relationship of food-AGEs and biological-AGEs. Molecular Nutrition and Food Research 2006, 50, 1140-1149.
6. van Boekel, M. A. J. S., Effect of heating on Maillard reactions in milk. Food Chemistry 1998, 62, 403-414.
7. Hiller, B.; Lorenzen, P. C., Functional properties of milk proteins as affected by Maillard reaction induced oligomerisation. Food Research International 2010, 43, 1155-1166.
8. Yadav, J. S.; Srinivasan, R. A., Advances in ghee flavour research. Indian Journal of Dairy Science 1992, 45, 338-348.
9. Sserunjogi, M. L.; Abrahamsen, R. K.; Narvhus, J., A review paper: Current knowledge of ghee and related products. International Dairy Journal 1998, 8, 677-688.
10. Preininger, M.; Gimelfarb, L.; Li, H. C.; Dias, B. E.; Fahmy, F.; White, J., Identification of dihydromaltol (2,3-dihydro-5-hydroxy-6-methyl-4(H)-pyran-4-one) in Ryazhenka kefir and comparative sensory impact assessment of related cycloenolones. Journal of Agricultural and Food Chemistry 2009, 57, 9902-9908.
11. Pauletti, M. S.; Matta, E. J.; Rozycki, S., Kinetics of heat-induced browning in concentrated milk with sucrose as affected by pH and temperature. Food Science and Technology International 1999, 5, 407-413.
12. Muresan, S.; Eillebrecht, M.; de Rijk, T. C.; de Jonge, H. G.; Leguijt, T.; Nijhuis, H. H., Aroma profile development of intermediate chocolate products I. Volatile constituents of block-milk. Food Chemistry 2000, 68, 167-174.
13. Edmondson, P. T.; Grammatika, M.; Fryer, P. J.; Handy, B., Modelling of heat transfer, mass transfer and flavour development in chocolate crumb. Food and Bioproducts Processing 2005, 83, 89-98.
14. Fanun, M.; Leser, M.; Aserin, A.; Garti, N., Sucrose ester microemulsions as microreactors for model Maillard reaction. Colloids and Surfaces A: Physicochemical and Engineering Aspects 2001, 194, 175-187.
15. Garti, N., Microemulsions as microreactors for food applications. Current Opinion in Colloid and Interface Science 2003, 8, 197-211.

29 | P a g e A n g e l a E . N e w t o n
16. Yaghmur, A.; Fanun, M.; Aserin, A.; Garti, N., Food grade microemulsions based on nonionic emulsifiers as selective microreactors for flavor formation by Maillard reaction. Self-Assembly 2003, 144-151.
17. Yaghmur, A.; Aserin, A.; Abbas, A.; Garti, N., Reactivity of furfural-cysteine model reaction in food-grade five-component nonionic o/w microemulsions. Colloids and Surfaces A: Physicochemical and Engineering Aspects 2005, 253, 223-234.
18. Holmberg, K., Organic reactions in microemulsions. European Journal of Organic Chemistry 2007, 731-742.
19. Vauthey, S.; Milo, C.; Frossard, P.; Garti, N.; Leser, M. E.; Watzke, H. J., Structured fluids as microreactors for flavor formation by the Maillard reaction. Journal of Agricultural and Food Chemistry 2000, 48, 4808-4816.
20. Ledl, F.; Schleicher, E., New aspects of the Maillard reaction in foods and in the human body. Angewandte Chemie - International Edition 1990, 29, 565-594.
21. Nursten, H. E., The Maillard reaction: chemistry, biochemistry and implications. RSC Publishing: Cambridge, UK, 2005.
22. Rizzi, G. P., The Strecker degradation of amino acids: Newer avenues for flavor formation. Food Reviews International 2008, 24, 416-435.
23. Whitfield, F. B., Volatiles from interactions of Maillard reactions and lipids. Critical Reviews in Food Science and Nutrition 1992, 31, 1-58.
24. Hidalgo, F. J.; Nogales, F.; Zamora, R., The role of amino phospholipids in the removal of the cito- and geno-toxic aldehydes produced during lipid oxidation. Food and Chemical Toxicology 2008, 46, 43-48.
25. Metwalli, A. A. M.; van Boekel, M., On the kinetics of heat-induced deamidation and breakdown of caseinate. Food Chemistry 1998, 61, 53-61.
26. Fayle, S. E.; Gerrard, J. A., The Maillard reaction. Royal Society of Chemistry: Cambridge, UK, 2002.
27. Gerrard, J. A., New aspects of an AGEing Chemistry - Recent developments concerning the Maillard reaction. Australian Journal of Chemistry 2002, 55, 299-310.
28. Shiratsuchi, H.; Shimoda, M.; Imayoshi, K.; Noda, K.; Osajima, Y., Volatile flavour compounds in spray-dried skim milk powder. Journal of Agricultural and Food Chemistry 1994, 42, 984-988.
29. Wadodkar, U. R.; Punjrath, J. S.; Shah, A. C.; Przybylski, R., Evaluation of volatile compounds in different types of ghee using headspace with GC/MS. Milchwissenschaft - Milk Science International 2003, 58, 37-39.
30. Le, T. T.; Bhandari, B.; Deeth, H. C., Chemical and physical changes in milk protein concentrate (MPC80) powder during storage. Journal of Agricultural and Food Chemistry 2011, 59, 5465-5473.

30 | P a g e A n g e l a E . N e w t o n
31. Wang, Y.; Juliani, H. R.; Simon, J. E.; Ho, C. T., Amino acid-dependent formation pathways of 2-acetylfuran and 2,5-dimethyl-4-hydroxy-3(2H)-furanone in the Maillard reaction. Food Chemistry 2009, 115, 233-237.
32. van Boekel, M., Kinetic aspects of the Maillard reaction: a critical review. Nahrung-Food 2001, 45, 150-159.
33. Brands, C. M. J.; van Boekel, M., Reactions of monosaccharides during heating of sugar-casein systems: Building of a reaction network model. Journal of Agricultural and Food Chemistry 2001, 49, 4667-4675.
34. van Boekel, M. A. J. S.; Brands, C. M. J., Heating of sugar-casein solutions: Isomerization and Maillard reactions. In The Maillard reaction in foods and medicine, O'Brien, J.; Nursten, H. E.; Crabbe, M. J.; Ames, J. M., Eds. Woodhead publishing: Cambridge, UK, 1998; pp 154-159.
35. Monti, S. M.; Ritieni, A.; Graziani, G.; Randazzo, G.; Mannina, L.; Segre, A. L.; Fogliano, V., LC/MS analysis and antioxidative efficiency of Maillard reaction products from a lactose-lysine model system. Journal of Agricultural and Food Chemistry 1999, 47, 1506-1513.
36. Yu, A. N.; Zhang, A. D., The effect of pH on the formation of aroma compounds produced by heating a model system containing L-ascorbic acid with L-threonine/L-serine. Food Chemistry 2010, 119, 214-219.
37. Limacher, A.; Kerler, J.; Conde-Petit, B.; Blank, I., Formation of furan and methylfuran from ascorbic acid in model systems and food. Food Additives and Contaminants 2007, 24, 122-135.
38. Berg, H. E.; Vanboekel, M., Degradation of lactose during heating of milk. 1. Reaction pathways. Netherlands Milk and Dairy Journal 1994, 48, 157-175.
39. Tomasik, P.; Palasinski, M.; Wiejak, S., The thermal decomposition of carbohydrates. 1. The decomposition of monosaccharides, disaccharides and oligosaccharides. Advances in Carbohydrate Chemistry and Biochemistry 1989, 47, 203-278.
40. Wrolstad, R. E., Reactions of sugars. In Food carbohydrate chemistry, 1 ed.; Wrolstad, R. E., Ed. John Wiley and Sons Inc: 2012; pp 35 - 47.
41. Aider, M.; de Halleux, D., Isomerization of lactose and lactulose production: review. Trends in Food Science and Technology 2007, 18, 356-364.
42. Wong, K. H.; Aziz, S. A.; Mohamed, S., Sensory aroma from Maillard reaction of individual and combinations of amino acids with glucose in acidic conditions. International Journal of Food Science and Technology 2008, 43, 1512-1519.
43. McSweeny;, P. L. H.; Nursten;, H. E.; Urbach, G., Advanced dairy chemistry vol 3: Lactose, water, salts and vitamins. 2 ed.; Chapman and Hall: London, UK, 1997; Vol. 3.
44. Hajek, J.; Murzin, D. Y.; Salmi, T.; Mikkola, J. P., Interconversion of lactose to lactulose in alkaline environment: comparison of different catalysis concepts. Topics in Catalysis 2013, 56, 839-845.
45. Ganzle, M. G.; Haase, G.; Jelen, P., Lactose: Crystallization, hydrolysis and value-added derivatives. International Dairy Journal 2008, 18, 685-694.

31 | P a g e A n g e l a E . N e w t o n
46. Hellwig, M.; Degen, J.; Henle, T., 3-Deoxygalactosone, a "new" 1,2-dicarbonyl compound in milk products. Journal of Agricultural and Food Chemistry 2010, 58, 10752-10760.
47. McMurry, J., Organic chemistry. 5 ed.; Brooks/Cole Thomson Learning: Pacific Grove, CA, United States of America, 1999.
48. Guan, Y. G.; Wang, S. L.; Yu, S. J.; Yu, S. M.; Zhao, Z. G., Changes in the initial stages of a glucose-proline Maillard reaction model system influences dairy product quality during thermal processing. Journal of Dairy Science 2012, 95, 590-601.
49. Bell, L. N., Maillard reaction as influenced by buffer type and concentration. Food Chemistry 1997, 59, 143-147.
50. Yaylayan, V. A.; Machiels, D.; Istasse, L., Thermal decomposition of specifically phosphorylated D-glucoses and their role in the control of the Maillard reaction. Journal of Agricultural and Food Chemistry 2003, 51, 3358-3366.
51. Yaghmur, A.; Aserin, A.; Garti, N., Furfural-cysteine model reaction in food grade nonionic oil/water microemulsions for selective flavor formation. Journal of Agricultural and Food Chemistry 2002, 50, 2878-2883.
52. Ajandouz, E. H.; Desseaux, V.; Tazi, S.; Puigserver, A., Effects of temperature and pH on the kinetics of caramelisation, protein cross-linking and Maillard reactions in aqueous model systems. Food Chemistry 2008, 107, 1244-1252.
53. Al-Attabi, Z.; D'Arcy, B. R.; Deeth, H. C., Volatile sulphur compounds in UHT milk. Critical Reviews in Food Science and Nutrition 2009, 49, 28-47.
54. TetraPak, Dairy processing handbook. Tetra Pak Processing Systems: Lund, Sweden, 1995.
55. Lioumbas, J. S.; Karapantsios, T. D., Evaporation front compared with crust thickness in potato deep-fat frying. Journal of Food Science 2011, E17-E25.
56. Voziyan, P. A.; Metz, T. O.; Baynes, J. W.; Hudson, B. G., A post-Amadori inhibitor pyridoxamine also inhibits chemical modification of proteins by scavenging carbonyl intermediates of carbohydrate and lipid degradation. Journal of Biological Chemistry 2002, 277, 3397-3403.
57. Parker, J. K., The kinetics of thermal generation of flavour. Journal of the Science of Food and Agriculture 2013, 93, 197-208.
58. Adams, A.; Kitryte, V.; Venskutonis, R.; De Kimpe, N., Model studies on the pattern of volatiles generated in mixtures of amino acids, lipid-oxidation-derived aldehydes, and glucose. Journal of Agricultural and Food Chemistry 2011, 59, 1449-1456.
59. Ho, C. T.; Chen, Q. Y., Lipids in food flavours - An overview. In Lipids in food flavors, Ho, C. T.; Hartman, T. G., Eds. American Chemical Society: Washington, DC, United States of America, 1994; Vol. 558, pp 2-14.
60. Singh, S.; Ram, B. P.; Mittal, S. K., Effect of phospholipids and method of manufacture on flavour and keeping quality of ghee. Indian Journal of Dairy Science 1979, 32.
61. Giroux, H. J.; Houde, J.; Britten, M., Use of heated milk protein-sugar blends as antioxidant in dairy beverages enriched with linseed oil. LWT - Food Science and Technology 2010, 43, 1373-1378.

32 | P a g e A n g e l a E . N e w t o n
62. Lutz, R.; Aserin, A.; Garti, N., Maillard reaction between leucine and glucose in o/w microemulsion media in comparison to aqueous solution. Journal of Dispersion Science and Technology 2005, 26, 535-547.
63. Malec, L. S.; Gonzales, A. S. P.; Naranjo, G. B.; Vigo, M. S., Influence of water activity and storage temperature on lysine availability of a milk like system. Food Research International 2002, 35, 849-853.
64. Gonzales, A. S. P.; Naranjo, G. B.; Leiva, G. E.; Malec, L. S., Maillard reaction kinetics in milk powder: Effect of water activity at mild temperatures. International Dairy Journal 2010, 20, 40-45.
65. Fernandez-Salguero J., G. R., Carmona M. A., Water activity of selected high-moisture foods. Journal of Food Composition and Analysis 1993, 6, 364-369.
66. Shrestha, A. K.; Howes, T.; Adhikari, B. P.; Bhandari, B. R., Spray drying of skim milk mixed with milk permeate: Effect on drying behavior, physicochemical properties, and storage stability of powder. Drying Technology 2008, 26, 239-247.
67. Lloyd, M. A.; Drake, M. A.; Gerard, P. D., Flavor variability and flavor stability of US-produced whole milk powder. Journal of Food Science 2009, 74, S334-S343.
68. Rizzi, G. P., Effects of cationic species on visual color formation in model Maillard reactions of pentose sugars and amino acids. Journal of Agricultural and Food Chemistry 2008, 56, 7160-7164.
69. Morgan, J.; Leake, D. S., Oxidation of low density lipoprotein by iron or copper at acidic pH. Journal of Lipid Research 1995, 36, 2504-2512.
70. Moulik, S. P.; Paul, B. K., Structure, dynamics and transport properties of microemulsions. Advances in Colloid and Interface Science 1998, 78, 99-195.
71. van Boekel, M. A. J. S., Predictive modeling of flavour compound formation in the Maillard reaction: A SWOT analysis. In In controlling Maillard pathways to generate flavors, Oxford University Press: Cary, NC, United States of America, 2010; Vol. 1042, pp 1-11.
72. Limacher, A.; Kerler, J.; Davidek, T.; Schmalzried, F., Formation of furan and methylfuran by Maillard-type reaction in model systems and food. Journal of Agricultural and Food Chemistry 2008, 56, 3639-3647.
73. Illmann, S.; Davidek, T.; Gouezec, E.; Rytz, A.; Schuchmann, H. P.; Blank, I., Generation of 4-hydroxy-2,5-dimethyl-3(2H)-furanone from rhamnose as affected by reaction parameters: experimental design approach. Journal of Agricultural and Food Chemistry 2009, 57, 2889-2895.
74. Engel, W.; Hofmann, T.; Schieberle, P., Characterization of 3,4-dihydroxy-3-hexen-2,5-dione as the first open-chain caramel-like smelling flavor compound. European Food Research and Technology 2001, 213, 104-106.
75. Wijewickreme, A. N.; Kitts, D. D., Influence of reaction conditions on the oxidative behavior of model Maillard-reaction products. Journal of Agricultural and Food Chemistry 1997, 45, 4571-4576.
76. Yoshimura, Y.; Iijima, T.; Watanabe, T.; Nakazawa, H., Antioxidative effect of Maillard reaction products using glucose-glycine model system. Journal of Agricultural and Food Chemistry 1997, 45, 4106-4109.

33 | P a g e A n g e l a E . N e w t o n
77. Akhtar, M.; Murray, B. S.; Dickinson, E., Perception of creaminess of model oil-in-water dairy emulsions: Influence of the shear-thinning nature of a viscosity-controlling hydrocolloid. Food Hydrocolloids 2006, 20, 839-847.
78. Brands, C. M. J.; van Boekel, M., Kinetic modelling of reactions in heated disaccharide-casein systems. Food Chemistry 2003, 83, 13-26.
79. Rozycki, S. D.; Buera, M. P.; Pauletti, M. S., Heat-induced changes in dairy products containing sucrose. Food Chemistry 2010, 118, 67-73.
80. Hernandez, H. G.; Livings, S.; Aguilera, J. M.; Chiralt, A., Phase transitions of dairy proteins, dextrans and their mixtures as a function of water interactions. Food Hydrocolloids 2011, 25, 1311-1318.
81. Drake, M. A.; Miracle, R. E.; McMahon, D. J., Influence of fat on flavour and flavour development in cheddar cheese. Australian Journal of Dairy Technology 2010, 65, 195-199.
82. Druaux, C.; Voilley, A., Effect of food composition and microstructure on volatile flavour release. Trends in Food Science and Technology 1997, 8, 364-368.
83. Hofmann, T.; Schieberle, P.; Grosch, W., Model studies on the oxidative stability of odor-active thiols occurring in food flavors. Journal of Agricultural and Food Chemistry 1996, 44, 251-255.
84. Philippe, E.; Seuvre, A. M.; Colas, B.; Langendorff, V.; Schippa, C.; Voilley, A., Behavior of flavor compounds in model food systems: a thermodynamic study. Journal of Agricultural and Food Chemistry 2003, 51, 1393-1398.
85. Morales, F. J.; Jimenez-Perez, S., HMF formation during heat-treatment of milk-type products as related to milkfat content. Journal of Food Science 1999, 64, 855-859.
86. Ajandouz, E. H.; Tchiakpe, L. S.; Dalle Ore, F.; Benajiba, A.; Puigserver, A., Effects of pH on caramelization and Maillard reaction kinetics in fructose-lysine model systems. Journal of Food Science 2001, 66, 926-931.
87. Hwang, I. G.; Kim, H. Y.; Woo, K. S.; Lee, J.; Jeong, H. S., Biological activities of Maillard reaction products (MRPs) in a sugar-amino acid model system. Food Chemistry 2011, 126, 221-227.
88. Wang, H. Y.; Qian, H.; Yao, W. R., Melanoidins produced by the Maillard reaction: Structure and biological activity. Food Chemistry 2011, 128, 573-584.
89. Davidek, T.; Devaud, S.; Robert, F.; Blank, I., Sugar fragmentation in the Maillard reaction cascade: Isotope labeling studies on the formation of acetic acid by a hydrolytic beta-dicarbonyl cleavage mechanism. Journal of Agricultural and Food Chemistry 2006, 54, 6667-6676.
90. Lobato-Calleros, C.; Sosa-Perez, A.; Rodriguez-Tafoya, J.; Sandoval-Castilla, O.; Perez-Alonso, C.; Vemon-Carter, E. J., Structural and textural characteristics of reduced-fat cheese-like products made from W1/O/W2 emulsions and skim milk. LWT - Food Science and Technology 2008, 41, 1847-1856.
91. Liu, Y. H.; Fribere, S. E., Perspectives of phase changes and reversibility on a case of emulsion inversion. Langmuir 2010, 26, 15786-15793.

34 | P a g e A n g e l a E . N e w t o n
92. Fay, L. B.; Brevard, H., Contribution of mass spectrometry to the study of the Maillard reaction in food. Mass Spectrometry Reviews 2005, 24, 487-507.
93. Vallejo-Cordoba, B.; Gonzalez-Cordova, A. F., CE: A useful analytical tool for the characterization of Maillard reaction products in foods. Electrophoresis 2007, 28, 4063-4071.
94. Porretta, S., Chromatographic analysis of Maillard reaction products. Journal of Chromatography 1992, 624, 211-219.
95. Mariaca, R.; Bosset, J. O., Instrumental analysis of volatile (flavour) compounds in milk and dairy products. Lait 1997, 77, 13-40.
96. Andersen, C. M.; Mortensen, G., Fluorescence spectroscopy: A rapid tool for analyzing dairy products. Journal of Agricultural and Food Chemistry 2008, 56, 720-729.
97. Ranalli, N.; Andres, S. C.; Califano, A. N., Physicochemical and rheological characterization of 'dulce de leche'. Journal of Texture Studies 2012, 43, 115-123.
98. Piggott, J. R.; Margomenou, A.; Withers, S. J.; Conner, J. M., Sensory characterization of Halloumi cheese and relationship with headspace composition. In Food flavors: Formation, analysis, and packaging influences, 1st ed.; Contis, E. T.; Ho, C. T.; Mussinan, C. J.; Parliment, T. H.; Shahidi, F.; Spanier, A. M., Eds. Elsevier Science: Philadelphia, PA, United States of America, 1998; Vol. 40, pp 385-391.
99. Gimenez, A.; Ares, G.; Gambaro, A., Consumer reaction to changes in sensory profile of dulce de leche due to lactose hydrolysis. International Dairy Journal 2008, 18, 951-955.
100. Prindiville, E. A.; Marshall, R. T.; Heymann, H., Effect of milk fat, cocoa butter, and whey protein fat replacers on the sensory properties of lowfat and nonfat chocolate ice cream. Journal of Dairy Science 2000, 83, 2216-2223.
101. Erbersdobler, H. F.; Somoza, V., Forty years of furosine - Forty years of using Maillard reaction products as indicators of the nutritional quality of foods. Molecular Nutrition & Food Research 2007, 51, 423-430.
102. Morales, F. J.; Romero, C.; Jimenez-Perez, S., Characterization of industrial processed milk by analysis of heat-induced changes. International Journal of Food Science and Technology 2000, 35, 193-200.
103. Shiratsuchi, H.; Shimoda, M.; Imayoshi, K.; Noda, K.; Osajima, Y., Off-flavour compounds in spray-dried skim milk powder. Journal of Agricultural and Food Chemistry 1994, 42, 1323-1327.
104. Liu, X. M.; Metzger, L. E., Application of fluorescence spectroscopy for monitoring changes in nonfat dry milk during storage. Journal of Dairy Science 2007, 90, 24-37.
105. Oral, R. A.; Dogan, M.; Sarioglu, K., Monitoring of the hydroxymethylfurfural amount as an indicator of Maillard products in sweet whey and skim milk powder stored under different conditions. Milchwissenschaft - Milk Science International 2011, 66, 398-401.
106. Patel, A. A.; Gandhi, H.; Singh, S.; Patil, G. R., Shelf-life modeling of sweetened condensed milk based on kinetics of Maillard browning. Journal of Food Processing and Preservation 1996, 20, 431-451.

35 | P a g e A n g e l a E . N e w t o n
107. Fang, G. Z.; Lv, Y. Y.; Sheng, W.; Liu, B.; Wang, X. X.; Wang, S., Development of an enzyme-linked immunosorbent assay for the determination of 5-hydroxymethyl-2-furfural in food. Analytical and Bioanalytical Chemistry 2011, 401, 3367-3373.
108. Kass, J. P.; Palmer, L. S., Browning of autoclaved milk - Chemical factors involved. Industrial and Engineering Chemistry 1940, 32, 1360-1366.
109. Urbach, G., The flavour of milk and dairy products. 2. Cheese: contribution of volatile compounds. International Journal of Dairy Technology 1997, 50, 79-89.
110. Wang, H. H.; Sun, D. W., Assessment of cheese browning affected by baking conditions using computer vision. Journal of Food Engineering 2003, 56, 339-345.
111. Matzdorf, B.; Cuppett, S. L.; Keeler, L.; Hutkins, R. W., Browning of mozzarella-cheese during high-temperature pizza baking. Journal of Dairy Science 1994, 77, 2850-2853.
112. Bertrand, E.; Machado-Maturana, E.; Chevarin, C.; Portanguen, S.; Mercier, F.; Tournayre, P.; Abouelkaram, S.; Guillard, A. S.; Kondjoyan, A.; Berdague, J. L., Heat-induced volatiles and odour-active compounds in a model cheese. International Dairy Journal 2011, 21, 806-814.
113. van Boekel, M. A. J. S.; Fogliano, V.; Pellegrini, N.; Stanton, C.; Scholz, G.; Lalljie, S.; Somoza, V.; Knorr, D.; Jasti, P. R.; Eisenbrand, G., A review on the beneficial aspects of food processing. Molecular Nutrition and Food Research 2010, 54, 1215-1247.
114. Nasirian, R.; Vaziri, A.; Safekordi, A. A.; Ardjmand, M., Use of gum tragacanth in reduction of dairy cream fat. Milchwissenschaft - Milk Science International 2010, 65, 49-52.
115. Sawaya, W. N.; Khan, P.; Alshalhat, A. F., Physical and chemical characteristics of ghee and butter from goats and sheeps milk. Food Chemistry 1984, 14, 227-232.
116. Wadodkar, U. R.; Punjrath, J. S.; Shah, A. C., Evaluation of volatile compounds in different types of ghee using direct injection with gas chromatography-mass spectrometry. Journal of Dairy Research 2002, 69, 163-171.
117. Alimentarius, C., Codex standard for milkfat products. In Codex Stan 280-1973, Codex Alimentarius: Rome, Italy, 2010; p 3.
118. Ganguli, N. C.; Jain, M. K., Ghee - its chemistry, processing and technology. Journal of Dairy Science 1973, 56, 19-25.
119. Yadav, J. S.; Srinivasan, R. A., Advances in ghee flavour research. Indian Journal of Dairy Science 1992, 45.
120. El-Rafey, M. S.; Richardson, G. A.; Henderson, J. L., The effect of the method of manufacture of butteroil on its keeping quality. Journal of Dairy Science 1944, 27, 807-820.
121. Yadav, J. S.; Srinivasan, R. A., Qualitative and quantitative changes in flavour characteristics of ghee made from ripened cream. Indian Journal of Dairy Science 1984, 37, 350-356.
122. Kim, M. O.; Baltes, W., On the role of 2,3-dihydro-3,5-dihydroxy-6-methyl-4(H)-pyran-4-one in the Maillard reaction. Journal of Agricultural and Food Chemistry 1996, 44, 282-289.

36 | P a g e A n g e l a E . N e w t o n
123. Konecny, M.; Cejpek, K.; Cechovska, L.; Velisek, J., Transformation pathways of reductones in the advanced Maillard reaction. Czech Journal of Food Sciences 2009, 27, S149-S152.
124. Hodge, J. E.; Fisher, B. E.; Mills, F. D., Compounds of browned flavour derived from sugar-amine reactions. Cereal Science Today 1972, 17, 34-36.
125. Shaw, P. E.; Tatum, J. H.; Berry, R. E., 2,3-dihydro-3,5-dihydroxy-6-methyl-4(H)-pyran-4-one, A degradation product of a hexose. Carbohydrate Research 1971, 16, 207-213.
126. Yaylayan, V. A.; Mandeville, S., Stereochemical control of maltol formation in Maillard reaction. Journal of Agricultural and Food Chemistry 1994, 42, 771-775.
127. Voigt, M.; Glomb, M. A., Reactivity of 1-deoxy-D-erythro-hexo-2,3-diulose: A key intermediate in the Maillard chemistry of hexoses. Journal of Agricultural and Food Chemistry 2009, 57, 4765-4770.
128. Toyosaki, T., Sakane, Y., and Kasai, M., Effects of medium-chain triacylglycerols (MCT) on the Maillard reaction. Journal of Food Processing and Technology 2013, 4.
129. Pischetsrieder, M.; Schoetter, C.; Severin, T., Formation of an aminoreductone during the Maillard reaction of lactose with N-alpha-acetyllysine or proteins. Journal of Agricultural and Food Chemistry 1998, 46, 928-931.

37 | P a g e A n g e l a E . N e w t o n
Chapter 2 Volatile compound analysis
2.1 Introduction
This chapter focuses on the method development for analysis of volatile compounds in ghee and
model systems, using gas chromatography paired with mass spectrometry (GCMS). Optimising an
appropriate analytical method was a crucial step for this project; a consistent and automated
method, able to analyse large numbers of samples was needed.
The objective for the analysis was monitoring the changes in the volatile compound profiles when
the external reaction conditions and the internal structure of the model system were changed. For
this reason the method chosen needed to be functional across many different sample types and
sample matrices. The samples being analysed contained a large number of different compounds. The
compounds being detected exhibit a range of properties that will influence the analysis and there
was a need to detect the compounds at both high and low concentrations.
The screening of the samples for changes in volatile compounds under multiple conditions required
a high throughput method that could be automated for experimental efficiency.
2.2 Analysis of volatile compounds
There are various methods of analysing volatile compounds; which is most appropriate depends on
the nature of the analysis required, the objective of the analysis and the sample being analysed. The
method of sample preparation also needs consideration when determining the most appropriate
analytical technique.
2.2.1 Analysis techniques
Due to the volatile nature of the flavour compounds being investigated, the use of GCMS has been
commonly used (1-7) and widely applied for the analysis of food (7-10) including ghee and related
products (2, 11-13) along with model Maillard reaction systems (14). GCMS has been coupled with
both direct injection (2) and head space (12, 13) techniques for these types of samples. Mass
spectrometry is commonly used as the detector for the analysis of Maillard reaction products. There
are three main uses of GCMS to investigate the Maillard reaction (7): identification of unknown

38 | P a g e A n g e l a E . N e w t o n
compounds, quantification of known compounds and the study of Maillard reaction mechanisms.
The comparison of unknown compound mass spectra to vast libraries of standard spectra is a useful
tool for identifying compounds (13). However, it is always best to identify the compound based on
the spectrum and retention time of an authentic compound run through the same system.
Although commonly utilised for this type of analysis there were other options besides the GCMS for
analysis such as liquid chromatography-mass spectrometry (LCMS) (15), nuclear magnetic resonance
(NMR) (15) electrochemistry (16, 17), capillary electrophoresis (CE) (18), fluorescence (19, 20) and
ultraviolet spectroscopy (UV) (21). When studying both Maillard and caramelisation reaction
products in foods it is necessary to separate them from each other to accurately account for reaction
contributions (22). In systems where both Maillard and caramelisation reactions are important and
need to be monitored, the disappearance of the reducing sugar (e.g., glucose) and amino acid
groups along with increasing UV absorbance, browning levels and protein reticulation have been
monitored (23). High performance anion exchange chromatography was used to monitor glucose
loss and protein reticulation was monitored by sodium dodecyl sulfate-polyacrylamide gel
electrophoresis (SDS-PAGE) (23). Isotopic labelling with C13 and N15 allows for tracking by GCMS to
monitor reaction pathways and fragmentation products (24).
For odour active compounds the technique of gas chromatography-olfactory can be a valuable tool
(25). This technique is useful for odour compounds where the molecule may give a large GC peak
area as generated by a detector but does not correspond to high odour intensity. The same can be
said for a compound with a small peak area coupled with high odour intensity. There is, however, a
need to assess the impact of the sample matrix on the odour intensity due to the complex nature of
interactions between flavour molecules and other food components. The compounds are detected
by the human olfactory system providing sensory analysis as well as analytical (typically a second
detector is also used). A detection outlet of the GC is connected to a sniffing port that is located in
an isolated environment to eliminate effects of outside odours. The results are limited by the limit of
detection associated with an individual evaluator’s sense of smell (25). This technique would be very
useful for later studies in this field, to correlate the presence of specific volatiles compounds with
perceived flavour in ghee.
An interesting technique used for monitoring the Maillard reaction is the use of electrochemical
monitoring (16). The Maillard reaction intermediates are a viable electrochemical system, as the
reductones formed are known to be electrochemically active. The use of a platinum working
electrode and an Ag/AgCl (saturated KCl) reference electrode allows redox potentials to be
measured. Based on a model system using ß-alanine and carbohydrates, an increasingly negative cell

39 | P a g e A n g e l a E . N e w t o n
potential was observed over time as browning increased. This was indicative of the formation of
chemically reducing species (16).
For this study GCMS was chosen as the most appropriate analytical technique because of the ability
to screen for a large range of volatile compounds using an automated system. GCMS allowed
compounds that were present in ghee and any model systems to be detected at a range of different
levels throughout the study and the sample analysis to be automated. The GCMS can also be
coupled with a range of sample preparation techniques.
2.2.2 Sample preparation techniques
A variety of sample preparation techniques are available for use depending on the analytical
technique chosen. Each technique has its advantages and disadvantages in terms of sample
handling, interferences, automation and time considerations.
Solid phase micro extraction (SPME) can be paired with headspace GCMS for analysis of volatile
compounds. Headspace has been particularly useful for dairy products, e.g., ghee (12, 13) as the
nature of the food component matrix is complex and has the potential to affect the release or
retention of the volatile flavour compounds (26). Headspace SPME provides a clean sample for
desorption onto the column and allows for high throughput sampling with minimal sample
preparation (27, 28). It also allows the analytes to be removed from complex matrices. Care needs
to be taken using SPME as there are several aspects that need consideration such as the linear range
of detection and competition effects on the fibre can lead to biases in quantitative determinations
(26). Selection of the optimal fibre can negate some of these effects.
Other sample preparation techniques that could be used include purge and trap, solvent extractions
with direct injection or headspace. These techniques can be used along with the introduction of
internal standards to the sample to monitor extraction efficiency. The purpose of the analysis is to
screen for changes in the volatile compound profile rather than quantitate exact quantities.
There are two options when extracting analytes using SPME: the first is headspace extraction where
the fibre is exposed to the volatiles in the gas phase above the sample; the other is liquid phase
extraction where the fibre is directly exposed to the analytes in the liquid sample. As the samples in
this study were predominantly fat, a liquid based extraction would result in the fibre being covered
in fat when introduced into the injection port creating contamination of the column. The best choice
was therefore to use a headspace extraction where the volatiles are the only part of the matrix in
contact with the SPME fibre.

40 | P a g e A n g e l a E . N e w t o n
The size of the sample determines the total quantity of any analyte available to equilibrate into the
headspace and then the fibre. A smaller sample has a lower quantity and a larger sample has a
higher quantity of analyte. A smaller sample and therefore lower quantity of analyte is less likely to
generate competition on the fibre; however, a larger sample can provide a more representative
sample of the bulk.
For this analysis a method using SPME for the sample preparation was chosen since it could be
automated and introduce analytes directly from the sample to the GCMS column without extra
handling steps. Due to the variety of compounds being detected within the samples and the
requirement to monitor many of them over the course of the study a quantitative detection method
was not feasible. This method was adapted from one previously developed in-house (29).
2.3 Standard samples
For the purposes of this study, a qualitative screening method was required for a variety of Maillard
reaction compounds. Internal standards or standard curves were not used for this study as there
was a wide range of compounds to be monitored. An internal standard would have been difficult to
accurately add to each sample after cooking and generation of standard curves for each monitored
compound would be time consuming. However a check on the system functionality was required
along with a sample for optimising the system. A commercial ghee sample made by Fonterra, dairy
flavour concentrate (DF300) and blank vials were used for the system checks.
2.3.1 Blank vials
Blank vials served the purpose of a control for system contamination. A blank sample should contain
only peaks that are attributed to volatile compounds on the fibre as shown in figure 2.1. Any sample
carry over would highlight a need to change the fibre, indicating that the extraction/desorption
process was not optimal or that the system was overloaded. The blank sample also conditioned the
fibre to remove any adsorbed volatile compounds from the lab environment.

41 | P a g e A n g e l a E . N e w t o n
Figure 2.1 A typical chromatogram from a blank vial run using the optimised method (chapter 8
section 2.5).
The intensity of the silane compounds detected in the analysed samples fluctuated greatly, this
fluctuation could be due to the preferential desorption of analytes from the fibre over desorption of
the silanes. This fluctuation can be seen when the peaks at 7 and 10 minutes in figure 2.1 are
compared with those detected at the same times in figure 2.2. It is also possible that any silanes
likely to desorb from the fibre are desorbed when the blank sample is run and therefore a lower
quantity of silanes are present to desorb when subsequent samples are analysed used the fibre.
2.3.2 Dairy flavour concentrate
Dairy flavour concentrate (DF300) is a commercial ghee product (chapter 8, section 8.2.2) and was
used as a reference material at the start and end of each run to check that the system was working
correctly. Samples were also run in the middle of large batches as a system check during the batch
analysis. A typical chromatogram of DF300 is shown in figure 2.2 which shows that the sample
contains a range of Maillard reaction compounds, methyl ketones, acids and silanes from the fibre.
5.0 10.0 15.0 20.0 25.0 30.0 35.0 40.0 45.0 50.0 55.0 60.0
0.00
0.25
0.50
0.75
1.00
1.25
1.50
1.75
2.00(x1,000,000)
Time (minutes)
Inte
nsi
ty

42 | P a g e A n g e l a E . N e w t o n
Figure 2.2 A typical DF300 chromatogram run using the optimised method (chapter 8 section
2.5).
2.4 Gas chromatography optimisation
2.4.1 Column selection
The compounds that are commonly associated with ghee and related dairy products such as maltol,
furfural, and HMF have varying degrees of acidity, are polar and are volatile with a range of boiling
points. This suggested that a polar column would be suitable for the analysis of these volatile organic
compounds. Most publications dealing with the analysis of the Maillard compounds, both in ghee
and model systems, use a ‘wax’ type stationary phase in the column (2, 13).
The column used on the instrument was an EC-Wax column made by Grace (Part no. 19655). The EC-
Wax column is commonly used for analysis of fatty acid methyl esters (FAMEs), polar solvents,
alcohols, flavours, fragrances, glycols and aromatic compounds (30). The stationary phase of the
column is 100% polyethylene glycol, the structure is shown in figure 2.3 (30).
H
O
O
H
n Polyethylene glycol stationary phase
Figure 2.3 The stationary phase of the EC-Wax column: Polyethylene glycol (31).
The dimensions of the column relate to the phase thickness, internal diameter of the column and the
length of the column. The chosen column was a 30 metre long column that had an internal diameter
5.0 10.0 15.0 20.0 25.0 30.0 35.0 40.0 45.0 50.0 55.0 60.0 65.0
0.00
0.25
0.50
0.75
1.00
1.25
1.50
1.75
(x1,000,000)
Time (minutes)
Inte
nsi
ty

43 | P a g e A n g e l a E . N e w t o n
of 0.25 mm with a film thickness of 0.25 µm. Each of these parameters has the ability to change the
efficiency, capacity, resolution, and retention of analytes on the column. The dimensions of the
column used were fairly typical dimensions that provide good resolution although the column had a
smaller sample capacity than thicker film columns (32). The narrow diameter of such columns
coupled with the thin and evenly distributed stationary phase provides fast mass transfer of analytes
between the stationary and mobile phases. The low flow rate was also suitable for the coupling with
mass spectrometers (32).
2.4.2 Temperature gradient
An isothermal method would not be suitable for analysis of ghee as there are a large number of
analytes to be separated and a lengthy analysis time is undesirable as the peaks will broaden. A
temperature gradient allows a greater number compounds to be separated in a shorter amount of
time. The initial starting temperature for the column was 50 °C. The minimum column temperature
is 40 °C (32); below this temperature the stationary phase (polyethylene glycol) will be frozen. A
starting temperature of 50 °C ensures the stationary phase is liquid. The final temperature must
remain below the maximum temperature limit for the column of 280 °C. However, the temperature
also needs to be high enough to elute all of the compounds from the column. Preliminary sample
runs demonstrated that with a final temperature of 220 °C there was no carryover of slow eluting
compounds into the next sample run.
Using the start (50 °C) and end (220 °C) temperatures, a series of constant slope gradients were run.
The runs ranged from temperature increases of 1 °Cmin-1 up to 6 °Cmin-1. There was a 5 min hold
time at 50 °C and again at 220 °C; these holds were applied to allow the compounds time to separate
out before being forced along the column by increasing temperatures, and finally to ensure all
compounds had eluted from the column before the start of the next run. Experimental details can be
found in chapter 8, section 8.2.6.
At 1 °Cmin-1 (figure 2.4) the time taken to run the sample was considered too long for use as a high
throughput method and the quality of chromatogram was low, there were also large tailing peaks
coming out at the end of the run. The temperature gradient was increased incrementally by 1 °Cmin-
1 up to a gradient of 6 °Cmin-1 (figure 2.5). At a gradient of 6 °Cmin-1 the analytes eluted from the
column six times faster and as such there was a lack of separation across the entire chromatogram.
Although compounds can be separated using mass spectrometry techniques, it was preferable to
separate the compounds using chromatography.

44 | P a g e A n g e l a E . N e w t o n
Figure 2.4 Temperature gradient set at 1 °Cmin-1.
Figure 2.5 Temperature gradient set at 6 °Cmin-1.
It was found that the optimum gradient was between 3 °Cmin-1 and 4 °Cmin-1 after considering the
time for separation and the peak resolution achieved. By incrementally increasing the gradient at
0.25 °Cmin-1 from 3 °Cmin-1 to 4 °Cmin-1 the chromatogram in figure 2.6 was achieved when the
gradient was 3.25 °Cmin-1 .
25.0 50.0 75.0 100.0 125.0 150.0 175.00.00
0.25
0.50
0.75
1.00
1.25
(x1,000,000)
2.5 5.0 7.5 10.0 12.5 15.0 17.5 20.0 22.5 25.0 27.5 30.0 32.5 35.0 37.50.00
0.25
0.50
0.75
1.00
1.25
1.50
1.75
2.00
2.25
2.50
(x1,000,000)
Time (minutes)
Inte
nsi
ty
Time (minutes)
Inte
nsi
ty
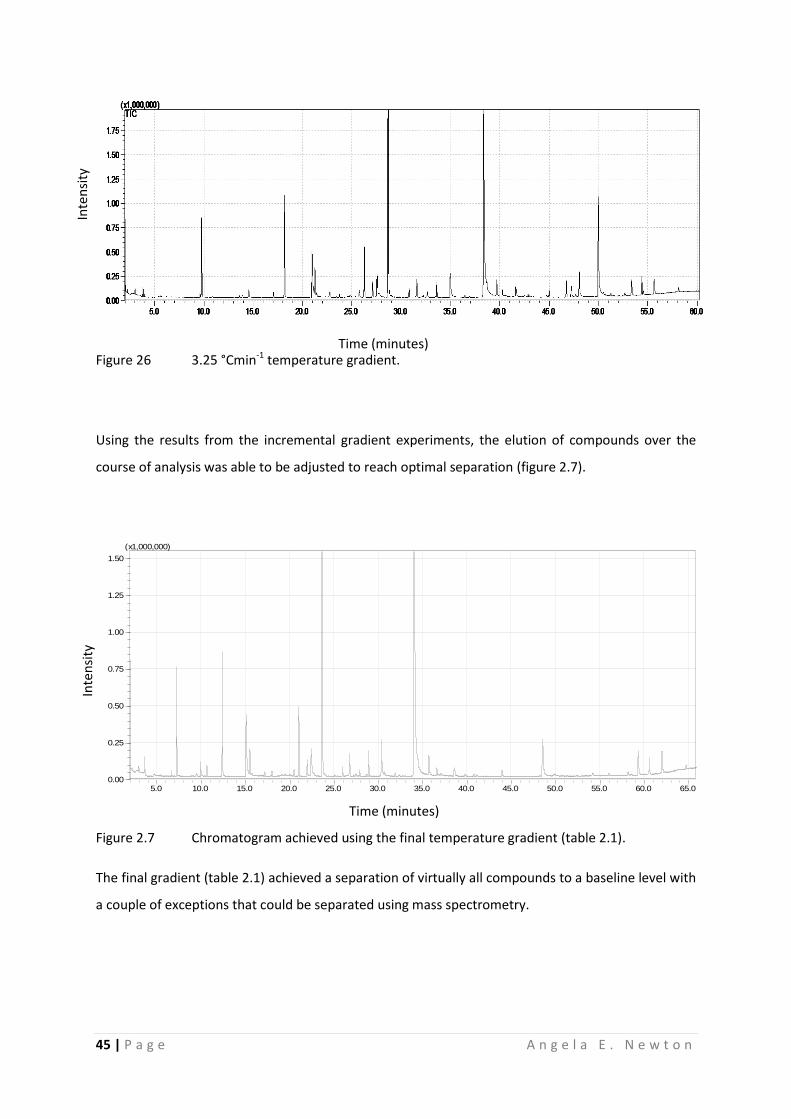
45 | P a g e A n g e l a E . N e w t o n
Figure 26 3.25 °Cmin-1 temperature gradient.
Using the results from the incremental gradient experiments, the elution of compounds over the
course of analysis was able to be adjusted to reach optimal separation (figure 2.7).
Figure 2.7 Chromatogram achieved using the final temperature gradient (table 2.1).
The final gradient (table 2.1) achieved a separation of virtually all compounds to a baseline level with
a couple of exceptions that could be separated using mass spectrometry.
5.0 10.0 15.0 20.0 25.0 30.0 35.0 40.0 45.0 50.0 55.0 60.0 65.00.00
0.25
0.50
0.75
1.00
1.25
1.50
(x1,000,000)
Time (minutes)
Inte
nsi
ty
Time (minutes)
Inte
nsi
ty

46 | P a g e A n g e l a E . N e w t o n
Table 2.1 Final temperature profile of GC column
Initial temperature (°C) Final Temperature (°C) Rate of change (°Cmin-1
) Hold time (min)
50 50 0 2
50 95 6 0
95 95 0 5
95 150 3.25 0
150 170 1 0
170 220 4 0
220 220 0 2
2.4.3 Instrument parameters
The compounds are desorbed from the SPME fibre in the injection port and swept onto the column
by the carrier gas (helium in this case). The temperature in the injection port needs to be hot enough
to volatilise all of the compounds as any that are not volatilised at this point will collect on the front
of the column and in the glass liner as impurities. The injection port temperature is also the
temperature at which the compounds are desorbed from the SPME fibre. The injection temperature
of the method was selected as 220 °C. The injection temperature is required to be high enough that
the analytes are desorbed from the SPME fibre and remain volatile as they are swept onto the
column (33, 34). The injection mode can either be split so that only a portion of the volatiles are
swept onto the column or splitless where all of the volatiles are swept off the fibre and directly onto
the column (35). A split ratio was chosen depending on the amount of analytes present on the fibre
and the response factors of these compounds to avoid column overloading whilst still having enough
of the analytes to achieve a representative chromatogram.
The initially selected parameters were an injection temperature of 220 °C and a split injection with a
ratio of 1:10. Three split valve settings were investigated: splitless, split ratio of 1:10 and split ratio
of 1:100. Figures 2.8 – 2.10 show the results of the same DF300 sample run at these three different
split conditions. After running the variations the decision was to leave the split ratio at 1:10 and the
injection temperature at 220 °C.

47 | P a g e A n g e l a E . N e w t o n
Figure 2.8 The oval marked A denotes overloading of the column as a result of a splitless
injection.
Figure 2.9 Split injection with a 1:10 ratio.
Using the splitless injection ratio 100% of the analytes desorbed from the SPME fibre were
introduced on to the column for separation. The large quantity of analytes eluting at ~33-36 minutes
overloaded the column and generated a response that was outside of the mass spectrometer
detection limits. This was evident by the sudden decrease and increase in peak intensity
accompanied by a gap in the peak where the intensity was zero, this is highlighted with an oval
marked A in figure 2.8. The split injection with a ratio of 1:10 (figure 2.9) provided an improvement
in chromatogram quality relative to the splitless injection (figure 2.8). The peaks were sharper along
with a smoother baseline, less peak tailing and the detector was not overloaded. However, a further
25.0 27.5 30.0 32.5 35.0 37.5 40.0 42.5 45.00.0
1.0
2.0
3.0
4.0
5.0
6.0
7.0
8.0
9.0
(x100,000)
25.0 27.5 30.0 32.5 35.0 37.5 40.0 42.5 45.00.0
1.0
2.0
3.0
4.0
5.0
6.0
7.0
8.0
9.0
(x100,000)
A
Time (minutes)
Inte
nsi
ty
Time (minutes)
Inte
nsi
ty

48 | P a g e A n g e l a E . N e w t o n
reduction in the split ratio to 1:100 (figure 2.10) meant that not enough of the analyte was loaded
onto the column leading to small peaks that were sometimes lost in the baseline noise.
Figure 2.10 Split injection with a 1:100 ratio.
Although there are various options for a carrier gas, the GCMS instrument was already set up with
helium as the carrier gas and it was not thought that there was any analytical advantage to be
gained by changing this.
2.5 Solid phase microextraction (SPME) optimisation
After selection of a suitable SPME fibre there are two steps that are carried out during SPME: the
solute adsorption from the sample matrix onto the fibre and the transfer of these analytes
(desorption) in the injection port both of steps were considered during the optimisation.
2.5.1 SPME fibre selection
The role of the fibre is to collect the volatile compounds from the sample, and then retain those
compounds until they are desorbed in the injection port. The fibre must be selected for the
compounds to be extracted from the headspace. Fibres have a range of coatings each with different
polarities ranging from non-polar to polar. For some compounds, such as many Maillard reaction
compounds, that may have mixed polarity and mixed volatility a
polydimethysiloxane/divinylbenzene (PDMS/DVB) fibre is suitable and can be used for the extraction
of compounds with a molecular mass range of 50-300 Da. The thickness of the fibre coating
25.0 27.5 30.0 32.5 35.0 37.5 40.0 42.5 45.00.0
1.0
2.0
3.0
4.0
5.0
6.0
7.0
8.0
9.0
(x100,000)
Time (minutes)
Inte
nsi
ty
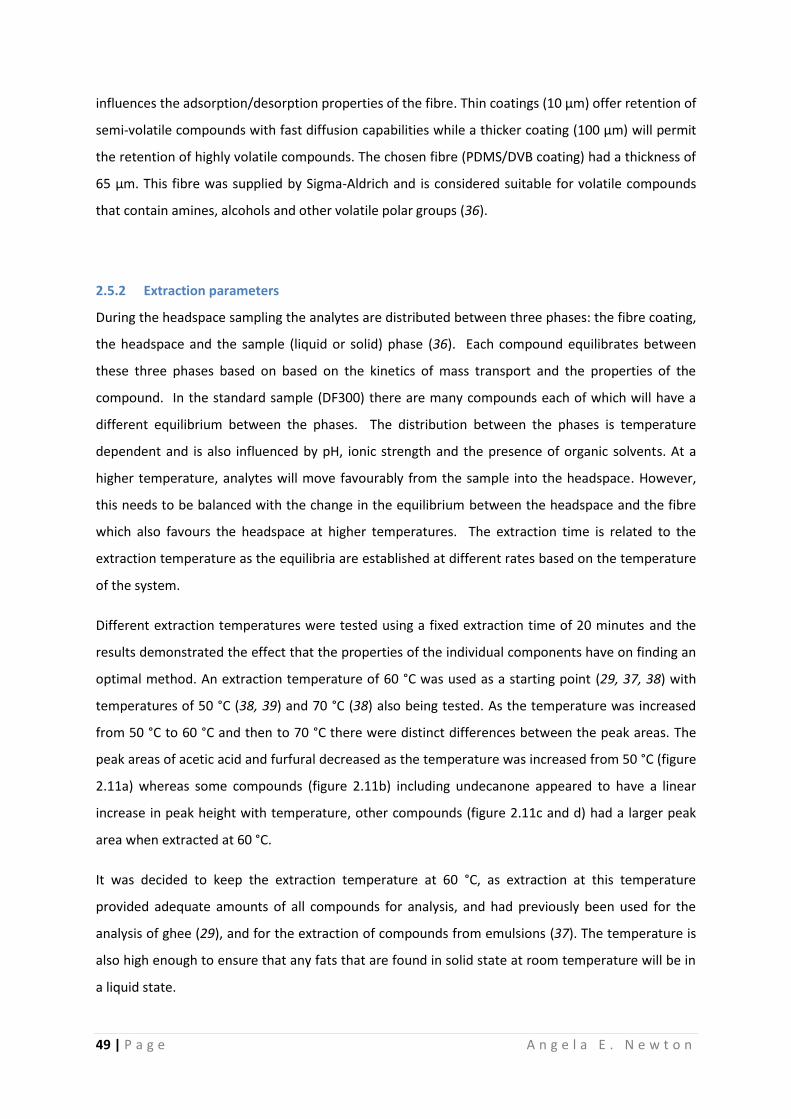
49 | P a g e A n g e l a E . N e w t o n
influences the adsorption/desorption properties of the fibre. Thin coatings (10 µm) offer retention of
semi-volatile compounds with fast diffusion capabilities while a thicker coating (100 µm) will permit
the retention of highly volatile compounds. The chosen fibre (PDMS/DVB coating) had a thickness of
65 µm. This fibre was supplied by Sigma-Aldrich and is considered suitable for volatile compounds
that contain amines, alcohols and other volatile polar groups (36).
2.5.2 Extraction parameters
During the headspace sampling the analytes are distributed between three phases: the fibre coating,
the headspace and the sample (liquid or solid) phase (36). Each compound equilibrates between
these three phases based on based on the kinetics of mass transport and the properties of the
compound. In the standard sample (DF300) there are many compounds each of which will have a
different equilibrium between the phases. The distribution between the phases is temperature
dependent and is also influenced by pH, ionic strength and the presence of organic solvents. At a
higher temperature, analytes will move favourably from the sample into the headspace. However,
this needs to be balanced with the change in the equilibrium between the headspace and the fibre
which also favours the headspace at higher temperatures. The extraction time is related to the
extraction temperature as the equilibria are established at different rates based on the temperature
of the system.
Different extraction temperatures were tested using a fixed extraction time of 20 minutes and the
results demonstrated the effect that the properties of the individual components have on finding an
optimal method. An extraction temperature of 60 °C was used as a starting point (29, 37, 38) with
temperatures of 50 °C (38, 39) and 70 °C (38) also being tested. As the temperature was increased
from 50 °C to 60 °C and then to 70 °C there were distinct differences between the peak areas. The
peak areas of acetic acid and furfural decreased as the temperature was increased from 50 °C (figure
2.11a) whereas some compounds (figure 2.11b) including undecanone appeared to have a linear
increase in peak height with temperature, other compounds (figure 2.11c and d) had a larger peak
area when extracted at 60 °C.
It was decided to keep the extraction temperature at 60 °C, as extraction at this temperature
provided adequate amounts of all compounds for analysis, and had previously been used for the
analysis of ghee (29), and for the extraction of compounds from emulsions (37). The temperature is
also high enough to ensure that any fats that are found in solid state at room temperature will be in
a liquid state.

50 | P a g e A n g e l a E . N e w t o n
Figure 2.11 Influence of extraction temperature on selected DF300 compounds: A, acetic acid
(left) and furfural (right); B, undecanone (21 minutes); C, hexanoic acid; D, maltol. Black, 50 °C; blue,
60 °C; pink = 70 °C.
The extraction time used to investigate the influence of changing extraction temperature was 20
minutes. The extraction time was varied to include three time points (chapter 8, section 8.2.6.4) of
10, 20 and 30 minutes (29, 38) using the optimised temperature of 60 °C. Reducing the extraction
time to 10 minutes decreased the amount of many compounds that were extracted with the
exception of acetic acid and furfural (figure 2.12). On the other hand, increasing the extraction time
to 30 minutes increased the extracted amount of only a few compounds such as undecanone (figure
2.12). The decision was made to utilise the 20 minute extraction time.
14.25 14.50 14.75 15.00 15.25 15.50 15.75 16.00 16.25 16.500.0
0.5
1.0
1.5
2.0
2.5
3.0
3.5
4.0
4.5
5.0
5.5
(x100,000)
19.75 20.00 20.25 20.50 20.75 21.00 21.25 21.50 21.75 22.000.0
1.0
2.0
3.0
4.0
5.0
6.0
7.0
8.0
9.0(x100,000)
29.25 29.50 29.75 30.00 30.25 30.50 30.75 31.00 31.25 31.500.0
0.5
1.0
1.5
2.0
2.5
3.0
3.5
(x100,000)
32.0 33.0 34.0 35.0 36.0 37.0 38.00.0
0.5
1.0
1.5
2.0
2.5
3.0
(x1,000,000)
A B
C D
Time (minutes)
Inte
nsi
ty

51 | P a g e A n g e l a E . N e w t o n
Figure 2.12 Influence of extraction time on selected DF300 compounds: A, acetic acid (left) and
furfural (right); B, undecanone (21 minutes); C, hexanoic acid; D, maltol. Black, 10 minutes; pink, 20
minutes; blue, 30 minutes.
Given sufficient time to test a wider range of time/temperature combinations it may have been
possible to achieve a more optimal system. However, the result achieved using the 20 minute
extraction at 60 °C was deemed suitable for this work which centred on the analysis of a wide range
of compounds at a range of different concentrations.
2.5 Mass spectrometry
Mass spectrometry requires a gaseous sample of high temperature to be introduced into the
ionisation chamber. The ionisation technique used in this instrument is electron ionisation (EI). High
voltage electrons are accelerated as a beam (70 eV) into the gaseous analyte molecules; this can
impart enough energy to generate a charged molecule, or ion, by the removal of an electron. The
energy and instability of the molecular ion can lead to fragmentation in a repeatable pattern.
Molecular ions will fragment in the same pattern under the same conditions. These charged
fragments then pass through the mass analyser. The sampling rates (Hz) were 0.5 (scan) and 0.2
(single ion monitoring, SIM) with the mass range being sampled between 40 and 350 Daltons. All of
the volatile compounds likely to be found in ghee and any model samples are small molecules with a
14.8 14.9 15.0 15.1 15.2 15.3 15.4 15.5 15.6 15.7 15.80.0
0.5
1.0
1.5
2.0
2.5
3.0
3.5
4.0
4.5
5.0
5.5
(x100,000)
20.00 20.25 20.50 20.75 21.00 21.25 21.50 21.75 22.000.0
1.0
2.0
3.0
4.0
5.0
6.0
7.0
8.0
(x100,000)
29.75 30.00 30.25 30.50 30.75 31.000.0
0.5
1.0
1.5
2.0
2.5
3.0
3.5
4.0
4.5
5.0
5.5
(x100,000)
31.5 32.0 32.5 33.0 33.5 34.0 34.5 35.0 35.5 36.0 36.5 37.00.00
0.25
0.50
0.75
1.00
1.25
1.50
1.75
2.00
2.25
2.50
2.75
3.00
(x1,000,000)
D C
B A
Time (minutes)
Inte
nsi
ty

52 | P a g e A n g e l a E . N e w t o n
molecular mass below 350 Da. The interface between the GC column and the mass spectrometer
was set at 230 °C and the ion source temperature at 200 °C. These temperatures ensure that there
was no condensation of volatile compounds inside the mass spectrometer. The MS conditions used
were taken from a method previously developed at Fonterra (29).
2.6 Data analysis
This project was concerned with changes that occurred in flavour formation when the matrix of the
sample being cooked was changed; as such there was no requirement to know the absolute quantity
of a compound present. The absolute quantities of any particular compound are not as important as
the relative changes in formation of compounds in one matrix as compared with another e.g., an
aqueous matrix versus an emulsion matrix. Studies that have used quantitative methods for ghee
analysis were primarily concerned with the quantity of each measured compound in certain types of
ghee (2, 13). Of course, the use of external or internal standards for any compounds that are of
particular interest could allow most methods to become quantifiable with either internal or external
standards.
2.7 Compound identification
The Wiley compound library (Wiley 7) was used for tentative identification of peaks in the mass
spectrum of each sample. These identifications were based on comparisons made to reference
spectra in the library. Throughout this work the peaks of interest were identified using this
identification system. A range of compounds were identified in the DF300 chromatogram including
Maillard reaction products, methyl ketones, acids and silane compounds derived from the fibre
(figure 2.13).
The range of compounds present in each sample includes Maillard (and caramelisation) reaction
compounds plus compounds from the fats. Maillard reaction compounds were the compounds that
were of most interest for this thesis. Based on the peak picking (figure 2.13) a group of eleven
compounds were selected for tracking throughout the rest of the experiments (table 2.2).
Monitoring of all the compounds was still carried out but these eleven compounds were the main
focus since they have a range of flavour attributes (40) (table 2.2) and are formed by a variety of
mechanistic pathways.

53 | P a g e A n g e l a E . N e w t o n
Table 2.2 Compounds identified in DF300 samples and chosen for monitoring
Name Structure Flavour
Acetic acid
CAS: 64-19-7
OH
O
vinegar, acidic
Furfural
CAS: 98-01-1 O
H
O
caramel, almond, sweet
2-Acetylfuran
CAS: 1192-62-7 O
O
sweet, nutty
Butyrolactone
Dihydro-2(3H)-furanone
CAS: 96-48-0
O O
milky, creamy, slightly fruity
Furfuryl alcohol
CAS: 98-00-1
O
OH
burnt, sweet, caramel, bitter
2(5H)-Furanone
CAS: 497-23-4
O O
buttery
Maltol
CAS: 118-71-8
O
OH
O
malt, cocoa, caramel, sweet, fruity
2-Acetylpyrrole
CAS: 1072-83-9 HN
O
sweet, tea, nutty
Hydroxymaltol
2,3-Dihydro-3,5-dihydroxy-6-methyl-
4H-pyranone
CAS: 28564-83-2 O
O
HO OH
caramel, burnt sugar
Hydroxymethylfurfural
HMF
CAS: 67-47-0
O
O
HO
buttery, caramel, bitter
Dihydro-4-hydroxy-2(3H)-furanone
DHHF
CAS: 5469-16-9
O
OH
O
None found

54 | P a g e A n g e l a E . N e w t o n
Figure 2.13 Labelled chromatogram of DF300 (not all peaks are labelled) *indicates a peak in the blank due to the SPME fibre.
5.0 10.0 15.0 20.0 25.0 30.0 35.0 40.0 45.0 50.0 55.0 60.0 65.0 0.00
0.25
0.50
0.75
1.00
1.25
(x1,000,000)
5-D
eca
no
lide
*
*
2-H
epta
no
ne
Met
hyl
hep
tyl
keto
ne
Ace
tic
acid
Fu
rfu
ral
*
* *
*
2-U
nd
eca
no
ne
Bu
tan
oic
aci
d
Furf
ury
l alc
oh
ol
2(5
H)-
Fura
no
ne
Met
hyl
un
dec
yl k
eto
ne
Hex
ano
ic a
cid
Mal
tol
2-A
cety
lpyr
role
2-A
cety
lfu
ran
2-P
enta
dec
ano
ne
Oct
ano
ic a
cid
Hyd
roxy
mal
tol
HM
F
Dih
ydro
-4-h
ydro
xy-2
(3H
)-fu
ran
on
e
Bu
tyro
lact
on
e
Time (minutes)
Inte
nsi
ty

55 | P a g e A n g e l a E . N e w t o n
2.8 Reproducibility and repeatability
The reproducibility of analytical methods using SPME extraction techniques are not as high as when
other techniques are used to introduce the analytes to the GC column. The repeatability was tested
by triplicate analysis of the same DF300 vial (figure 2.14) and the reproducibility of multiple samples
was tested across different days (figure 2.15).
Analysis of the same DF300 vial multiple times (figure 2.14) had a residual standard deviation of
<20% across all 11 compounds whilst analysis of multiple DF300 samples across different days had a
higher residual standard deviation of up to 50%; although most compounds fell below 30%.
Attempts were made to minimise the residual standard deviation by increasing the sample size,
adding buffer solutions to alter the pH, altering the SPME extraction and desorption conditions. This
demonstrates the need to run control samples for each experiment and randomise sample analysis
for large sample sets. Samples run on different days will be more difficult to compare due to the
lower degree of reproducibility; however, a set of samples run on the same day can be compared
with a greater degree of confidence in the differences.
Figure 2.14 Triplicate analysis of a DF300 sample. Error bars represent the standard deviation of
the triplicate measurements.
0
500,000
1,000,000
1,500,000
2,000,000
2,500,000
3,000,000
3,500,000
4,000,000
4,500,000
Pe
ak a
rea
Reaction compounds

56 | P a g e A n g e l a E . N e w t o n
Figure 2.15 Averages of triplicate DF300 samples measured on different days using different
DF300 samples each day. Error bars represent the standard deviation of the replicate
measurements.
The repeatability of compound retention times was also measured and found that retention times
were highly reproducible with a small standard deviation (table 2.3).
Table 2.3 Repeatability of retention times for a DF300 sample analysed in triplicate.
Sample
Acetic
Acid Furfural 2-Acetylfuran Butyrolactone
Furfuryl
alcohol 2(5H)-Furanone Maltol 2-Acetylpyrrole Hydroxymaltol HMF DHHF
1 15.03 15.50 17.18 21.98 23.65 26.75 34.04 34.46 48.54 59.32 61.99
2 15.03 15.50 17.18 21.98 23.65 26.75 34.04 34.46 48.54 59.32 61.99
3 15.03 15.50 17.18 21.98 23.65 26.75 34.04 34.46 48.54 59.32 61.99
Average 15.03 15.50 17.18 21.98 23.65 26.75 34.04 34.46 48.54 59.32 61.99
Standard
deviation 0.00 0.00 0.00 0.00 0.00 0.00 0.00 0.00 0.00 0.00 0.00
%RSD 0.00 0.00 0.00 0.00 0.00 0.00 0.00 0.00 0.00 0.00 0.00
2.9 Error Calculations
Error bars used on all graphs are based on the standard deviation of replicate samples.
0
1,000,000
2,000,000
3,000,000
4,000,000
5,000,000
6,000,000
7,000,000
8,000,000P
eak
are
a
Reaction compounds

57 | P a g e A n g e l a E . N e w t o n
2.11 Matrix interference
There are various matrix factors, such as pH and the amount of fat present that can affect the final
result when analysing for volatile compounds. The headspace GC analysis relies on partitioning of
volatile compounds into the gas phase so that when the SPME fibre is exposed the volatiles adsorb
onto the surface in an equilibrium between the gas phase and the fibre. However, some matrix
components change the partition coefficients, which results in a change in the equilibrium between
the sample phase and the gas phase (41).
Liquid extractions can also be used to isolate the compound of interest. However, this method is still
prone to matrix effects. Liquid extraction is done by extracting the compounds of interest into
another solvent – often a non-polar solvent like diethyl ether, which can then be directly injected
onto the column. Caution needs to be taken as this method can cause contamination of the column
and injection port if the extraction is not done cleanly. Care needs to be taken particularly with food
system samples as they can contain proteins and other non-volatile compounds which can
contaminate the column and lead to artefacts.
If two samples have different matrices e.g. if one contains fat and the other does not, but the
samples contain the same quantity of a specific analyte there will still be a difference in the partition
coefficients of the two samples which will result in differences in final analytical results. Therefore all
of the samples in this thesis were matrix matched to ensure analytes were being extracted for
analysis from the same matrix regardless of the initial sample matrix by the addition of fat to the
aqueous samples after cooking. The samples had either canola oil or AMF added depending on the
experiment being carried out. There was no difference in results when using different fats for the
analysis of the caramelisation (figure 2.16) or the Maillard reactions (figure 2.17).
The protonation state of a compound can affect its partition coefficient. At different sample pH a
compound can have a different protonation state meaning that a salt form of the compound may
not be as volatile as its acid or neutral form or may not be volatile at all. The molecules will form an
equilibrium between the acid, neutral and salt forms, the favourable direction of the equilibrium
depends on the pH of the solution. Cooking cream and the reaction model systems resulted in pH
values of 4-5 and this pH was consistently achieved by the final samples. Samples that are analysed
at different stages of the cooking time from 2 minutes up to the 20 minute final cook time had pH
values below pH 7. The pH of these samples was not adjusted prior to analysis.
The ability to compare the aqueous model samples with the cream samples was crucial to this work
and therefore this matrix effect needed to be overcome. Other influences on the matrix could be

58 | P a g e A n g e l a E . N e w t o n
components that were added to the system such as salts (including buffers) and emulsifiers added to
generate emulsions. The addition of these components to samples of DF300 indicated that there
were no significant differences when compared with original DF300 samples. The additional
components were tested for interference at two levels: at the level of addition and a level 2-5x
higher, depending on the additive.
Figure 2.16 The influence of different fats on the analysis of aqueous caramelisation reaction
samples. The error bars represent the standard deviation of replicate samples. The samples that
were matrix matched with AMF are shown in blue while those matched with canola oil are shown in
red.
Figure 2.17 The influence of different fats on the analysis of aqueous Maillard reaction samples.
The error bars represent the standard deviation of replicate samples. The samples that were matrix
matched with AMF are shown in blue while those matched with canola oil are shown in red.
0
5,000
10,000
15,000
20,000
25,000
30,000
Pe
ak a
rea
Reaction compounds
0
50,000
100,000
150,000
200,000
250,000
Pe
ak a
rea
Reaction compounds

59 | P a g e A n g e l a E . N e w t o n
2.18 The influence of PGPR on the analysis of DF300. The DF300 samples containing 3% (blue),
1.5% (red) or 0% (green) PGPR with error bars representing the standard deviation of replicate
samples.
The addition of PGPR to DF300 at both 1.5% (experimental level) and at 3% (excess PGPR) did not
cause any significant changes to the analysis of the volatile compounds. PGPR is an emulsifier that
will be used for the generation of w/o emulsion structure. There is a chance that the PGPR could
react with the model system components or that the presence of the PGPR could alter the
partitioning of the volatile compounds between the samples, the headspace and the fibre. These
results (figure 2.18) suggest that any differences seen in the formation of volatile compounds when
PGPR is added will be due to reactions occurring rather than interference of the PGPR with the
partitioning of the volatile compounds. The same scenario could happen with the addition of the
o/w emulsifier Tween 60 (figure 2.19); the results indicate that there will be no interference with the
analysis of the volatile compounds. This does not rule out the possibility that the Tween 60 can
participate in the reactions.
It is expected that the addition of sodium chloride (NaCl) and sodium phosphate buffers could
influence the Maillard and caramelisation reactions when added to a model reaction system. The
addition of these salts could also interfere with the analysis by altering the partitioning of the
volatile compounds between the sample, headspace and fibre. The addition of NaCl (figure 2.20)
leads to some small changes in the levels of detected volatile compounds; however, the changes are
smaller than the calculated error and therefore unlikely to be significant. The sodium phosphate
buffer (figure 2.21) generated similar small changes in the results when DF300 containing the buffer
0
1,000,000
2,000,000
3,000,000
4,000,000
5,000,000
6,000,000
7,000,000
8,000,000P
eak
are
a
Reaction compounds

60 | P a g e A n g e l a E . N e w t o n
was analysed and it was concluded that the presence of the buffer was not causing any interference
with the analytical method. Any differences in the formation of volatile compounds seen when
comparing results of samples cooked with and without NaCl or sodium phosphate buffer can be
assumed to be generated through the participation of NaCl or sodium phosphate buffer in the
Maillard and caramelisation reactions as there is no significant interference of these components in
the analysis.
Figure 2.19 The influence of Tween 60 on the analysis of DF300. The DF300 samples have 3%
(red), 1.5% (blue) or 0% (green). Tween 60 with error bars representing the standard deviation of
replicate samples.
Figure 2.20 The influence of sodium chloride on the analysis of DF300. The samples of DF300
contain 10% (green), 5% (red) and 0% (purple) sodium chloride with error bars representing the
standard deviation of replicate samples.
0
1,000,000
2,000,000
3,000,000
4,000,000
5,000,000
6,000,000
7,000,000
Pe
ak a
rea
Reaction compounds
01,000,0002,000,0003,000,0004,000,0005,000,0006,000,0007,000,0008,000,000
Pea
k ar
ea
Reaction compounds
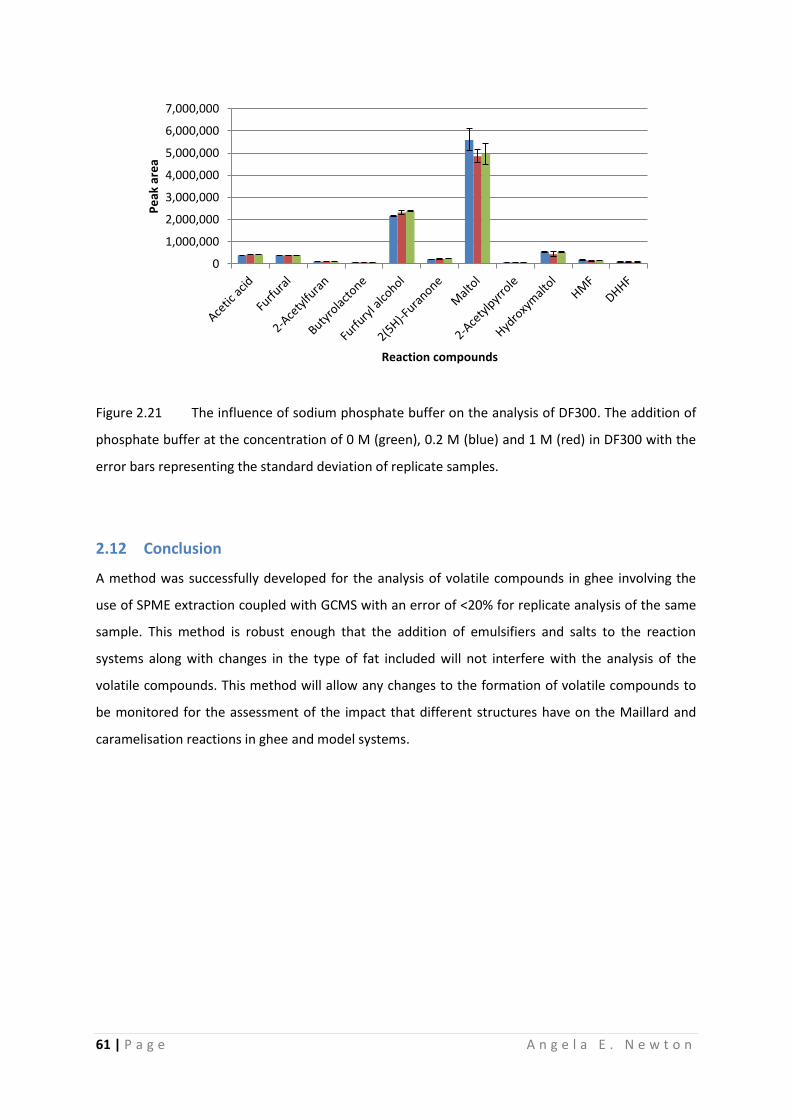
61 | P a g e A n g e l a E . N e w t o n
Figure 2.21 The influence of sodium phosphate buffer on the analysis of DF300. The addition of
phosphate buffer at the concentration of 0 M (green), 0.2 M (blue) and 1 M (red) in DF300 with the
error bars representing the standard deviation of replicate samples.
2.12 Conclusion
A method was successfully developed for the analysis of volatile compounds in ghee involving the
use of SPME extraction coupled with GCMS with an error of <20% for replicate analysis of the same
sample. This method is robust enough that the addition of emulsifiers and salts to the reaction
systems along with changes in the type of fat included will not interfere with the analysis of the
volatile compounds. This method will allow any changes to the formation of volatile compounds to
be monitored for the assessment of the impact that different structures have on the Maillard and
caramelisation reactions in ghee and model systems.
0
1,000,000
2,000,000
3,000,000
4,000,000
5,000,000
6,000,000
7,000,000
Pe
ak a
rea
Reaction compounds

62 | P a g e A n g e l a E . N e w t o n
2.13 References
1. Yasuhara, A.; Tanaka, Y.; Hengel, M.; Shibamoto, T., Gas chromatographic investigation of acrylamide formation in browning model systems. Journal of Agricultural and Food Chemistry 2003, 51, 3999-4003.
2. Wadodkar, U. R.; Punjrath, J. S.; Shah, A. C., Evaluation of volatile compounds in different types of ghee using direct injection with gas chromatography-mass spectrometry. Journal of Dairy Research 2002, 69, 163-171.
3. Nursten, H. E., The flavour of milk and dairy products. 1. Milk of different kinds, milk powder, butter and cream. International Journal of Dairy Technology 1997, 50, 48-56.
4. Contarini, G.; Povolo, M.; Leardi, R.; Toppino, P. M., Influence of heat treatment on the volatile compounds of milk. Journal of Agricultural and Food Chemistry 1997, 45, 3171-3177.
5. Philippe, E.; Seuvre, A. M.; Colas, B.; Langendorff, V.; Schippa, C.; Voilley, A., Behavior of flavor compounds in model food systems: a thermodynamic study. Journal of Agricultural and Food Chemistry 2003, 51, 1393-1398.
6. Mariaca, R.; Bosset, J. O., Instrumental analysis of volatile (flavour) compounds in milk and dairy products. Lait 1997, 77, 13-40.
7. Fay, L. B.; Brevard, H., Contribution of mass spectrometry to the study of the Maillard reaction in food. Mass Spectrometry Reviews 2005, 24, 487-507.
8. Lehotay, S. J.; Hajslova, J., Application of gas chromatography in food analysis. Trac-Trends in Analytical Chemistry 2002, 21, 686-697.
9. Wang, Y. W.; McCaffrey, J.; Norwood, D. L., Recent advances in headspace gas chromatography. Journal of Liquid Chromatography and Related Technologies 2008, 31, 1823-1851.
10. Dorman, F. L.; Whiting, J. J.; Cochran, J. W.; Gardea-Torresdey, J., Gas chromatography. Analytical Chemistry 2010, 82, 4775-4785.
11. Yadav, J. S.; Srinivasan, R. A., Advances in ghee flavour research. Indian Journal of Dairy Science 1992, 45, 338-348.
12. Alonso, L.; Juarez, M.; Abd Rabou, N. S.; El-Shibiny, S., Head space analysis of volatile compounds from buffalo and ewe's Samna (ghee) and butter oil. Milchwissenschaft - Milk Science International 2002, 57, 76-78.
13. Wadodkar, U. R.; Punjrath, J. S.; Shah, A. C.; Przybylski, R., Evaluation of volatile compounds in different types of ghee using headspace with GC/MS. Milchwissenschaft - Milk Science International 2003, 58, 37-39.
14. Vauthey, S.; Milo, C.; Frossard, P.; Garti, N.; Leser, M. E.; Watzke, H. J., Structured fluids as microreactors for flavor formation by the Maillard reaction. Journal of Agricultural and Food Chemistry 2000, 48, 4808-4816.
15. Monti, S. M.; Ritieni, A.; Graziani, G.; Randazzo, G.; Mannina, L.; Segre, A. L.; Fogliano, V., LC/MS analysis and antioxidative efficiency of Maillard reaction products from a lactose-lysine model system. Journal of Agricultural and Food Chemistry 1999, 47, 1506-1513.

63 | P a g e A n g e l a E . N e w t o n
16. Rizzi, G. P., Electrochemical study of the Maillard reaction. Journal of Agricultural and Food Chemistry 2003, 51, 1728-1731.
17. Rizzi, G. P., Electrochemical aspects of the Maillard reaction and related reactions. Food Reviews International 2013, 29, 178-191.
18. Jones, A. D.; Tier, C. M.; Wilkins, J. P. G., Analysis of the Maillard reaction products of beta-lactoglobulin and lactose in skimmed milk powder by capillary electrophoresis and electrospray mass spectrometry. Journal of Chromatography A 1998, 822, 147-154.
19. Liu, X. M.; Metzger, L. E., Application of fluorescence spectroscopy for monitoring changes in nonfat dry milk during storage. Journal of Dairy Science 2007, 90, 24-37.
20. Andersen, C. M.; Mortensen, G., Fluorescence spectroscopy: A rapid tool for analyzing dairy products. Journal of Agricultural and Food Chemistry 2008, 56, 720-729.
21. Patton, S., Isolation of maltol from heated skim milk. Journal of Dairy Science 1950, 33, 102-106.
22. Ajandouz, E. H.; Tchiakpe, L. S.; Dalle Ore, F.; Benajiba, A.; Puigserver, A., Effects of pH on caramelization and Maillard reaction kinetics in fructose-lysine model systems. Journal of Food Science 2001, 66, 926-931.
23. Ajandouz, E. H.; Desseaux, V.; Tazi, S.; Puigserver, A., Effects of temperature and pH on the kinetics of caramelisation, protein cross-linking and Maillard reactions in aqueous model systems. Food Chemistry 2008, 107, 1244-1252.
24. Totlani, V. M.; Peterson, D. G., Reactivity of epicatechin in aqueous glycine and glucose Maillard reaction models: Quenching of C-2, C-3, and C-4 sugar fragments. Journal of Agricultural and Food Chemistry 2005, 53, 4130-4135.
25. Zellner, B. D.; Dugo, P.; Dugo, G.; Mondello, L., Gas chromatography-olfactometry in food flavour analysis. Journal of Chromatography A 2008, 1186, 123-143.
26. Fabre, M.; Aubry, V.; Guichard, E., Comparison of different methods: Static and dynamic headspace and solid-phase microextraction for the measurement of interactions between milk proteins and flavor compounds with an application to emulsions. Journal of Agricultural and Food Chemistry 2002, 50, 1497-1501.
27. Marsili, R. T.; Miller, N., SPME-GC/MS testing for monitoring off-flavors in processed milk: Application of odor wheel plots. In Freshness and Shelf Life of Foods, Cadwallader, K. R.; Weenen, H., Eds. ACS Publications: Washington, DC, United States of America, 2003; Vol. 836, pp 80-94.
28. Balasubramanian, S.; Panigrahi, S., Solid-phase microextraction (SPME) techniques for quality characterization of food products: A review. Food and Bioprocess Technology 2011, 4, 1-26.
29. Andrewes, P., Changes in Maillard reaction products in ghee during storage. Food Chemistry 2012, 135, 921-928.
30. DiscoverySciences, Product: GC columns. In www.discoverysciences.com, 2010; pp 216-231.
31. SigmaAldrich, Polyethylene glycol standard. In www.sigmaaldrich.com, 2013.

64 | P a g e A n g e l a E . N e w t o n
32. Supelco, GC column selection guide. In www.sigmaaldrich.com, 2013; pp 1-30.
33. Vas, G.; Vekey, K., Solid-phase microextraction: a powerful sample preparation tool prior to mass spectrometric analysis. Journal of Mass Spectrometry 2004, 39, 233-254.
34. Kataoka, H.; Lord, H. L.; Pawliszyn, J., Applications of solid-phase microextraction in food analysis. Journal of Chromatography A 2000, 880, 35-62.
35. Grob, K., Injection technology in capillary GC. Analytical Chemistry 1994, 66, A1009-A1019.
36. Stashenko, E. E.; Martinez, J. R., Sampling volatile compounds from natural products with headspace/solid-phase micro-extraction. Journal of Biochemical and Biophysical Methods 2007, 70, 235-242.
37. Miettinen, S. M.; Tuorila, H.; Piironen, V.; Vehkalahti, K.; Hyvonen, L., Effect of emulsion characteristics on the release of aroma as detected by sensory evaluation, static headspace gas chromatography, and electronic nose. Journal of Agricultural and Food Chemistry 2002, 50, 4232-4239.
38. Kim, T.; Kim, S.; Lee, K., Analysis of furan in heat-processed foods consumed in Korea using solid phase microextraction-gas chromatography/mass spectrometry (SPME-GC/MS). Food Chemistry 2010, 123, 1328-1333.
39. Lee, J. H.; Diono, R.; Kim, G. Y.; Min, D. B., Optimization of solid phase microextraction analysis for the headspace volatile compounds of Parmesan cheese. Journal of Agricultural and Food Chemistry 2003, 51, 1136-1140.
40. TheGoodScentsCompany, Flavours and fragrances. In http://www.thegoodscentscompany.com/, 2012.
41. Leksrisompong, P.; Barbano, D. M.; Foegeding, A. E.; Gerard, P.; Drake, M., The roles of fat and pH on the detection thresholds and coefficients of three compounds: Diacetyl, delta-decalactone and furaneol. Journal of Sensory Studies 2010, 25, 347-370.

65 | P a g e A n g e l a E . N e w t o n
Chapter 3 Ghee
3.1 Introduction
The discussion in this chapter focuses on traditional methods of making ghee, the adaptation of
these processes to establish a high throughput production method and the volatile compound
profiles of different ghee samples. The volatile compound profile of the ghee samples was
investigated using the GCMS method developed previously (chapter 2). External factors leading to
changes in the volatile compound profiles such as pH, time and temperature, were explored with
respect to their impact on the Maillard reaction. The central hypothesis that the colloidal structures
of cream and butter are a key factor in the volatile compound formation is then explored. Such
changes in the profile of volatile compounds in ghee offer the potential for manipulating flavour of
ghee products.
3.2 Traditional ghee cooking methods
Traditionally, cream (or milk) is fermented by warming to promote growth of intrinsic lactic acid
bacteria. Alternatively, cream is inoculated with active cultures. The cultures produce lactic acid,
souring and curdling the cream and contributing to the final flavour of the ghee (1-3). There are
several artisan methods of making indigenous ghee (figure 3.1) from the soured cream; all of which
have a common element of heating to high temperature, 110-140 °C. These different methods all
start from fermented milk, cream (often soured to 0.5-1% acidity with lactic acid), butter or a
combination of butter and buttermilk (2, 3). After the heat clarification, the remaining product is
filtered to remove any remaining solids. Whether the ghee is made by the desi (milk butter) (MB)
method, direct cream (DC) method, cream butter (CB) method or the prestratification (PS) method
(3) they all have a heat clarification step. The desi or milk butter method (3) involves fermenting the
milk for 12-16 hours using lactic acid bacteria and then churning it to make butter (plus buttermilk)
before heat clarification to evaporate the water and leave just milk fat (ghee) after filtration to
remove non-fat solids (3). The heat clarification step takes place in an open pan at 110-125 °C (4).
The direct cream method involves separating the cream from the milk, heating the cream to
evaporate the water (110-125 °C) and filtering (4). Cream butter ghee is made with soured cream
(0.5-1% acidity value), that is churned to butter before evaporating the water (110-125 °C) and
filtering (4). The pre-stratification method involves heating creamery or desi butter to 80 °C and

66 | P a g e A n g e l a E . N e w t o n
standing for 30 minutes (3). Once separated the bottom layer can be discarded and the upper layer
is heated further to evaporate the water before filtration (4).
An extra ghee preparation method was trialled that was not documented in the literature. Similar to
the CB method of ghee manufacture, this method kept the buttermilk produced when the cream
was churned to butter. The butter and buttermilk were then cooked together to form the ghee to
investigate if it was the structure change (cream versus butter) or different ratios of matrix and
starting materials that could lead to the differences in final ghee flavour. The method is referred to
as the butter/buttermilk method (B/B method); see figure 3.2.
Samples of ghee made using the direct cream method (chapter 8, section 8.4.1.1), cream butter
method (chapter 8, section 8.4.1.2) and butter/buttermilk method (chapter 8, section 8.4.1.3) all
exhibited differences in the profile of Maillard compounds. The fermentation step was not carried
out when the ghee samples were made in the wok. This step was removed from the wok methods as
the contributions to the final flavour from fermentation are not of interest in this study.
Figure 3.1 Traditional methods of ghee manufacture (3).
Butter
Fermentation
Churning
Heat clarification
Ghee
Milk
Milk butter method
Butter
Separation
Churning
Heat clarification
Ghee
Milk
Cream
Fermentation
Cream butter method
Separation
Heat clarification
Ghee
Milk
Cream
Fermentation
Direct cream method
Butter
Separation
Churning
Heat clarification
Ghee
Milk
Cream
Fermentation
Stratification
Fat phase
Prestratification method
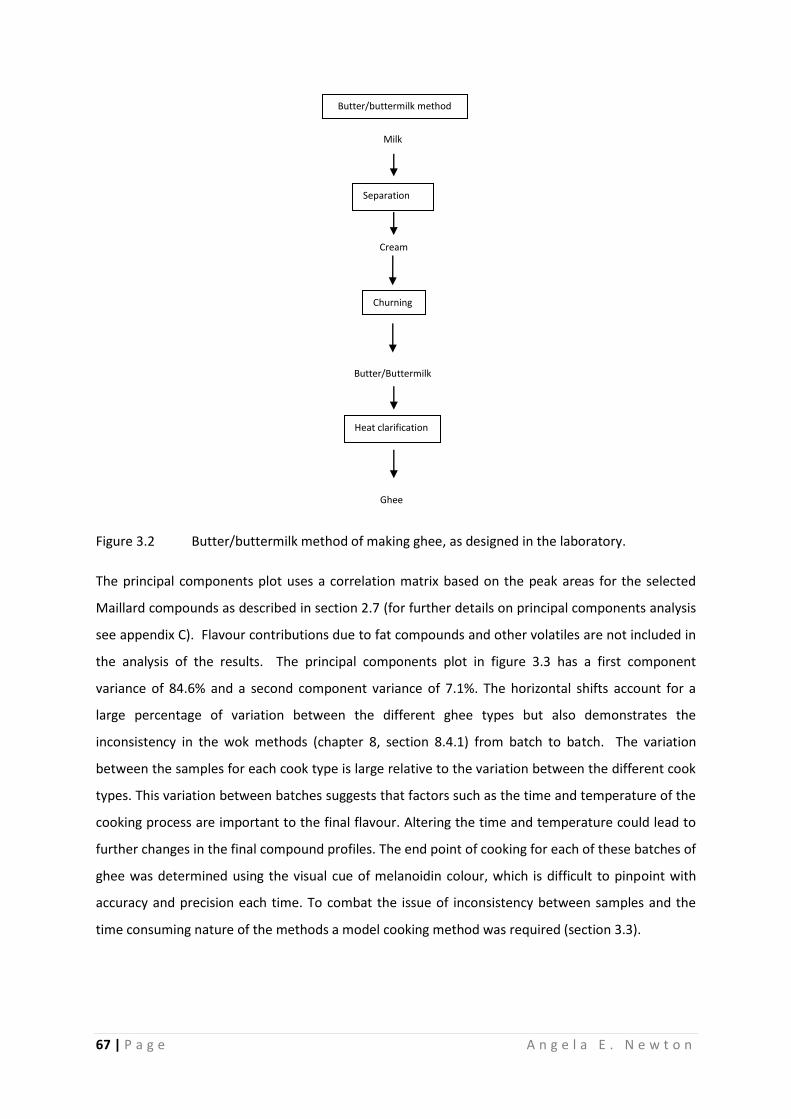
67 | P a g e A n g e l a E . N e w t o n
Figure 3.2 Butter/buttermilk method of making ghee, as designed in the laboratory.
The principal components plot uses a correlation matrix based on the peak areas for the selected
Maillard compounds as described in section 2.7 (for further details on principal components analysis
see appendix C). Flavour contributions due to fat compounds and other volatiles are not included in
the analysis of the results. The principal components plot in figure 3.3 has a first component
variance of 84.6% and a second component variance of 7.1%. The horizontal shifts account for a
large percentage of variation between the different ghee types but also demonstrates the
inconsistency in the wok methods (chapter 8, section 8.4.1) from batch to batch. The variation
between the samples for each cook type is large relative to the variation between the different cook
types. This variation between batches suggests that factors such as the time and temperature of the
cooking process are important to the final flavour. Altering the time and temperature could lead to
further changes in the final compound profiles. The end point of cooking for each of these batches of
ghee was determined using the visual cue of melanoidin colour, which is difficult to pinpoint with
accuracy and precision each time. To combat the issue of inconsistency between samples and the
time consuming nature of the methods a model cooking method was required (section 3.3).
Butter/Buttermilk
Separation
Churning
Heat clarification
Ghee
Milk
Cream
Butter/buttermilk method

68 | P a g e A n g e l a E . N e w t o n
7.55.02.50.0-2.5-5.0
1.0
0.5
0.0
-0.5
-1.0
-1.5
-2.0
First Component (variance 84.6%)
Se
co
nd
Co
mp
on
en
t (v
ari
an
ce
7.1
%)
Figure 3.3 Principal components score plot of ghee samples cooked using traditional wok
methods. Butter samples are represented in black, cream samples in green and butter/buttermilk
samples in red; three batches of each were produced.
3.3 Modelling the cooking of ghee
To effectively study the impact of matrix structure on the formation of volatile compounds in ghee a
high throughput and controllable method of cooking small samples was required. By utilising an
autosampler agitator attached to the GCMS, the temperature and time of cooking could be
controlled along with stirring. Small samples were able to be prepared and cooked using a
replicated, high throughput method.
The direct cream and cream butter methods (figure 3.1) were transferred directly to the
autosampler (AS) cook setup by placing either cream or butter into the vials. The prestratification
method (figure 3.1) was not used due to the extra separation step required which was not practical
on a small scale. The butter/buttermilk method (figure 3.2) trialled on the stove top was also
applied to the AS cooked ghee.
For all AS methods the filtration step to remove non-fat solids from the ghee was omitted because
the presence of the non-fat solids was assumed not to interfere with the equilibrium of volatile
69 | P a g e A n g e l a E . N e w t o n
compounds with the SPME fibre. The non-fat solids are melanoidins; these melanoidins are non-
volatile large compounds (5, 6) that have been characterised using size exclusion chromatography
(7), rheology, thermal and microscopy analysis (8) or solid phase extraction (9) rather than GC.
To establish a set of cooking parameters (time and temperature) a set of experiments were run
using the direct cream method (chapter 8, section 8.4.3) to investigate the influence of time and
temperature.
3.4 Influence of time and temperature
The time taken to cook ghee is partially related to sample size – the 200 ml sample of cream cooked
in the wok takes approximately 60 minutes to cook whereas the smaller 2 ml sample of cream took
much less time to go through the same stages of cooking discussed earlier (temperature
equilibration, evaporation, further cooking). Cooking times of up to and including 20 minutes were
investigated along with a range of temperatures from 110 to 135 °C (1-3, 10-12).
By altering the time and temperature of cooking the ratio of Maillard and caramelisation reactants
formed can be shifted. The cooking times and temperatures were varied (chapter 8, section 8.4.3)
to gain an understanding of how different compounds act with respect to time and temperature.
The accuracy of the temperature regulation in the agitator is ± 2 °C as stated in the user manual.
Figure 3.4 shows the differences that occur when the cook temperature is altered by 3 °C. Relative
to the differences achieved when the temperature is changed by 10 °C or more (figure 3.5), the
changes of ± 3 °C (figure 3.4) lead to relatively minor differences suggesting that any inaccuracy in
the temperature control will be insignificant to the final results.
As cooking temperature was increased the yield of Maillard reaction compounds also increased.
Temperature can be used to change the volatile compound profile and potentially the flavour of the
ghee can be achieved; a lower cooking temperature will provide a ghee containing less of the volatile
compounds whereas a higher cooking temperature will provide a ghee containing higher quantities
of these compounds. These results were taken from samples of ghee with a cooking time of 20
minutes. When the cooking time is changed, the formation of volatile compounds changes as well
(figure 3.6).

70 | P a g e A n g e l a E . N e w t o n
Figure 3.4 Differences generated by a small change in temperature. The temperatures shown
on the graph are 132 °C (blue), 135 °C (purple) and 138 °C (red). The error bars represent the
standard deviation of duplicate samples.
Figure 3.5 Differences generated by large changes in temperature. The temperatures assessed
were 110 °C (blue), 120 °C (red), 125 °C (green) and 135 °C (purple). The data in figure 3.5 were not
duplicated as they were part of a time series experiment that was only carried out once due to time
constraints.
0
2,000,000
4,000,000
6,000,000
8,000,000
10,000,000
12,000,000
14,000,000
16,000,000P
eak
Are
a
Reaction compounds
0
1,000,000
2,000,000
3,000,000
4,000,000
5,000,000
6,000,000
7,000,000
Pe
ak A
rea
Reaction compounds

71 | P a g e A n g e l a E . N e w t o n
For some of the Maillard compounds it can be seen (figure 3.6) that the effect of temperature and
time is greater for some products than for others. There are compounds (furfural, 2(5H)-furanone,
maltol) that have little difference in rate or yield at 120-125 °C; however, as soon as the temperature
is increased to 135 °C there is an distinct increase in rate overall. When all of the monitored
compounds are considered (figure 3.7) an increase in product formation with time was seen at all
temperatures tested over the 20 minute time period (figure 3.7). The point at which this rate change
occurs differs between the compounds from 12-14 minutes possibly due to change in water activity
and the temperature increase that occurs after evaporation. DHHF shows a steady increase over
time that increases incrementally with temperature; there is not the large increase in formation that
was seen in the other compounds.
After assessing the impact of time and temperature on the volatile compound profile in the ghee
samples, a set of cooking parameters was established. Each sample was cooked for 20 minutes at
135 °C to achieve a caramel coloured product containing a range of Maillard reaction compounds.
Figure 3.6 Influence of time and temperature on the formation of selected Maillard reaction
compounds; A, Furfural; B, 2(5H)-Furanone; C, Maltol; D, DHHF. The temperatures represented on
the graphs are 120 °C (red), 125 °C (green) and 135 °C (purple).
0
100,000
200,000
300,000
400,000
10 12 14 16 18 20
0
50,000
100,000
150,000
200,000
250,000
300,000
350,000
10 12 14 16 18 20
0
1000000
2000000
3000000
4000000
5000000
6000000
7000000
10 12 14 16 18 20
0
200,000
400,000
600,000
800,000
1,000,000
1,200,000
10 12 14 16 18 20
A B
C D
Time (minutes)
Pea
k ar
ea

72 | P a g e A n g e l a E . N e w t o n
Figure 3.7 Maillard product formation over 10 minutes at; A, 135 °C; B, 125 °C; C, 120 °C.
0
1,000,000
2,000,000
3,000,000
4,000,000
5,000,000
6,000,000
7,000,000
0
200,000
400,000
600,000
800,000
1,000,000
1,200,000
0
50,000
100,000
150,000
200,000
250,000
300,000
350,000
400,000
10 12 14 16 18 20
Time (minutes)
C
B
A
Pea
k ar
ea

73 | P a g e A n g e l a E . N e w t o n
3.5 Comparing high throughput cooking to wok ghee
The standard cooking parameters adopted for the cooking of ghee in the autosampler were
established as 20 minutes cooking time at 135 °C with stirring set to 500 rpm. These cooking
parameters were used to cook six replicate samples of each sample: direct cream, cream butter and
butter/buttermilk ghee (chapter 8 section 8.4.2). The PCA plot obtained is shown in figure 3.8.
7.55.02.50.0-2.5-5.0
1.0
0.5
0.0
-0.5
-1.0
-1.5
First Component (variance 87.4%)
Se
co
nd
Co
mp
on
en
t (v
ari
an
ce
6.8
%)
Figure 3.8 PCA score plot of ghee samples cooked using the GC autosampler. Butter samples
are shown in black, cream samples in green and butter/buttermilk samples in red.
A comparison of the figure 3.8 PCA plot (correlation matrix) with the plot for the wok ghee (figure
3.3) highlights a similar distribution of sample profiles. The first component explains 87% of the
variation with 6.8% explained by the second component. While the percentage in variation is similar
between the two figures (3.8 and 3.3), the distribution within the quadrants was different. In figure
3.8 the cream can be seen in the bottom right quadrant with butter and buttermilk positioned in the
top half, the distribution in figure 3.3 places cream in the top left quadrant. The different
distributions arise from a variation in the ratio of the Maillard compounds.
Ghee cooked in the GC autosampler cannot be expected to mimic ghee cooked in a wok exactly as
the conditions of cooking are not able to be 100% replicated. The vials are glass as opposed to the

74 | P a g e A n g e l a E . N e w t o n
metal/Teflon surface of a wok. The stirring in the autosampler is constant versus intermittent with
the wok, the heated surface area and therefore temperature profile across the samples is different
not only because of the cooking set up but also because the volume of the samples is considerably
smaller in the autosampler. When the two cooking set ups are compared for each of the ghee
methods it can be seen in the PCA plot (figure 3.9) that there is clearly a separation between wok
cooked samples and ghee cooked samples. Variation along the first component axis accounts for
77% of the sample variation while the second component axis accounts for 11.7% of the variation.
7.55.02.50.0-2.5-5.0
2
1
0
-1
-2
-3
-4
First Component (variance 77%)
Se
co
nd
Co
mp
on
en
t (v
ari
an
ce
11
.7%
)
Figure 3.9 PCA score plot showing the differences between wok-cooked ghee and AS-cooked
ghee. Samples made from butter are shown in black, made from cream in green and
butter/buttermilk samples are shown in red.
The purpose of transferring the method of cooking ghee from a wok to the GC autosampler was to
allow for automated high throughput sample cooking. The ghee made using the model cooking
setup does not have to match the volatile compound profile of the ghee cooked in the wok exactly
as the reactions will still behave in the same manner with respect to time, temperature and pH
changes. Maillard compounds picked out of the standard reference sample (chapter 8 section 8.2.2)
were also found in the wok ghee and model cooked AS ghee (figure 3.10). The variation between
cooking methods is greater than the variation between samples of the same method when the ghee
AS
Wok

75 | P a g e A n g e l a E . N e w t o n
is cooked using the autosampler. The automated method is not only more consistent, but it is a
better model for commercial processes.
Figure 3.10 Volatile compound profile comparing autosampler and wok cooked cream. Wok
cooked cream samples are shown in blue with AS cooked ghee in red. The error bars represent the
standard deviation of the six samples.
3.6 Structure of starting materials
As a preliminary experiment, a comparison of different starting materials was used, to see if there
was a difference in the volatile compound profile of the ghee. Obviously these starting materials
have differences in both chemical composition and physical structure, which does not allow a direct
test of the hypothesis. However, the structural differences of each starting material could provide
an insight as to why the volatile compound results after cooking are different. Figure 3.11 shows the
results from four different ghee samples each cooked in the autosampler (chapter 8 section 8.4.2),
for comparison, another sample of model ghee was cooked from a buttermilk sample which
contained no fat (chapter 8 section 8 4.2). Starting materials for generating model ghee samples
were weighed out such that the amount of aqueous phase would be as consistent as possible across
the samples to rule out the possibility of the differences being due to different levels of reactants.
0
5,000,000
10,000,000
15,000,000
20,000,000
25,000,000
30,000,000
Pe
ak a
rea
Reaction products

76 | P a g e A n g e l a E . N e w t o n
Figure 3.11 Autosampler cooking of different structures of cream. Direct cream method samples
are shown in blue, butter samples in red, butter/buttermilk in purple and buttermilk in green. The
error bars represent the standard deviation of six samples.
Cream has an oil-in-water emulsion structure. As heat was applied to the system the cream began to
simmer and water began to evaporate to create a thick sticky oil in water emulsion. As the water
percentage in the matrix decreased further the emulsion underwent a catastrophic transition (13)
where the emulsion structure collapsed and did not form a water in oil emulsion. The collapsed
emulsion structure which had formed two separate phases of oil and water continued to cook and
the remaining water evaporated until only the fat phase remained, along with non-fat solids.
The structure of butter is a water in oil emulsion in which the dispersed water droplets are
kinetically trapped and stabilised by the surrounding crystalline fat continuous phase. As butter was
heated, the fat phase (which is semi-solid at room temperature) melted and the aqueous phase was
released from the fat matrix. The aqueous phase then evaporated without being constrained by a
matrix structure.
0
5,000,000
10,000,000
15,000,000
20,000,000
25,000,000
30,000,000
35,000,000P
eak
are
a
Reaction compounds

77 | P a g e A n g e l a E . N e w t o n
Along with the structural differences between cream, butter and buttermilk there are also some
differences in chemical composition. Cream contains 60% aqueous phase with approximately 3%
lactose and 2% protein along with various salts and minerals. Butter contains approximately 20%
aqueous phase with the same composition as the aqueous phase of cream – the butter therefore
contains only 1/3 of the reactants relative to cream. When the excess buttermilk is retained with the
butter the aqueous reactant levels remain the same when compared to cream. Buttermilk that has
been removed from cream contains the aqueous components described above but does not contain
any of the fat components that could be contributing to the final volatile profile.
To remove the variability associated with chemical composition of the starting materials controlled
model systems were needed. The development of these model systems can be found in the next
chapter (chapter 4).
3.7 Conclusion
The AS cooking method was developed to cook a ghee sample of small volume with high throughput
in an automated system. Differences seen in the samples cooked traditionally in the wok using the
various methods could be replicated in the AS samples. The standard method of cooking for the
remainder of the study was to use 2 ml cooked in the autosampler agitator for 20 minutes with fast
stirring (500 rpm) and a glass bead at 135 °C; any deviations from this standard method are clearly
stated.
There were some differences seen between the samples cooked using the same method on both the
autosampler and the wok; however, the autosampler cooked samples behaved as expected with
respect to pH, time and temperature. In general, the overall Maillard product formation increased
as time and temperature were increased between 120 and 135 °C and 10 to 20 minutes,
respectively.
There were differences achieved in the volatile compound profile when different starting structures
were used; butter versus cream versus butter/buttermilk. The ability to determine which differences
are due primarily to the structural differences rather than differences in the chemical composition of
the starting ingredients required the use of a model system. The following chapters will continue to
explore the impact that matrix structure has on the Maillard and caramelisation reactions. A model
system will be discussed in chapter 4 as a simple model for the Maillard and caramelisation reactions
in cream.

78 | P a g e A n g e l a E . N e w t o n
3.8 References
1. Yadav, J. S.; Srinivasan, R. A., Qualitative and quantitative changes in flavour characteristics of ghee made from ripened cream. Indian Journal of Dairy Science 1984, 37, 350-356.
2. Ganguli, N. C.; Jain, M. K., Ghee - its chemistry, processing and technology. Journal of Dairy Science 1973, 56, 19-25.
3. Sserunjogi, M. L.; Abrahamsen, R. K.; Narvhus, J., A review paper: Current knowledge of ghee and related products. International Dairy Journal 1998, 8, 677-688.
4. Wadodkar, U. R.; Punjrath, J. S.; Shah, A. C., Evaluation of volatile compounds in different types of ghee using direct injection with gas chromatography-mass spectrometry. Journal of Dairy Research 2002, 69, 163-171.
5. Adams, A.; Borrelli, R. C.; Fogliano, V.; De Kimpe, N., Thermal degradation studies of food melanoidins. Journal of Agricultural and Food Chemistry 2005, 53, 4136-4142.
6. Wang, H. Y.; Qian, H.; Yao, W. R., Melanoidins produced by the Maillard reaction: Structure and biological activity. Food Chemistry 2011, 128, 573-584.
7. Brudzynski, K.; Miotto, D., Honey melanoidins: Analysis of the compositions of the high molecular weight melanoidins exhibiting radical-scavenging activity. Food Chemistry 2011, 127, 1023-1030.
8. Venir, E.; Pittia, P.; Giavon, S.; Maltini, E., Structure and water relations of melanoidins investigated by thermal, rheological and microscopic analysis. International Journal of Food Properties 2009, 12, 819-833.
9. Bekedam, E. K.; Roos, E.; Schols, H. A.; van Boekel, M.; Smit, G., Low molecular weight melanoidins in coffee brew. Journal of Agricultural and Food Chemistry 2008, 56, 4060-4067.
10. Yadav, J. S.; Srinivasan, R. A., Advances in ghee flavour research. Indian Journal of Dairy Science 1992, 45, 338-348.
11. Wadodkar, U. R.; Punjrath, J. S.; Shah, A. C.; Przybylski, R., Evaluation of volatile compounds in different types of ghee using headspace with GC/MS. Milchwissenschaft - Milk Science International 2003, 58, 37-39.
12. Andrewes, P., Changes in Maillard reaction products in ghee during storage. Food Chemistry 2012, 135, 921-928.
13. Liu, Y. H.; Fribere, S. E., Perspectives of phase changes and reversibility on a case of emulsion inversion. Langmuir 2010, 26, 15786-15793.
79 | P a g e A n g e l a E . N e w t o n
Chapter 4 An experimental model for the Maillard and
caramelisation reactions
4.1 Introduction
This chapter outlines the development and use of reaction models for this thesis. The models were
designed to study the Maillard and caramelisation reactions for the purpose of understanding
flavour formation in ghee. The reaction models were validated against cream by adjusting the
parameters of cooking time, and temperature and starting pH to ensure that the model system
behaved in a similar manner to cream when these influential parameters were changed. The
addition of phosphates and salt to the model allowed the impact of these components, to be
assessed.
A model system was designed based on a very simple view of a cream system. Two simple reaction
systems for the Maillard and caramelisation reactions were designed. It can be difficult to separate
and distinguish between the caramelisation reaction and the Maillard reaction in any reaction
system, particularly in food systems (1, 2). The use of two model reaction systems side by side
containing the same quantity of lactose allowed the potential impact of caramelisation pathways to
be determined relative to the overall reaction scheme occurring in the Maillard reaction system.
To allow the influence of the chemical composition and matrix to be distinguished, the matrix was
broken down into its building blocks, the model system was then built from the bottom up, starting
with the simplest matrix and adding components until the model resembled the original matrix. This
approach allowed each component of the matrix composition and structure to be investigated and
its influence on the reactions determined.
4.2 Modelling the Maillard and caramelisation reaction in cream
Most dairy products including cream and butter contain significant quantities of lactose, a
disaccharide of glucose and galactose (3). Lactose and the monosaccharides glucose and galactose
are all reducing sugars. Amine groups are available through free amino acids present as well as
reactive side chains of lysine residues in proteins. The caramelisation reaction differs from the
Maillard reaction in that the reducing sugar (lactose) is degraded in the absence of any amino acids
(figure 1.4). In the presence of excess amino groups the Maillard reaction will be favoured. The
kinetics of the caramelisation reaction are different from those of the Maillard reaction as the

80 | P a g e A n g e l a E . N e w t o n
reaction mechanism that occurs in the absence of the amino groups is different (1, 2) from the
mechanisms occurring in the presence of amino groups.
The model reaction systems were developed using D-lactose (3.0% w/v) and L-lysine (2.0% w/v). This
equates to concentrations of 87 mML-1 (lactose) and 140 mML-1 (lysine) and a molar ratio of 1: 1.6;
which in turn gives a ratio of lactose: available amino groups of 1:3.2. The lactose content of the
model system is a reflection of the lactose content in cream. Lysine was chosen as the amino
component of the model system because it is a common and readily available amino acid found in
dairy proteins. Lysine also contains a free amino group that is not part of the protein backbone and
therefore is free to participate in the Maillard reaction. Lysine was added in excess to explore the
limits of the Maillard reaction. Additional lysine could be added to the ghee in a commercial context
if excess lysine produced a more favourable flavour profile.
There are other components of cream and dairy products that may also contribute to the Maillard
reaction, including phosphates and other salts. These salts can enhance the rate of the Maillard
reaction (figure 1.9) and their influence in this model reaction system was explored further in section
4.6. Metals have also been shown to have an impact on the Maillard reaction including calcium,
magnesium and sodium (4), all of which are found in dairy products. Sodium was introduced in small
amounts as sodium hydroxide to the model reaction systems in order to change the pH. However,
the concentration in the sample was less than 0.04 M which is the concentration at which the group
I metal ions produced a reliable increase in browning in the ribose/glycine model used in a study by
Rizzi (4). The amount of calcium and sodium found in cream is 96 mg/100 ml (~0.02 M calcium), 25 –
40 mg/100 ml (0.01-0.02 M sodium) along with magnesium, phosphorus and potassium in quantities
ranging from <10 mg/100 ml to 75 mg/100 ml (5) (Fonterra product bulletin, appendix B).

81 | P a g e A n g e l a E . N e w t o n
Table 4.1 Amino acids in cream as a percentage calculated from the amino acid profile of milk
protein concentrates (Total protein percentage in cream = 2% (Fonterra product bulletin; appendix
B)). The fat content of cream was ~40%.
Amino acid % in cream g per 100 g of protein
Isoleucine 0.11 5.30
Leucine 0.19 9.60
Lysine 0.17 8.40
Methionine 0.06 2.80
Phenylalanine 0.10 4.90
Threonine 0.09 4.50
Tryptophan 0.03 1.40
Valine 0.13 6.40
Histidine 0.05 2.70
Alanine 0.07 3.30
Arginine 0.74 37.0
Aspartic acid 0.16 7.80
Cysteine/cystine 0.02 1.20
Glutamic acid 0.43 21.6
Glycine 0.04 1.90
Proline 0.20 9.80
Serine 0.11 5.60
Tyrosine 0.12 5.30
4.3 The differences between the Maillard and caramelisation reactions
Using the standard conditions, (chapter 8, section 8.4.2) with a starting pH of 7 (the same pH as
fresh cream measured using pH paper (0-14, Merck)) a set of results was obtained for both the
caramelisation (figure 4.1) and Maillard reaction (figure 4.2) models that highlights some of the
differences in the measured products. Samples were made and cooked in duplicate as per chapter 8,
section 8.5.

82 | P a g e A n g e l a E . N e w t o n
Figure 4.1 Compounds formed via the caramelisation reaction (lactose) at pH 7. Cooking
conditions were 135 °C, 20 minutes, 500 rpm stirring. Results are an average of two duplicate cooks
of the same aqueous solution as comparison of the caramelisation reaction across multiple
experiments can have up to 70% variation in these results. The error bars represent the standard
deviation of the duplicate cooked samples for this experiment.
Figure 4.2 Compounds formed via the Maillard reaction (lactose and lysine) at pH 7 in a model
system. Cooking conditions were 135 °C, 20 minutes, 500 rpm stirring. Results are an average of two
duplicate cooks as comparison of the Maillard reaction across multiple experiments can have up to
70% variation in these results. The error bars represent the standard deviation of the duplicate
cooked samples for this experiment.
0
50,000
100,000
150,000
200,000
250,000
300,000
350,000
400,000
450,000P
eak
are
a
Reaction compounds
0
50,000
100,000
150,000
200,000
250,000
300,000
350,000
400,000
450,000
Pe
ak a
rea
Reaction compounds

83 | P a g e A n g e l a E . N e w t o n
When cream was cooked (chapter 8, section 8.5.3.1) under the same conditions at pH 7 (pH of fresh
cream, no adjustment was made) the same group of compounds were formed although with
different ratios (figure 4.3). The pH of fresh cream was measured using 0-14 pH paper.
Figure 4.3 Reaction compounds formed via the Maillard and caramelisation reactions in fresh
cream. Cooking conditions: 135 °C, 20 minutes, 500 rpm stirring. Error based on the standard
deviation of six cooked samples of fresh cream.
The mechanisms of the Maillard and caramelisation reactions of lactose and lysine each have the
potential to provide a similar set of volatile compounds (as set out in table 2.2) to those seen in
cooked cream and ghee. The Maillard and caramelisation reactions have different initial stages due
to the presence of the amino groups in the Maillard reaction (6). The volatile compounds (table 2.2)
can be formed by the mechanisms proposed (appendix A) by the Maillard reaction via the Amadori
compound (figure 1.2) and subsequent rearrangement (7-11) (figure 1.3), or alternately the
compounds can be formed via the caramelisation reaction through a lactose isomerisation pathway
(6, 11-14) (figures 1.5 and 1.6). These pathways converge on a set of intermediate compounds: 1-
deoxyosone (15-19), 3-deoxyhexosone (6, 19) and lactulose (caramelisation) (6) or aminoreductone
(Maillard) (20-22) (figure 4.4) that then react to generate the compounds identified in table 2.2. The
only compound that cannot be formed via the caramelisation reaction is 2-acetylpyrrole since the
nitrogen from the amino acid is incorporated into the final compound and this is absent in the
caramelisation reaction.
0
5,000,000
10,000,000
15,000,000
20,000,000
25,000,000
30,000,000
Pe
ak a
rea
Reaction compounds
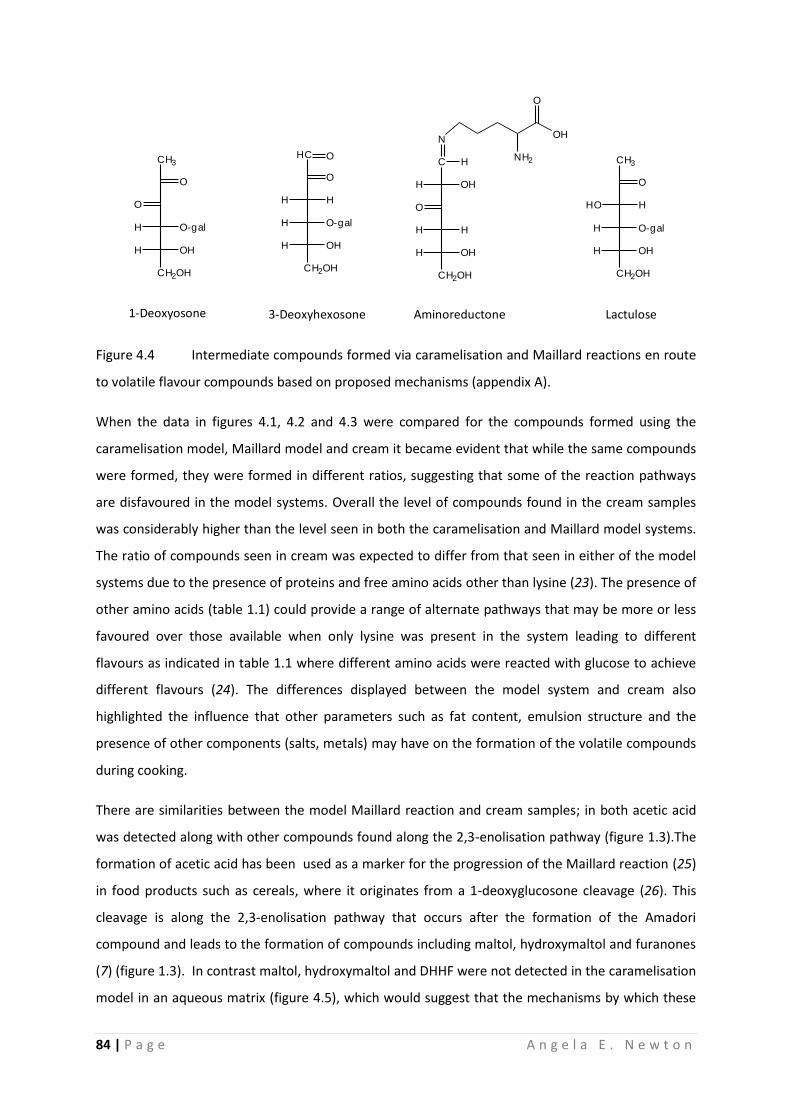
84 | P a g e A n g e l a E . N e w t o n
CH3
O
O
H O-gal
H OH
CH2OH
HC
O
H
H O-gal
H OH
CH2OH
O
H
3-Deoxyhexosone
C
OH
H
H OH
CH2OH
NOH
O
NH2H
O
H
H
Aminoreductone Lactulose1-Deoxyosone
CH3
O
HO
H O-gal
H OH
CH2OH
H
Figure 4.4 Intermediate compounds formed via caramelisation and Maillard reactions en route
to volatile flavour compounds based on proposed mechanisms (appendix A).
When the data in figures 4.1, 4.2 and 4.3 were compared for the compounds formed using the
caramelisation model, Maillard model and cream it became evident that while the same compounds
were formed, they were formed in different ratios, suggesting that some of the reaction pathways
are disfavoured in the model systems. Overall the level of compounds found in the cream samples
was considerably higher than the level seen in both the caramelisation and Maillard model systems.
The ratio of compounds seen in cream was expected to differ from that seen in either of the model
systems due to the presence of proteins and free amino acids other than lysine (23). The presence of
other amino acids (table 1.1) could provide a range of alternate pathways that may be more or less
favoured over those available when only lysine was present in the system leading to different
flavours as indicated in table 1.1 where different amino acids were reacted with glucose to achieve
different flavours (24). The differences displayed between the model system and cream also
highlighted the influence that other parameters such as fat content, emulsion structure and the
presence of other components (salts, metals) may have on the formation of the volatile compounds
during cooking.
There are similarities between the model Maillard reaction and cream samples; in both acetic acid
was detected along with other compounds found along the 2,3-enolisation pathway (figure 1.3).The
formation of acetic acid has been used as a marker for the progression of the Maillard reaction (25)
in food products such as cereals, where it originates from a 1-deoxyglucosone cleavage (26). This
cleavage is along the 2,3-enolisation pathway that occurs after the formation of the Amadori
compound and leads to the formation of compounds including maltol, hydroxymaltol and furanones
(7) (figure 1.3). In contrast maltol, hydroxymaltol and DHHF were not detected in the caramelisation
model in an aqueous matrix (figure 4.5), which would suggest that the mechanisms by which these

85 | P a g e A n g e l a E . N e w t o n
compounds are formed occur more readily when an amino acid is present. Furfural, furfuryl alcohol
and HMF were formed in both the caramelisation and the Maillard model reactions (figure 4.5).
These compounds have been shown to form via an alternate pathway from the Amadori compound
rather than the 2,3-enolisation pathway (figure 1.3) in the Maillard reaction (7) and via the
caramelisation reaction (11). With the exception of butyrolactone and furfural the Maillard reaction
generated a higher yield of all flavour compounds in an aqueous matrix.
Figure 4.5 Relative amounts of compounds formed in the Maillard model compared to the
caramelisation model. Caramelisation reaction samples are represented by the red bars, Maillard
reaction samples by the blue bars. The error bars represent the standard deviation of the duplicate
cooked samples. The data was taken from figures 4.1 and 4.2.
4.4 Influence of time and temperature
When cooking parameters were altered the amount of flavour compounds in cooked cream
generally increased with increasing time and temperature (section 3.4). In cream, both the Maillard
and caramelisation reactions can occur at the same time and not all of the protein is available for
participation in the Maillard reaction. To validate the model reaction systems against cream a set of
samples were cooked against the same time and temperature parameters used to investigate the
behaviour of cream.
0
50,000
100,000
150,000
200,000
250,000
300,000
350,000
400,000
450,000
Pe
ak a
rea
Reaction compounds

86 | P a g e A n g e l a E . N e w t o n
Figure 4.6 Influence of time on the Maillard reaction. Samples of the model aqueous Maillard
reaction were cooked at 135 °C for 10 (green), 15 (red) and 20 (blue) minutes. The error bars
represent the standard deviation of duplicate cooked samples.
As the time of cooking was lengthened the amount of volatile compound formation increased by a
considerable amount (figure 4.6). An increase was also seen when the temperature was increased
from 125 to 135 °C (figure 4.7). Similar behaviour with respect to time and temperature was also
seen in cream (figure 3.5).
0
50,000
100,000
150,000
200,000
250,000
300,000
350,000
400,000
450,000P
eak
are
a
Reaction compounds

87 | P a g e A n g e l a E . N e w t o n
Figure 4.7 Influence of temperature on the Maillard reaction. Samples of the aqueous model
Maillard reaction were cooked for 20 minutes at 125 °C (blue) and 135 °C (red). The error bars
represent the standard deviation of duplicate samples.
A closer look at the data highlights that the formation of furfural, HMF and butyrolactone was not
significantly influenced by temperature and time when compared with the other compounds. The
yield of all other compounds significantly increased with longer times and higher temperatures.
When these results are compared with the results for the caramelisation there are several points to
note. The formation of furfural increased in the caramelisation reaction relativeto the Maillard
reaction where there appeared to be no significant change with time or temperature in the amount
formed. However, butyrolactone appears to decrease with increases in time and temperature
during the progress of the caramelisation reaction (figure 4.8 and 4.9). This decrease could suggest
that the butyrolactone reacts further as the reaction time increased or that at higher temperatures
another compound is forming preferentially. In studies carried out to investigate the formation of
Maillard reaction compounds during the breakdown of inulin to make tequila (27), a similar trend
was seen during the cooking process whereby the concentration of butyrolactone remained
constant and then decreased over time. Along with 2-acetylpyrrole, a compound not expected to be
formed in the caramelisation reaction, there are several other compounds that were not detected in
this experiment, such as: 2(5H)-furanone (very low detection in figure 4.1 samples), maltol, and
DHHF. The absence/low detection of these compounds suggests that other reaction pathways were
preferred.
0
50,000
100,000
150,000
200,000
250,000
300,000
350,000
400,000
450,000P
eak
are
a
Reaction compounds

88 | P a g e A n g e l a E . N e w t o n
All the other compounds formed during the caramelisation reaction behaved in a similar manner to
those formed via the Maillard reaction with respect to time and temperature.
Figure 4.8 The influence of time of the caramelisation reaction in an aqueous matrix. The
samples were cooked for 10 (green), 15 (red) and 20 (blue) minutes at 135 °C. The error bars
represent the standard deviation of duplicate samples.
0
5000
10000
15000
20000
25000
30000
Pe
ak a
rea
Reaction compounds
0
5,000
10,000
15,000
20,000
25,000
30,000
pe
ak a
reas
reaction compounds

89 | P a g e A n g e l a E . N e w t o n
Figure 4.9 The influence of temperature on the caramelisation reaction in an aqueous matrix.
The samples were cooked for 20 minutes at 125 °C (red) and 135 °C (blue). The error bars represent
the standard deviation of duplicate samples.
Overall, the trend relating to increasing overall volatile compounds with time and temperature was
occurring within the Maillard and caramelisation models as was the case during the cooking of the
cream samples. A change to time and temperature of cooking alters the overall levels of volatile
compounds. The levels of the compounds represent the potential for different levels of flavour and
changes in the ratios of compounds to each other can generate changes in the type of flavour. To
change these ratios the reaction pathways need to be directed in alternate directions and one
method for changing the favoured mechanistic pathway is to change the pH of the reaction.
4.5 Influence of pH on the Maillard and caramelisation reactions
The influence of pH on the Maillard reactions has been previously studied and shown to correlate
with the generation of different compounds due to the occurrence of different pathways under
different pH conditions (section 1.3.1) (1-3, 28-30). Based on this literature it was hypothesised that
the formation of volatile compounds in ghee could be altered by using cream that had been adjusted
to different pH values (chapter 8, section 8.5.3.1). The pH of the system changes as the reaction
progresses and so it is difficult to control the reaction pH without the addition of a buffering system
to maintain a constant pH; however, the addition of these buffers can also impact on the reaction
(section 1.3.1).
Even with the buffering capacity of cream (31) there was decrease in measured pH as the reaction
progressed. This is in part due to the formation of acidic compounds (32, 33). This pH decrease was
seen across all of the cream samples (chapter 8, section 8.5.2) regardless of the starting pH, the final
pH for all samples was 4-5. The decrease of pH observed in the cream solution (figure 4.10) during
cooking was also observed in the caramelisation experiments, and has been documented as
occurring during caramelisation leading to lactulose degradation into fructose and galactose (12).
The model reaction system samples all followed the same pH trend (figure 4.11).

90 | P a g e A n g e l a E . N e w t o n
Figure 4.10 Change in pH of cream at 2.5 minute intervals as it was cooked at 135 °C for 20
minutes. The pH was measured using 0-14 pH paper.
Figure 4.11 Change in pH at 2 minute time intervals of the aqueous Maillard reaction model as it
was cooked at 135 °C for 20 minutes. The pH was measured using 0-14 pH paper.
By adjusting the starting pH of the system the rate of change in reaction pH over time will be altered
leading to differing amounts of time at which any one mechanistic pathway is favoured for the
formation of volatile compounds. As such, different ratios of volatile compounds were expected
when the pH of cream and the model systems was adjusted prior to cooking. There was a distinct
change in the volatile compound profile of the ghee. The mechanism shown in figure 1.3 predicted
4
5
6
7
8
2.5 5 7.5 10 12.5 15 17.5 20
pH
Time (minutes)
4
5
6
7
2 4 6 8 10 12 14 16 18 20
pH
Time (min)

91 | P a g e A n g e l a E . N e w t o n
that furanone would decrease with decreasing pH and that HMF would increase along with furfural
due to the preference for 2,3-enolisation mechanisms at high pH and 1,2-enolisation mechanisms at
lower pH (1, 2, 19, 30). Furfural formation did not appear to follow a trend as the starting pH was
altered despite the mechanisms by which it is formed being reported (3) to require acidic
conditions.
The influence of pH on the Maillard reaction products is due to the different reaction pathways
from the Amadori compound (figure 1.3). The different reaction mechanisms are pH dependent with
the 2,3-enolisation pathway dominant at high pH values and the 1,2-enolisation pathway dominant
at lower pH values. The proposed mechanism for the formation of HMF indicate that acidic
conditions are required (figure 1.3) and its formation occurs along the 1,2-enolisation pathways
whereas the furanones are formed along the 2,3-enolisation pathway (figure 1.3) via the
deoxyhexosone compound (figure 4.4).
Figure 4.12 The change in formation of furfural, 2(5H)-furanone and HMF in cooked cream at
different pH values. Error bars represent the standard deviation of duplicate cooked cream samples.
0
200,000
400,000
600,000
800,000
1,000,000
1,200,000
1,400,000
1,600,000
1,800,000
Furfural 2(5H)-Furanone HMF
Pe
ak a
rea
Reaction compounds

92 | P a g e A n g e l a E . N e w t o n
Figure 4.13 Influence of different starting pH on volatile compound formation in cream cooked
at 135 °C for 20 minutes. Error bars represent the standard deviation of duplicate cooked cream
samples.
The effect of pH on the overall volatile compound formation in cream can be seen in figure 4.13.
Each compound has an independent optimum pH of formation meaning that different compound
ratios can be generated through a simple pH change. At an initial pH of 11 furfuryl alcohol, 2(5H)-
furanone, butyrolactone and acetic acid are formed at their highest yields, these yields then
decrease as the starting pH is decreased. Other compounds, such as maltol and the related
compound hydroxymaltol, had an optimal yield at pH 9 with HMF favoured at acidic pH. The same
effect was seen in the model reaction systems (chapter 8, section 8.5.3) when the starting pH was
adjusted. Different changes in individual compounds were seen in the caramelisation reaction and
the Maillard reaction models.
When the caramelisation reaction was carried out at an initial pH of 11 there was a significant
increase in the formation of most of the compounds, particularly furfuryl alcohol (figure 4.14).
Whilst it is difficult to directly compare the results from the caramelisation model with those from
cream (due to the multiple reactions that occur in cream) the increase in furfuryl alcohol at pH 11
was in line with an increase seen in cream.
0
5,000,000
10,000,000
15,000,000
20,000,000
25,000,000
30,000,000P
eak
are
a
Reaction compounds

93 | P a g e A n g e l a E . N e w t o n
Caramelisation of lactose can occur through multiple pathways via the isomer lactulose (11, 12, 34,
35). Isomerisation of lactose to lactulose (figure 1.5) occurs as a series of reversible reactions. The
position of the equilibrium and therefore the balance of isomers can be pushed towards lactulose by
using sodium hydroxide at pH 11 and by heating the solution (12). Given the impact seen when the
pH was adjusted to pH 11 prior to cooking it was likely this isomerisation to lactulose was occurring
at an increased rate in the model system.
Figure 4.14 Variation in product formation for the caramelisation reaction with a change in the
initial pH. Error bars represent the standard deviation of duplicate cooked samples
A closer look at the results obtained when the initial pH of the aqueous caramelisation reaction is
changed (figures 4.14 and 4.15) show that the formation of furfural exhibits only a little variation as
the pH was varied while HMF formation was increased at low pH and 2(5H)-furanone increased with
increasing pH.
0
500,000
1,000,000
1,500,000
2,000,000
2,500,000
3,000,000
3,500,000
Pe
ak a
rea
Reaction compounds

94 | P a g e A n g e l a E . N e w t o n
Figure 4.15 Changes to the caramelisation reaction with pH (pH 11 results have been removed
for clarity). Error bars represent the standard deviation of duplicate cooked samples.
The increase in the formation of volatile compounds at high pH can be attributed to the protonation
state of the amine groups on the lysine residue (figure 1.8). The initial stages of the Maillard
reaction up to the formation of the Amadori compound occur at a slower rate when the amine
groups are protonated under acidic conditions. Adjusting the reaction solutions to a higher pH
resulted in a faster reaction that yielded higher levels of several key compounds including acetic
acid. Based on these results (figure 4.16) it would appear that an initial reaction pH of 9 would yield
the greatest level of product formation for the Maillard reaction model. The 2,3-enolisation
pathway (figure 1.3) of the Maillard reaction has been shown to be favoured at basic rather than
acidic pH. As can be seen in figure 4.16 compounds such as maltol, hydroxymaltol, DHHF and
furanone that are found along the 2,3-enolisation pathway (figure 1.3) were prominent at pH values
above 7. An increase in acetic acid, a by-product of this pathway also increased at higher pH values,
contributing to the overall decrease in pH (figure 4.11).
0
50,000
100,000
150,000
200,000
250,000
300,000
350,000P
eak
are
a
Reaction compounds

95 | P a g e A n g e l a E . N e w t o n
Figure 4.16 Influence of pH on the Maillard reaction model. The error bars represent the
standard deviation of duplicate samples.
4.6 Other components of cream that influence the Maillard reaction
As previously indicated there are many components in cream and related dairy products other than
lactose and lysine including phosphates and other salts (31). These compounds are also able to
influence the Maillard and caramelisation reactions (36). The reaction models contained only the
reactants, whereas cream on the other hand contains a myriad of buffers and salts each of which
can buffer the pH (31) and catalyse the reaction (37) as shown in figure 1.10.
Since the decrease of pH over the course the Maillard reaction can slow the initial reaction rate, the
addition of a buffer can stop this pH decrease (37) depending on the reaction parameters. Studies
carried out at 37 °C showed no change in pH over the course of the reaction when a pH 7 phosphate
buffer (0.02 - 0.5 M) was added to the reaction system (37). This is contrary to what happened in
cream which contains its own buffering capacity which has an optimum capacity at pH 3-6 (31) and
has a final pH of ~pH 5 when cooked for 20 min at 135 °C. The addition of buffers and salts to the
model system was used to gain an understanding of the impact the buffering species present in
cream could have on the Maillard and caramelisation reactions. A 0.2 M phosphate buffer was
added to the model systems along with 5% NaCl as per chapter 8, section 8.5.4/8.5.5. At a
0
1,000,000
2,000,000
3,000,000
4,000,000
5,000,000
6,000,000
7,000,000
8,000,000
9,000,000P
eak
are
a
Reaction compounds

96 | P a g e A n g e l a E . N e w t o n
concentration of 0.2 M the phosphate buffer was roughly 50% of the maximum buffer concentration
used by Bell (1997) (37) and exceeded the concentration of lysine in the system. The 5% NaCl
provided 0.3 M of sodium to the reaction system which exceeds the amounts used in the study by
Rizzi (2008) (4). At these concentrations any influence of the phosphate or sodium addition should
be detected in changes to volatile compound formation. Each sample was cooked and analysed
once to provide an indication of the potential impact that the addition of sodium chloride and
phosphate buffer may have on the reactions.
There is an obvious impact on both the Maillard (figure 4.17) and the caramelisation (figure 4.18)
when the phosphate buffers are added. Any phosphates present in cream can therefore be expected
to have a large impact on the overall progress of each reaction either due to the buffering provided
or the interaction of the phosphate groups (figure 1.9).
Figure 4.17 Impact of phosphate buffer addition to the Maillard reaction. Maillard reaction
samples containing 0.2 M phosphate buffer (pH 7) shown by the green bars and samples without
phosphate buffer shown by the blue bars. This experiment was not replicated.
0
200000
400000
600000
800000
1000000
1200000
1400000
1600000
1800000
2000000
Pe
ak a
rea
Reaction compounds

97 | P a g e A n g e l a E . N e w t o n
Figure 4.18 Impact of phosphate buffer addition of the caramelisation reaction. Caramelisation
reaction samples containing 0.2 M phosphate buffer (pH 7) shown by the green bars and samples
without phosphate buffer shown by the blue bars. This experiment was not replicated.
When phosphate buffer was added to the caramelisation reaction an increase in 2,3-enolisation
compounds, maltol, hydroxymaltol and DHHF was detected. The formation of these compounds
highlighted the impact that the phosphate groups or buffering effect could be having on the reaction
as these compounds had not previously (figure 4.5) been seen under these cooking conditions.
The addition of salts such as sodium chloride did not appear to have the same effect on either
reaction. The addition of 5% sodium chloride to both the Maillard reaction (figure 4.19) and the
caramelisation reaction (figure 4.20) did not result in a change in relative amounts of volatile
compounds that were formed as large as that seen when the phosphates were added to the system.
The addition of sodium chloride to the Maillard reaction lead to lower formation of volatile
compounds with the exception of furfuryl alcohol and 2(5H)-furanone. A similar general decrease in
compound formation was seen in the caramelisation reaction; however, increases in furfural and 2-
acetylfuran were detected.
0
20,000
40,000
60,000
80,000
100,000
120,000
140,000
160,000
180,000
200,000
Pe
ak a
rea
Reaction compounds
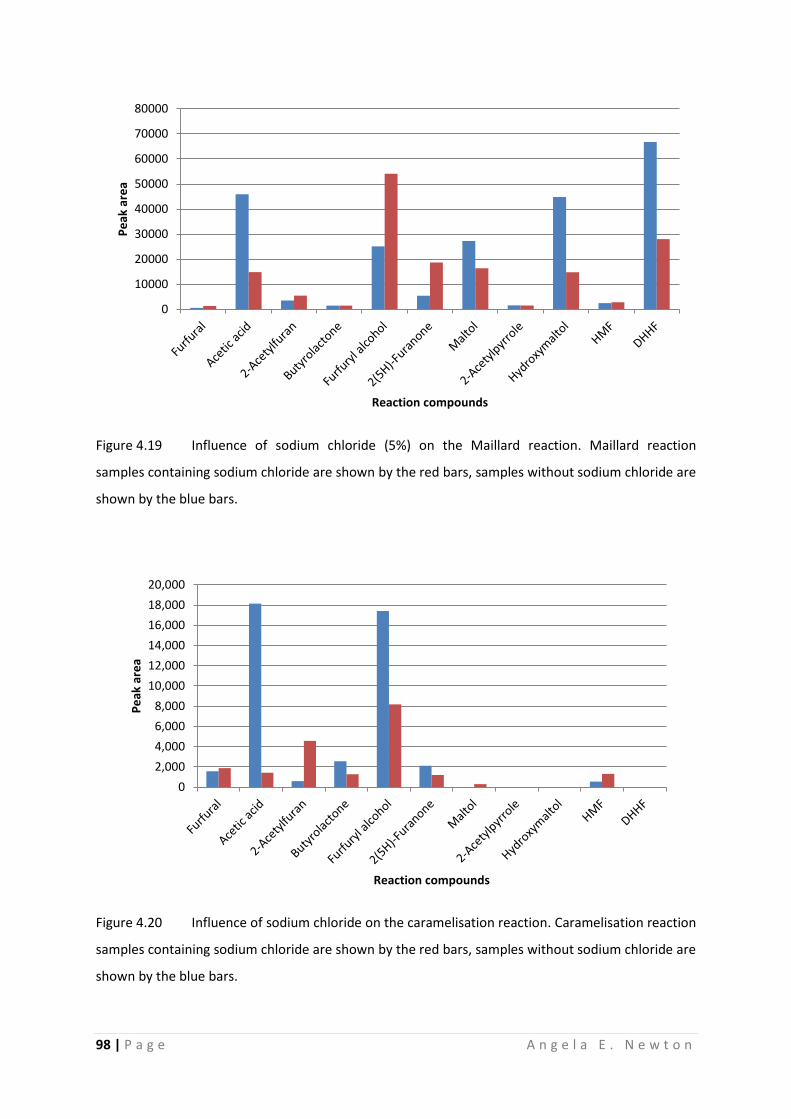
98 | P a g e A n g e l a E . N e w t o n
Figure 4.19 Influence of sodium chloride (5%) on the Maillard reaction. Maillard reaction
samples containing sodium chloride are shown by the red bars, samples without sodium chloride are
shown by the blue bars.
Figure 4.20 Influence of sodium chloride on the caramelisation reaction. Caramelisation reaction
samples containing sodium chloride are shown by the red bars, samples without sodium chloride are
shown by the blue bars.
0
10000
20000
30000
40000
50000
60000
70000
80000P
eak
are
a
Reaction compounds
0
2,000
4,000
6,000
8,000
10,000
12,000
14,000
16,000
18,000
20,000
Pe
ak a
rea
Reaction compounds

99 | P a g e A n g e l a E . N e w t o n
The increase of the amount of some compounds formed when phosphates are present and the
general decrease in compound formation when sodium chloride was added to the system
demonstrates the different influences that the salt components of cream can have on the system.
Additionally, salts can influence the structure of the matrix as well as the reactions (38).Therefore
for the purposes of keeping the reactions as simple as possible, the salts were not added to the
model reaction when changing the structural matrix.
4.7 Conclusion
The reactions occurring in cream while it is being cooked were modelled based on the
caramelisation reaction and the Maillard reaction. These model reaction systems were simplified to
lactose and lysine in an effort to remove the majority of further confounding chemical factors. Based
on experimental evidence, these reaction systems behaved in a similar way to cream when different
parameters such as time, temperature and pH were changed. Differences that were seen in the
results can be explained, in part, by the presence of buffers and salts in cream, the differences may
be able to be further explained by the presence of lipids and the emulsion structure of cream. The
next step was to establish the model structural matrix, using a step by step build so that each part of
the matrix could be studied and its role determined in a systematic fashion.
As described in chapters 5 and 6, building the aqueous matrix into a cream-like matrix involved
adding several structural components: an oil phase following by an emulsion structure containing
emulsifiers. The contribution of each component and each of the various parameters associated with
these components was explored using the model reactions developed in this chapter. The influence
of the addition of fat on the reaction outcome can be found in chapter 5, followed by a study into
the influence of emulsion structure in chapter 6.

100 | P a g e A n g e l a E . N e w t o n
4.8 References
1. Ajandouz, E. H.; Tchiakpe, L. S.; Dalle Ore, F.; Benajiba, A.; Puigserver, A., Effects of pH on caramelization and Maillard reaction kinetics in fructose-lysine model systems. Journal of Food Science 2001, 66, 926-931.
2. Ajandouz, E. H.; Desseaux, V.; Tazi, S.; Puigserver, A., Effects of temperature and pH on the kinetics of caramelisation, protein cross-linking and Maillard reactions in aqueous model systems. Food Chemistry 2008, 107, 1244-1252.
3. van Boekel, M. A. J. S., Effect of heating on Maillard reactions in milk. Food Chemistry 1998, 62, 403-414.
4. Rizzi, G. P., Effects of cationic species on visual color formation in model Maillard reactions of pentose sugars and amino acids. Journal of Agricultural and Food Chemistry 2008, 56, 7160-7164.
5. Philippe, E.; Seuvre, A. M.; Colas, B.; Langendorff, V.; Schippa, C.; Voilley, A., Behavior of flavor compounds in model food systems: a thermodynamic study. Journal of Agricultural and Food Chemistry 2003, 51, 1393-1398.
6. Brands, C. M. J.; van Boekel, M., Reactions of monosaccharides during heating of sugar-casein systems: Building of a reaction network model. Journal of Agricultural and Food Chemistry 2001, 49, 4667-4675.
7. Nursten, H. E., The Maillard reaction: chemistry, biochemistry and implications. RSC Publishing: Cambridge, UK, 2005.
8. Ledl, F.; Schleicher, E., New aspects of the Maillard reaction in foods and in the human body. Angewandte Chemie - International Edition 1990, 29, 565-594.
9. Gerrard, J. A., New aspects of an AGEing Chemistry - Recent developments concerning the Maillard reaction. Australian Journal of Chemistry 2002, 55, 299-310.
10. van Boekel, M. A. J. S., Formation of flavour compounds in the Maillard reaction. Biotechnology Advances 2006, 24, 230-233.
11. Berg, H. E.; Vanboekel, M., Degradation of lactose during heating of milk. 1. Reaction pathways. Netherlands Milk and Dairy Journal 1994, 48, 157-175.
12. Aider, M.; de Halleux, D., Isomerization of lactose and lactulose production: review. Trends in Food Science and Technology 2007, 18, 356-364.
13. van Boekel, M. A. J. S.; Brands, C. M. J., Heating of sugar-casein solutions: Isomerization and Maillard reactions. In The Maillard reaction in foods and medicine, O'Brien, J.; Nursten, H. E.; Crabbe, M. J.; Ames, J. M., Eds. Woodhead publishing: Cambridge, UK, 1998; pp 154-159.
14. van Boekel, M. A. J. S., Kinetic modelling of sugar reactions in heated milk-like systems. Netherlands Milk and Dairy Journal 1996, 50, 245-266.
15. Wang, Y.; Juliani, H. R.; Simon, J. E.; Ho, C. T., Amino acid-dependent formation pathways of 2-acetylfuran and 2,5-dimethyl-4-hydroxy-3(2H)-furanone in the Maillard reaction. Food Chemistry 2009, 115, 233-237.

101 | P a g e A n g e l a E . N e w t o n
16. Wang, Y.; Ho, C. T., Comparison of 2-acetylfuran formation between ribose and glucose in the Maillard reaction. Journal of Agricultural and Food Chemistry 2008, 56, 11997-12001.
17. Shaw, P. E.; Tatum, J. H.; Berry, R. E., 2,3-dihydro-3,5-dihydroxy-6-methyl-4(H)-pyran-4-one, A degradation product of a hexose. Carbohydrate Research 1971, 16, 207-213.
18. Kim, M. O.; Baltes, W., On the role of 2,3-dihydro-3,5-dihydroxy-6-methyl-4(H)-pyran-4-one in the Maillard reaction. Journal of Agricultural and Food Chemistry 1996, 44, 282-289.
19. Parker, J. K., The kinetics of thermal generation of flavour. Journal of the Science of Food and Agriculture 2013, 93, 197-208.
20. Shimamura, T.; Kurogi, Y.; Katsuno, S.; Kashiwagi, T.; Ukeda, H., Demonstration of the presence of aminoreductone formed during the Maillard reaction in milk. Food Chemistry 2011, 129, 1088-1092.
21. Trang, V. T.; Shimamura, T.; Kashiwagi, T.; Ukeda, H.; Katsuno, S., Elucidation of mechanism of aminoreductone formation in the Maillard reaction of lactose. International Journal of Dairy Technology 2011, 64, 188-196.
22. Pischetsrieder, M.; Schoetter, C.; Severin, T., Formation of an aminoreductone during the Maillard reaction of lactose with N-alpha-acetyllysine or proteins. Journal of Agricultural and Food Chemistry 1998, 46, 928-931.
23. TheGoodScentsCompany, Flavours and fragrances. In http://www.thegoodscentscompany.com/, 2012.
24. Wong, K. H.; Aziz, S. A.; Mohamed, S., Sensory aroma from Maillard reaction of individual and combinations of amino acids with glucose in acidic conditions. International Journal of Food Science and Technology 2008, 43, 1512-1519.
25. Davidek, T.; Devaud, S.; Robert, F.; Blank, I., Sugar fragmentation in the Maillard reaction cascade: Isotope labeling studies on the formation of acetic acid by a hydrolytic beta-dicarbonyl cleavage mechanism. Journal of Agricultural and Food Chemistry 2006, 54, 6667-6676.
26. Keogh, M. K., Anhydrous milk fat. 5. Deep fat frying. Irish Journal of Food Science and Technology 1989, 13, 129-140.
27. Shrestha, A. K.; Howes, T.; Adhikari, B. P.; Bhandari, B. R., Spray drying of skim milk mixed with milk permeate: Effect on drying behavior, physicochemical properties, and storage stability of powder. Drying Technology 2008, 26, 239-247.
28. Martins, S.; Van Boekel, M., Kinetics of the glucose/glycine Maillard reaction pathways: influences of pH and reactant initial concentrations. Food Chemistry 2005, 92, 437-448.
29. Yu, A. N.; Zhang, A. D., The effect of pH on the formation of aroma compounds produced by heating a model system containing L-ascorbic acid with L-threonine/L-serine. Food Chemistry 2010, 119, 214-219.
30. Pauletti, M. S.; Matta, E. J.; Rozycki, S., Kinetics of heat-induced browning in concentrated milk with sucrose as affected by pH and temperature. Food Science and Technology International 1999, 5, 407-413.
102 | P a g e A n g e l a E . N e w t o n
31. Salaun, F.; Mietton, B.; Gaucheron, F., Buffering capacity of dairy products. International Dairy Journal 2005, 15, 95-109.
32. Novotny, O.; Cejpek, K.; Velisek, J., Formation of carboxylic acids during degradation of monosaccharides. Czech Journal of Food Sciences 2008, 26, 117-131.
33. Smuda, M.; Voigt, M.; Glomb, M. A., Degradation of 1-deoxy-D-erythro-hexo-2,3-diulose in the presence of lysine leads to formation of carboxylic acid amides. Journal of Agricultural and Food Chemistry 2010, 58, 6458-6464.
34. Hajek, J.; Murzin, D. Y.; Salmi, T.; Mikkola, J. P., Interconversion of lactose to lactulose in alkaline environment: comparison of different catalysis concepts. Topics in Catalysis 2013, 56, 839-845.
35. Ganzle, M. G.; Haase, G.; Jelen, P., Lactose: Crystallization, hydrolysis and value-added derivatives. International Dairy Journal 2008, 18, 685-694.
36. van Boekel, M. A. J. S., Kinetic aspects of the Maillard reaction: a critical review. Nahrung - Food 2001, 45, 150-159.
37. Bell, L. N., Maillard reaction as influenced by buffer type and concentration. Food Chemistry 1997, 59, 143-147.
38. Zhang, J. C.; Li, L.; Wang, J.; Sun, H. G.; Xu, J.; Sun, D. J., Double inversion of emulsions induced by salt concentration. Langmuir 2012, 28, 6769-6775.
103 | P a g e A n g e l a E . N e w t o n
Chapter 5 The role of fat in the Maillard and caramelisation reactions
5.1 Introduction
This chapter takes the model reaction systems developed in chapter 4 and introduces a fat
component as part of the colloidal structure to probe the role of fat when the reaction systems are
cooked at high temperatures. In the context of this study the term fat covers both liquid oils and
solid lipids of plant and animal origins. Fat present in a food system can have various roles as part of
the material functionality, flavour perception, texture and the health attributes of that system (1).
The properties and functionality of fats are determined by their fatty acid components, which have
different levels of saturation and different chain lengths (1). The length of the chains and degree of
saturation affect the melting point and the crystal structure of the fat at different temperatures.
Addition of fat to a food matrix or reaction matrix has the potential to change the properties of the
overall system and, therefore, the course of the reaction or behaviour of a reaction in the selected
matrix. The properties of a system that change upon the addition of fat may include the polarity, the
specific heat capacity and mass transfer parameters. It has also been suggested that particular free
fatty acids can have an influence on compound formation (2, 3).
Fat has a low polarity and is hydrophobic; therefore, the addition of fat to an aqueous matrix will
generally provide a second phase. This second phase has properties substantially different from
those of the initial water phase, which leads to the partitioning and mass transfer of reactants,
reaction intermediates and final volatile compounds across the two phases (4, 5). The partition
coefficient of each compound will determine which of the two phases the compounds are in. Milk
fat and plant oils have different chemical compositions and physical properties and so differences in
partitioning are very likely. The partitioning of reaction products into the fat phase may move the
position of equilibrium in the aqueous phase and so lead to product formation (5-7).
Canola oil and anhydrous milk fat (AMF) were the fats chosen for addition to the model reaction
system as set out in section 8.6. Anhydrous milk fat, derived from dairy products, contains a large
percentage of shorter saturated fatty acid chains, and usually needs to be heated above 40 °C for all
the fat to be melted (Fonterra product bulletin, appendix B). Canola oil has a higher percentage of
longer unsaturated fatty acid chains and is a liquid at room temperature (8). These two fats also
have different densities, specific heat capacities and thermal conductivity properties (8). The
addition of fat to the aqueous reaction created a reaction environment that contained two phases
each with different physical properties, which will be referred to as the two phase system. The use

104 | P a g e A n g e l a E . N e w t o n
of two different fats allowed the impact of the particular properties of that fat on the reactions to be
investigated as well as the general impact of fat addition.
The effect of changes in heat transfer throughout a reaction system along with moisture evaporation
need to be considered as the addition of fat (and the specific properties of the fat) will have an
influence over these parameters, which in turn can influence the Maillard and caramelisation
reactions (9). It has already been shown that the formation of volatile compounds in ghee (section
3.4) and the model systems (section 4.4) changes with cooking temperature. However, the internal
temperature of the system is not always the same as the set cooking temperature (10). The internal
temperature of the sample relies on the heat transfer of the system as determined by the thermal
properties of the reaction medium (11).
A considerable amount of research has been undertaken on the participation of lipids and the
carbonyl groups of oxidised lipids in the Maillard reaction (12-15). The work in this chapter looks at
the influence of fat on the physical parameters of the reaction system that influence the Maillard
and caramelisation reactions to generate flavours other than those arising from methyl ketones and
aldehydes which are generated from fats (section 1.3.5).
5.2 The influence of fat on the Maillard reaction
The PCA plot (figure 5.1) comparing samples (chapter 8, section 8.6) cooked in a 100% aqueous
reaction medium and those cooked in a 60% aqueous medium with added fat indicates a clear
difference in the formation of volatile compounds. The addition of the fat to the matrix generated a
significant difference (p value <0.05, as determined by ANOVA (appendix C, table C1)) and figure 5.2
demonstrates that the difference generated was an overall increase in volatile compound intensity
within the cooked sample. A significant increase was seen in most of the compounds measured in
the Maillard model reaction system, the exceptions being acetic acid, hydroxymaltol and DHHF.

105 | P a g e A n g e l a E . N e w t o n
43210-1-2-3-4
3
2
1
0
-1
-2
-3
First Component (variation = 70%)
Se
co
nd
Co
mp
on
en
t (v
ari
ati
on
= 1
7%
)
Figure 5.1 PCA of the influence of fat on the Maillard reaction. Samples containing 40% fat and
60% aqueous phase are shown by red squares and samples with 100% aqueous phase are black
circles.
Figure 5.2 Influence of fat (samples containing canola oil shown by red bars, samples
containing no canola oil shown by blue bars) on the formation of volatile compounds by the Maillard
reaction (Error is based on standard deviation of six samples).
0
200,000
400,000
600,000
800,000
1,000,000
1,200,000
Pe
ak a
rea
Reaction compounds
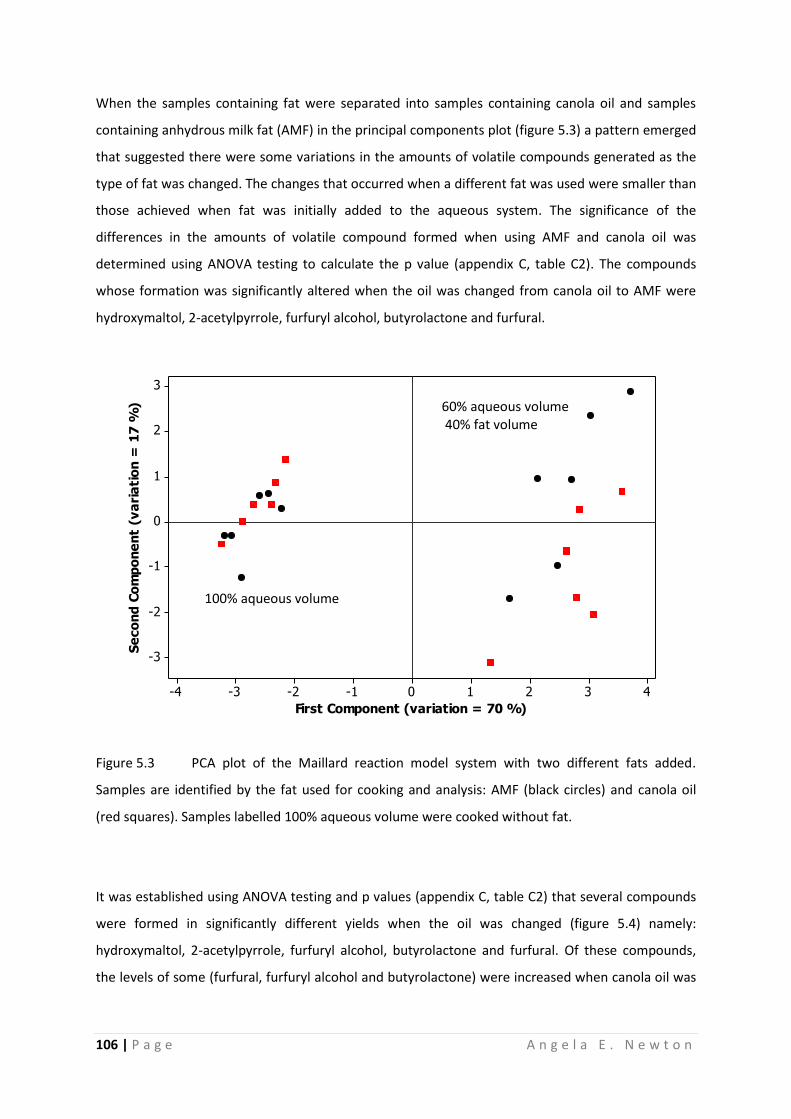
106 | P a g e A n g e l a E . N e w t o n
When the samples containing fat were separated into samples containing canola oil and samples
containing anhydrous milk fat (AMF) in the principal components plot (figure 5.3) a pattern emerged
that suggested there were some variations in the amounts of volatile compounds generated as the
type of fat was changed. The changes that occurred when a different fat was used were smaller than
those achieved when fat was initially added to the aqueous system. The significance of the
differences in the amounts of volatile compound formed when using AMF and canola oil was
determined using ANOVA testing to calculate the p value (appendix C, table C2). The compounds
whose formation was significantly altered when the oil was changed from canola oil to AMF were
hydroxymaltol, 2-acetylpyrrole, furfuryl alcohol, butyrolactone and furfural.
43210-1-2-3-4
3
2
1
0
-1
-2
-3
First Component (variation = 70 %)
Se
co
nd
Co
mp
on
en
t (v
ari
ati
on
= 1
7 %
)
Figure 5.3 PCA plot of the Maillard reaction model system with two different fats added.
Samples are identified by the fat used for cooking and analysis: AMF (black circles) and canola oil
(red squares). Samples labelled 100% aqueous volume were cooked without fat.
It was established using ANOVA testing and p values (appendix C, table C2) that several compounds
were formed in significantly different yields when the oil was changed (figure 5.4) namely:
hydroxymaltol, 2-acetylpyrrole, furfuryl alcohol, butyrolactone and furfural. Of these compounds,
the levels of some (furfural, furfuryl alcohol and butyrolactone) were increased when canola oil was
100% aqueous volume
60% aqueous volume 40% fat volume

107 | P a g e A n g e l a E . N e w t o n
used instead of AMF, whilst the levels of other compounds (hydroxymaltol and 2-acetylpyrrole)
decreased with the use of canola oil.
Figure 5.4 Influence of fat type on the Maillard reaction. Error bars are the standard deviation
of replicate samples for this experiment. Maltol values are underestimated due to poor peak shape.
Blue bars represent samples containing AMF as the fat phase, and samples containing canola oil are
shown in red. The error bars represent the standard deviation of six replicate samples.
5.3 The influence of fat on the caramelisation reaction
The caramelisation reaction behaved differently to the Maillard reaction when fat was added to the
system (figure 5.5). The difference between the samples with fat and without fat was not as large
when plotted on a PCA plot and compared to the differences seen in the Maillard reaction (figure
5.1).
When fat (canola) was added to the caramelisation model (figure 5.6) several compounds exhibited
a significant change including DHHF, furfuryl alcohol, butyrolactone, 2-acetylfuran, furfural and
acetic acid (appendix C, table C3). Of these compounds, furfural and 2-acetylfuran increased in yield
when the fat was added, whilst DHHF, furfuryl alcohol, butyrolactone and acetic acid decreased
when fat was added to the system.
0
200,000
400,000
600,000
800,000
1,000,000
1,200,000
Pe
ak a
rea
Reaction compounds

108 | P a g e A n g e l a E . N e w t o n
43210-1-2-3
3
2
1
0
-1
-2
First Component (variation = 52%)
Se
co
nd
Co
mp
on
en
t (v
ari
ati
on
= 2
4%
)
Figure 5.5 PCA plot of the differences between caramelisation reaction samples containing fat
(red squares) and samples without fat (black circles).
Figure 5.6 The addition of fat (canola) to the caramelisation reaction matrix. Samples with
100% aqueous phase are shown in blue while samples containing 60% aqueous phase plus canola oil
are shown in red. Error bars are based on the standard deviation of six samples within the
experiment.
0
5,000
10,000
15,000
20,000
25,000
30,000
Pe
ak a
reas
Reaction compounds

109 | P a g e A n g e l a E . N e w t o n
When considering the impact of fat on the caramelisation reaction (figure 5.6) the addition of fat
appears to have significant impact on some of the compounds, with acetic acid, furfural, 2-
acetylfuran, butyrolactone, furfuryl alcohol and DHHF having a calculated p value <0.05 when fat
was added to the system (appendix C, table C3). When a closer look is taken at the PCA plot (figure
5.7) to determine the impact of the different types of fat (AMF versus canola) it appears that there is
a shift in the overall compound profile. However, it is only a small shift when compared with the
overall shift in the profile generated by the addition of fat to the aqueous system.
43210-1-2-3
3
2
1
0
-1
-2
First Component (variation = 52%)
Se
co
nd
Co
mp
on
en
t (v
ari
ati
on
= 2
4%
)
Figure 5.7 PCA plot of the influence the type of fat has on the caramelisation reaction. AMF is
represented by the black circles, canola oil samples are represented by red squares.
The change in compound profile identified in the PCA plot (figure 5.7) was due to the significant
shifts in the levels of acetic acid, 2(5H)-furanone, furfuryl alcohol and buytrolactone formed
(appendix C, table C4). The amounts of these compounds all decreased when canola oil was used
instead of AMF (figure 5.8). The changes in the caramelisation reaction with the addition of fat and
by changing the type of fat were small compared with the changes occurring in the Maillard reaction
(figure 5.9).
100%
aqueous
volume
60% aqueous volume 40 % fat

110 | P a g e A n g e l a E . N e w t o n
Figure 5.8 Changes occurring in the formation of the volatile compounds when the fat phase of
the caramelisation reaction was changed from canola oil (red bars) to AMF (blue bars). The error
bars represent the standard deviation of six replicate samples.
6543210-1-2-3
3
2
1
0
-1
-2
-3
First Component (variation = 79%)
Se
co
nd
Co
mp
on
en
t (v
ari
ati
on
= 9
%)
Figure 5.9 PCA plot of the variation in compound profiles achieved using caramelisation
reaction versus Maillard reaction, aqueous versus two phase matrix and different fats. The
caramelisation reaction is shown in green diamonds (canola oil) and black circles (AMF) with the
Maillard reaction represented by red squares (AMF) and blue triangles (canola oil).
0
5,000
10,000
15,000
20,000
25,000
30,000P
eak
are
a
Reaction compounds
Caramelisation
reaction –all
samples
Maillard reaction
– No fat
Maillard reaction
– with fat

111 | P a g e A n g e l a E . N e w t o n
5.4 Aqueous concentration effect
The model reactants were dissolved in the aqueous portion of the reaction environment. The total
reactant concentration was kept the same for both the aqueous and two phase samples. This was
achieved by increasing the reactant concentration in the aqueous phase of the two phase samples
due to the lack of reactant solubility in the fat. Therefore, each sample contains the same quantity of
reactants; however, they are dissolved in a different volume. The aqueous matrix samples have an
aqueous volume of 100% and the two phase matrix samples have an aqueous volume of 60%.
Control testing (chapter 8, section 8.6.1) on the different aqueous concentrations (both contain
0.272 mmol lysine and/or 0.174 mmol lactose per 2 ml or 1.2 ml sample) showed that the aqueous
concentration had no significant impact on the overall results of the Maillard (figure 5.10) (appendix
C, table C5) and caramelisation reactions (figure 5.11) (appendix C, table C6). Any of the monitored
compounds that were influenced by the concentration of the aqueous phase were expected to
increase in yield at higher aqueous concentrations. However, there were no large increases in the
formation of volatile compounds across either the Maillard (figure 5.10) or caramelisation (figure
5.11) reactions indicating that the aqueous concentration was not an influencing factor for the
model reaction system under these conditions.
Figure 5.10 Aqueous concentration effects on the Maillard reaction. Samples containing
0.174 mmol lactose and 0.272 mmol lysine in 2 ml shown as blue bars and samples containing the
same quantities in 60% volume (1.2 ml) are shown as green bars. Error bars represent the standard
deviation of six replicate samples.
0
50,000
100,000
150,000
200,000
250,000
300,000
350,000
400,000
450,000
Pe
ak a
rea
Reaction compounds

112 | P a g e A n g e l a E . N e w t o n
Figure 5.11 Aqueous concentration effects on the caramelisation reaction. Samples
containing 0.174 mmol lactose in 2 ml are shown as blue bars and samples containing the same
quantities in 60% volume (1.2 ml) are shown as green bars. The error bars represent the standard
deviation of six replicate samples.
5.5 Reaction temperature and evaporation
The increase in formation of volatile compounds across the cross section of selected compounds
suggests that the reaction rates of the initial stages of the Maillard reaction increased with the
addition of the fat. The addition of fat provided the reaction matrix with a solvent that unlike water
does not evaporate as the temperature approaches 135 °C. When the reactants were heated in a
100% aqueous system the water evaporated as the temperature reached 100 °C to leave only solid
reactants behind. This complete evaporation of the water potentially creates a situation where the
reactants may have limited mobility and are being dry roasted together (16, 17). When the two
phase system was heated the water evaporated but the fat remained. The fat provided a solvent
environment where the reactants and intermediate compounds have a degree of mobility that may
lead to a higher rate of particular reactions and correspondingly the higher product yields that were
seen in the results. Figure 5.12 provides an indication of the rate of evaporation overlaid with the
temperature profile of the system. (See chapter 8, section 8.6.2 for experimental details.) This
temperature/time profile was the same for both the caramelisation and Maillard reaction samples.
The Maillard reaction is directly influenced by cooking temperature (18-20) and although the
cooking temperature was maintained at 135 °C the internal temperature of the sample being cooked
was not necessarily the same as the applied external cooking temperature (10). The heat transfer
0
5,000
10,000
15,000
20,000
25,000
30,000
35,000P
eak
are
a
Reaction compounds

113 | P a g e A n g e l a E . N e w t o n
properties of the matrix determines the temperature inside the sample (9, 21) and it is expected
that heat transfer would become more important as the sample size increases relative to the heating
surface. Therefore for the small samples that were utilised for these experiments the temperature
gradient across the sample it is expected that would be small. The influence of temperature on the
aqueous model reaction system is shown in figure 4.6, where the final compound yields were
increased with increasing temperature. Figure 5.12 demonstrates how the internal temperature
changed in the aqueous samples when compared to the two phase samples as the cooking time
progressed and the water and other volatiles evaporated from the reaction matrix. After an initial
rise in temperature to ~100 °C, the temperature plateaus until the water has evaporated from the
system. The water from the two phase sample evaporated several minutes earlier than the 100%
aqueous sample and therefore the temperature of the sample increased above 100 °C after a
shorted time period. This prolonged increase in temperature leads to an increase in the rate of the
Maillard reaction.
Figure 5.12 Evaporation and temperature profile of the samples in different matrices (cooked at
135 °C for 20 min with stirring). The internal temperature of aqueous samples is shown in purple
with temperature of the two phase samples in pale blue. The corresponding evaporation of the
aqueous samples is shown in dark blue with that of the two phase samples represented in red. The
two phase matrix contains canola oil.
The time of the increase in temperature of the two phase system (figure 5.12) corresponds to the
time at which product formation in the Maillard reaction increased (figure 5.13a). Comparatively the
0
20
40
60
80
100
120
140
0
10
20
30
40
50
60
70
80
90
100
0 5 10 15 20
Tem
pe
ratu
re (°C
)
Sam
ple
eva
po
rati
on
(%
)
Time (minutes)

114 | P a g e A n g e l a E . N e w t o n
formation of volatile compounds in the aqueous system was much slower and occurred several
minutes later in the cooking process (figure 5.13b).
Figure 5.13 (a) Maillard reaction time series for the two phase reaction (60% aqueous, 40% fat).
(b) Maillard reaction time series plot for 100% aqueous reaction.
5.6 Participation of fat in the Maillard reaction
Although the fat was added to the reaction matrix as a structural component and changed the
physical properties of that matrix, there was also the possibility that there were reactions occurring
between the dicarbonyl groups of lipid oxidation products and the amines (12-14, 22). The Maillard
model system has an excess of amino groups that could react with the dicarbonyl groups. Such
reactions could offer a possible explanation as to why the changes observed in the caramelisation
reaction were smaller when fat was added, as there are no amino groups for the lipid oxidation
products to interact with.
The results generated when the type of fat used in the Maillard reaction system was changed from
AMF to canola oil indicated a change in volatile compound formation and for some compounds this
was a significant change. Canola oil consists of a large percentage of unsaturated C18 fatty acids (8)
0
500,000
1,000,000
1,500,000
2,000,000
2,500,000
2 4 6 8 10 12 14 18 20
0
500,000
1,000,000
1,500,000
2,000,000
2,500,000
2 4 6 8 10 12 14 16 18 20
b
Time (minutes)
Pea
k ar
ea
a
115 | P a g e A n g e l a E . N e w t o n
that have been studied for their impact on flavour formation in meat-like model systems (2) in which
it was found that different degrees of unsaturation could inhibit or promote the Maillard reaction.
Therefore a set of reaction samples were set up containing only lysine in the two phase system
(canola oil) to investigate the potential of product formation via reaction with any lipid oxidation
products under the standard reaction conditions. The experiment indicated that none of the
Maillard reaction products that were monitored were formed at detectable levels (data not shown).
5.7 The partitioning effect of the two phase reaction matrix
The changes seen in the reaction compound profiles when fat was added to the Maillard reaction,
and to a lesser degree to the caramelisation reaction, can be attributed to the changes in the
physical properties of the reaction matrix. The properties of the reaction matrix may have the
capability to alter the final compound profile by changing the reactant and intermediate compound
partitioning within the reaction matrix and therefore provide an explanation as to why the change in
volatile compound yield was seen.
The introduction of the hydrophobic fat phase leads to a potential partitioning effect between the
fat phase and the water phase. The initial reactants (lactose and lysine) are water soluble. However,
as the reaction progresses some intermediate products are less water soluble, and indeed many of
the final volatile compounds have limited water solubility. The partitioning of compounds between
the aqueous and fat phases can impact the position of the equilibrium of any reaction by removing
intermediates and/or products from the aqueous phase and into the fat phase. In particular, HMF is
one component that has been shown to accumulate in the oil phase due to partitioning (23, 24).
Each compound has a partition coefficient (logP value) that is dependent on its structure (4, 25).
Most logP values are obtained by measuring the amount of a compound partitioned in a hydrophilic
phase, normally water, versus the amount partitioned into the hydrophobic phase, usually octanol
(4). A positive logP value indicates that the compound partitions preferentially into a lipophilic
phase. If the value approaches zero and becomes negative the compounds partition into the
aqueous hydrophilic phase (4).
Across the two reaction systems the compounds that exhibit the largest changes in yield when fat
was added are also those compounds that have a positive (lipophilic) logP value. The reaction
mechanisms by which the compounds of interest are formed go through several intermediates, and
analysis of their structure indicates that they would be expected to become more lipophilic as the
reaction progresses along the mechanistic pathway to the final product (figure 5.14). If this is the

116 | P a g e A n g e l a E . N e w t o n
case, then the early reaction equilibrium may be driven by the intermediate products moving into
the fat phase and pulling the equilibrium in favour of the product.
When fat is added to the system there is a large increase in maltol formation and an insignificant
change in hydroxymaltol formation, suggesting that more of the intermediate products are forming
in the presence of fat and that the intermediates are then forming higher quantities of maltol
relative to hydroxymaltol. A hypothesised mechanism through a common intermediate is shown in
figure 5.14 (26-28). This may be a partitioning effect due to the relative lipophilicity of maltol (logP =
0.090) (29) when compared with hydroxymaltol (logP = -0.420) (29) altering the equilibrium between
these two compounds.
CH3
O
O
H O-gal
H OH
CH2OH
Deoxy-2,3-hexodiulose
OHO
O
Ogal
OH
H
O
Ogal
HOOH
HO
H+
O
O
HO OH
Hydroxymaltol
H+
logP = -0.420
O
O
HO
Maltol
logP = 0.090
Figure 5.14 Schematic of the hypothesised pathways to hydroxymaltol and maltol via a common
intermediate (26-28).
5.8 Conclusion
The presence of fat in the Maillard and caramelisation reactions affects volatile compound
formation. The addition of fat to the reaction matrix containing the Maillard reaction model
reactants generated an increase in all of the volatile compounds formed. The caramelisation
reaction exhibited a less generalised increase, and only a few compounds were increased when fat
was added. Since these volatile compounds indicate the potential for flavour within the system, this
117 | P a g e A n g e l a E . N e w t o n
implies that in a cooked food system fat can enhance flavour formation, and that a low fat food may
contain fewer flavours formed during cooking. Therefore, when flavour formation during cooking is
important to a food’s finished flavour a reduction in fat can be detrimental.
Changing the added fat from canola oil (an unsaturated fat) to AMF (a saturated dairy fat) led to
small changes in the final volatile compound profile for both the Maillard and caramelisation
reactions. Relative to other influencing factors, such as the addition of fat and reaction type, the
differences seen when the type of fat was changed from AMF to canola oil were statistically less
significant. However, given the different flavour thresholds of the compounds, changing the type of
fat could still generate a significant flavour difference in the final product. Further experiments
would be required to fully explore how the individual components of fat influence the reactions.
The fat could be participating by regulating the temperature of the system and allowing reactants to
maintain mobility by providing a liquid solvent environment after the water has evaporated. A
correlation between increased reaction temperature and increased volatile compound formation
was seen when cream and the aqueous reaction system were cooked and this could quite plausibly
be responsible for some of the changes seen in the two phase system.
There was no evidence of any direct reaction occurring between any lipid oxidation products and
amino acids. However, this does not rule out the possibility of other lipid oxidation product
involvement at some point in the complex reaction cascade leading from reagents to final volatile
products.
It was demonstrated that the flavours that were formed via the Maillard reaction mechanisms can
be enhanced with the addition of fat: when a sugar based system where amino acids are not
present, or are limited, the influence of fat was smaller. Some of the changes can be rationalised by
considering partitioning effects between the oil and water phases. Based on these results, it can be
concluded that the fat component of cream could have an important role in the generation of
flavour in ghee. Whilst on the one hand increasing amounts of focus has been placed on low fat
foods and on the other consumers are unwilling to compromise on flavour, serious consideration has
to be given to the role the fat plays when foods are cooked.

118 | P a g e A n g e l a E . N e w t o n
5.9 References
1. Marangoni, A. G.; Acevedo, N.; Maleky, F.; Co, E.; Peyronel, F.; Mazzanti, G.; Quinn, B.; Pink, D., Structure and functionality of edible fats. Soft Matter 2012, 8, 1275-1300.
2. Van Ba, H.; Amna, T.; Hwang, I., Significant influence of particular unsaturated fatty acids and pH on the volatile compounds in meat-like model systems. Meat Science 2013, 94, 480-488.
3. Toyosaki, T., Sakane, Y., and Kasai, M., Effects of medium-chain triacylglycerols (MCT) on the Maillard reaction. Journal of Food Processing and Technology 2013, 4.
4. Leo, A.; Hansch, C.; Elkins, D., Partition coefficients and their uses. Chemical Reviews 1971, 71, 525-616.
5. Dunstan, T. S.; Fletcher, P. D. I., Compartmentalisation and separation of aqueous reagents in the water droplets of water-in-oil high internal phase emulsions. Langmuir 2011, 27, 3409-3415.
6. Holmberg, K., Organic reactions in microemulsions. European Journal of Organic Chemistry 2007, 731-742.
7. Simonyan, G. S.; Beileryan, N. M., Michael condensation in a two-phase system: The application of inverse phase-transfer catalysis to the reaction of butyl acrylate with diethylamine in a water-heptane system. Kinetics and Catalysis 2002, 43, 337-340.
8. Przybylski, D. R., Canola Oil: physical and chemical properties. In Canola council of Canada: http://www.canolacouncil.org/publication-resources/print-resources/technical-sheets/canola-oil-physical-and-chemical-properties/, 2011; pp 1-6.
9. Edmondson, P. T.; Grammatika, M.; Fryer, P. J.; Handy, B., Modelling of heat transfer, mass transfer and flavour development in chocolate crumb. Food and Bioproducts Processing 2005, 83, 89-98.
10. Lioumbas, J. S.; Karapantsios, T. D., Evaporation front compared with crust thickness in potato deep-fat frying. Journal of Food Science 2011, E17-E25.
11. Souza, E. C.; Fontan, R. C. I.; Verissimo, L. A. A.; Sampaio, V. S.; Silva, W. S.; Bonomo, R. C. F.; Veloso, C. M., Thermal diffusivity and specific heat of bovine milk affected by temperature and composition. International Journal of Food Engineering 2012, 8, 1-15.
12. Whitfield, F. B., Volatiles from interactions of Maillard reactions and lipids. Critical Reviews in Food Science and Nutrition 1992, 31, 1-58.
13. Ho, C. T.; Chen, Q. Y., Lipids in food flavours - An overview. In Lipids in food flavors, Ho, C. T.; Hartman, T. G., Eds. American Chemical Society: Washington, DC, United States of America, 1994; Vol. 558, pp 2-14.
14. Karademir, Y.; Goncuoglu, N.; Gokmen, V., Investigation of heat induced reactions between lipid oxidation products and amino acids in lipid rich model systems and hazelnuts. Food and Function 2013, 4, 1061-1066.
15. Potes, N.; Kerry, J. P.; Roos, Y. H., Oil as reaction medium for glycation, oxidation, denaturation, and aggregation of whey protein systems of low water activity. Journal of Agricultural and Food Chemistry 2013, 61, 3748-3756.

119 | P a g e A n g e l a E . N e w t o n
16. Pan, G. G.; Oliver, C. M.; Melton, L. D., alpha-dicarbonyl compounds formed by nonenzymatic browning during the dry heating of caseinate and lactose. Journal of Agricultural and Food Chemistry 2006, 54, 6852-6857.
17. Pan, G. G.; Melton, L. D., Nonenzymatic browning of lactose and caseinate during dry heating at different relative humidities. Journal of Agricultural and Food Chemistry 2007, 55, 10036-10042.
18. Ajandouz, E. H.; Desseaux, V.; Tazi, S.; Puigserver, A., Effects of temperature and pH on the kinetics of caramelisation, protein cross-linking and Maillard reactions in aqueous model systems. Food Chemistry 2008, 107, 1244-1252.
19. Parker, J. K., The kinetics of thermal generation of flavour. Journal of the Science of Food and Agriculture 2013, 93, 197-208.
20. van Boekel, M. A. J. S., Kinetic aspects of the Maillard reaction: a critical review. Nahrung - Food 2001, 45, 150-159.
21. Dumas, C.; Mittal, G. S., Heat and mass transfer properties of pizza during baking. International Journal of Food Properties 2002, 5, 161-177.
22. Severini, C. R.; Lerici, C., Interaction between the Maillard reaction and lipid oxidation in model systems during high temperature treatment. Italian Journal of Food Science 1995, 7, 189-196.
23. Morales, F. J.; Jimenez-Perez, S., HMF formation during heat-treatment of milk-type products as related to milkfat content. Journal of Food Science 1999, 64, 855-859.
24. Goncuoglu, N.; Gokmen, V., Accumulation of 5-hydroxymethylfurfural in oil during frying of model dough. Journal of the American Oil Chemists Society 2013, 90, 413-417.
25. Philippe, E.; Seuvre, A. M.; Colas, B.; Langendorff, V.; Schippa, C.; Voilley, A., Behavior of flavor compounds in model food systems: a thermodynamic study. Journal of Agricultural and Food Chemistry 2003, 51, 1393-1398.
26. Kim, M. O.; Baltes, W., On the role of 2,3-dihydro-3,5-dihydroxy-6-methyl-4(H)-pyran-4-one in the Maillard reaction. Journal of Agricultural and Food Chemistry 1996, 44, 282-289.
27. Shaw, P. E.; Tatum, J. H.; Berry, R. E., 2,3-dihydro-3,5-dihydroxy-6-methyl-4(H)-pyran-4-one, A degradation product of a hexose. Carbohydrate Research 1971, 16, 207-213.
28. Yaylayan, V. A.; Mandeville, S., Stereochemical control of maltol formation in Maillard reaction. Journal of Agricultural and Food Chemistry 1994, 42, 771-775.
29. TheGoodScentsCompany, Flavours and fragrances. In http://www.thegoodscentscompany.com/, 2012.

120 | P a g e A n g e l a E . N e w t o n
Chapter 6 The role of emulsion structure in caramelisation and Maillard
reactions
6.1 Introduction
Many food products, in particular dairy products, are emulsions (1). Cream and butter are both
emulsions with different structures. Cream is an oil in water emulsion (o/w) where the oil droplets
(discrete or dispersed phase) are suspended in the water (continuous phase). Butter is the reverse
of this emulsion with a discrete phase of water and a continuous phase of oil to give a water in oil
(w/o) emulsion (2). The generation of emulsions usually requires a combination of high shear, to
create small droplets that are resistant to gravity separation, and an emulsifier that adsorbs at the
newly created interface, providing a barrier against coalescence and imparting long term stability (2,
3).
In this chapter the addition of emulsion structure to the model system is investigated. Many model
systems in literature use a thermodynamically stable emulsion, the microemulsion (4-12).
Microemulsions display a number of properties different from those of conventional emulsions (2),
including spontaneous formation, optical transparency and particular sensitivity to dilution and
thermal conditions (13). These microemulsions usually require a high level of surfactant coupled
with a low concentration of the dispersed phase. However, reactions within these microreactors can
lead to unique products (5, 6, 11, 12). This chapter looks at whether the introduction of an emulsion
structure can have a similar impact to the introduction of a microemulsion. This investigation will
allow the influence of the cream emulsion structure to be assessed.
In a microemulsion, the extremely high surface areas and orientated surfactant layers provide many
advantages to chemical reactions such as increased reaction rate, selective product formation, and
lower energy input into the reaction system (4, 6-8, 11). This is particularly useful for reactions
requiring extreme conditions, such as those involving two immiscible reactants or that contain
compounds that are sensitive to temperature and environmental conditions (6). The phases of
interest in microemulsions include discontinuous cubic phases that are optically isotropic,
completely transparent and have a gel-like consistency, cubic phases that are a bicontinuous
network of channels with a large interfacial area (12) and cubosomes (water dispersed cubic phases)
(13).
121 | P a g e A n g e l a E . N e w t o n
Vauthy et al. (12) investigated structured fluids as microreactors for Maillard reaction chemistry.
The reactions were carried out in aqueous, microemulsion and cubic phased reaction systems. The
aqueous phase was 100% water, which was compared to a traditional w/o microemulsion with
discrete and continuous phases. The cubic microemulsion is an interesting structure; it consists of
channels of the two phases each of which is bicontinous (12). When the reaction was carried out in
the cubic phase there was a wider product profile along with increased product yields.
Garti and co-workers (4, 5) studied the model Maillard reaction in depth with a w/o emulsion
stabilised with non-ionic surfactants. They looked at sucrose ester emulsions and compared the
results with the aqueous phase with respect to water content within the microemulsion, reactant
ratio, pH and temperature. With the generation of more than 200 volatile compounds (4) they
simplified the system to use furfural rather than sugar; this limited the number of possible products.
The results (4) showed two new compounds in the microemulsion system which were not present in
the aqueous model. It was hypothesised that the environment at the interface and the
concentration of reactants there may have lowered the activation energy required for this new
reaction pathway to be available at the temperature of the reaction. The limiting factor for some of
the reaction pathways is the solubilisation capacity (4) at the interfacial layer; this is unique to each
reactant and interface interaction. A particular challenge in the use of microemulsions as
microreactors in food systems is the difficulty in formulating a stable microemulsion using food
grade materials, coupled with the need to use high levels of surfactant to accommodate the
extremely high surface areas generated (5, 11).
In emulsion-based foods, it has been shown (4, 5, 7, 9, 12) that different emulsion structures can
lead to different reaction product profiles. It is also known that ghee from different processes and
from different parts of the world has different flavour profiles (14-18). Notably, the heating of
butter or cream to make ghee generates a phase inversion of the emulsion. Phase inversions occur
when the discrete phase and the continuous phase swap so that the discrete phase becomes
continuous and the continuous phase becomes discrete (19). There are mechanisms by which this
phase inversion can take place: catastrophic and transitional. A catastrophic phase inversion occurs
when the dispersed phase becomes increasingly larger; inversion subsequently takes place abruptly
causing the continuous phase to become engulfed by the coalescing droplets of the discrete phase.
A catastrophic inversion will result in coalescing of the phases. Alternatively when the inversion is
transitional a more gradual process occurs where intermediate stages occur with different
structures. This process can be particularly important when an evaporation process is occurring (19)
such as in the manufacture of ghee. In ghee the evaporation of water is a key part of the process

122 | P a g e A n g e l a E . N e w t o n
(chapter 3, section 3.2). In the initial stages of evaporation of water from cream the water to oil
ratio was large, as the evaporation proceeded the ratio became increasingly smaller.
6.2 Formation of emulsions
The formulation of the emulsions was a crucial element of these experiments with the requirement
to form stable emulsions with consistent droplet sizes from one emulsion to the next. Emulsions
were generated using canola oil (rather than AMF) as it was easier to handle due to its liquidity at
room temperature. This removed the complication that AMF adds to the emulsions when it begins
to crystallise below 40 °C.
The hydrophilic lipophilic balance (HLB) of the emulsifiers provides an indication of what type of
emulsion they are likely to form based on their structure (2). The small molecule surfactants
commonly used as emulsifiers contain a hydrophobic group (often a long chain fatty acid) that can
bind to the oil phase of an o/w emulsion and a hydrophilic head group that differs from emulsifier to
emulsifier. The HLB provides an indication to the percentage contribution of the hydrophilic portion
to the total weight of the emulsifier molecule (20).
Oil in water emulsions utilised Tween 60 (figure 6.1) as the emulsifier. Tween 60 (CAS 9005-67-8) is a
polyethylene glycol sorbitan monostearate containing no unsaturated bonds and an HLB of 14.9
making it suitable for the formation of o/w emulsions (2). The Tween 60 molecule does not include
groups likely to participate in Maillard or caramelisation reaction (unlike proteins that can also be
used to stabilise o/w emulsions (21)) and has good stability against processing at higher
temperatures, it is food grade and found commercially in various products. Polyglycerol
polyricinoleate (PGPR) (figure 6.2) was used to generate the w/o emulsion. The PGPR is food grade
with applications in chocolate, and widely used to create exceptional stability in w/o systems due to
its low HLB value (~4) and structure (2).
O
OHO
OOH
OOH
OO
z y
x
O
w
Figure 6.1 Polyethylene glycol sorbitan monostearate (Tween 60). Tween 60 is a group of
isomers with the number of OCH2CH2 groups always equal to 20. w + x+ y+ z = 20 (2).

123 | P a g e A n g e l a E . N e w t o n
RO OR
OR
n
OH
O
OH
(a) (b)
Figure 6.2 (a) Polyglycercol polyricinoleate in which R is hydrogen, ricinoleate acid or
polyricinoleate acid. (b) Ricinoleate acid (3).
6.3 Impact of emulsifiers
The addition of the emulsifiers (Tween 60 and PGPR) to the matrix allowed the two different
emulsion structures to be formed; however, any participation of these emulsifiers in the reactions or
any chemical influence on reaction rate needed to be assessed. This was done using control samples
(chapter 8, section 8.7.1) in which each of the emulsifiers was heated in a two phase solution,
without an emulsion being formed, with the reaction components lactose, lysine or both. A blank
sample of water and canola, the two phase reaction matrix, was cooked alongside the samples.
These results are shown in figure 6.3, where only acetic acid was detected in the PGPR, Tween 60
and canola/water samples. The acetic acid was most likely due to the canola oil rather than any
reactions taking place. Figure 6.4 compares the results achieved when lactose was cooked in the two
phase matrix with the changes occurring when the emulsifiers were added to the lactose samples.
The results of emulsifiers on lysine when cooked without lactose are shown in figure 6.5, while figure
6.6 demonstrates the effect of emulsifiers on the Maillard model containing lactose and lysine.
These control samples were all run with phase ratios of 60% aqueous and 40% fat as per the two
phase experiments (chapter 8, section 8.7.1).
Figure 6.3 Baseline compound measurements after the heating of PGPR (red), Tween 60
(green) and canola/water (blue). The error bars represent the standard deviation of samples cooked
in triplicate.
020,00040,00060,00080,000
100,000
Pe
ak a
rea
Reaction compounds

124 | P a g e A n g e l a E . N e w t o n
Figure 6.4 Influence of emulsifiers on the degradation of lactose in a two phase system: lactose
only (red), lactose with PGPR (green) and lactose with Tween 60 (purple). The error bars represent
the standard deviation of samples cooked in triplicate.
The large butyrolactone peak appears to be an anomaly when compared with previous
caramelisation (lactose) experiments run under the same conditions (figure 4.1). Without
considering the butyrolactone result there is a trend of PGPR reducing the peak area of the
respective compounds while the Tween 60 appears to increase this peak area. Analytical control
samples run during method development (section 2.11) indicate that these differences are not due
to interference with the analytical method.
As expected none of the reaction compounds are formed when lactose is absent from the system
(figure 6.5). A small amount of acetic acid is seen; however, this is a very small contribution to the
overall results when compared to the results shown in figures 6.3, 6.4 and 6.6. The acetic acid was
most likely from the canola oil.
There were some noticeable differences in results when the Maillard reaction model had different
emulsifiers added (figure 6.6). There was a small change in compound formation when Tween 60
was added; however, there was a significant drop when the PGPR is added to the system. It could
be speculated that the emulsifiers were forming micelles and crude emulsions during cooking due to
the stirring of the samples, which were altering the results. Any differences between the two phase
0
20,000
40,000
60,000
80,000
100,000
120,000
140,000
160,000
180,000
Pe
ak a
rea
Reaction compounds

125 | P a g e A n g e l a E . N e w t o n
systems and the emulsion systems need to take the emulsifier influences into account to determine
the overall significance of any differences on the system.
Figure 6.5 Interactions between lysine and emulsifiers in a two phase system: lysine (teal),
lysine with PGPR (orange) and lysine with Tween 60 (blue).The error bars represent the standard
deviation of samples cooked in triplicate.
Figure 6.6 Influence of the emulsifiers on the Maillard reaction model (lactose and lysine):
lactose and lysine (teal), lactose and lysine with PGPR (orange), lactose and lysine with Tween 60
(blue) were all cooked in triplicate using a two phase system. The error bars represent the standard
deviation of triplicate samples.
0
10,000
20,000
30,000
40,000
50,000
60,000
70,000
Pe
ak a
rea
Reaction compounds
0500,000
1,000,0001,500,0002,000,0002,500,0003,000,0003,500,0004,000,0004,500,0005,000,000
Pe
ak A
rea
Reaction compounds

126 | P a g e A n g e l a E . N e w t o n
6.4 Influence of emulsion structure
The two emulsifiers were used to generate o/w and w/o emulsions as described in chapter 8, section
8.7. These two emulsion structures generate two different distributions of the reactants (lactose and
lysine). In the o/w emulsion the reactants are present in the continuous phase whereas in the w/o
emulsion, the reactants are contained within in the oil in discrete droplets of water. Due to time
constraints on the large number of experiments required to fully explore the emulsion system the
Maillard reaction received the most focus with repeated experiments; the caramelisation reactions
were only carried out once with duplicate samples cooked.
The control testing (figure 6.6) indicated that some small differences in product formation could be
expected when the Maillard reaction was occurring between lactose and lysine in the presence of
Tween 60. Therefore, the control sample containing Tween 60 was used to determine if there was
any further influence (other than the presence of the Tween 60) on the Maillard reaction when the
emulsion structure was generated through high pressure homogenisation (2). A comparison of the
Maillard reaction occurring in a two phase system containing Tween 60 and the o/w emulsion (figure
6.7) shows a difference in the formation of some volatile compounds being achieved when the
reaction was occurring in an o/w emulsion structure.
Figure 6.7 Maillard reaction compounds formed in the o/w emulsion (blue) compared with the
two phase control sample containing Tween 60 (red). The error bars represent the standard
deviation of triplicate samples.
The o/w structure of the emulsion is the same structure that cream exhibits and ANOVA results
(appendix C, table C7) (significance α=0.05) indicated significant differences for that 2-acetylfuran
0
500,000
1,000,000
1,500,000
2,000,000
2,500,000
3,000,000
3,500,000
Pe
ak a
rea
Reaction Compounds

127 | P a g e A n g e l a E . N e w t o n
(p=0.01), 2-acetylpyrrole (p=0.02) and hydroxymaltol (p=0.05) as compared with the two phase
structure containing Tween 60 when the o/w emulsion structure was introduced. Both maltol and
DHHF had p values that were below 0.1 but above the 0.05 significance level. These compounds all
decreased in yield with the emulsion structure addition.
One of the emulsion parameters altered was the droplet size (table 6.1). The parameters measured
included the surface area weighted mean (D[3,2]) which is the average surface area (calculated) of
the droplets, d(0.1), d(0.5) and d(0.9) represent the maximum droplet diameter that 10%, 50% and
90% of the droplets measure respectively (22). The volume weighted mean (D[4,3]) can also be
calculated and represents the mean volume of a droplet (22). In the case of the o/w emulsion this
increased the surface area of oil within the emulsion as the oil droplets were made smaller through
higher pressure processing. Cream had a measured droplet size of D[3,2] = 0.6 (averaged across two
cream samples) and a droplet diameter range from d(0.1) = 0.2 to d(0.9) = 7.0 µm. 10% of cream
droplets have a diameter less than or equal to 0.16 µm and 90% of the droplet diameters fall below
7.3 µm. Using different pressure settings on the homogeniser and different speed settings on the
ultraturrax, a range of droplet sizes were formed to explore the impact of droplet size may have on
the reactions (figure 6.8). These droplet sizes could be replicated across different emulsions using
the same homogeniser settings (figure 6.8); other droplet size parameters such as volume weighted
mean and surface weight mean were also measured (table 6.1) to gauge not only the diameter of
the droplets but also the droplet volume and surface area.
Table 6.1 Droplet size (µm) parameters for emulsion samples (values are the average of
duplicate samples, each measured twice)
Sample Name D [4, 3] * D [3, 2] * d (0.1) d (0.5) d (0.9)
Maillard homogenised 0.6 0.4 0.2 0.5 1.0
Maillard homogenised 1.0 0.5 0.2 0.6 2.0
Maillard UT20000 10.0 1.0 1.0 9.0 19.0
Maillard UT20000 9.0 2.0 1.0 8.0 17.0
Maillard UT13500 15.0 8.0 6.0 14.0 26.0
Maillard UT13500 15.0 6.0 2.0 14.0 27.0
Maillard UT8000 41.0 34.0 21.0 37.0 66.0
Maillard UT8000 34.0 14.0 15.0 33.0 56.0
*D [4, 3] - Volume weighted mean; D [3, 2] - Surface weighted mean
Each of these emulsion samples was cooked to generate volatile compounds to explore whether the
manipulation of droplet size could lead to a significant change in the results. The results are shown

128 | P a g e A n g e l a E . N e w t o n
in figure 6.9 and represent the average peak areas formed across the two experiments (chapter 8,
section 8.7.2).
Crea
m
UT80
00
UT13
500
UT20
000
Homog
enise
d
70
60
50
40
30
20
10
0
Crea
m
UT80
00
UT13
500
UT20
000
Homog
enised
1
dro
ple
t m
easu
rem
ents
2
Figure 6.8 The range of droplet sizes achieved across two experiments as compared to the
droplet sizes of cream. The bars of each box represent the d(0.1), d(0.5) and d(0.9) respectively from
the bottom of each box up.
Figure 6.9 Averaged data showing the influence of droplet size on the Maillard compounds
formed in an oil in water emulsion structure. Droplet sizes were generated using the ultraturrax at
20,000 rpm (red), 13,500 rpm (green), 8,000 rpm (purple) and the homogeniser (blue). The error
bars represent the standard deviation of triplicate samples from two experiments.
0
500,000
1,000,000
1,500,000
2,000,000
2,500,000
3,000,000
3,500,000
Pe
ak a
rea
Reaction compounds
(µm
)

129 | P a g e A n g e l a E . N e w t o n
The addition of the emulsion structure similar to that of cream in a range of droplet sizes yielded a
varied influence on the Maillard reaction with some significant impact (appendix C, table C8) on the
formation of volatile compounds (figure 6.9). The smallest droplet size as generated through
homogenisation appeared to have generated a lower level of compound formation relative to the
larger droplet sizes. However, amongst the larger droplet sizes there were no significant differences
in compound formation. When the compound formation for the larger droplet sizes is compared
with that of the two phase control sample that contains the emulsifier there was no significant
difference (figure 6.10). This could suggest that the emulsion structure coalesced at a faster rate
when the larger droplet sizes were used resulting in a structure similar to that of the two phase
system during cooking.
Figure 6.10 Averaged data showing the influence of droplet size on the Maillard compounds
formed in an oil in water emulsion structure. Droplet sizes were generated using the ultraturrax at
20,000 rpm (red), 13,500 rpm (green), 8,000 rpm (purple), the homogeniser (blue) and the two
phase Tween 60 control sample (light blue). The error bars represent the standard deviation of
triplicate samples from two experiments.
The impact of the addition of the emulsion structure and the different droplet sizes on the
caramelisation reaction can be seen in figure 6.11, the droplet sizes are given in table 6.2;
comparison with the average Maillard experiment droplet sizes are given in small italics.
0
500,000
1,000,000
1,500,000
2,000,000
2,500,000
3,000,000
3,500,000
Pe
ak a
rea
Reaction compounds
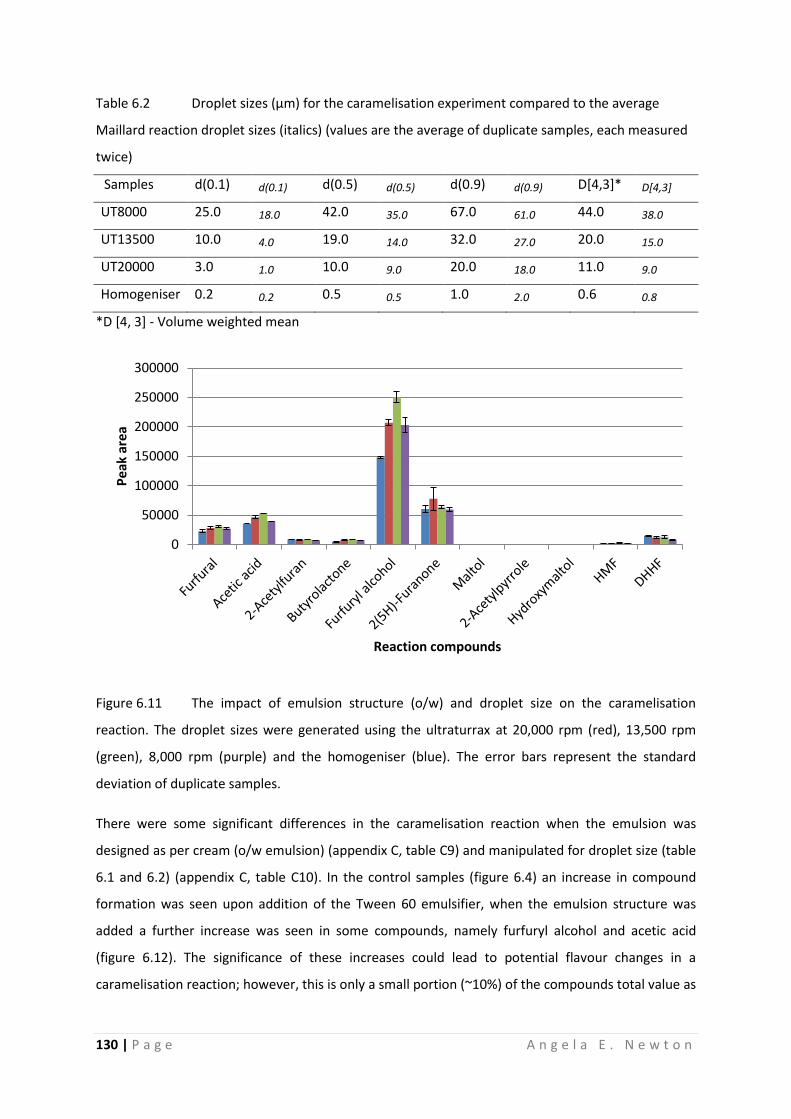
130 | P a g e A n g e l a E . N e w t o n
Table 6.2 Droplet sizes (µm) for the caramelisation experiment compared to the average
Maillard reaction droplet sizes (italics) (values are the average of duplicate samples, each measured
twice)
Samples d(0.1) d(0.1) d(0.5) d(0.5) d(0.9) d(0.9) D[4,3]* D[4,3]
UT8000 25.0 18.0 42.0 35.0 67.0 61.0 44.0 38.0
UT13500 10.0 4.0 19.0 14.0 32.0 27.0 20.0 15.0
UT20000 3.0 1.0 10.0 9.0 20.0 18.0 11.0 9.0
Homogeniser 0.2 0.2 0.5 0.5 1.0 2.0 0.6 0.8
*D [4, 3] - Volume weighted mean
Figure 6.11 The impact of emulsion structure (o/w) and droplet size on the caramelisation
reaction. The droplet sizes were generated using the ultraturrax at 20,000 rpm (red), 13,500 rpm
(green), 8,000 rpm (purple) and the homogeniser (blue). The error bars represent the standard
deviation of duplicate samples.
There were some significant differences in the caramelisation reaction when the emulsion was
designed as per cream (o/w emulsion) (appendix C, table C9) and manipulated for droplet size (table
6.1 and 6.2) (appendix C, table C10). In the control samples (figure 6.4) an increase in compound
formation was seen upon addition of the Tween 60 emulsifier, when the emulsion structure was
added a further increase was seen in some compounds, namely furfuryl alcohol and acetic acid
(figure 6.12). The significance of these increases could lead to potential flavour changes in a
caramelisation reaction; however, this is only a small portion (~10%) of the compounds total value as
0
50000
100000
150000
200000
250000
300000
Pe
ak a
rea
Reaction compounds

131 | P a g e A n g e l a E . N e w t o n
generated by the Maillard reaction system and so is unlikely to have any impact on flavour when the
caramelisation reaction is occurring alongside the Maillard reaction.
Figure 6.12 The impact of emulsion structure (o/w) and droplet size on the caramelisation
reaction. The droplet sizes were generated using the ultraturrax at 20,000 rpm (red), 13,500 rpm
(green), 8,000 rpm (purple) and the homogeniser (blue). The two phase control sample contains
Tween 60 (light blue). The error bars represent the standard deviation of duplicate samples.
An inversion of the o/w emulsion structure to the w/o emulsion structure was predicted to
generate a more significant change as the dynamics of evaporation and heat transfer could be
altered by forming discrete water droplets within the oil phase. As seen previously (section 6.3) the
addition of PGPR to form the w/o emulsion generated a drop in the formation of volatile
compounds; when this system was homogenised to form small water droplets within the oil phase
an increase in all compound formation was seen. These results are shown in figure 6.13.
There was an increase in many of the compounds formed by the Maillard reaction (figure 6.13)
when the emulsion structure was formed to generate discrete droplets of water inside the
continuous oil phase compared with the two phase control solution containing no emulsion
structure. When this was compared with the results seen for an o/w emulsion and also a standard
two phase system without emulsifiers the differences achieved can be seen (figure 6.14).
0
50000
100000
150000
200000
250000
300000
Pe
ak a
rea
Reaction compounds

132 | P a g e A n g e l a E . N e w t o n
Figure 6.13 The Maillard reaction in a w/o emulsion (red) compared with a control solution of
reactants and emulsifier with no emulsion structure (blue). The error bars represent the standard
deviation of duplicate samples across two experiments.
Figure 6.14 Comparison of the emulsion structures (o/w, blue; w/o, red) with a two phase
sample containing no emulsion structure or emulsifiers (green). The error bars represent the
standard deviation of duplicate samples across two experiments.
0
200,000
400,000
600,000
800,000
1,000,000
1,200,000
1,400,000
1,600,000
1,800,000
2,000,000P
eak
are
a
Reaction compounds
0
500,000
1,000,000
1,500,000
2,000,000
2,500,000
3,000,000
3,500,000
4,000,000
4,500,000
5,000,000
Pe
ak a
rea
Reaction compounds

133 | P a g e A n g e l a E . N e w t o n
The comparison of results gained through the different emulsion structures (figure 6.15) indicates
that different flavours could be formed using different emulsion structures. The w/o emulsion
generates a higher level of many flavours compared with the o/w emulsions. However, when these
levels are compared with the two phase system (figure 6.14) there are only some compounds that
show an increased level of volatile compound formation: acetic acid, 2-acetylfuran and 2(5H)-
furanone. The only compound to have decreased with the introduction of the emulsion structure
was maltol; however, with the large error present for the two phase system it was difficult to
conclude how significant this decrease was.
Figure 6.15 The direct comparison of the two emulsion structures influence on the Maillard
reaction: w/o emulsion structure given in red and o/w emulsion structure given in blue. The error
bars represent the standard deviation of duplicate samples across two experiments.
The results for the Maillard reaction system were significantly different when the emulsion structure
was inverted to a w/o emulsion (appendix C, table C11). However, when the caramelisation reaction
model was put into the inverted emulsion (figures 6.16 and 6.17) few differences were seen, with
the exception of an increase in the 2-acetylfuran and 2(5H)-furanone peaks. The formation of 2-
acetylfuran decreased with the introduction of the w/o emulsion structure while there was an
increase in the formation of 2(5H)-furanone (figure 6.16).
0200,000400,000600,000800,000
1,000,0001,200,0001,400,0001,600,0001,800,000
Pe
ak a
rea
Reaction compounds
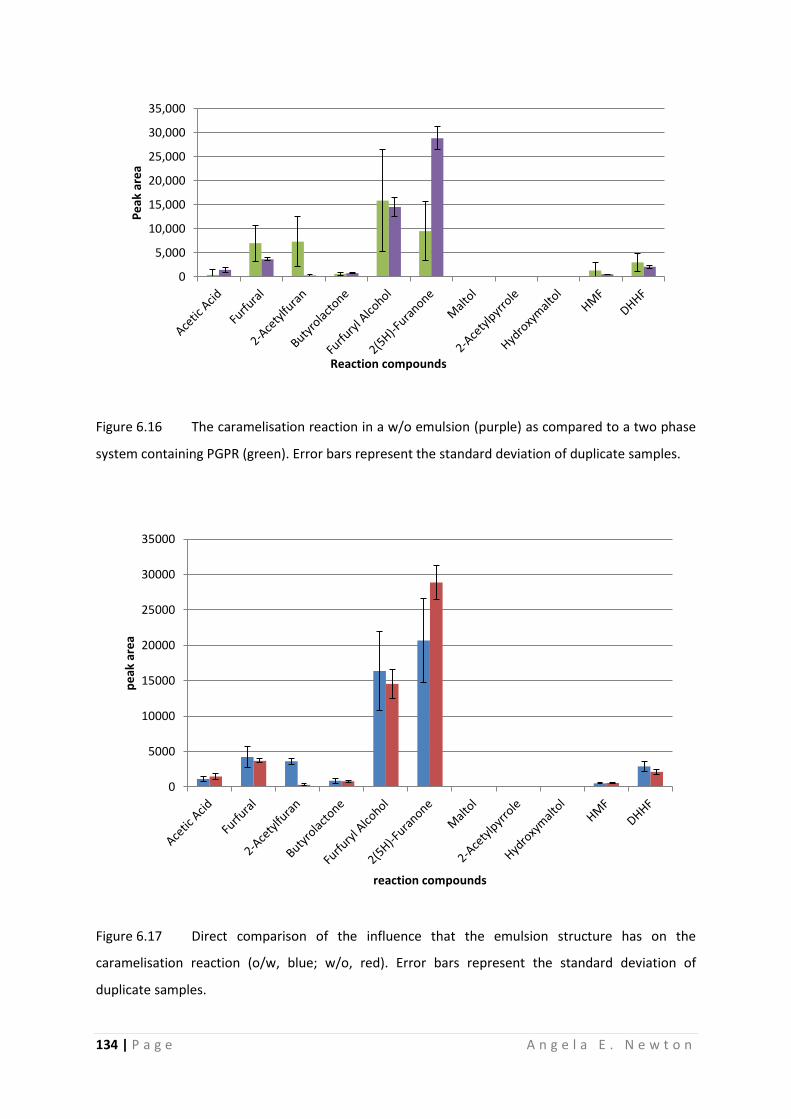
134 | P a g e A n g e l a E . N e w t o n
Figure 6.16 The caramelisation reaction in a w/o emulsion (purple) as compared to a two phase
system containing PGPR (green). Error bars represent the standard deviation of duplicate samples.
Figure 6.17 Direct comparison of the influence that the emulsion structure has on the
caramelisation reaction (o/w, blue; w/o, red). Error bars represent the standard deviation of
duplicate samples.
0
5,000
10,000
15,000
20,000
25,000
30,000
35,000
Pe
ak a
rea
Reaction compounds
0
5000
10000
15000
20000
25000
30000
35000
pe
ak a
rea
reaction compounds

135 | P a g e A n g e l a E . N e w t o n
Given that there was a difference seen in the volatile compound results between the o/w emulsion
and the w/o emulsion, a set of experiments was run to look at the changes over time in conjunction
with the temperature and evaporation of the reaction system. Figure 6.18 shows the changes in
volatile compounds over the 20 min cooking time, each sample was cooked for two minutes longer
than the previous sample. Over the cooking time the observation of colour changes within the
samples was made. The o/w samples became brown as the emulsion separated around 15-16
minutes and continued to develop colour until the end of cooking. The final o/w samples were a
clear oil phase with a dark brown solid cooked onto the bottom of the vial. In contrast, the w/o
samples contained dispersed dark brown solid particles at the end of the cooking process; colour
development started to occur from 12-14 minutes.
Figure 6.18 (A) Maillard reaction o/w emulsion cooked in time series over two minute intervals.
(B) Maillard reaction w/o emulsion cooked in time series over two minute intervals.
There were two other differences that were noticed when the time series experiments were run that
could help to explain why the difference was seen in the Maillard reaction. Past results (chapter 5)
had shown that time and temperature, are both very important to the rate of the Maillard reaction
and that different compounds have different rates of reaction. Figure 6.18 shows the average data
for the temperature changes with the emulsions and figure 6.19 the rate of evaporation over the
course of a 20 minute reaction.
0
200,000
400,000
600,000
800,000
1,000,000
1,200,000
1,400,000
1,600,000
2 4 6 8 10 12 14 16 18 20 2 4 6 8 10 12 14 16 18 20
A B
Time (minutes)
Pea
k ar
ea

136 | P a g e A n g e l a E . N e w t o n
Figure 6.19 The internal sample temperatures of the two different emulsion structures: w/o
emulsion is given by the red line and the o/w emulsion is given by the blue line.
There was no significant difference in temperatures within the emulsion samples although the
measurements were difficult to make given the small amount of sample present. A larger scale
reaction with real time monitoring of the samples could provide a more useful insight into the
internal temperature of the samples. Likewise, the rate of evaporation (figure 6.20) across the two
samples indicated only a small difference in overall rate and may not be significant enough to cause
the differences seen between the two emulsion structures. Further investigation into the influence
of evaporation rates could shed some light on the impact of these differences.
Figure 6.20 The rate of evaporation for the different emulsion structures: w/o emulsion given in
red; o/w emulsion given in blue. Error bars represent the standard deviation of triplicate samples.
0
20
40
60
80
100
120
140
0 5 10 15 20
Tem
pe
ratu
re (°C
)
Time (minutes)
0
10
20
30
40
50
60
70
80
0 2 4 6 8 10 12 14 16 18 20
% e
vap
ora
ted
Time (minutes)
o/w
w/o

137 | P a g e A n g e l a E . N e w t o n
The measurements of temperature and evaporation rate provided no measureable difference within
the error between the two emulsion structures during cooking and are therefore unlikely to be
sufficient enough to generate the differences seen. Changes over time of the internal emulsion
structure along with the fundamental differences between the structures could contribute to the
differences in results.
To investigate the changes occurring in the emulsion structures during cooking, a microscopy
experiment was set up to capture images (chapter 8 section 8.7.6) of the emulsion structure at 2
minute intervals. The microscopy images (figure 6.21) provide a time stamped guide to what was
occurring during the cooking of the emulsions. Samples of the Maillard reaction in an o/w and w/o
emulsion were made up as per chapter 8 section 8.7.2 and cooked 0 – 20 minutes at 2 minute time
intervals. At the end of each two minute time interval a tiny droplet of the sample was removed
from the vial and placed on a microscope slide with a cover slip. Images were taken of the samples
and compared to identify the changes in emulsion structure that were taking place during cooking.
Early in the cooking process (time = 2 minutes) both emulsions have internal temperatures less than
100 °C (figure 6.18). The w/o emulsion consists of water droplets in oil and the o/w emulsion is oil
droplets in water. The droplets in both emulsions are coalescing. Further on in the cooking process
as the cooking time approaches 10 minutes with both emulsions reaching internal temperatures in
excess of 100 °C (figure 6.18) with the w/o emulsion exhibiting a slightly higher temperature than
the o/w emulsion. The water has mostly evaporated from the w/o emulsion, the o/w emulsion
structure has become highly coalesced. At 12 minutes a faster rate of evaporation has occurred in
the w/o emulsion with the o/w emulsion containing a higher % of water. Development of colour can
clearly seen in the w/o emulsion and the structure of the o/w emulsion continues to collapse. The
detection of volatile flavour compounds in the w/o emulsion exceeds those detected in the o/w
emulsion. After 14 minutes of cooking time the colour development continues in the w/o emulsion
becoming increasingly dark brown with o/w emulsion fully separated and some colour formation
beginning. This colour development corresponds with an increase in volatile compound formation.
At the end of the cooking process (20 minutes) dark droplets (melanoidins) are seen suspended in
the w/o emulsion (A) whereas the o/w emulsion (B) has no suspended particles or droplets. The
profile of volatile compounds differs between the two emulsions.

138 | P a g e A n g e l a E . N e w t o n
w/o emulsion o/w emulsion
2 minutes
10 minutes
12 minutes
14 minutes
20 minutes
Figure 6.21 Microscopy images of the structural changes occurring in w/o and o/w emulsions
during cooking.
The microscopy images show clearly the coalescing of the droplets early in the cooking process; this
provides a possible explanation as to why the changes in droplet size did not lead to a significant
difference for the o/w emulsion results. The colour development as discussed previously begins at

139 | P a g e A n g e l a E . N e w t o n
12 minutes for the w/o emulsion and the colour particles are visible throughout the samples until
the end of cooking. The o/w emulsion displays no colour development until closer to 14 minutes and
the particles are not suspended in solution so were not sampled for the microscopy. This is
congruent with the observations of the sample vials and colour changes during the cooking process.
The catastrophic inversion (separation) of the o/w emulsion between 8 and 12 minutes can be seen
clearly in the microscopy images while the w/o emulsion continues to shrink the droplet sizes as the
water evaporates and does not appear to undergo the same transitional separation as the o/w
emulsion. A future experiment that could be interesting would be to investigate the relative
stabilities of different emulsions and control the point at which they invert or maintain their
structure throughout the cooking to control the Maillard reaction.
6.5 Conclusion
The introduction of the emulsion structure to the model reaction system led to some changes within
the reaction systems, although not all of the changes translated into changes in volatile compound
profiles. The interactions of emulsifiers with the reactants provided some interesting results
although they were not the focus of this study; they were used as control samples. It could be
hypothesised that the addition of the emulsifiers allowed micelles to form, which in turn influenced
the partitioning of the reactants, intermediate products and final products leading to the altered
results. In contrast when the emulsion structure was added there was little change in the o/w
emulsion compared with the control sample and compared with the two phase samples discussed in
chapter 5. In future experiments, the stability of the emulsion and type of emulsifier along with the
amount of emulsifier could be altered in an effort to shift the reaction.
The use of microemulsions as microreactors (4-6, 9-12) for the Maillard reaction led to the formation
of higher yields of volatile compounds and different compounds forming; however, this same
phenomenon was not seen in the emulsions based on food products under these conditions. The
Maillard reaction exhibited significant changes in the formation of all compounds with the change in
emulsion structure, but the caramelisation reaction only presented significant changes in the
formation of two compounds formation when the emulsion structure was changed. The greatest
level of change was seen when the emulsion structure was altered from an o/w structure to a w/o
structure. The change in compound formation using the w/o emulsion structure generated a change
in the ratio of the compounds rather than just increasing the other all level of formation as was seen
when fat was added to the reaction (chapter 5). The ability to generate different volatile compound
profiles between the o/w and w/o emulsions could lead to the generation of different flavour
profiles when applied to food design.

140 | P a g e A n g e l a E . N e w t o n

141 | P a g e A n g e l a E . N e w t o n
6.6 References
1. TetraPak, Dairy processing handbook. Tetra Pak Processing Systems: Lund, Sweden, 1995.
2. Friberg, S. E.; Larsson, K.; Sjoblom, J., Food emulsions. Marcel Dekker Inc: New York, NY, United States of America, 2004.
3. Ushikubo, F. Y.; Cunha, R. L., Stability mechanisms of liquid water-in-oil emulsions. Food Hydrocolloids 2014, 34, 145-153.
4. Fanun, M.; Leser, M.; Aserin, A.; Garti, N., Sucrose ester microemulsions as microreactors for model Maillard reaction. Colloids and Surfaces A: Physicochemical and Engineering Aspects 2001, 194, 175-187.
5. Garti, N., Microemulsions as microreactors for food applications. Current Opinion in Colloid and Interface Science 2003, 8, 197-211.
6. Holmberg, K., Organic reactions in microemulsions. European Journal of Organic Chemistry 2007, 731-742.
7. Lutz, R.; Aserin, A.; Garti, N., Maillard reaction between leucine and glucose in o/w microemulsion media in comparison to aqueous solution. Journal of Dispersion Science and Technology 2005, 26, 535-547.
8. Yaghmur, A.; Aserin, A.; Abbas, A.; Garti, N., Reactivity of furfural-cysteine model reaction in food-grade five-component nonionic o/w microemulsions. Colloids and Surfaces A: Physicochemical and Engineering Aspects 2005, 253, 223-234.
9. Yaghmur, A.; Aserin, A.; Garti, N., Furfural-cysteine model reaction in food grade nonionic oil/water microemulsions for selective flavor formation. Journal of Agricultural and Food Chemistry 2002, 50, 2878-2883.
10. Yaghmur, A.; de Campo, L.; Aserin, A.; Garti, N.; Glatter, O., Structural characterization of five-component food grade oil-in-water nonionic microemulsions. Physical Chemistry Chemical Physics 2004, 6, 1524-1533.
11. Yaghmur, A.; Fanun, M.; Aserin, A.; Garti, N., Food grade microemulsions based on nonionic emulsifiers as selective microreactors for flavor formation by Maillard reaction. Self-Assembly 2003, 144-151.
12. Vauthey, S.; Milo, C.; Frossard, P.; Garti, N.; Leser, M. E.; Watzke, H. J., Structured fluids as microreactors for flavor formation by the Maillard reaction. Journal of Agricultural and Food Chemistry 2000, 48, 4808-4816.
13. Moulik, S. P.; Paul, B. K., Structure, dynamics and transport properties of microemulsions. Advances in Colloid and Interface Science 1998, 78, 99-195.
14. Ganguli, N. C.; Jain, M. K., Ghee - its chemistry, processing and technology. Journal of Dairy Science 1973, 56, 19-25.
15. Sserunjogi, M. L.; Abrahamsen, R. K.; Narvhus, J., A review paper: Current knowledge of ghee and related products. International Dairy Journal 1998, 8, 677-688.

142 | P a g e A n g e l a E . N e w t o n
16. Wadodkar, U. R.; Punjrath, J. S.; Shah, A. C., Evaluation of volatile compounds in different types of ghee using direct injection with gas chromatography-mass spectrometry. Journal of Dairy Research 2002, 69, 163-171.
17. Wadodkar, U. R.; Punjrath, J. S.; Shah, A. C.; Przybylski, R., Evaluation of volatile compounds in different types of ghee using headspace with GC/MS. Milchwissenschaft - Milk Science International 2003, 58, 37-39.
18. Yadav, J. S.; Srinivasan, R. A., Advances in ghee flavour research. Indian Journal of Dairy Science 1992, 45, 338-348.
19. Liu, Y. H.; Fribere, S. E., Perspectives of phase changes and reversibility on a case of emulsion inversion. Langmuir 2010, 26, 15786-15793.
20. Pasquali, R. C.; Taurozzi, M. P.; Bregni, C., Some considerations about the hydrophilic-lipophilic balance system. International Journal of Pharmaceutics 2008, 356, 44-51.
21. Akhtar, M.; Murray, B. S.; Dickinson, E., Perception of creaminess of model oil-in-water dairy emulsions: Influence of the shear-thinning nature of a viscosity-controlling hydrocolloid. Food Hydrocolloids 2006, 20, 839-847.
22. Rawle, A., Basic principles of particle size analysis. In www.malvern.co.uk, Malvern Instruments: www.malvern.co.uk, 2011; pp 1-8.

143 | P a g e A n g e l a E . N e w t o n
Chapter 7 Conclusion
The understanding and ability to manipulate the Maillard reaction has the potential to alter the way
foods are formulated for cooking. The Maillard reaction has often been to blame for undesirable
flavours (1-4) of cooked foods, although the reaction also holds the capability to generate desirable
flavours (5). The flavours that are formed in cooked dairy fat emulsion products such as ghee (6, 7)
and dulce de leche (8) rely on the Maillard reaction for formation.
While there have been studies into the formation of Maillard reaction compounds (3, 9-14) and into
the flavour compounds present in various foods (1, 2, 4, 6, 7, 15-22) along with the impact of certain
reaction matrix structures on model reaction systems (9, 10, 23-27), there have been fewer studies
investigating the formation of flavour via the Maillard reaction in food (11, 12, 28-32) and how the
structure of the food could be used to manipulate the progress of the reaction. The focus of most
model systems studies investigating the impact of structure on the Maillard reaction has been
through the use of microemulsions (9, 10, 23-27), rather than emulsion structures that are
commonly found in food. The study of emulsions has looked mainly at the influence on flavour
release and perception (33, 34). This thesis investigated how the fat and emulsion structure of cream
influence the generation of flavour via the Maillard and caramelisation reaction and if these
parameters could be manipulated to alter the formation of the volatile compound profile.
A SPME/GCMS method was developed and used to identify a range of volatile compounds in a
commercial ghee sample and to confirm their presence in traditionally made ghee. The compounds
exhibit a range of different flavours and are partially responsible for the flavour of ghee (along with
fat related flavour compounds) (6, 7, 17, 18).
The complex nature of cream made it necessary to develop a set of model reaction systems for the
caramelisation and Maillard reaction along with a structural model system. The model reaction
system was based on lysine and/or lactose and led to the formation of the volatile compounds as
identified in the ghee and cooked cream samples. The model system allowed the behaviour of the
reactions to be compared in an aqueous system, a two phase system consisting of water and an oil
phase and two emulsion structures: an oil in water emulsion and a water in oil emulsion. Parameters
associated with each matrix in the structural model system were able to be explored, such as the
influence of oil type in a two phase system and the size of oil droplets in the oil in water emulsion
structure. It is common knowledge that time and temperature can be used to manipulate the yields
of the Maillard reaction; however, a compromise must be reached between the intensity of the
flavour and the balance of the desired flavour. The objective of this work was to find new ways of

144 | P a g e A n g e l a E . N e w t o n
controlling the Maillard reaction (in addition to time/temperature) that could allow higher yields to
be achieved along with a different or more desirable balance of flavours. To validate the model it
was important to demonstrate that the model system behaved in the same way as did cream with
respect to time and temperature.
The high throughput method of cooking ghee samples that was developed was applied to all cooked
cream and model system samples, allowing for control of the time and temperature. Time and
temperature were shown to influence the rate of reaction for the model systems and cooked
cream/ghee. As the temperature increased so did the yield of volatile compounds; a similar trend
was seen as time of cooking was increased.
Changes made to the pH of the starting materials can also provide a method for altering the
formation of volatile compounds. Both the caramelisation and Maillard reactions responded to the
changes in pH, giving rise to different volatile compound profiles. This confirms that the Maillard and
caramelisation reaction are pH dependent (35-40). The manipulation of the pH of cream may be a
viable method for the control of flavour formation in ghee if done in a manner appropriate for food.
The most novel aspect of this work for manipulation of volatile compound formation was the
manipulation of structure. There has been much interest in the control of the Maillard reaction
through the use of different microemulsion structures (9, 10, 23-27, 41-43). These microemulsion
structures have allowed the generation of new compounds and control over their formation. The
concept of emulsion catalysis via the use of microemulsions to manipulate the Maillard reaction did
not translate into an emulsion system. There were, however, several differences found to have been
achieved when compounds formed in an aqueous environment were compared with the levels and
ratios formed in a two phase system and two emulsion systems.
The addition of fat to an aqueous reaction system to form a two phase reaction matrix consisting of
a hydrophilic and a lipophilic layer generated some significant changes in volatile compound
formation. The Maillard reaction results indicated a significant increase in the yield of most volatile
compounds, while the caramelisation reaction resulted in only a few compounds increasing. This
increase in formation indicates that the fat component of food products could be crucial not only
because of the intrinsic flavour but also because the fat enhances the development of flavour during
cooking. This has the implication that low-fat products could potentially generate less flavour than
their full fat counterparts during cooking. The effect of fat on flavour has been investigated in the
context of cheese (22, 44) and the impact on sensory properties such as texture and flavour release
(45, 46) along with lipid oxidation products participating in the Maillard reaction (39, 47-51).
145 | P a g e A n g e l a E . N e w t o n
However, there has not been a lot of research into the role of fat as a structural component of the
reaction matrix (52).
Further exploration into the importance of fat in the Maillard and caramelisation reactions indicated
that in the model system developed the fat was not participating in the reactions, but there was a
change in physical parameters associated with the cooking such as temperature. The temperature
was shown early on in the study to be important for the development of flavour, where a difference
of 5-10 °C led to significant changes in the levels of various compounds. Internal temperatures of
food being cooked are generally lower than the applied external temperatures (53) and are related
to the thermal properties of the food. In the case of the model matrix systems, the aqueous matrix
did not exceed 100 °C before evaporating, leaving behind solid state products and reactants. The
two phase system, however, contains an oil phase that does not evaporate at 100 °C but continued
to increase in temperature over the cook time. The increase in temperature is likely a contributor to
the progression of the reactions towards higher yields.
There does appear to be some correlation between the increase in compounds with fat addition and
the type of fat added to the system. There has been some work conducted to investigate the
influence of different fatty acid chain lengths on the Maillard reaction (39, 54). The strong ‘buttery’
flavour associated with milk fat compared with the mild flavour of canola oil means that differences
in flavour formation during cooking with canola oil and milkfat are likely to be insignificant compared
with the large flavour difference imparted by the fat before cooking starts.
Following the addition of fat to the system and the conclusion that fat was important for the
Maillard reaction but less so for the caramelisation reaction, the emulsion structure was introduced
to the reaction system. The introduction of an emulsion structure required the use of emulsifiers
including Tween 60 and PGPR, both of which are food grade and already used in food applications.
The emulsifiers lead to some surprising results when they were added to the reactions without
homogenisation to form the emulsions. Across both the caramelisation and Maillard reactions there
was a small change in compound formation with the addition of Tween 60 and a significant decrease
in formation with the addition of PGPR, which could be for a variety of reasons, such as micelle
formation. This interaction was not explored any further and was used as a baseline for the impact
of emulsion structure.
The oil in water emulsion structure mimicked the emulsion structure of cream with discrete droplets
of oil throughout the continuous water phase. Formulated with the Tween 60 emulsifier, there were
a few compounds that demonstrated a significant decrease in formation; all other compounds

146 | P a g e A n g e l a E . N e w t o n
exhibited no significant change. The manipulation of emulsion parameters such as droplet size for
the oil in water emulsion did not generate any significant differences; this could be due to
coalescence of the droplets during the cooking process prior to the initiation of the caramelisation
and Maillard reactions.
The inverted form of the oil in water emulsion is the water in oil emulsion where the discrete water
droplets are trapped inside the oil phase. The use of PGPR generated a stable emulsion that led to
increased product formation when cooked. This was an interesting development after the decrease
in formation seen with the addition of PGPR to the two phase system. Comparison of the results
achieved through using the o/w and w/o emulsion allowed the change in ratios to be seen. This
change in the ratio of flavour compounds has the potential to provide a change to the final flavour of
the product. Not only did the final levels of volatile compounds change but the time at which
formation of the compounds began also changed. In the o/w emulsions there were no compounds
detected until ~14 minutes; however, in the w/o emulsions product formation was increasing as
early at 10 – 12 minutes into the cooking time.
The ability to manipulate the flavour of ghee relies on the ability to manipulate the reactions
(Maillard and caramelisation) that are responsible for their formation. These compounds each have
a different taste threshold and will contribute differently to the overall product flavour based on
this. The ability to change the volatile compound profile of a given sample may not translate to a
change in flavour from a sensory perspective. Application of the findings in this thesis from a model
system into ghee or other related product for sensory studies would be required to determine the
impact of any volatile compound ratio or yield change on the flavour of the product.
There are further avenues that could be investigated for these emulsion structures in relation to the
stability of the emulsions. PGPR forms a highly stable emulsion, altering the stability so that the
emulsion structure destabilises earlier with cooking and evaporation could yield a different ratio of
volatile compounds.
These insights into the importance of emulsion structure can be translated into food systems such as
the cooking of ghee. The o/w emulsion system replicates the emulsion structure of cream whereas
the w/o structure is similar to that of butter. The issue with the structure of butter for developing
flavours in a similar manner to the w/o emulsion is the stability; as the butter heats up and melts the
structure is lost. If butter could be structured such that there was a stable emulsion structure
present as the fat melted to contain discrete water droplets then the flavour of the ghee generated
would change.

147 | P a g e A n g e l a E . N e w t o n
Throughout this thesis the objective has been to understand the flavour chemistry occurring in ghee
and the influence of emulsion structure on these reactions. Several key findings have been made
after the successful development of the analytical method, high throughput cooking method and the
model reaction and structure systems. The reaction model was validated against cream and both
demonstrated temperature, time and pH dependence as expected. The addition of fat to the matrix
gave the largest structure effect and the emulsion structure had a minor effect.
7.1 Future work
There are several areas that could provide avenues towards the generation of different flavours
through manipulation of the Maillard and caramelisation reactions.
(1) Influence of fatty acid chain length.
Preliminary experiments as part of this study agreed with recent work that reported different fats
and oils could have an influence on the Maillard reaction (54). The impact of the fat and oil
properties on flavour formation during the cooking of food could allow for the generation of
different flavour types. Different fractions from milkfat could also be studied to identify the best
fraction for flavour formation.
(2) Impact of evaporation profiles from different food structures.
There were differences seen in the evaporation profiles of each structural matrix. Further work
would allow the investigation into the impact of the rate of evaporation on the Maillard reaction and
how the rate of evaporation could be manipulated by altering the food structure.
(3) Stability of emulsions and inversion of emulsions during cooking.
The stability of the emulsion could provide an important tool for manipulating the Maillard reaction
in milk fat emulsions. If the emulsion could be broken down or inverted at a specific time or
temperature, this could allow different flavours to be formed by changing the emulsion structure
during the cooking process.
(4) Development of a method for monitoring the components of the Maillard reaction in ghee
during the cooking process in real time.
The ability to monitor the volatile products and intermediate compounds along with reactants and
non-volatile compounds would offer a unique insight into the formation of flavour and allow a
higher degree of control over the cooking process.

148 | P a g e A n g e l a E . N e w t o n
7.2 References
1. Shiratsuchi, H.; Shimoda, M.; Imayoshi, K.; Noda, K.; Osajima, Y., Off-flavour compounds in spray-dried skim milk powder. Journal of Agricultural and Food Chemistry 1994, 42, 1323-1327.
2. Shiratsuchi, H.; Shimoda, M.; Imayoshi, K.; Noda, K.; Osajima, Y., Volatile flavour compounds in spray-dried skim milk powder. Journal of Agricultural and Food Chemistry 1994, 42, 984-988.
3. van Boekel, M. A. J. S., Formation of flavour compounds in the Maillard reaction. Biotechnology Advances 2006, 24, 230-233.
4. Ridgway, K.; Lalljie, S. P. D.; Smith, R. M., Analysis of food taints and off-flavours: a review. Food Additives and Contaminants Part A - Chemistry Analysis Control Exposure and Risk Assessment 2010, 27, 146-168.
5. Newton, A. E.; Fairbanks, A. J.; Golding, M.; Andrewes, P.; Gerrard, J. A., The role of the Maillard reaction in the formation of flavour compounds in dairy products - not only a deleterious reaction but also a rich source of flavour compounds. Food and Function 2012, 3, 1231-1241.
6. Yadav, J. S.; Srinivasan, R. A., Advances in ghee flavour research. Indian Journal of Dairy Science 1992, 45, 338-348.
7. Sserunjogi, M. L.; Abrahamsen, R. K.; Narvhus, J., A review paper: Current knowledge of ghee and related products. International Dairy Journal 1998, 8, 677-688.
8. Ranalli, N.; Andres, S. C.; Califano, A. N., Physicochemical and rheological characterization of 'dulce de leche'. Journal of Texture Studies 2012, 43, 115-123.
9. Vauthey, S.; Milo, C.; Frossard, P.; Garti, N.; Leser, M. E.; Watzke, H. J., Structured fluids as microreactors for flavor formation by the Maillard reaction. Journal of Agricultural and Food Chemistry 2000, 48, 4808-4816.
10. Yaghmur, A.; Aserin, A.; Garti, N., Furfural-cysteine model reaction in food grade nonionic oil/water microemulsions for selective flavor formation. Journal of Agricultural and Food Chemistry 2002, 50, 2878-2883.
11. Limacher, A.; Kerler, J.; Conde-Petit, B.; Blank, I., Formation of furan and methylfuran from ascorbic acid in model systems and food. Food Additives and Contaminants 2007, 24, 122-135.
12. Limacher, A.; Kerler, J.; Davidek, T.; Schmalzried, F., Formation of furan and methylfuran by Maillard-type reaction in model systems and food. Journal of Agricultural and Food Chemistry 2008, 56, 3639-3647.
13. Rizzi, G. P., The Strecker degradation of amino acids: Newer avenues for flavor formation. Food Reviews International 2008, 24, 416-435.
14. Van Lancker, F.; Adams, A.; Owczarek-Fendor, A.; De Meulenaer, B.; De Kimpe, N., Mechanistic insights into furan formation in Maillard model systems. Journal of Agricultural and Food Chemistry 2011, 59, 229-235.
15. Yadav, J. S.; Srinivasan, R. A., Qualitative and quantitative changes in flavour characteristics of ghee made from ripened cream. Indian Journal of Dairy Science 1984, 37, 350-356.

149 | P a g e A n g e l a E . N e w t o n
16. Alonso, L.; Juarez, M.; Abd Rabou, N. S.; El-Shibiny, S., Head space analysis of volatile compounds from buffalo and ewe's Samna (ghee) and butter oil. Milchwissenschaft - Milk Science International 2002, 57, 76-78.
17. Wadodkar, U. R.; Punjrath, J. S.; Shah, A. C., Evaluation of volatile compounds in different types of ghee using direct injection with gas chromatography-mass spectrometry. Journal of Dairy Research 2002, 69, 163-171.
18. Wadodkar, U. R.; Punjrath, J. S.; Shah, A. C.; Przybylski, R., Evaluation of volatile compounds in different types of ghee using headspace with GC/MS. Milchwissenschaft - Milk Science International 2003, 58, 37-39.
19. McSweeney, P. L. H., The flavour of milk and dairy products: III. Cheese: taste. International Journal of Dairy Technology 1997, 50, 123-128.
20. Nursten, H. E., The flavour of milk and dairy products. 1. Milk of different kinds, milk powder, butter and cream. International Journal of Dairy Technology 1997, 50, 48-56.
21. Urbach, G., The flavour of milk and dairy products. 2. Cheese: contribution of volatile compounds. International Journal of Dairy Technology 1997, 50, 79-89.
22. Drake, M. A.; Miracle, R. E.; McMahon, D. J., Influence of fat on flavour and flavour development in cheddar cheese. Australian Journal of Dairy Technology 2010, 65, 195-199.
23. Fanun, M.; Leser, M.; Aserin, A.; Garti, N., Sucrose ester microemulsions as microreactors for model Maillard reaction. Colloids and Surfaces A: Physicochemical and Engineering Aspects 2001, 194, 175-187.
24. Garti, N., Microemulsions as microreactors for food applications. Current Opinion in Colloid and Interface Science 2003, 8, 197-211.
25. Yaghmur, A.; Fanun, M.; Aserin, A.; Garti, N., Food grade microemulsions based on nonionic emulsifiers as selective microreactors for flavor formation by Maillard reaction. Self-Assembly 2003, 144-151.
26. Lutz, R.; Aserin, A.; Garti, N., Maillard reaction between leucine and glucose in o/w microemulsion media in comparison to aqueous solution. Journal of Dispersion Science and Technology 2005, 26, 535-547.
27. Yaghmur, A.; Aserin, A.; Abbas, A.; Garti, N., Reactivity of furfural-cysteine model reaction in food-grade five-component nonionic o/w microemulsions. Colloids and Surfaces A: Physicochemical and Engineering Aspects 2005, 253, 223-234.
28. Martins, S.; Jongen, W. M. F.; van Boekel, M., A review of Maillard reaction in food and implications to kinetic modelling. Trends in Food Science and Technology 2000, 11, 364-373.
29. Adams, A.; Borrelli, R. C.; Fogliano, V.; De Kimpe, N., Thermal degradation studies of food melanoidins. Journal of Agricultural and Food Chemistry 2005, 53, 4136-4142.
30. Erbersdobler, H. F.; Somoza, V., Forty years of furosine - Forty years of using Maillard reaction products as indicators of the nutritional quality of foods. Molecular Nutrition and Food Research 2007, 51, 423-430.

150 | P a g e A n g e l a E . N e w t o n
31. Mottram, D. S.; Elmore, J. S., Control of the Maillard reaction during the cooking of food. In Controlling Maillard Pathways to Generate Flavors, Mottram, D. S.; Taylor, A. J., Eds. 2010; Vol. 1042, pp 143-155.
32. Lineback, D. R.; Coughlin, J. R.; Stadler, R. H., Acrylamide in foods: A review of the science and future considerations. Annual Review of Food Science and Technology 2012, 3, 15-35.
33. Bayarri, S.; Smith, T.; Hollowood, T.; Hort, J., The role of rheological behaviour in flavour perception in model oil/water emulsions. European Food Research and Technology 2007, 226, 161-168.
34. Phan, V. A.; Liao, Y. C.; Antille, N.; Sagalowicz, L.; Robert, F.; Godinot, N., Delayed volatile compound release properties of self-assembly structures in emulsions. Journal of Agricultural and Food Chemistry 2008, 56, 1072-1077.
35. Pauletti, M. S.; Matta, E. J.; Rozycki, S., Kinetics of heat-induced browning in concentrated milk with sucrose as affected by pH and temperature. Food Science and Technology International 1999, 5, 407-413.
36. Ajandouz, E. H.; Tchiakpe, L. S.; Dalle Ore, F.; Benajiba, A.; Puigserver, A., Effects of pH on caramelization and Maillard reaction kinetics in fructose-lysine model systems. Journal of Food Science 2001, 66, 926-931.
37. Ajandouz, E. H.; Desseaux, V.; Tazi, S.; Puigserver, A., Effects of temperature and pH on the kinetics of caramelisation, protein cross-linking and Maillard reactions in aqueous model systems. Food Chemistry 2008, 107, 1244-1252.
38. Yu, A. N.; Zhang, A. D., The effect of pH on the formation of aroma compounds produced by heating a model system containing L-ascorbic acid with L-threonine/L-serine. Food Chemistry 2010, 119, 214-219.
39. Van Ba, H.; Amna, T.; Hwang, I., Significant influence of particular unsaturated fatty acids and pH on the volatile compounds in meat-like model systems. Meat Science 2013, 94, 480-488.
40. Nursten, H. E., The Maillard reaction: chemistry, biochemistry and implications. RSC Publishing: Cambridge, UK, 2005.
41. Holmberg, K., Organic reactions in microemulsions. European Journal of Organic Chemistry 2007, 731-742.
42. Patel, N.; Schmid, U.; Lawrence, M. J., Phospholipid-based microemulsions suitable for use in foods. Journal of Agricultural and Food Chemistry 2006, 54, 7817-7824.
43. Yaghmur, A.; de Campo, L.; Aserin, A.; Garti, N.; Glatter, O., Structural characterization of five-component food grade oil-in-water nonionic microemulsions. Physical Chemistry Chemical Physics 2004, 6, 1524-1533.
44. Johnson, M. E.; Kapoor, R.; McMahon, D. J.; McCoy, D. R.; Narasimmon, R. G., Reduction of sodium and fat levels in natural and processed cheeses: scientific and technological aspects. Comprehensive Reviews in Food Science and Food Safety 2009, 8, 252-268.

151 | P a g e A n g e l a E . N e w t o n
45. Relkin, P.; Fabre, M.; Guichard, E., Effect of fat nature and aroma compound hydrophobicity on flavor release from complex food emulsions. Journal of Agricultural and Food Chemistry 2004, 52, 6257-6263.
46. Prindiville, E. A.; Marshall, R. T.; Heymann, H., Effect of milk fat, cocoa butter, and whey protein fat replacers on the sensory properties of lowfat and nonfat chocolate ice cream. Journal of Dairy Science 2000, 83, 2216-2223.
47. Capuano, E.; Oliviero, T.; Acar, O. C.; Gokmen, V.; Fogliano, V., Lipid oxidation promotes acrylamide formation in fat-rich model systems. Food Research International 2010, 43, 1021-1026.
48. Whitfield, F. B., Volatiles from interactions of Maillard reactions and lipids. Critical Reviews in Food Science and Nutrition 1992, 31, 1-58.
49. Severini, C. R.; Lerici, C., Interaction between the Maillard reaction and lipid oxidation in model systems during high temperature treatment. Italian Journal of Food Science 1995, 7, 189-196.
50. Adams, A.; Kitryte, V.; Venskutonis, R.; De Kimpe, N., Model studies on the pattern of volatiles generated in mixtures of amino acids, lipid-oxidation-derived aldehydes, and glucose. Journal of Agricultural and Food Chemistry 2011, 59, 1449-1456.
51. Ho, C. T.; Chen, Q. Y., Lipids in food flavours - An overview. In Lipids in food flavors, Ho, C. T.; Hartman, T. G., Eds. American Chemical Society: Washington, DC, United States of America, 1994; Vol. 558, pp 2-14.
52. Potes, N.; Kerry, J. P.; Roos, Y. H., Oil as reaction medium for glycation, oxidation, denaturation, and aggregation of whey protein systems of low water activity. Journal of Agricultural and Food Chemistry 2013, 61, 3748-3756.
53. Lioumbas, J. S.; Karapantsios, T. D., Evaporation front compared with crust thickness in potato deep-fat frying. Journal of Food Science 2011, E17-E25.
54. Toyosaki, T., Sakane, Y., and Kasai, M., Effects of medium-chain triacylglycerols (MCT) on the Maillard reaction. Journal of Food Processing and Technology 2013, 4.

152 | P a g e A n g e l a E . N e w t o n
Chapter 8 Materials and Methods
8.1 Materials
Cream was purchased fresh on the day of use from the local supermarket with a fat content of ~40
%. Canola oil was also purchased from a local supermarket.
D-Lactose, L-lysine, Tween 60, sodium hydroxide, hydrochloric acid, sodium chloride, sodium
dihydrogen phosphate and disodium hydrogen phosphate were all purchased from BDH (Poole,
England), Merck (Frankfurt, Germany) or Sigma-Aldrich (St. Louis, MO, United States of America).
Polyglycerol polyricinoleate/Palsgaard 4150 (Palsgaard, Denmark) was gifted by Massey University,
Palmerston North, New Zealand.
Anhydrous milk fat (AMF) was supplied by Fonterra Cooperative Group, New Zealand; batch
JT16F3872.
All water used was deionised water.
8.2 Gas chromatography mass spectrometry (GCMS)
8.2.1 Vials
Glass Chromacol (Welwyn Garden City, Herts, UK) headspace vials (20 ml) and caps were used for all
experiments and analysis.
8.2.2 Reference sample
The reference material used for the development of the method was Dairy Flavour 300 (DF300)
which is a commercial ghee sample manufactured by Fonterra. The samples finished product
number was 10-920 milk fat: batch 260195: item 12918703. It was manufactured in Stanhope
Australia in 2010. The reference sample was a 2.0 ml sample of DF300 in a 20 ml glass headspace vial
(8.2.1) with crimped cap. Reference samples were stored frozen (-20 °C). A new reference sample
vial was used for each batch of analysis.

153 | P a g e A n g e l a E . N e w t o n
8.2.3 Blank sample
The blank sample was a new empty vial as per section 8.2.1 with crimped cap in place. A new blank
vial was used for each batch of analysis.
8.2.4 GCMS sample preparation
8.2.4.1 Externally cooked or raw samples
The appropriate amount of the sample was added to the 20 ml headspace vial and sealed with caps
containing an intact seal.
Oil 2.0 ml liquid oil
Ghee 2.0 ml liquid ghee
If necessary, samples were warmed to melting in a standard kitchen microwave.
8.2.4.2 Autosampler cooked samples
Samples cooked in the autosampler were cooked with punched caps (section 8.4.2). These caps were
removed and replaced with intact caps prior to analysis.
Aqueous samples prepared in the AOC5000 (CTC Combipal, CTC Analytics, Zwingen, Switzerland)
autosampler were matrix matched to a standard cream sample by adding 0.8 ml of oil (AMF or
Canola oil).
8.2.5 GCMS instrument setup
All analyses used a gas chromatograph (GC) GC2010 (Shimadzu, Kyoto, Japan), coupled with a
QP2010 (Shimadzu, Kyoto, Japan) mass spectrometer (MS). The GC column was a 30 m (length) x
0.25 mm (internal diameter) x 0.25 µm (film thickness) EC-Wax column (Alltech Associates,
Deerfield, IL, United States of America) with a temperature range of 40 °C – 280 °C (1, 2). The solid
phase microextraction (SPME) was automated using the (CTC combipal) robot. The SPME fibre was a
1 cm (length) 23 gauge PDMS-DVB (polydimethysiloxane/divinylbenzene) fibre (Supelco, Bellefonte,
PA, USA). The glass injection liner was split liner 1 mm (internal diameter) x 5 mm (external
diameter) x 95 mm (length) for Shimadzu GC (IP deactivated)(3).

154 | P a g e A n g e l a E . N e w t o n
The instrument was controlled using Lab Solutions, GCMS solutions software, version 2.5 (Shimadzu,
Kyoto, Japan). Peak integration of GCMS chromatograms was also carried out using this software.
Compound identification was carried out using the Wiley 7 spectra library as incorporated into the
GCMS solutions software.
8.2.6 Experimental GCMS conditions
8.2.6.1 Standard testing conditions
These are the parameters used for all GCMS method development unless otherwise stated (3).
Extraction parameters: Extraction temperature 60 °C
5 min pre incubation
20 min extraction onto fibre
2 min desorption into injection port
GC parameters: Injection temperature 220 °C
Carrier gas helium
Flow rate control linear velocity
Linear velocity 37.3 cms-1
Column flow rate 1.06 mlmin-1
Total flow 14.6 mlmin-1
Purge flow 3.0 mlmin-1
Injection mode: Split 1:10 ratio
MS parameters: Sampling rate 0.5 (scan) 0.2 (SIM)
Interface temperature 230 °C
Mass range 40 – 350
Ion source temperature 200 °C
EI 70 eV
8.2.6.2 Column temperature gradient
The following gradients were run during the preliminary temperature gradient determination. There
was a 5 min hold time at 50 °C and again at 220 °C. The sample analysed was a standard DF300

155 | P a g e A n g e l a E . N e w t o n
reference sample (section 8.2.2). All other setup for the GCMS conditions is outlined in section
8.2.6.1. Table 8.1 details the initial gradients run and table 8.2 details the second set of iterative
gradients. The final temperature gradient is detailed in table 8.3.
Table 8.1: Initial temperature gradients
Gradient (°Cmin-1) Start temperature (°C) Finish temperature (°C) Time* (min)
1 50 220 180
2 50 220 95
3 50 220 67
4 50 220 53
5 50 220 44
6 50 220 39
*Hold time has been rounded up to the nearest whole minute.
Table 8.2: Second set of iterative temperature gradients
Gradient (°Cmin-1) Start temperature (°C) Finish temperature (°C) Time* (min)
3 50 220 67
3.25 50 220 63
3.5 50 220 59
3.75 50 220 56
4 50 220 53
*Hold time has been rounded to the nearest whole minute.
Table 8.3: Final temperature profile of GC column
Initial temperature
(°C)
Final Temperature (°C) Rate of change (°Cmin-
1)
Hold time* (min)
50 50 0 2
50 95 6 0
95 95 0 5
95 150 3.25 0
150 170 1 0
170 220 4 0
220 220 0 2
*Hold time has been rounded up to the nearest whole minute.

156 | P a g e A n g e l a E . N e w t o n
8.2.6.3 Injection split ratio
There were three split ratio conditions that were tested to determine optimum conditions; 1:10,
1:100 and splitless injection. Other GCMS conditions are set out in section 8.3.6.1. The test sample
was the standard DF300 sample.
8.2.6.4 SPME Extraction time
The time of extraction was tested at 10, 20 and 30 min. Extraction temperature was 60 °C; other
conditions are set out in section 8.3.6.1. The test sample was the standard DF300 sample.
8.2.6.5 SPME Extraction temperature
Extraction temperatures trialled were 50 °C, 60 °C and 70 °C. Extraction time was 20 min; other
conditions are set out in section 8.3.6.1. The test sample was the standard DF300 sample.
8.2.7 Optimised GCMS method
GC setup
Injection temperature 220 °C
Injection mode split 1:10 ratio
Column start temperature 50 °C
Column end temperature 220 °C
Column temperature gradient table 8.3
Carrier gas helium
Flow rate control linear velocity
Linear velocity 37.3 cms-1
Column flow rate 1.06 mlmin-1
Total flow 14.6 mlmin-1
Purge flow 3.0 mlmin-1
Mass spectrometer parameters
Sampling rate 0.5 (scan) 0.2 (SIM)
Interface temperature 230 °C
Mass range 40 – 350
Ion source temperature 200 °C
EI 70 eV

157 | P a g e A n g e l a E . N e w t o n
Optimised SPME method
Extraction temperature 60 °C
pre-incubation 5 min
Extraction time 20 min
Desorption time 2 min
8.2.8 Matrix interferences
Analysis of each of the potential matrix interference (4, 5) was carried out on 2.00 ml subsamples.
The DF300 was warmed to a liquid state using a standard kitchen microwave.
8.2.8.1 Fat type
A set of aqueous caramelisation and Maillard reaction samples (section 8.5) were cooked (section
8.4.2). Half of the caramelisation and Maillard reaction samples were analysed with canola oil and
the other half with AMF.
8.2.8.2 PGPR
PGPR (0.75 g or 1.5 g) was added to 50 ml liquid DF300 and mixed thoroughly.
8.2.8.3 Tween 60
Tween 60 (0.75 g or 1.5 g) was added to 50 ml liquid DF300 and mixed thoroughly.
8.2.8.4 Sodium chloride
Sodium chloride (2.5 g or 5.0 g) was added to 50 ml liquid DF300 and mixed thoroughly.
8.2.8.5 Phosphate buffer
Sodium dihydrogen phosphate (0.45 g or 0.90 g) and disodium hydrogen phosphate (0.35 g or 0.70
g) were added to 50 ml of liquid DF300 and mixed thoroughly.
8.3 General methods
8.3.1 pH measurement
8.3.1.1 Aqueous phase
Aqueous phase pH measurements were made using a Jenway 3510 pH meter (Bibby Scientific
Limited, Staffordshire, UK). Calibrations were carried out using pH 4 and pH 7 standards purchased

158 | P a g e A n g e l a E . N e w t o n
from Merck (Frankfurt, Germany) and BDH (Poole, England). All pH adjustments were made ± 0.2 pH
units. Measurement of pH was carried out between 18 and 22 °C.
8.3.1.2 Cooked samples
The pH of samples was measured after cooking by adding 2 ml of DI water and shaking to mix. The
pH was measured using Merck pH strips 0-14 (Frankfurt, Germany). Measurement of pH was carried
out between 18 and 22 °C.
8.3.2 Temperature measurement
Temperature measurements were made using a Fischer Scientific (Waltham, MA, United States of
America) traceable thermometer. The probe was inserted into the top of the GC vial and the
temperature taken once the temperature had stabilised. The thermometer was suitable for
temperature measurements from -50 to + 300 °C.
8.3.3 Statistical analysis
Statistical analysis was carried out using Minitab statistical software, version 16 (State College, PA,
United States of America) (6, 7).
8.4 Ghee
8.4.1 Wok procedures
The methods detailed in section 8.4.1 were all cooked in a non-stick Teflon wok (30 cm) on a
conventional stove top element. The element was set to temperature mark 4 and stirring was
conducted with a non-stick spatula. Stirring was intermittent to prevent sticking of the ghee. The
end point was reached when the water had evaporated to leave an oil (ghee) and dark brown solids
(melanoidins). The wok was removed from the heat to cool (~ 2-5 min or <60 °C) and the solids
filtered off using a coarse paper towel (3). Each method (8.4.1.1 – 8.4.1.3) was carried out in
triplicate. Each replicate was made on a different day using fresh cream. The wok methods are based
on traditional ghee methods (8, 9).
8.4.1.1 Direct cream
Cream (200 g) was allowed to reach ambient temperature (~18-20 °C) before adding to the wok and
heating to form ghee using the method detailed in section 8.4.1.
159 | P a g e A n g e l a E . N e w t o n
8.4.1.2 Cream butter
Cream (200 g) was churned to butter using a household food processor. Cream was churned until
the butter formed a solid mass (~130-135 g) and the excess buttermilk (~60-65 g) was discarded. The
butter was transferred to the wok and heated to form ghee using the method detailed in section
8.4.1.
8.4.1.3 Butter/buttermilk
Cream (200 g) was churned to butter using a household food processor. Cream was churned until
the butter formed a solid mass (~130-135 g) with excess buttermilk (~60-65 g). The butter and
buttermilk were transferred to the wok and heated to form ghee using the method detailed in
section 8.4.1.
8.4.2 GC autosampler procedures
The autosampler on the GC was programmed to cook the ghee samples. The autosampler settings
were: temperature, 135 °C; time, 20 minutes; stirring, 500 Hz. The cooking vessel was the headspace
vial (section 8.2.1) with a hole punched in the cap seal. All vials had a glass bead added to improve
stirring and ensure consistent results. All sample weights are ± 0.1 g. The samples were not filtered
prior to analysis.
8.4.2.1 Direct cream
Cream (2 g) was weighed into 6 headspace vials.
8.4.2.2 Cream butter
Cream (100 g) was churned into ~ 60 g butter as per section 8.8.1.2 (~40 g buttermilk was retained
for section 8.8.2.4). Butter (1.3 g) was weighed into 6 headspace vials. The weight of butter was
based on measurements from the large scale ghee batch (section 8.8.2.2).
8.4.2.3 Butter/Buttermilk
Cream (100 g) was churned into ~ 60 g butter with ~40 g buttermilk as per section 8.8.1.3. Butter
(1.3 g) and buttermilk (0.6 g) was weighed into 6 headspace vials. The weight of butter and
buttermilk was based on measurements from the large scale ghee batch (section 8.8.2.3).
8.4.2.4 Buttermilk
Buttermilk (discarded from 8.8.2.2) was weighed (1.2 g) into 6 headspace vials. The amount was
calculated from 60% aqueous volume in cream with 40% fat volume therefore each 2 g of cream was
equivalent to ~1.2 g aqueous buttermilk.

160 | P a g e A n g e l a E . N e w t o n
8.4.3 Influence of time and temperature
Cream (2.00 ml) was cooked in triplicate. The cook times incrementally increased in 2 minute
intervals, starting at 10 minute cooking time and cumulating in a maximum time length of 20
minutes. The experimental temperatures started at 110 °C increasing to a maximum temperature of
135 °C and covered a range of cooking times. The temperature of the sample was measured using a
temperature probe in the final minute of cooking. At each of the experimental temperatures
triplicate samples of cream were cooked (sample preparation detailed in section 8.8.2.1) at each of
the time intervals. The time/temperature experiments were split into two sets.
Experimental set 1 of time/temperature experiments consisted of samples cooked at 110, 120, 125
and 135 °C for 10, 12, 14, 16, 18 and 20 minutes.
Experimental set 2 of time/temperature experiments using smaller temperature differences based
on the accuracy of the agitator temperature settings. The same cooking times were used as for
experimental set 1 with temperatures of 132, 134, 135, 136 and 138 °C.
8.5 Aqueous experimental model system
The model samples were cooked using the parameters in section 8.4.2 unless otherwise stated. A
sample size of 2 ml was used for all samples.
All sample solutions were made up fresh on the day of cooking. The aqueous phase of all samples
was pH adjusted to pH 7 using dilute sodium hydroxide unless otherwise stated. The two model
reaction systems used were the caramelisation reaction (10, 11) and Maillard reaction (12, 13) as set
out in table 8.4 unless otherwise stated. The concentrations are the total concentration of the
system. All weights were ± 0.1 g.
Table 8.4 Total reactant concentration for each model system (14)
Reaction system Lactose (% w/w) Lysine (% w/w)
Caramelisation 3 0
Maillard 3 2
Caramelisation model samples were made by dissolving 3.0 g of lactose (Fonterra product bulletin,
appendix B) in water (total sample weight 100.0 g) at ambient temperature.

161 | P a g e A n g e l a E . N e w t o n
Maillard model samples were made by dissolving 3.0 g of lactose and 2.0 g of lysine (Fonterra
product bulletin) in water (total sample weight 100.0 g) at ambient temperature.
Cooking was carried out using a 2.0 ml sample.
8.5.1 Influence of time and temperature
The time and temperature influence were assessed using samples set up as per 8.5.1 cooked using
the time and temperature data set out in table 8.5 (3, 15-19).
Table 8.5 Time and temperature validation of Maillard and caramelisation reaction samples.
Reaction Temperature (°C) Time (min)
Maillard 135 10
Maillard 135 15
Maillard 135 20
Maillard 125 20
Caramelisation 135 10
Caramelisation 135 15
Caramelisation 135 20
Caramelisation 125 20
8.5.2 Changes in pH over time (20, 21)
8.5.2.1 pH changes in cream during cooking
The pH of cream was measured as per section 8.3.1.2. The pH of cream was measured for a series of
2.0 ml cream samples that were cooked for different lengths of time. Each sample was cooked for 2
minutes and 30 seconds longer than the previous sample. The time series ran from time = 0 to time
= 20 minutes at intervals of 2 minutes and 30 seconds. All other cooking conditions were as set out
in section 8.4.2.
8.5.2.2 pH changes in the Maillard reaction during cooking
The pH of the Maillard reaction was measured as per section 8.3.1.2. The pH was measured for a
series of 2.0 ml Maillard model reaction samples (the 2.0 ml samples were taken from a 100 ml
solution made up as per section 8.6) that were cooked for different lengths of time. Each sample was

162 | P a g e A n g e l a E . N e w t o n
cooked for 2 minutes longer than the previous sample. The time series ran from time = 0 to time =
20 minutes at intervals of 2 minutes. All other cooking conditions were as set out in section 8.4.2.
8.5.3 The influence of pH on the Maillard and caramelisation reactions (15, 17, 18, 22)
The pH of samples was adjusted using HCl (0.5 M) or NaOH (0.1 M).
8.5.3.1 Influence of pH of cream
The pH of cream (25 ml) was adjusted as set out in table 8.6.
Table 8.6 pH adjustment of cream
pH Adjusted with
3 HCl
5 HCl
7 None required
9 NaOH
11 NaOH
8.5.3.2 Influence of pH on the caramelisation and Maillard reaction
The pH of aqueous caramelisation or Maillard reaction model (100 ml, section 8.5) was adjusted as
set out in table 8.7.
Table 8.7 pH adjustment of caramelisation and Maillard model system
pH Adjusted with
3 HCl
5 None required
7 NaOH
9 NaOH
11 NaOH
163 | P a g e A n g e l a E . N e w t o n
8.5.4 Effect of phosphate buffer
Maillard and caramelisation reaction samples were made up as per section 8.5 with the addition of
phosphate buffer (0.2 M, pH 7) (23) prior to making the samples up to weight (100.0 g) with water.
Sodium dihydrogen phosphate 0.90 g
Disodium hydrogen phosphate 0.70 g
8.5.5 Effect of sodium chloride
Maillard and caramelisation reaction samples were made up as per section 8.5 with the addition of
sodium chloride (5%) (24) prior to making the samples up to weight (100.0 g) with water.
Sodium chloride 5.0 g
8.6 The addition of fat to the aqueous model system
The ratio for the two phase system was 60% aqueous and 40% fat measured volume for volume
(Fonterra product bulletin, appendix B). The concentration of the aqueous phase was increased to
adjust for the 60% volume to maintain the concentration as per table 8.4.
Caramelisation model samples were made using an aqueous phase consisting of 5.0 g lactose
dissolved in water (total sample weight 100.0 g).
Maillard model systems were made using an aqueous phase consisting of 5.0 g lactose and 3.30 g
lysine dissolved in water (total sample weight 100.0 g).
To achieve a two phase system for cooking 1.2 ml of the aqueous phase was added to a headspace
vial along with 0.8 ml of fat (canola oil or AMF (25)).
8.6.1 Effect of aqueous concentration
100% aqueous caramelisation and Maillard reaction samples were made up as per section 8.5 and
cooked using a 2.0 ml subsample. Samples were cooked as per section 8.4.2.
The aqueous phase of a two phase sample for caramelisation and Maillard reactions were made up
as per section 8.6 and cooked using a 1.2 ml subsample. Samples were cooked as per section 8.4.2.

164 | P a g e A n g e l a E . N e w t o n
8.6.2 Time series, temperature and evaporation profile
Aqueous Maillard samples were made up as per section 8.5 and two phase samples were made up
as per section 8.6. The fat used for the two phase samples was canola oil. The vials were weighed to
4 decimal places before samples were added. The vial and samples were weighed again before being
capped for cooking. Samples were weighed after cooking once samples were cool and vial caps were
removed.
Samples were cooked for times between 0 and 20 minutes at 2 minute time intervals.
Evaporation of water was calculated using average weights from triplicate cooked samples at each
time point. Temperature was measured as per section 8.3.2.
These samples were analysed using GCMS to monitor compound formation.
8.6.3 Participation of fat in the Maillard reaction
A sample was made up as per section 8.6 with the omission of lactose. The fat used for the
experiment was canola oil.
8.7 The influence of emulsion structure (26-30)
Emulsions were made with a total volume of 500 ml to be suitable for the homogeniser. The
aqueous phase contained 15.0 g lactose and 10.0 g lysine made up with water to 300 g for 60:40
emulsions and 250 g for 50:50 emulsions. The aqueous phase was adjusted to pH 7 with sodium
hydroxide (0.5 M).
Emulsifier concentration was 1.50% (w/v) of the total emulsion volume. Tween 60 was added to the
aqueous phase and the PGPR to the fat phase. Both phases are equilibrated to 50 °C before
homogenisation.
8.7.1 Emulsifier control samples
Each aqueous phase in table 8.8 was made up to 50 g with water. Samples were made for cooking by
taking 1.2 ml of the appropriate control sample aqueous phase and adding 0.8 ml of the appropriate
fat phase.

165 | P a g e A n g e l a E . N e w t o n
Table 8.8 The control samples for the influence of emulsifiers.
Control sample Lactose (g) Lysine (g) Tween 60 (g) Aqueous phase (g) Fat phase
Lactose 2.50 0 0 50 Canola oil
Lysine 0 1.65 0 50 Canola oil
Lactose + lysine 2.50 1.65 0 50 Canola oil
Tween 60 0 0 1.25 50 Canola oil
Lactose + Tween 60 2.50 0 1.25 50 Canola oil
Lysine + Tween 60 0 1.65 1.25 50 Canola oil
Lactose + lysine + Tween 60 2.50 1.65 1.25 50 Canola oil
PGPR 0 0 0 50 1.25 g PGPR + 50 ml canola oil
Lactose + PGPR 2.50 0 0 50 1.25 g PGPR + 50 ml canola oil
Lysine + PGPR 0 1.65 0 50 1.25 g PGPR + 50 ml canola oil
Lactose + lysine + PGPR 2.50 1.65 0 50 1.25 g PGPR + 50 ml canola oil
8.7.2 o/w emulsion (influence of emulsion structure and droplet size)
The ratio of the phases for the emulsion system was 60% aqueous and 40% fat measured volume for
volume. The contents and weights for the aqueous phase for each reaction model are set out in
table 8.9.
Table 8.9 Aqueous phase content for a 60:40 o/w emulsion
Aqueous phase components Reaction model
(g) Caramelisation Maillard
Lactose 15.0 15.0
Lysine 0.0 10.0
Tween 60 7.5 7.5
Total weight with water 300.0 300.0
After temperature equilibration (50 °C) the emulsion structure was formed by pre-homogenising the
emulsion using the ultraturrax. The aqueous phase was mixed at 8500 rpm while the oil phase was
slowly added over 30 seconds. The emulsion was then homogenised using a two stage homogeniser.
Different sized droplets were formed using different ultraturrax and homogeniser settings (table
8.10). The emulsion was sampled for cooking and particle size measurements after each stage of
homogenisation.

166 | P a g e A n g e l a E . N e w t o n
Table 8.10 Stages of homogenisation
Stage Method Duration Speed/pressure
Stage 1 Ultraturrax 2 min 8500 rpm
Stage 2 Ultraturrax 2 min 13500 rpm
Stage 3 Ultraturrax 2 min 20500 rpm
Stage 4 Homogeniser 2 passes 500 psi (first stage) 50 psi (second stage)
8.7.3 Droplet size measurement
The droplet size of emulsions made in section 2.8.2.1 was measured using the Malvern Mastersizer
2000. The method used was adapted from Srinivasan et al (31) using a relative refractive index (N) of
1.095. The ratio of the refractive index of the fat droplet (1.46) to the continuous water phase (1.33).
An absorbance value of 0.001 was used.
The droplet size of o/w emulsions was measured using this method. The droplet size of w/o
emulsions was not measured because the instrument was not set up for these measurements.
8.7.4 o/w versus w/o (influence of emulsion type)
The aqueous phases (table 8.11) for the emulsions were made up as per table 2.9 and equilibrated at
50 °C along with the corresponding oil phases (table 8.12). These phases were used in a 1 to 1 ratio
to generate the appropriate emulsion.
Table 8.11 Phase contents for 50:50 emulsions (Maillard reaction)
Aqueous phase components (g) Oil in water emulsion Water in oil emulsion
Lactose 15 15
Lysine 10 10
Tween 60 7.5 0
Total weight with water 250 250
Table 8.12 Oil phase for 50:50 emulsions (Maillard reaction)
Phase Oil in water emulsion Water in oil emulsion
PGPR (g) 0 7.5
Total weight (g) 250 250

167 | P a g e A n g e l a E . N e w t o n
After temperature equilibration the emulsion structure was formed by pre-homogenising the
emulsion using the ultraturrax. The o/w emulsion was formed by mixing the aqueous phase at 8500
rpm while the oil phase was slowly added over 30 seconds. The emulsion was then homogenised
using a two stage homogeniser (500 psi/50 psi). The w/o emulsion was formed by mixing the oil
phase at 8500 rpm while the aqueous phase was slowly added over 30 seconds. The emulsion was
then homogenised using a two stage homogeniser (500 psi/50 psi).
8.7.5 Time series, temperature and evaporation experiments
Emulsions were made up as per section 8.7.4. The vials were weighed to 4 decimal places before
samples were added. The vial and samples were weighed again before being capped for cooking.
Samples were weighed after cooking once samples were cool and vial caps were removed. Samples
were cooked for times between 0 and 20 minutes at 2 minute time intervals.
Evaporation of water was calculated using average weights from triplicate cooked samples at each
time point. Temperature was measured as per section 8.3.2.
These samples were analysed using GCMS to monitor compound formation.
8.7.6 Microscopy
Microscopy of the emulsion structure (32) was carried out using an Olympus BX60 light microscope
(Tokyo, Japan). Samples were prepared using samples cooked in time series as per section 8.7.2. A
droplet of the emulsion was placed on a glass slide and covered with a coverslip. Photos of the
emulsions were taken at 80 x magnification.

168 | P a g e A n g e l a E . N e w t o n
8.8 References
1. Supelco, GC column selection guide. In www.sigmaaldrich.com, 2013; pp 1-30.
2. DiscoverySciences, Product: GC columns. In www.discoverysciences.com, 2010; pp 216-231.
3. Andrewes, P., Changes in Maillard reaction products in ghee during storage. Food Chemistry
2012, 135, 921-928.
4. Tsai, S. W.; Kao, K. Y., Determination of furfural in beers, vinegars and infant formulas by
solid-phase microextraction and gas chromatography/mass spectrometry. International Journal of
Environmental Analytical Chemistry 2012, 92, 76-84.
5. Leksrisompong, P.; Barbano, D. M.; Foegeding, A. E.; Gerard, P.; Drake, M., The roles of fat
and pH on the detection thresholds and coefficients of three compounds: Diacetyl, delta-
decalactone and furaneol. Journal of Sensory Studies 2010, 25, 347-370.
6. Jacobson, D.; Monforte, A. R.; Ferreira, A. C. S., Untangling the chemistry of port wine aging
with the use of GC-FID, multivariate statistics, and network reconstruction. Journal of Agricultural
and Food Chemistry 2013, 61, 2513-2521.
7. Minitab, I. Minitab statistical software, Release 16 for Windows; State College, Pennsylvania,
United States of America, 2009.
8. Ganguli, N. C.; Jain, M. K., Ghee - its chemistry, processing and technology. Journal of Dairy
Science 1973, 56, 19-25.
9. Sserunjogi, M. L.; Abrahamsen, R. K.; Narvhus, J., A review paper: Current knowledge of ghee
and related products. International Dairy Journal 1998, 8, 677-688.
10. Lee, G. C.; Lee, C. Y., Inhibitory effect of caramelisation products on enzymic browning. Food
Chemistry 1997, 60, 231-235.
11. Quintas, M. A. C.; Brandao, T. R. S.; Silva, C. L. M., Modelling colour changes during the
caramelisation reaction. Journal of Food Engineering 2007, 83, 483-491.
12. Fayle, S. E.; Gerrard, J. A., The Maillard reaction. Royal Society of Chemistry: Cambridge, UK,
2002.

169 | P a g e A n g e l a E . N e w t o n
13. Nursten, H. E., The Maillard reaction: chemistry, biochemistry and implications. RSC
Publishing: Cambridge, UK, 2005.
14. Monti, S. M.; Ritieni, A.; Graziani, G.; Randazzo, G.; Mannina, L.; Segre, A. L.; Fogliano, V.,
LC/MS analysis and antioxidative efficiency of Maillard reaction products from a lactose-lysine model
system. Journal of Agricultural and Food Chemistry 1999, 47, 1506-1513.
15. Ajandouz, E. H.; Desseaux, V.; Tazi, S.; Puigserver, A., Effects of temperature and pH on the
kinetics of caramelisation, protein cross-linking and Maillard reactions in aqueous model systems.
Food Chemistry 2008, 107, 1244-1252.
16. Gonzales, A. S. P.; Naranjo, G. B.; Leiva, G. E.; Malec, L. S., Maillard reaction kinetics in milk
powder: Effect of water activity at mild temperatures. International Dairy Journal 2010, 20, 40-45.
17. Parker, J. K., The kinetics of thermal generation of flavour. Journal of the Science of Food and
Agriculture 2013, 93, 197-208.
18. Pauletti, M. S.; Matta, E. J.; Rozycki, S., Kinetics of heat-induced browning in concentrated
milk with sucrose as affected by pH and temperature. Food Science and Technology International
1999, 5, 407-413.
19. van Boekel, M. A. J. S., Kinetic aspects of the Maillard reaction: a critical review. Nahrung -
Food 2001, 45, 150-159.
20. Novotny, O.; Cejpek, K.; Velisek, J., Formation of carboxylic acids during degradation of
monosaccharides. Czech Journal of Food Sciences 2008, 26, 117-131.
21. Smuda, M.; Voigt, M.; Glomb, M. A., Degradation of 1-deoxy-D-erythro-hexo-2,3-diulose in
the presence of lysine leads to formation of carboxylic acid amides. Journal of Agricultural and Food
Chemistry 2010, 58, 6458-6464.
22. Ajandouz, E. H.; Tchiakpe, L. S.; Dalle Ore, F.; Benajiba, A.; Puigserver, A., Effects of pH on
caramelization and Maillard reaction kinetics in fructose-lysine model systems. Journal of Food
Science 2001, 66, 926-931.
23. Bell, L. N., Maillard reaction as influenced by buffer type and concentration. Food Chemistry
1997, 59, 143-147.
170 | P a g e A n g e l a E . N e w t o n
24. Rizzi, G. P., Effects of cationic species on visual color formation in model Maillard reactions
of pentose sugars and amino acids. Journal of Agricultural and Food Chemistry 2008, 56, 7160-7164.
25. Toyosaki, T., Sakane, Y., and Kasai, M., Effects of medium-chain triacylglycerols (MCT) on the
Maillard reaction. Journal of Food Processing and Technology 2013, 4.
26. Friberg, S. E.; Larsson, K.; Sjoblom, J., Food emulsions. Marcel Dekker Inc: New York, NY,
United States of America, 2004.
27. Akhtar, M.; Murray, B. S.; Dickinson, E., Perception of creaminess of model oil-in-water dairy
emulsions: Influence of the shear-thinning nature of a viscosity-controlling hydrocolloid. Food
Hydrocolloids 2006, 20, 839-847.
28. Biasutti, M.; Venir, E.; Marchesini, G.; Innocente, N., Rheological properties of model dairy
emulsions as affected by high pressure homogenization. Innovative Food Science and Emerging
Technologies 2010, 11, 580-586.
29. Cerimedo, M. S. A.; Iriart, C. H.; Candal, R. J.; Herrera, M. L., Stability of emulsions
formulated with high concentrations of sodium caseinate and trehalose. Food Research International
2010, 43, 1482-1493.
30. Dunstan, T. S.; Fletcher, P. D. I., Compartmentalisation and separation of aqueous reagents
in the water droplets of water-in-oil high internal phase emulsions. Langmuir 2011, 27, 3409-3415.
31. Srinivasan, M.; Singh, H.; Munro, P. A., Influence of retorting (121 degrees C for 15 min),
before or after emulsification, on the properties of calcium caseinate oil-in-water emulsions. Food
Chemistry 2003, 80, 61-69.
32. Liu, Y. H.; Fribere, S. E., Perspectives of phase changes and reversibility on a case of emulsion
inversion. Langmuir 2010, 26, 15786-15793.

171 | P a g e A n g e l a E . N e w t o n
Appendix A
This appendix contains hypothesised mechanisms for the formation of some of the compounds of
interest for both the Maillard and caramelisation reactions. Structures for each formed compound
can be found in table 2.2 or the respective mechanisms.
A1 Caramelisation reaction
OHH
H O
HO H
H Ogal
OHH
CH2OH
O
H O-
HO H
H Ogal
OHH
CH2OH
H
O-
H OH
HO H
H Ogal
OHH
CH2OH
H+
O
HO H
H Ogal
OHH
CH2OH
CH2OH
H2C
OH
HO
H Ogal
OHH
CH2OH
O
HO H
H Ogal
OHH
CH2OH
CH2OH
OH
H
OHH
CH2OH
O
O
H
OHH
CH2OH
Ogal
H
H
H
O
H H
Ogal
H+
H+
Maltol A9Hydroxymaltol A10
Furfural A4Butyrolactone A6Furfuryl alcohol A72(5H)-Furanone A8DHHF A8
HMF A11
OH2
2-Acetylfuran A5
LactuloseLactose

172 | P a g e A n g e l a E . N e w t o n
A2 Maillard reaction
H
HC
OH
HO H
H O-gal
H OH
CH2OH
H
CH
OH
HO H
H O-gal
H OH
CH2OH
CH2
O
HO H
H O-gal
H OH
CH2OH
Lactoseopen ring form +
Lysine groupof protein
ImineAmadori product(lactulosylysine)
+
Lactoseclosed ring form
OO
O
HO
OH
HO
OH
HO
OH OH
OH
O
H2NO
R
OH
N
R
O
OH
NH
R
O
OH
The initial stages of the Maillard reaction, lactose reacts with the N-terminal of the lysine. This is an
alternate mechanism to that shown in figure 1.1 where the lactose reacts with the lysine residue. For
most compounds the Maillard reaction mechanisms can occur via both the lysine residue and the N-
terminal. However, mechanisms occurring via the Strecker degradation such as 2-acetylfuran can
only occur when the N-terminal of the amino acid reactions with the lactose.The Amadori compound
can then react via a 1,2-enolisation pathway or 2,3- enolisation pathway to form the compounds of
interest (table 2.2).
A2.1 1,2-Enolisation reaction pathway from the Amadori product
CH
OH
HO H
H O-gal
H OH
CH2OH
HN
ROH
O
Enol
Amadori compound
N-substituted 1-amino-2-deoxy-2-ketose
Furfural A4Furfuryl alcohol A7
HC
OH
H
H OH
CH2OH
NH
H
HO
Ogal
H
HC
OH
H
H OH
CH2OH
NH
H
HO
Ogal
H+
HC
OH
H
H OH
CH2OH
NH
H
HO
Ogal
H
OH
H
H OH
CH2OH
HO
Ogal
H
H+
H+
OH
H
H OH
CH2OH
O
Ogal
H
H
R
O
OHR
O
OH R
O
OH

173 | P a g e A n g e l a E . N e w t o n
2.2 2,3-Enolisation reaction pathway from the Amadori compound
CH2
O
HO H
H O-gal
H OH
CH2OH
NH
CH2
OH
HO
H O-gal
H OH
CH2OH
NH2 CH2
OH
O
H O-gal
H OH
CH2OH
CH3
O
O
H O-gal
H OH
CH2OH
H
KetoAmadori compound
N-substituted 1-amino-2-deoxy-2-ketose
Deoxy-2,3-hexodiulose
Acetic acid A32(5H)-Furanone A8DHHF A8Maltol A9Hydroxymaltol A10
CH3
O
O
H H
H OH
CH2OH
CH2
OH
HO
H O-gal
H OH
CH2OH
NH
CH2
O
HO
H
H OH
CH2OH
NH
CH
O
O
H
H OH
CH2OH
NH
H
H CH
OH
O
H
H OH
CH2OH
NH
H
CH
OH
HO
H
H OH
CH2OH
N
H
CH
O
HO
H
H OH
CH2OH
N R
H
H
O
O-
CH
OH
HO
H
H OH
CH2OH
N R
H
H
H
CH2
O
HO
H
H OH
CH2OH
NH2
H
H
CH2
OH
HO
H
H OH
CH2OH
NH3
H
CH2
OH
O
H
H OH
CH2OH
H
H
H+
H+
H+
H+
H+
OH2
H+
H+
H+
H+
-Ogal
R
ROH
O
R
O
OHR
O
OH
O
OHR
O
OH
O
2-AcetylfuranA5
H+
RR
OH
ROH
NH2
O
OH
O
CH2
O
HO
H
H OH
CH2OH
H2N R
H
H
H OH

174 | P a g e A n g e l a E . N e w t o n
A3 Acetic Acid
Retro-Claisen condensation reaction
OH
OH
CH2OH
HOHH
OHH
CH2OH
CH3
O
O
H2OCH3
O
HO
O
H OH
CH2OH
H
O
OHH
CH2OH
CH3
O
HO
H
H+
H+H+
Deoxy-2,3-hexodiulose Acetic acid
+
2,3-Enolisation pathway Maillard reaction A2.2
2(5H)-Furanone A8DHHF A8
OH
O
OHH
A4 Furfural
OH
H O
O
H Ogal
OHH
CH2OH
H+OH
O
H
OHH
CH2OH
Ogal
H H
O
HH+ CH2OH
O
OgalH
OHH
CH2OH
O
OH
OH2
OgalHO
O+
HO Ogal
OH
O
H
O
OgalHOH
O
HO
O
H+
O+
O
HO
O
H
H
H
Lactulose A1
Furfural
+
1,2-Enolisation pathway Maillard reaction A2.1
CH2OH
O
HO
H Ogal
OHH
CH2OH
HH+

175 | P a g e A n g e l a E . N e w t o n
A5 2-Acetylfuran
The caramelisation reaction mechanism occurs via a disproportionation reaction. This mechanism
can only happen using glucose or galactose. Lactose is unable to participate in the
disproportionation reaction because the presence of galactose at C4.
O
HO H
H OH
OHH
CH2OH
CH2OH H2C
OH
O
H OH
OHH
CH2OH
O
HO H
H OH
OHH
CH2OH
CH2OH
O
H
OHH
CH2OH
C
O
O
H
OHH
CH2OH
OH
H
H
H
O
H H
OH
H+ H+
H
H
CH3
O
HO
OHH
CH2OH
OH
CH3
O
O
OHH
CH2OH
OH
CH3
O
OHH
CH2OH
O
CH3
O
HO
OHH
CH2OH
OH
CH3
OH
HO
OHH
CH2OH
OH2
CH3
O
HO
OHH
CH2OH
CH3
O
O
H H
H OH
CH2OH
O
HO
OH2
O
H
O
H2O
O
O
O
H
O
O
H+H+
H+
H+
H+OH
2-Acetylfuran
2,3-Enolisation pathway Maillard reaction A2.2
Deoxy-2,3-hexodiulose
Glucose
CH3
O
OHH
CH2OH
O
O+
OH2

176 | P a g e A n g e l a E . N e w t o n
A6 Butyrolactone
OH
H O
O
H Ogal
OHH
CH2OH
H+
OH
O
H
OHH
CH2OH
OgalH H
O
HH+
CH2OH
O
OgalH
OHH
CH2OH
O
O
HO H
H Ogal
OHH
CH2OH
CH2OH CH2OH
O
Ogal
OH2H
CH2OH
H
CH2OH
O
Ogal
H
CH2OH
H+
CH2OH
O
Ogal
HH
CH2OH
H2O
CH2OH
O
OHgal
HH
CH2OH
HO
C
O
O
HH
CH2OH
OH
O
HH
CH2OH
O
H
H2O H+
OH
O
HH
CH2OH
O
H
OH
OH
HH
CH2OH
H
H
H
O
OHH+
O
OH
HH
CH2OH
H
H
O
OH2
HOH
O O
H+
H
H
H
H
H
H
Butyrolactone
O
+
H+
+
HC
OH
O
HH
CH2OH
Lactulose A1
2,3-Enolisation pathway Maillard reaction A2.2
HH
HO OHO
H
H
H+
HC
OH
O
HH
CH2OH
OHH+

177 | P a g e A n g e l a E . N e w t o n
A7 Furfuryl alcohol
O
HO H
H Ogal
OHH
CH2OH
CH2OH CH2OH
O
O
H
OHH
CH2OH
O
O
H
OHH
CH2OH
H
OH
O
H
OHH
CH2OH
H
OH
H
H
OH
H+
H+
H
H
OH
O
H
OHH
CH2OH
H
OH
OH
O
H
OHH
CH2OH
H
H
OH
OH
OH
O
H
OHH
CH2OH
H
H OH
O
H H
HH+
HO
H H
OHH
CH2OH
H
H
OH
O
OH
OH2
HO
O
OH
HO H
O
H2O
OH
O+
OH
HO
OH
H
H
H
H2O
Lactulose A1
Furfuryl alcohol
H
1,2-Enolisation pathway Maillard reaction A2.1
A8 2(5H)-Furanone and Dihydro-4-hydroxy-2(3H)-furanone (DHHF)
OH
H O
O
H Ogal
OHH
CH2OH
H+
OH
O
H
OHH
CH2OH
OgalH H
O
HH+
CH2OH
O
OgalH
OHH
CH2OH
O
HO H
H Ogal
OHH
CH2OH
CH2OH
OH
O
OHH
CH2OH
O
H H
OH
OH
OH
OHH
H
OHH
OH
OH
OHH
H
H+H
O
OH
H
OH2HO
O H
H
O
HO
O
H+
OO
HO
OO
HO H
O O
H2O
OO
H
H
H
HH+
H
Lactulose A1
2(5H)-Furanone
DHHF
2,3-Enolisation pathway Maillard reaction A2.2
+
H
HH

178 | P a g e A n g e l a E . N e w t o n
A9 Maltol
CH3
O
O
H O-gal
H OH
CH2OH
OHO
O
Ogal
OHH
H+
O
Ogal
OHO
O
Ogal
O
H
O
HO
HO
O
HO
H+
H+
O
Ogal
HO
+H2OO
O
HO
gal
O
O
HO
gal
OH2
O
HO
HO
galHO
H
H+
Deoxy-2,3-hexodiulose
Maltol
H2C
OH
O
H Ogal
OHH
CH2OH
O
HO H
H Ogal
OHH
CH2OH
CH2OH
O
H
OHH
CH2OH
O
H H
Ogal
H+
H+
H
H
2,3-Enolisation pathway Maillard reaction A2.2
Lactulose A1
OH2
A10 Hydroxymaltol
H2C
OH
O
H Ogal
OHH
CH2OH
O
HO H
H Ogal
OHH
CH2OH
CH2OH
O
H
OHH
CH2OH
OH
O
H
OHH
CH2OH
Ogal
H
H
H
O
H H
Ogal
H+H+
H
H
OHO
O
Ogal
OHH
O
Ogal
HO OH
H2O
H+
O
O
HO OH
gal
O
O
HO OH
galOH2
O
HO
HO OH
galHO
O
O
HO OH
Hydroxymaltol
2,3-Enolisation pathway Maillard reaction A2.2
Lactulose A1
OH2

179 | P a g e A n g e l a E . N e w t o n
A 11 HMF
O
HO H
H Ogal
OHH
CH2OH
CH2OH
O
Ogal
O
HO
O
OH
HOOO
HO
H
H
HMF
OHO OH
OHOgal
O
HO OH
OHOgal
HOH2
OHO O
OH2Ogal
H
Lactulose A1

180 | P a g e A n g e l a E . N e w t o n
Appendix B
This appendix contains the following Fonterra bulletins:
Anhydrous Milk Fat PB. 102 V. 2.0712
Liquid Cream PB. 265 V. 1.0511
Typical Amino Acid Profile: Whey Protein Isolate 895 NB. 071 V. 1.0511

Anhydrous Milkfat Regular Grade
PB.102 Version 2.0712 UNRESTRICTED
Fonterra Co-operative Group Limited (Fonterra) and its subsidiaries, affiliates, agents, suppliers and distributors make no representations or warranties of any kind as to the accuracy, adequacy, or completeness of any information and/or opinions contained in this document or that they are suitable for your intended use. The information and/or opinions contained in this document may be changed at any time without notice. Nothing contained in this document should be construed as permission to infringe any intellectual property right or as a warranty of non-infringement of any intellectual property right. Please note that some products and applications may not be available and/or admissible.
Anhydrous Milkfat (regular grade) from Fonterra gives a natural dairy flavour and creaminess to finished products and is the perfect high quality fat ingredient. Anhydrous Milkfat (regular grade) is pure milkfat, derived exclusively from milk and/or products obtained from milk (may include mixtures of cream, butter or whey cream). It has excellent natural keeping qualities. Anhydrous Milkfat (regular grade) is virtually free of moisture and contains no chemical additives, preservatives, flavours, foreign fats or other impurities.
Product Characteristics 99.9% pure milkfat made from 100% pure cream.
Imparts good dairy flavour to product.
Anhydrous Milkfat (Regular Grade) is full of natural goodness – it contains no additives.
Is produced in a sophisticated processing plant to ensure product consistency.
Good shelf life in high quality packaging.
Suggested Uses Frying, grilling, roasting
Sauces
Recombined dairy products
Ice cream
Processed cheese
Confectionery
Packaging A round closed-head drum, lined with food grade resin and headspace filled with nitrogen.
Net Weight 210 kg
Gross Weight 226.8 kg
Cubic measure – per drum 0.255 m
Storage and Handling Anhydrous Milkfat (regular grade) may be transported and stored without refrigeration. However, the storage life will depend on the storage temperature. To maintain quality, it is recommended the product is stored in a cool dry area away from direct sunlight. Provided the seal is unbroken and the above storage conditions are followed, the milkfat will be suitable as a dairy ingredient for at least 12 months after the date of manufacture.
Typical Compositional Analysis The analysis results listed in this product bulletin are typical. Refer to the selling specification for minimum & maximum limits by parameter.
Fat (g/100g) 99.9
Moisture (g/100g) <0.1
Typical Mineral Analysis Iron (mg/kg) <0.2
Copper (mg/kg) <0.05
Sodium (mg/100g) <1
Potassium (mg/100g) <1
Calcium (mg/100g) <1
Typical Chemical Analysis Free fatty acids as Oleic acid (%m/m) 0.2
Peroxide Value (meq O2/kg) 0.2
Iodine value 29 - 39
Reichert Meissl value 22.4 – 31.8
Polenske value 1.5 – 3.4
Kirchner value 17 - 27
Saponification value 225 - 235

Anhydrous Milkfat Regular Grade
PB.102 Version 2.0712 UNRESTRICTED
Fonterra Co-operative Group Limited (Fonterra) and its subsidiaries, affiliates, agents, suppliers and distributors make no representations or warranties of any kind as to the accuracy, adequacy, or completeness of any information and/or opinions contained in this document or that they are suitable for your intended use. The information and/or opinions contained in this document may be changed at any time without notice. Nothing contained in this document should be construed as permission to infringe any intellectual property right or as a warranty of non-infringement of any intellectual property right. Please note that some products and applications may not be available and/or admissible.
Typical Fatty Acid Composition (g/100g) Fatty Acid Min% Max %
Butyric C4:0 2.7 4.5
Caproic C6:0 1.8 2.7
Caprylic C8:0 1.0 1.7
Capric C10:0 2.2 3.9
Lauric C12:0 2.5 4.5
Myristic C14:0 9.1 13.1
Myristoleic C14:1 0.5 1.2
Palmitic C16:0 23.6 33.3
Palmitoleic C16:1 0.7 2.3
Stearic C18:0 9.1 14.6
Oleic C18:1 18.3 29.6
Linoleic C18:2 0.8 1.7
Linolenic C18:3 0.8 2.0
Arachidic C20:0 0.05 0.3
Density (Typical Seasonal Range) 10°C (kg/dm
3) 0.935 - 0.956
20°C (kg/dm3) 0.922 - 0.942
30°C (kg/dm3) 0.909 - 0.925
40°C (kg/dm3) 0.900 - 0.912
50°C (kg/dm3) 0.893 - 0.902
60°C (kg/dm3) 0.888 - 0.893
70°C (kg/dm3) 0.885 - 0.888
Solid Fat Content Temperature Mean Typical Range
0°C 66.9 58.5 – 70.5
5° 63.3 55.0 – 67.1
10°C 56.4 48.5 – 60.9
15°C 41.0 33.5 – 46.6
20°C 22.5 17.1 – 27.8
25°C 12.4 8.4 – 14.7
30°C 5.9 3.8 – 7.8
35°C 1.0 0.0 – 1.9
Typical Nutritional Analysis Energy (kJ/100g) 3700
Calories (kcal/100g) 880
Total Fat (Milkfat) (g/100g) 99.9
Moisture (g/100g) <0.1
Protein (g/100g) <0.01
Carbohydrate (g/100g) <0.01
Sugars (Lactose) (g/100g) <0.01
Dietary Fibre (g/100g) Nil
Cholesterol (mg/100g) 240
Fatty Acids (g/100g Product)
Saturated fatty acids 60.2
Total Unsaturated fatty acids 22.6
Mono unsaturated fatty acids 20.6
Poly unsaturated fatty acids 2.1
Trans1 fatty acids
2 4.9
1 Methylene interrupted trans .
2 Please refer to individual country regulations for trans
fatty acid labelling requirements
Vitamins Vitamin A (mg retinol/100g) 1.0
Vitamin A potency (IU/g) (retinol + carotene) 35 - 50
Vitamin D (mg/100g) Trace
Vitamin E (mg/100g) 3.8
Vitamin C (mg/100g) <0.1
Typical Physical Properties Melting Point (Mettler) 31 - 34°C
Refractive Index 1.4534 - 1.4549
Specific Heat at 40°C (kJ/kg) 2.1
Solubility of water in AMF (40°C) 0.20
Viscosity at 40°C (mPa.s) 31
Viscosity at 50°C (mPa.s) 22

Anhydrous Milkfat Regular Grade
PB.102 Version 2.0712 UNRESTRICTED
Fonterra Co-operative Group Limited (Fonterra) and its subsidiaries, affiliates, agents, suppliers and distributors make no representations or warranties of any kind as to the accuracy, adequacy, or completeness of any information and/or opinions contained in this document or that they are suitable for your intended use. The information and/or opinions contained in this document may be changed at any time without notice. Nothing contained in this document should be construed as permission to infringe any intellectual property right or as a warranty of non-infringement of any intellectual property right. Please note that some products and applications may not be available and/or admissible.
Typical Microbiological Analysis Aerobic Plate Count (cfu/g) <100
Listeria (/25g) Absent
Salmonella (/250g) Absent
Refer to individual Fonterra product selling specification for specific microbiological limits.
Quality Assurance Strict quality control procedures are enforced during manufacture. The manufacturing environment is also subject to regular monitoring and control.
Product is pasteurised.
Final product is sampled and tested for chemical, sensory and microbial parameters using internationally recognised procedures.
During storage and shipment, precautions are taken to ensure that the product quality is maintained. Each package is identified enabling traceback.
Compliance Meets CODEX requirements for Anhydrous Milkfat.
http://www.codexalimentarius.net/web/index_en.jsp
Meets Halal requirements.
Suggested Labelling Anhydrous Milkfat or AMF
Allergens: Contains Milk and Dairy products
Country regulations for product labelling vary. Fonterra advises customers that they need to check local regulations to determine the correct labelling of this ingredient

Liquid Cream
PB.265 Version 1.0511 UNRESTRICTED
Fonterra Co-operative Group Limited (Fonterra) and its subsidiaries, affiliates, agents, suppliers and distributors make no representations or warranties of any kind as to the accuracy, adequacy, or completeness of any information and/or opinions contained in this document or that they are suitable for your intended use. The information and/or opinions contained in this document may be changed at any time without notice. Nothing contained in this document should be construed as permission to infringe any intellectual property right or as a warranty of non-infringement of any intellectual property right. Please note that some products and applications may not be available and/or admissible.
This bulletin applies to both Pasteurised and Unpasteurised Bulk Liquid Cream. Please refer to individual product selling specification.
Product Characteristics 100% fresh cream.
Natural rich flavour imparts premium fresh dairy flavour to product.
High in fat.
Suggested Uses Bulk Liquid Cream is suitable for use in the
manufacture of fresh liquid products where a high fat content is required.
Ice Cream.
Packaging Delivered in 25000 kg Tankers.
Storage and Handling Tankers are filled at less than 11°C. Note: Milkfat will crystallize with time after cooling. The process of fat crystallization results in “Heat of Crystallization” being given off. This will result in a rise of temperature of the cream during storage and distribution. Cream should be delivered at 14°C or less.
Typical Compositional Analysis The analysis results listed in this product bulletin are typical as measured on an “as is” basis. Refer to the selling specification for minimum & maximum limits by parameter.
Milk Solids Not Fat 4.5%
Moisture 54.0%
Fat 41.5%
Typical Nutritional Analysis Energy (kJ/100g) 1612
Calories (kcal/100g) 384
Protein (g/100g) 2.0
Total Carbohydrate (g/100g) 2.5
Total Sugars (lactose) (g/100g) 2.5
Total Fat (Milkfat) (g/100g) 41.5
Saturated fat (g/100g) 28.9
Sodium (mg/100g) 25
Typical Microbiological Analysis Aerobic Plate Count (cfu/ml) < 10,000
Inhibitory Substances (IU/ml) <0.003
Coliforms (cfu/ml) <10
Quality Assurance Strict quality control procedures are enforced during production. The manufacturing environment is subject to strict monitoring.
During storage and shipment, precautions are taken to ensure that the product quality is maintained.
Compliance Complies with Food Standards Australia New
Zealand (FSANZ) and Animal Products (Dairy) Regulation 2005.
Suggested Labelling Allergens: Contains Milk and Dairy products
Country regulations for product labelling vary. Fonterra advises customers that they need to check local regulations to determine the correct labelling of this ingredient

Typical Amino Acid Profile Whey Protein Isolate 895
NB.071 Version 1.0511
UNRESTRICTED
Fonterra Co-operative Group Limited (Fonterra) and its subsidiaries, affiliates, agents, suppliers and distributors make no representations or warranties of any kind as to the accuracy, adequacy, or completeness of any information and/or opinions contained in this document or that they are suitable for your intended use. The information and/or opinions contained in this document may be changed at any time without notice. Nothing contained in this document should be construed as permission to infringe any intellectual property right or as a warranty of non-infringement of any intellectual property right. Please note that some products and applications may not be available and/or admissible.
The typical value is an average of representative samples taken from across the manufacturing season.
Amino acid Essential amino acids Typical Amount per 100gm of Protein Isoleucine 6.3 g
Leucine 14.3 g
Lysine 11.2 g
Methionine 2.4 g
Phenylalanine 3.8 g
Threonine 5.3 g
Tryptophan 2.4 g
Valine 5.6 g
Non-Essential amino acids
Histidine (Essential for Infants) 2.0 g
Alanine 5.7 g
Arginine 3.0 g
Aspartic acid 12.5 g
Cysteine/cystine 4.0 g
Glutamic acid 17.6 g
Glycine 1.8 g
Proline 4.5 g
Serine 4.5 g
Tyrosine 4.2 g

186 | P a g e A n g e l a E . N e w t o n
Appendix C Statistics
Principle Components Analysis (PCA)
Principle components analysis was carried out using Minitab software (version 16) (1). The PCA
generates linear combinations of the original data that was entered into the system. A set of
principle component (PC) values is calculated for each variable, indicating how far the variable is
from the calculated axis. The axis is the linear combination that describes the variation across all of
the variable responses and has a calculated Eigenvalue corresponding to the amount of variation
explained by that axis; the higher the Eigenvalue the higher the percentage of variation explained by
that axis (1).
For the experiments in this thesis, the peak areas of the eleven monitored compounds were entered
for each individual sample. The principle components were calculated using a correlation matrix in
which all the variables (peak area) had been standardised. The peak areas were standardised
because each compound has a different response factor, compounds with a very large or very small
response factor can skew the data. The standardisation is also appropriate because it is the relative
amounts of compounds present rather than the absolute quantities in each sample. The linear
combinations (principle components) explain the given amount of variance within the data set (1).
The PCA score plots represent each sample along with similarities and dissimilarities between them.
The x and y axis of the PCA score plot represent the first two principle components calculated to
explain the variation within the samples (1). A loading plot can be used in combination with the
score plot to identify which variables are associated with which samples.
Samples that are similar to each other with respect to the variables represented using the principle
components (peak area of the monitored compounds) will be clustered close together while samples
with a lesser degree of similarity will be further apart. The percentage of variance explained by each
principle component as plotted on the PCA score plot give an indication of the degree of similarity
between samples: a large PC value would indicate that the first principle component explains a large
percentage of variation and therefore samples spread along this axis exhibit large differences;
however, a small PC value indicates only a small percentage of variation is explained and therefore
samples spread along the axis exhibit only small differences (1).
187 | P a g e A n g e l a E . N e w t o n
Analysis of Variance (ANOVA)
An ANOVA using Minitab software (version 16) was employed in the study/thesis (1). This analysis
was used to investigate the relationship between changes in responses (eleven monitored
compounds) and changes in sample treatments (pH, time, temperature, matrix structure). The
calculation investigates whether the means of the groups are, statistically, the same or different (1).
The null hypothesis is that the means of the groups are statistically the same. The alpha value (α) is
the level of confidence you have in correctly rejecting the null hypothesis when it is true. The p-value
relates to the chances of saying that there is a significant relationship when in fact there is none, i.e.
a p-value of 0.05 means that 95 times out of 100 we will correctly assume that there is an effect, but
5 times out of 100 we will say there is an effect when there isn’t one.
To test for significance a p value of <0.05 was used; any variation with a p value less than 0.05 was
regarded as indicating a reliably significant difference in the results. This equates to a 95%
confidence interval, indicating that there is 95% confidence in the means being different. Along with
calculating the p value an F value was also calculated, the F value is the ratio of the explained (can be
attributed to the experimental factors) and unexplained (attributed to error) variances in the
experiment. A large F value indicates that variance has been efficiently explained and when coupled
with a small p value provides strong evidence that the results are significantly different from one
another (1).
Other information that can be obtained from the ANOVA includes interactions between treatments
of data, and the main effects of the treatment for each response. Prior to the ANOVA calculations
the normality of the data was tested. It is important that the data points are normally distributed for
each response, in this case for each compound. For all ANOVA carried out in this study the residuals
were checked and all showed normal distributions. The interaction plots give an insight into the
complex relationships occurring between treatments and the main effects show the effect of a single
factor acting alone on the samples (1).
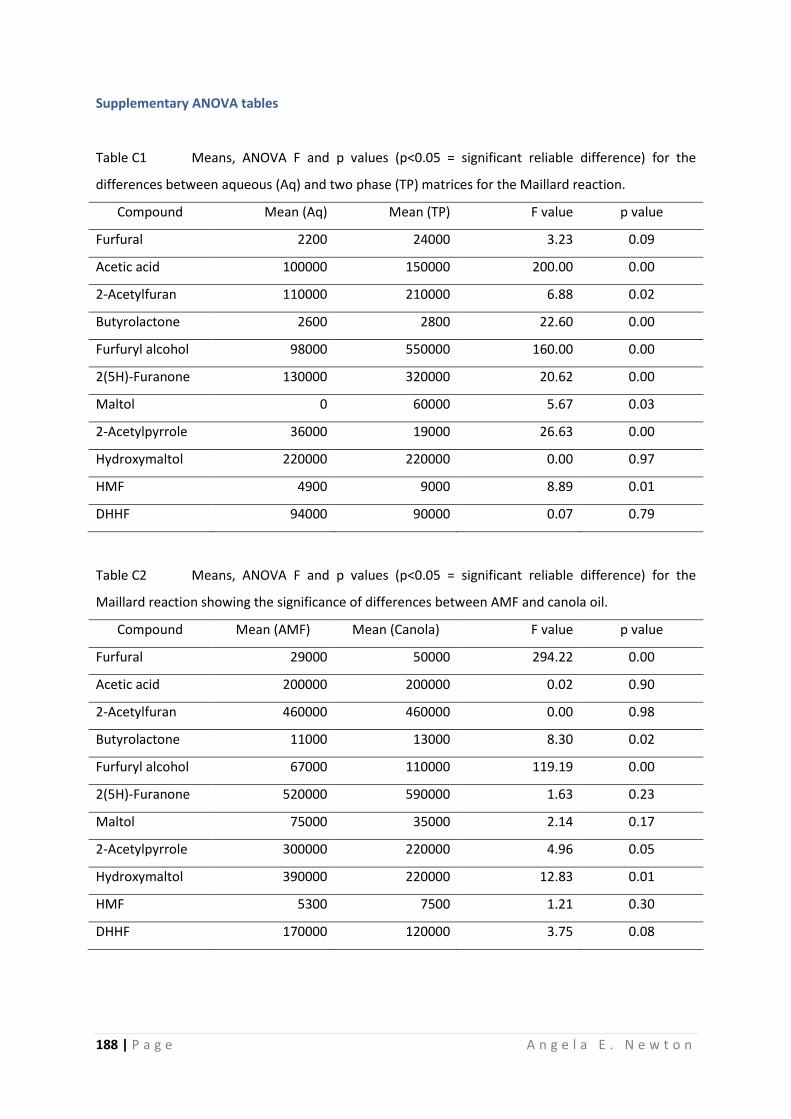
188 | P a g e A n g e l a E . N e w t o n
Supplementary ANOVA tables
Table C1 Means, ANOVA F and p values (p<0.05 = significant reliable difference) for the
differences between aqueous (Aq) and two phase (TP) matrices for the Maillard reaction.
Compound Mean (Aq) Mean (TP) F value p value
Furfural 2200 24000 3.23 0.09
Acetic acid 100000 150000 200.00 0.00
2-Acetylfuran 110000 210000 6.88 0.02
Butyrolactone 2600 2800 22.60 0.00
Furfuryl alcohol 98000 550000 160.00 0.00
2(5H)-Furanone 130000 320000 20.62 0.00
Maltol 0 60000 5.67 0.03
2-Acetylpyrrole 36000 19000 26.63 0.00
Hydroxymaltol 220000 220000 0.00 0.97
HMF 4900 9000 8.89 0.01
DHHF 94000 90000 0.07 0.79
Table C2 Means, ANOVA F and p values (p<0.05 = significant reliable difference) for the
Maillard reaction showing the significance of differences between AMF and canola oil.
Compound Mean (AMF) Mean (Canola) F value p value
Furfural 29000 50000 294.22 0.00
Acetic acid 200000 200000 0.02 0.90
2-Acetylfuran 460000 460000 0.00 0.98
Butyrolactone 11000 13000 8.30 0.02
Furfuryl alcohol 67000 110000 119.19 0.00
2(5H)-Furanone 520000 590000 1.63 0.23
Maltol 75000 35000 2.14 0.17
2-Acetylpyrrole 300000 220000 4.96 0.05
Hydroxymaltol 390000 220000 12.83 0.01
HMF 5300 7500 1.21 0.30
DHHF 170000 120000 3.75 0.08

189 | P a g e A n g e l a E . N e w t o n
Table C3 Means, ANOVA F and p values (p<0.05 = significant reliable difference) for the
significance of differences between aqueous (Aq) and two phase (TP) matrices for the
Caramelisation reaction.
Compound Mean (Aq) Mean (TP) F value p value
Furfural 1800 3400 5.47 0.03
Acetic acid 5400 4900 0.03 0.87
2-Acetylfuran 1700 2200 0.89 0.36
Butyrolactone 1200 700 6.79 0.02
Furfuryl alcohol 1700 10000 6.82 0.02
2(5H)-Furanone 5600 12000 21.59 0.00
Maltol Not detected Not detected
2-Acetylpyrrole Not detected Not detected
Hydroxymaltol Not detected Not detected
HMF 3600 2900 0.28 0.60
DHHF 5900 3700 3.87 0.06
Table C4 Means, ANOVA F and p values (p<0.05 = significant reliable difference) for the
caramelisation reaction showing the significance of differences between AMF and canola oil.
Compound Mean (AMF) Mean (Canola) F value p value
Furfural 3000 6100 40.98 0.37
Acetic acid 6900 0 0.89 0.00
2-Acetylfuran 4100 4700 1.50 0.25
Butyrolactone 1300 700 16.15 0.00
Furfuryl alcohol 20000 10000 7.89 0.02
2(5H)-Furanone 15000 7000 21.64 0.00
Maltol Not detected Not detected
2-Acetylpyrrole Not detected Not detected
Hydroxymaltol Not detected Not detected
HMF 1400 700 1.97 0.19
DHHF 2900 2500 0.47 0.51

190 | P a g e A n g e l a E . N e w t o n
Table C5 Means, ANOVA F and p values (p<0.05 = significant reliable difference) for the effect
of aqueous concentration on the Maillard reaction.
Compound Mean (100% Aq) Mean (60% Aq) F value p value
Furfural 2200 2400 0.36 0.55
Acetic acid 110000 150000 5.22 0.03
2-Acetylfuran 110000 190000 3.77 0.07
Butyrolactone 2700 3400 2.05 0.16
Furfuryl alcohol 97000 82000 3.76 0.07
2(5H)-Furanone 130000 190000 5.33 0.03
Maltol Not detected Not detected
2-Acetylpyrrole 36000 59000 3.04 0.10
Hydroxymaltol 220000 200000 0.14 0.71
HMF 4700 4100 0.95 0.34
DHHF 94000 140000 13.31 0.00
Table C6 Means, ANOVA F and p values (p<0.05 = significant reliable difference) for the effect
of aqueous concentration on the caramelisation reaction.
Compound Mean (100% Aq) Mean (60% Aq) F value p value
Furfural 1800 2000 0.26 0.62
Acetic acid 5400 4900 0.07 0.80
2-Acetylfuran 1700 700 6.11 0.02
Butyrolactone 1200 1600 6.31 0.02
Furfuryl alcohol 17000 16000 0.00 0.96
2(5H)-Furanone 5600 5800 0.03 0.86
Maltol Not detected Not detected
2-Acetylpyrrole Not detected Not detected
Hydroxymaltol Not detected Not detected
HMF 3600 1700 2.31 0.15
DHHF 5900 4900 0.74 0.40

191 | P a g e A n g e l a E . N e w t o n
Table C7 Means, ANOVA F and p values (p<0.05 = significant reliable difference) for the
difference between o/w emulsion and two phase Maillard reaction.
Compound Mean (o/w) Mean (TP) F value p value
Furfural 40000 35000 0.63 0.47
Acetic acid 420000 520000 12.18 0.02
2-Acetylfuran 280000 710000 2.80 0.00
Butyrolactone 13000 15000 4.30 0.11
Furfuryl alcohol 1300000 1000000 2.41 0.20
2(5H)-Furanone 170000 290000 3058.45 0.00
Maltol 1300000 3000000 75.36 0.00
2-Acetylpyrrole 110000 490000 174.81 0.00
Hydroxymaltol 310000 710000 144.20 0.00
HMF 11000 18000 23.70 0.01
DHHF 140000 290000 69.59 0.00
Table C8 Means, ANOVA F and p values (p<0.05 = significant reliable difference) for
differences between different droplet sizes in o/w emulsions for the Maillard reaction.
Means
Compound A* B* C* D* F value p value
Furfural 40000 40000 40000 40000 0.01 0.99
Acetic acid 420000 850000 720000 860000 4.81 0.02
2-Acetylfuran 280000 87000 720000 19000 3.17 0.06
Butyrolactone 13000 19000 18000 19000 1.20 0.35
Furfuryl alcohol 1300000 140000 1400000 1400000 0.04 0.99
2(5H)-Furanone 170000 390000 370000 390000 3.24 0.060
Maltol 1300000 2500000 2500000 2500000 16.25 0.000
2-Acetylpyrrole 110000 310000 320000 330000 17.82 0.000
Hydroxymaltol 310000 650000 650000 680000 7.39 0.01
HMF 11000 10000 10000 16000 6.87 0.00
DHHF 140000 280000 270000 280000 35.78 0.00
*A = homogeniser; B = 20,000 ultraturrax; C = 13500 ultraturrax; D = 8500 ultraturrax.

192 | P a g e A n g e l a E . N e w t o n
Table C9 Means, ANOVA F and p values (p<0.05 = significant reliable difference) for the
difference between o/w emulsion and two phase caramelisation reaction.
Compound Mean (o/w) Mean (TP) F value p value
Furfural 23000 17000 10.78 0.08
Acetic acid 36000 83000 152.33 0.01
2-Acetylfuran 8800 5400 61.71 0.02
Butyrolactone 4700 6400 7.57 0.12
Furfuryl alcohol 150000 90000 472.00 0.00
2(5H)-Furanone 60000 73000 2.05 0.89
Maltol Not detected Not detected
2-Acetylpyrrole Not detected Not detected
Hydroxymaltol Not detected Not detected
HMF 1800 2100 3.99 0.18
DHHF 15000 7700 122.30 0.01
Table C10 Means, ANOVA F and p values (p<0.05 = significant reliable difference) for
differences between different droplet sizes in o/w emulsions for the caramelisation reaction.
Means
Compound A* B* C* D* F value p value
Furfural 23000 31000 28000 27000 4.66 0.09
Acetic acid 36000 53000 46000 3900 77.00 0.00
2-Acetylfuran 8800 8600 7500 7400 0.94 0.50
Butyrolactone 4800 8400 7400 7100 23.02 0.01
Furfuryl alcohol 150000 250000 210000 200000 45.53 0.00
2(5H)-Furanone 61000 64000 78000 5900 1.36 0.37
Maltol Not detected Not detected Not detected Not detected
2-Acetylpyrrole Not detected Not detected Not detected Not detected
Hydroxymaltol Not detected Not detected Not detected Not detected
HMF 1800 3100 2400 2200 3.73 0.12
DHHF 15000 13000 12000 8300 6.98 0.05
A = homogeniser; B = 20,000 ultraturrax; C = 13500 ultraturrax; D = 8500 ultraturrax.

193 | P a g e A n g e l a E . N e w t o n
Table C11 Means, ANOVA F and p values (p<0.05 = significant reliable difference) for the
difference between o/w and w/o emulsion structures for the Maillard reaction.
Compound Mean (o/w) Mean (w/o) F value p value
Furfural 40000 70000 611.02 0.00
Acetic acid 270000 96000 10.04 0.01
2-Acetylfuran 280000 890000 42.19 0.00
Butyrolactone 11000 17000 32.82 0.00
Furfuryl alcohol 110000 1000000 6.15 0.04
2(5H)-Furanone 370000 870000 2.80 0.13
Maltol 440000 960000 2.58 0.15
2-Acetylpyrrole 170000 440000 8.32 0.02
Hydroxymaltol 160000 390000 1.93 0.20
HMF 47000 160000 1.31 0.29
DHHF 120000 230000 181.45 0.00
References
1. Minitab, I. Minitab statistical software, Release 16 for Windows; State College, Pennsylvania, United States of America, 2009.