Flavors of Climate variability: El Nino, La Niña, … of Climate variability: El Nino, La Niña,...
44
Flavors of Climate variability: El Nino, La Niña, Recurring Jet Stream patterns, Multi-Decadal Variability By Dr. Gerry Bell Climate Prediction Center (CPC) NOAA/National Weather Service/ National Centers for Environmental Prediction Presented to Community Collaborative Rain, Hail and Snow Network (CoCoRaHS) 17 January 2013 www.cpc.ncep.noaa.gov
Transcript of Flavors of Climate variability: El Nino, La Niña, … of Climate variability: El Nino, La Niña,...
Flavors of Climate variability: El Nino, La Niña, Recurring Jet Stream patterns, Multi-Decadal Variability
By
Dr. Gerry Bell Climate Prediction Center (CPC)
NOAA/National Weather Service/ National Centers for Environmental Prediction
Presented to Community Collaborative Rain, Hail and Snow Network (CoCoRaHS)
17 January 2013
www.cpc.ncep.noaa.gov
Outline
1. Dinstinguishing weather and climate, climate variability
2. Climate variability linked to El Niño and La Niña (ENSO)
3. Climate variability linked to recurring jet stream patterns (Teleconnections) • Some concepts • Pacific/ North American Pattern (PNA) • North Atlantic Oscillation (NAO) • Arctic Oscillation (AO)
4. Climate variability linked to decadal ocean patterns
• Atlantic Multi-Decadal Oscillation (AMO) • Pacific Decadal Oscillation (PDO)
5. Summary
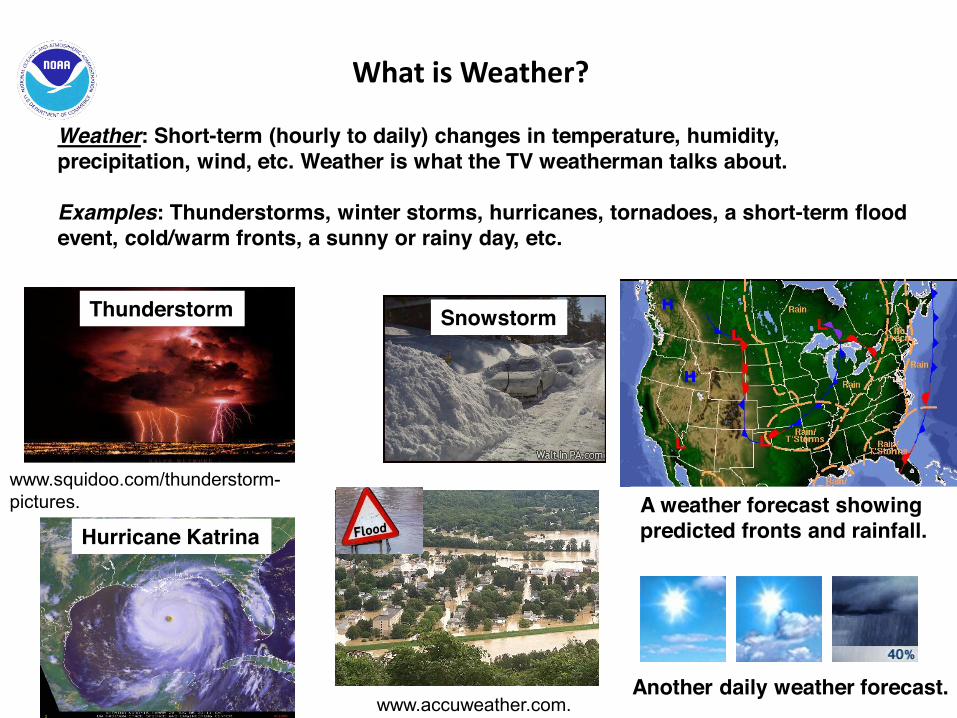
What is Weather?
Weather: Short-term (hourly to daily) changes in temperature, humidity, precipitation, wind, etc. Weather is what the TV weatherman talks about. Examples: Thunderstorms, winter storms, hurricanes, tornadoes, a short-term flood event, cold/warm fronts, a sunny or rainy day, etc.
Hurricane Katrina
www.squidoo.com/thunderstorm-pictures.
www.accuweather.com.
Thunderstorm Snowstorm
A weather forecast showing predicted fronts and rainfall.
Another daily weather forecast.
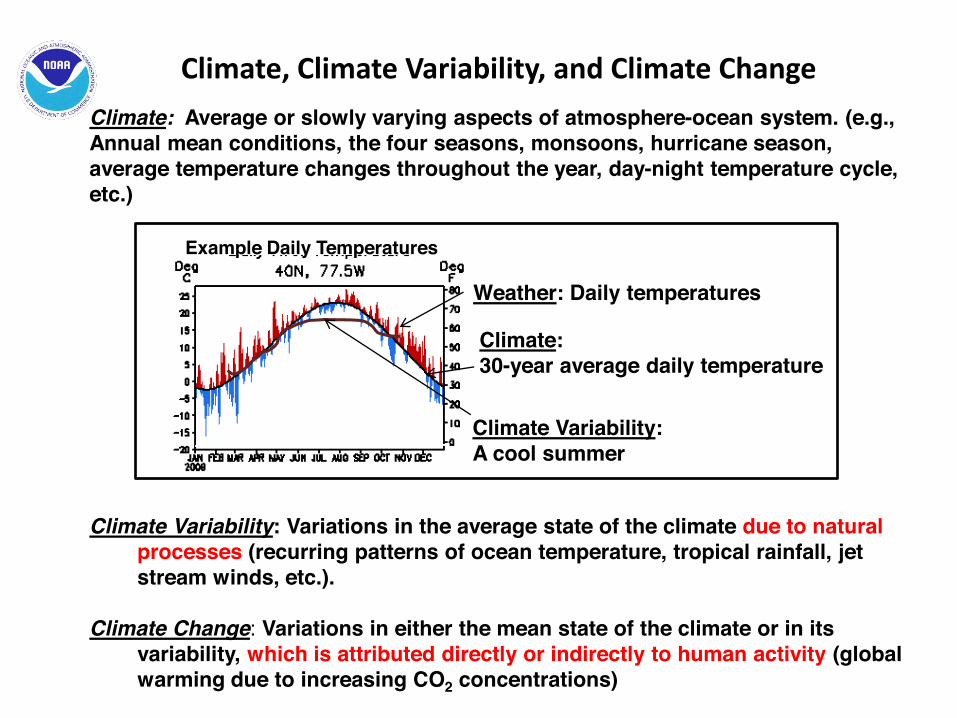
Climate, Climate Variability, and Climate Change
Climate: Average or slowly varying aspects of atmosphere-ocean system. (e.g., Annual mean conditions, the four seasons, monsoons, hurricane season, average temperature changes throughout the year, day-night temperature cycle, etc.)
Climate Variability: Variations in the average state of the climate due to natural
processes (recurring patterns of ocean temperature, tropical rainfall, jet stream winds, etc.).
Climate Change: Variations in either the mean state of the climate or in its
variability, which is attributed directly or indirectly to human activity (global warming due to increasing CO2 concentrations)
Weather: Daily temperatures
Climate: 30-year average daily temperature
Climate Variability: A cool summer
Example Daily Temperatures

Climate Variability
•Climate variability typically occurs over vast distances (continental, hemispheric, global), with time scales ranging from weeks to years to decades.
•Climate variability is often linked to recurring jet stream, ocean temperature, and tropical rainfall patterns.
•Climate variability differs throughout the world and with the seasons.
Atlantic Multi-Decadal Oscillation
El Niño El Niño Impacts
African Sahel Drought 2009-2010 Record
Snowfall
Atlantic Hurricane Season Strength
Some examples of climate variability:
Inde
x of
Atla
ntic
Oce
an
Tem
pera
ture
Dep
artu
res
Sea surface temperature Departures
Climate Variability Linked to El Niño and La Niña (ENSO)
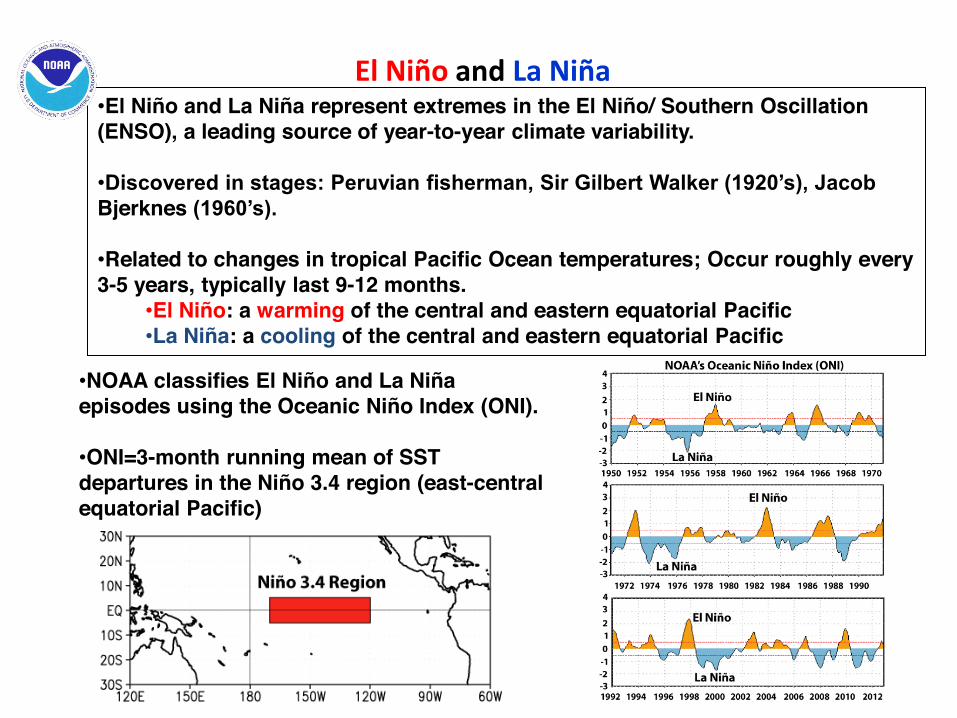
El Niño and La Niña •El Niño and La Niña represent extremes in the El Niño/ Southern Oscillation (ENSO), a leading source of year-to-year climate variability.
•Discovered in stages: Peruvian fisherman, Sir Gilbert Walker (1920’s), Jacob Bjerknes (1960’s).
•Related to changes in tropical Pacific Ocean temperatures; Occur roughly every 3-5 years, typically last 9-12 months.
•El Niño: a warming of the central and eastern equatorial Pacific •La Niña: a cooling of the central and eastern equatorial Pacific
•NOAA classifies El Niño and La Niña episodes using the Oceanic Niño Index (ONI). •ONI=3-month running mean of SST departures in the Niño 3.4 region (east-central equatorial Pacific)
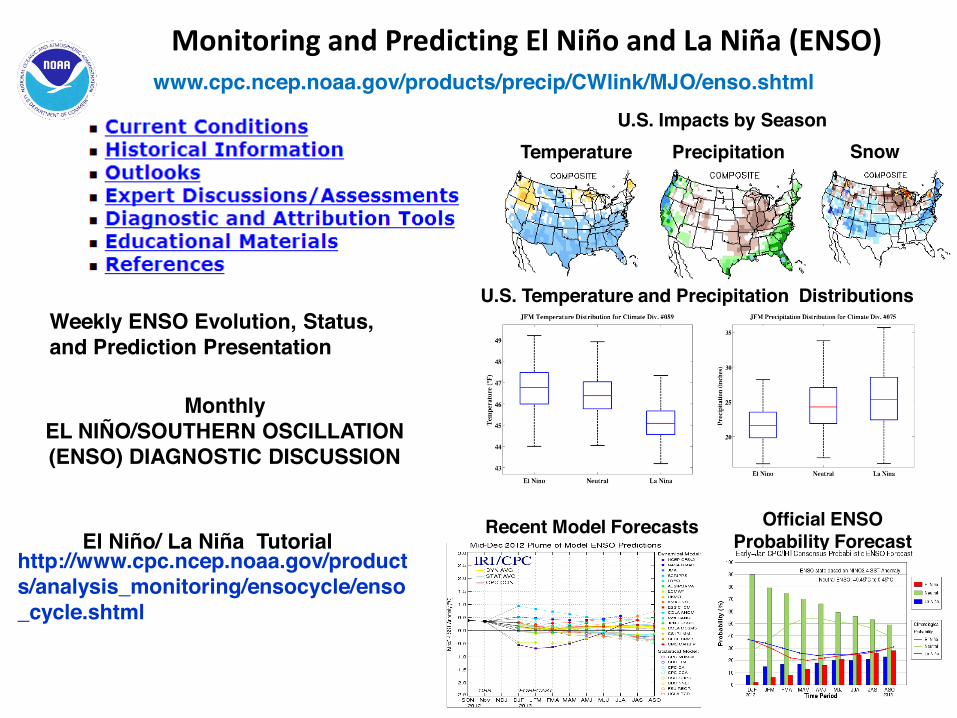
Monitoring and Predicting El Niño and La Niña (ENSO) www.cpc.ncep.noaa.gov/products/precip/CWlink/MJO/enso.shtml
http://www.cpc.ncep.noaa.gov/products/analysis_monitoring/ensocycle/enso_cycle.shtml
El Niño/ La Niña Tutorial
U.S. Impacts by Season Temperature Precipitation Snow
U.S. Temperature and Precipitation Distributions Weekly ENSO Evolution, Status, and Prediction Presentation
Monthly EL NIÑO/SOUTHERN OSCILLATION (ENSO) DIAGNOSTIC DISCUSSION
Recent Model Forecasts Official ENSO Probability Forecast
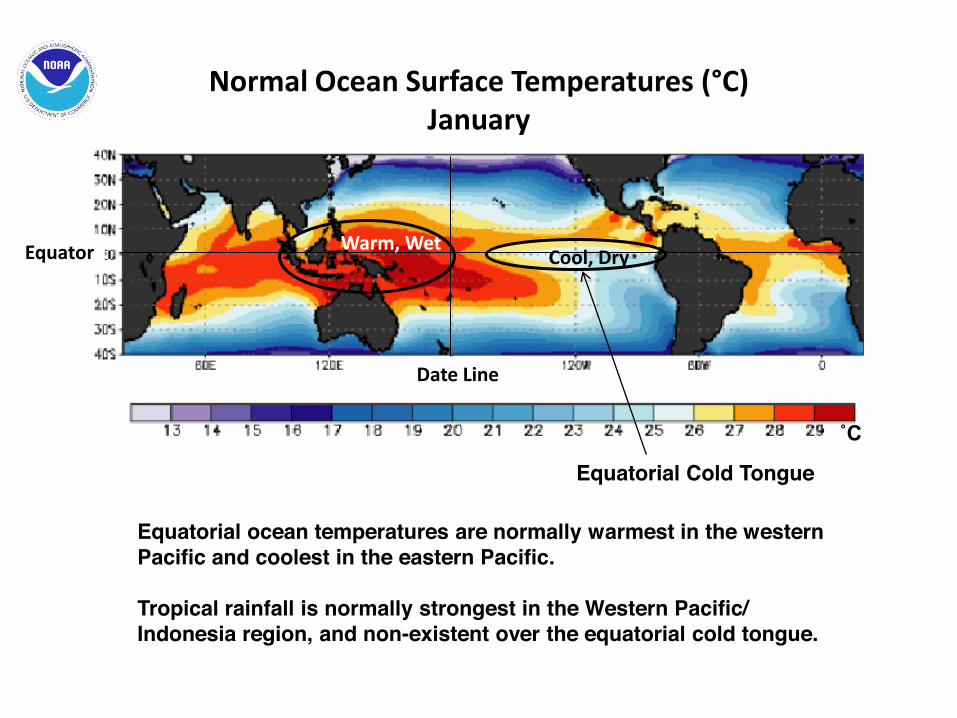
Normal Ocean Surface Temperatures (°C) January
Equator
Date Line
Equatorial ocean temperatures are normally warmest in the western Pacific and coolest in the eastern Pacific. Tropical rainfall is normally strongest in the Western Pacific/ Indonesia region, and non-existent over the equatorial cold tongue.
Warm, Wet Cool, Dry
˚C
Equatorial Cold Tongue
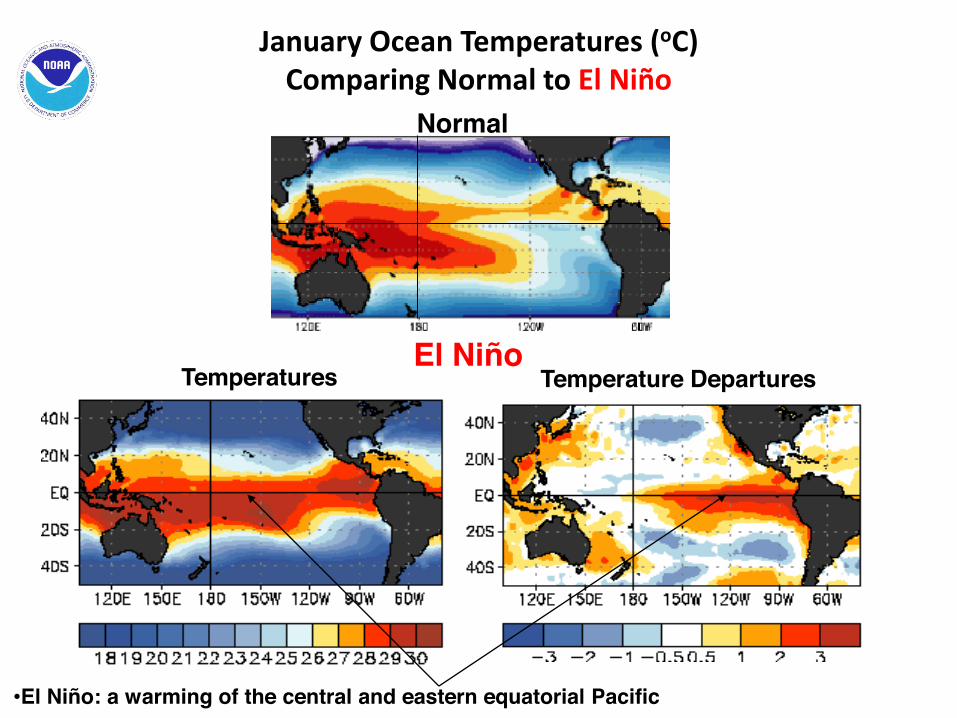
January Ocean Temperatures (oC) Comparing Normal to El Niño
Temperature Departures Temperatures El Niño
Normal
•El Niño: a warming of the central and eastern equatorial Pacific
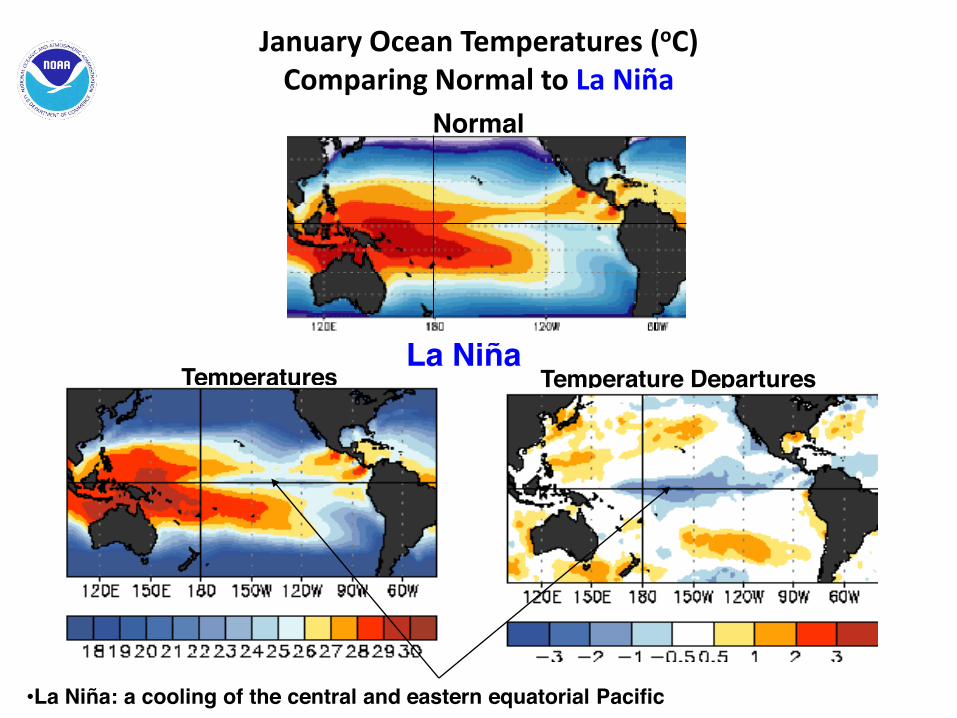
January Ocean Temperatures (oC) Comparing Normal to La Niña
Temperature Departures Temperatures La Niña
Normal
•La Niña: a cooling of the central and eastern equatorial Pacific
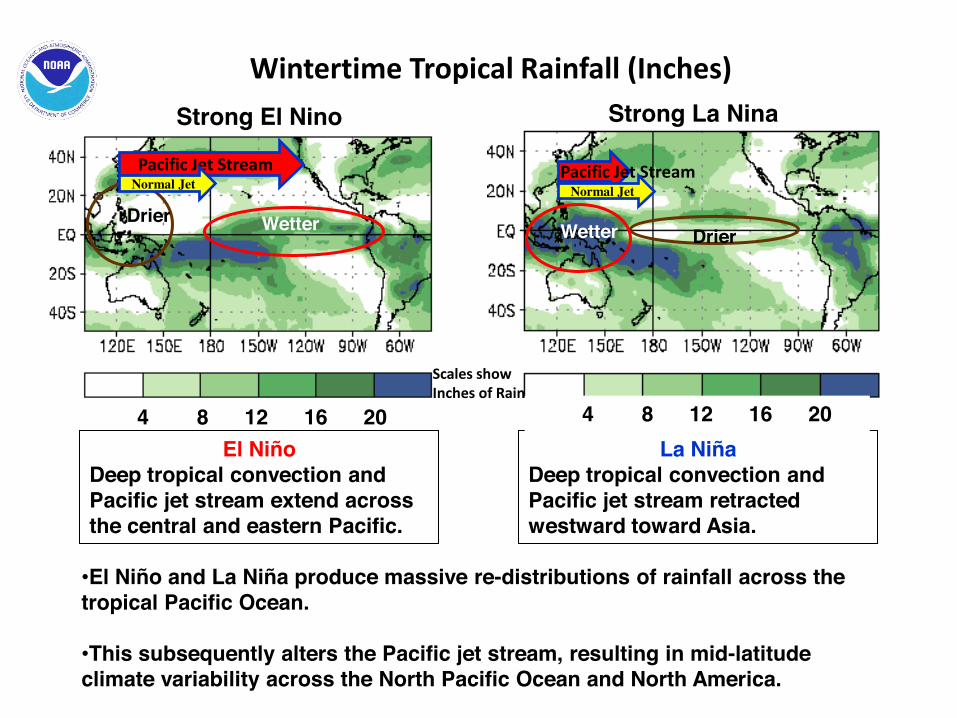
Wintertime Tropical Rainfall (Inches)
Wetter Drier
Strong El Nino
•El Niño and La Niña produce massive re-distributions of rainfall across the tropical Pacific Ocean.
•This subsequently alters the Pacific jet stream, resulting in mid-latitude climate variability across the North Pacific Ocean and North America.
4 8 12 16 20
Wetter Drier
Strong La Nina
La Niña Deep tropical convection and Pacific jet stream retracted westward toward Asia.
4 8 12 16 20 El Niño
Deep tropical convection and Pacific jet stream extend across the central and eastern Pacific.
Pacific Jet Stream Pacific Jet Stream
Scales show Inches of Rain
Normal Jet Normal Jet
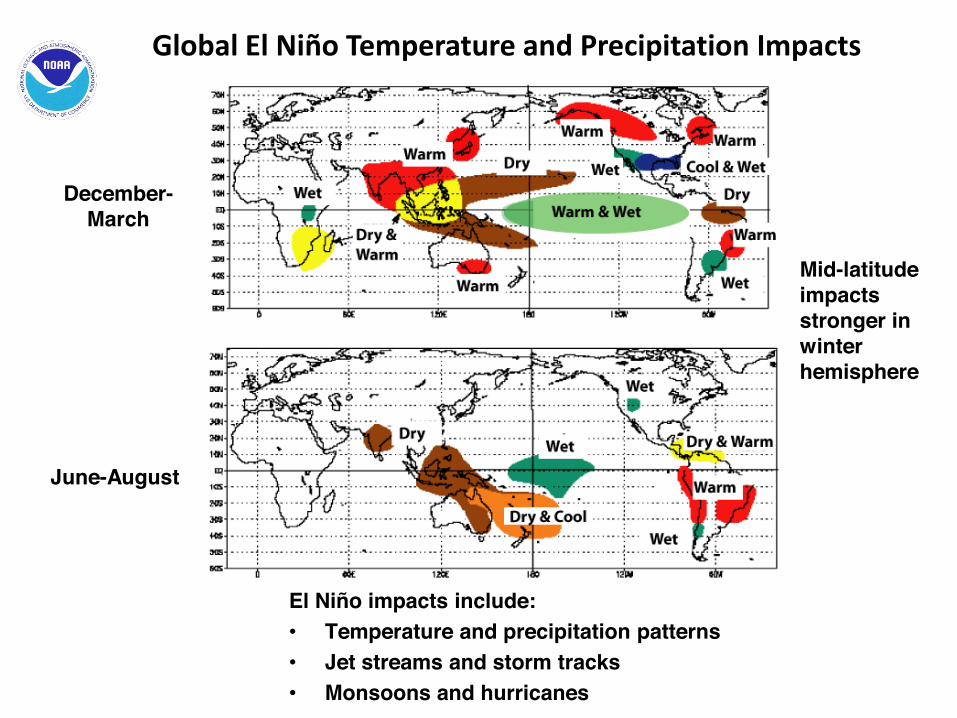
December- March
June-August
Mid-latitude impacts stronger in winter hemisphere
El Niño impacts include: • Temperature and precipitation patterns • Jet streams and storm tracks • Monsoons and hurricanes
Global El Niño Temperature and Precipitation Impacts
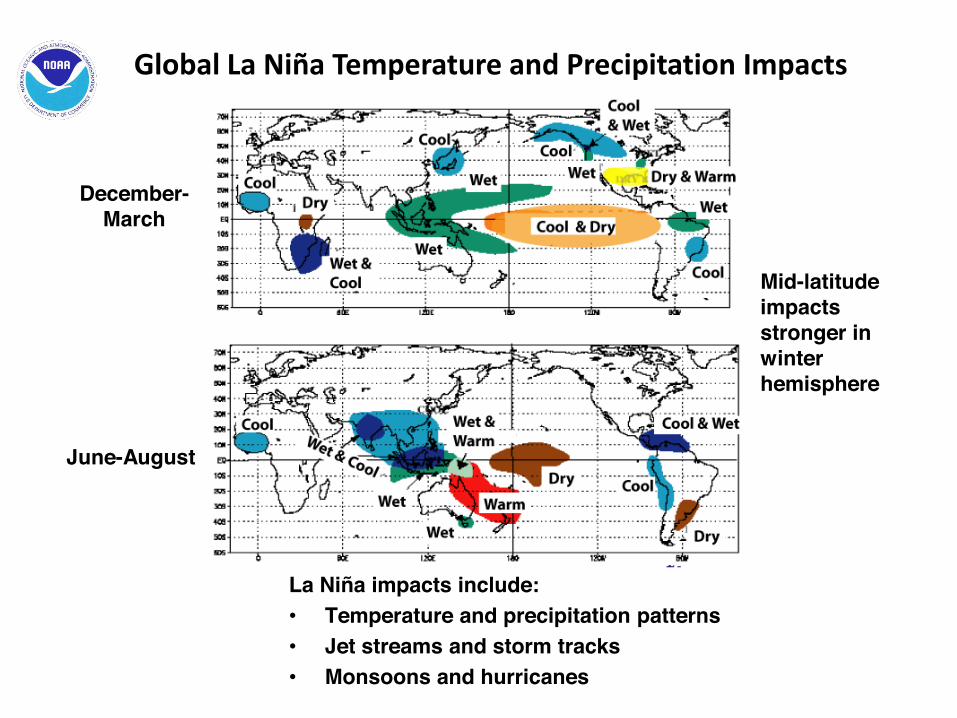
Global La Niña Temperature and Precipitation Impacts
December- March
June-August
Mid-latitude impacts stronger in winter hemisphere
La Niña impacts include: • Temperature and precipitation patterns • Jet streams and storm tracks • Monsoons and hurricanes
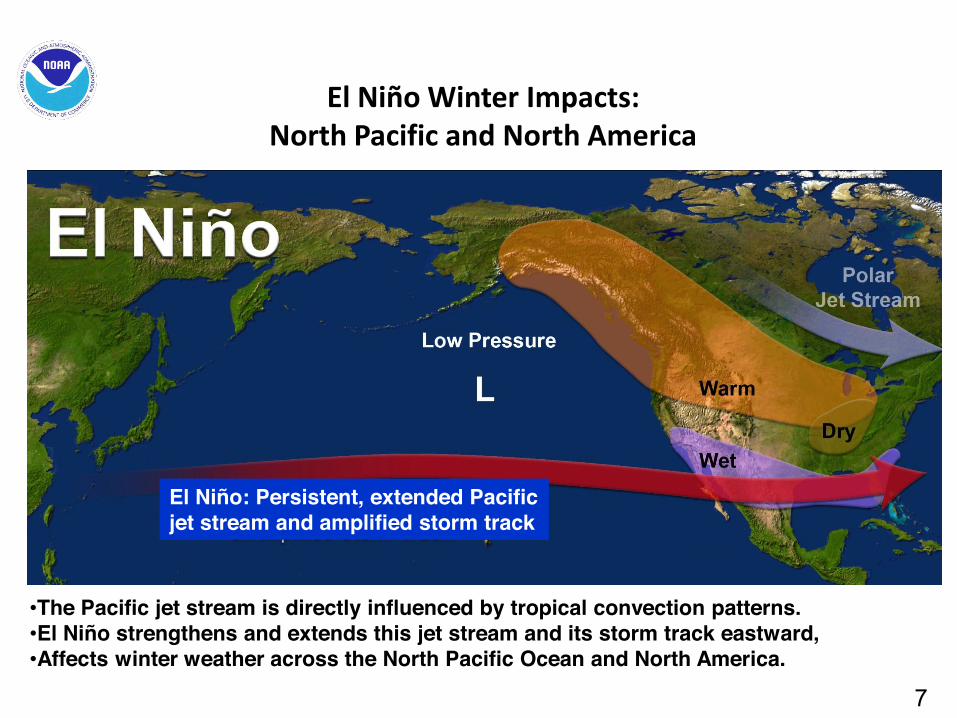
El Niño Winter Impacts: North Pacific and North America
•The Pacific jet stream is directly influenced by tropical convection patterns. •El Niño strengthens and extends this jet stream and its storm track eastward, •Affects winter weather across the North Pacific Ocean and North America.
7
El Niño: Persistent, extended Pacific jet stream and amplified storm track

La Niña Winter Impacts: North Pacific and North America
8
•La Niña weakens the Pacific jet stream and makes it much more variable, often shifting it back toward Asia. •The polar jet steam is also shifted westward. •Affects winter weather across the North Pacific Ocean and North America.
La Niña: Weaker and Variable Pacific Jet Stream
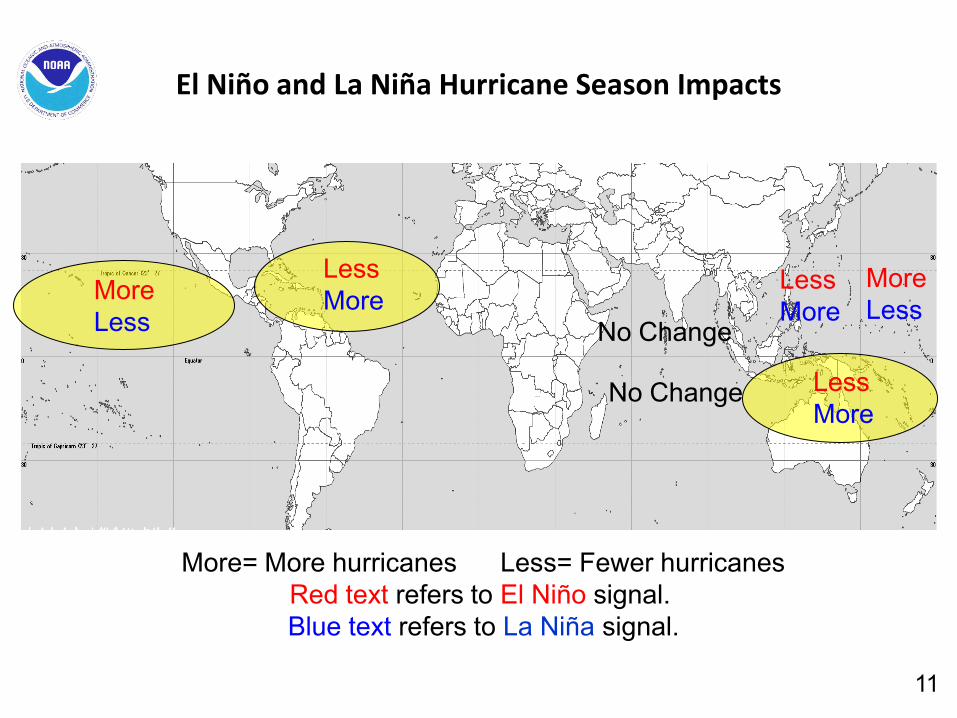
El Niño and La Niña Hurricane Season Impacts
More Less
Less More
No Change
No Change
More Less
Less More
Less More
More= More hurricanes Less= Fewer hurricanes Red text refers to El Niño signal. Blue text refers to La Niña signal.
11
Climate Variability Linked to Recurring Jet Stream Patterns (Teleconnections)
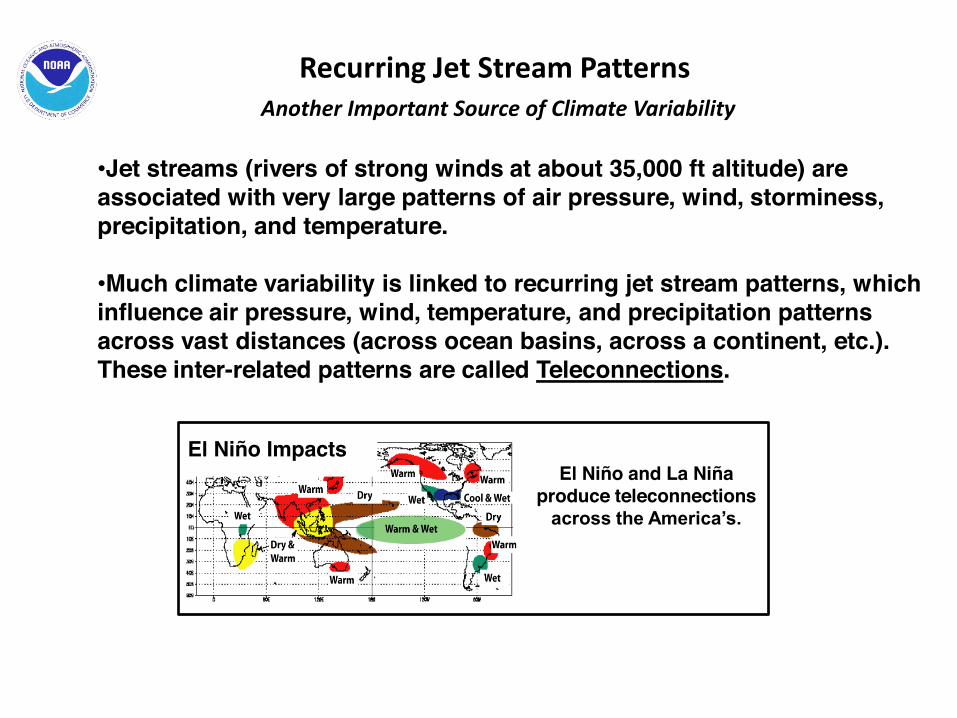
Recurring Jet Stream Patterns Another Important Source of Climate Variability
•Jet streams (rivers of strong winds at about 35,000 ft altitude) are associated with very large patterns of air pressure, wind, storminess, precipitation, and temperature. •Much climate variability is linked to recurring jet stream patterns, which influence air pressure, wind, temperature, and precipitation patterns across vast distances (across ocean basins, across a continent, etc.). These inter-related patterns are called Teleconnections.
El Niño Impacts El Niño and La Niña
produce teleconnections across the America’s.
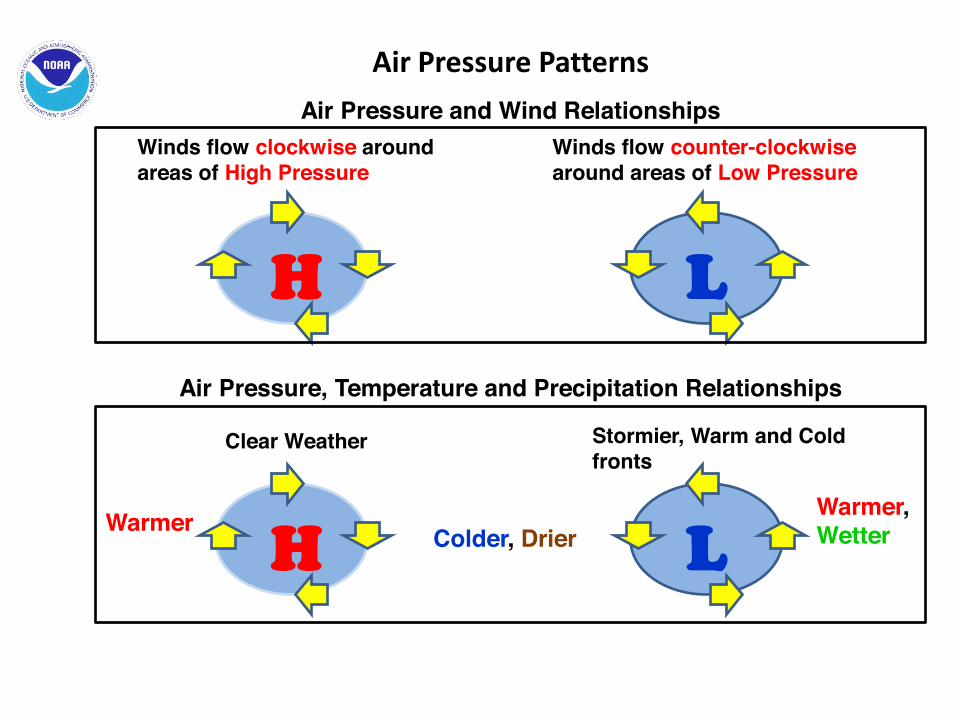
Air Pressure Patterns
H
Winds flow clockwise around areas of High Pressure
L
Winds flow counter-clockwise around areas of Low Pressure
H
Air Pressure, Temperature and Precipitation Relationships
L
Air Pressure and Wind Relationships
Colder, Drier Warmer, Wetter Warmer
Clear Weather Stormier, Warm and Cold fronts
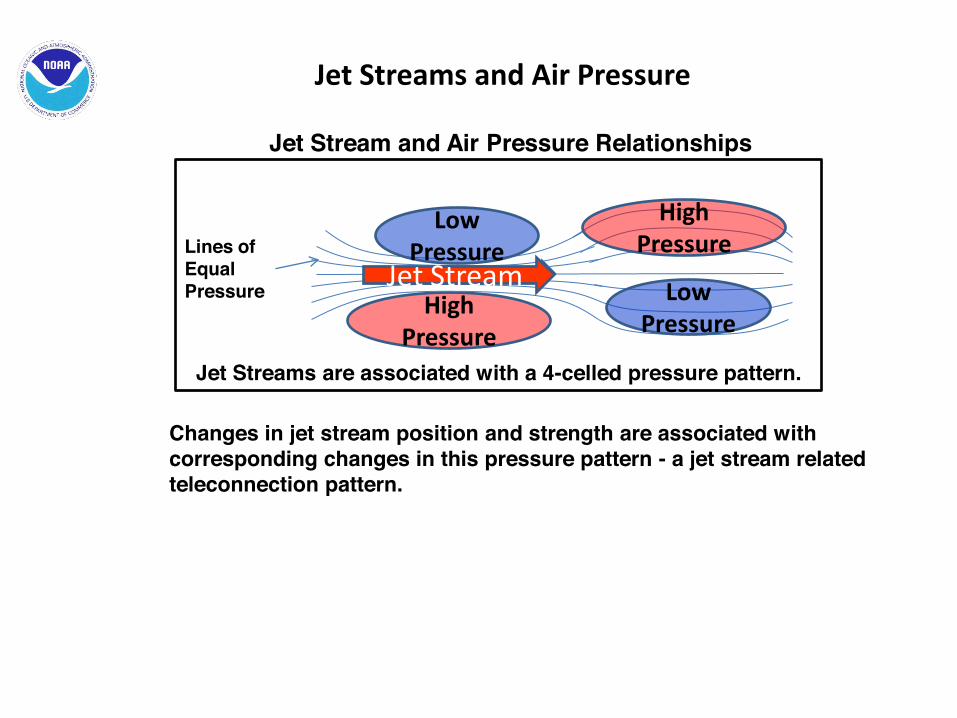
Jet Streams and Air Pressure
Jet Streams are associated with a 4-celled pressure pattern.
High Pressure
Jet Core
Low Pressure
Jet Stream
High Pressure
Low Pressure
Lines of Equal Pressure
Jet Stream and Air Pressure Relationships
Changes in jet stream position and strength are associated with corresponding changes in this pressure pattern - a jet stream related teleconnection pattern.

Jet Streams, Precipitation and Storms
Jet Core Jet Stream Storms
Form Here
Storms Decay Here
Jet streams influence regions of storm formation/ decay
Jet Stream and Storm Relationships
Jet Streams produce a 4-celled pattern of wet/dry
Jet Core Dry
Wet Dry
Jet Stream Wet
Jet Stream and Precipitation Relationships
Lines of Equal Pressure
Jet stream variability also produces these teleconnection patterns.
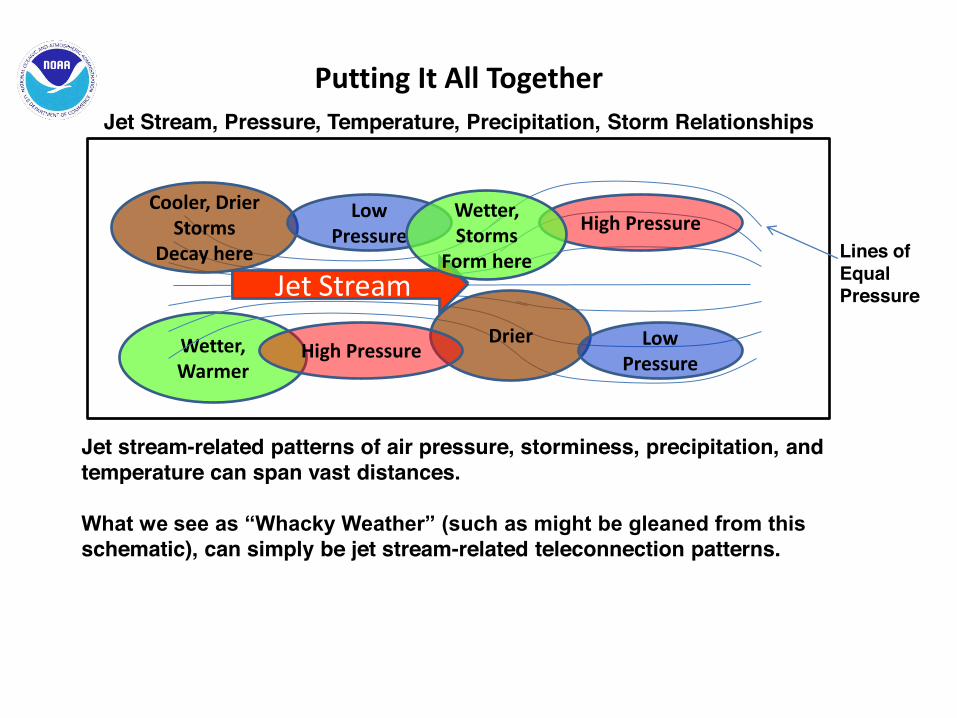
Putting It All Together
Jet stream-related patterns of air pressure, storminess, precipitation, and temperature can span vast distances. What we see as “Whacky Weather” (such as might be gleaned from this schematic), can simply be jet stream-related teleconnection patterns.
Jet Stream, Pressure, Temperature, Precipitation, Storm Relationships
Wetter, Warmer
Jet Core
Cooler, Drier Storms
Decay here
Drier
Jet Stream
High Pressure
Low Pressure
Low Pressure
High Pressure
Lines of Equal Pressure
Wetter, Storms
Form here
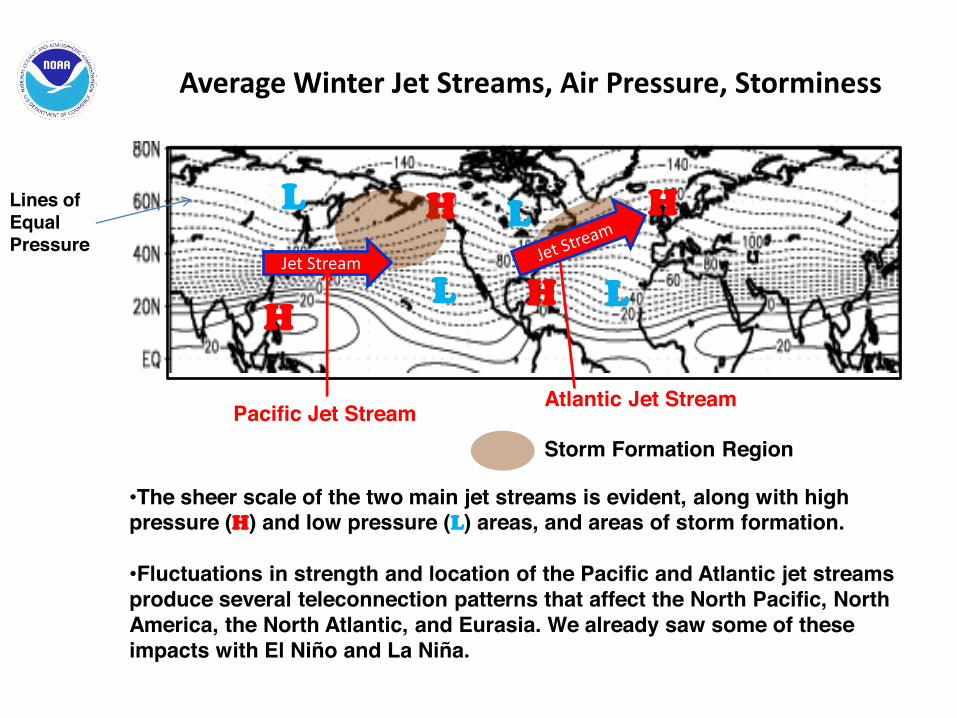
Average Winter Jet Streams, Air Pressure, Storminess
L
L
H
H
L H
L H
Pacific Jet Stream Atlantic Jet Stream
Jet Stream
•The sheer scale of the two main jet streams is evident, along with high pressure (H) and low pressure (L) areas, and areas of storm formation.
•Fluctuations in strength and location of the Pacific and Atlantic jet streams produce several teleconnection patterns that affect the North Pacific, North America, the North Atlantic, and Eurasia. We already saw some of these impacts with El Niño and La Niña.
Lines of Equal Pressure
Storm Formation Region
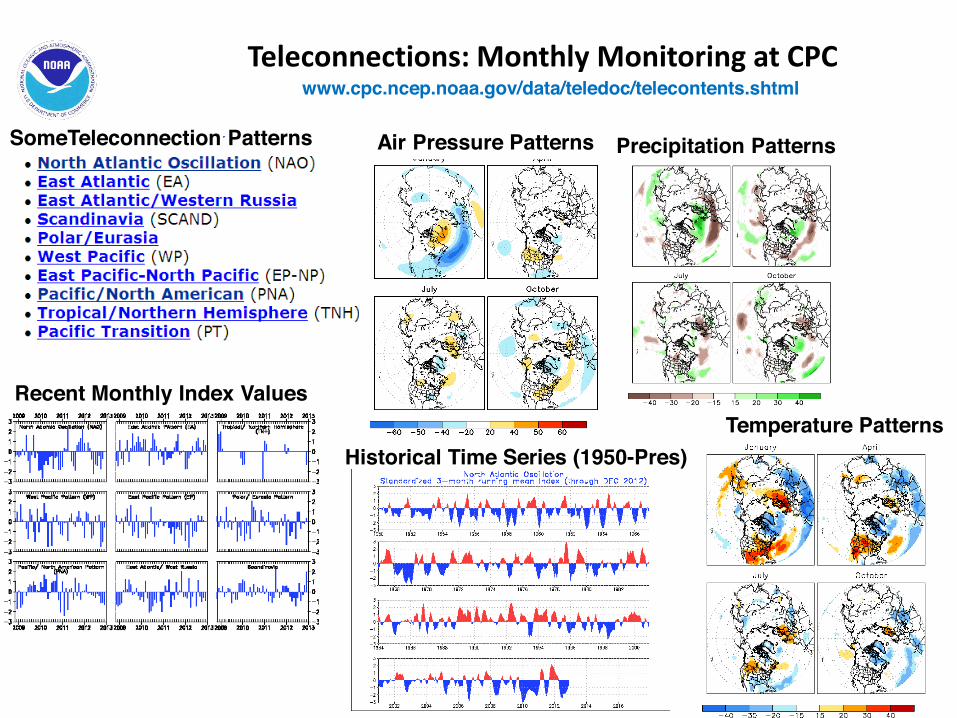
Teleconnections: Monthly Monitoring at CPC www.cpc.ncep.noaa.gov/data/teledoc/telecontents.shtml
Air Pressure Patterns Precipitation Patterns
Temperature Patterns Historical Time Series (1950-Pres)
SomeTeleconnection Patterns
Recent Monthly Index Values
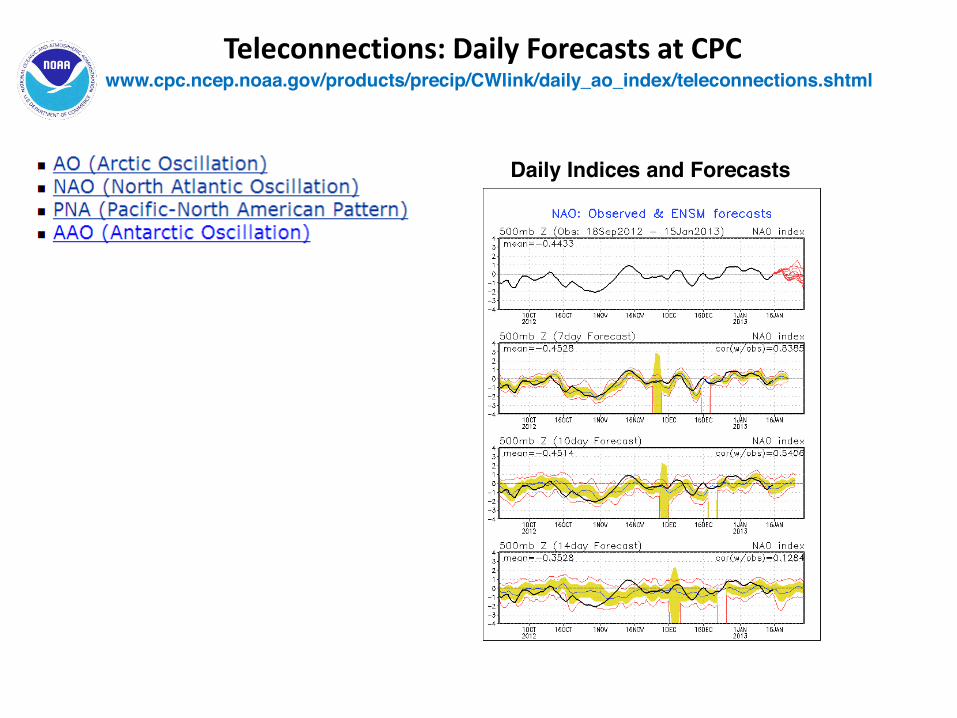
Teleconnections: Daily Forecasts at CPC www.cpc.ncep.noaa.gov/products/precip/CWlink/daily_ao_index/teleconnections.shtml
Daily Indices and Forecasts
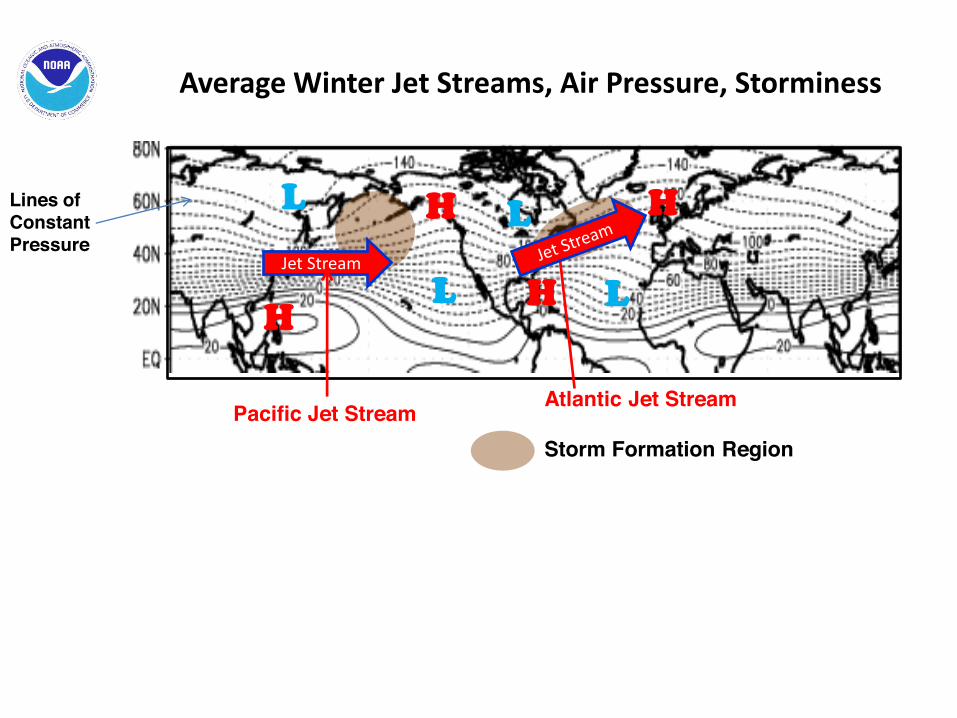
Average Winter Jet Streams, Air Pressure, Storminess
L
L
H
H
L H
L H
Pacific Jet Stream Atlantic Jet Stream
Jet Stream
Lines of Constant Pressure
Storm Formation Region
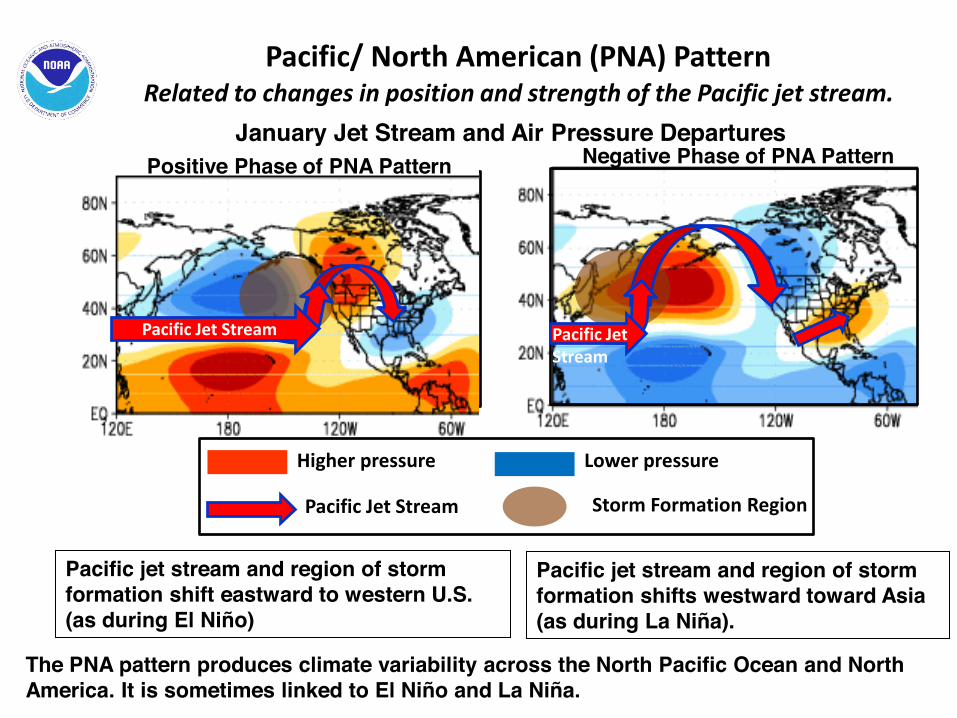
Pacific/ North American (PNA) Pattern
Pacific jet stream and region of storm formation shift eastward to western U.S. (as during El Niño)
Positive Phase of PNA Pattern Negative Phase of PNA Pattern
Pacific jet stream and region of storm formation shifts westward toward Asia (as during La Niña).
January Jet Stream and Air Pressure Departures
Pacific Jet Stream
Higher pressure Lower pressure
Pacific Jet Stream Storm Formation Region
Pacific Jet Stream
Related to changes in position and strength of the Pacific jet stream.
The PNA pattern produces climate variability across the North Pacific Ocean and North America. It is sometimes linked to El Niño and La Niña.
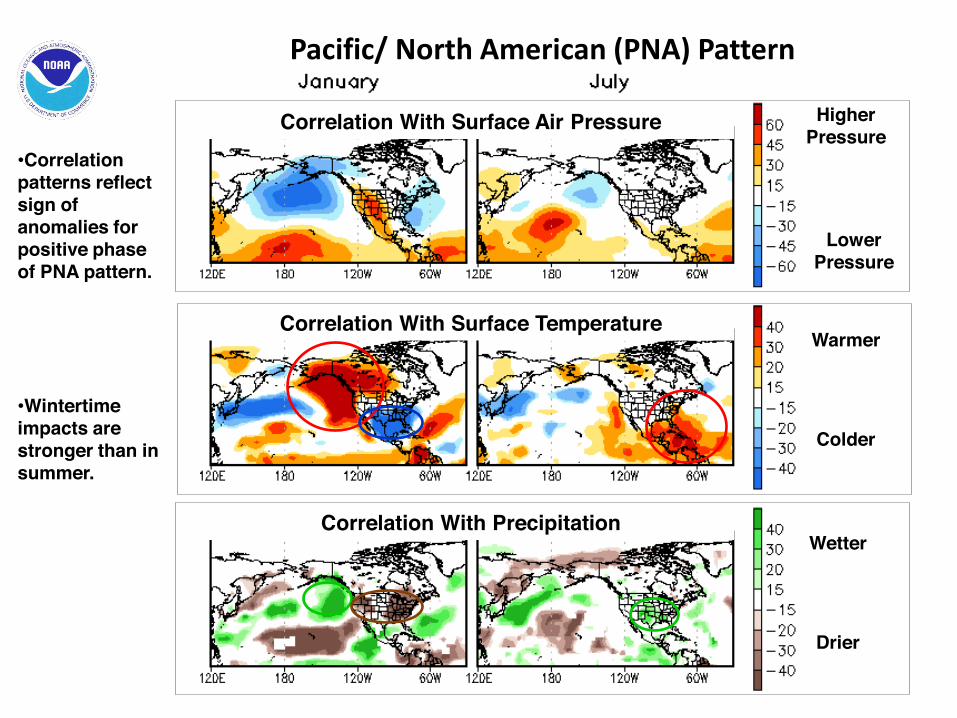
Pacific/ North American (PNA) Pattern Winter vs. Summer
Higher Pressure
Lower Pressure
Warmer
Colder
Wetter
Drier
•Correlation patterns reflect sign of anomalies for positive phase of PNA pattern.
•Wintertime impacts are stronger than in summer.
Correlation With Surface Air Pressure
Correlation With Surface Temperature
Correlation With Precipitation

Pacific/ North American (PNA) Pattern Negative Phase
Higher Pressure
Lower Pressure
Warmer
Colder
Wetter
Drier
Air Pressure Departures
Surface Temperature Departures
Precipitation Departures
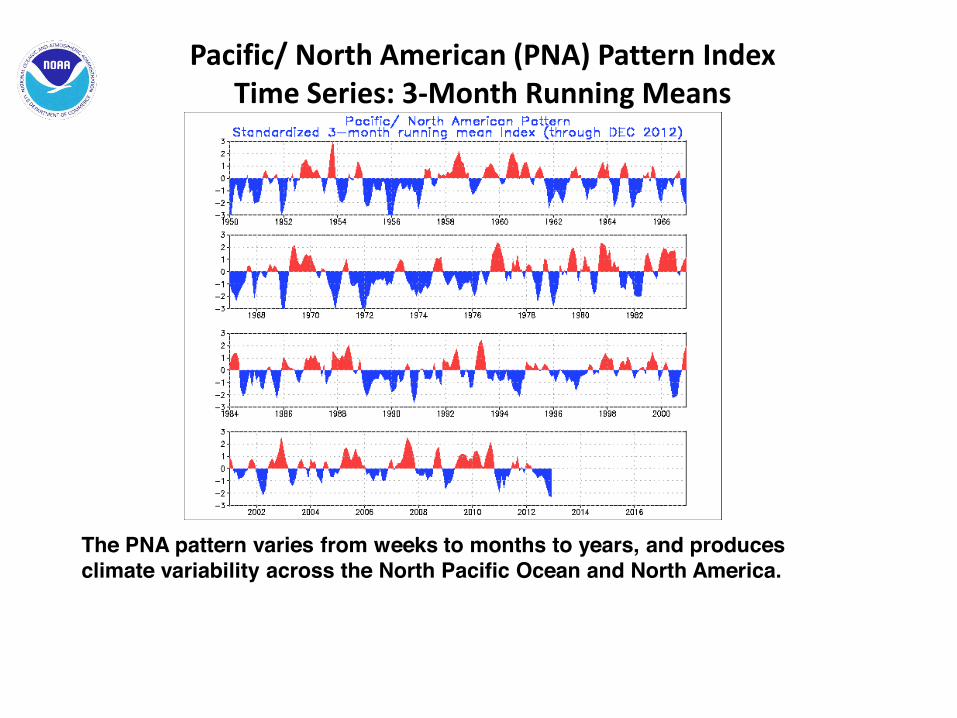
Pacific/ North American (PNA) Pattern Index Time Series: 3-Month Running Means
The PNA pattern varies from weeks to months to years, and produces climate variability across the North Pacific Ocean and North America.

North Atlantic Oscillation (NAO) Related to North-South Fluctuations in North Atlantic Jet Stream
The NAO varies from weeks to years to decades, producing climate variability extending from central North America to Eurasia and Africa.
Smoothed NAO Index Back to 1860
http://www.ldeo.columbia.edu/res/pi/NAO/
Wintertime NAO Index 1950-Present
Warm, Wet
Cold, Dry Warmer, Less snow
Cold, Dry
Warm, Wet
Colder, Snowier
Warm
Cold
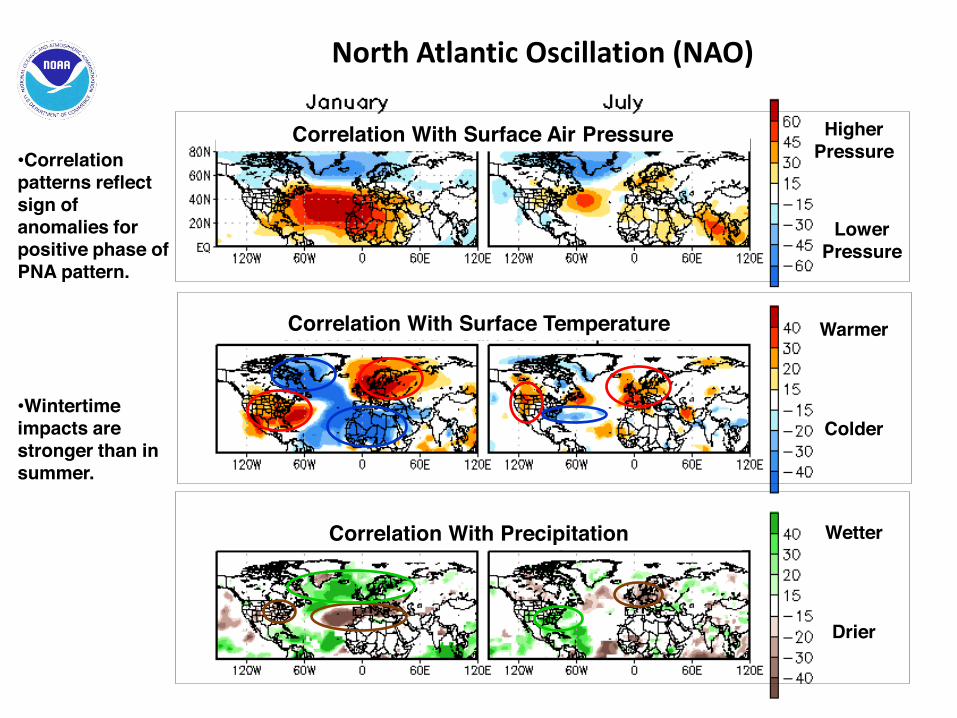
North Atlantic Oscillation (NAO)
Higher Pressure
Lower Pressure
Warmer
Colder
Wetter
Drier
Correlation With Surface Air Pressure
Correlation With Surface Temperature
Correlation With Precipitation
•Correlation patterns reflect sign of anomalies for positive phase of PNA pattern.
•Wintertime impacts are stronger than in summer.
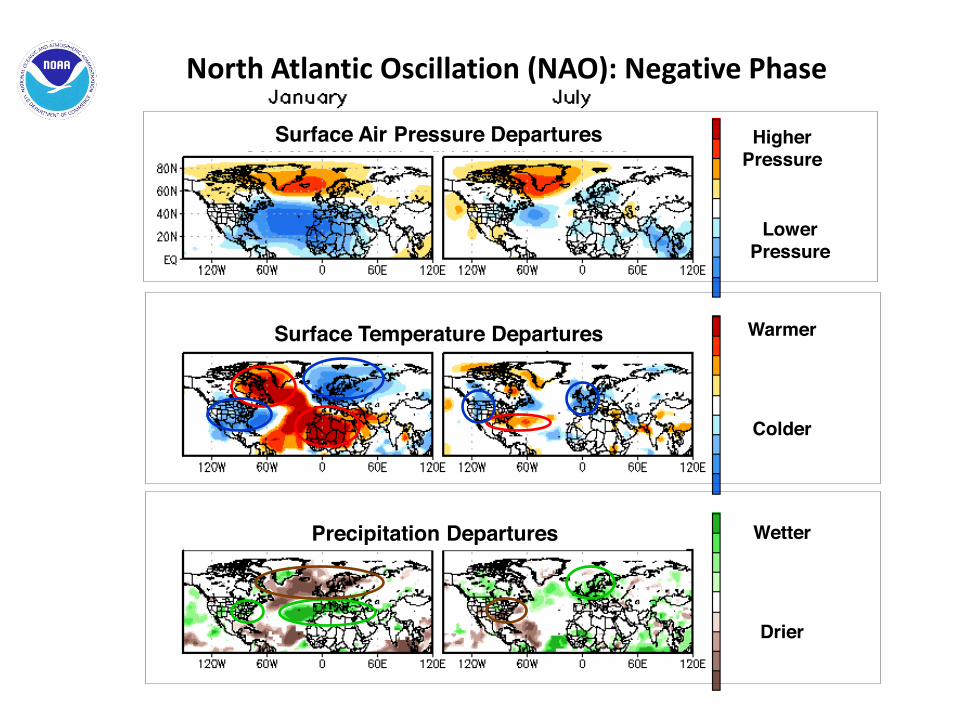
North Atlantic Oscillation (NAO): Negative Phase
Higher Pressure
Lower Pressure
Warmer
Colder
Wetter
Drier
Surface Air Pressure Departures
Surface Temperature Departures
Precipitation Departures
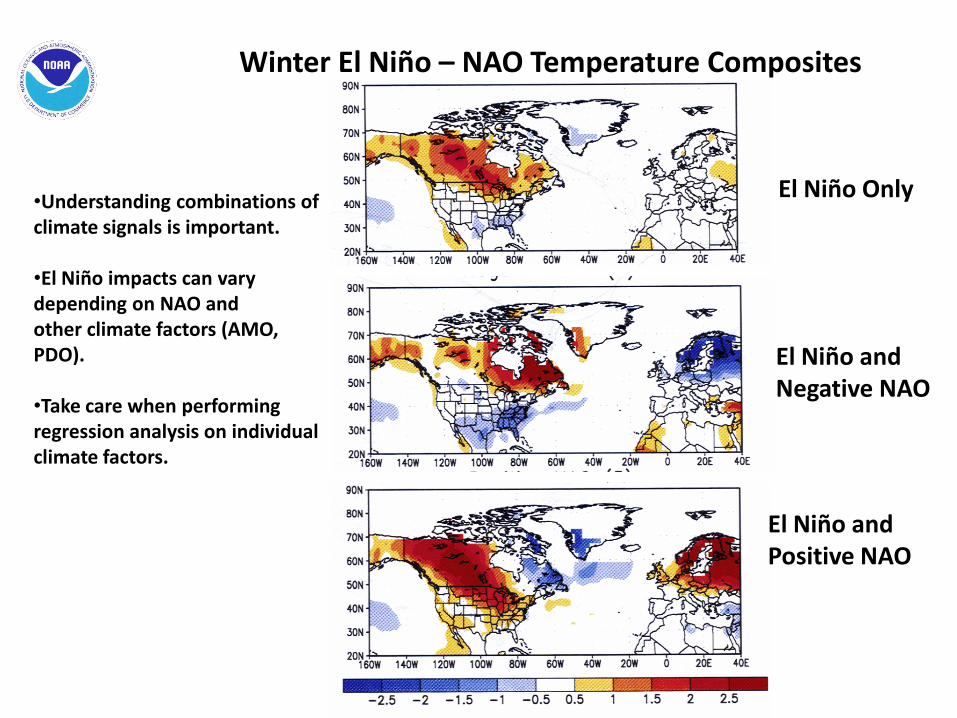
El Niño and Negative NAO
El Niño Only
oC
Winter El Niño – NAO Temperature Composites
El Niño and Positive NAO
•Understanding combinations of climate signals is important.
•El Niño impacts can vary depending on NAO and other climate factors (AMO, PDO).
•Take care when performing regression analysis on individual climate factors.
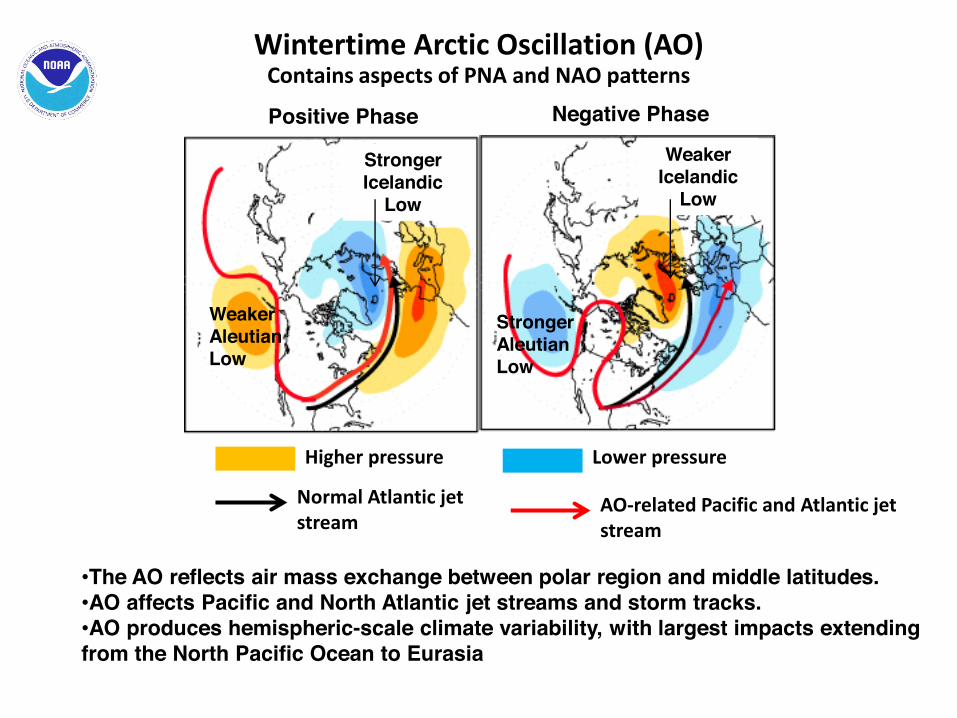
Wintertime Arctic Oscillation (AO)
Higher pressure Lower pressure
•The AO reflects air mass exchange between polar region and middle latitudes. •AO affects Pacific and North Atlantic jet streams and storm tracks. •AO produces hemispheric-scale climate variability, with largest impacts extending from the North Pacific Ocean to Eurasia
Positive Phase Negative Phase
Weaker Aleutian Low
Stronger Aleutian Low
Weaker Icelandic
Low
Stronger Icelandic
Low
Normal Atlantic jet stream
AO-related Pacific and Atlantic jet stream
Contains aspects of PNA and NAO patterns
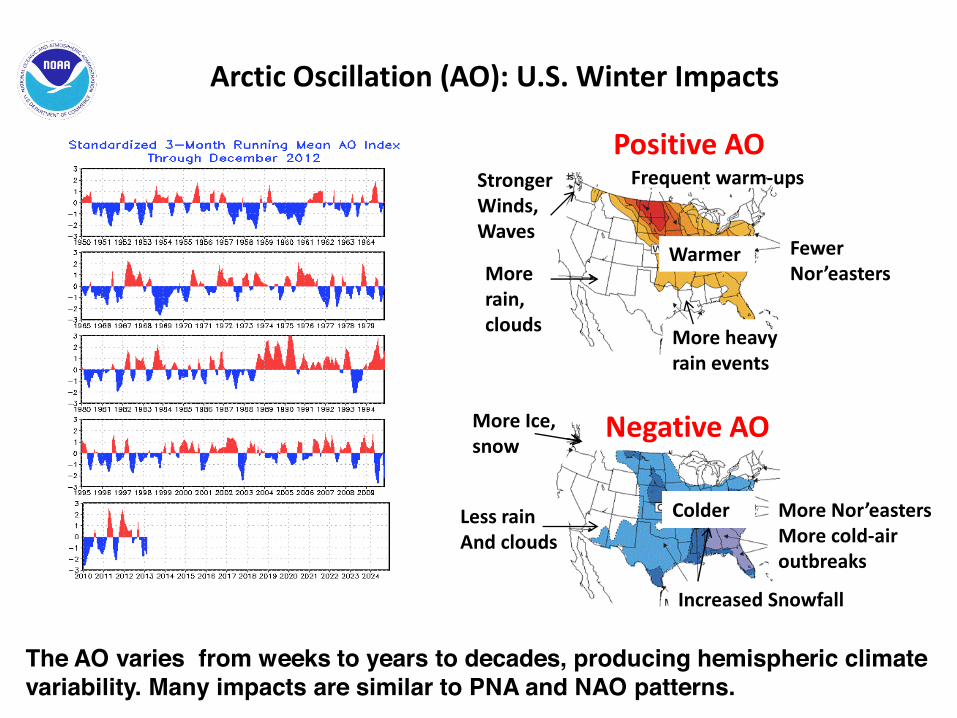
Arctic Oscillation (AO): U.S. Winter Impacts
Positive AO
Negative AO
Warmer
Colder
Fewer Nor’easters
More Nor’easters More cold-air outbreaks
Increased Snowfall
More heavy rain events
Frequent warm-ups
More rain, clouds
Stronger Winds, Waves
More Ice, snow
Less rain And clouds
The AO varies from weeks to years to decades, producing hemispheric climate variability. Many impacts are similar to PNA and NAO patterns.
Climate Variability Linked to Decadal Ocean Patterns
•Atlantic Multi-Decadal Oscillation (AMO) •Pacific Decadal Oscillation (PDO)
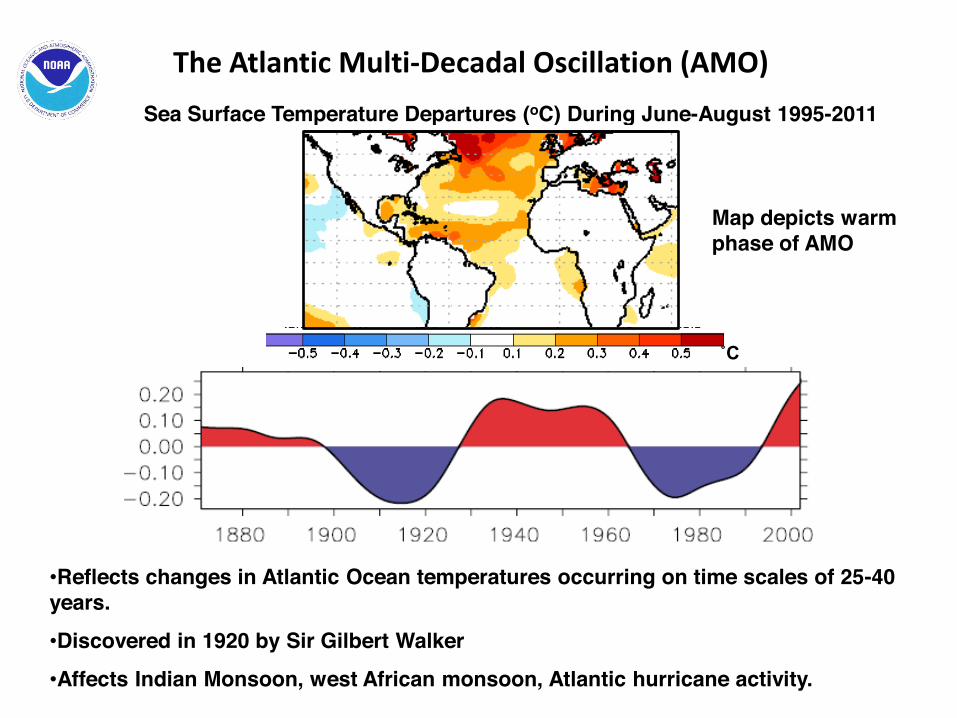
The Atlantic Multi-Decadal Oscillation (AMO)
Sea Surface Temperature Departures (oC) During June-August 1995-2011
•Reflects changes in Atlantic Ocean temperatures occurring on time scales of 25-40 years. •Discovered in 1920 by Sir Gilbert Walker •Affects Indian Monsoon, west African monsoon, Atlantic hurricane activity.
Map depicts warm phase of AMO
˚C
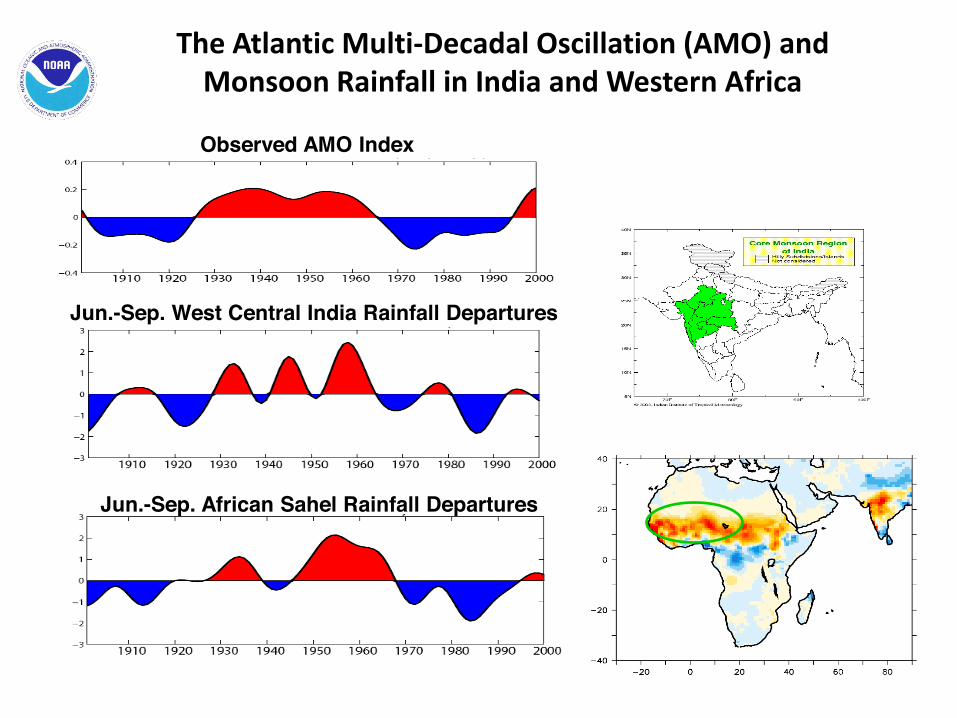
Observed AMO Index
Jun.-Sep. West Central India Rainfall Departures
Jun.-Sep. African Sahel Rainfall Departures
The Atlantic Multi-Decadal Oscillation (AMO) and Monsoon Rainfall in India and Western Africa
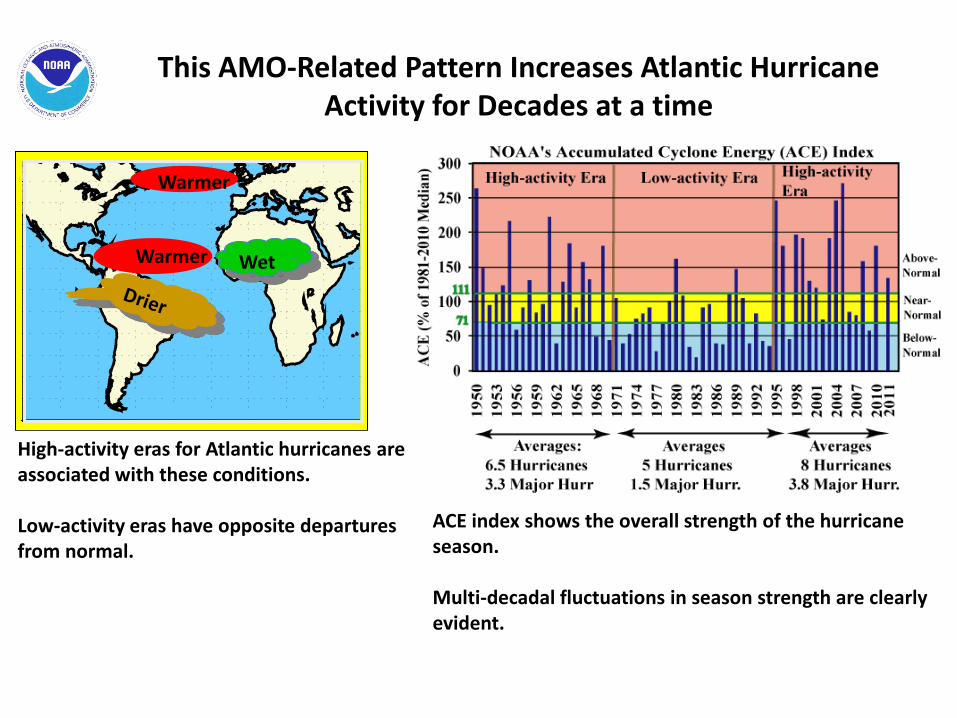
This AMO-Related Pattern Increases Atlantic Hurricane Activity for Decades at a time
Warmer Wet
Warmer
High-activity eras for Atlantic hurricanes are associated with these conditions. Low-activity eras have opposite departures from normal.
ACE index shows the overall strength of the hurricane season. Multi-decadal fluctuations in season strength are clearly evident.
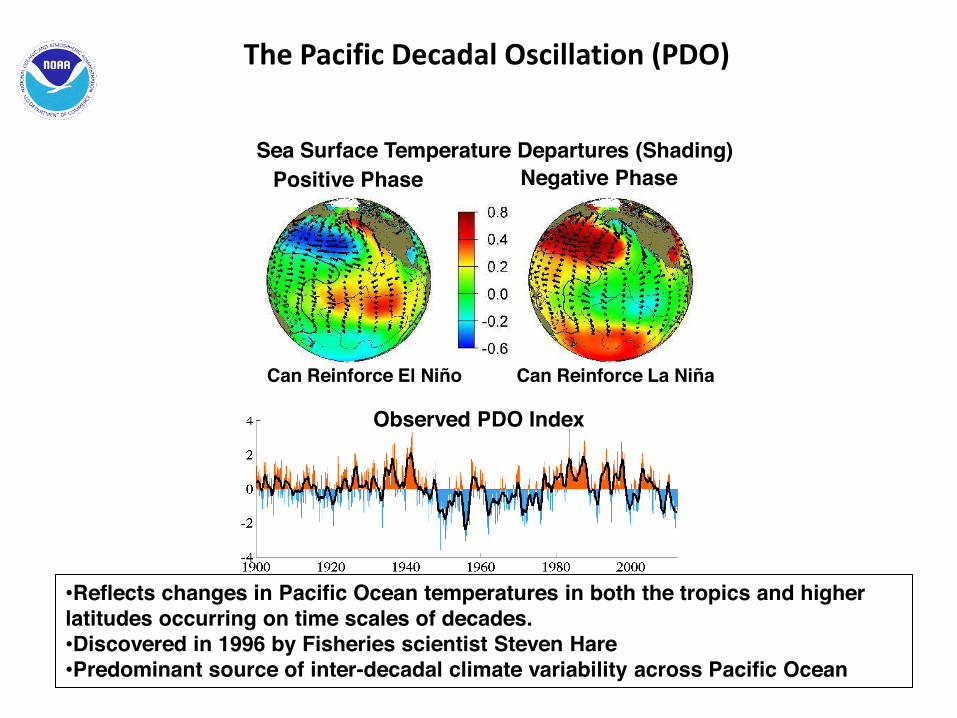
The Pacific Decadal Oscillation (PDO)
Observed PDO Index
Sea Surface Temperature Departures (Shading)
•Reflects changes in Pacific Ocean temperatures in both the tropics and higher latitudes occurring on time scales of decades. •Discovered in 1996 by Fisheries scientist Steven Hare •Predominant source of inter-decadal climate variability across Pacific Ocean
Positive Phase Negative Phase
Can Reinforce El Niño Can Reinforce La Niña
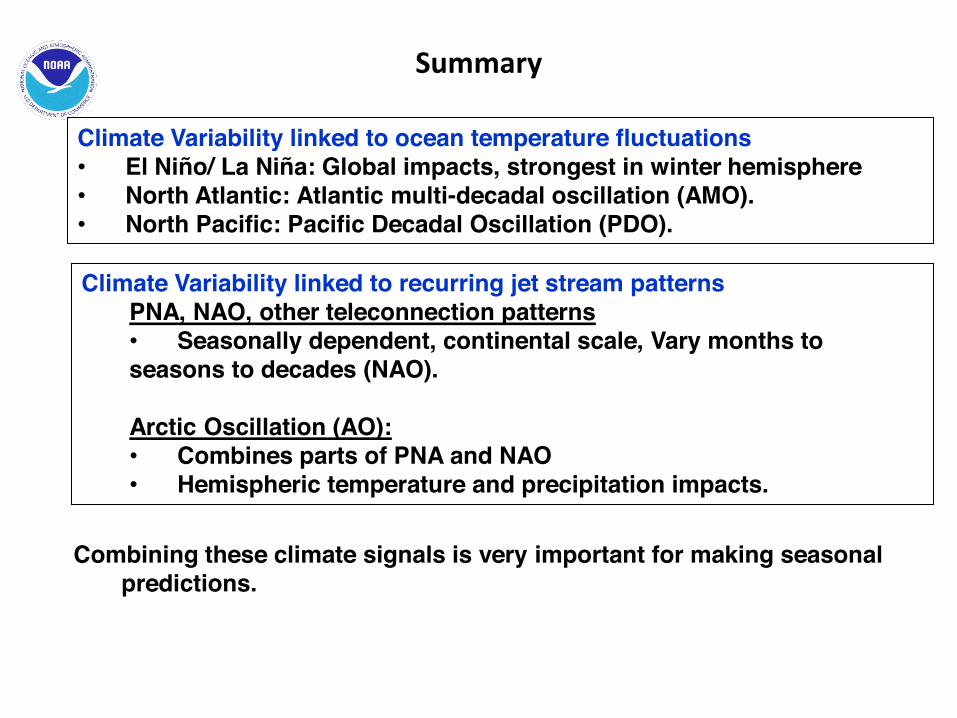
Summary
Climate Variability linked to recurring jet stream patterns PNA, NAO, other teleconnection patterns
• Seasonally dependent, continental scale, Vary months to seasons to decades (NAO).
Arctic Oscillation (AO):
• Combines parts of PNA and NAO • Hemispheric temperature and precipitation impacts.
Climate Variability linked to ocean temperature fluctuations • El Niño/ La Niña: Global impacts, strongest in winter hemisphere • North Atlantic: Atlantic multi-decadal oscillation (AMO). • North Pacific: Pacific Decadal Oscillation (PDO).
Combining these climate signals is very important for making seasonal predictions.

Questions?