Flavor of Computational Geometry Voronoi Diagramsshireen/pdfs/tutorials/Elhabian_vor10.pdfFlavor of...
108
Flavor of Computational Geometry Voronoi Diagrams Shireen Y. Elhabian Aly A. Farag University of Louisville March 2010
Transcript of Flavor of Computational Geometry Voronoi Diagramsshireen/pdfs/tutorials/Elhabian_vor10.pdfFlavor of...

Flavor of Computational Geometry
Voronoi Diagrams
Shireen Y. ElhabianAly A. Farag
University of LouisvilleMarch 2010
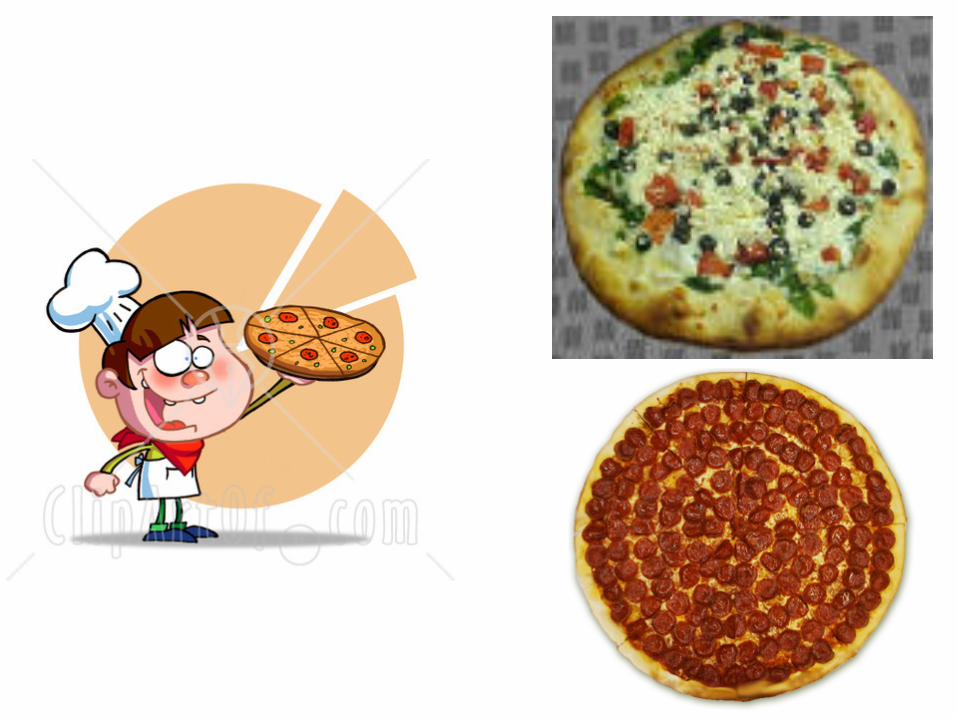

Pepperoni Sparse PizzasOlive Sparse Pizzas
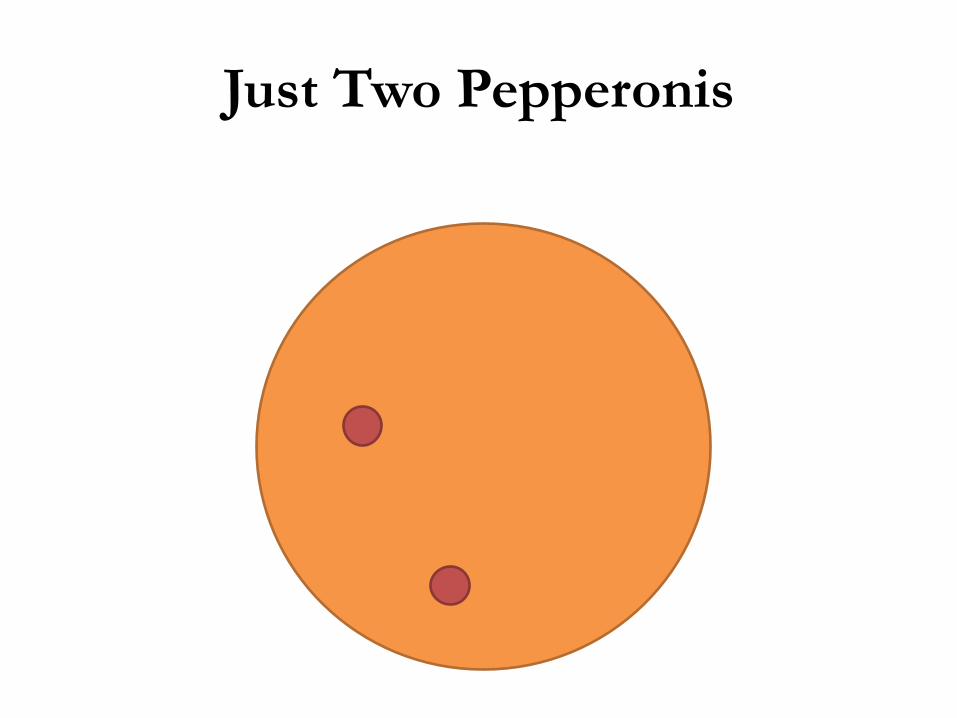
Just Two Pepperonis

A person gets the part of the pizza closest to their pepperoni.
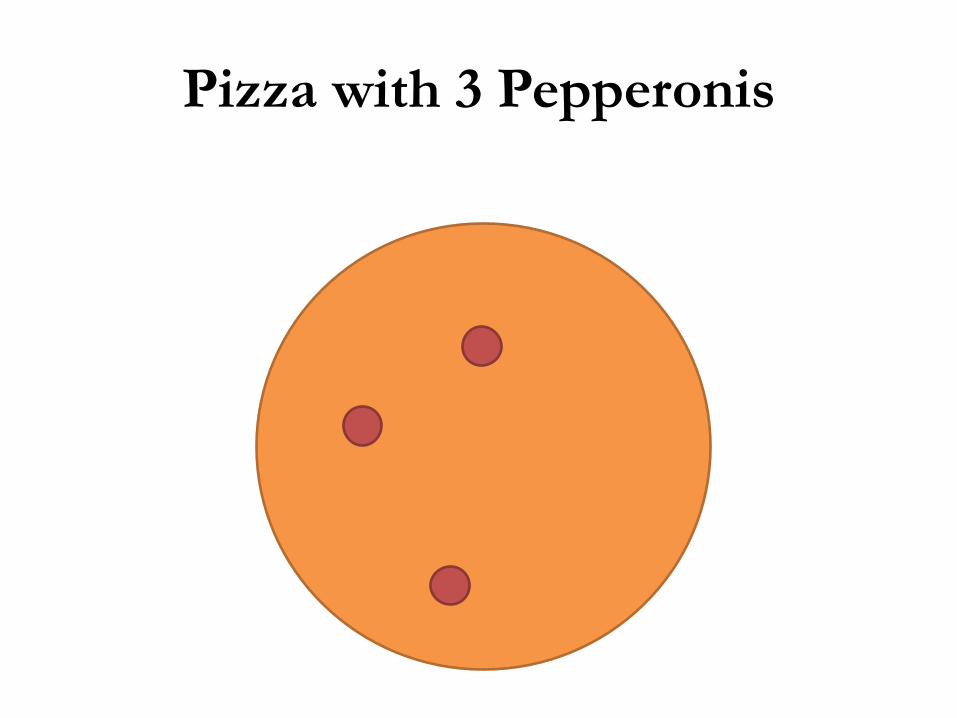
Pizza with 3 Pepperonis

Each person gets the part of the pizza closest to their pepperoni.

Four olives

Each person gets the part of the pizza closest to their olive.

The State Forest has four fire towers. We want to partition the
State Forest into four regions so that the individuals in the fire towers are
searching for fires in the region nearest to their own tower.
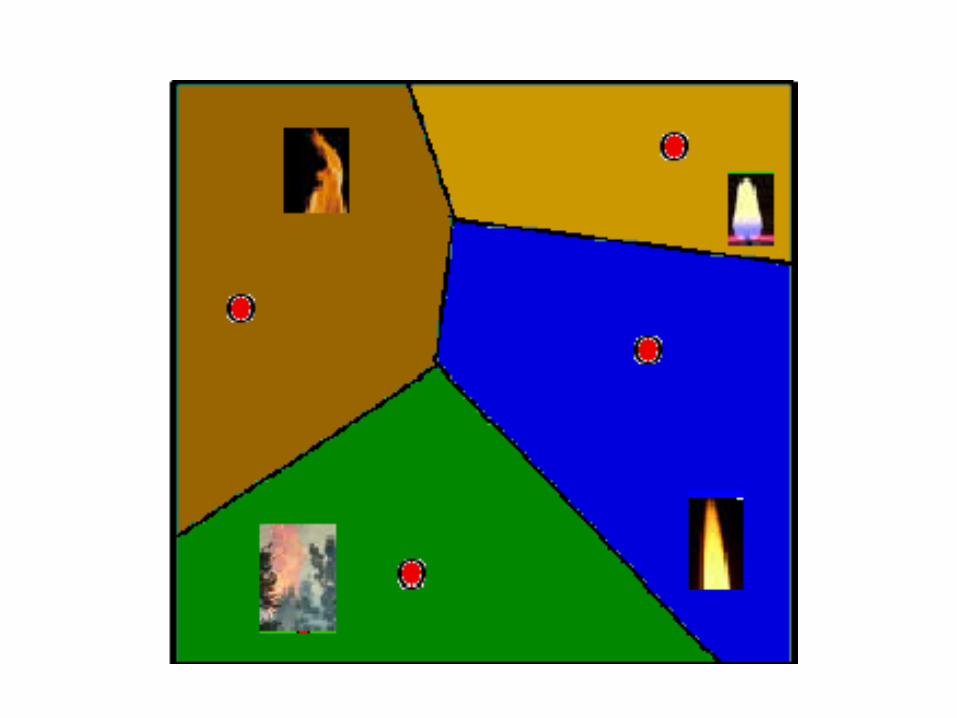

A Voronoi diagramrepresents
the region of influence around each of a given set of sites.

Terminology
• Voronoi site - red dots• Voronoi diagram -
edges of polygonal regions
• Voronoi point - corners of polygonal regions
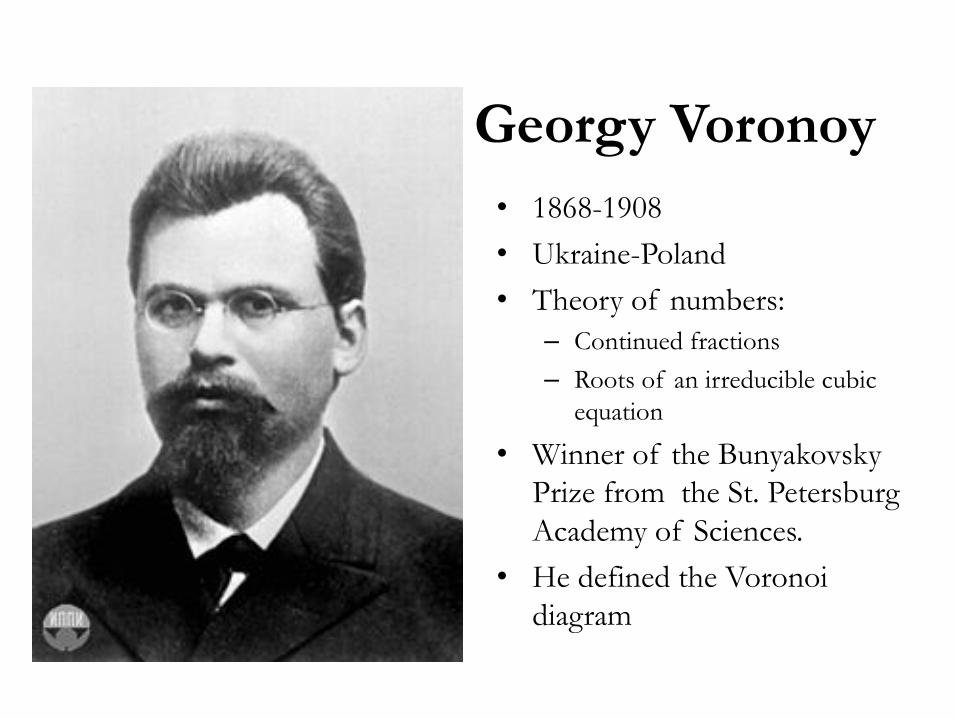
Georgy Voronoy• 1868-1908• Ukraine-Poland• Theory of numbers:
– Continued fractions– Roots of an irreducible cubic
equation
• Winner of the BunyakovskyPrize from the St. Petersburg Academy of Sciences.
• He defined the Voronoi diagram

The Post Office Problem

Problem Statement
• Suppose we want to open a new branch for a supermarket chainat a certain location.
• To predict whether the new branch will be profitable, we mustestimate the number of customers it will attract.
• Thus we need to model the behavior of our potential customers:how do people decide where to do their shopping?
• A similar question arises in social geography, when studying theeconomic activities in a country: what is the trading area ofcertain cities?
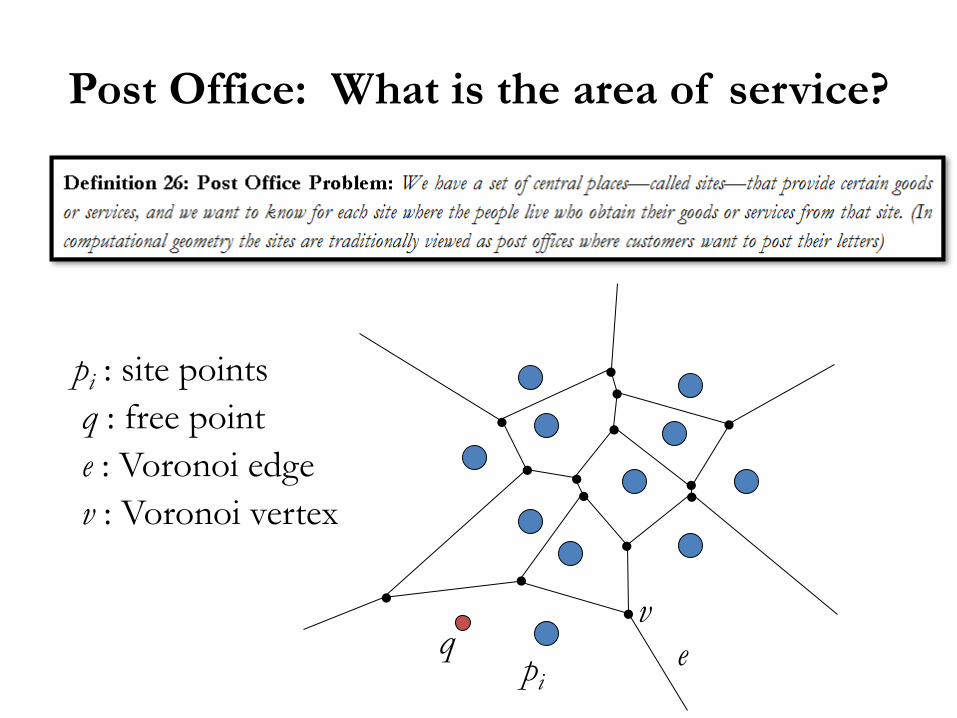
Post Office: What is the area of service?
q
q : free point
e
e : Voronoi edge
v
v : Voronoi vertex
pi
pi : site points

Assumptions
• The price of a particular good or service is the same atevery site;
• The cost of acquiring the good or service is equal tothe price plus the cost of transportation to the site;
• The cost of transportation to a site equals theEuclidean distance to the site times a fixed price perunit distance;
• Consumers try to minimize the cost of acquiring thegood or service.
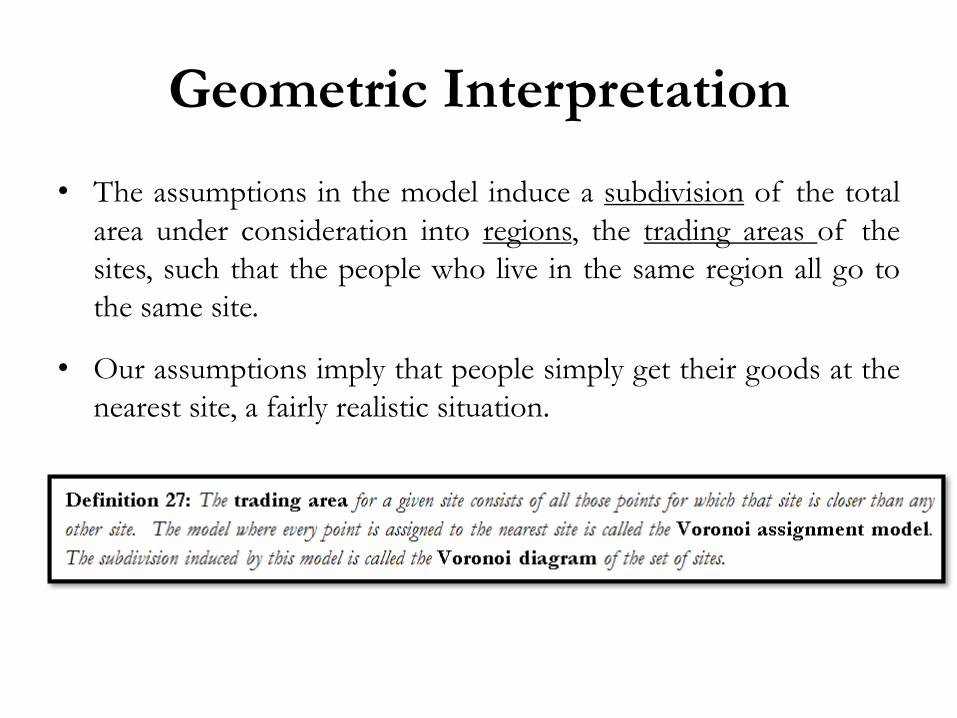
Geometric Interpretation
• The assumptions in the model induce a subdivision of the totalarea under consideration into regions, the trading areas of thesites, such that the people who live in the same region all go tothe same site.
• Our assumptions imply that people simply get their goods at thenearest site, a fairly realistic situation.

Definitions and Basic Properties

Voronoi Diagram

q
q : free point
e
e : Voronoi edge
v
v : Voronoi vertex
pi
pi : site points
pj
Voronoi Cell

Structure of Voronoi Cell
We now take a closer look at the Voronoi diagram. First we study the structure of a single Voronoi cell.
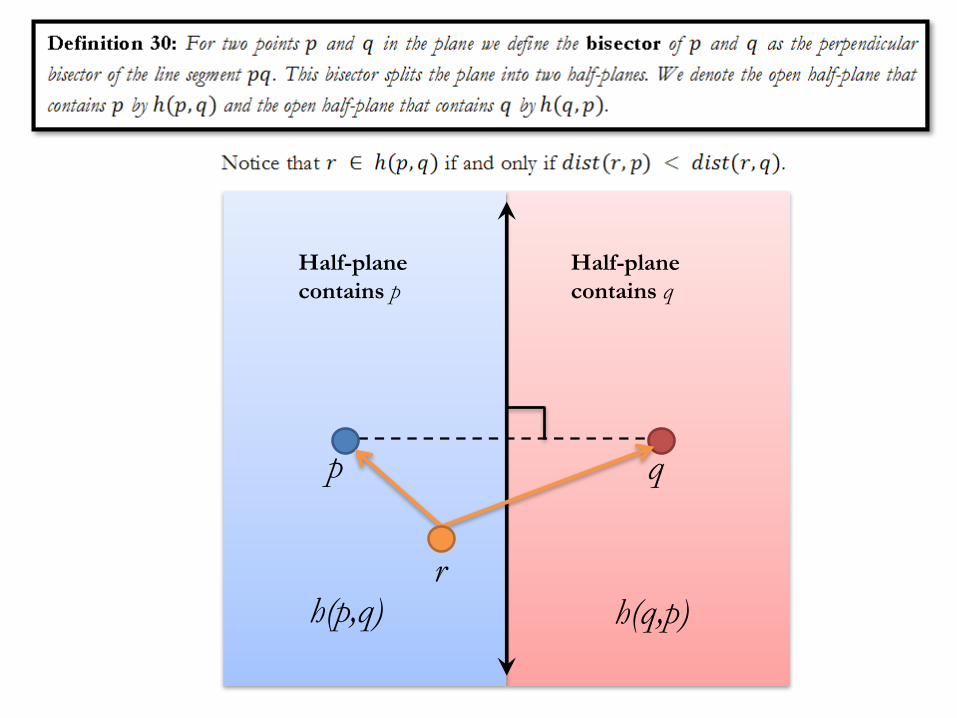
p q
h(p,q) h(q,p)
Half-plane contains q
Half-plane contains p
r


Structure of Voronoi Diagram
What does the complete Voronoi diagram look like?
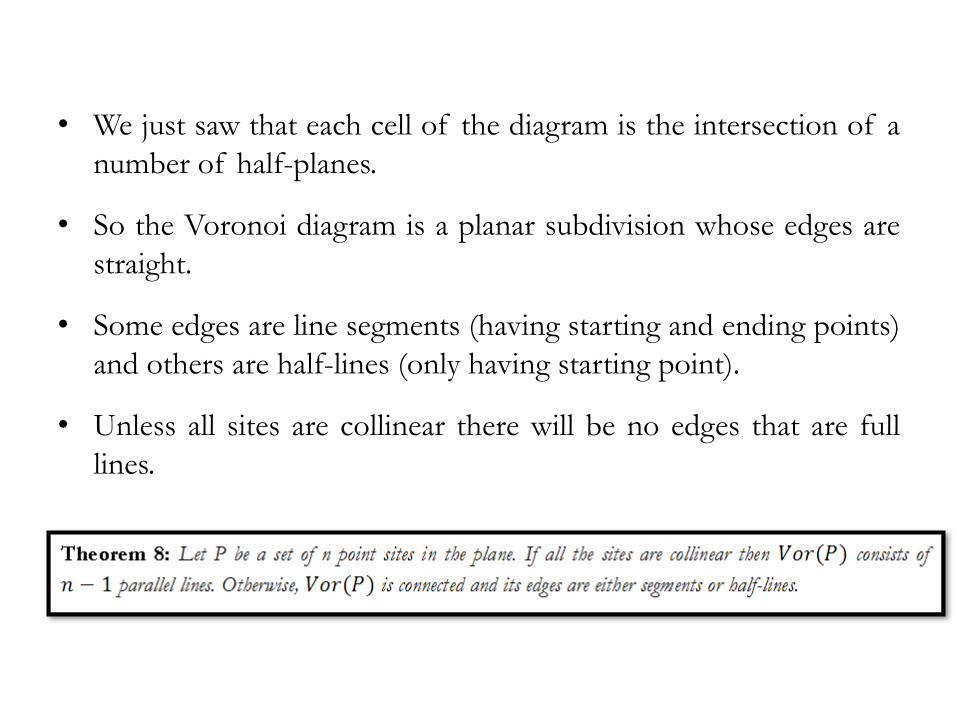
• We just saw that each cell of the diagram is the intersection of anumber of half-planes.
• So the Voronoi diagram is a planar subdivision whose edges arestraight.
• Some edges are line segments (having starting and ending points)and others are half-lines (only having starting point).
• Unless all sites are collinear there will be no edges that are fulllines.

Voronoi Diagram Example: 1 site

Two sites form a perpendicular bisector
Voronoi Diagram is a linethat extends infinitely inboth directions, and thetwo half planes on eitherside.

Collinear sites form a series of parallel lines

Non-collinear sites form Voronoi half lines that meet at a vertex
A Voronoi vertex is the center of an emptycircle touching 3 or more sites.
v
Half lines
A vertex hasdegree ³ 3

Voronoi Edges and Vertices
What does the complete Voronoi diagram look like?
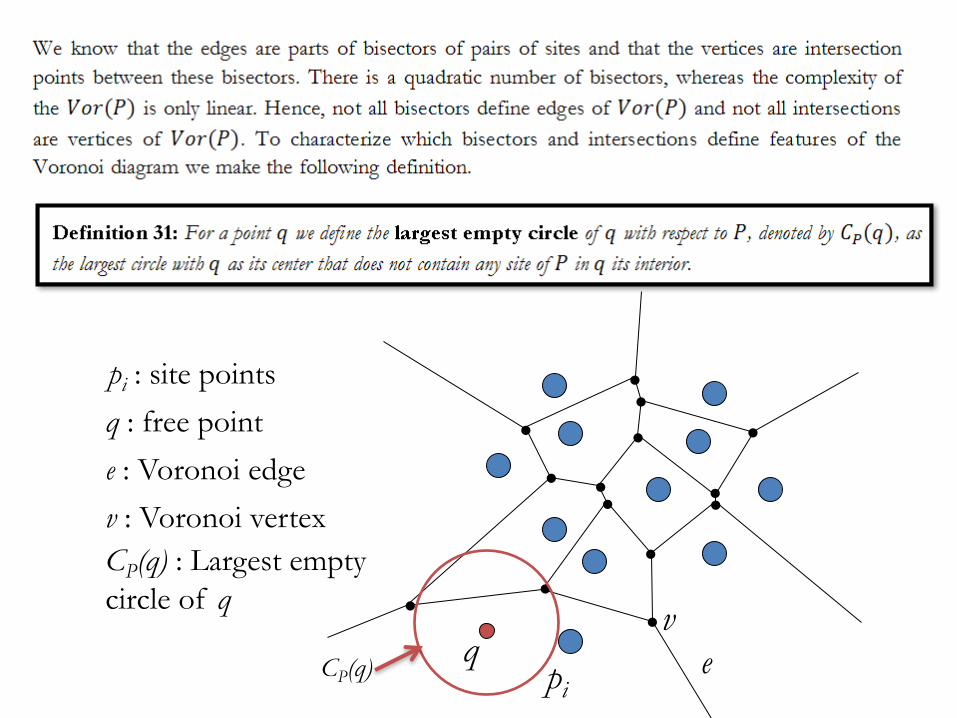
q
q : free point
e
e : Voronoi edge
v
v : Voronoi vertex
pi
pi : site points
CP(q) : Largest empty circle of q
CP(q)
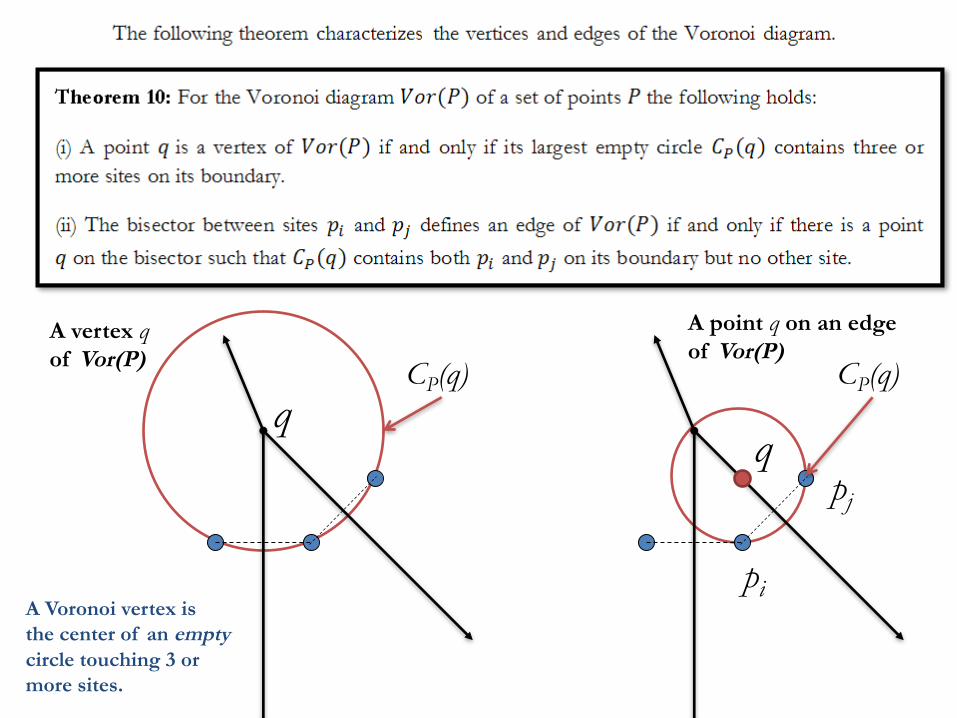
A Voronoi vertex is the center of an emptycircle touching 3 or more sites.
A vertex qof Vor(P)
qCP(q)
q
CP(q)
pi
pj
A point q on an edge of Vor(P)

Voronoi Cells and Segments
v

v
Unbounded CellBounded Cell
Segment
Voronoi Cells and Segments

Who wants to be a Millionaire?
vWhich of the following is true for2-D Voronoi diagrams?
Four or more non-collinear sites are…1. sufficient to create a bounded cell2. necessary to create a bounded cell3. 1 and 24. none of above

Degenerate Case: no bounded cells L
v

Summary of
Voronoi Properties
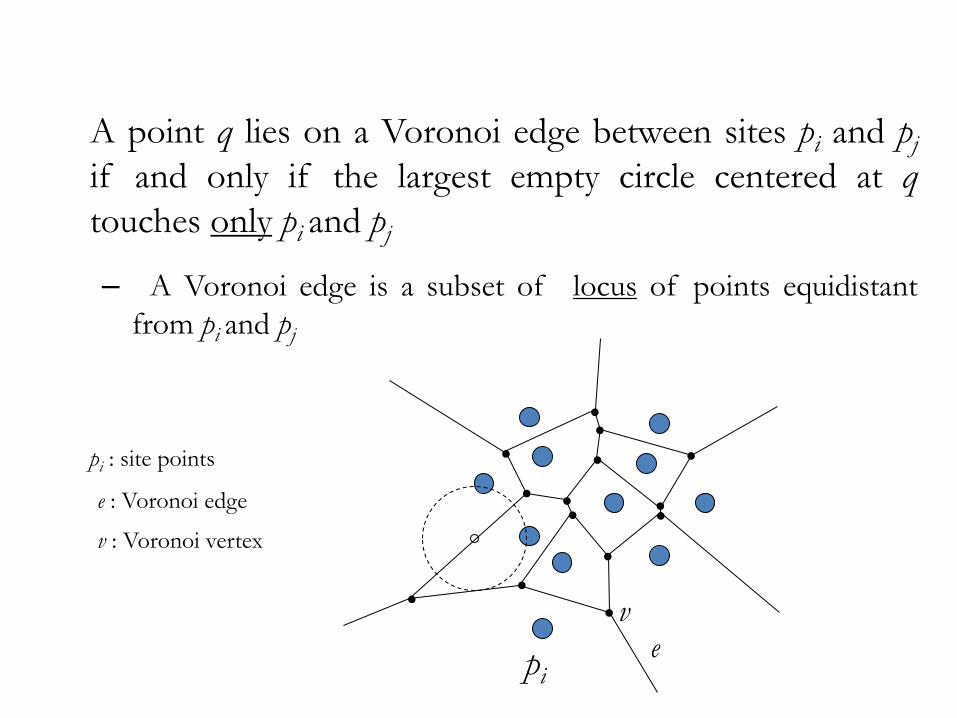
A point q lies on a Voronoi edge between sites pi and pjif and only if the largest empty circle centered at qtouches only pi and pj
– A Voronoi edge is a subset of locus of points equidistantfrom pi and pj
e
e : Voronoi edge
v
v : Voronoi vertex
pi
pi : site points

A point q is a vertex if and only if the largest emptycircle centered at q touches at least 3 sites
– A Voronoi vertex is an intersection of 3 more segments,each equidistant from a pair of sites
e
e : Voronoi edge
v
v : Voronoi vertex
pi
pi : site points

Complexity of Voronoi Diagrams

Voronoi diagrams have linear complexity {|v|, |e| = O(n)}
Intuition: Not all bisectors are Voronoi edges!
e
e : Voronoi edge
pi
pi : site points
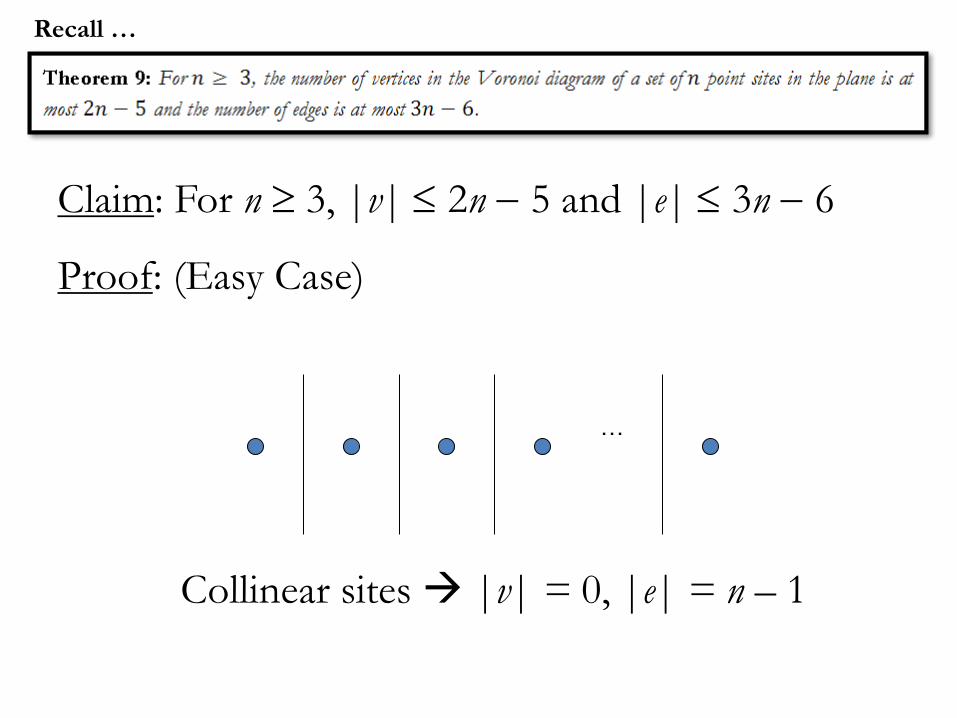
Claim: For n ³ 3, |v| £ 2n - 5 and |e| £ 3n - 6
Proof: (Easy Case)
…
Collinear sites à |v| = 0, |e| = n – 1
Recall …

Claim: For n ³ 3, |v| £ 2n - 5 and |e| £ 3n - 6
Proof: (General Case)
• Euler’s Formula: for connected, planar graphs,|v| – |e| + f = 2
Where:
|v| is the number of vertices
|e| is the number of edges
f is the number of faces
Recall …

Claim: For n ³ 3, |v| £ 2n - 5 and |e| £ 3n - 6
Proof: (General Case)
• For Voronoi graphs, f = n à (|v| +1) – |e| + n =2
epi
v¥
To apply Euler’s Formula, we“planarize” the Voronoi diagramby connecting half lines to an extravertex.

Moreover,
and
so
together with
we get, for n ³ 3
||2)deg()(
evPVorv
×=åÎ
),(PVorvÎ" 3)deg( ³v
)1|(|3||2 +³× ve
2||)1|(| =+-+ nev
63||52||
-£-£nenv

Constructing Voronoi Diagrams
Intuitions

Given a half plane intersection algorithm…

Given a half plane intersection algorithm…

Given a half plane intersection algorithm…

Given a half plane intersection algorithm…
Repeat for each site
Running Time: O( n2 log n )
Can we do better ?!!!

Constructing Voronoi Diagrams
Fortune’s Algorithm
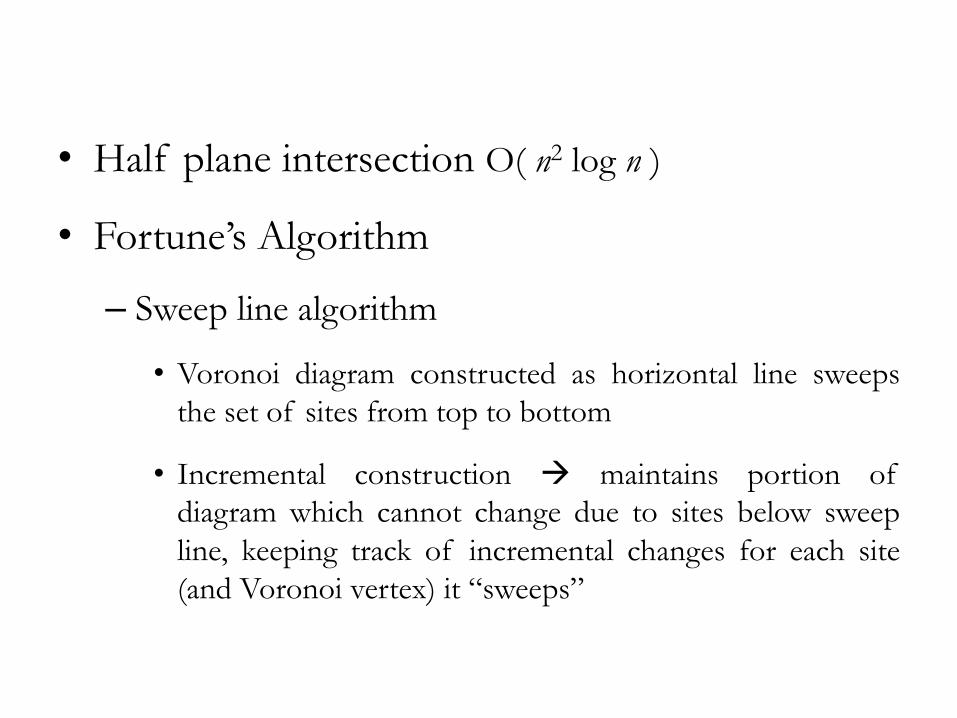
• Half plane intersection O( n2 log n )
• Fortune’s Algorithm
– Sweep line algorithm
• Voronoi diagram constructed as horizontal line sweepsthe set of sites from top to bottom
• Incremental construction à maintains portion ofdiagram which cannot change due to sites below sweepline, keeping track of incremental changes for each site(and Voronoi vertex) it “sweeps”

What is the invariant we are looking for?
Maintain a representation of the locus of points q that are closer to some site pi above the sweep line than to the line itself (and thus to any site below the line).
ev
pi
Sweep Line
q

Which points are closer to a site above the sweep line than to the sweep line itself ?
Sweep Line
pi
q
The set of parabolic arcs form a beach-line that bounds the locus of all such points
Equidistance
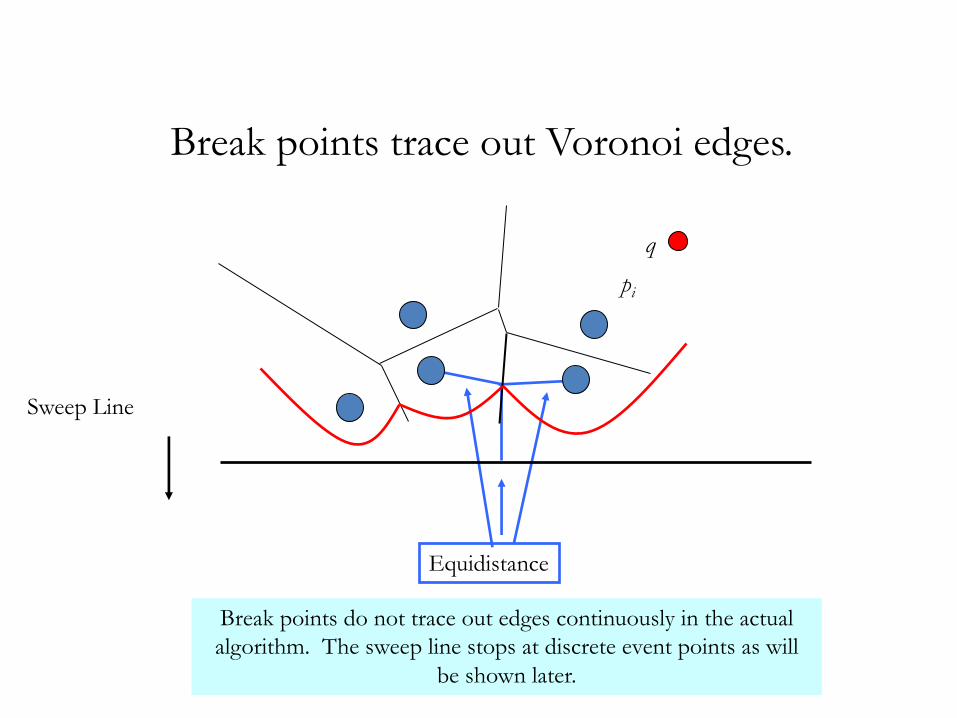
Break points trace out Voronoi edges.
Equidistance
Sweep Line
pi
q
Break points do not trace out edges continuously in the actual algorithm. The sweep line stops at discrete event points as will
be shown later.

Arcs flatten out as sweep line moves down.
Sweep Line
pi
q
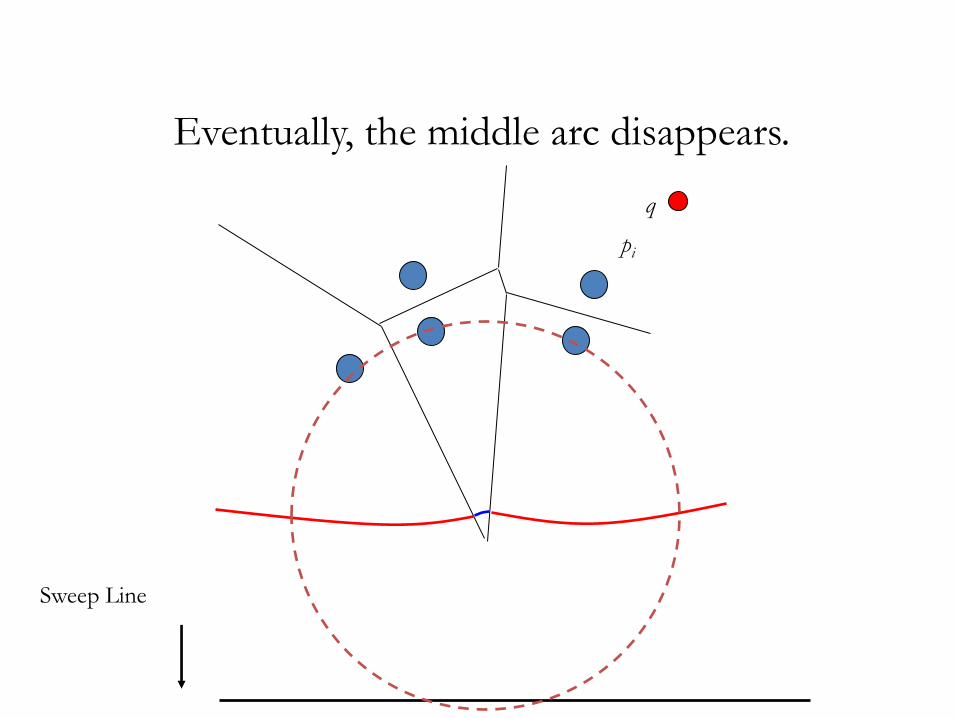
Eventually, the middle arc disappears.
Sweep Line
pi
q

We have detected a circle that is empty (contains no sites) and touches 3 or more sites.
Sweep Line
pi
q
Voronoi vertex!

Beach Line properties
• Voronoi edges are traced by the break points asthe sweep line moves down.
– Emergence of a new break point(s) (from formationof a new arc or a fusion of two existing breakpoints) identifies a new edge
• Voronoi vertices are identified when two breakpoints meet (fuse).
– Decimation of an old arc identifies new vertex
Constructing Voronoi Diagrams
Data Structures

Data Structures
• Current state of the Voronoi diagram
– Doubly linked list of half-edge, vertex, cell records
• Current state of the beach line
– Keep track of break points
– Keep track of arcs currently on beach line
• Current state of the sweep line
– Priority event queue sorted on decreasing y-coordinate
Discrete sweep steps, rather than a continuous sweep

Doubly Linked List (D)
• Goal: a simple data structure that allows analgorithm to traverse a Voronoi diagram’ssegments, cells and vertices
ev
Cell(pi)

Doubly Linked List (D)• Divide segments into uni-directional half-edges
• A chain of counter-clockwise half-edges forms a cell
• Define a half-edge’s “twin” to be its opposite half-edge of thesame segment
e
v
Cell(pi)
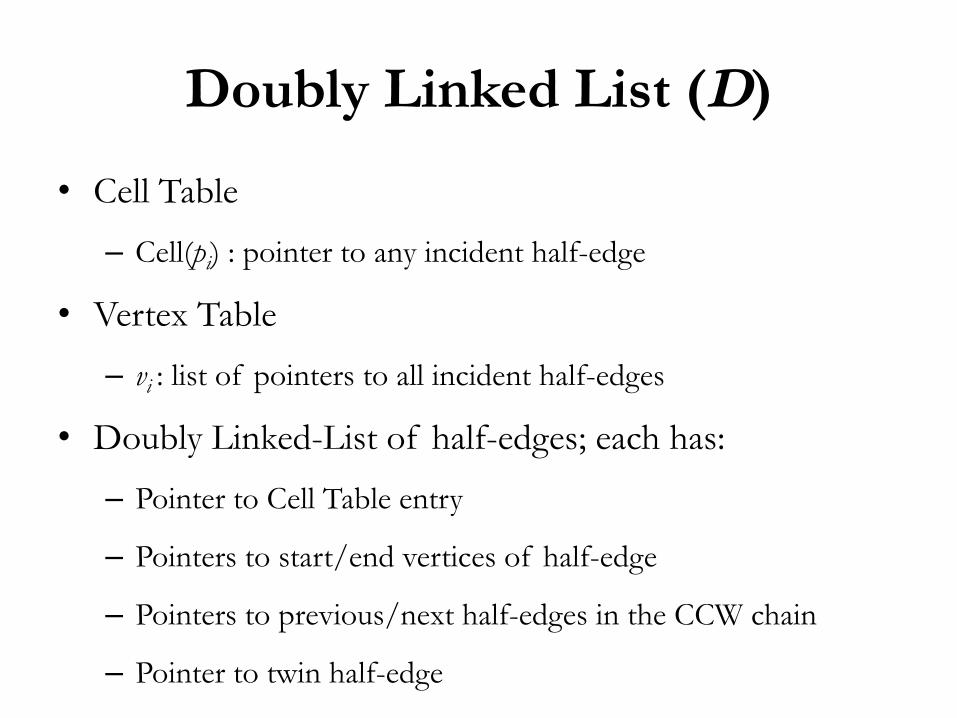
Doubly Linked List (D)
• Cell Table– Cell(pi) : pointer to any incident half-edge
• Vertex Table– vi : list of pointers to all incident half-edges
• Doubly Linked-List of half-edges; each has:– Pointer to Cell Table entry
– Pointers to start/end vertices of half-edge
– Pointers to previous/next half-edges in the CCW chain
– Pointer to twin half-edge

Balanced Binary Tree (T)• Internal nodes represent break points between two arcs
– Also contains a pointer to the D record of the edge being traced
• Leaf nodes represent arcs, each arc is in turn representedby the site that generated it
– Also contains a pointer to a potential circle event
pi pj pk pl
< pj, pk>
< pi, pj> < pk, pl>
pi
pjpk
pl
l
Event Queue (Q)
• An event is an interesting point encountered by thesweep line as it sweeps from top to bottom
– Sweep line makes discrete stops, rather than a continuoussweep
• Consists of Site Events (when the sweep lineencounters a new site point) and Circle Events (whenthe sweep line encounters the bottom of an empty circletouching 3 or more sites).
• Events are prioritized based on y-coordinate

Site Event
A new arc appears when a new site appears.
l

Site Event
A new arc appears when a new site appears.
l

Site Event
Original arc above the new site is broken into two
à Number of arcs on beach line is O(n)
l

Circle Event
An arc disappears whenever an empty circle touches three or more sites and is tangent to the sweep line.
Sweep line helps determine that the circle is indeed empty.
Circle Event!Sweep Line
pi
q
Voronoi vertex!
Event Queue Summary• Site Events are
– given as input
– represented by the xy-coordinate of the site point
• Circle Events are
– computed on the fly (intersection of the two bisectors in betweenthe three sites)
– represented by the xy-coordinate of the lowest point of an emptycircle touching three or more sites
– “anticipated”, these newly generated events may be false and need tobe removed later
• Event Queue prioritizes events based on their y-coordinates

Summarizing Data Structures
• Current state of the Voronoi diagram
– Doubly linked list of half-edge, vertex, cell records
• Current state of the beach line
– Keep track of break points
• Inner nodes of binary search tree; represented by a tuple
– Keep track of arcs currently on beach line
• Leaf nodes of binary search tree; represented by a site that generated thearc
• Current state of the sweep line
– Priority event queue sorted on decreasing y-coordinate

Constructing Voronoi Diagrams
Algorithm

1. Initialize
• Event queue Q ß all site events
• Binary search tree T ß Æ
• Doubly linked list D ß Æ
2. While Q not Æ,
• Remove event (e) from Q with largest y-coordinate
• HandleEvent(e, T, D)

Handling Site Events
1. Locate the existing arc (if any) that is above thenew site
2. Break the arc by replacing the leaf node with a subtree representing the new arc and its break points
3. Add two half-edge records in the doubly linked list
4. Check for potential circle event(s), add them toevent queue if they exist
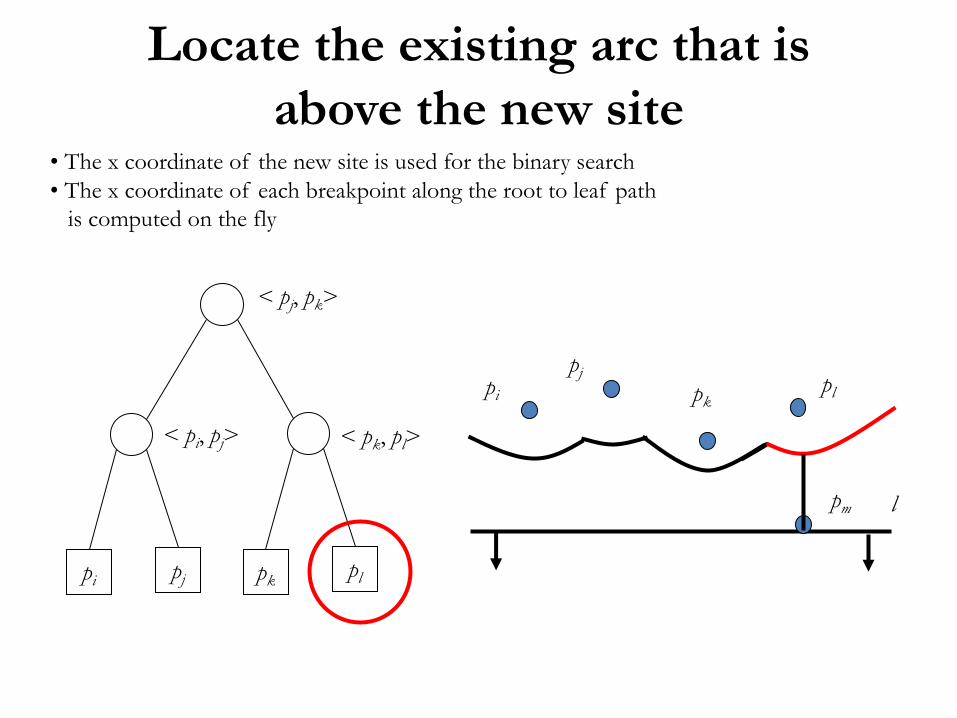
Locate the existing arc that is above the new site
pi pj pk pl
< pj, pk>
< pi, pj> < pk, pl>
• The x coordinate of the new site is used for the binary search• The x coordinate of each breakpoint along the root to leaf path
is computed on the fly
pi
pjpk
pl
lpm
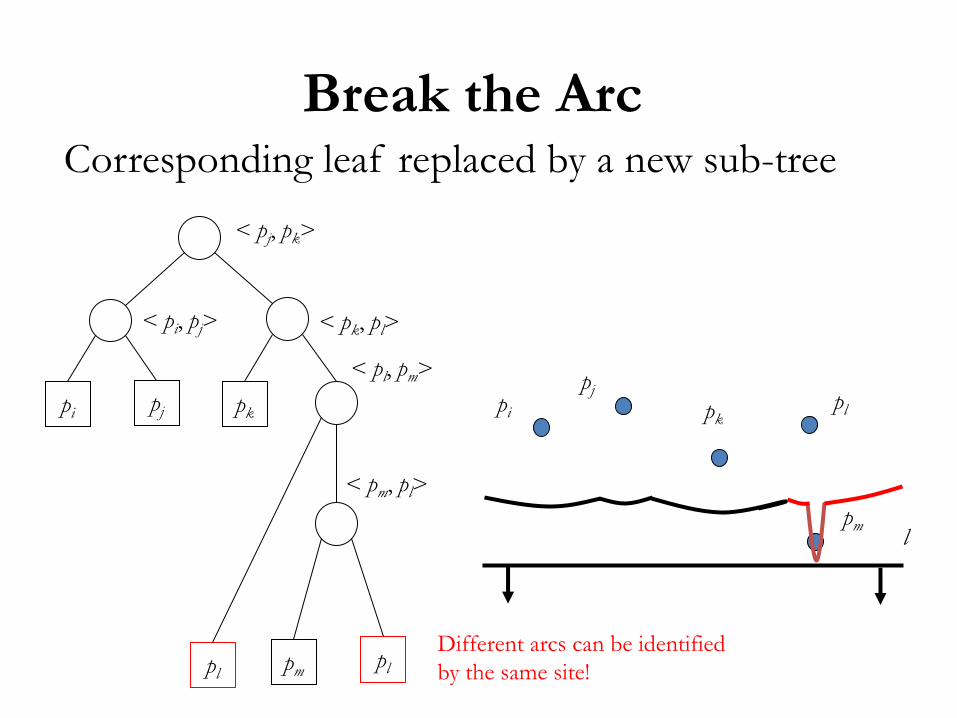
Break the Arc
pi pj pk
< pj, pk>
< pi, pj> < pk, pl>
Corresponding leaf replaced by a new sub-tree
pi
pjpk
pl
lpm
pm pl
< pl, pm>
< pm, pl>
pl
Different arcs can be identified by the same site!

Add a new edge record in the doubly linked list
pi pj pk
< pj, pk>
< pi, pj> < pk, pl>
pm pl
< pl, pm>
< pm, pl>
pl
pi
pjpk
pl
lpm
New Half Edge RecordEndpoints ß Æ
Pointers to two half-edge records
lpm

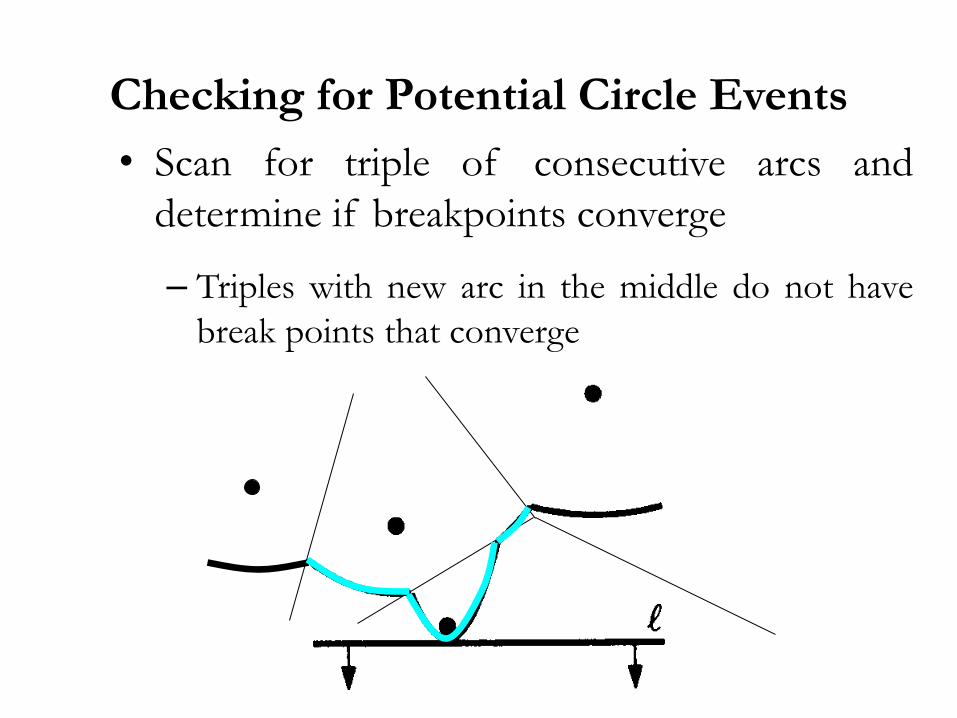
Checking for Potential Circle Events• Scan for triple of consecutive arcs and
determine if breakpoints converge
– Triples with new arc in the middle do not havebreak points that converge
Checking for Potential Circle Events• Scan for triple of consecutive arcs and
determine if breakpoints converge
– Triples with new arc in the middle do not havebreak points that converge

Checking for Potential Circle Events• Scan for triple of consecutive arcs and
determine if breakpoints converge
– Triples with new arc in the middle do not havebreak points that converge

Converging break points may not always yield a circle event
• Appearance of a new site before the circle eventmakes the potential circle non-empty
l
(The original circle event becomes a false alarm)

Handling Site Events
1. Locate the leaf representing the existing arc that isabove the new site
– Delete the potential circle event in the event queue
2. Break the arc by replacing the leaf node with a subtree representing the new arc and break points
3. Add a new edge record in the doubly linked list
4. Check for potential circle event(s), add them toqueue if they exist
– Store in the corresponding leaf of T a pointer to the newcircle event in the queue

Handling Circle Events
1. Add vertex to corresponding edge record in doublylinked list
2. Delete from T the leaf node of the disappearing arcand its associated circle events in the event queue
3. Create new edge record in doubly linked list
4. Check the new triplets formed by the formerneighboring arcs for potential circle events

A Circle Event
pi pj pk
< pj, pk>
< pi, pj> < pk, pl>
pi
pj
pkpl
lpm
pm pl
< pl, pm>
< pm, pl>
pl

Add vertex to corresponding edge record
pi pj pk
< pj, pk>
< pi, pj> < pk, pl>
pi
pj
pkpl
lpm
pm pl
< pl, pm>
< pm, pl>
pl
Half Edge RecordEndpoints.add(x, y)
Half Edge RecordEndpoints.add(x, y)
Link!

Deleting disappearing arc
pi pj pk
< pj, pk>
< pi, pj>
pi
pj
pkpl
lpm
pm pl
< pm, pl>

Deleting disappearing arc
pi pj pk
< pj, pk>
< pi, pj>
pi
pj
pkpl
lpm
pm pl
< pm, pl>
< pk, pm>

Create new edge record
pi pj pk
< pj, pk>
< pi, pj>
pi
pj
pkpl
lpm
pm pl
< pm, pl>
< pk, pm>
New Half Edge RecordEndpoints.add(x, y)
A new edge is traced out by the new break point < pk, pm>
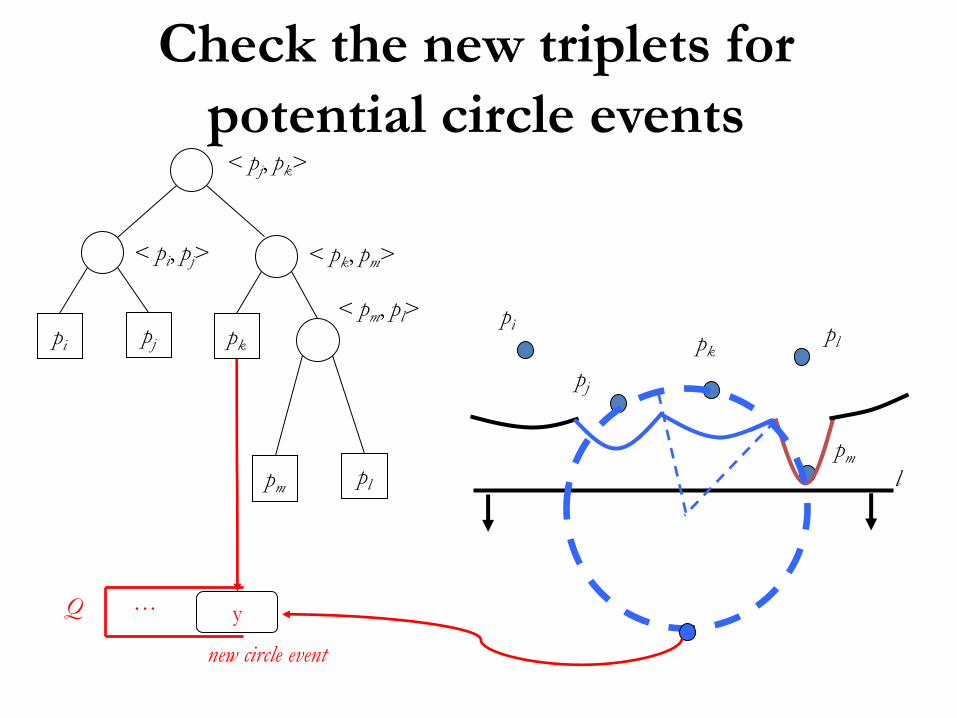
Check the new triplets for potential circle events
pi pj pk
< pj, pk>
< pi, pj>
pi
pj
pkpl
lpm
pm pl
< pm, pl>
< pk, pm>
Q y…
new circle event

Minor Detail
• Algorithm terminates when Q = Æ, but thebeach line and its break points continue to tracethe Voronoi edges
– Terminate these “half-infinite” edges via a boundingbox
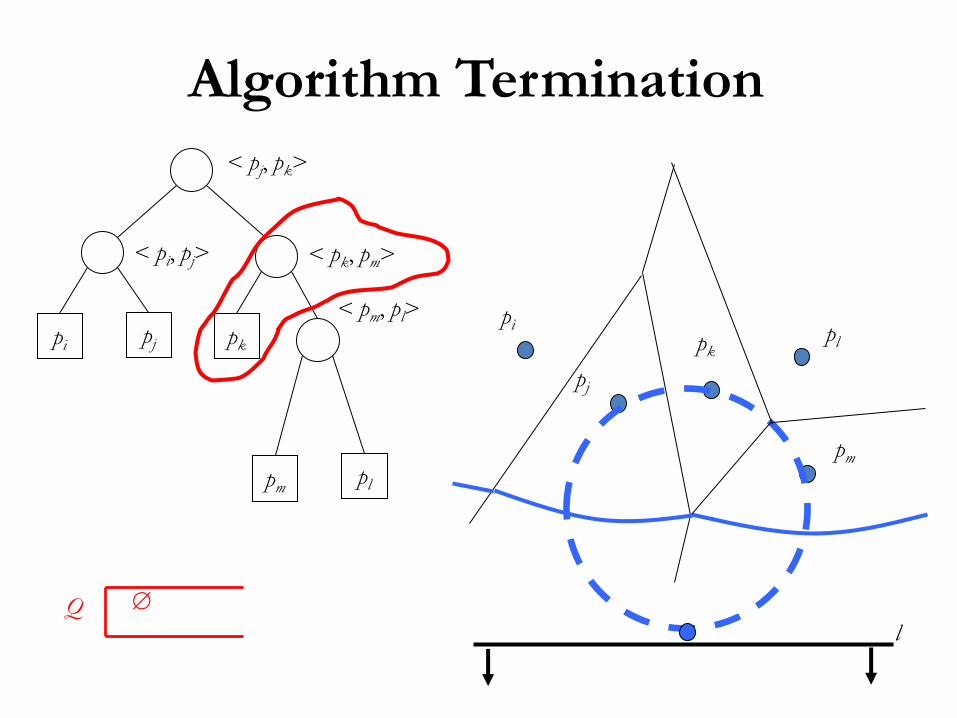
Algorithm Termination
pi pj pk
< pj, pk>
< pi, pj>
pi
pj
pkpl
l
pmpm pl
< pm, pl>
< pk, pm>
Q Æ

Algorithm Termination
pi pj
< pj, pm>
< pi, pj>
pi
pj
pkpl
l
pm
pm pl
< pm, pl>
Q Æ

Algorithm Termination
pi pj
< pj, pm>
< pi, pj>
pi
pj
pkpl
l
pm
pm pl
< pm, pl>
Q Æ
Terminate half-lines with a bounding box!

Constructing Voronoi Diagrams
Running Time Analysis
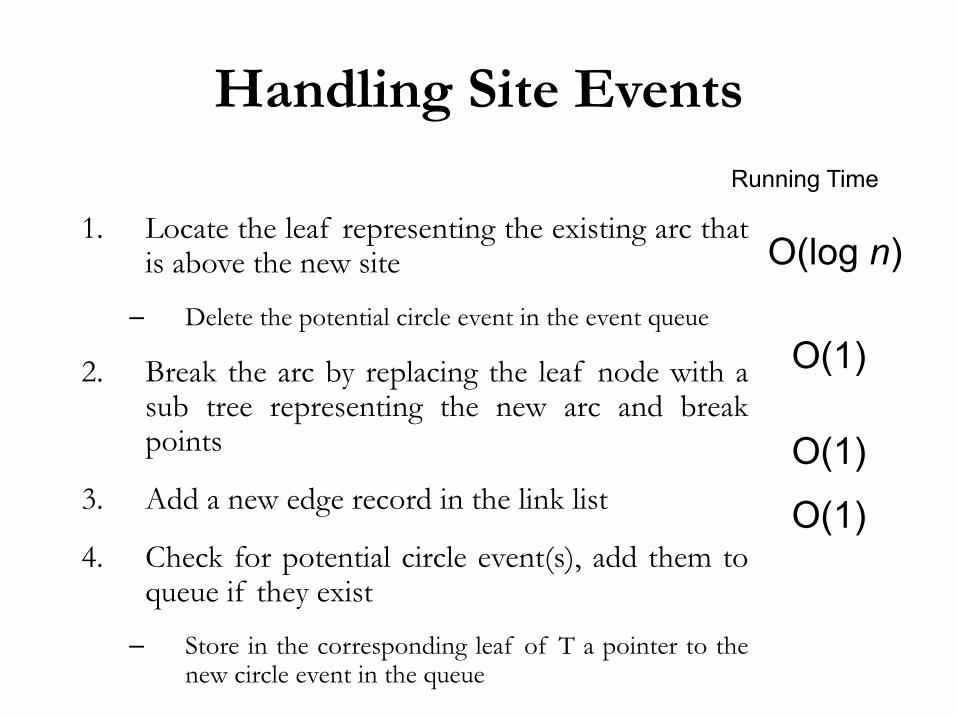
Handling Site Events
1. Locate the leaf representing the existing arc thatis above the new site
– Delete the potential circle event in the event queue
2. Break the arc by replacing the leaf node with asub tree representing the new arc and breakpoints
3. Add a new edge record in the link list
4. Check for potential circle event(s), add them toqueue if they exist
– Store in the corresponding leaf of T a pointer to thenew circle event in the queue
Running Time
O(log n)
O(1)
O(1)
O(1)
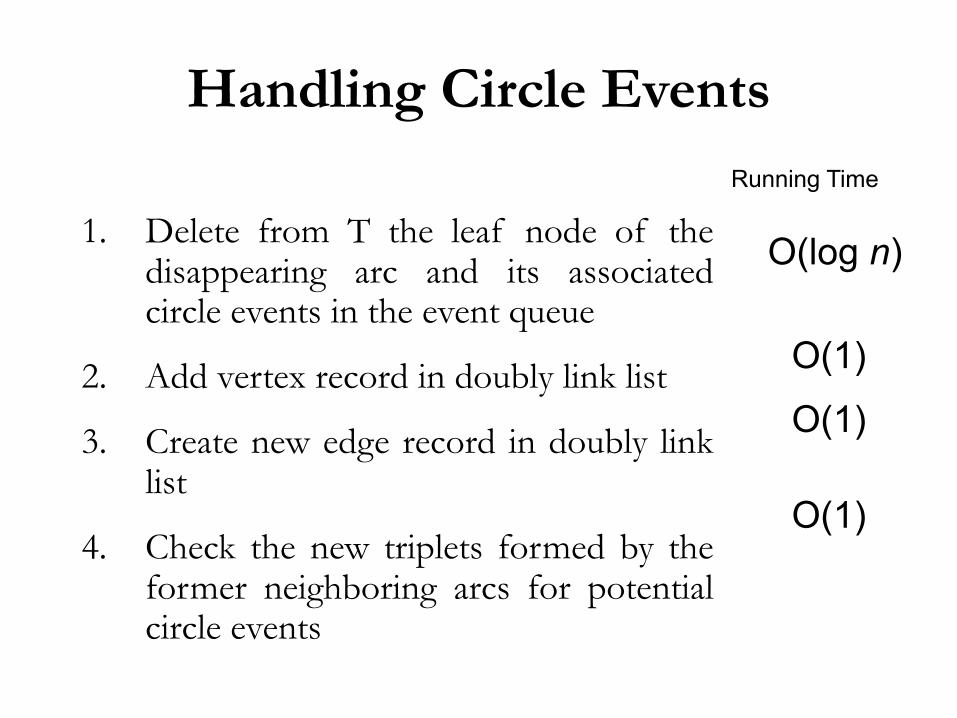
Handling Circle Events
1. Delete from T the leaf node of thedisappearing arc and its associatedcircle events in the event queue
2. Add vertex record in doubly link list
3. Create new edge record in doubly linklist
4. Check the new triplets formed by theformer neighboring arcs for potentialcircle events
Running Time
O(log n)
O(1)
O(1)
O(1)

Total Running Time
• Each new site can generate at most two new arcs
àbeach line can have at most 2n – 1 arcs
àat most O(n) site and circle events in the queue
• Site/Circle Event Handler O(log n)
à O(n log n) total running time

Is Fortune’s Algorithm Optimal?• We can sort numbers using any algorithm that
constructs a Voronoi diagram!
• Map input numbers to a position on the numberline. The resulting Voronoi diagram is doubly linkedlist that forms a chain of unbounded cells in theleft-to-right (sorted) order.
-5 1 3 6 7
NumberLine

Constructing Voronoi Diagrams
Duality and degenerate cases
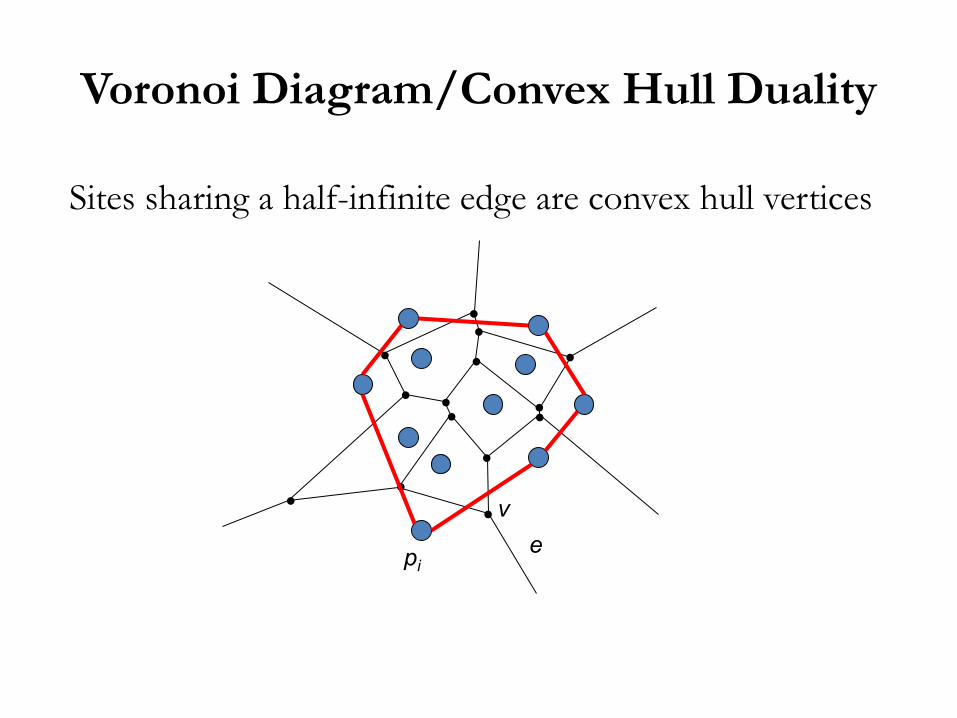
Voronoi Diagram/Convex Hull Duality
Sites sharing a half-infinite edge are convex hull vertices
ev
pi
Degenerate Cases
• Events in Q share the same y-coordinate
– Can additionally sort them using x-coordinate
• Circle event involving more than 3 sites
– Current algorithm produces multiple degree 3Voronoi vertices joined by zero-length edges
– Can be fixed in post processing

Degenerate Cases
• Site points are collinear (break points neitherconverge or diverge)
– Bounding box takes care of this
• One of the sites coincides with the lowest pointof the circle event
– Do nothing

Site coincides with circle event: the same algorithm applies!
1. New site detected2. Break one of the arcs an infinitesimal distance
away from the arc’s end point

Site coincides with circle event

Summary
• Voronoi diagram is a useful planar subdivisionof a discrete point set
• Voronoi diagrams have linear complexity andcan be constructed in O(n log n) time
• Fortune’s algorithm (optimal)