flavor Network And The Principles Of Food Pairing - Arxiv · Flavor network and the principles of...
39
Flavor network and the principles of food pairing Yong-Yeol Ahn, 1,2,3† Sebastian E. Ahnert, 1,4†* James P. Bagrow, 1,2 Albert-L´ aszl´ o Barab´ asi 1,2* 1 Center for Complex Network Research, Department of Physics Northeastern University, Boston, MA 02115 2 Center for Cancer Systems Biology Dana-Farber Cancer Institute, Harvard University, Boston, MA 02115 3 School of Informatics and Computing Indiana University, Bloomington, IN 47408 4 Theory of Condensed Matter, Cavendish Laboratory University of Cambridge, Cambridge CB3 0HE, UK † These authors contributed equally to this work. * To whom correspondence should be addressed. E-mail: [email protected] (S.E.A.); [email protected] (A.L.B.) Abstract The cultural diversity of culinary practice, as illustrated by the variety of regional cuisines, raises the question of whether there are any general patterns that determine the ingredient combinations used in food today or principles that transcend individual tastes and recipes. We introduce a flavor network that captures the flavor compounds shared by culinary ingredients. Western cuisines show a tendency to use ingredient pairs that share many flavor compounds, supporting the so-called food pairing hypothesis. By contrast, East Asian cuisines tend to avoid compound sharing ingredients. Given the increasing availabil- ity of information on food preparation, our data-driven investigation opens new avenues towards a systematic understanding of culinary practice. As omnivores, humans have historically faced the difficult task of identifying and gather- ing food that satisfies nutritional needs while avoiding foodborne illnesses [1]. This process has contributed to the current diet of humans, which is influenced by factors ranging from an 1 arXiv:1111.6074v1 [physics.soc-ph] 25 Nov 2011
Transcript of flavor Network And The Principles Of Food Pairing - Arxiv · Flavor network and the principles of...
Flavor network and the principles of food pairing
Yong-Yeol Ahn,1,2,3† Sebastian E. Ahnert,1,4†∗ James P. Bagrow,1,2
Albert-Laszlo Barabasi1,2∗
1Center for Complex Network Research, Department of PhysicsNortheastern University, Boston, MA 02115
2Center for Cancer Systems BiologyDana-Farber Cancer Institute, Harvard University, Boston, MA 02115
3School of Informatics and ComputingIndiana University, Bloomington, IN 47408
4Theory of Condensed Matter, Cavendish LaboratoryUniversity of Cambridge, Cambridge CB3 0HE, UK
† These authors contributed equally to this work.∗ To whom correspondence should be addressed.
E-mail: [email protected] (S.E.A.); [email protected] (A.L.B.)
AbstractThe cultural diversity of culinary practice, as illustrated by the variety of regional
cuisines, raises the question of whether there are any general patterns that determine theingredient combinations used in food today or principles that transcend individual tastesand recipes. We introduce a flavor network that captures the flavor compounds shared byculinary ingredients. Western cuisines show a tendency to use ingredient pairs that sharemany flavor compounds, supporting the so-called food pairing hypothesis. By contrast, EastAsian cuisines tend to avoid compound sharing ingredients. Given the increasing availabil-ity of information on food preparation, our data-driven investigation opens new avenuestowards a systematic understanding of culinary practice.
As omnivores, humans have historically faced the difficult task of identifying and gather-
ing food that satisfies nutritional needs while avoiding foodborne illnesses [1]. This process
has contributed to the current diet of humans, which is influenced by factors ranging from an
1
arX
iv:1
111.
6074
v1 [
phys
ics.
soc-
ph]
25
Nov
201
1
evolved preference for sugar and fat to palatability, nutritional value, culture, ease of produc-
tion, and climate [1, 2, 3, 4, 5, 6, 7, 8, 9]. The relatively small number of recipes in use (∼ 106,
e.g. http://cookpad.com) compared to the enormous number of potential recipes (> 1015, see
Supplementary Information Sec S1.2), together with the frequent recurrence of particular com-
binations in various regional cuisines, indicates that we are exploiting but a tiny fraction of the
potential combinations. Although this pattern itself can be explained by a simple evolutionary
model [10] or data-driven approaches [11], a fundamental question still remains: are there any
quantifiable and reproducible principles behind our choice of certain ingredient combinations
and avoidance of others?
Although many factors such as colors, texture, temperature, and sound play an important
role in food sensation [12, 13, 14, 15], palatability is largely determined by flavor, representing
a group of sensations including odors (due to molecules that can bind olfactory receptors), tastes
(due to molecules that stimulate taste buds), and freshness or pungency (trigeminal senses) [16].
Therefore, the flavor compound (chemical) profile of the culinary ingredients is a natural start-
ing point for a systematic search for principles that might underlie our choice of acceptable
ingredient combinations.
A hypothesis, which over the past decade has received attention among some chefs and food
scientists, states that ingredients sharing flavor compounds are more likely to taste well together
than ingredients that do not [17]. This food pairing hypothesis has been used to search for novel
ingredient combinations and has prompted, for example, some contemporary restaurants to
combine white chocolate and caviar, as they share trimethylamine and other flavor compounds,
or chocolate and blue cheese that share at least 73 flavor compounds. As we search for evidence
supporting (or refuting) any ‘rules’ that may underlie our recipes, we must bear in mind that the
scientific analysis of any art, including the art of cooking, is unlikely to be capable of explaining
every aspect of the artistic creativity involved. Furthermore, there are many ingredients whose
2
main role in a recipe may not be only flavoring but something else as well (e.g. eggs’ role to
ensure mechanical stability or paprika’s role to add vivid colors). Finally, the flavor of a dish
owes as much to the mode of preparation as to the choice of particular ingredients [12, 18,
19]. However, our hypothesis is that given the large number of recipes we use in our analysis
(56,498), such confounding factors can be systematically filtered out, allowing for the discovery
of patterns that may transcend specific dishes or ingredients.
Here we introduce a network-based approach to explore the impact of flavor compounds on
ingredient combinations. Efforts by food chemists to identify the flavor compounds contained
in most culinary ingredients allows us to link each ingredient to 51 flavor compounds on av-
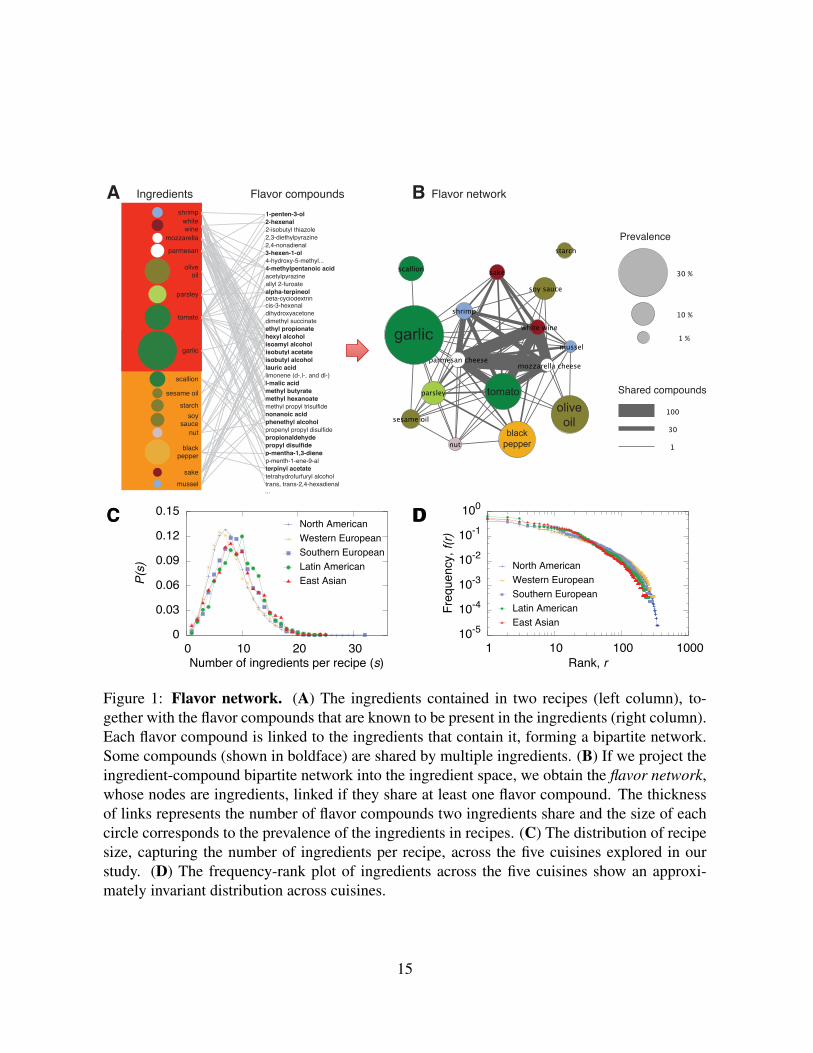
erage [20]1. We build a bipartite network [21, 22, 23, 24, 25, 26] consisting of two different
types of nodes: (i) 381 ingredients used in recipes throughout the world, and (ii) 1,021 flavor
compounds that are known to contribute to the flavor of each of these ingredients (Fig. 1A).
A projection of this bipartite network is the flavor network in which two nodes (ingredients)
are connected if they share at least one flavor compound (Fig. 1B). The weight of each link
represents the number of shared flavor compounds, turning the flavor network into a weighted
network [27, 22, 23]. While the compound concentration in each ingredient and the detection
threshold of each compound should ideally be taken into account, the lack of systematic data
prevents us from exploring their impact (see Sec S1.1.2 on data limitations).
Since several flavor compounds are shared by a large number of ingredients, the resulting
flavor network is too dense for direct visualization (average degree 〈k〉 ' 214). We therefore
use a backbone extraction method [28, 29] to identify the statistically significant links for each
ingredient given the sum of weights characterizing the particular node (Fig. 2), see SI for de-
tails). Not surprisingly, each module in the network corresponds to a distinct food class such as
meats (red) or fruits (yellow). The links between modules inform us of the flavor compounds1While finalizing this manuscript, an updated edition (6th Ed.) of Fenaroli’s handbook of flavor ingredients has
been released.
3
that hold different classes of foods together. For instance, fruits and dairy products are close to
alcoholic drinks, and mushrooms appear isolated, as they share a statistically significant number
of flavor compounds only with other mushrooms.
The flavor network allows us to reformulate the food pairing hypothesis as a topological
property: do we more frequently use ingredient pairs that are strongly linked in the flavor net-
work or do we avoid them? To test this hypothesis we need data on ingredient combinations
preferred by humans, information readily available in the current body of recipes. For gen-
erality, we used 56,498 recipes provided by two American repositories (epicurious.com and
allrecipes.com) and to avoid a distinctly Western interpretation of the world’s cuisine, we also
used a Korean repository (menupan.com) (Fig. 1). The recipes are grouped into geographically
distinct cuisines (North American, Western European, Southern European, Latin American, and
East Asian; see Table S2). The average number of ingredients used in a recipe is around eight,
and the overall distribution is bounded (Fig. 1C), indicating that recipes with a very large or
very small number of ingredients are rare. By contrast, the popularity of specific ingredients
varies over four orders of magnitude, documenting huge differences in how frequently various
ingredients are used in recipes (Fig. 1D), as observed in [10]. For example, jasmine tea, Ja-
maican rum, and 14 other ingredients are each found in only a single recipe (see SI S1.2), but
egg appears in as many as 20,951, more than one third of all recipes.
Results
Figure 3D indicates that North American and Western European cuisines exhibit a statistically
significant tendency towards recipes whose ingredients share flavor compounds. By contrast,
East Asian and Southern European cuisines avoid recipes whose ingredients share flavor com-
pounds (see Fig. 3D for the Z-score, capturing the statistical significance of ∆Ns). The system-
atic difference between the East Asian and the North American recipes is particularly clear if we
4
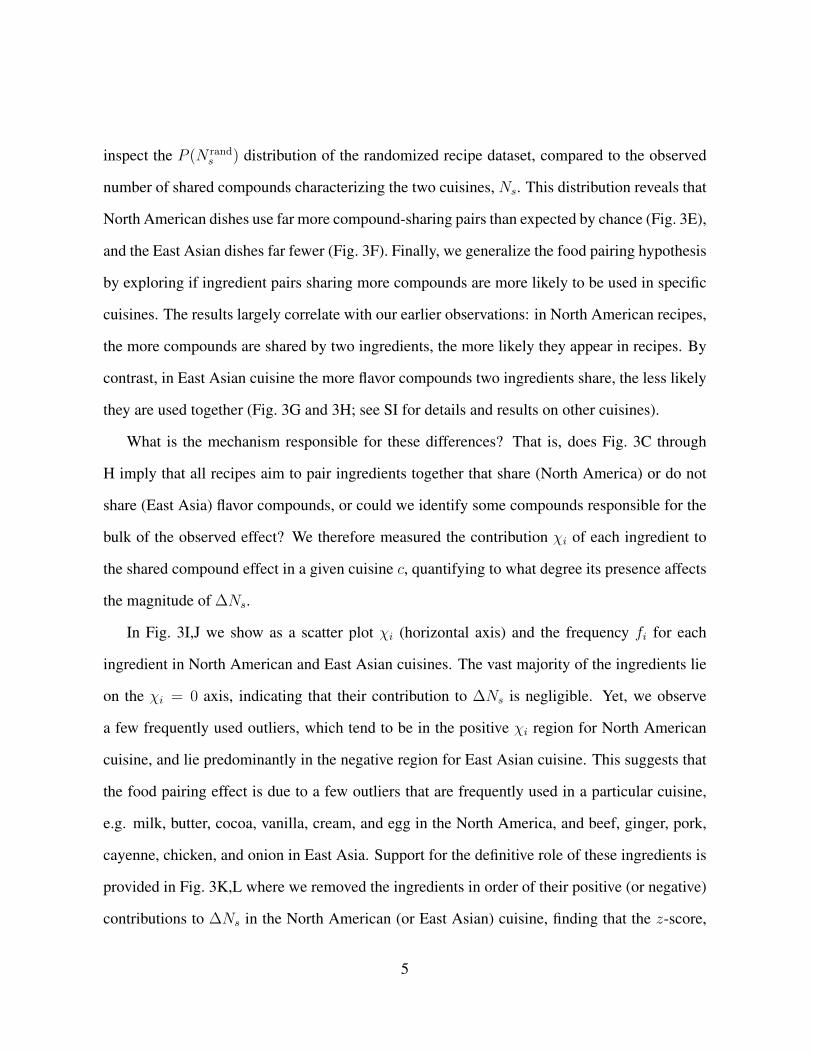
inspect the P (N rands ) distribution of the randomized recipe dataset, compared to the observed
number of shared compounds characterizing the two cuisines, Ns. This distribution reveals that
North American dishes use far more compound-sharing pairs than expected by chance (Fig. 3E),
and the East Asian dishes far fewer (Fig. 3F). Finally, we generalize the food pairing hypothesis
by exploring if ingredient pairs sharing more compounds are more likely to be used in specific
cuisines. The results largely correlate with our earlier observations: in North American recipes,
the more compounds are shared by two ingredients, the more likely they appear in recipes. By
contrast, in East Asian cuisine the more flavor compounds two ingredients share, the less likely
they are used together (Fig. 3G and 3H; see SI for details and results on other cuisines).
What is the mechanism responsible for these differences? That is, does Fig. 3C through
H imply that all recipes aim to pair ingredients together that share (North America) or do not
share (East Asia) flavor compounds, or could we identify some compounds responsible for the
bulk of the observed effect? We therefore measured the contribution χi of each ingredient to
the shared compound effect in a given cuisine c, quantifying to what degree its presence affects
the magnitude of ∆Ns.
In Fig. 3I,J we show as a scatter plot χi (horizontal axis) and the frequency fi for each
ingredient in North American and East Asian cuisines. The vast majority of the ingredients lie
on the χi = 0 axis, indicating that their contribution to ∆Ns is negligible. Yet, we observe
a few frequently used outliers, which tend to be in the positive χi region for North American
cuisine, and lie predominantly in the negative region for East Asian cuisine. This suggests that
the food pairing effect is due to a few outliers that are frequently used in a particular cuisine,
e.g. milk, butter, cocoa, vanilla, cream, and egg in the North America, and beef, ginger, pork,
cayenne, chicken, and onion in East Asia. Support for the definitive role of these ingredients is
provided in Fig. 3K,L where we removed the ingredients in order of their positive (or negative)
contributions to ∆Ns in the North American (or East Asian) cuisine, finding that the z-score,
5
which measures the significance of the shared compound hypothesis, drops below two after
the removal of only 13 (5) ingredients from North American (or East Asian) cuisine (see SI
S2.2.2). Note, however, that these ingredients play a disproportionate role in the cuisine under
consideration—for example, the 13 key ingredients contributing to the shared compound effect
in North American cuisine appear in 74.4% of all recipes.
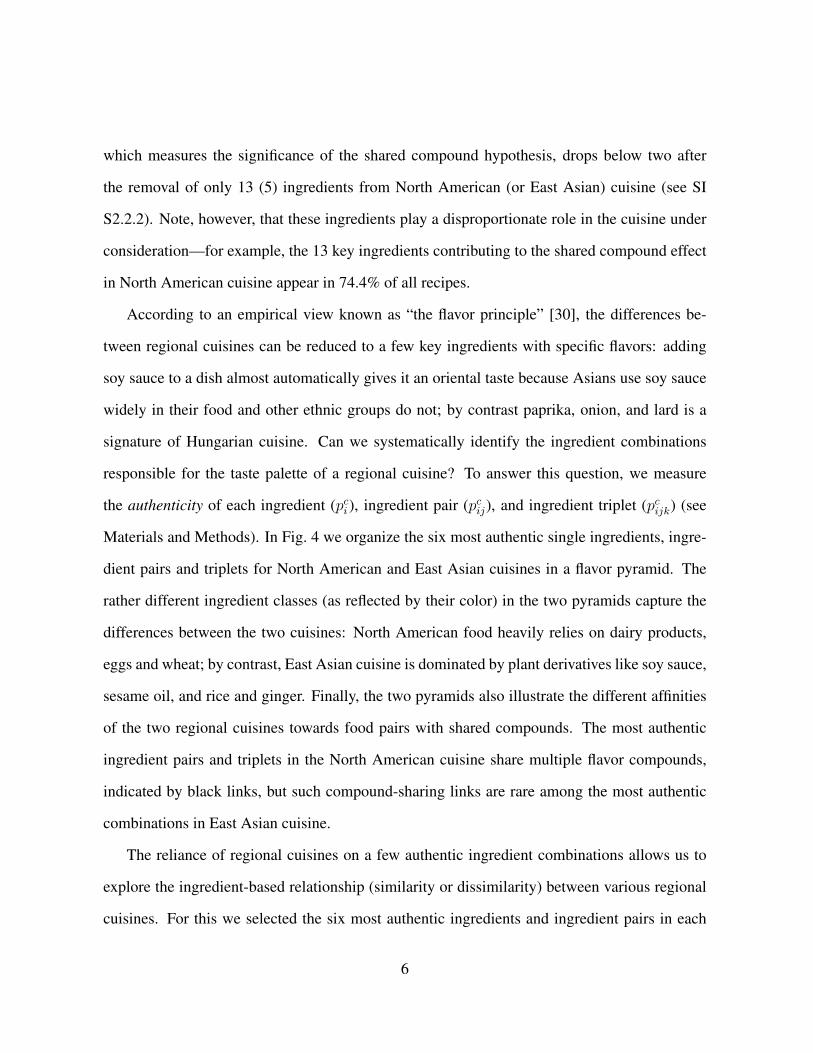
According to an empirical view known as “the flavor principle” [30], the differences be-
tween regional cuisines can be reduced to a few key ingredients with specific flavors: adding
soy sauce to a dish almost automatically gives it an oriental taste because Asians use soy sauce
widely in their food and other ethnic groups do not; by contrast paprika, onion, and lard is a
signature of Hungarian cuisine. Can we systematically identify the ingredient combinations
responsible for the taste palette of a regional cuisine? To answer this question, we measure
the authenticity of each ingredient (pci ), ingredient pair (pcij), and ingredient triplet (pcijk) (see
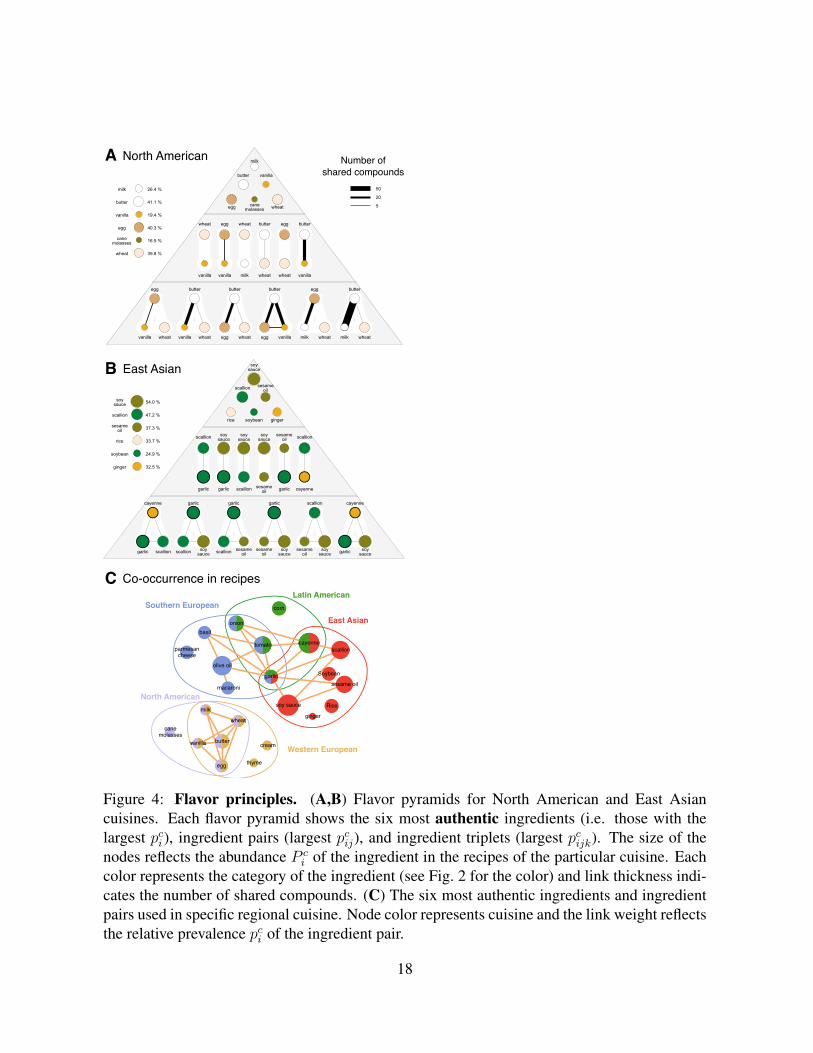
Materials and Methods). In Fig. 4 we organize the six most authentic single ingredients, ingre-
dient pairs and triplets for North American and East Asian cuisines in a flavor pyramid. The
rather different ingredient classes (as reflected by their color) in the two pyramids capture the
differences between the two cuisines: North American food heavily relies on dairy products,
eggs and wheat; by contrast, East Asian cuisine is dominated by plant derivatives like soy sauce,
sesame oil, and rice and ginger. Finally, the two pyramids also illustrate the different affinities
of the two regional cuisines towards food pairs with shared compounds. The most authentic
ingredient pairs and triplets in the North American cuisine share multiple flavor compounds,
indicated by black links, but such compound-sharing links are rare among the most authentic
combinations in East Asian cuisine.
The reliance of regional cuisines on a few authentic ingredient combinations allows us to
explore the ingredient-based relationship (similarity or dissimilarity) between various regional
cuisines. For this we selected the six most authentic ingredients and ingredient pairs in each
6
regional cuisine (i.e. those shown in Fig. 4A,B), generating a diagram that illustrates the ingre-
dients shared by various cuisines, as well as singling out those that are unique to a particular
region (Fig. 4C). We once again find a close relationship between North American and West-
ern European cuisines and observe that when it comes to its signature ingredient combinations
Southern European cuisine is much closer to Latin American than Western European cuisine
(Fig. 4C).
Discussion
Our work highlights the limitations of the recipe data sets currently available, and more gener-
ally of the systematic analysis of food preparation data. By comparing two editions of the same
dataset with significantly different coverage, we can show that our results are robust against data
incompleteness (see SI S1.1.2). Yet, better compound databases, mitigating the incompleteness
and the potential biases of the current data, could significantly improve our understanding of
food. There is inherent ambiguity in the definition of a particular regional or ethnic cuisine.
However, as discussed in SI S1.2, the correlation between different datasets, representing two
distinct perspectives on food (American and Korean), indicates that humans with different eth-
nic background have a rather consistent view on the composition of various regional cuisines.
Recent work by Kinouchi et al. [10] observed that the frequency-rank plots of ingredients
are invariant across four different cuisines, exhibiting a shape that can be well described by a
Zipf-Mandelbrot curve. Based on this observation, they model the evolution of recipes by as-
suming a copy-mutate process, leading to a very similar frequency-rank curve. The copy-mutate
model provides an explanation for how an ingredient becomes a staple ingredient of a cuisine:
namely, having a high fitness value or being a founder. The model assigns each ingredient a
random fitness value, which represents the ingredient’s nutritional value, availability, flavor,
etc. For example, it has been suggested that each culture eagerly adopt spices that have high
7
anti-bacterial activity (e.g. garlic) [6, 7], spices considered to have high fitness. The mutation
phase of the model replaces less fit ingredients with more fit ones. Meanwhile, the copy mecha-
nism keeps copying the founder ingredients—ingredients in the early recipes—and makes them
abundant in the recipes regardless of their fitness value.
It is worthwhile to discuss the similarity and difference between the quantities we measured
and the concepts of fitness and founders. First of all, prevalence (P ci ) and authenticity (pci ) are
empirically measured values while fitness is an intrinsic hidden variable. Among the list of
highly prevalent ingredients we indeed find old ingredients—founders—that have been used in
the same geographic region for thousands of years. At the same time, there are relatively new
ingredients such as tomatoes, potatoes, and peppers that were introduced to Europe and Asia
just a few hundred years ago. These new, but prevalent ingredients can be considered to have
high fitness values. If an ingredient has a high level of authenticity, then it is prevalent in a
cuisine while not so prevalent in all other cuisines.
Indeed, each culture has developed their own authentic ingredients. It may indicate that
fitness can vary greatly across cuisines or that the stochasticity of recipe evolution diverge the
recipes in different regions into completely different sets. More historical investigation will
help us to estimate the fitness of ingredients and assess why we use the particular ingredients
we currently do. The higher order fitness value suggested in [10] is very close to our concept of
food pairing affinity.
Another difference in our results is the number of ingredients in recipes. Kinouchi et al.
reported that the average number of ingredients per recipe varies across different cookbooks.
While we also observed variation in the number of ingredients per recipe, the patterns we found
were not consistent with those found by Kinouchi et al. For instance, the French cookbook
has more ingredients per recipe than a Brazillian one, but in our dataset we find the opposite
result. We believe that a cookbook cannot represent a whole cuisine, and that cookbooks with
8
more sophisticated recipes will tend to have more ingredients per recipe than cookbooks with
everyday recipes. As more complete datasets become available, sharper conclusions can be
drawn regarding the size variation between cuisines.
Our contribution in this context is a study of the role that flavour compounds play in de-
termining these fitness values. One possible interpretation of our results is that shared flavor
compounds represent one of several contributions to fitness value, and that, while shared com-
pounds clearly play a significant role in some cuisines, other contributions may play a more
dominant role in other cuisines. The fact that recipes rely on ingredients not only for flavor but
also to provide the final textures and overall structure of a given dish provides support for the
idea that fitness values depend on a multitude of ingredient characteristics besides their flavor
profile.
In summary, our network-based investigation identifies a series of statistically significant
patterns that characterize the way humans choose the ingredients they combine in their food.
These patterns manifest themselves to varying degree in different geographic regions: while
North American and Western European dishes tend to combine ingredients that share flavor
compounds, East Asian cuisine avoids them. More generally this work provides an example
of how the data-driven network analysis methods that have transformed biology and the social
sciences in recent years can yield new insights in other areas, such as food science.
Methods
Shared compounds
To test the hypothesis that the choice of ingredients is driven by an appreciation for ingredient
pairs that share flavor compounds (i.e. those linked in Fig. 2), we measured the mean number
of shared compounds in each recipe, Ns, comparing it with N rands obtained for a randomly con-
structed reference recipe dataset. For a recipe R that contains nR different ingredients, where
9
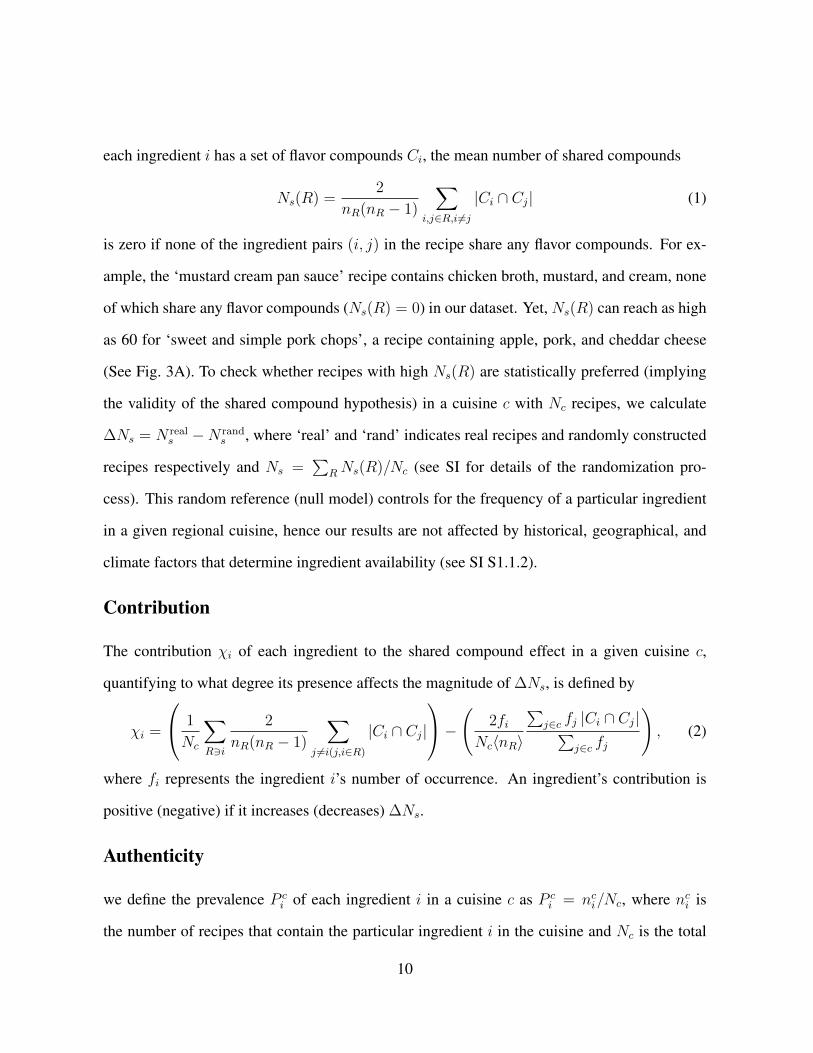
each ingredient i has a set of flavor compounds Ci, the mean number of shared compounds
Ns(R) =2
nR(nR − 1)
∑i,j∈R,i 6=j
|Ci ∩ Cj| (1)
is zero if none of the ingredient pairs (i, j) in the recipe share any flavor compounds. For ex-
ample, the ‘mustard cream pan sauce’ recipe contains chicken broth, mustard, and cream, none
of which share any flavor compounds (Ns(R) = 0) in our dataset. Yet, Ns(R) can reach as high
as 60 for ‘sweet and simple pork chops’, a recipe containing apple, pork, and cheddar cheese
(See Fig. 3A). To check whether recipes with high Ns(R) are statistically preferred (implying
the validity of the shared compound hypothesis) in a cuisine c with Nc recipes, we calculate
∆Ns = N reals −N rand
s , where ‘real’ and ‘rand’ indicates real recipes and randomly constructed
recipes respectively and Ns =∑
RNs(R)/Nc (see SI for details of the randomization pro-
cess). This random reference (null model) controls for the frequency of a particular ingredient
in a given regional cuisine, hence our results are not affected by historical, geographical, and
climate factors that determine ingredient availability (see SI S1.1.2).
Contribution
The contribution χi of each ingredient to the shared compound effect in a given cuisine c,
quantifying to what degree its presence affects the magnitude of ∆Ns, is defined by
χi =
1
Nc
∑R3i
2
nR(nR − 1)
∑j 6=i(j,i∈R)
|Ci ∩ Cj|
−( 2fiNc〈nR〉
∑j∈c fj |Ci ∩ Cj|∑
j∈c fj
), (2)
where fi represents the ingredient i’s number of occurrence. An ingredient’s contribution is
positive (negative) if it increases (decreases) ∆Ns.
Authenticity
we define the prevalence P ci of each ingredient i in a cuisine c as P c
i = nci/Nc, where nc
i is
the number of recipes that contain the particular ingredient i in the cuisine and Nc is the total
10
number of recipes in the cuisine. The relative prevalence pci = P ci − 〈P c′
i 〉c′ 6=c measures the
authenticity—the difference between the prevalence of i in cuisine c and the average prevalence
of i in all other cuisines. We can also identify ingredient pairs or triplets that are overrepresented
in a particular cuisine relative to other cuisines by defining the relative pair prevalences pcij =
P cij − 〈P c′
ij 〉c′ 6=c and triplet prevalences pcijk = P cijk − 〈P c′
ijk〉c′ 6=c, with P cij = nc
ij/Nc and P cijk =
ncijk/Nc.
References
[1] Rozin, P. The selection of foods by rats, humans, and other animals. Advances in the
Study of Behavior 7, 21–76 (1976).
[2] Pfaffman, C. Olfaction and taste V, chap. Phylogenetic origins of sweet sensitivity (New
York: Academic Press, 1975).
[3] Garcia, J. & Hankins, W. G. Olfaction and taste V, chap. The evolution of bitter and the
acquisition of toxiphobia (New York: Academic Press, 1975).
[4] Drewnowski, A. & Greenwood, M. R. C. Cream and sugar: human preferences for high-
fat foods. Physiology & Behavior 30, 629–633 (1983).
[5] Diamond, J. M. Guns, germs, and steel: The fates of human societies (W.W. Norton, New
York, 1997).
[6] Billing, J. & Sherman, P. W. Antimicrobial functions of spices: why some like it hot. The
Quarterly Review of Biology 73, 3–49 (1998).
[7] Sherman, P. W. & Hash, G. A. Why vegetable recipes are not very spicy. Evolution and
Human Behavior 22, 147–163 (2001).
11
[8] Harris, M. Good to eat: riddles of food and culture (Waveland Press, 1998).
[9] Counihan, C. & van Esterik, P. (eds.) Food and culture (Routledge, 2007).
[10] Kinouchi, O., Diez-Garcia, R. W., Holanda, A. J., Zambianchi, P. & Roque, A. C. The
non-equilibrium nature of culinary evolution. New Journal of Physics 10, 073020 (2008).
[11] Teng, C.-Y., Lin, Y.-R. & Adamic, L. A. Recipe recommendation using ingredient net-
works (2011). ArXiv:1111.3919 [cs.SI].
[12] This, H. Molecular gastronomy: exploring the science of flavor (Columbia University
Press, 2005).
[13] Johnson, J. & Clydesdale, F. Perceived sweetness and redness in colored sucrose solutions.
Journal of Food Science 47, 747–752 (1982).
[14] Shankaer, M. U. & Levitan, C. A. Grape expectations: the role of cognitive influences in
color-flavor interactions. Conscious Cogn. 19, 380–390 (2010).
[15] Zampini, M. & Spence, C. The role of auditory cues in modulating the perceived crispness
and staleness of potato chips. Journal of Sensory Studies 19, 347–363 (2005).
[16] Breslin, P. A. S. & Beauchamp, G. K. Suppression of bitterness by sodium: variation
among bitter taste stimuli. Chem. Senses 20, 609–623 (1995).
[17] Blumenthal, H. The big fat duck cookbook (Bloomsbury, London, 2008).
[18] This, H. Molecular gastronomy, a scientific look at cooking. Accounts of Chemical Re-
search 42, 575–583 (2009).
[19] McGee, H. On food and cooking: the science and lore of the kitchen (Scribner, 2004).
12
[20] Burdock, G. A. Fenaroli’s handbook of flavor ingredients (CRC Press, 2004), 5th edn.
[21] Newman, M. E. J., Barabasi, A.-L. & Watts, D. J. The structure and dynamics of networks:
(Princeton University Press, 2006).
[22] Caldarelli, G. Scale-free networks: complex webs in nature and technology (Oxford Uni-
versity Press, USA, 2007).
[23] Dorogovtsev, S. N. & Mendes, J. F. F. Evolution of networks: from biological nets to the
internet and WWW (Oxford University Press, USA, 2003).
[24] Albert, R. & Barabasi, A.-L. Statistical mechanics of complex networks. Rev. Mod. Phys.
74, 47 (2002).
[25] Newman, M. E. J. The structure and function of complex networks. SIAM Review 45,
167–256 (2003).
[26] Dorogovtsev, S. N., Goltsev, A. V. & Mendes, J. F. F. Critical phenomena in complex
networks. Reviews of Modern Physics 80, 1275–61 (2008).
[27] Barrat, A., Barthelemy, M., Pastor-Satorras, R. & Vespignani, A. The architecture of
complex weighted networks. Proc. Nat. Acad. Sci. 111, 3747 (2004).
[28] Serrano, M. A., Boguna, M. & Vespignani, A. Extracting the multiscale backbone of
complex weighted networks. Proceedings of the National Academy of Sciences 106, 6483–
6488 (2009).
[29] Lee, S. H., Kim, P.-J., Ahn, Y.-Y. & Jeong, H. Googling social interactions: web search
engine based social network construction. PLoS One 5, e11233 (2010).
[30] Rozin, E. The flavor-principle cookbook (Hawthorn Books; Book Club Ed. edition, 1973).
13
Acknowledgements
We thank M. I. Meirelles, S. Lehmann, D. Kudayarova, T. W. Lim, J. Baranyi, H. This for
discussions. This work was supported by the James S. McDonnell Foundation 21st Century
Initiative in Studying Complex Systems.
Author contributions
YYA, SEA, and ALB designed research and YYA, SEA, and JPB performed research. All
authors wrote and reviewed the manuscript.
14
blackpepper
garlic
tomatooliveoil
0
0.03
0.06
0.09
0.12
0.15
0 10 20 30
P(s)
Number of ingredients per recipe (s)
C DNorth AmericanWestern EuropeanSouthern EuropeanLatin AmericanEast Asian
10-5
10-4
10-3
10-2
10-1
100
1 10 100 1000
Freq
uenc
y, f(
r)
Rank, r
C D
North AmericanWestern EuropeanSouthern EuropeanLatin AmericanEast Asian
A B Flavor network
...
propenyl propyl disulfide
cis-3-hexenal
2-isobutyl thiazole2-hexenal
trans, trans-2,4-hexadienal
1-penten-3-ol
acetylpyrazine
dihydroxyacetone
beta-cyclodextrin
isobutyl acetate
dimethyl succinate
phenethyl alcohol
limonene (d-,l-, and dl-)
terpinyl acetate
methyl hexanoate
p-mentha-1,3-diene
3-hexen-1-ol
p-menth-1-ene-9-al
alpha-terpineol
methyl propyl trisulfide
propionaldehyde
ethyl propionate
nonanoic acid
4-methylpentanoic acid
tetrahydrofurfuryl alcohol
allyl 2-furoate
4-hydroxy-5-methyl...
2,3-diethylpyrazine
lauric acid
l-malic acid
isoamyl alcohol
2,4-nonadienal
methyl butyrate
isobutyl alcohol
hexyl alcohol
propyl disulfide
Ingredients Flavor compounds
tomato
oliveoil
mozzarella
shrimp
parsley
parmesan
whitewine
garlic
sesame oil
starch
sakemussel
nut
blackpepper
soysauce
scallion
Shrim
p sc
ampi
and
tom
ato
broi
lSe
ason
ed m
usse
ls
Prevalence
Shared compounds
Figure 1: Flavor network. (A) The ingredients contained in two recipes (left column), to-gether with the flavor compounds that are known to be present in the ingredients (right column).Each flavor compound is linked to the ingredients that contain it, forming a bipartite network.Some compounds (shown in boldface) are shared by multiple ingredients. (B) If we project theingredient-compound bipartite network into the ingredient space, we obtain the flavor network,whose nodes are ingredients, linked if they share at least one flavor compound. The thicknessof links represents the number of flavor compounds two ingredients share and the size of eachcircle corresponds to the prevalence of the ingredients in recipes. (C) The distribution of recipesize, capturing the number of ingredients per recipe, across the five cuisines explored in ourstudy. (D) The frequency-rank plot of ingredients across the five cuisines show an approxi-mately invariant distribution across cuisines.
15
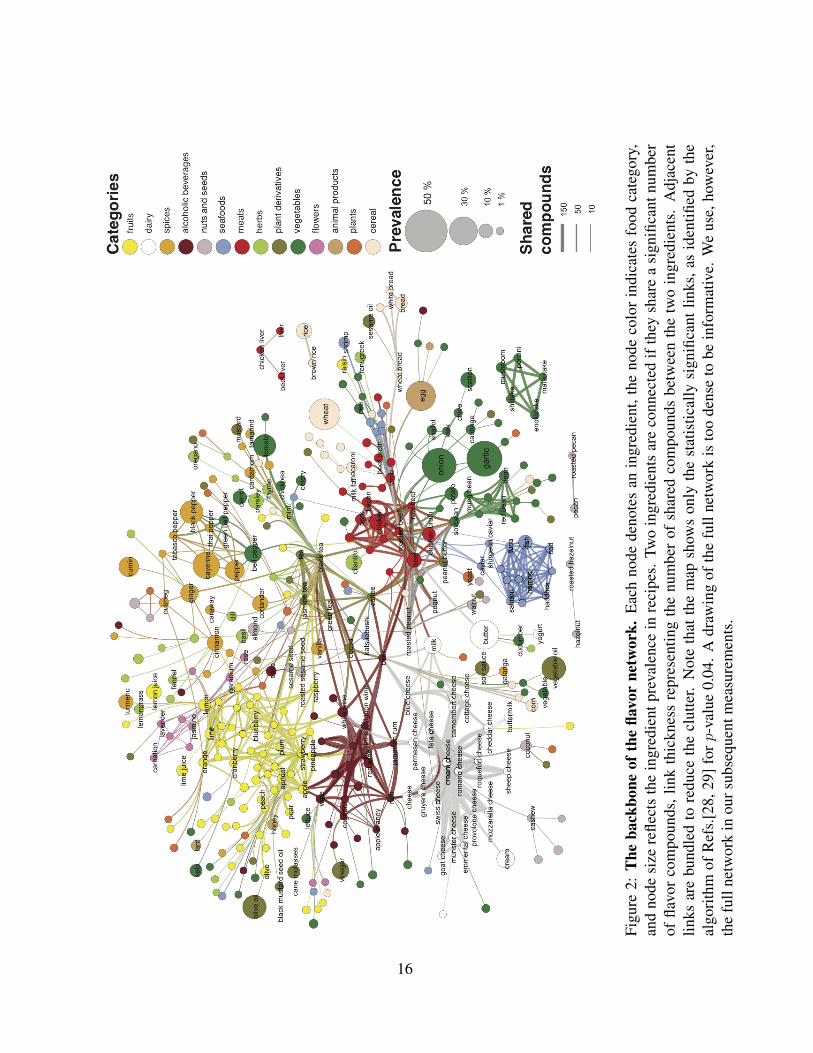
Figu
re2:
The
back
bone
ofth
efla
vor
netw
ork.
Eac
hno
dede
note
san
ingr
edie
nt,t
heno
deco
lor
indi
cate
sfo
odca
tego
ry,
and
node
size
refle
cts
the
ingr
edie
ntpr
eval
ence
inre
cipe
s.Tw
oin
gred
ient
sar
eco
nnec
ted
ifth
eysh
are
asi
gnifi
cant
num
ber
offla
vor
com
poun
ds,l
ink
thic
knes
sre
pres
entin
gth
enu
mbe
rof
shar
edco
mpo
unds
betw
een
the
two
ingr
edie
nts.
Adj
acen
tlin
ksar
ebu
ndle
dto
redu
ceth
ecl
utte
r.N
ote
that
the
map
show
son
lyth
est
atis
tical
lysi
gnifi
cant
links
,as
iden
tified
byth
eal
gori
thm
ofR
efs.
[28,
29]
forp-
valu
e0.
04.
Adr
awin
gof
the
full
netw
ork
isto
ode
nse
tobe
info
rmat
ive.
We
use,
how
ever
,th
efu
llne
twor
kin
ours
ubse
quen
tmea
sure
men
ts.
16

-1012
Nor
thAm
eric
anW
este
rnEu
rope
anLa
tinAm
eric
anSo
uthe
rnEu
rope
anEa
stAs
ian
Ns
AB
CD
EF
GH
IJ
KL
-4-20246810
Nor
thAm
eric
anW
este
rnEu
rope
anLa
tinAm
eric
anSo
uthe
rnEu
rope
anEa
stAs
ian
Z
0
0.1
0.2 6
6.2
6.4
6.6
6.8
P(Ns)
Ns
East
Asi
an,
p 1
.6
10-2
0
0.1
0.2 9
.5 1
0 1
0.5
11
11.
5 1
2
P(Ns)
Ns
Nor
th A
mer
ican
,p
<< 1
0-3
0
0.2
0.4
0.6
0.81 0
30
60
90
120
PR
Ns
Nor
th A
mer
ican
linea
r reg
ress
ion
0
0.2
0.4
0.6
0.81 0
30
60
90
120
PR
Ns
r = 0
.59
p 9
.0
10-1
1
r =
0.31
p 0
.002
7
East
Asi
anlin
ear r
egre
ssio
n
0
0.1
0.2
0.3
0.4
0.5
0.6 -0
.6-0
.4-0
.2 0
0.2
0.4
0.6
Frequency of use
Com
poun
d co
ntrib
utio
n,
i
Nor
th A
mer
ican
milkbu
tter
coco
a
vani
llacr
eam
crea
m c
hees
e
egg
tom
ato
0
0.1
0.2
0.3
0.4
0.5
0.6
-0.4
-0.2
0 0
.2 0
.4C
ompo
und
cont
ribut
ion,
i
East
Asi
an rice
beef
ging
er pork
caye
nne
chic
ken
onio
n
-1001020304050
0 5
10
15
20
25
30
z-score (shared compounds)
Num
ber o
f rem
oved
ingr
edie
nts
all m
ilk
butte
rco
coa
vani
lla
crea
m
crea
m c
hees
eegg
pean
ut b
utte
rst
raw
berry
Nor
th A
mer
ican
-4-3-2-1012
0 5
10
15
20
25
30
Num
ber o
f rem
oved
ingr
edie
nts
all
beef
ging
erpo
rkca
yenn
ech
icke
n
East
Asi
an
Man
y sh
ared
com
poun
ds
Ns
= 10
2
Cof
fee
Beef
132
102
97
Few
sha
red
com
poun
ds
Ns
= 9
Shrim
pLe
mon
639
69
45.5
Figu
re3:
Test
ing
thef
ood
pair
ing
hypo
thes
is.S
chem
atic
illus
trat
ion
oftw
oin
gred
ient
pair
s,th
efir
stsh
arin
gm
any
mor
e(A
)an
dth
ese
cond
muc
hfe
wer
(B)c
ompo
unds
than
expe
cted
ifth
efla
vorc
ompo
unds
wer
edi
stri
bute
dra
ndom
ly.
(C,D
)To
test
the
valid
ityof
the
food
pair
ing
hypo
thes
is,w
eco
nstr
uct1
0,00
0ra
ndom
reci
pes
and
calc
ulat
e∆N
s.
We
find
that
ingr
edie
ntpa
irs
inN
orth
Am
eric
ancu
isin
este
ndto
shar
em
ore
com
poun
dsw
hile
Eas
tAsi
ancu
isin
este
ndto
shar
efe
wer
com
poun
dsth
anex
pect
edin
ara
ndom
reci
peda
tase
t.(E
,F)
The
dist
ribu
tionsP
(Ns)
for
10,0
00ra
ndom
ized
reci
peda
tase
tsco
mpa
red
with
the
real
valu
esfo
rEas
tAsi
anan
dN
orth
Am
eric
ancu
isin
e.B
oth
cuis
ines
exhi
bits
igni
fican
tp-v
alue
s,as
estim
ated
usin
gaz-
test
.(G
,H)
We
enum
erat
eev
ery
poss
ible
ingr
edie
ntpa
irin
each
cuis
ine
and
show
the
frac
tion
ofpa
irs
inre
cipe
sas
afu
nctio
nof
the
num
ber
ofsh
ared
com
poun
ds.
Tore
duce
nois
e,w
eon
lyus
edda
tapo
ints
calc
ulat
edfr
omm
ore
than
5pa
irs.
Thep-
valu
esar
eca
lcul
ated
usin
gat-
test
.Nor
thA
mer
ican
cuis
ine
isbi
ased
tow
ards
pair
sw
ithm
ore
shar
edco
mpo
unds
whi
leE
astA
sian
show
sth
eop
posi
tetr
end
(see
SIfo
rde
tails
and
resu
ltsfo
rot
her
cuis
ines
).N
ote
that
we
used
the
full
netw
ork,
nott
heba
ckbo
nesh
own
inFi
g.2
toob
tain
thes
ere
sults
.(I
,J)
The
cont
ribu
tion
and
freq
uenc
yof
use
for
each
ingr
edie
ntin
Nor
thA
mer
ican
and
Eas
tAsi
ancu
isin
e.T
hesi
zeof
the
circ
les
repr
esen
tsth
ere
lativ
epr
eval
encepc i
.N
orth
Am
eric
anan
dE
ast
Asi
ancu
isin
esh
ows
the
oppo
site
tren
ds.
(K,L
)If
we
rem
ove
the
high
lyco
ntri
butin
gin
gred
ient
sse
quen
tially
(fro
mth
ela
rges
tco
ntri
butio
nin
Nor
thA
mer
ican
cuis
ine
and
from
the
smal
lest
cont
ribu
tion
inE
ast
Asi
ancu
isin
e),
the
shar
edco
mpo
unds
effe
ctqu
ickl
yva
nish
esw
hen
we
rem
oved
five
(Eas
tAsi
an)t
ofif
teen
(Nor
thA
mer
ican
)ing
redi
ents
.
17
North AmericanA Number of shared compounds
East AsianB
Co-occurrence in recipesCcorn
ginger
Southern European
Rice
East Asian
Latin American
milk
wheat
creamvanilla
egg
butter
cane molasses
Western European
North American
thyme
onion
tomato
garlic
olive oil
basil
parmesan cheese
macaroni
soy sauce
Soybean
sesame oil
scallioncayennetomato
garlic
cayenne
milk
wheat
buttervanilla
egg
Figure 4: Flavor principles. (A,B) Flavor pyramids for North American and East Asiancuisines. Each flavor pyramid shows the six most authentic ingredients (i.e. those with thelargest pci ), ingredient pairs (largest pcij), and ingredient triplets (largest pcijk). The size of thenodes reflects the abundance P c
i of the ingredient in the recipes of the particular cuisine. Eachcolor represents the category of the ingredient (see Fig. 2 for the color) and link thickness indi-cates the number of shared compounds. (C) The six most authentic ingredients and ingredientpairs used in specific regional cuisine. Node color represents cuisine and the link weight reflectsthe relative prevalence pci of the ingredient pair.
18
Supporting Online MaterialFlavor network and the principles of food pairing
by Yong-Yeol Ahn, Sebastian E. Ahnert, James P. Bagrow, Albert-Laszlo Barabasi
Table of ContentsS1 Materials and methods 2
S1.1 Flavor network . . . . . . . . . . . . . . . . . . . . . . . . . . . . . . . . . . 2S1.1.1 Ingredient-compounds bipartite network . . . . . . . . . . . . . . . . . 2S1.1.2 Incompleteness of data and the third edition . . . . . . . . . . . . . . . 4S1.1.3 Extracting the backbone . . . . . . . . . . . . . . . . . . . . . . . . . 6S1.1.4 Sociological bias . . . . . . . . . . . . . . . . . . . . . . . . . . . . . 7
S1.2 Recipes . . . . . . . . . . . . . . . . . . . . . . . . . . . . . . . . . . . . . . 7S1.2.1 Size of recipes . . . . . . . . . . . . . . . . . . . . . . . . . . . . . . . 9S1.2.2 Frequency of recipes . . . . . . . . . . . . . . . . . . . . . . . . . . . 13
S1.3 Number of shared compounds . . . . . . . . . . . . . . . . . . . . . . . . . . 14S1.4 Shared compounds hypothesis . . . . . . . . . . . . . . . . . . . . . . . . . . 14
S1.4.1 Null models . . . . . . . . . . . . . . . . . . . . . . . . . . . . . . . . 14S1.4.2 Ingredient contributions . . . . . . . . . . . . . . . . . . . . . . . . . . 18
List of Figures1 . . . . . . . . . . . . . . . . . . . . . . . . . . . . . . . . . . . . . . . . . . . 152 . . . . . . . . . . . . . . . . . . . . . . . . . . . . . . . . . . . . . . . . . . . 163 . . . . . . . . . . . . . . . . . . . . . . . . . . . . . . . . . . . . . . . . . . . 174 . . . . . . . . . . . . . . . . . . . . . . . . . . . . . . . . . . . . . . . . . . . 18S1 Full ingredient network . . . . . . . . . . . . . . . . . . . . . . . . . . . . . . 3S2 Degree distribution of flavor network . . . . . . . . . . . . . . . . . . . . . . . 3S3 Comparing the third and fifth edition of Fenaroli’s . . . . . . . . . . . . . . . . 5S4 Backbone . . . . . . . . . . . . . . . . . . . . . . . . . . . . . . . . . . . . . 6S5 Potential biases . . . . . . . . . . . . . . . . . . . . . . . . . . . . . . . . . . 8S6 Coherency of datasets . . . . . . . . . . . . . . . . . . . . . . . . . . . . . . . 11S7 Number of ingredients per recipe . . . . . . . . . . . . . . . . . . . . . . . . . 12S8 The distribution of duplicated recipes . . . . . . . . . . . . . . . . . . . . . . . 13S9 Measures . . . . . . . . . . . . . . . . . . . . . . . . . . . . . . . . . . . . . 14S10 Null models . . . . . . . . . . . . . . . . . . . . . . . . . . . . . . . . . . . . 15S11 Shared compounds and usage . . . . . . . . . . . . . . . . . . . . . . . . . . . 17
List of TablesS1 Statistics of 3rd and 5th editions . . . . . . . . . . . . . . . . . . . . . . . . . 4S2 Recipe dataset . . . . . . . . . . . . . . . . . . . . . . . . . . . . . . . . . . . 10
1
S3 Coherence of cuisines . . . . . . . . . . . . . . . . . . . . . . . . . . . . . . . 10S4 Each cuisine’s average number of ingredients per recipe . . . . . . . . . . . . . 11S5 Top contributors in North American and East Asian cuisines . . . . . . . . . . 19
S1 Materials and methods
S1.1 Flavor network
S1.1.1 Ingredient-compounds bipartite network
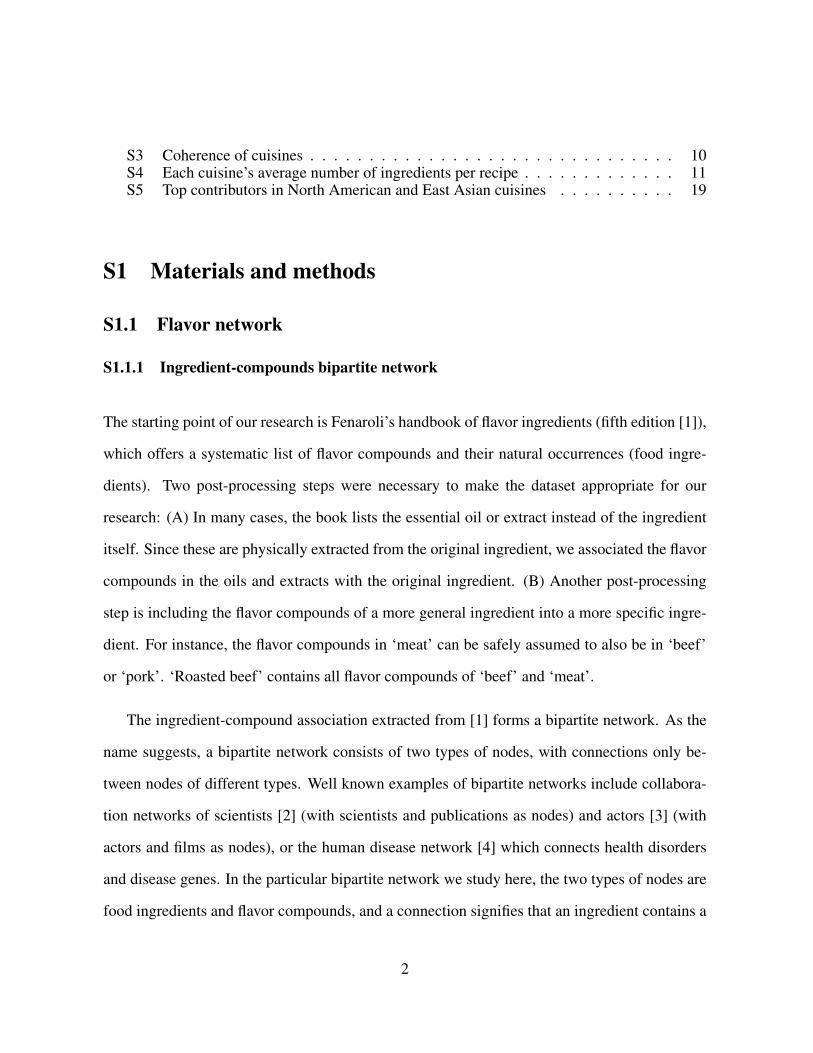
The starting point of our research is Fenaroli’s handbook of flavor ingredients (fifth edition [1]),
which offers a systematic list of flavor compounds and their natural occurrences (food ingre-
dients). Two post-processing steps were necessary to make the dataset appropriate for our
research: (A) In many cases, the book lists the essential oil or extract instead of the ingredient
itself. Since these are physically extracted from the original ingredient, we associated the flavor
compounds in the oils and extracts with the original ingredient. (B) Another post-processing
step is including the flavor compounds of a more general ingredient into a more specific ingre-
dient. For instance, the flavor compounds in ‘meat’ can be safely assumed to also be in ‘beef’
or ‘pork’. ‘Roasted beef’ contains all flavor compounds of ‘beef’ and ‘meat’.
The ingredient-compound association extracted from [1] forms a bipartite network. As the
name suggests, a bipartite network consists of two types of nodes, with connections only be-
tween nodes of different types. Well known examples of bipartite networks include collabora-
tion networks of scientists [2] (with scientists and publications as nodes) and actors [3] (with
actors and films as nodes), or the human disease network [4] which connects health disorders
and disease genes. In the particular bipartite network we study here, the two types of nodes are
food ingredients and flavor compounds, and a connection signifies that an ingredient contains a
2
compound.
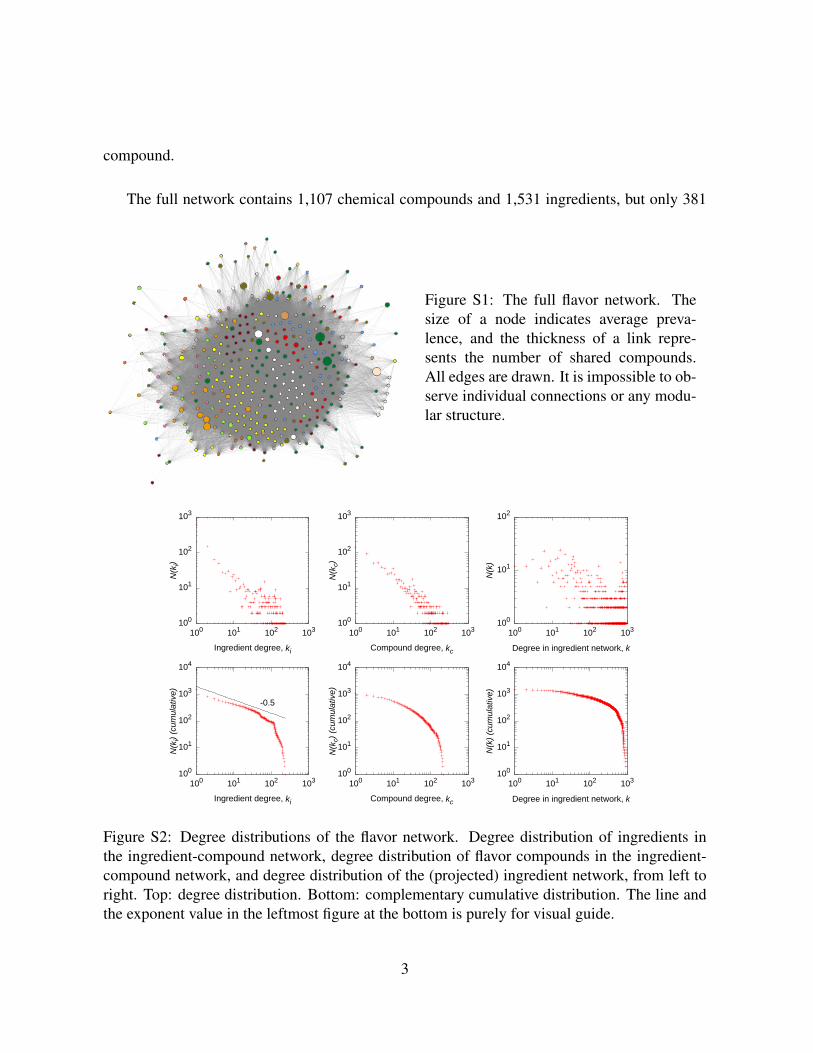
The full network contains 1,107 chemical compounds and 1,531 ingredients, but only 381
Figure S1: The full flavor network. Thesize of a node indicates average preva-lence, and the thickness of a link repre-sents the number of shared compounds.All edges are drawn. It is impossible to ob-serve individual connections or any modu-lar structure.
100
101
102
103
100 101 102 103
N(k
i)
Ingredient degree, ki
100
101
102
103
100 101 102 103
N(k
c)
Compound degree, kc
100
101
102
100 101 102 103
N(k
)
Degree in ingredient network, k
100
101
102
103
104
100 101 102 103
N(k
i) (c
umul
ativ
e)
Ingredient degree, ki
-0.5
100
101
102
103
104
100 101 102 103
N(k
c) (c
umul
ativ
e)
Compound degree, kc
100
101
102
103
104
100 101 102 103
N(k
) (cu
mul
ativ
e)
Degree in ingredient network, k
Figure S2: Degree distributions of the flavor network. Degree distribution of ingredients inthe ingredient-compound network, degree distribution of flavor compounds in the ingredient-compound network, and degree distribution of the (projected) ingredient network, from left toright. Top: degree distribution. Bottom: complementary cumulative distribution. The line andthe exponent value in the leftmost figure at the bottom is purely for visual guide.
3
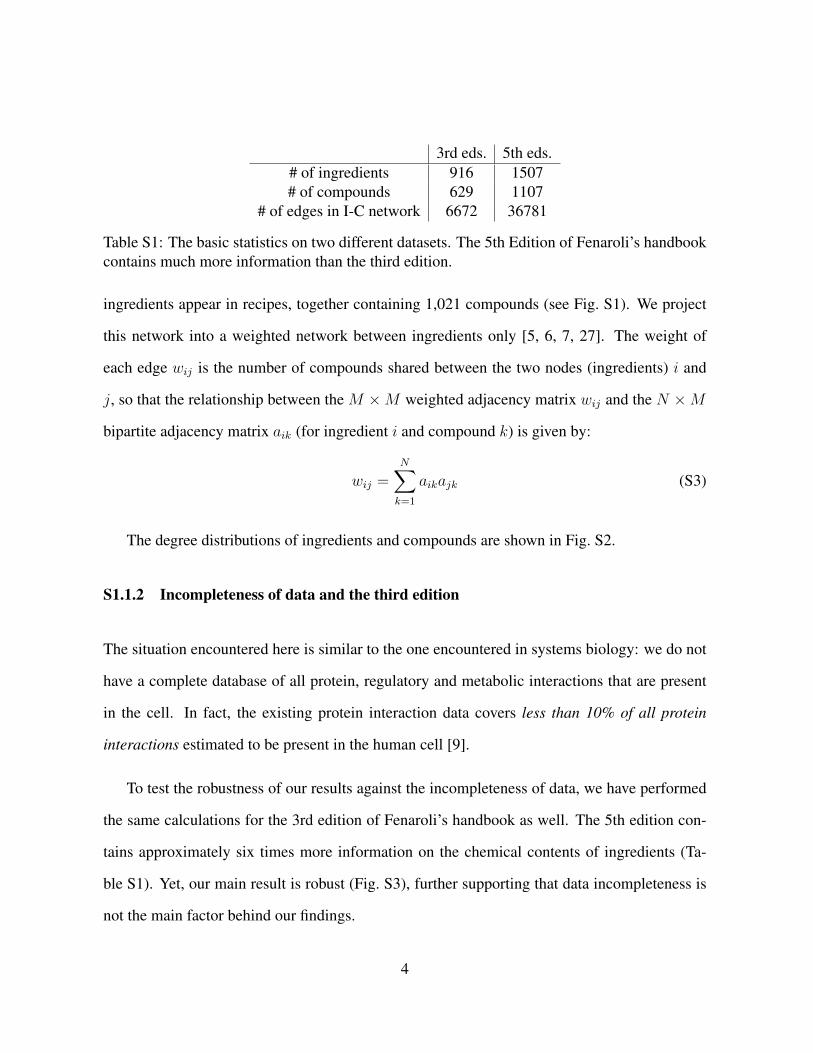
3rd eds. 5th eds.# of ingredients 916 1507# of compounds 629 1107
# of edges in I-C network 6672 36781
Table S1: The basic statistics on two different datasets. The 5th Edition of Fenaroli’s handbookcontains much more information than the third edition.
ingredients appear in recipes, together containing 1,021 compounds (see Fig. S1). We project
this network into a weighted network between ingredients only [5, 6, 7, 27]. The weight of
each edge wij is the number of compounds shared between the two nodes (ingredients) i and
j, so that the relationship between the M ×M weighted adjacency matrix wij and the N ×M
bipartite adjacency matrix aik (for ingredient i and compound k) is given by:
wij =N∑k=1
aikajk (S3)
The degree distributions of ingredients and compounds are shown in Fig. S2.
S1.1.2 Incompleteness of data and the third edition
The situation encountered here is similar to the one encountered in systems biology: we do not
have a complete database of all protein, regulatory and metabolic interactions that are present
in the cell. In fact, the existing protein interaction data covers less than 10% of all protein
interactions estimated to be present in the human cell [9].
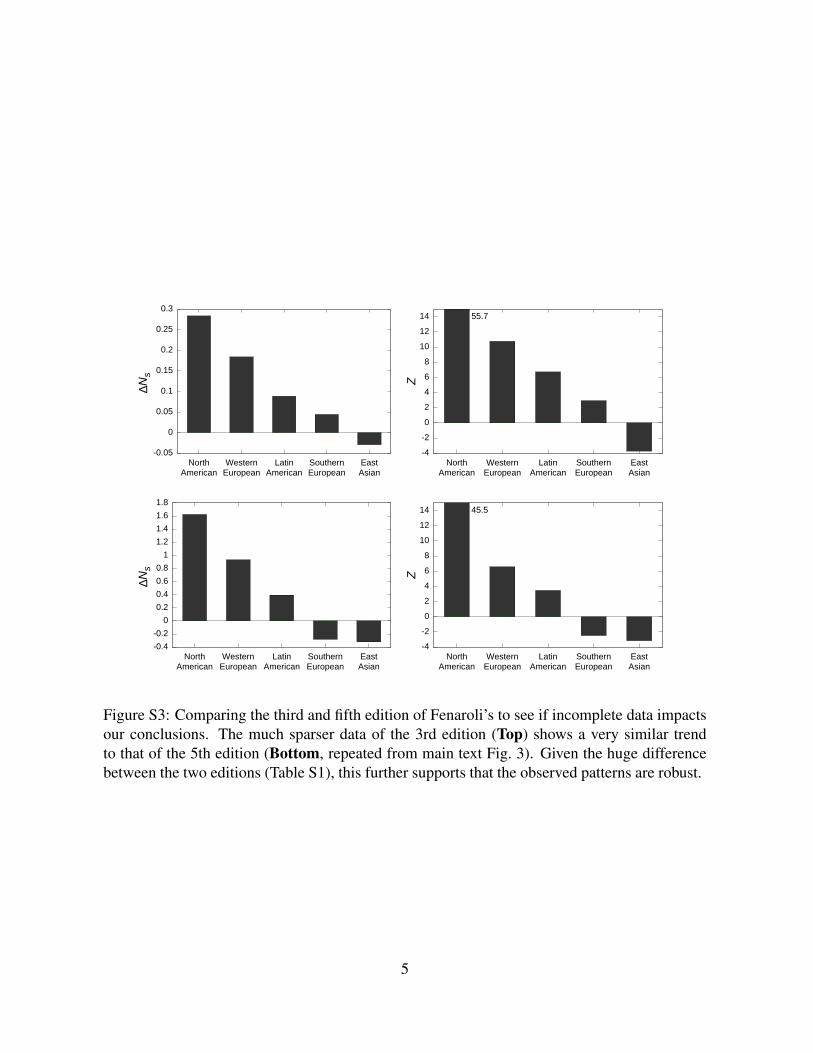
To test the robustness of our results against the incompleteness of data, we have performed
the same calculations for the 3rd edition of Fenaroli’s handbook as well. The 5th edition con-
tains approximately six times more information on the chemical contents of ingredients (Ta-
ble S1). Yet, our main result is robust (Fig. S3), further supporting that data incompleteness is
not the main factor behind our findings.
4
-0.05
0
0.05
0.1
0.15
0.2
0.25
0.3
NorthAmerican
WesternEuropean
LatinAmerican
SouthernEuropean
EastAsian
∆Ns
-4
-2
0
2
4
6
8
10
12
14
NorthAmerican
WesternEuropean
LatinAmerican
SouthernEuropean
EastAsian
Z
55.7
-0.4-0.2
00.20.40.60.8
11.21.41.61.8
NorthAmerican
WesternEuropean
LatinAmerican
SouthernEuropean
EastAsian
∆Ns
-4
-2
0
2
4
6
8
10
12
14
NorthAmerican
WesternEuropean
LatinAmerican
SouthernEuropean
EastAsian
Z
45.5
Figure S3: Comparing the third and fifth edition of Fenaroli’s to see if incomplete data impactsour conclusions. The much sparser data of the 3rd edition (Top) shows a very similar trendto that of the 5th edition (Bottom, repeated from main text Fig. 3). Given the huge differencebetween the two editions (Table S1), this further supports that the observed patterns are robust.
5
Alco
holic
drin
ks
Anim
alpr
oduc
ts
Dairy
Fruits
Herbs
Spices
Meats
Cereal
Nuts and seeds
Plants
Plant derivatives
Vegetables
Seaf
oods
Flow
ers
almond
leek
blueberrywoo
d
caviar
corn flake
fish
mandarin
bacon
lemongrass
apricot
olive
ruta
baga
herring
pear brandy
pars
nip
black pepper
kiwi
turn
ip
blue cheese
saffron
sunf
lowe
r oil
cass
ava
gree
n be
ll pe
pper
mango
cane
mol
asse
s
tom
ato
juic
e
licorice
smok
e
bell
pepp
er
gin
butterparmesan cheese
sesame seed
tarragon
salmon
macaroni
sage
currant
thyme
caca
o
carro
t
cured pork
fatty fish
anise seed
porc
ini
pork sausage
hazelnut
haddock
star anise
scallop
date
grape brandyrum
bitter orange
berry
zucc
hini
cucu
mbe
r
whole grain wheat flourbrown rice
marjoram
lettu
celim
a be
an
grilled beef
bartlett pear
woo
d sp
irit
litchi
hors
erad
ish
pean
ut o
il
ginger
bean
seed
huckleberry
cumin
lentil
bananapassion fruit
cilantro
barley
codsalmon roe
coco
a
nut
sour milkbutterfat
caps
icum
ann
uum
cash
ew
pear
ham
catfish
yogurt
root
beef liver
shiit
ake
leaf
basilparsley
tabasco pepper
mussel
black currant
camembert cheese
roas
ted
onio
nbl
ack
bean
cheddar cheese
orange
swiss cheese
fruit
rye bread
black raspberry
balm
pum
pkin
concord grapeco
ffee
pecan
juniper berry
lavender
cream
fried chicken
palm
boiled pork
roaste
d alm
ond
tulip
aspa
ragu
s
veal
cardamom
wild straw
berry
turmeric
mus
hroo
m
chicken broth
cayenne
smoked fish
sake
dill
prawn
romano cheese
man
darin
pee
l
orange flower
frankfurter
corn
brus
sels
spr
out
scal
lion
galanga
cabernet sauvignon wine
cream cheese
caraway
onio
ncele
ry o
il
endi
ve
rice bran
port wine
shrimp
walnut
peach
lambbeef broth
map
le s
yrup
soyb
ean
oil
crab
tamarind
citrusprickly pear
roaste
d pec
an
pota
to
pineapplew
atermelon
yam
muscat grape
lemon
pee
l
popcorn
jasm
ine
tea
okra
pean
ut
fennel
garlic
tom
ato
whiskey
tangerine
roquefort cheese
honey
grape juice
cider
bread
milk
cognac
yeas
t
corn grit
flower
clove
winepapaya
cinnamon
raspberryavocado
katsuobushi
kumquat
ouzo
spearmint
pepp
erm
int o
il
strawberry
plum
feta cheese
rose
melon
laur
el
bay
cauli
flowe
rca
bbag
eve
geta
ble
orange juice
pistac
hio
kohlr
abi
lemon
fenugreek
bergamot
cranberry
coco
nut
saue
rkrau
t
rhub
arb
buttermilk
lovage
roasted beef
roaste
d nut
brandy
chicken
cherry brandy
shellfish
celer
ysq
uash
apple brandyarmagnac
chervil
blackberry brandy
nutmeg
pea
mint
lemon juice
lime
oat
vege
tabl
e oi
l
malt
soyb
ean
chick
pea
oran
ge p
eel
lard
gree
n te
a
soy
sauc
e
mus
tard
quince
sherry wine
bake
d pota
to
beef pork liver
egg
tea
egg noodle
beet
beer
geranium
oyster
mutton
rosemary
chicken liver
tuna
gardenia
rye flour
lingonberry
chico
ry
potat
o chip
chive
blackberry
rape
seed
coriander
milk fat
mace
apple
pork
kale
blac
k te
a
liver
smoked salmon
beec
h
savory
grapefruit
vanilla
coco
nut o
il
fig
smoked sausage
champagne wine
roaste
d haz
elnut
chamomile
oliv
e oi
l
lime juice
roas
ted pe
anut
pepper
nectarine
cheese
buckwheat
holy basil
grape
meat
seaweed
white bread
kidney b
ean
broccoli
bone oil
sesa
me
oil
wheat bread wheat
angelica
rice
peppermint
lobster
cottage cheese
octopus
radish
watercress
squid
cereal
roas
ted se
same s
eed
anise
cherry
artichoke
oatmeal
white wine
mung bean
guava
vine
gar
violet
red wine
sturgeon caviar
clam
sherry
red kidney bean
turkey
crayfish
chayote
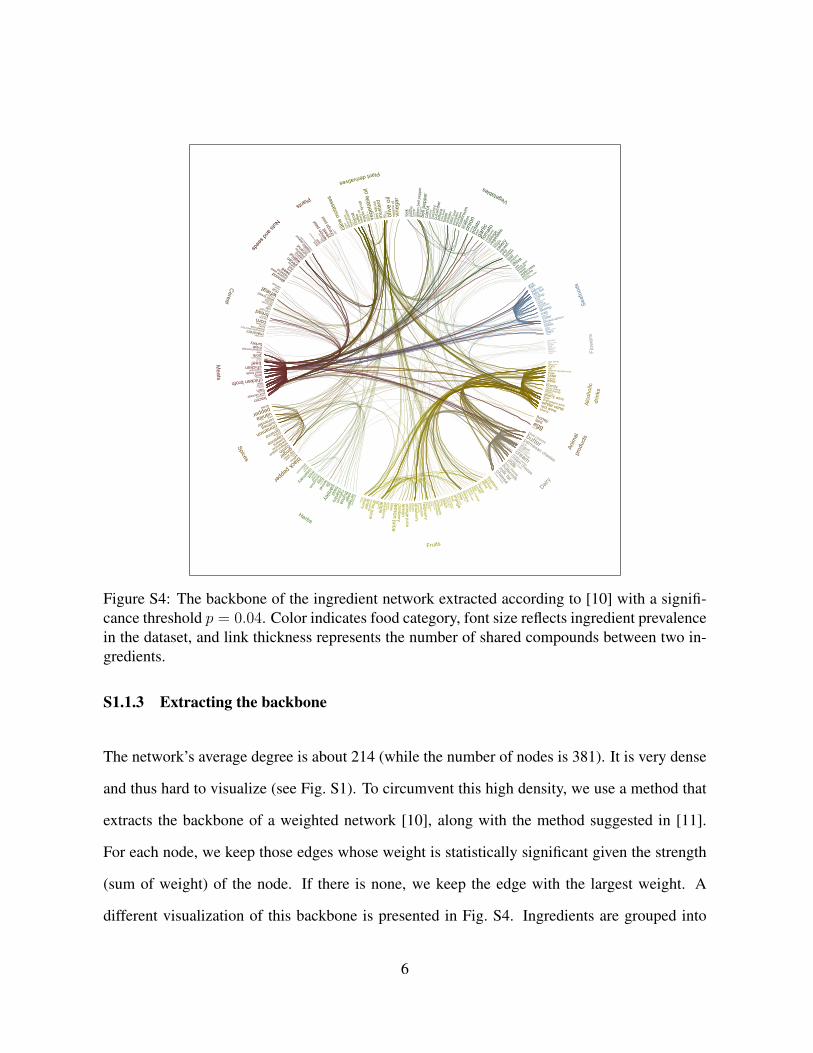
Figure S4: The backbone of the ingredient network extracted according to [10] with a signifi-cance threshold p = 0.04. Color indicates food category, font size reflects ingredient prevalencein the dataset, and link thickness represents the number of shared compounds between two in-gredients.
S1.1.3 Extracting the backbone
The network’s average degree is about 214 (while the number of nodes is 381). It is very dense
and thus hard to visualize (see Fig. S1). To circumvent this high density, we use a method that
extracts the backbone of a weighted network [10], along with the method suggested in [11].
For each node, we keep those edges whose weight is statistically significant given the strength
(sum of weight) of the node. If there is none, we keep the edge with the largest weight. A
different visualization of this backbone is presented in Fig. S4. Ingredients are grouped into
6
categories and the size of the name indicates the prevalence. This representation clearly shows
the categories that are closely connected.
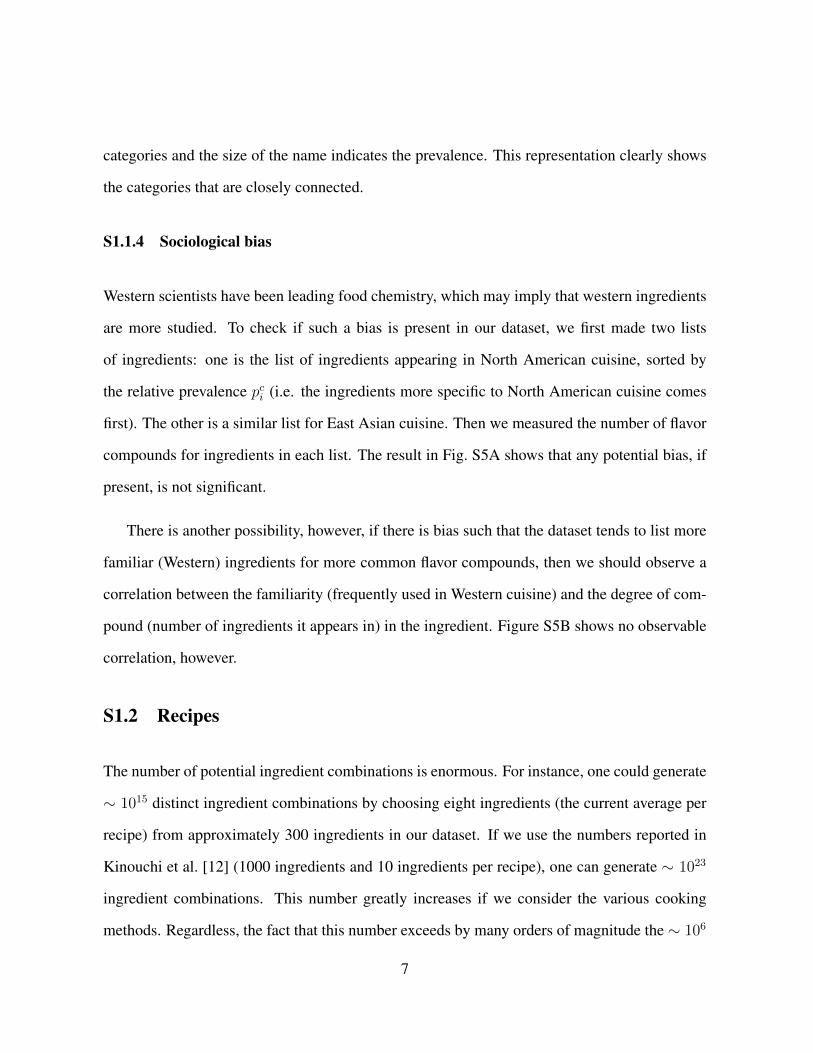
S1.1.4 Sociological bias
Western scientists have been leading food chemistry, which may imply that western ingredients
are more studied. To check if such a bias is present in our dataset, we first made two lists
of ingredients: one is the list of ingredients appearing in North American cuisine, sorted by
the relative prevalence pci (i.e. the ingredients more specific to North American cuisine comes
first). The other is a similar list for East Asian cuisine. Then we measured the number of flavor
compounds for ingredients in each list. The result in Fig. S5A shows that any potential bias, if
present, is not significant.
There is another possibility, however, if there is bias such that the dataset tends to list more
familiar (Western) ingredients for more common flavor compounds, then we should observe a
correlation between the familiarity (frequently used in Western cuisine) and the degree of com-
pound (number of ingredients it appears in) in the ingredient. Figure S5B shows no observable
correlation, however.
S1.2 Recipes
The number of potential ingredient combinations is enormous. For instance, one could generate
∼ 1015 distinct ingredient combinations by choosing eight ingredients (the current average per
recipe) from approximately 300 ingredients in our dataset. If we use the numbers reported in
Kinouchi et al. [12] (1000 ingredients and 10 ingredients per recipe), one can generate ∼ 1023
ingredient combinations. This number greatly increases if we consider the various cooking
methods. Regardless, the fact that this number exceeds by many orders of magnitude the ∼ 106
7
0
50
100
150
200
250
300
0 100 200 300
Num
ber o
f com
poun
ds
North AmericanA
B
p-value = 0.01 (*)
0
50
100
150
200
250
300
0 100 200 300
Num
ber o
f com
poun
ds
Western European
p-value = 0.07
0
50
100
150
200
250
300
0 100 200 300
Num
ber o
f com
poun
ds
Southern European
p-value = 0.23
0
50
100
150
200
250
300
0 100 200 300
Num
ber o
f com
poun
ds
Latin American
p-value = 0.04 (*)
0
50
100
150
200
250
300
0 100 200 300
Num
ber o
f com
poun
ds
East Asian
p-value = 0.12
0 50
100 150 200 250 300 350 400
0 100 200 300
Avg.
com
poun
d de
gree
Ingredient rank
p-value = 0.82
0 50
100 150 200 250 300 350 400
0 100 200 300
Avg.
com
poun
d de
gree
Ingredient rank
p-value = 0.99
0 50
100 150 200 250 300 350 400
0 100 200 300
Avg.
com
poun
d de
gree
Ingredient rank
p-value = 0.53
0 50
100 150 200 250 300 350 400
0 100 200 300
Avg.
com
poun
d de
gree
Ingredient rank
p-value = 0.50
0 50
100 150 200 250 300 350 400
0 100 200 300
Avg.
com
poun
d de
gree
Ingredient rank
p-value = 0.72
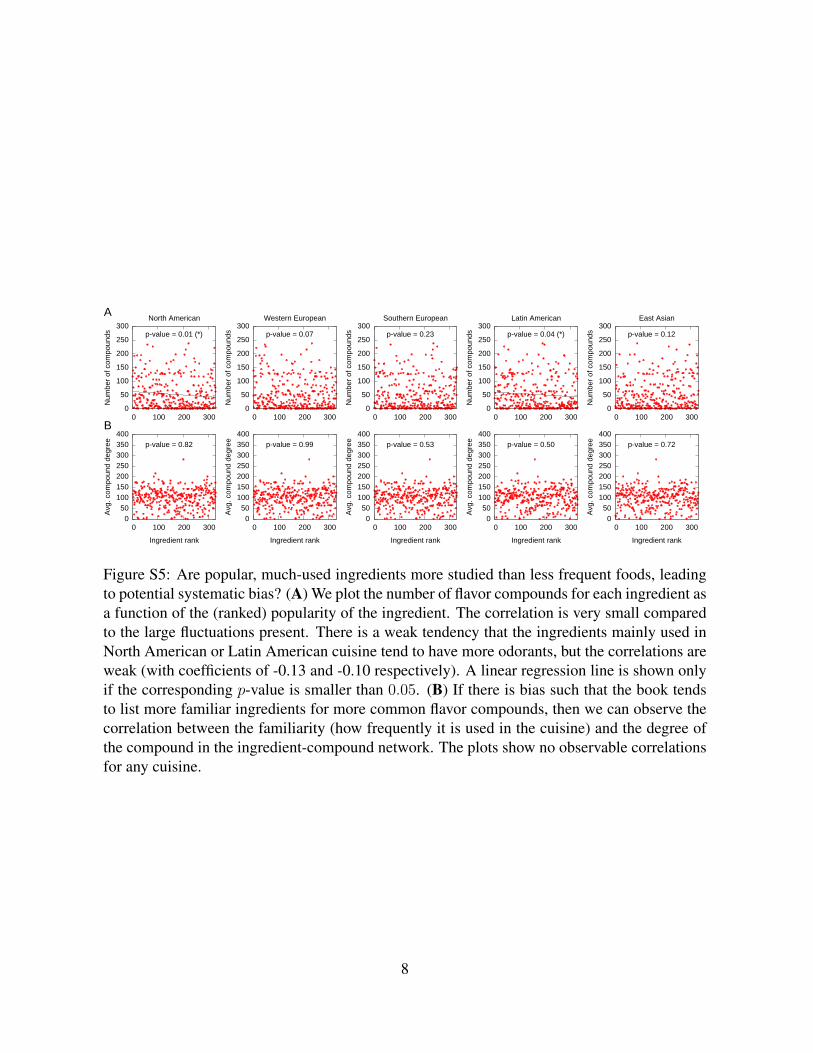
Figure S5: Are popular, much-used ingredients more studied than less frequent foods, leadingto potential systematic bias? (A) We plot the number of flavor compounds for each ingredient asa function of the (ranked) popularity of the ingredient. The correlation is very small comparedto the large fluctuations present. There is a weak tendency that the ingredients mainly used inNorth American or Latin American cuisine tend to have more odorants, but the correlations areweak (with coefficients of -0.13 and -0.10 respectively). A linear regression line is shown onlyif the corresponding p-value is smaller than 0.05. (B) If there is bias such that the book tendsto list more familiar ingredients for more common flavor compounds, then we can observe thecorrelation between the familiarity (how frequently it is used in the cuisine) and the degree ofthe compound in the ingredient-compound network. The plots show no observable correlationsfor any cuisine.
8
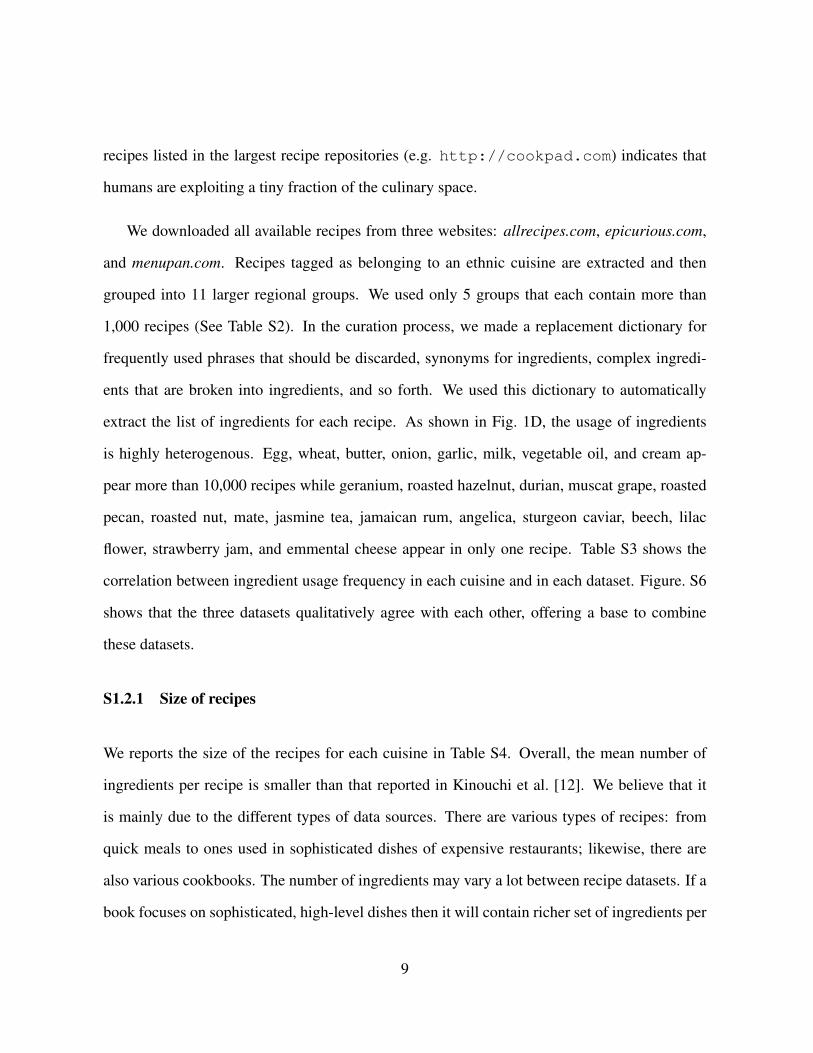
recipes listed in the largest recipe repositories (e.g. http://cookpad.com) indicates that
humans are exploiting a tiny fraction of the culinary space.
We downloaded all available recipes from three websites: allrecipes.com, epicurious.com,
and menupan.com. Recipes tagged as belonging to an ethnic cuisine are extracted and then
grouped into 11 larger regional groups. We used only 5 groups that each contain more than
1,000 recipes (See Table S2). In the curation process, we made a replacement dictionary for
frequently used phrases that should be discarded, synonyms for ingredients, complex ingredi-
ents that are broken into ingredients, and so forth. We used this dictionary to automatically
extract the list of ingredients for each recipe. As shown in Fig. 1D, the usage of ingredients
is highly heterogenous. Egg, wheat, butter, onion, garlic, milk, vegetable oil, and cream ap-
pear more than 10,000 recipes while geranium, roasted hazelnut, durian, muscat grape, roasted
pecan, roasted nut, mate, jasmine tea, jamaican rum, angelica, sturgeon caviar, beech, lilac
flower, strawberry jam, and emmental cheese appear in only one recipe. Table S3 shows the
correlation between ingredient usage frequency in each cuisine and in each dataset. Figure. S6
shows that the three datasets qualitatively agree with each other, offering a base to combine
these datasets.
S1.2.1 Size of recipes
We reports the size of the recipes for each cuisine in Table S4. Overall, the mean number of
ingredients per recipe is smaller than that reported in Kinouchi et al. [12]. We believe that it
is mainly due to the different types of data sources. There are various types of recipes: from
quick meals to ones used in sophisticated dishes of expensive restaurants; likewise, there are
also various cookbooks. The number of ingredients may vary a lot between recipe datasets. If a
book focuses on sophisticated, high-level dishes then it will contain richer set of ingredients per
9
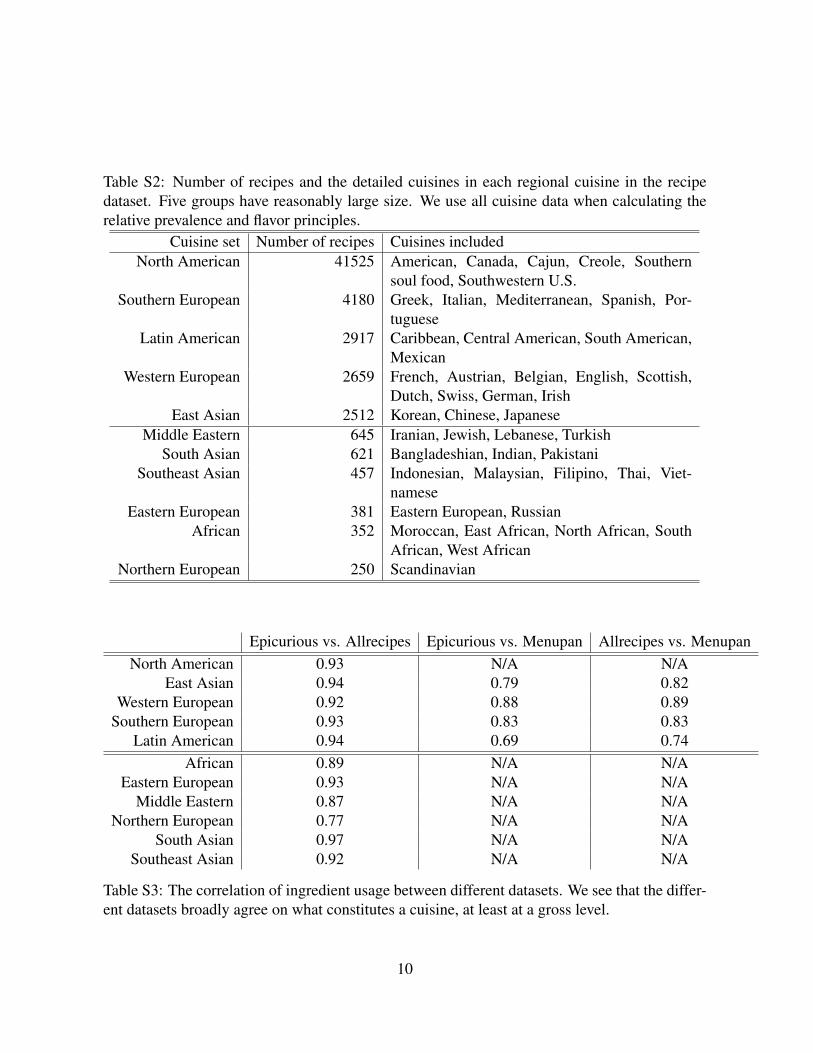
Table S2: Number of recipes and the detailed cuisines in each regional cuisine in the recipedataset. Five groups have reasonably large size. We use all cuisine data when calculating therelative prevalence and flavor principles.
Cuisine set Number of recipes Cuisines includedNorth American 41525 American, Canada, Cajun, Creole, Southern
soul food, Southwestern U.S.Southern European 4180 Greek, Italian, Mediterranean, Spanish, Por-
tugueseLatin American 2917 Caribbean, Central American, South American,
MexicanWestern European 2659 French, Austrian, Belgian, English, Scottish,
Dutch, Swiss, German, IrishEast Asian 2512 Korean, Chinese, Japanese
Middle Eastern 645 Iranian, Jewish, Lebanese, TurkishSouth Asian 621 Bangladeshian, Indian, Pakistani
Southeast Asian 457 Indonesian, Malaysian, Filipino, Thai, Viet-namese
Eastern European 381 Eastern European, RussianAfrican 352 Moroccan, East African, North African, South
African, West AfricanNorthern European 250 Scandinavian
Epicurious vs. Allrecipes Epicurious vs. Menupan Allrecipes vs. MenupanNorth American 0.93 N/A N/A
East Asian 0.94 0.79 0.82Western European 0.92 0.88 0.89
Southern European 0.93 0.83 0.83Latin American 0.94 0.69 0.74
African 0.89 N/A N/AEastern European 0.93 N/A N/A
Middle Eastern 0.87 N/A N/ANorthern European 0.77 N/A N/A
South Asian 0.97 N/A N/ASoutheast Asian 0.92 N/A N/A
Table S3: The correlation of ingredient usage between different datasets. We see that the differ-ent datasets broadly agree on what constitutes a cuisine, at least at a gross level.
10
-1
0
1
2
EastAsian
SouthernEuropean
LatinAmerican
WesternEuropean
NorthAmerican
Nsre
al -
Nsra
ndEpicuriousAllrecipesMenupan (Korean)
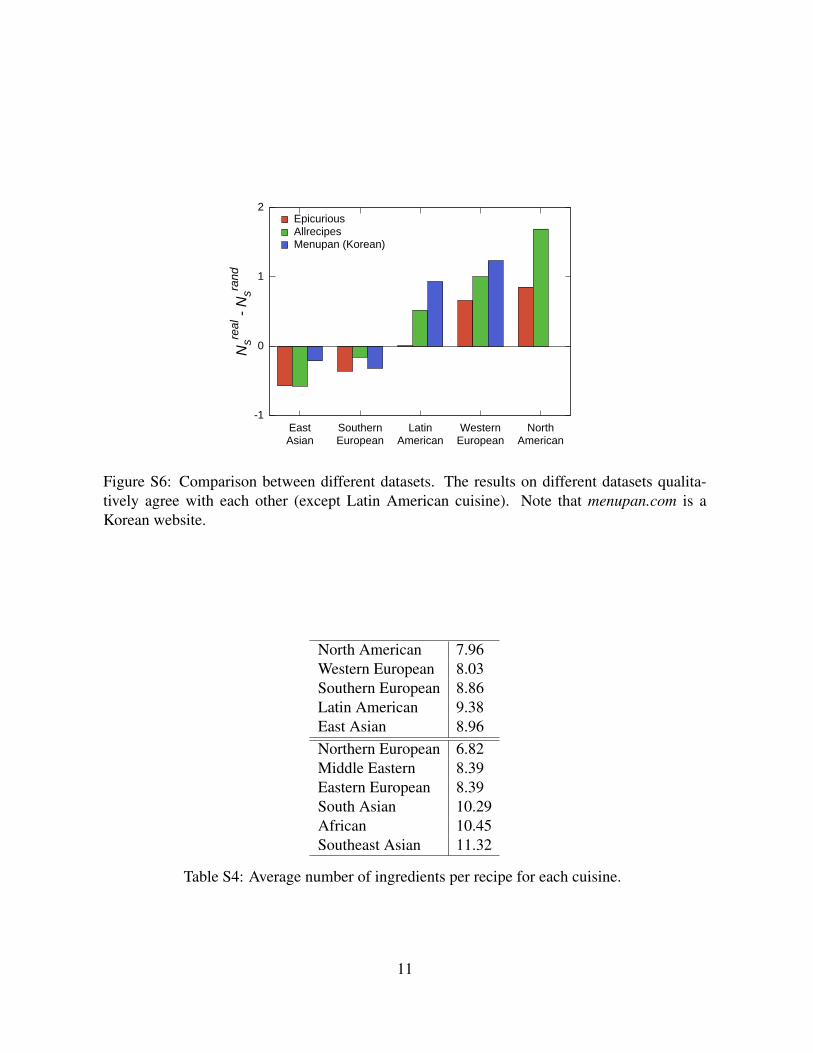
Figure S6: Comparison between different datasets. The results on different datasets qualita-tively agree with each other (except Latin American cuisine). Note that menupan.com is aKorean website.
North American 7.96Western European 8.03Southern European 8.86Latin American 9.38East Asian 8.96Northern European 6.82Middle Eastern 8.39Eastern European 8.39South Asian 10.29African 10.45Southeast Asian 11.32
Table S4: Average number of ingredients per recipe for each cuisine.
11
recipe; if a book focuses on simple home cooking recipes, then the book will contain fewer in-
gredients per recipe. We believe that the online databases are close to the latter; simpler recipes
are likely to dominate the database because anyone can upload their own recipes. By contrast,
we expect that the cookbooks, especially the canonical ones, contain more sophisticated and
polished recipes, which thus are more likely to contain more ingredients.
Also, the pattern reported in Kinouchi et al. [12] is reversed in our dataset: Western Euro-
pean cuisine has 8.03 ingredients per recipe while Latin American cuisine has 9.38 ingredients
per recipe. Therefore, we believe that there is no clear tendency of the number of ingredients
per recipe between Western European and Latin American cuisine.
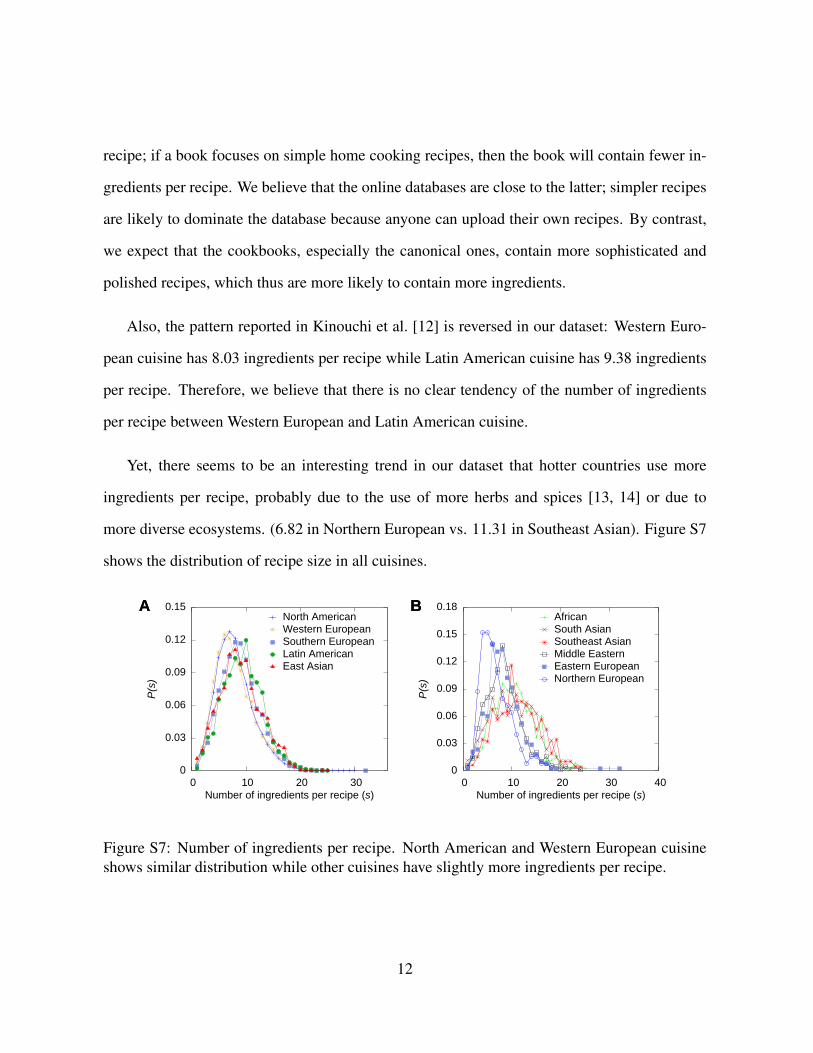
Yet, there seems to be an interesting trend in our dataset that hotter countries use more
ingredients per recipe, probably due to the use of more herbs and spices [13, 14] or due to
more diverse ecosystems. (6.82 in Northern European vs. 11.31 in Southeast Asian). Figure S7
shows the distribution of recipe size in all cuisines.
0
0.03
0.06
0.09
0.12
0.15
0 10 20 30
P(s
)
Number of ingredients per recipe (s)
A BNorth AmericanWestern EuropeanSouthern EuropeanLatin AmericanEast Asian
0
0.03
0.06
0.09
0.12
0.15
0.18
0 10 20 30 40
P(s
)
Number of ingredients per recipe (s)
A BAfricanSouth AsianSoutheast AsianMiddle EasternEastern EuropeanNorthern European
Figure S7: Number of ingredients per recipe. North American and Western European cuisineshows similar distribution while other cuisines have slightly more ingredients per recipe.
12
1
10
100
1000
10000
100000
1 10 100
Num
ber o
f rec
ipes
with
D d
uplic
ates
Number of duplicates, D
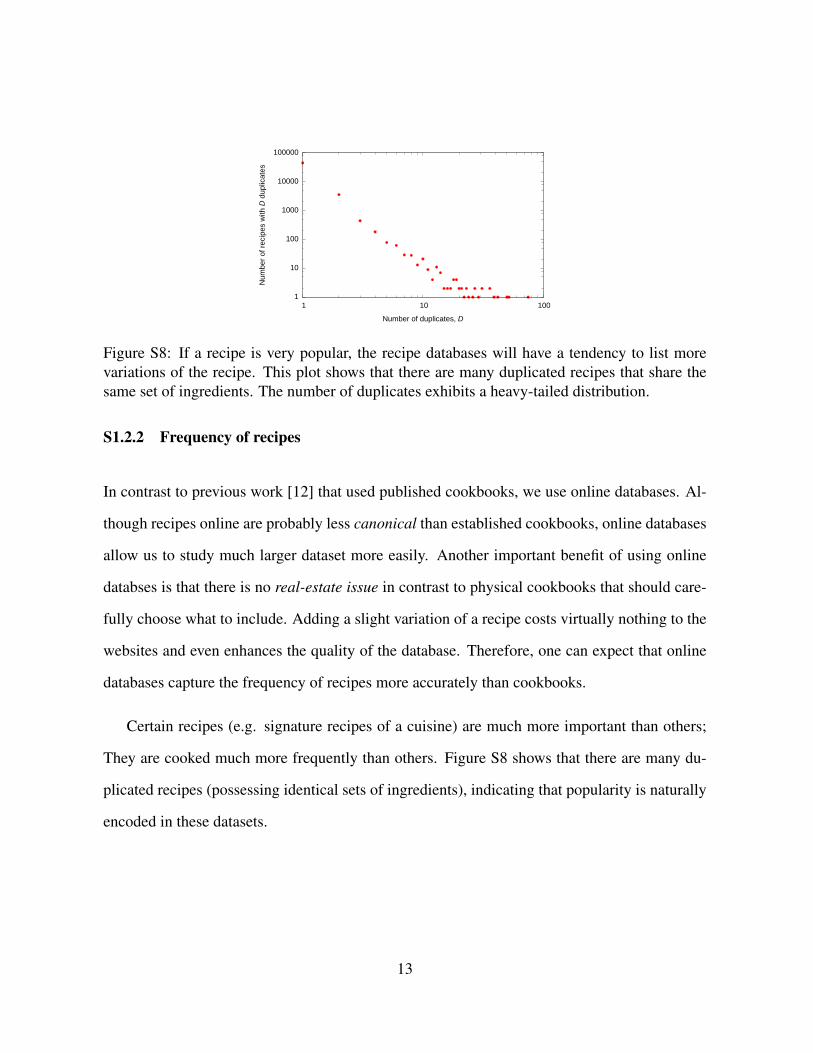
Figure S8: If a recipe is very popular, the recipe databases will have a tendency to list morevariations of the recipe. This plot shows that there are many duplicated recipes that share thesame set of ingredients. The number of duplicates exhibits a heavy-tailed distribution.
S1.2.2 Frequency of recipes
In contrast to previous work [12] that used published cookbooks, we use online databases. Al-
though recipes online are probably less canonical than established cookbooks, online databases
allow us to study much larger dataset more easily. Another important benefit of using online
databses is that there is no real-estate issue in contrast to physical cookbooks that should care-
fully choose what to include. Adding a slight variation of a recipe costs virtually nothing to the
websites and even enhances the quality of the database. Therefore, one can expect that online
databases capture the frequency of recipes more accurately than cookbooks.
Certain recipes (e.g. signature recipes of a cuisine) are much more important than others;
They are cooked much more frequently than others. Figure S8 shows that there are many du-
plicated recipes (possessing identical sets of ingredients), indicating that popularity is naturally
encoded in these datasets.
13
S1.3 Number of shared compounds
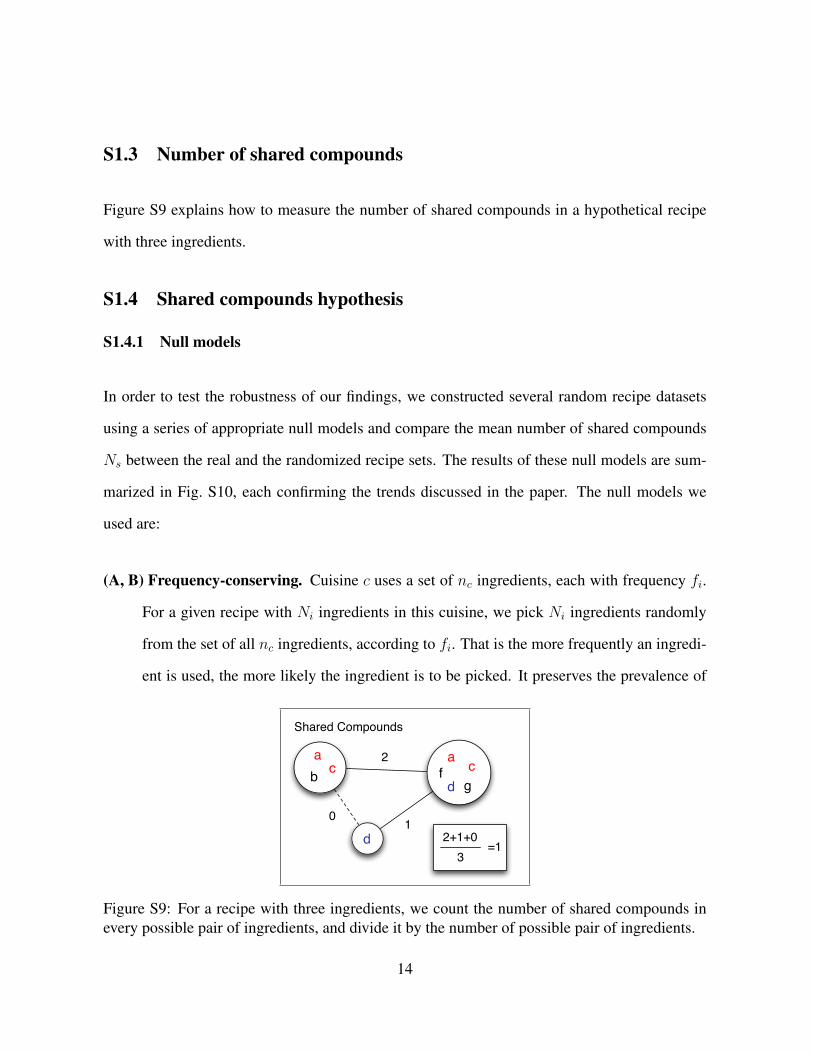
Figure S9 explains how to measure the number of shared compounds in a hypothetical recipe
with three ingredients.
S1.4 Shared compounds hypothesis
S1.4.1 Null models
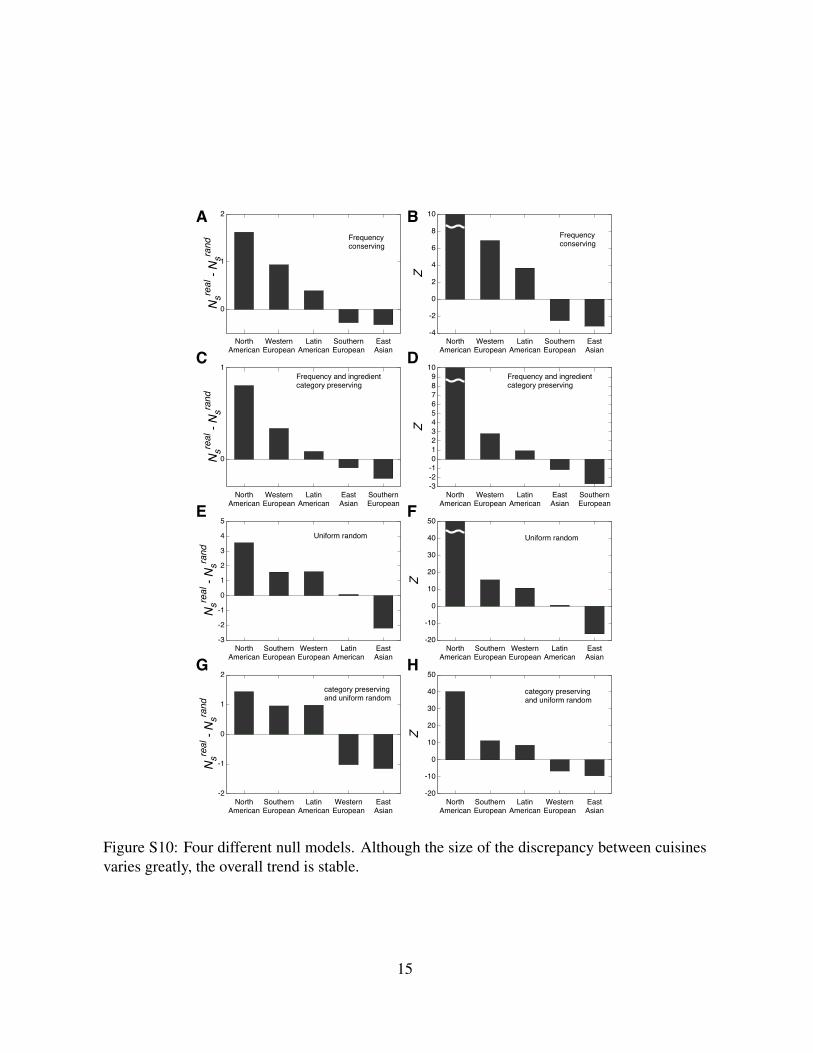
In order to test the robustness of our findings, we constructed several random recipe datasets
using a series of appropriate null models and compare the mean number of shared compounds
Ns between the real and the randomized recipe sets. The results of these null models are sum-
marized in Fig. S10, each confirming the trends discussed in the paper. The null models we
used are:
(A, B) Frequency-conserving. Cuisine c uses a set of nc ingredients, each with frequency fi.
For a given recipe with Ni ingredients in this cuisine, we pick Ni ingredients randomly
from the set of all nc ingredients, according to fi. That is the more frequently an ingredi-
ent is used, the more likely the ingredient is to be picked. It preserves the prevalence of
Shared Compounds
ab
a cd
d
c fg
2
102+1+0
3=1
Binary
ab
a cd
d
c fg
1
10
1+1+03
=0.67
Jaccard
ab
a cd
d
c fg
2/6
1/50
1/3 + 1/53
=0.18
Figure S9: For a recipe with three ingredients, we count the number of shared compounds inevery possible pair of ingredients, and divide it by the number of possible pair of ingredients.
14
0
1
2
NorthAmerican
WesternEuropean
LatinAmerican
SouthernEuropean
EastAsian
Nsre
al -
Nsra
ndA B
C D
E F
G H
Frequencyconserving
-4
-2
0
2
4
6
8
10
NorthAmerican
WesternEuropean
LatinAmerican
SouthernEuropean
EastAsian
Z
Frequencyconserving
0
1
NorthAmerican
WesternEuropean
LatinAmerican
EastAsian
SouthernEuropean
Nsre
al -
Nsra
nd
Frequency and ingredientcategory preserving
-3-2-10123456789
10
NorthAmerican
WesternEuropean
LatinAmerican
EastAsian
SouthernEuropean
Z
Frequency and ingredientcategory preserving
-3
-2
-1
0
1
2
3
4
5
NorthAmerican
SouthernEuropean
WesternEuropean
LatinAmerican
EastAsian
Nsre
al -
Nsra
nd
Uniform random
-20
-10
0
10
20
30
40
50
NorthAmerican
SouthernEuropean
WesternEuropean
LatinAmerican
EastAsian
Z
Uniform random
-2
-1
0
1
2
NorthAmerican
SouthernEuropean
LatinAmerican
WesternEuropean
EastAsian
Nsre
al -
Nsra
nd
category preservingand uniform random
-20
-10
0
10
20
30
40
50
NorthAmerican
SouthernEuropean
LatinAmerican
WesternEuropean
EastAsian
Z
category preservingand uniform random
Figure S10: Four different null models. Although the size of the discrepancy between cuisinesvaries greatly, the overall trend is stable.
15

each ingredient. This is the null model presented in the main text.
(C, D) Frequency and ingredient category preserving. With this null model, we conserve
the category (meats, fruits, etc) of each ingredient in the recipe, and when sample ran-
dom ingredients proportional to the prevalence. For instance, a random realization of a
recipe with beef and onion will contain a meat and a vegetable. The probability to pick
an ingredient is proportional to the prevalence of the ingredient in the cuisine.
(E, F) Uniform random. We build a random recipe by randomly choosing an ingredient that
is used at least once in the particular cuisine. Even very rare ingredients will frequently
appear in random recipes.
(G, H) Uniform random, ingredient category preserving. For each recipe, we preserve the
category of each ingredient, but not considering frequency of ingredients.
Although these null models greatly change the frequency and type of ingredients in the
random recipes, North American and East Asian recipes show a robust pattern: North American
recipes always share more flavor compounds than expected and East Asian recipes always share
less flavor compounds than expected. This, together with the existence of both positive and
negative N reals −N rand
s in every null model, indicates that the patterns we find are not due to a
poorly selected null models.
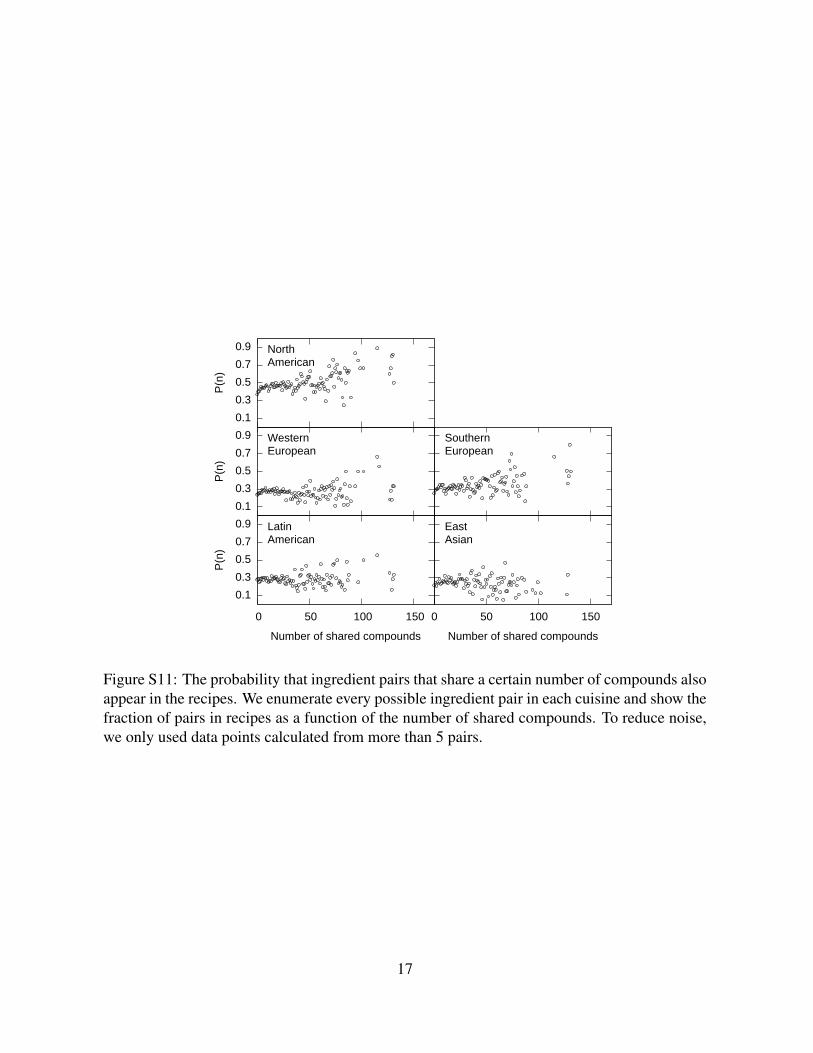
Finally, Fig. S11 shows the probability that a given pair with certain number of shared
compounds will appear in the recipes, representing the raw data behind the generalized food-
pairing hypothesis discussed in the text. To reduce noise, we only consider Ns where there are
more than five ingredient pairs.
16
0.1 0.3 0.5 0.7 0.9
0 50 100 150
P(n)
Number of shared compounds
LatinAmerican
0.1 0.3 0.5 0.7 0.9
P(n)
WesternEuropean
0.1 0.3 0.5 0.7 0.9
P(n)
NorthAmerican
0 50 100 150
Number of shared compounds
EastAsian
SouthernEuropean
Figure S11: The probability that ingredient pairs that share a certain number of compounds alsoappear in the recipes. We enumerate every possible ingredient pair in each cuisine and show thefraction of pairs in recipes as a function of the number of shared compounds. To reduce noise,we only used data points calculated from more than 5 pairs.
17
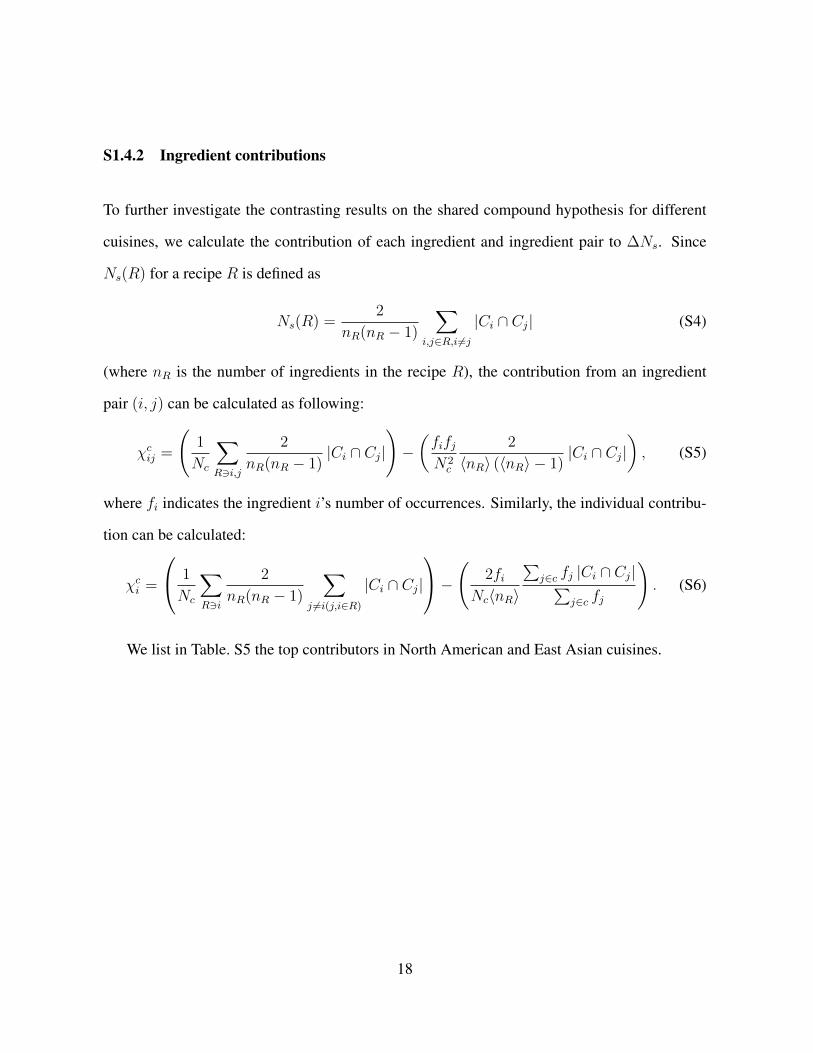
S1.4.2 Ingredient contributions
To further investigate the contrasting results on the shared compound hypothesis for different
cuisines, we calculate the contribution of each ingredient and ingredient pair to ∆Ns. Since
Ns(R) for a recipe R is defined as
Ns(R) =2
nR(nR − 1)
∑i,j∈R,i 6=j
|Ci ∩ Cj| (S4)
(where nR is the number of ingredients in the recipe R), the contribution from an ingredient
pair (i, j) can be calculated as following:
χcij =
(1
Nc
∑R3i,j
2
nR(nR − 1)|Ci ∩ Cj|
)−(fifjN2
c
2
〈nR〉 (〈nR〉 − 1)|Ci ∩ Cj|
), (S5)
where fi indicates the ingredient i’s number of occurrences. Similarly, the individual contribu-
tion can be calculated:
χci =
1
Nc
∑R3i
2
nR(nR − 1)
∑j 6=i(j,i∈R)
|Ci ∩ Cj|
−( 2fiNc〈nR〉
∑j∈c fj |Ci ∩ Cj|∑
j∈c fj
). (S6)
We list in Table. S5 the top contributors in North American and East Asian cuisines.
18
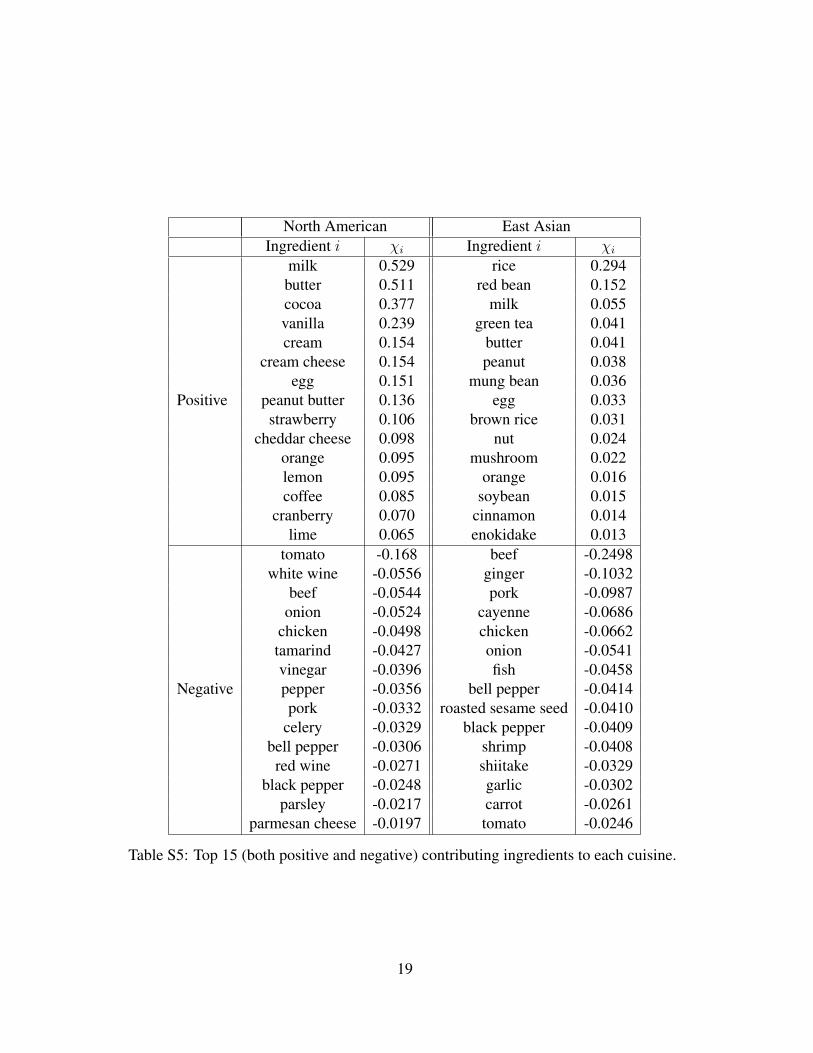
North American East AsianIngredient i χi Ingredient i χi
Positive
milk 0.529 rice 0.294butter 0.511 red bean 0.152cocoa 0.377 milk 0.055vanilla 0.239 green tea 0.041cream 0.154 butter 0.041
cream cheese 0.154 peanut 0.038egg 0.151 mung bean 0.036
peanut butter 0.136 egg 0.033strawberry 0.106 brown rice 0.031
cheddar cheese 0.098 nut 0.024orange 0.095 mushroom 0.022lemon 0.095 orange 0.016coffee 0.085 soybean 0.015
cranberry 0.070 cinnamon 0.014lime 0.065 enokidake 0.013
Negative
tomato -0.168 beef -0.2498white wine -0.0556 ginger -0.1032
beef -0.0544 pork -0.0987onion -0.0524 cayenne -0.0686
chicken -0.0498 chicken -0.0662tamarind -0.0427 onion -0.0541vinegar -0.0396 fish -0.0458pepper -0.0356 bell pepper -0.0414pork -0.0332 roasted sesame seed -0.0410
celery -0.0329 black pepper -0.0409bell pepper -0.0306 shrimp -0.0408red wine -0.0271 shiitake -0.0329
black pepper -0.0248 garlic -0.0302parsley -0.0217 carrot -0.0261
parmesan cheese -0.0197 tomato -0.0246
Table S5: Top 15 (both positive and negative) contributing ingredients to each cuisine.
19
References
[1] Burdock, G. A. Fenaroli’s handbook of flavor ingredients (CRC Press, 2004), 5th edn.
[2] Newman, M. E. J. The structure of scientific collaboration networks. Proc. Natl. Acad.
Sci. USA 98, 404 (2001).
[3] Watts, D. J. & Strogatz, S. H. Collective dynamics of ‘small-world’ networks. Natue 393,
440 (1998).
[4] Goh, K.-I. et al. The human disease network. Proc. Natl. Acad. Sci. USA 104, 8685
(2007).
[5] Newman, M. E. J., Barabasi, A.-L. & Watts, D. J. The structure and dynamics of networks:
(Princeton University Press, 2006).
[6] Caldarelli, G. Scale-free networks: complex webs in nature and technology (Oxford Uni-
versity Press, USA, 2007).
[7] Dorogovtsev, S. N. & Mendes, J. F. F. Evolution of networks: from biological nets to the
internet and WWW (Oxford University Press, USA, 2003).
[8] Barrat, A., Barthelemy, M., Pastor-Satorras, R. & Vespignani, A. The architecture of
complex weighted networks. Proc. Nat. Acad. Sci. 111, 3747 (2004).
[9] Venkatesan, K. et al. An empirical framework for binary interactome mapping. Nature
Methods 6, 83–90 (2009).
[10] Serrano, M. A., Boguna, M. & Vespignani, A. Extracting the multiscale backbone of
complex weighted networks. Proceedings of the National Academy of Sciences 106, 6483–
6488 (2009).
20
[11] Lee, S. H., Kim, P.-J., Ahn, Y.-Y. & Jeong, H. Googling social interactions: web search
engine based social network construction. PLoS One 5, e11233 (2010).
[12] Kinouchi, O., Diez-Garcia, R. W., Holanda, A. J., Zambianchi, P. & Roque, A. C. The
non-equilibrium nature of culinary evolution. New Journal of Physics 10, 073020 (2008).
[13] Billing, J. & Sherman, P. W. Antimicrobial functions of spices: why some like it hot. The
Quarterly Review of Biology 73, 3–49 (1998).
[14] Sherman, P. W. & Hash, G. A. Why vegetable recipes are not very spicy. Evolution and
Human Behavior 22, 147–163 (2001).
21