Flavonoid Intake in European Adults (18 to 64 Years)
24
Flavonoid intake in European adults (18 to 64 years) Article Published Version Creative Commons: Attribution 3.0 (CC-BY) Open Access Vogiatzoglou, A., Mulligan, A. A., Lentjes, M. A. H., Luben, R. N., Spencer, J. P. E., Schroeter, H., Khaw, K.-T. and Kuhnle, G. G. C. (2015) Flavonoid intake in European adults (18 to 64 years). PLoS ONE. e0128132. ISSN 1932-6203 doi: https://doi.org/10.1371/journal.pone.0128132 Available at https://centaur.reading.ac.uk/40348/ It is advisable to refer to the publisher’s version if you intend to cite from the work. See Guidance on citing . Published version at: http://journals.plos.org/plosone/article?id=10.1371/journal.pone.0128132 To link to this article DOI: http://dx.doi.org/10.1371/journal.pone.0128132 Publisher: PLOS All outputs in CentAUR are protected by Intellectual Property Rights law, including copyright law. Copyright and IPR is retained by the creators or other copyright holders. Terms and conditions for use of this material are defined in the End User Agreement . www.reading.ac.uk/centaur CentAUR Central Archive at the University of Reading
Transcript of Flavonoid Intake in European Adults (18 to 64 Years)
Flavonoid intake in European adults (18 to64 years) Article
Published Version
Creative Commons: Attribution 3.0 (CC-BY)
Open Access
Vogiatzoglou, A., Mulligan, A. A., Lentjes, M. A. H., Luben, R. N., Spencer, J. P. E., Schroeter, H., Khaw, K.-T. and Kuhnle, G.G. C. (2015) Flavonoid intake in European adults (18 to 64 years). PLoS ONE. e0128132. ISSN 1932-6203 doi: https://doi.org/10.1371/journal.pone.0128132 Available at https://centaur.reading.ac.uk/40348/
It is advisable to refer to the publisher’s version if you intend to cite from the work. See Guidance on citing .Published version at: http:// journals.plos.org/plosone/article?id=10.1371/journal.pone.0128132 To link to this article DOI: http://dx.doi.org/10.1371/journal.pone.0128132
Publisher: PLOS
All outputs in CentAUR are protected by Intellectual Property Rights law, including copyright law. Copyright and IPR is retained by the creators or other copyright holders. Terms and conditions for use of this material are defined in the End User Agreement .
www.reading.ac.uk/centaur
CentAUR
Central Archive at the University of Reading

Reading’s research outputs online
RESEARCH ARTICLE
Flavonoid Intake in European Adults (18 to64 Years)Anna Vogiatzoglou1, Angela A. Mulligan2, Marleen A. H. Lentjes2, Robert N. Luben2,Jeremy P. E. Spencer1, Hagen Schroeter3, Kay-Tee Khaw4, Gunter G. C. Kuhnle1,2*
1 Department of Food & Nutritional Sciences, University of Reading, Reading, United Kingdom,2 Department of Public Health and Primary Care, University of Cambridge, Cambridge, United Kingdom,3 Mars, Inc., McLean, VA, 22101, United States of America, 4 University of Cambridge, School of ClinicalMedicine, Clinical Gerontology Unit, Cambridge, United Kingdom
Abstract
Background
Flavonoids are a group of phenolic secondary plant metabolites that are ubiquitous in plant-
based diets. Data from anthropological, observational and intervention studies have shown
that many flavonoids are bioactive. For this reason, there is an increasing interest in investi-
gating the potential health effects of these compounds. The translation of these findings into
the context of the health of the general public requires detailed information on habitual die-
tary intake. However, only limited data are currently available for European populations.
Objective
The objective of this study is to determine the habitual intake and main sources of anthocya-
nidins, flavanols, flavanones, flavones, flavonols, proanthocyanidins, theaflavins and thear-
ubigins in the European Union.
Design
We use food consumption data from the European Food Safety Authority (EFSA) and the
FLAVIOLA Food Composition Database to estimate intake of flavonoids.
Results
Mean (±SEM) intake of total flavonoids in Europe was 428±49 mg/d, of which 136±14 mg/d
were monomeric compounds. Gallated flavan-3-ols (53±12 mg/d) were the main contribu-
tor. The lowest flavonoid intake was observed in Mediterranean countries (monomeric com-
pounds: 95±11 mg/d). The distribution of intake was skewed in many countries, especially
in Germany (monomeric flavonoids; mean intake: 181 mg/d; median intake: 3 mg/d).
Conclusions
The habitual intake of flavonoids in Europe is below the amounts found to have a significant
health effect.
PLOS ONE | DOI:10.1371/journal.pone.0128132 May 26, 2015 1 / 22
a11111
OPEN ACCESS
Citation: Vogiatzoglou A, Mulligan AA, Lentjes MAH,Luben RN, Spencer JPE, Schroeter H, et al. (2015)Flavonoid Intake in European Adults (18 to 64 Years).PLoS ONE 10(5): e0128132. doi:10.1371/journal.pone.0128132
Academic Editor: Dong Wang, Harbin MedicalUniversity, CHINA
Received: March 2, 2015
Accepted: April 23, 2015
Published: May 26, 2015
Copyright: © 2015 Vogiatzoglou et al. This is anopen access article distributed under the terms of theCreative Commons Attribution License, which permitsunrestricted use, distribution, and reproduction in anymedium, provided the original author and source arecredited.
Data Availability Statement: All relevant data arewithin the paper and its Supporting Information files.
Funding: This project was supported by theEuropean Union (grant 226588, “Flaviola”). Mars,Inc., a member of the FLAVIOLA researchconsortium, provided support in the form of salariesfor author HS, but did not have any additional role inthe study design, data collection and analysis,decision to publish, or preparation of the manuscript.The specific roles of this author is articulated in the‘author contributions’ section.
IntroductionFlavonoids are a group of secondary plant metabolites, derived from 2-phenylchroman, whichare ubiquitous in seed plants (spermatophytes) and therefore found in most plant-based foods[1]. They exist both in monomeric (e.g. flavanols or anthocyanidins), and in polymeric form(e.g. proanthocyanidins, theaflavins and thearubigins). Flavonoids have a wide range of biolog-ical function in plants [2], such as the protection from UV radiation and as signalling mole-cules for interaction with microbes [3]. Flavonoid-containing plants have also a long history ofmedicinal use: for example the catechin-monomer rich extract of Acacia, catechu, has been de-scribed as astringent in European pharmacopoeias since almost 400 years [4], and has alsobeen recommended to treat heart diseases [5]. In the 20th century, flavonoids were briefly con-sidered to be a vitamin affecting capillary permeability [6], although it emerged quickly thatthese compounds are not an essential dietary factor [7]. However, based on these observations,flavonoid-containing drugs have been used extensively not only to treat disorders of the pe-ripheral circulation, but also to treat radiation poisoning, intoxications and liver diseases [8].
In recent decades, there has been increasing interest in the potential beneficial effect of ha-bitual flavonoid consumption on human health. Data from anthropological research [9] andobservational studies [10, 11] suggested that they can reduce the risk of cardio-vascular diseases(CVD) although results from more recent studies have been less clear [12–15]. Due to theirability to scavenge free radicals in vitro they have often been described as antioxidants althoughit has been shown that this is an unlikely explanation for their activity in vivo [16]. A recentmeta-analysis of observational epidemiological studies suggested an overall beneficial effect offlavonoid intake [17], however, the data available are more ambiguous. McCullough et al. findthe main beneficial effect emerge when comparing very low intake with low intake [13] andthis can be observed in other studies [12, 14]. While this could be explained by a threshold ef-fect, there are also alternative explanations such as differences in dietary composition [15] orother unknown confounding factors. It is therefore not possible to attribute the observed effectto flavonoid intake alone. There are also no consistent associations between flavonoid intakeand cancer risk. A recent meta-analysis showed no beneficial association between flavonoid in-take and breast cancer risk [18] or gastric cancers [19], while there was a beneficial effect withsmoking-related lung cancer [20] although only in some populations [21]. As with cardiovas-cular diseases, the main beneficial effect is often found when comparing very low with low in-takes [22]. This is in marked contrast to results from a recent study investigating associationsbetween flavonoid intake and the risk of type 2 diabetes in the EPIC cohort [23]: in this study,higher intake is associated with lower risk at least for some compounds, and the analyses showstatistically significant trends.
While considerable attention has been focused on the beneficial health effects of flavonoids,excessive intake can also result in significant adverse effects [24], however there is a paucity ofdata on safety. Adverse affects range from mild gastro-intestinal symptoms to severe condi-tions such as haemolytic anaemia. Although flavonoids have been used as hepatoprotectivedrugs, flavonoids—and in particular gallated compounds found in green tea [25]—have beenassociated with increased risk of hepatotoxicity [24]. Flavonoid consumption has also beenlinked to haemolytic anaemia, and while this is best documented for (+)-catechin containingdrugs [8], it is documented for other flavonoids as well [26, 27]. Flavonoids can also interactwith cell proliferation by inhibiting topoisomerase 2 [28] and this can have both, a pro- and ananti-carcinogenic effect; some epidemiological data suggest an increased risk of leukaemia inneonates following high intake of bioflavonoids by mothers [29, 30]. Furthermore, the exten-sive hepatic metabolism of flavonoids can result in extensive flavonoid-drug interactions, espe-cially as flavonoids can induce and inhibit cytochrome P450 enzymes [31].
Flavonoid Intake in European Adults
PLOS ONE | DOI:10.1371/journal.pone.0128132 May 26, 2015 2 / 22
Competing Interests: HS is employed by MARS,Inc., a member of the FLAVIOLA researchconsortium and a company engaged in flavanolresearch and flavanol-related commercial activities.This does not alter the authors' adherence to allPLOS ONE policies on sharing data and materials.

There is an increased interest in exploring the benefits of establishing dietary recommenda-tion for bioactives such as flavonoids [32], but there are still insufficient data on efficacy andsafety for most compounds. Although dietary intervention studies have been conducted to in-vestigate the beneficial effect of flavonoids on health, most notably with flavan-3-ols [33], thelack of standardised protocols and well defined intervention vehicles makes it often difficult tointerpret the results.
The development of dietary recommendations and also the interpretation of results from in-tervention studies, requires reliable information on habitual flavonoid intake in the generalpublic. This information is also important to assess the potential health impact of these com-pounds. However, there is a paucity of data available. While the flavonoid consumption data ofthe European Prospective Investigation into Cancer (EPIC) provides detailed information onflavonoid intake in this cohort [34], the data are not representative of the European public be-cause of selection bias. Previously, we have used a novel food composition database, in combi-nation with food consumption data from the European Food Safety Authority (EFSA), todetermine flavan-3-ol intake in the European Union [35]. We have now used the same meth-ods and data to investigate the habitual consumption of selected monomeric and polymeric fla-vonoids (see Fig 1 for a summary of the monomeric compounds included in this study) in theadult population of the European Union.
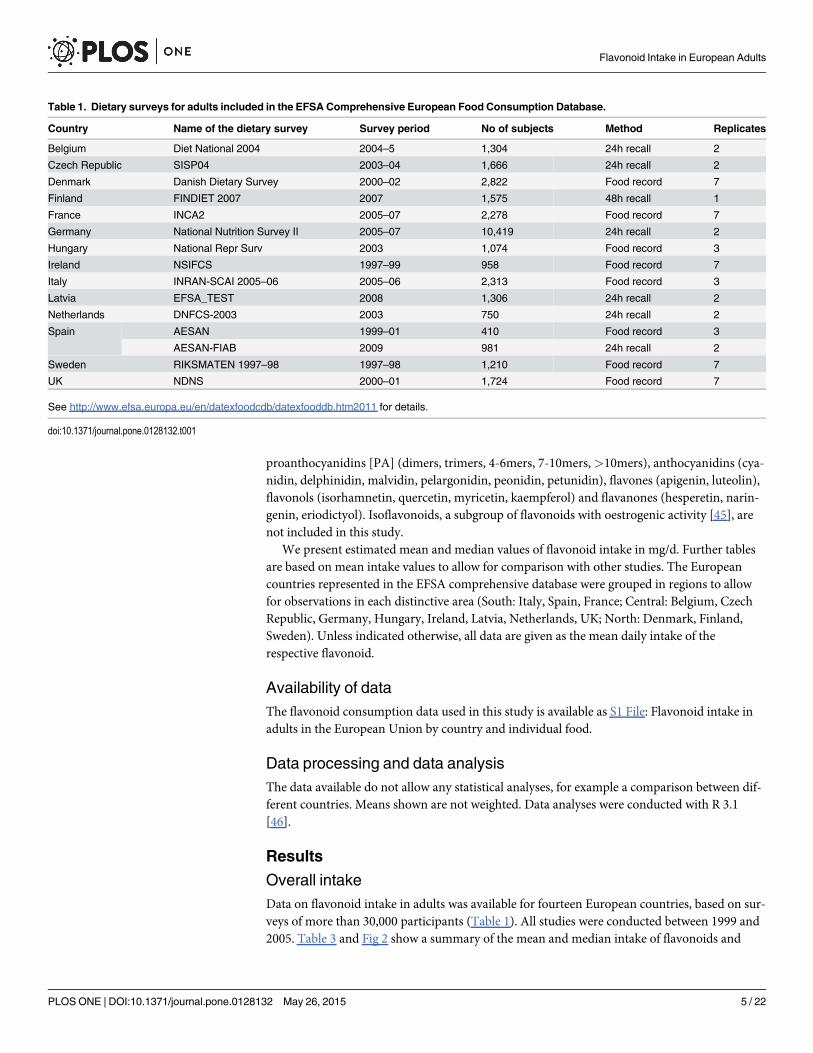
Subjects and MethodsWe have used the methods described previously [35] to determine mean and median intake offlavonoids, using the 2011 EFSA Comprehensive European Food Consumption Database. Thisdatabase contains food consumption data for adults aged 18–64 years from 21 surveys(~30,000 individuals) and 14 countries [36]. Information concerning the methodologies usedin each survey is presented in Table 1. Food consumption statistics are reported in g/day andfor habitual consumption. For each country, consumption data are given according to the 1st
(20 categories) and 2nd (140 categories) level of the FoodEx system and for the total population[37]. The hierarchical food classification system ‘FoodEx’, developed by EFSA, was used to cod-ify all food items. Food intake by non-consumers is reported as 0.
In order to estimate the flavonoid intake in Europe, we expanded the FLAVIOLA FlavanolFood Composition database which contains food composition data for approximately 3,000food items as described previously [35]. This database is based on the US Department of Agri-culture database for the Flavonoid Content of Selected Foods [38], and the proanthocyanidins(PA) Content of Selected Foods [39], expanded with values from Phenol-Explorer, a compre-hensive database on the polyphenol content of foods [40]. These databases are the most up-to-date databases on flavonoids and polyphenols, and include information for 500, 205, and 456food items for flavonoids [38], PA [39] and polyphenols [40], respectively. We expanded andcompleted the FLAVIOLA Flavanol Food Composition database using food data underlyingDINER (Data Into Nutrients for Epidemiological Research), a data-entry system for food rec-ords created for EPIC (European Prospective Investigation into Cancer and Nutrition)-Norfolk[41]. This database was used for the calculation of the estimated flavonoid content of ~2,500food items (82% of the 3000 total foods), using approximately 800 recipes. Retention and cook-ing factors for approximately 500 food items were used to estimate the effect of processing (e.g.frying, boiling, roasting, etc.) [42–44]. When information on the ingredients of commercialfood products was provided by manufacturers, their flavonoid content was also calculated;where no information was available, products were matched to similar ones if possible. Fooditems thought not to contain significant levels of flavanols (fish, meat and eggs) were treated aslogical zeros and omitted from the database. Dietary intake was estimated for the following
Flavonoid Intake in European Adults
PLOS ONE | DOI:10.1371/journal.pone.0128132 May 26, 2015 3 / 22

major flavonoid subgroups (see also Fig 1 and Table 2): flavan-3-ol monomers((–)-epicatechin, (–)-epicatechin-3-gallate, (–)-epigallocatechin. (–)-epigallocatechin-3-gallate,(+)-catechin, (+)-gallocatechin, (+)-catechin-3-gallate, (+)-gallocatechin-3-gallate), theaflavins(theaflavin, thearubigins, theaflavin-3,3'-digallate, theaflavin-3'-gallate, theaflavin-3-gallate),
Fig 1. Structures of monomeric flavonoids assessed in this study.
doi:10.1371/journal.pone.0128132.g001
Flavonoid Intake in European Adults
PLOS ONE | DOI:10.1371/journal.pone.0128132 May 26, 2015 4 / 22
proanthocyanidins [PA] (dimers, trimers, 4-6mers, 7-10mers,>10mers), anthocyanidins (cya-nidin, delphinidin, malvidin, pelargonidin, peonidin, petunidin), flavones (apigenin, luteolin),flavonols (isorhamnetin, quercetin, myricetin, kaempferol) and flavanones (hesperetin, narin-genin, eriodictyol). Isoflavonoids, a subgroup of flavonoids with oestrogenic activity [45], arenot included in this study.
We present estimated mean and median values of flavonoid intake in mg/d. Further tablesare based on mean intake values to allow for comparison with other studies. The Europeancountries represented in the EFSA comprehensive database were grouped in regions to allowfor observations in each distinctive area (South: Italy, Spain, France; Central: Belgium, CzechRepublic, Germany, Hungary, Ireland, Latvia, Netherlands, UK; North: Denmark, Finland,Sweden). Unless indicated otherwise, all data are given as the mean daily intake of therespective flavonoid.
Availability of dataThe flavonoid consumption data used in this study is available as S1 File: Flavonoid intake inadults in the European Union by country and individual food.
Data processing and data analysisThe data available do not allow any statistical analyses, for example a comparison between dif-ferent countries. Means shown are not weighted. Data analyses were conducted with R 3.1[46].
Results
Overall intakeData on flavonoid intake in adults was available for fourteen European countries, based on sur-veys of more than 30,000 participants (Table 1). All studies were conducted between 1999 and2005. Table 3 and Fig 2 show a summary of the mean and median intake of flavonoids and
Table 1. Dietary surveys for adults included in the EFSA Comprehensive European Food Consumption Database.
Country Name of the dietary survey Survey period No of subjects Method Replicates
Belgium Diet National 2004 2004–5 1,304 24h recall 2
Czech Republic SISP04 2003–04 1,666 24h recall 2
Denmark Danish Dietary Survey 2000–02 2,822 Food record 7
Finland FINDIET 2007 2007 1,575 48h recall 1
France INCA2 2005–07 2,278 Food record 7
Germany National Nutrition Survey II 2005–07 10,419 24h recall 2
Hungary National Repr Surv 2003 1,074 Food record 3
Ireland NSIFCS 1997–99 958 Food record 7
Italy INRAN-SCAI 2005–06 2005–06 2,313 Food record 3
Latvia EFSA_TEST 2008 1,306 24h recall 2
Netherlands DNFCS-2003 2003 750 24h recall 2
Spain AESAN 1999–01 410 Food record 3
AESAN-FIAB 2009 981 24h recall 2
Sweden RIKSMATEN 1997–98 1997–98 1,210 Food record 7
UK NDNS 2000–01 1,724 Food record 7
See http://www.efsa.europa.eu/en/datexfoodcdb/datexfooddb.htm2011 for details.
doi:10.1371/journal.pone.0128132.t001
Flavonoid Intake in European Adults
PLOS ONE | DOI:10.1371/journal.pone.0128132 May 26, 2015 5 / 22

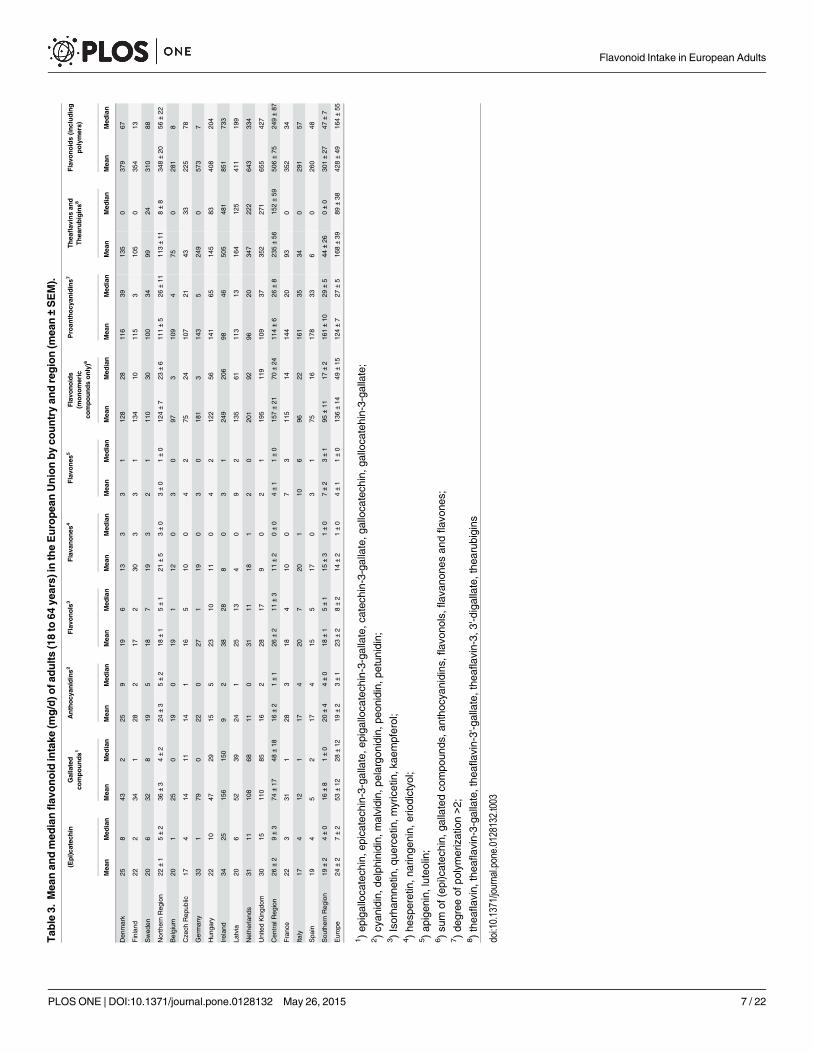
flavonoid sub-groups. Mean intake of total flavonoids, including oligomeric compounds, was428 mg/d with the highest intake in the Central Region (506 mg/d), followed by the NorthernRegion (348 mg/d) and the Southern Region (301 mg/d). The main types of flavonoids con-sumed were thearubigins and theaflavins (168 mg/d), mainly from tea, and oligo- and polymer-ic proanthocyanidins (124 mg/d), mainly from fruits and vegetable.
The highest intake of monomeric flavonoids was also found in the Central Region (157 mg/d), followed by the Northern (124 mg/d) and Southern (95 mg/d) Region. The distribution ofintake was skewed for all compounds with a considerably lower median intake for all flavonoidclasses. The main type of monomeric compounds consumed were flavan-3-ols, of which 53mg/d were gallated and 24 mg/d non-gallated compounds.
Regional variationThere were noticeable differences in flavonoid intake between different countries and Europe-an regions (Fig 3). This was in particular pronounced for theaflavins and thearubigins wheremean intake in the Central Region (235 mg/d) was more than double than intake in the
Table 2. Names and synonyms of monomeric flavonoids used.
Compound Synonyms
Flavan-3-ols
(–)-epicatechin L-epicatechin, (–)-epicatechol, L-acacatechin
(–)-epigallocatechin gallocatechol, epigallocatechol,
(–)-epicatechin-3-gallate
(–)-epigallocatechin-3-gallate
EGCG
(+)-catechin catechinic acid, catechuic acid, catergen, (+)-cianidanol, (+)-cyanidanol,(+)-cyanidanol-3
(+)-gallocatechin gallocatechol
(+)-catechin-3-gallate
(+)-gallocatechin-3-gallate gallocatechol-gallate
Anthocyanidins
Cyanidin cyanidol, gastrotelos
Delphinidin delphinidol, ephdine
Malvidin
Pelargonidin pelargonidol
Peonidin
Petunidin petunidol
Flavones
Apigenin spigenin, versulin, apigenol
Luteolin luteolol, flacitran, digitoflavone
Flavonols
Isorhamnetin isorhamnetol, 3'-methyl-quercetin
Quercetin sophoretin, meletin, xanthaurine, quercetol, quercetin, quertine, flavin meletin
Myricetin cannabiscetin, myricetol
Kaempferol kaempferol, populnetin, rhamnolutein, robigenin, trifolitin, pelargidenolon,rhamnolutin, swartziol
Flavanones
Hesperetin hesperitin, hesperin, 4'-methyl-cyanidanon
Naringenin
Eriodictyol
doi:10.1371/journal.pone.0128132.t002
Flavonoid Intake in European Adults
PLOS ONE | DOI:10.1371/journal.pone.0128132 May 26, 2015 6 / 22
Tab
le3.
Mea
nan
dmed
ianflav
onoid
intake
(mg/d)o
fadults(18to
64ye
ars)
intheEuropea
nUnionbyco
untryan
dregion(m
ean±SEM).
(Epi)ca
tech
inGallated
compounds1
Anthocy
anidins2
Flavo
nols
3Flava
nones
4Flavo
nes
5Flavo
noids
(monomeric
compoundsonly)6
Proan
thocy
anidins7
Thea
flav
insan
dThea
rubigins8
Flavo
noids(including
polymers)
Mea
nMed
ian
Mea
nMed
ian
Mea
nMed
ian
Mea
nMed
ian
Mea
nMed
ian
Mea
nMed
ian
Mea
nMed
ian
Mea
nMed
ian
Mea
nMed
ian
Mea
nMed
ian
Den
mark
258
432
259
196
133
31
128
2811
639
135
037
967
Finland
222
341
282
172
303
31
134
1011
53
105
035
413
Swed
en20
632
819
518
719
32
111
030
100
3499
2431
088
NorthernReg
ion
22±1
5±2
36±3
4±2
24±3
5±2
18±1
5±1
21±5
3±0
3±0
1±0
124±7
23±6
111±5
26±11
113±11
8±8
348±20
56±22
Belgium
201
250
190
191
120
30
973
109
475
028
18
Cze
chRep
ublic
174
1411
141
165
100
42
7524
107
2143
3322
578
German
y33
179
022
027
119
03
018
13
143
524
90
573
7
Hun
gary
2210
4729
155
2310
110
42
122
5614
165
145
8340
820
4
Irelan
d34
2515
615
09
238
288
03
124
920
698
4650
548
185
173
3
Latvia
206
5239
241
2513
40
92
135
6111
313
164
125
411
199
Nethe
rland
s31
1110
868
110
3111
181
20
201
9296
2034
722
264
333
4
UnitedKingd
om30
1511
085
162
2817
90
21
195
119
109
3735
227
165
542
7
Cen
tral
Reg
ion
26±2
9±3
74±17
48±18
16±2
1±1
26±2
11±3
11±2
0±0
4±1
1±0
157±21
70±24
114±6
26±8
235±56
152±59
506±75
249±87
Franc
e22
331
128
318
410
07
311
514
144
2093
035
234
Italy
174
121
174
207
201
106
9622
161
3534
029
157
Spa
in19
45
217
415
517
03
175
1617
833
60
260
48
Sou
thernReg
ion
19±2
4±0
16±8
1±0
20±4
4±0
18±1
5±1
15±3
1±0
7±2
3±1
95±11
17±2
161±10
29±5
44±26
0±0
301±27
47±7
Europ
e24
±2
7±2
53±12
28±12
19±2
3±1
23±2
8±2
14±2
1±0
4±1
1±0
136±14
49±15
124±7
27±5
168±39
89±38
428±49
164±55
1)ep
igalloca
tech
in,e
pica
tech
in-3-gallate,e
piga
lloca
tech
in-3-gallate,c
atec
hin-3-ga
llate,g
alloca
tech
in,g
alloca
tehin-3-ga
llate;
2)cyan
idin,d
elph
inidin,m
alvidin,
pelargon
idin,p
eonidin,
petunidin;
3)Isorha
mne
tin,q
uercetin,m
yricetin,k
aempferol;
4)he
speretin,n
aringe
nin,
eriodictyo
l;5)ap
igen
in,luteo
lin;
6)su
mof
(epi)catec
hin,
gallatedco
mpo
unds
,antho
cyan
idins,
flav
onols,
flav
anon
esan
dflav
ones
;7)de
gree
ofpo
lymerization>2;
8)thea
flav
in,the
aflav
in-3-gallate,the
aflav
in-3'-g
allate,the
aflav
in-3,3
'-digallate,the
arub
igins
doi:10.1371/journal.pone.0128132.t003
Flavonoid Intake in European Adults
PLOS ONE | DOI:10.1371/journal.pone.0128132 May 26, 2015 7 / 22
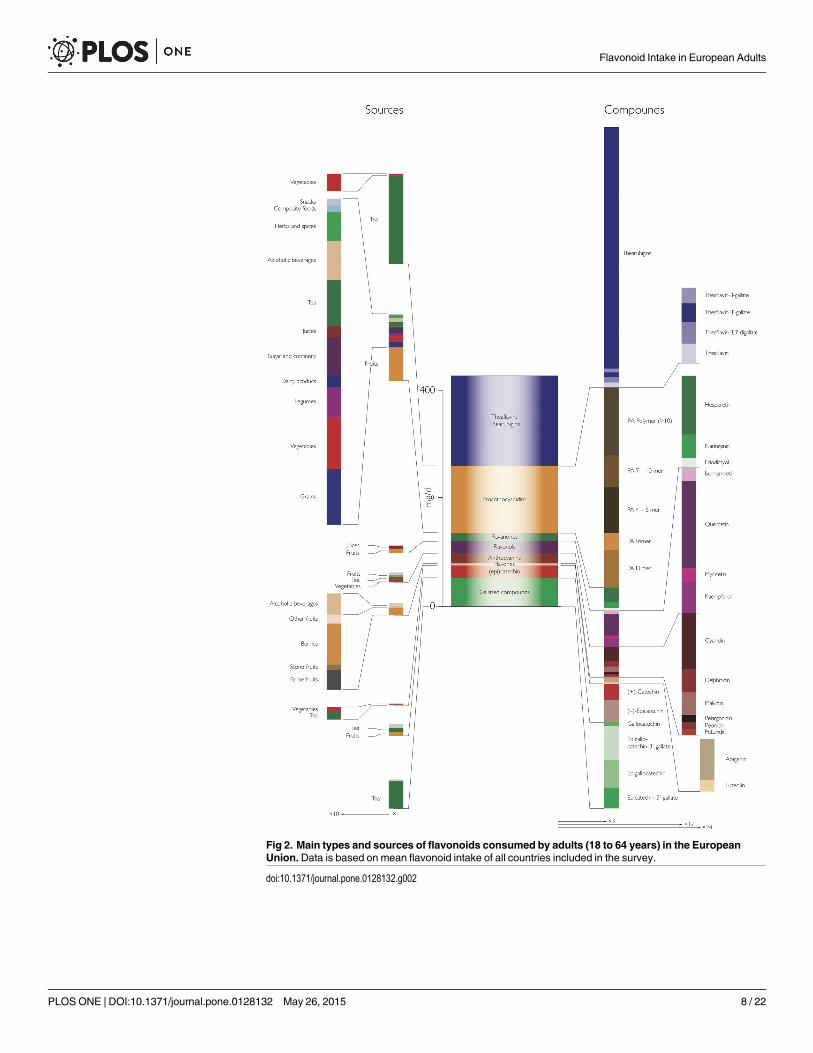
Fig 2. Main types and sources of flavonoids consumed by adults (18 to 64 years) in the EuropeanUnion.Data is based on mean flavonoid intake of all countries included in the survey.
doi:10.1371/journal.pone.0128132.g002
Flavonoid Intake in European Adults
PLOS ONE | DOI:10.1371/journal.pone.0128132 May 26, 2015 8 / 22

Fig 3. Flavonoid intake of adults (18 to 64 years) in the European Union. The maps showmean flavonoid intake in mg/d per country, the pie charts therelative contribution of different types of flavonoids.
doi:10.1371/journal.pone.0128132.g003
Flavonoid Intake in European Adults
PLOS ONE | DOI:10.1371/journal.pone.0128132 May 26, 2015 9 / 22

Northern region (113 mg/d) and five times higher than in the Southern Region (44 mg/d).Moreover, even in the Central Region we observed a wide range of intake, with low intakes inthe Czech Republic (43 mg/d) and Belgium (75 mg/d) and high intake in Ireland (505 mg/d),the UK (352 mg/d) and the Netherlands (347 mg/d). Conversely, intake of proanthocyanidinswas highest in the Southern Region (161 mg/d) and similar in the Central (114 mg/d) andNorthern (111 mg/d) Region. For all other compound classes, intake was highest in the CentralRegion, except for flavones and anthocyanidins, for which the highest intake was observed inthe Northern Region, in particular in Finland.
Flavonoid sourcesFig 2 shows a summary of the overall main contributors to total flavonoid intake and regionaldata are shown in Tables 4 and 5. Non-alcoholic beverages, in particular tea, are the mainsource of total and monomeric flavonoids in the European Union (mean: 66 mg/d) with no-ticeable difference between countries and regions. In the Northern and Central region, flavo-noids from non-alcoholic beverages are the main contributors, but in the Southern region themain contributors are fruits and fruit products. Most other food sources contributed only littleto overall intake.
Whereas tea was the main contributor to dietary theaflavins and thearubigins, there was awider variety of sources for proanthocyanidins (Table 5, Fig 4). The main sources were fruits(mean: 62 mg/d), in particular pome fruits (35 mg/d), berries and small fruits (11 mg/d) andstone fruits (10 mg/d). There were however large variations between different countries (Fig 5):in Finland and Latvia, berries and other small fruits were a major contributor to proanthocya-nidins intake, whereas in the Southern Region, in particular in Italy and Spain, stone fruitswere an important source. In comparison to polymeric and monomeric flavan-3-ols, the con-tribution from other groups were small and their main sources were fruits.
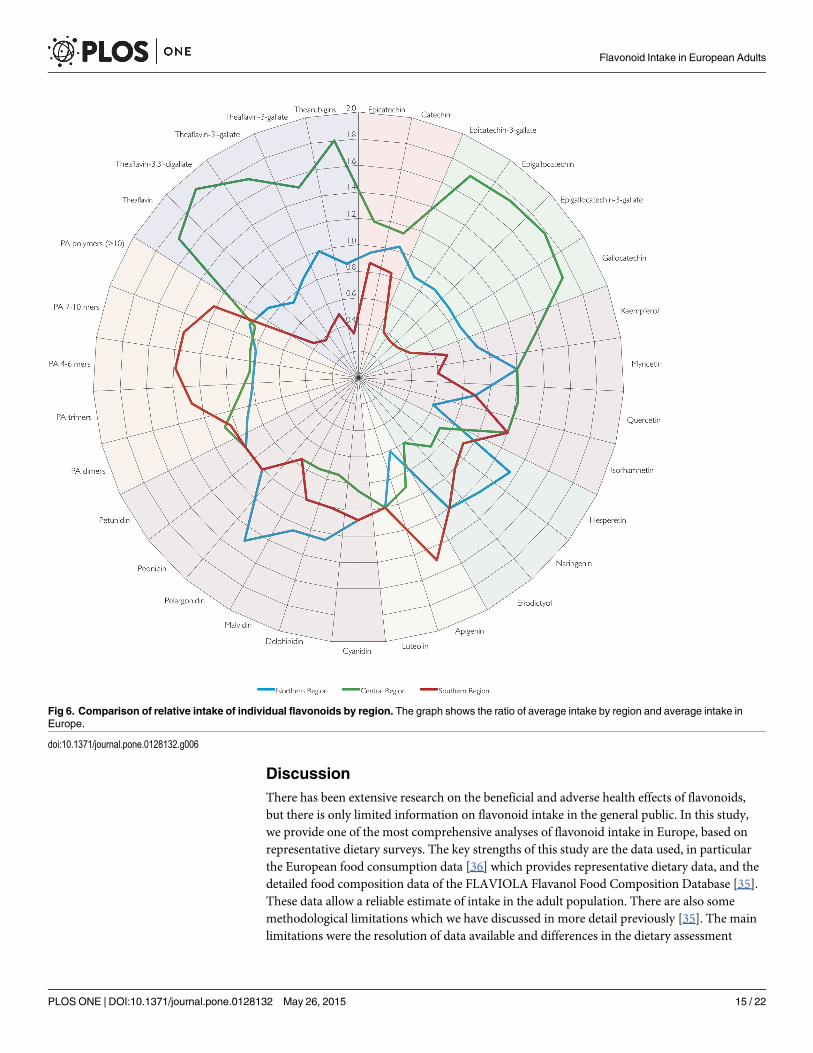
Individual compounds and sourcesThe contribution of different compounds to total flavonoid intake is summarised in Fig 2, andshown by region in Table 6 and Fig 6. Thearubigins were the largest contributor to total flavo-noid intake (156 mg/d) whereas theaflavins contributed only small amounts, and this can beobserved in all countries, independent of the total amount consumed. Conversely, the compo-sition of proanthocyanidins is more variable. Overall, polymeric proanthocyanidins (DP> 10)contribute most to total intake, but the contribution of different oligomers is very variable. Es-pecially in countries of the Southern Region, intake of 4-6mers is much higher than in mostother countries (Fig 3).
Epigallocatechin-3-gallate (EGCG) is the main type of gallated compounds consumed (21mg/d) and (–)-epicatechin the main non-gallated monomeric flavan-3-ol. The consumption ofall other types of flavonoids, except for quercetin (14 mg/d), was much lower.
Distribution of intakeThe data available did not provide much information about the distribution of intake exceptfor median and mean values and these data allows only a limited assessment. The distributionof intake was skewed for most compounds and countries, as median intake was always lowerthan mean intake. This was in particular noticeable in Germany were mean monomeric flavo-noid intake was more than 60-fold higher than median intake (181 mg/d vs 3 mg/d) and morethan 80-fold higher when including polymeric compounds (523 mg/d vs 7 mg/d). It was notice-able that for some compounds, i.e. gallated flavan-3-ols, anthocyanidins, flavanones and fla-vones as well as theaflavins and thearubigins, median intake in Germany was 0 mg/d. A
Flavonoid Intake in European Adults
PLOS ONE | DOI:10.1371/journal.pone.0128132 May 26, 2015 10 / 22

Tab
le4.
Sources
ofm
onomeric
flav
onoids(inmg/d
oftotalflavo
noids;
mea
n±SEM)o
fadults(18to
64ye
ars)
intheEuropea
nUnionbyco
untryan
dregion.
Totalintake
Grainsan
dgrain-bas
edproducts
Veg
etab
les
andve
getab
leproducts
(including
fungi)
Starchyroots
andtubers
Leg
umes
,nuts
and
oils
eeds
Fruitan
dfruit
products
Milk
anddairy
products
Sugar
and
confectionary
Fruitan
dve
getab
lejuices
Non-alcoholic
bev
erag
es(exc
eptmilk
bas
edbev
erag
es)
Alcoholic
bev
erag
esHerbs,
spices
and
condim
ents
Composite
food
(including
froze
nproducts)
Snac
ks,
des
serts,
and
other
foods
Mea
nMed
ian
Mea
nMed
ian
Mea
nMed
ian
Mea
nMed
ian
Mea
nMed
ian
Mea
nMed
ian
Mea
nMed
ian
Mea
nMed
ian
Mea
nMed
ian
Mea
nMed
ian
Mea
nMed
ian
Mea
nMed
ian
Mea
nMed
ian
Den
mark
10
85
11
00
307
21
21
123
551
169
10
00
00
Finland
00
72
11
10
560
32
10
154
431
40
20
10
00
Swed
en3
22
11
10
029
52
11
014
441
107
01
08
41
1
Northern
Reg
ion
1±1
1±1
6±2
3±1
1±0
1±0
0±0
0±0
39±9
4±2
2±0
1±0
1±0
0±0
13±1
4±0
46±4
4±3
9±4
3±3
1±0
0±0
3±2
1±1
1±0
0±0
Belgium
21
61
11
10
270
20
20
60
311
110
10
60
10
Cze
chRep
ublic
21
2516
11
10
273
10
10
30
00
90
52
10
00
German
y2
16
01
01
034
01
02
020
010
01
80
20
40
10
Hun
gary
10
104
11
10
3515
10
10
50
5733
30
43
00
00
Irelan
d2
110
73
21
017
31
02
13
020
019
17
03
11
01
0
Latvia
21
21
11
00
340
10
10
40
6650
10
80
138
10
Nethe
rland
s2
18
01
11
019
03
02
114
013
989
50
10
50
20
United
Kingd
om2
28
51
12
119
21
02
17
014
010
810
02
00
01
0
Cen
tral
Reg
ion
2±0
1±0
9±2
4±2
1±0
1±0
1±0
0±0
27±3
3±2
1±0
0±0
1±0
0±0
8±2
0±0
92±23
59±24
7±1
0±0
3±1
1±0
4±2
1±1
1±0
0±0
Franc
e2
28
31
12
131
12
11
010
038
012
27
20
01
1
Italy
11
105
10
10
4110
10
00
30
130
110
145
00
10
Spa
in2
115
51
12
039
72
11
05
01
05
02
10
01
0
Sou
thern
Reg
ion
2±0
1±0
11±2
4±0
1±0
1±0
1±0
0±0
37±3
6±2
1±0
1±0
1±0
0±0
6±2
0±0
17±11
0±0
9±2
1±1
8±3
3±1
0±0
0±0
1±0
0±0
Europ
e2±0
1±0
9±1
4±1
1±0
1±0
1±0
0±0
31±3
4±1
2±0
1±0
1±0
0±0
8±1
1±0
66±16
35±15
8±1
1±1
4±1
1±0
3±1
1±1
1±0
0±0
Mea
t,mea
tprodu
cts,
fish
andothe
rse
a-food
sdidno
tcon
tributeto
totalflav
onoidintake
andwereom
itted
.
doi:10.1371/journal.pone.0128132.t004
Flavonoid Intake in European Adults
PLOS ONE | DOI:10.1371/journal.pone.0128132 May 26, 2015 11 / 22

Tab
le5.
Sources
ofp
roan
thocy
anidins(inmg/d
ofp
roan
thocy
anidinswithadeg
reeofp
olymerisationoftwoormore;m
ean±SEM)o
fadults(18to
64ye
ars)
intheEurope-
anUnionbyco
untryan
dregion.
Totalintake
Grainsan
dgrain-bas
edproducts
Veg
etab
lesan
dve
getab
leproducts
(includingfungi)
Leg
umes
,nuts
and
oils
eeds
Fruitan
dfruit
products
Milk
anddairy
products
Sugar
and
confectionary
Fruitan
dve
getab
lejuices
Non-alcoholic
bev
erag
es(exc
epting
milk
bas
edbev
erag
es)
Alcoholic
bev
erag
esHerbs,
spices
andco
ndim
ents
Composite
food
(including
froze
nproducts)
Snac
ks,
des
serts,
and
other
foods
Mea
nMed
ian
Mea
nMed
ian
Mea
nMed
ian
Mea
nMed
ian
Mea
nMed
ian
Mea
nMed
ian
Mea
nMed
ian
Mea
nMed
ian
Mea
nMed
ian
Mea
nMed
ian
Mea
nMed
ian
Mea
nMed
ian
Den
mark
41
40
20
6823
30
94
31
60
169
00
00
10
Finland
40
150
40
690
32
70
41
50
30
00
00
10
Swed
en20
130
03
046
152
17
02
17
17
00
05
31
1
NorthernReg
ion
9±6
5±4
6±4
0±0
3±1
0±0
61±7
13±7
3±0
1±0
8±1
1±1
3±1
1±0
6±1
0±0
9±4
3±3
0±0
0±0
2±2
1±1
1±0
0±0
Belgium
104
80
30
520
20
110
20
50
110
20
10
10
Cze
chRep
ublic
116
110
50
5911
10
30
10
00
70
74
10
10
German
y12
46
07
080
01
09
06
013
07
00
00
01
0
Hun
gary
51
160
70
8653
30
40
10
74
30
87
00
00
Irelan
d10
77
03
033
101
010
51
024
235
03
10
01
0
Latvia
113
00
30
700
10
60
10
86
10
10
104
10
Nethe
rland
s10
55
05
030
04
013
43
017
114
00
01
03
0
UnitedKingd
om18
110
013
638
41
08
32
017
139
02
00
01
0
Cen
tral
Reg
ion
11±1
5±1
7±2
0±0
6±1
1±1
56±8
10±6
2±0
0±0
8±1
2±1
2±1
0±0
11±3
7±3
6±1
0±0
3±1
1±1
2±1
0±0
1±0
0±0
Franc
e14
1019
08
170
52
17
02
06
012
24
00
02
1
Italy
83
90
30
8332
10
20
10
20
110
410
00
10
Spa
in11
552
011
085
232
14
01
00
05
05
20
01
0
Sou
thernReg
ion
11±2
6±2
27±13
0±0
7±2
0±0
80±5
20±8
1±0
1±0
4±1
0±0
1±0
0±0
2±2
0±0
9±2
1±1
16±12
1±1
0±0
0±0
2±0
0±0
Europ
e10
±1
5±1
11±4
0±0
5±1
0±0
62±5
13±4
2±0
0±0
7±1
1±1
2±0
0±0
8±2
4±2
7±1
1±1
5±3
1±1
1±1
0±0
1±0
0±0
Starchy
rootsan
dtube
rs,m
eat,mea
tprodu
cts,
fish
andothe
rse
a-food
sdidno
tcon
tributeto
totalflav
onoidintake
andwereom
itted
.
doi:10.1371/journal.pone.0128132.t005
Flavonoid Intake in European Adults
PLOS ONE | DOI:10.1371/journal.pone.0128132 May 26, 2015 12 / 22

similar, although less extreme, distribution was observed in Belgium (97 mg/d vs 3 mg/d formonomeric flavonoids and 281 mg/d vs 8 mg/d for all flavonoids). Conversely, mean and me-dian intake were very similar both in Ireland, both for monomeric compounds (249 mg/d vs206 mg/d) and total flavonoids (851 mg/d vs 733 mg/d). The distribution of intake was mostskewed for flavanones, were median intake was 0 mg/d in most countries.
Fig 4. Contribution of different fruits to total proanthocyanidins.
doi:10.1371/journal.pone.0128132.g004
Fig 5. Relative contribution of individual compounds to total flavonoid intake.
doi:10.1371/journal.pone.0128132.g005
Flavonoid Intake in European Adults
PLOS ONE | DOI:10.1371/journal.pone.0128132 May 26, 2015 13 / 22

Tab
le6.
Mea
nintake
ofindividual
compounds(m
g/d
±SEM)inad
ults
(18to
64ye
ars)
intheEuropea
nUnion.
Den
mark
Finland
Swed
enNorthern
Reg
ion
Belgium
Cze
chRep
ublic
German
yHungary
Irelan
dLatvia
Netherlands
United
Kingdom
Cen
tral
Reg
ion
France
Italy
Spain
Southern
Reg
ion
Europe
(–)-Epica
tech
in14
1211
12±1
119
1914
2012
1817
15±1
1310
1111
±1
14±1
(+)-Catec
hin
1111
910
±1
97
148
159
1314
11±1
107
88±1
10±1
(–)-Epica
tech
in-
3-ga
llate
108
89±1
64
1912
3713
2626
18±4
73
14±2
13±3
(–)-Epiga
lloca
tech
in14
1110
12±1
85
2515
5017
3435
24±5
104
25±2
17±4
(–)-Epiga
lloca
tech
in-
3-ga
llate
1713
1214
±1
95
3118
6220
4243
29±7
124
16±3
21±5
(+)-Galloca
tech
in2
22
2±0
11
42
82
55
4±1
21
01±0
3±1
Kae
mpferol
43
34±0
34
65
114
88
6±1
34
23±0
5±1
Myricetin
22
12±0
11
22
42
33
2±0
21
11±0
2±0
Que
rcetin
1210
1211
±1
129
1714
2117
1816
15±1
1113
1011
±1
14±1
Isorha
mne
tin1
21
1±0
23
23
32
22
2±0
23
22±0
2±0
Hes
peretin
819
1213
±3
76
137
53
126
7±1
612
109±2
9±1
Naringe
nin
37
55±1
33
43
21
42
3±0
36
44±1
4±0
Erio
dictyo
l1
32
2±1
11
11
10
21
1±0
12
22±0
1±0
Apige
nin
22
12±0
23
23
38
11
3±1
69
15±2
3±1
Luteolin
11
11±0
11
11
11
11
1±0
12
11±0
1±0
Cya
nidin
912
810
±1
87
119
412
66
8±1
128
1010
±1
9±1
Delph
inidin
65
55±0
32
32
24
24
3±0
62
34±1
4±0
Malvidin
65
35±1
53
42
23
23
3±0
54
34±1
3±0
Pelargo
nidin
22
12±0
11
11
12
11
1±0
21
11±0
1±0
Peo
nidin
12
11±0
11
11
02
01
1±0
11
11±0
1±0
Petun
idin
12
11±0
11
10
01
01
1±0
11
11±0
1±0
PAdimers
2518
1820
±2
2015
3022
3318
2729
24±2
2522
2323
±1
23±1
PAtrim
ers
99
89±0
99
1212
98
99
10±1
1216
1614
±1
10±1
PA4–
6mers
2525
2224
±1
2627
3133
1923
2021
25±2
3542
4842
±4
28±2
PA7–
10mers
1818
1517
±1
1719
2225
1317
1314
18±2
2428
3529
±3
20±2
PApo
lymers(>10
)39
4537
40±3
3737
4850
2545
2636
38±3
4854
5653
±2
42±3
The
aflav
in2
22
2±0
11
43
93
66
4±1
21
01±0
3±1
The
aflav
in-3,3'-
diga
llate
32
22±0
21
53
103
77
5±1
21
01±1
3±1
The
aflav
in-3'-g
allate
22
22±0
11
43
93
66
4±1
21
01±0
3±1
The
aflav
in-3-gallate
22
12±0
11
42
72
55
3±1
10
01±0
2±1
The
arub
igins
126
9893
105±10
7040
231
135
470
152
323
327
219±52
8731
641
±24
156±36
doi:10.1371/journal.pone.0128132.t006
Flavonoid Intake in European Adults
PLOS ONE | DOI:10.1371/journal.pone.0128132 May 26, 2015 14 / 22
DiscussionThere has been extensive research on the beneficial and adverse health effects of flavonoids,but there is only limited information on flavonoid intake in the general public. In this study,we provide one of the most comprehensive analyses of flavonoid intake in Europe, based onrepresentative dietary surveys. The key strengths of this study are the data used, in particularthe European food consumption data [36] which provides representative dietary data, and thedetailed food composition data of the FLAVIOLA Flavanol Food Composition Database [35].These data allow a reliable estimate of intake in the adult population. There are also somemethodological limitations which we have discussed in more detail previously [35]. The mainlimitations were the resolution of data available and differences in the dietary assessment
Fig 6. Comparison of relative intake of individual flavonoids by region. The graph shows the ratio of average intake by region and average intake inEurope.
doi:10.1371/journal.pone.0128132.g006
Flavonoid Intake in European Adults
PLOS ONE | DOI:10.1371/journal.pone.0128132 May 26, 2015 15 / 22

methods between countries (Table 1), which is likely to have introduced bias. In particular dif-ferences in assessment methods, such as differences in the number of days of assessment andseasonality, will affect the results. In addition, all observational methods are prone to underre-porting and it is therefore likely that the actual intake of flavonoids is higher than reportedhere. Furthermore, the data available did not allow further statistical analyses.
More detailed data on the distribution of intake, or even the actual food consumption datasuch as provided by the UK’s National Diet and Nutrition Survey (NDNS) or National Healthand Nutrition Examination Survey (NHANES) in the US, would have allowed a better explora-tion of the data available. However, despite these limitations this study, in particular in combi-nation with our previous research [35], provides the most detailed and accurate analysis offlavonoid intake in the European Union.
Comparison with studiesThere is a paucity of data on flavonoid intake in the general public and only few estimates exist.
Johannot and Somerset [47] reanalysed data from representative surveys in Denmark [48]and the Netherlands [49, 50], but these estimates are considerably lower than estimated intakein the current study and this might be due to a smaller number of food items for which datawere available. While there are only limited data from representative surveys, there are moredata available from other studies, such as clinical trials and observational cohorts, or food bal-ance sheets. Beking and Vieira estimated flavonoid intake in the UK and Ireland using the lat-ter approach [51], and their estimates are considerably higher for anthocyanidins (60 mg/d vs 9mg/d for Ireland; 69 mg/d vs 16 mg/d for the UK) and flavanones (29 mg/d vs 8 mg/d for Ire-land; 26 mg/d vs 9 mg/d for the UK), whereas their estimates for monomeric flavan-3-ols arelower (190 mg/d vs 9 mg/d for Ireland; 140 mg/d vs 16 mg/d for the UK). Due to differences inthe methodologies used, it is difficult to explain the reason for these differences. Zamaro-Roset al. conducted one of the most detailed analysis of total flavonoid intake in the different cen-tres of the European Prospective Investigation into Cancer (EPIC) study [34, 52–54]. These dataprovided so far the most comprehensive analysis of flavonoid intake in Europe, but intakeswere considerably lower in our study: flavonol (30 mg/d vs 23 mg/d), flavanone (35 mg/d vs 14mg/d), anthocyanidins (31 mg/d vs 19 mg/d) and proanthocyanidin (207 mg/d vs 124 mg/d)intake were considerably higher than in our study. However, there are some important differ-ences: Firstly, the participants of EPIC are not a representative selection of the general publicwith some cohorts contributing only women or men and the cohorts consisting of mainlyhealthy, middle-aged participants, and because of volunteer bias, participants are likely to havemore interest in diet and health and therefore a different diet. Secondly, intake assessment inEPIC is based on dietary data collected in the 1990s, and it is likely that dietary habitshave changed.
Total intake of flavonoids in Europe is comparable with intake in Australia (454 mg/d), al-though the consumption of anthocyanidins (3 mg/d in Australia vs 19 mg/d), flavanones (7mg/d in Australia vs 14 mg/d) and flavones (0.5 mg/d in Australia vs 4 mg/d) was considerablylower and it is mainly monomeric and polymeric flavan-3-ol that is higher (422 mg/d vs 370mg/d; see [35] for a more detailed discussion) [47].
Based on data from NHANES, Bai et al. [55] estimated dietary intake of flavonoids in USadults. Overall, intake in the US is similar to intake in Europe, although there are some notabledifferences: intake of flavanones (22 mg/d vs 14 mg/d) is higher in the US population, but in-take of flavones (4 mg/d vs 1 mg/d) and in particular anthocyanidins (9 mg/d vs 19 mg/d) isconsiderably lower. Indeed, the intake of anthocyanidins is lower than in all European coun-tries except for Ireland. It is more difficult to compare intake of flavan-3-ols or total flavonoids,
Flavonoid Intake in European Adults
PLOS ONE | DOI:10.1371/journal.pone.0128132 May 26, 2015 16 / 22

as Bai et al. did not include thearubigins. However, it is noticeable that the intake of gallatedcompounds is lower than intake in Europe (27 mg/d vs 53 mg/d) whereas the intakes of(–)-epicatechin (68 mg/d vs 14 mg/d) and (+)-catechin (84 mg/d vs 10 mg/d) are much higher.This is surprising as such a pattern of intake is difficult to explain as the main sources of(–)-epicatechin and (+)-catechin also contain similar or higher amounts of gallated com-pounds and thus it is not clear how such high intakes can be achieved.
Table 7 shows a comparison of mean and median intake data from Europe, Australia andthe USA, both from representative surveys and large cohort studies. While differences in meth-odology and the definition of flavonoid subclasses, in particular polymeric compounds, make adirect comparison difficult, the results are similar for most compounds. The most obvious dif-ferences, which cannot be explained by methodological differences, are the lower intake ofanthocyanidins in the USA and Australia and the higher intake of flavanones in the USA.
Regional differences and distributionsThere were large regional differences, both in the type of flavonoids consumed and the distri-bution of intake. We have discussed differences in the consumption of flavan-3-ols, in particu-lar gallated compounds and proanthocyanidins, in great detail previously [35], but there werealso noticeable differences for other compound classes. Intakes of anthocyanidins (in particularcyanidin) and flavanones (in particular hesperetin) were highest in the Northern Region, inparticular in Finland. In Finland, the main source of anthocyanidins where berries and smallfruits (18 mg/d) whereas the main source of flavanones were citrus fruits (20 mg/d). Interest-ingly, Finland had the highest intake of flavanones from citrus fruits in Europe, followed byItaly (17 mg/d) and Sweden (11 mg/d). Within the Central Region, there was also a large vari-ability of intake between countries. While overall flavonoid intake in Ireland was the highest in
Table 7. Mean andmedian flavonoid intake (in mg/d) in representative nutrition surveys and observational studies.
Country/Region
Flavan-3-ols
Anthocyanidins Flavonols Flavanones Flavones PA Thearubigins &Theaflavins
Study Assessmentmethod¶
Mean intake
Europe† 77 19 23 14 4 124 168 Current study Table 1
Europe 76 31 29 5 35 198 107 EPIC§ [34, 52–54] 24HDR
USA† 182 9.2 18 22 1 98 — NHANES [55] 24HDR
USA 79 8 15 26 1 — — Nurses Health Study II[56]
FFQ
Australia† — 2.9 21 7 1 — — Australian NationalNutrition Survey (NNS95)[47]
24HDR
Median intake
Europe† 35 3 8 1 1 27 89 Current study Table 1
USA 20 <1 9 40 <1 175‡ — Iowa Women’s Health [12] FFQ
USA 17 10 13 17 1 132‡ — Cancer Prevention StudyII [13]
FFQ
For observational studies, mean or median intake is based on the mean/median intake of quintile 3.†representative surveys;‡includes monomeric compounds;§non-weighed average of values;¶FFQ: food frequency questionnaire, 24HDR 24h dietary recall
doi:10.1371/journal.pone.0128132.t007
Flavonoid Intake in European Adults
PLOS ONE | DOI:10.1371/journal.pone.0128132 May 26, 2015 17 / 22

Europe, the intake of anthocyanidins was the lowest overall, and intake of flavanones was alsovery low.
In this and previous studies [35], we have included France in the Southern Region as dietaryintake was more comparable with intake in Italy and Spain. However, there are some importantdifferences, and the intake of flavan-3-ols and anthocyanidins in France is considerably higherthan in the other countries of the Southern Region.
The distribution of intake is very skewed, with higher mean than median intake. This is in par-ticular noticeable for compounds with high intake such as monomeric and polymeric flavan-3-ols[35], but also for other compounds. The largest difference between mean and median intake wasobserved in Germany where median intake for some flavan-3-ols, but also anthocyanidins, flava-nones and flavones was 0 mg/d. Although regional differences in dietary intake might be an expla-nation for this, as the Second German National Nutrition Survey [57] shows an almost two-foldregional variation in the consumption of fruit, the main sources of monomeric flavonoids apartfrom tea in Germany. However, data from EPIC Potsdam and EPIC Heidelberg show similarmean intake of anthocyanidins (34 mg/d and 37 mg/d respectively) [52] and similar results arealso found for flavanones (44 mg/d and 36 mg/d) and flavones (7 mg/d and 8 mg/d).
ImplicationsThe mean intake of flavonoids in Europe is lower than the amounts suspected to result in ad-verse effects [24] and it is therefore unlikely that the habitual intake is detrimental to health.However, the main focus of flavonoid research in the past decades has focused on their poten-tially beneficial effect. Mean intake of most flavonoids in Europe is broadly comparable withintake in observational studies conducted in the US [12–14, 56] and Europe [15, 23] benefits tohealth are therefore likely to be limited. However, mean intake of anthocyanidins in somecountries (Finland, Latvia and France) was similar or higher than intake in the top quintile inthe Nurses Health Study II, where high anthocyanidins intake was associated with a reducedrisk of myocardial infarction [56]. It was also higher than in the UK twin study [58], wherehigh anthocyanin intake was associated with improved vascular function.
Results from observational studies are ambiguous and failed to show a clear association be-tween flavonoid intake and health, especially for cardio-vascular diseases and all-cause mortali-ty. Studies investigating these associations did not show significant trends suggestive of a dose-response effect, and beneficial effects are mainly observed when comparing the quantiles withlowest and very low intake [13, 15]. As this pattern is observed in several observational studieswith a very wide range of flavonoid intake [12, 13, 15, 56, 59, 60], it is unlikely that there is athreshold effect. A similar pattern was observed for risk-factors of cardio-vascular diseases[61]. Conversely, a statistically significant trend suggesting a dose response effect was observedfor associations with type 2 diabetes in Europe [23] and the US [62].
Previously, we have shown that flavan-3-ol intake in the general public is much lower thanthe amounts used in most dietary intervention studies [33] and that it is unlikely that theamount consumed has a direct impact on vascular health. While there are several systematicreviews and meta-analyses for flavan-3-ols [33, 63, 64], there is a paucity of similar data forother compounds. A recent review of dietary intervention studies with berry polyphenolsfound that most intervention studies were conducted with anthocyanidin intakes in excess of200 mg/d, which is much higher than the usual intake in Europe.
ConclusionOur results provide a detailed overview of flavonoid consumption in European adults. Theseresults allow for a comparison of habitual intake in the general public with the amounts used in
Flavonoid Intake in European Adults
PLOS ONE | DOI:10.1371/journal.pone.0128132 May 26, 2015 18 / 22

dietary intervention studies. Our data suggest that habitual intake of most compounds is likelytoo low to result in a reduced risk of cardio-vascular diseases, but also too low to result in ad-verse effects. However, a lack of systematic reviews and meta-analyses of intervention studiesmakes these comparisons difficult. Further research is required to investigate the potentialhealth benefits of flavonoids, in particular the primary prevention of chronic diseases in thegeneral public. It is in particular important to use standardised and validated analytical meth-ods and a consistent nomenclature of compounds to ensure that results are comparable. Fur-thermore, the development of improved dietary assessment methods, especially usingnutritional biomarkers, is important to investigate the potential health effects of flavonoids inlarger observational studies.
An important result of our study was the skewed distribution of flavonoid intake, especiallyin Belgium and Germany. In both countries, half of the adult population consumed only negli-gible amounts of monomeric and polymeric flavonoids. Most observational studies conductedso far have found the highest risk of cardio-vascular diseases with very low flavonoid intake[12–14], and even though it is not clear whether this is due to dietary or other factors, it is im-portant to investigate whether these dietary patterns have an impact on public health.
Supporting InformationS1 File. Flavonoid intake in adults in the European Union by country and individual food(CSV)
AcknowledgmentsWe thank the members of the FLAVIOLA consortium for their critical review ofthe manuscript.
Author ContributionsAnalyzed the data: AV AAMMAHL RNL GGCK. Wrote the paper: AV AAMMAHL RNLJPES HS KTK GGCK.
References1. Hollman PCH, Hertog MGL, Katan MB. Analysis and health effects of flavonoids. Food Chemistry.
1996; 57(1):43–6. doi: papers3://publication/doi/10.1016/0308-8146(96)00065-9.
2. Strack D. Phenolic metabolism. In: Dey PM, Harborne JB, editors. Plant biochemistry. 3rd ed. SanDiego: Academic Press; 1997. p. 387–416.
3. Wasson AP, Pellerone FI, Mathesius U. Silencing the flavonoid pathway in Medicago truncatula inhibitsroot nodule formation and prevents auxin transport regulation by rhizobia. The Plant cell. 2006; 18(7):1617–29. doi: 10.1105/tpc.105.038232 PMID: 16751348; PubMed Central PMCID: PMC1488924.
4. Schroeder I. Pharmacopoeia medico-chymica, sive thesaurus pharmacologeus. UlmaeSuevorum1655.
5. Berends KAW. Handbuch der praktischen Arzneiwissenschaft oder der speziellen Pathologie undTherapie. Berlin: Enslin; 1829.
6. Armentano L, Bentsáth A, Béres T, Rusnyák S, Szent-Györgzi A. Über den Einfluß von Substanzen derFlavongruppe auf die Permeabilität der Kapillaren. Vitamin P. Deutsche Medizinische Wochenschrift.1936; 62(32):1325–8.
7. Zilva SS. Vitamin P. 3. Biochemical Journal. 1949; 45(1):79–83. PMID: 18148608
8. Jaeger A, Wälti M, Neftel KA. Side effects of flavonoids in medical practice. Progress in Clinical and Bio-logical Research. 1988; 280:379–94. PMID: 2971975
9. Hollenberg NK, Martinez G, McCullough M, Meinking T, Passan D, Preston M, et al. Aging, accultura-tion, salt intake, and hypertension in the Kuna of Panama. Hypertension. 1997; 29(1 Pt 2):171–6. doi:10.1161/01.HYP.29.1.171 PMID: 9039098.
Flavonoid Intake in European Adults
PLOS ONE | DOI:10.1371/journal.pone.0128132 May 26, 2015 19 / 22

10. Hertog MG, Feskens EJ, Hollman PC, Katan MB, Kromhout D. Dietary antioxidant flavonoids and riskof coronary heart disease: the Zutphen Elderly Study. Lancet. 1993; 342(8878):1007–11. PMID:8105262.
11. Keli SO, Hertog MG, Feskens EJ, Kromhout D. Dietary flavonoids, antioxidant vitamins, and incidenceof stroke: the Zutphen study. 1996; 156(6):637–42. PMID: 8629875.
12. Mink PJ, Scrafford CG, Barraj LM, Harnack L, Hong C-P, Nettleton JA, et al. Flavonoid intake and car-diovascular disease mortality: a prospective study in postmenopausal women. The American journal ofclinical nutrition. 2007; 85(3):895–909. PMID: 17344514.
13. McCulloughML, Peterson JJ, Patel R, Jacques PF, Shah R, Dwyer JT. Flavonoid intake and cardiovas-cular disease mortality in a prospective cohort of US adults. American Journal of Clinical Nutrition.2012; 95(2):454–64. doi: 10.3945/ajcn.111.016634 PMID: 22218162; PubMed Central PMCID:PMCPMC3260072.
14. Cassidy A, Rimm EB, O’ Reilly EJ, Logroscino G, Kay C, Chiuve SE, et al. Dietary flavonoids and risk ofstroke in women. Stroke; a journal of cerebral circulation. 2012; 43(4):946–51. doi: 10.1161/STROKEAHA.111.637835 PMID: 22363060; PubMed Central PMCID: PMCPMC3360888.
15. Vogiatzoglou A, Mulligan AA, Bhaniani A, Lentjes MA, McTaggart A, Luben RN, et al. Associations be-tween flavan-3-ol intake and CVD risk in the Norfolk cohort of the European Prospective Investigationinto Cancer (EPIC-Norfolk). Free Radic Biol Med. 2015. doi: 10.1016/j.freeradbiomed.2015.03.005PMID: 25795512.
16. Williams RJ, Spencer JP, Rice-Evans C. Flavonoids: antioxidants or signalling molecules? Free Radi-cal Biology and Medicine. 2004; 36(7):838–49. PMID: 15019969
17. Wang X, Ouyang YY, Liu J, Zhao G. Flavonoid intake and risk of CVD: a systematic review and meta-analysis of prospective cohort studies. Br J Nutr. 2014; 111(1):1–11. doi: 10.1017/S000711451300278X PMID: 23953879.
18. Hui C, Qi X, Qianyong Z, Xiaoli P, Jundong Z, Mantian M. Flavonoids, flavonoid subclasses and breastcancer risk: a meta-analysis of epidemiologic studies. PLoS One. 2013; 8(1):e54318. doi: 10.1371/journal.pone.0054318 PMID: 23349849; PubMed Central PMCID: PMC3548848.
19. Woo HD, Kim J. Dietary flavonoid intake and risk of stomach and colorectal cancer. World journal ofgastroenterology: WJG. 2013; 19(7):1011–9. doi: 10.3748/wjg.v19.i7.1011 PMID: 23467443; PubMedCentral PMCID: PMC3581988.
20. Woo HD, Kim J. Dietary flavonoid intake and smoking-related cancer risk: a meta-analysis. PLoS One.2013; 8(9):e75604. doi: 10.1371/journal.pone.0075604 PMID: 24069431; PubMed Central PMCID:PMC3777962.
21. Tang N-P, Zhou B, Wang B, Yu R-B, Ma J. Flavonoids Intake and Risk of Lung Cancer: A Meta-analy-sis. Japanese Journal of Clinical Oncology. 2009; 39(6):352–9. doi: 10.1093/jjco/hyp028 PMID:19351659
22. Wang L, Lee I-M, Zhang SM, Blumberg JB, Buring JE, Sesso HD. Dietary intake of selected flavonols,flavones, and flavonoid-rich foods and risk of cancer in middle-aged and older women. The AmericanJournal of Clinical Nutrition. 2009; 89(3):905–12. doi: 10.3945/ajcn.2008.26913 PMID: 19158208
23. Zamora-Ros R, Forouhi NG, Sharp SJ, Gonzalez CA, Buijsse B, Guevara M, et al. Dietary intakes of in-dividual flavanols and flavonols are inversely associated with incident type 2 diabetes in European pop-ulations. J Nutr. 2014; 144(3):335–43. doi: 10.3945/jn.113.184945 PMID: 24368432; PubMed CentralPMCID: PMC3927546.
24. Martinez SE, Davies NM, Reynolds JK. Toxicology and safety of flavonoids. In: Davies NM, Yáñez JA,editors. Flavonoid Pharmacokinetics: Methods of Analysis, Preclinical and Clinical Pharmacokinetics,Safety, and Toxicology. Hoboken, New Jersey: JohnWiley & Son; 2012.
25. Mazzanti G, Menniti-Ippolito F, Moro PA, Cassetti F, Raschetti R, Santuccio C, et al. Hepatotoxicityfrom green tea: a review of the literature and two unpublished cases. European journal of clinical phar-macology. 2009; 65(4):331–41. doi: 10.1007/s00228-008-0610-7 PMID: 19198822.
26. Quadri F, Neftel K, Zwahlen H, Marone C. Catergen-induced immune hemolytic anemia following sen-sitization by other flavonoids. Schweizerische Rundschau Medizin Praxis. 1987; 76(48):1338–40.PMID: 3432825
27. Wälti M, Neftel KA, Jost R, Jaeger A, Berg P, Heinzel F, et al. IE and IgG antibodies against flavonoidsfollowing therapy with flavonoid-containing drugs]. Schweizerische MedizinischeWochenschrift. 1986;116(4):98–103. PMID: 2937144
28. Bandele OJ, Clawson SJ, Osheroff N. Dietary Polyphenols as Topoisomerase II Poisons: B Ring and CRing Substituents Determine the Mechanism of Enzyme-Mediated DNA Cleavage Enhancement.Chemical Research in Toxicology. 2008; 21(6):1253–60. doi: 10.1021/tx8000785 PMID: 18461976
Flavonoid Intake in European Adults
PLOS ONE | DOI:10.1371/journal.pone.0128132 May 26, 2015 20 / 22
29. Strick R, Strissel PL, Borgers S, Smith SL, Rowley JD. Dietary bioflavonoids induce cleavage in theMLL gene and may contribute to infant leukemia. Proceedings of the National Academy of Sciences.2000; 97(9):4790–5. doi: 10.1073/pnas.070061297 PMID: 10758153
30. Pendleton M, Lindsey RH, Felix CA, Grimwade D, Osheroff N. Topoisomerase II and leukemia. Annalsof the New York Academy of Sciences. 2014; 1310(1):98–110. doi: 10.1111/nyas.12358 PMID:24495003
31. Yáñez JA, Chemuturi NV, Womble SW, Sayre CL, Davies NM. Flavonoids and drug interactions. In:Davies NM, Yáñez JA, editors. Flavonoid Pharmacokinetics: Methods of Analysis, Preclinical and Clini-cal Pharmacokinetics, Safety, and Toxicology. Hoboken, New Jersey: JohnWiley & Sons; 2012.
32. Lupton JR, Atkinson SA, Chang N, Fraga CG, Levy J, Messina M, et al. Exploring the benefits and chal-lenges of establishing a DRI-like process for bioactives. Eur J Nutr. 2014; 53 Suppl 1:1–9. doi: 10.1007/s00394-014-0666-3 PMID: 24566766.
33. Hooper L, Kay C, Abdelhamid A, Kroon PA, Cohn JS, Rimm EB, et al. Effects of chocolate, cocoa, andflavan-3-ols on cardiovascular health: a systematic review and meta-analysis of randomized trials.American Journal of Clinical Nutrition. 2012; 95(3):740–51. doi: 10.3945/ajcn.111.023457 PMID:22301923.
34. Zamora-Ros R, Knaze V, Lujan-Barroso L, Slimani N, Romieu I, Fedirko V, et al. Estimated dietary in-takes of flavonols, flavanones and flavones in the European Prospective Investigation into Cancer andNutrition (EPIC) 24 hour dietary recall cohort. Br J Nutr. 2011; 106(12):1915–25. doi: 10.1017/S000711451100239X PMID: 21679483.
35. Vogiatzoglou A, Mulligan AA, Luben RN, Lentjes MAH, Heiss C, Kelm M, et al. Assessment of the die-tary intake of total flavan-3-ols, monomeric flavan-3-ols, proanthocyanidins and theaflavins in the Euro-pean Union. British Journal of Nutrition. 2014; 111(8):1463–73. doi: 10.1017/S0007114513003930PMID: 24331295
36. The EFSA Comprehensive European Food Consumption Database [Internet]. 2011.
37. Food classification [Internet]. 2011.
38. USDA. USDA Database for the Flavonoid Content of Selected Foods. Beltsville: MD: US Departmentof Agriculture; 2011. doi: 10.1080/21551197.2012.702530 PMID: 22888838
39. USDA. USDA Database for the Proanthocyanidin Content of Selected Foods. Beltsville, MD: US De-partment of Agriculture; 2007.
40. Neveu V, Perez-Jimenez J, Vos F, Crespy V, du Chaffaut L, Mennen L, et al. Phenol-Explorer: an on-line comprehensive database on polyphenol contents in foods. Database (Oxford). 2010; 2010:bap024. Epub 2010/04/30. doi: 10.1093/database/bap024 PMID: 20428313; PubMed Central PMCID:PMC2860900.
41. Welch AA, McTaggart A, Mulligan AA, Luben R, Walker N, Khaw KT, et al. DINER (Data Into Nutrientsfor Epidemiological Research)—a new data-entry program for nutritional analysis in the EPIC-Norfolkcohort and the 7-day diary method. Public Health Nutr. 2001; 4(6):1253–65. Epub 2002/02/14. doi:S136898000100115X [pii]. PMID: 11796089.
42. Crozier A, Lean M, McDonald M, Black C. Quantitative analysis of the flavonoid content of commercialtomatoes, onions, lettuces, and celery. J Agric Food Chem. 1997; 45:590–5.
43. Lentjes MAH, McTaggart A, Mulligan AA, Powell NA, Parry-Smith D, Luben RN, et al. Dietary intakeusing 7-day diaries in British men and women in the EPIC-Norfolk Study: a focus on methodologicalissures. British Journal of Nutrition. 2013;in press.
44. Holland B, Welch AA, Unwin I, Buss D, Paul A, Southgate D. McCance andWiddowson's TheComposition of Foods1991.
45. Ward HA, Kuhnle GGC. Phytoestrogen consumption and association with breast, prostate and colorec-tal cancer in EPIC Norfolk. Archives of Biochemistry and Biophysics. 2010; 501(1):170–5. doi: 10.1016/j.abb.2010.05.018 PMID: 20494649
46. Team RC. R: A language and environment for statistical computing. Vienna, Austria: R Foundation forStatistical Computing; 2014. doi: 10.1016/j.jneumeth.2014.06.019 PMID: 24970579
47. Johannot L, Somerset SM. Age-related variations in flavonoid intake and sources in the Australian pop-ulation. Public Health Nutr. 2006; 9(8):1045–54. Epub 2006/11/28. doi: S1368980006009712 [pii].PMID: 17125569.
48. Justesen U, Knuthsen P, Leth T. Determination of plant polyphenols in Danish foodstuffs by HPLC-UVand LC-MS detection. Cancer Lett. 1997; 114(1–2):165–7. Epub 1997/03/19. doi: S0304-3835(97)04651-X. PMID: 9103280.
49. Hertog MG, Hollman PC, Katan MB, Kromhout D. Intake of potentially anticarcinogenic flavonoids andtheir determinants in adults in The Netherlands. Nutr Cancer. 1993; 20(1):21–9. Epub 1993/01/01. doi:10.1080/01635589309514267 PMID: 8415127.
Flavonoid Intake in European Adults
PLOS ONE | DOI:10.1371/journal.pone.0128132 May 26, 2015 21 / 22

50. Commenges D, Scotet V, Renaud S, Jacqmin-Gadda H, Barberger-Gateau P, Dartigues JF. Intake offlavonoids and risk of dementia. European Journal of Epidemiology. 2000; 16(4):357–63. PMID:10959944
51. Beking K, Vieira A. An assessment of dietary flavonoid intake in the UK and Ireland. Int J Food Sci Nutr.2011; 62(1):17–9. doi: 10.3109/09637486.2010.511165 PMID: 20858155.
52. Zamora-Ros R, Knaze V, Lujan-Barroso L, Slimani N, Romieu I, Touillaud M, et al. Estimation of the in-take of anthocyanidins and their food sources in the European Prospective Investigation into Cancerand Nutrition (EPIC) study. The British journal of nutrition. 2011:1–10. doi: 10.1017/S0007114511001437 PMID: 22018161
53. Knaze V, Zamora-Ros R, Lujan-Barroso L, Romieu I, Scalbert A, Slimani N, et al. Intake estimation oftotal and individual flavan-3-ols, proanthocyanidins and theaflavins, their food sources and determi-nants in the European Prospective Investigation into Cancer and Nutrition (EPIC) study. The Britishjournal of nutrition. 2012; 108(6):1095–108. doi: 10.1017/S0007114511006386 PMID: 22186699.
54. Zamora-Ros R, Knaze V, Romieu I, Scalbert A, Slimani N, Clavel-Chapelon F, et al. Impact of thearubi-gins on the estimation of total dietary flavonoids in the European Prospective Investigation into Cancerand Nutrition (EPIC) study. Eur J Clin Nutr. 2013; 67(7):779–82. doi: 10.1038/ejcn.2013.89 PMID:23612513.
55. Bai W, Wang C, Ren C. Intakes of total and individual flavonoids by US adults. Int J Food Sci Nutr.2014; 65(1):9–20. doi: 10.3109/09637486.2013.832170 PMID: 24020353.
56. Cassidy A, Mukamal KJ, Liu L, Franz M, Eliassen AH, Rimm EB. High anthocyanin intake is associatedwith a reduced risk of myocardial infarction in young and middle-aged women. Circulation. 2013; 127(2):188–96. doi: 10.1161/CIRCULATIONAHA.112.122408 PMID: 23319811; PubMed Central PMCID:PMC3762447.
57. Max Rubner-Institut. Ergebnisbericht der Nationalen Verzehrsstudie II. Karlsruhe: 2008.
58. Jennings A, Welch AA, Fairweather-Tait SJ, Kay C, Minihane AM, Chowienczyk P, et al. Higher antho-cyanin intake is associated with lower arterial stiffness and central blood pressure in women. Am J ClinNutr. 2012; 96(4):781–8. doi: 10.3945/ajcn.112.042036 PMID: 22914551.
59. Tresserra-Rimbau A, Rimm EB, Medina-Remon A, Martinez-Gonzalez MA, Lopez-Sabater MC, CovasMI, et al. Polyphenol intake and mortality risk: a re-analysis of the PREDIMED trial. BMCMed. 2014;12:77. doi: 10.1186/1741-7015-12-77 PMID: 24886552; PubMed Central PMCID: PMC4102266.
60. Cassidy A, O’Reilly EJ, Kay C, Sampson L, Franz M, et al. Habitual intake of flavonoid subclasses andincident hypertension in adults. American Journal of Clinical Nutrition. 2010. doi: 10.3945/ajcn.110.006783
61. Cassidy A, O’Reilly EJ, Kay C, Sampson L, Franz M, Forman J, et al. Habitual intake of flavonoid sub-classes and incident hypertension in adults. American Journal of Clinical Nutrition. 2011; 93(2):338–47.doi: 10.3945/ajcn.110.006783 PMID: 21106916.
62. Wedick NM, Pan A, Cassidy A, Rimm EB, Sampson L, Rosner B, et al. Dietary flavonoid intakes andrisk of type 2 diabetes in US men and women. Am J Clin Nutr. 2012; 95(4):925–33. doi: 10.3945/ajcn.111.028894 PMID: 22357723; PubMed Central PMCID: PMC3302366.
63. Ellinger S, Reusch A, Stehle P, Helfrich H-P. Epicatechin ingested via cocoa products reduces bloodpressure in humans: a nonlinear regression model with a Bayesian approach. American Journal of Clin-ical Nutrition. 2012; 95(6):1365–77. doi: 10.3945/ajcn.111.029330 PMID: 22552030.
64. Ried K, Sullivan T, Fakler P, Frank OR, Stocks NP. Effect of cocoa on blood pressure. Cochrane Data-base of Systematic Reviews. 2012;(8: ):1–83. doi: 10.1002/14651858.CD008893.pub2
Flavonoid Intake in European Adults
PLOS ONE | DOI:10.1371/journal.pone.0128132 May 26, 2015 22 / 22