Flavio H. Fenton Cornell University -...
78
Atrial Fibrillation: Modeling Overview Flavio H. Fenton Cornell University
Transcript of Flavio H. Fenton Cornell University -...
Atrial Fibrillation: Modeling Overview
Flavio H. Fenton
Cornell University

Ventricular fibrillationVentricular tachycardia
Atrial fibrillationNormal sinus rhythm
What Underlies
Arrhythmias?
To understand how arrhythmias form, we must go beyond
the mechanical function of the heart to the electrical.
Arrhythmias develop from disruptions in the normal
electrical activation of the heart.
How does electricity play a role in the heart, and how do
such disruptions of normal electrical activity occur?
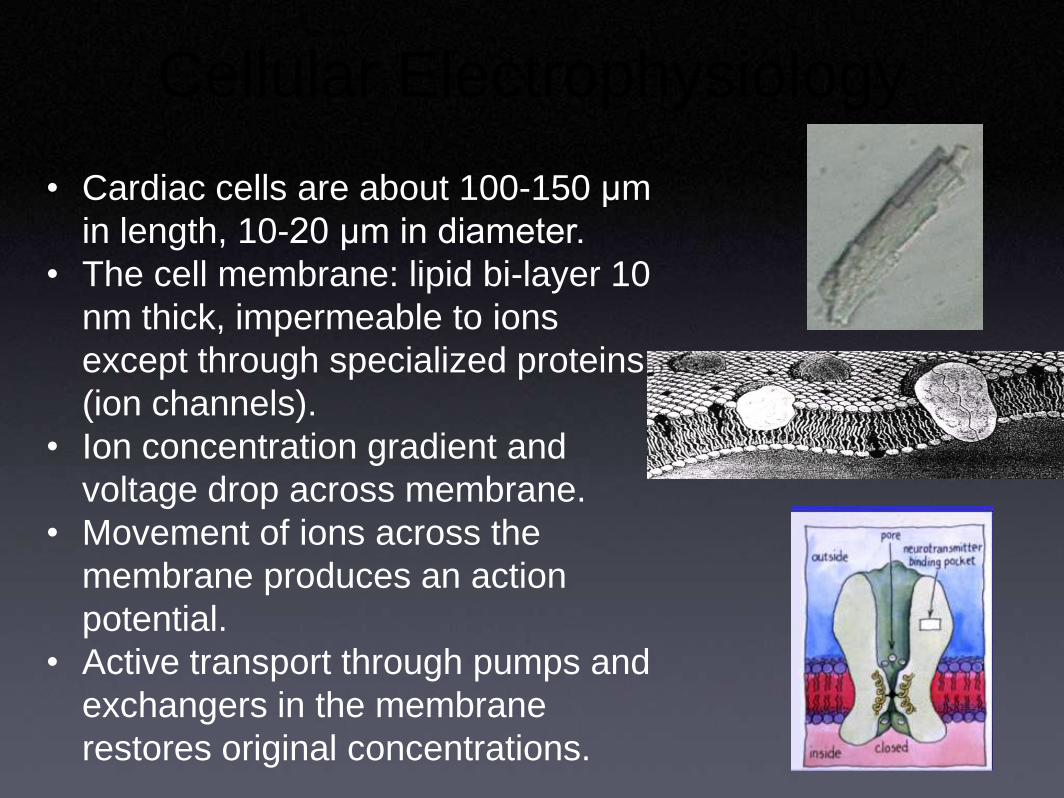
Cellular Electrophysiology
• Cardiac cells are about 100-150 μm
in length, 10-20 μm in diameter.
• The cell membrane: lipid bi-layer 10
nm thick, impermeable to ions
except through specialized proteins
(ion channels).
• Ion concentration gradient and
voltage drop across membrane.
• Movement of ions across the
membrane produces an action
potential.
• Active transport through pumps and
exchangers in the membrane
restores original concentrations.
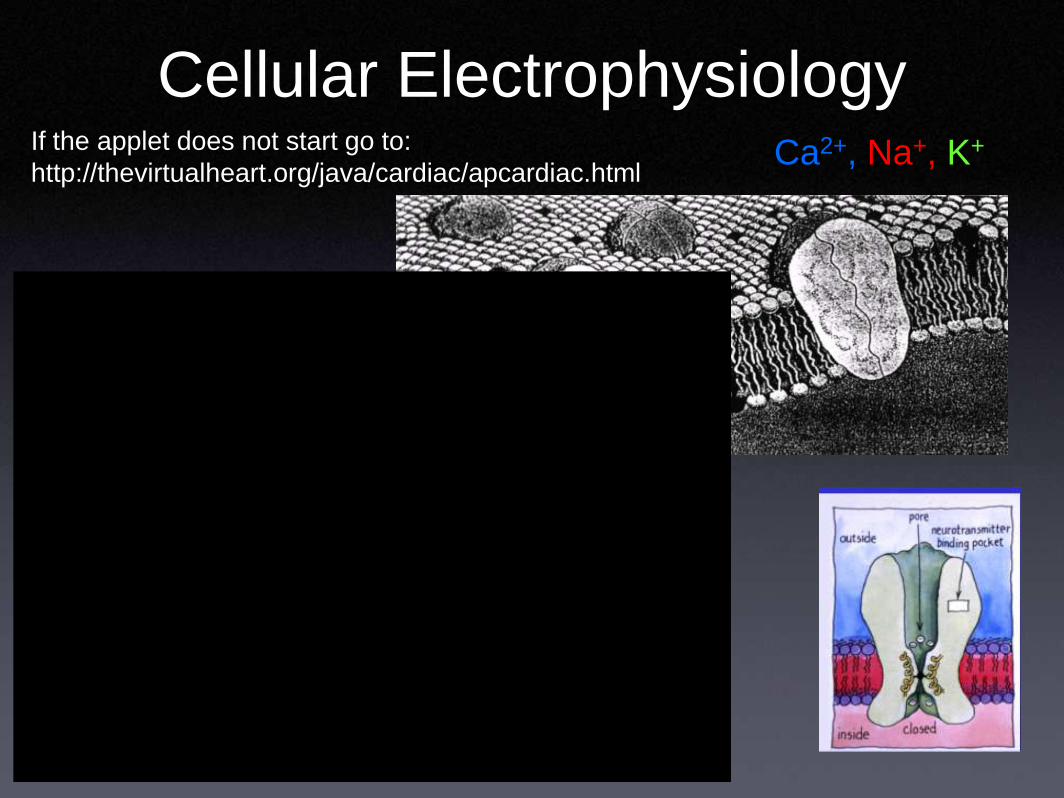
Cellular ElectrophysiologyCa2+, Na+, K+If the applet does not start go to:
http://thevirtualheart.org/java/cardiac/apcardiac.html
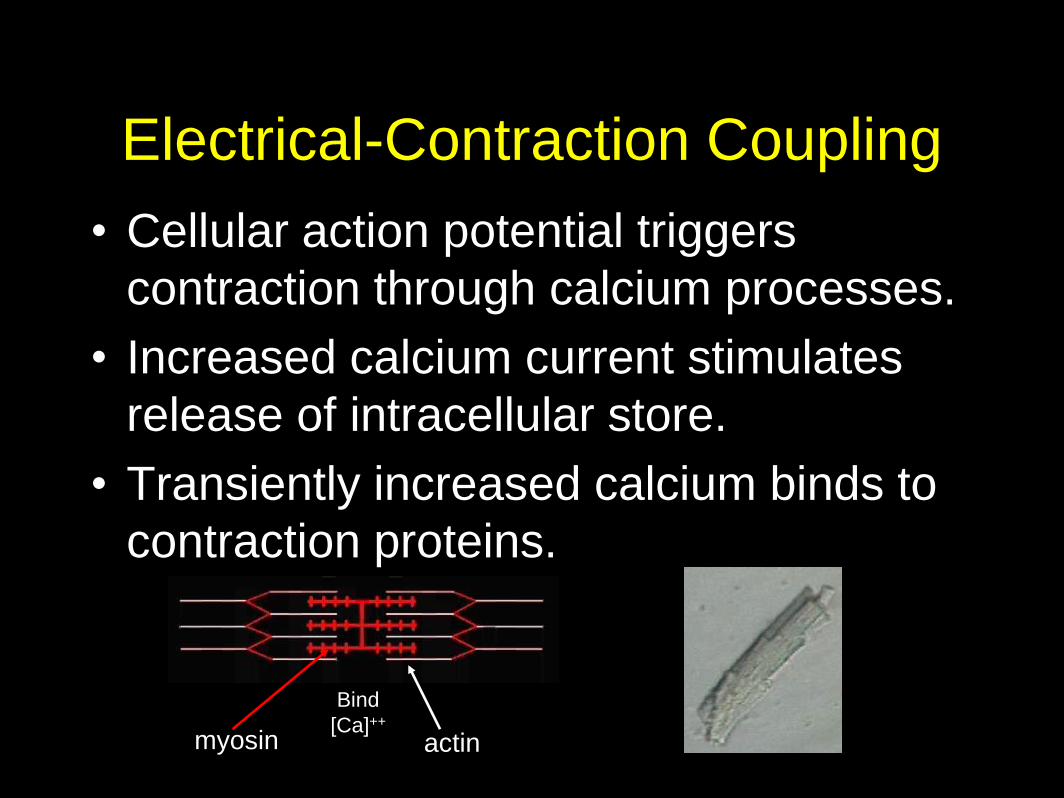
myosin actin
Bind
[Ca]++
Electrical-Contraction Coupling
• Cellular action potential triggers
contraction through calcium processes.
• Increased calcium current stimulates
release of intracellular store.
• Transiently increased calcium binds to
contraction proteins.
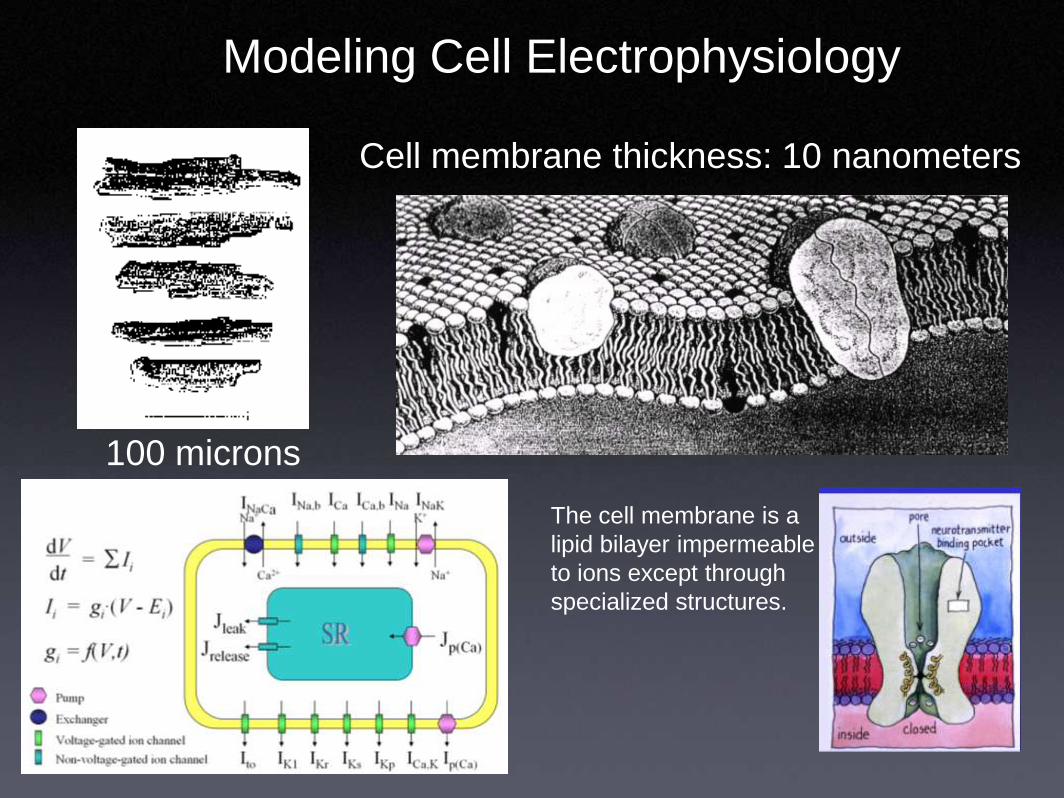
100 microns
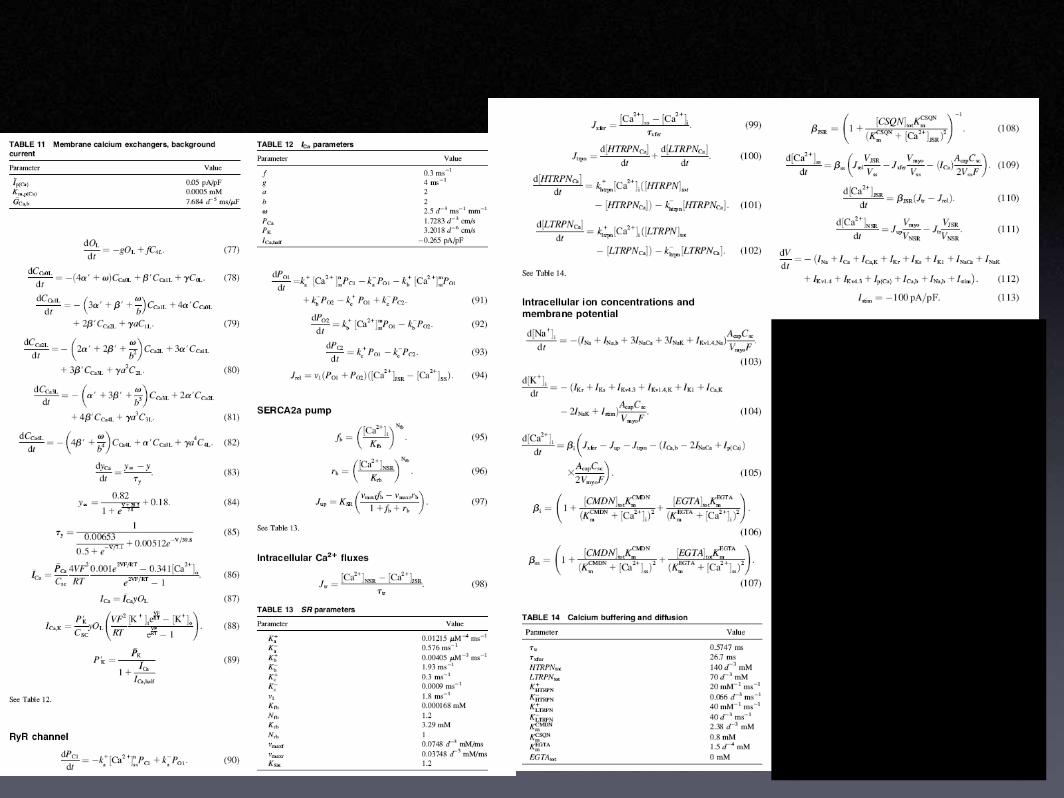
Modeling Cell Electrophysiology
The cell membrane is a
lipid bilayer impermeable
to ions except through
specialized structures.
Cell membrane thickness: 10 nanometers

Iyer et al
Human cardiac
cell model
(67 Variables)

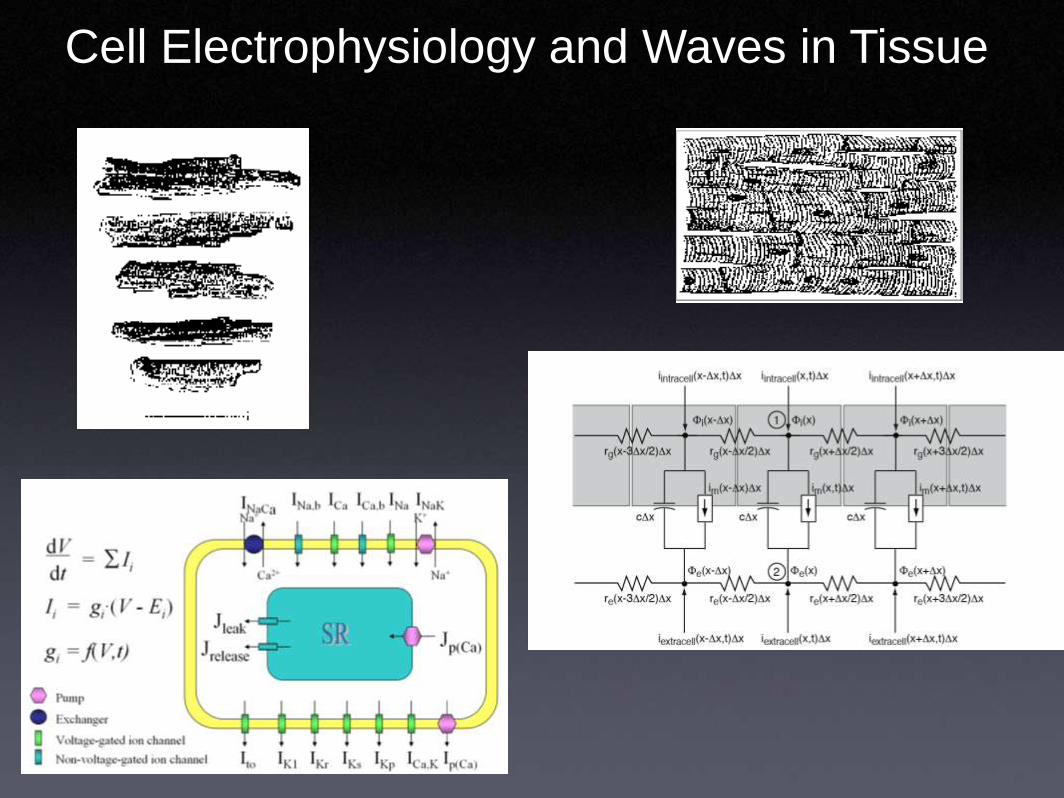
Cell Electrophysiology and Waves in Tissue
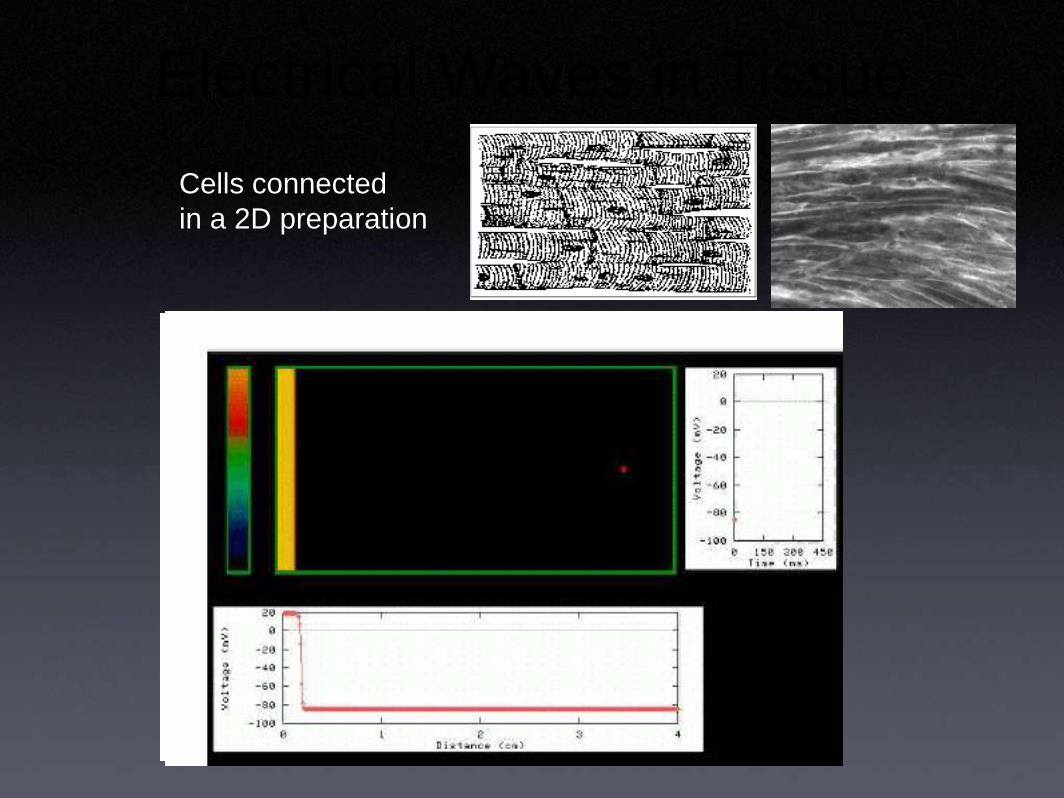
Cells connected
in a 2D preparation
Electrical Waves in Tissue
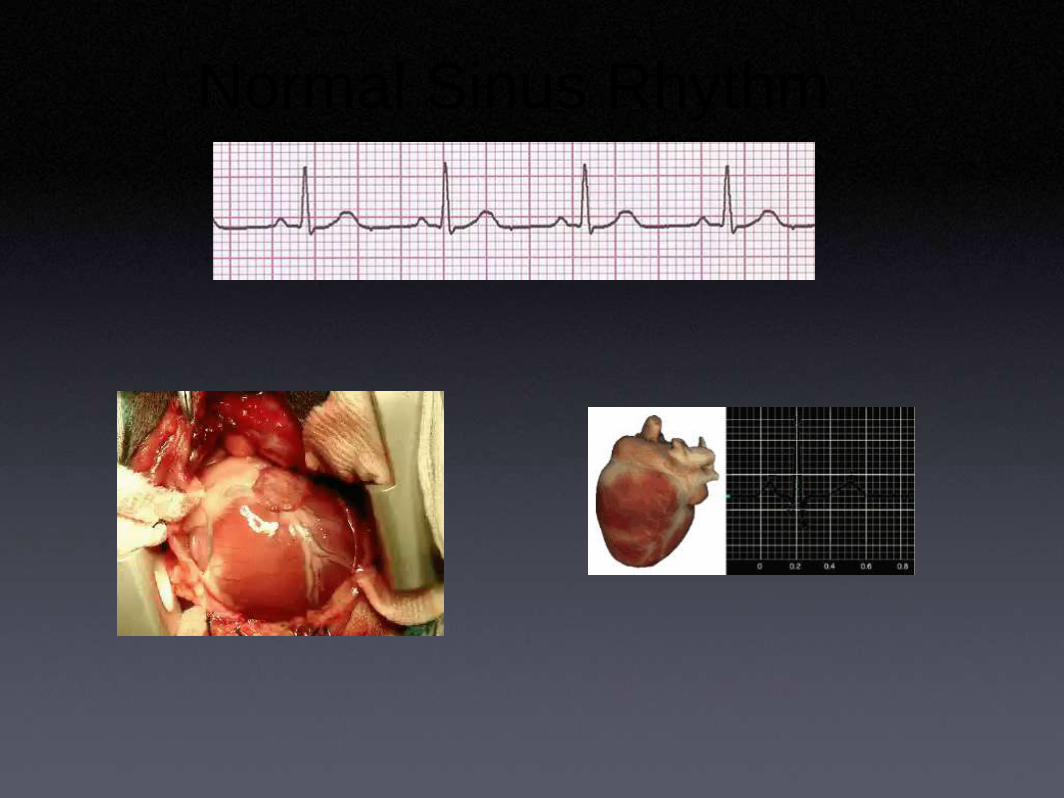
Normal Sinus Rhythm
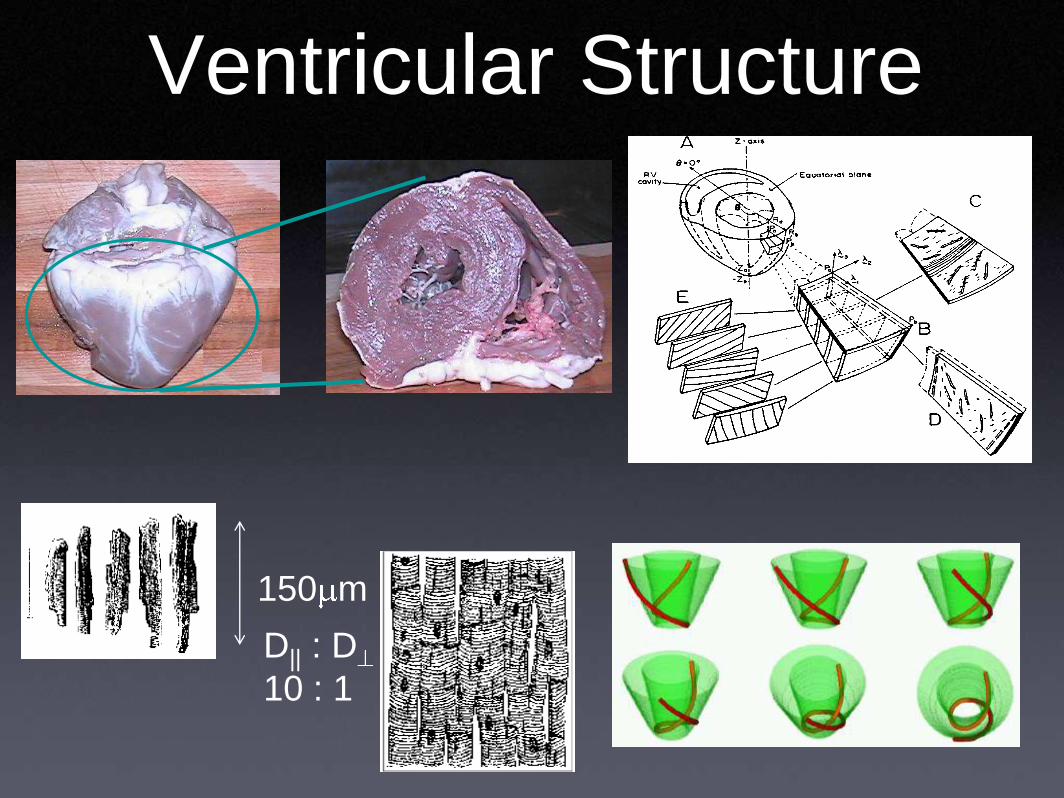
Ventricular Structure
150 m
D|| : D
10 : 1

Ventricular Structure
Rabbit
Canine
Porcine
150 m
D|| : D
10 : 1
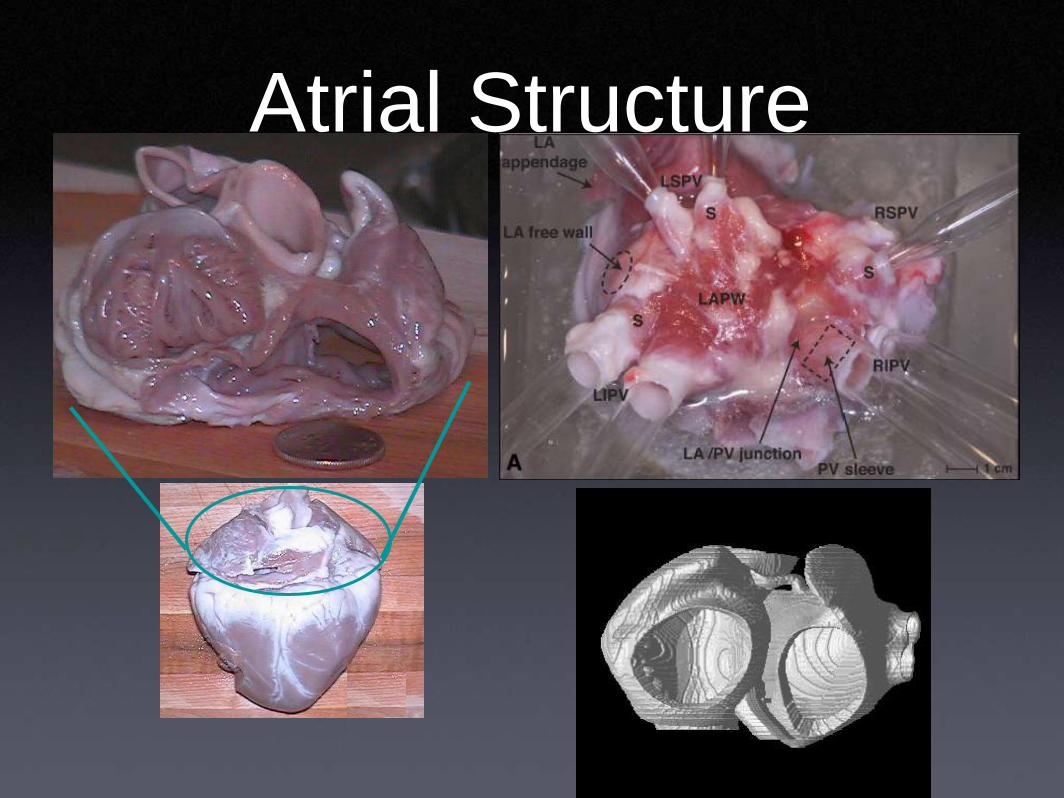
Atrial Structure
Visualization of
Electrical Activity in the
Heart
Visualizing Electrical Activity
• Computer simulations.
– Mathematical models of cellular
electrophysiology.
• Optical mapping.
– Fluorescence recordings using voltage-
sensitive dyes.
– Intensity proportional to membrane
potential.
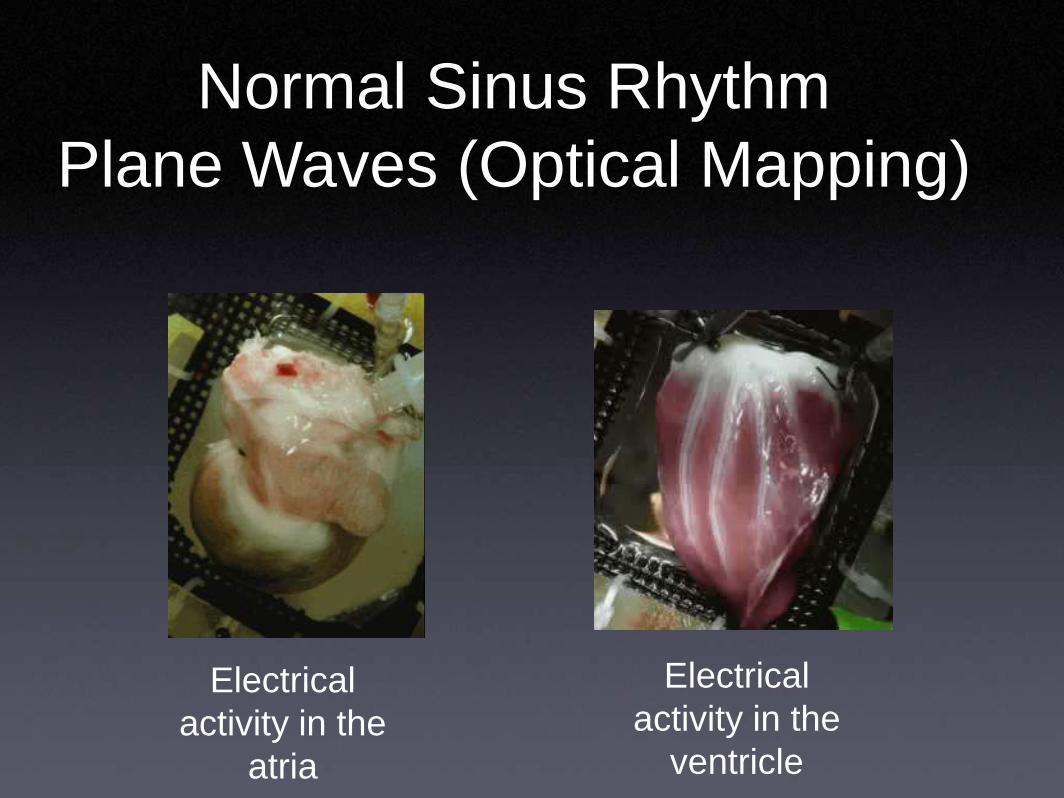
Normal Sinus Rhythm
Plane Waves (Optical Mapping)
Electrical
activity in the
atria
Electrical
activity in the
ventricle
Spiral Waves in the
Heart
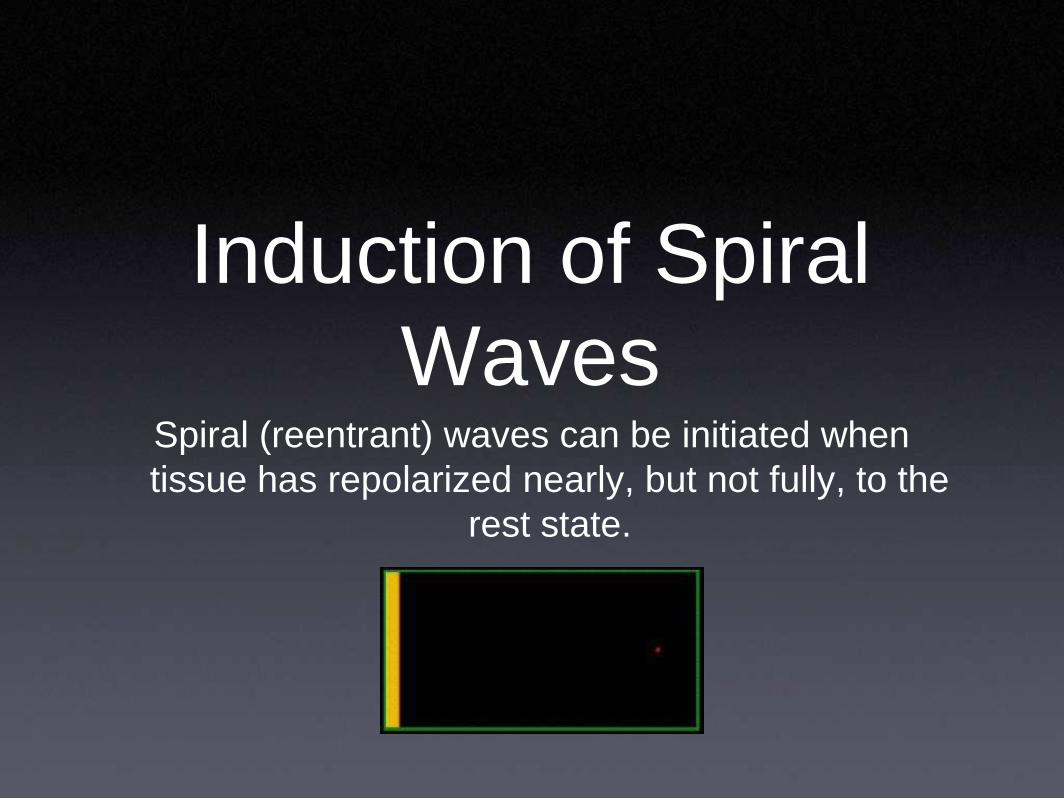
Induction of Spiral
WavesSpiral (reentrant) waves can be initiated when
tissue has repolarized nearly, but not fully, to the
rest state.
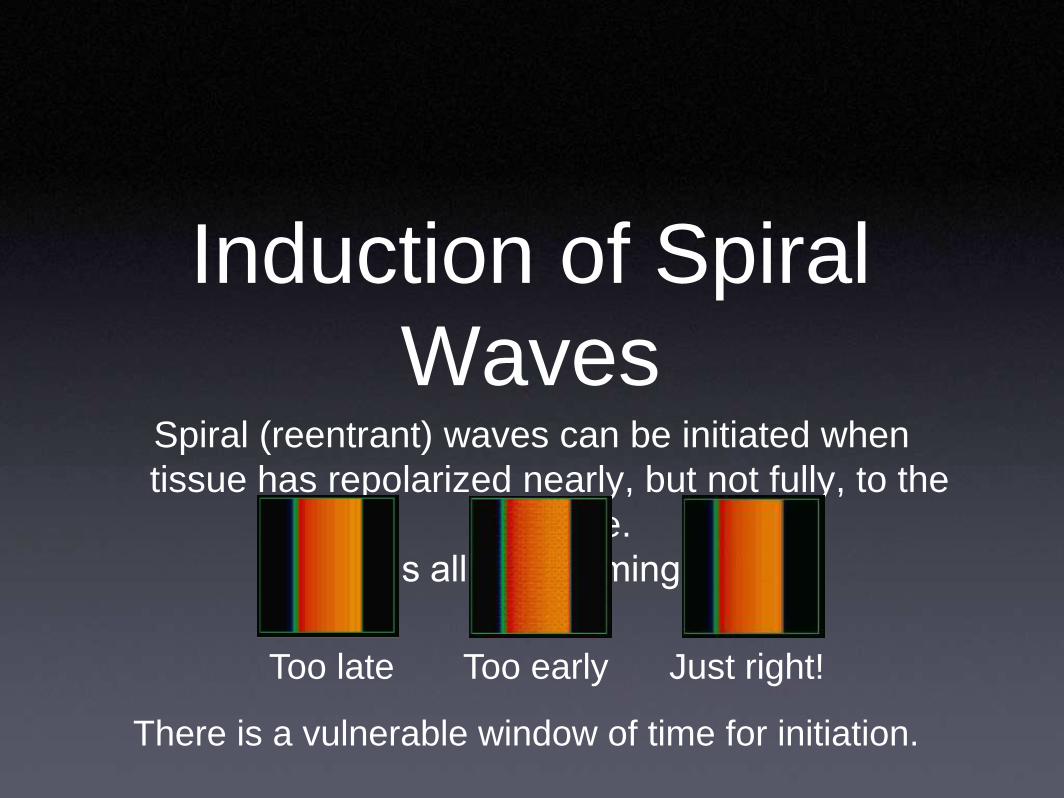
Induction of Spiral
WavesSpiral (reentrant) waves can be initiated when
tissue has repolarized nearly, but not fully, to the
rest state.
It’s all about timing!
Too late Too early Just right!
There is a vulnerable window of time for initiation.
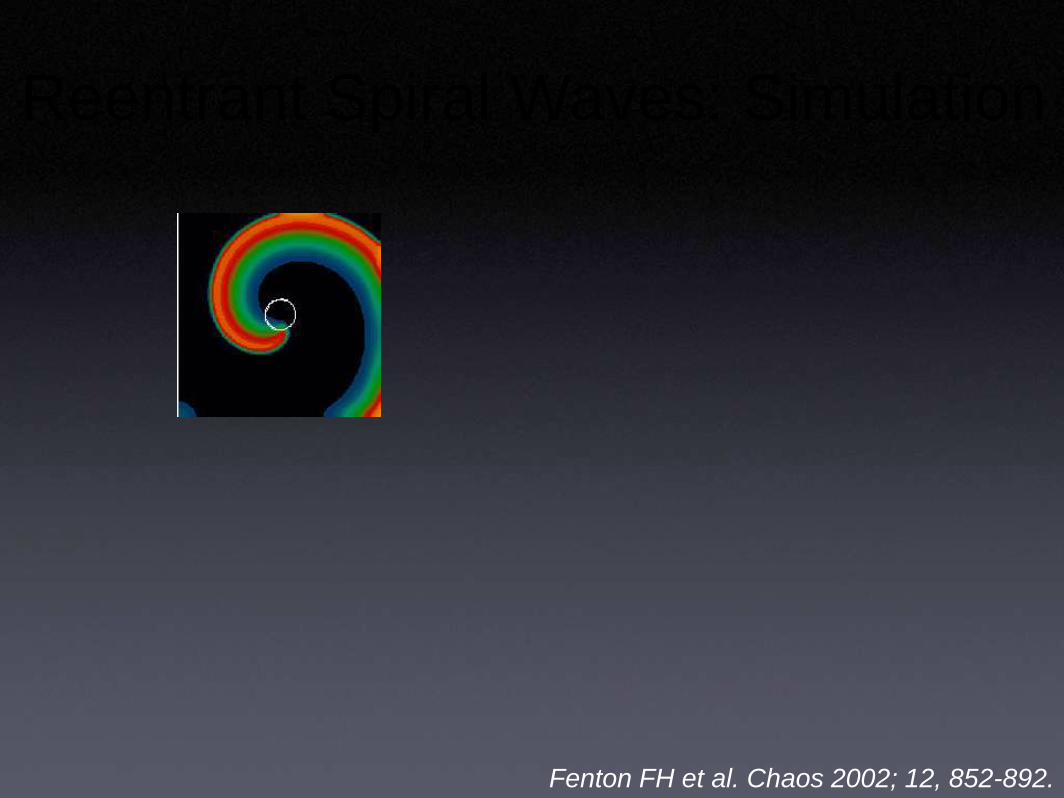
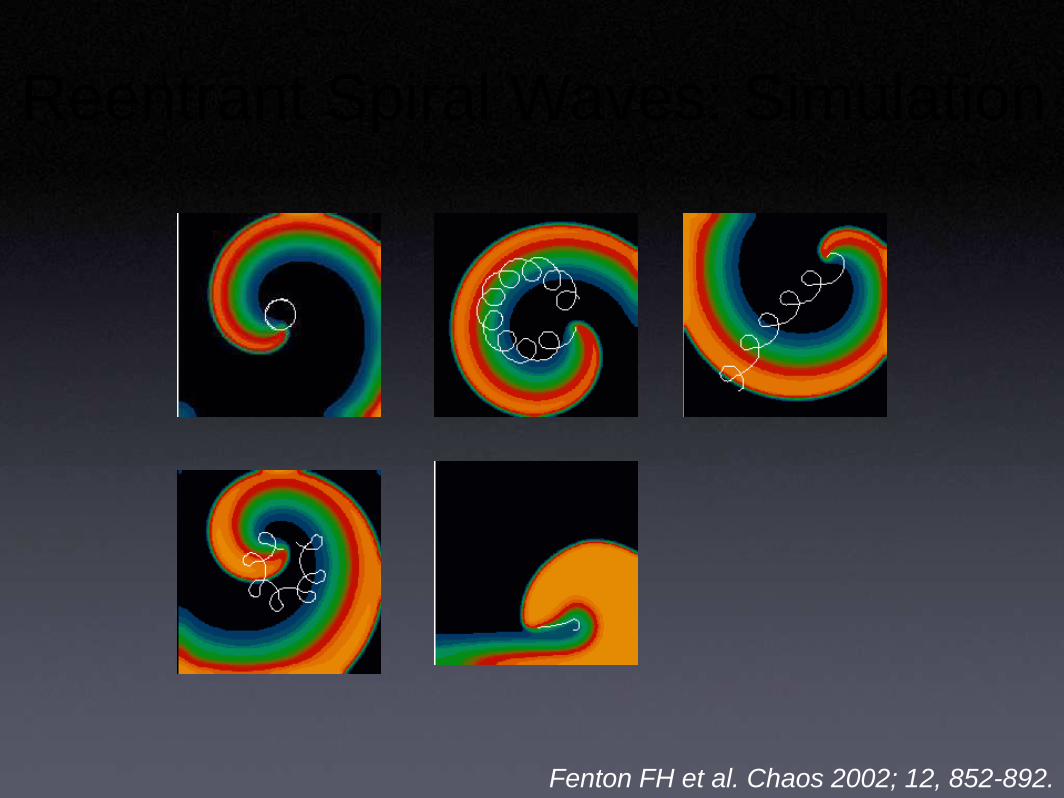
Reentrant Spiral Waves: Simulation
Fenton FH et al. Chaos 2002; 12, 852-892.
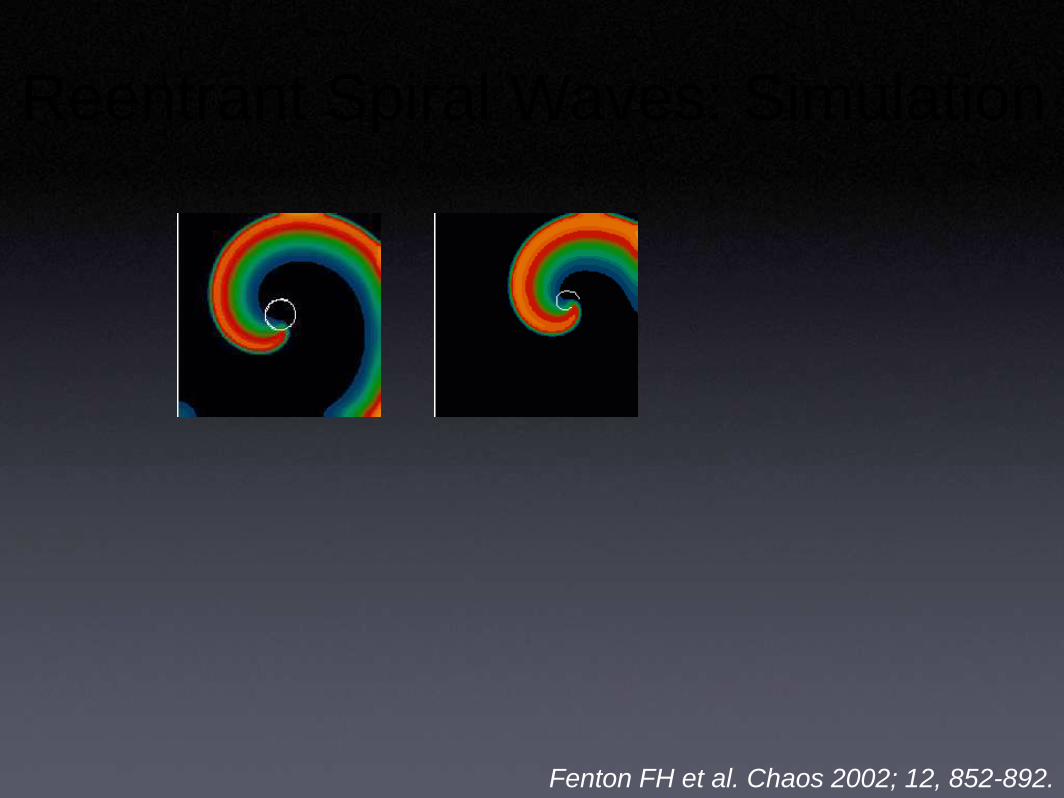
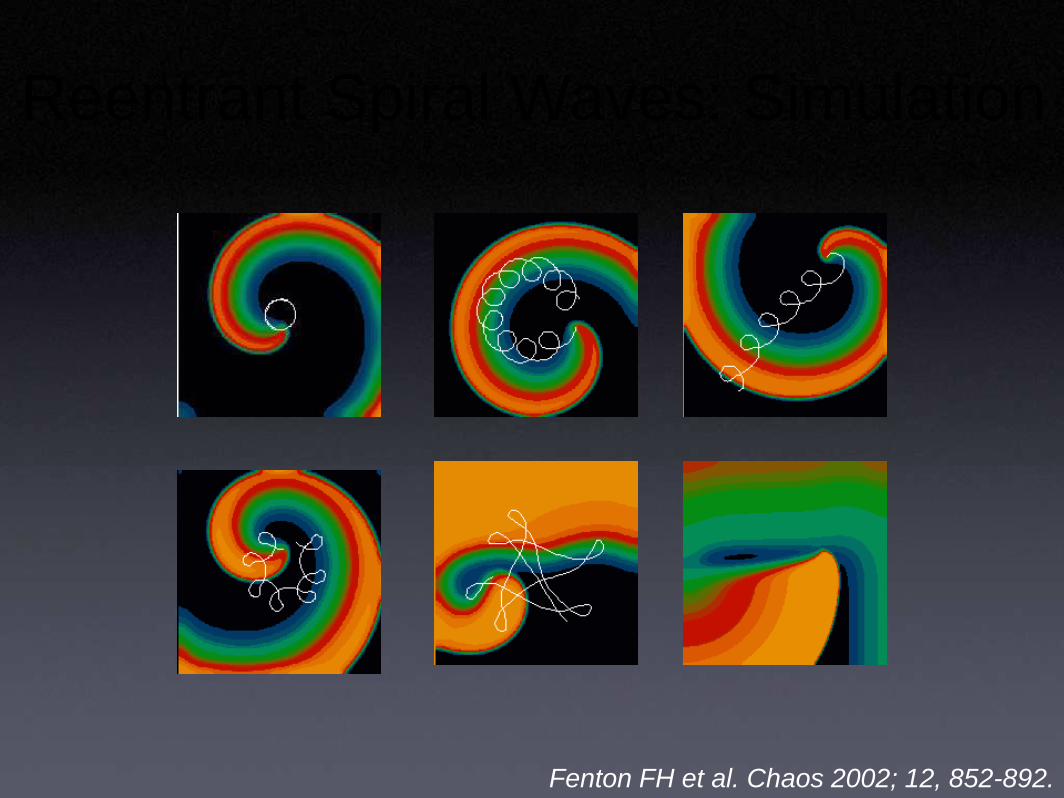
Reentrant Spiral Waves: Simulation
Fenton FH et al. Chaos 2002; 12, 852-892.
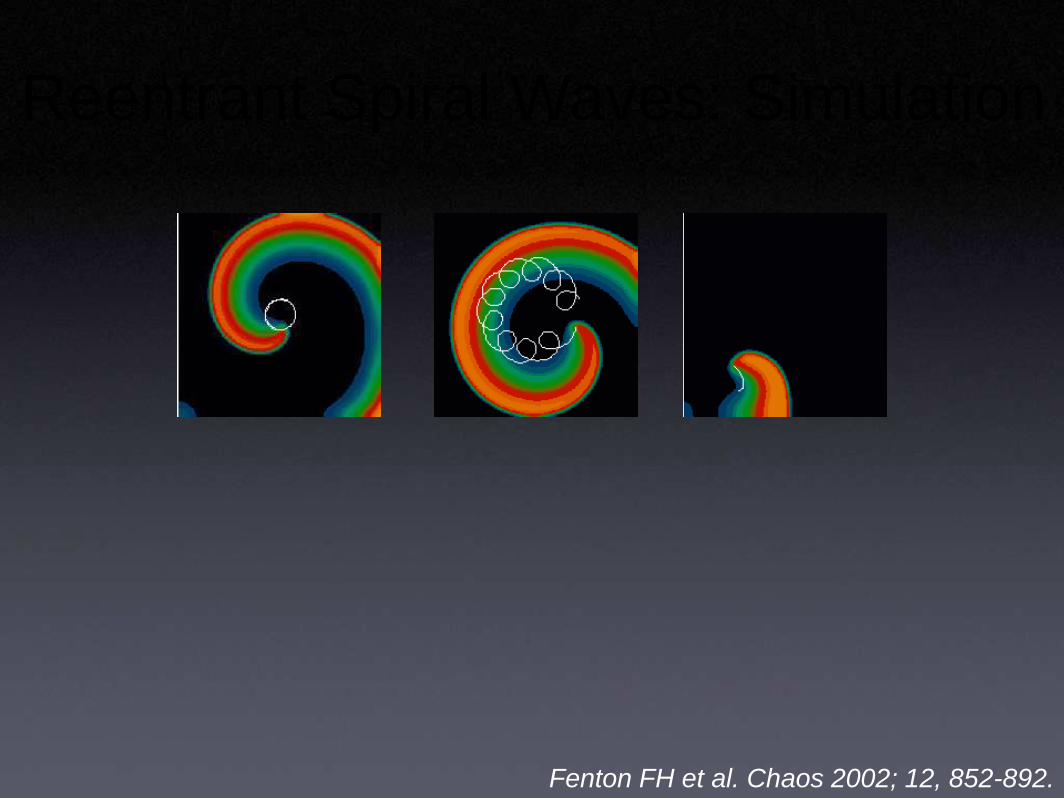
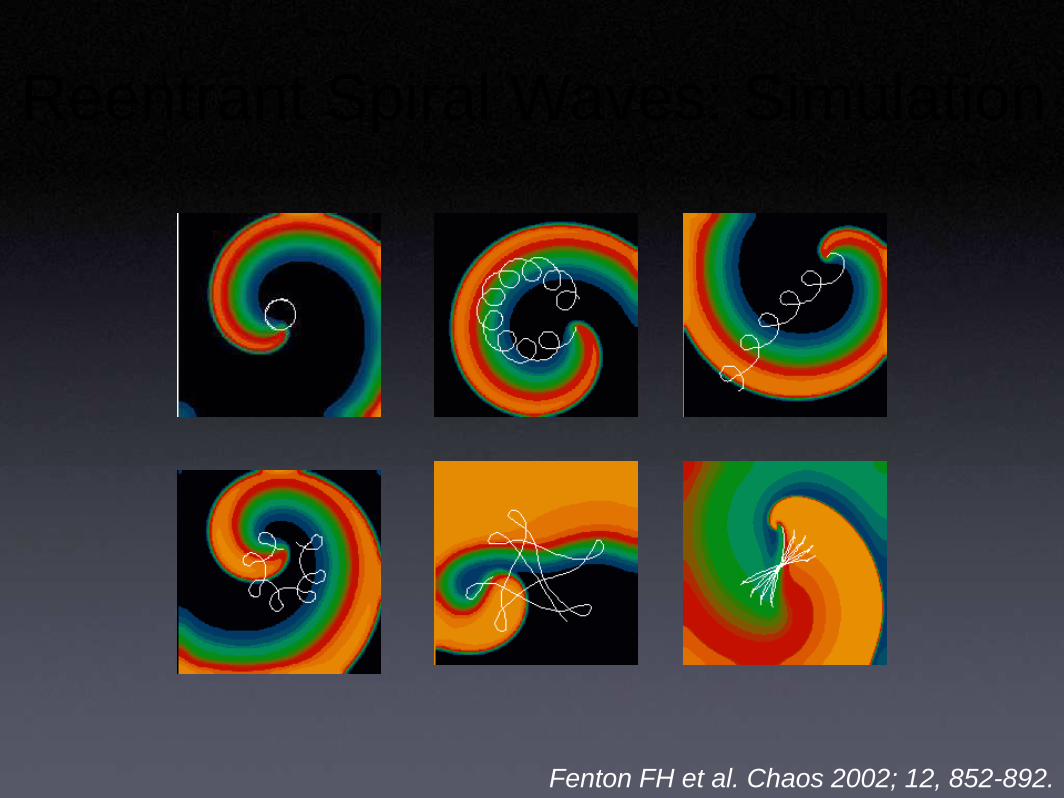
Reentrant Spiral Waves: Simulation
Fenton FH et al. Chaos 2002; 12, 852-892.
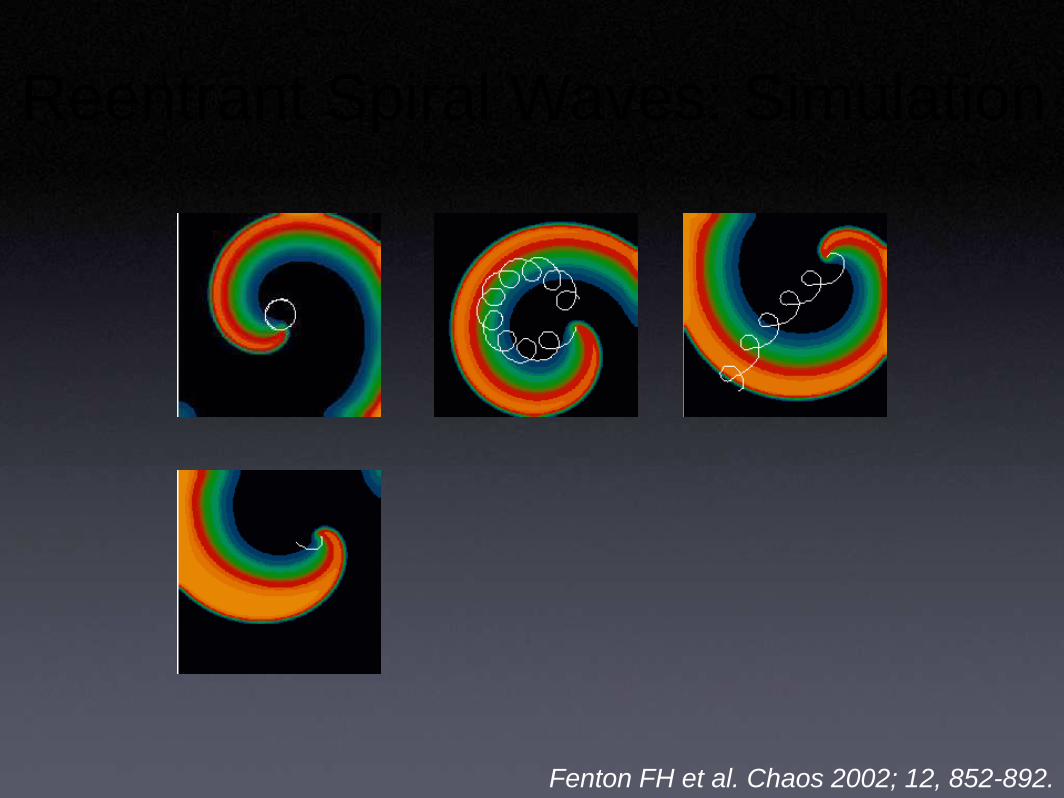
Reentrant Spiral Waves: Simulation
Fenton FH et al. Chaos 2002; 12, 852-892.
Reentrant Spiral Waves: Simulation
Fenton FH et al. Chaos 2002; 12, 852-892.
Reentrant Spiral Waves: Simulation
Fenton FH et al. Chaos 2002; 12, 852-892.
Reentrant Spiral Waves: Simulation
Fenton FH et al. Chaos 2002; 12, 852-892.
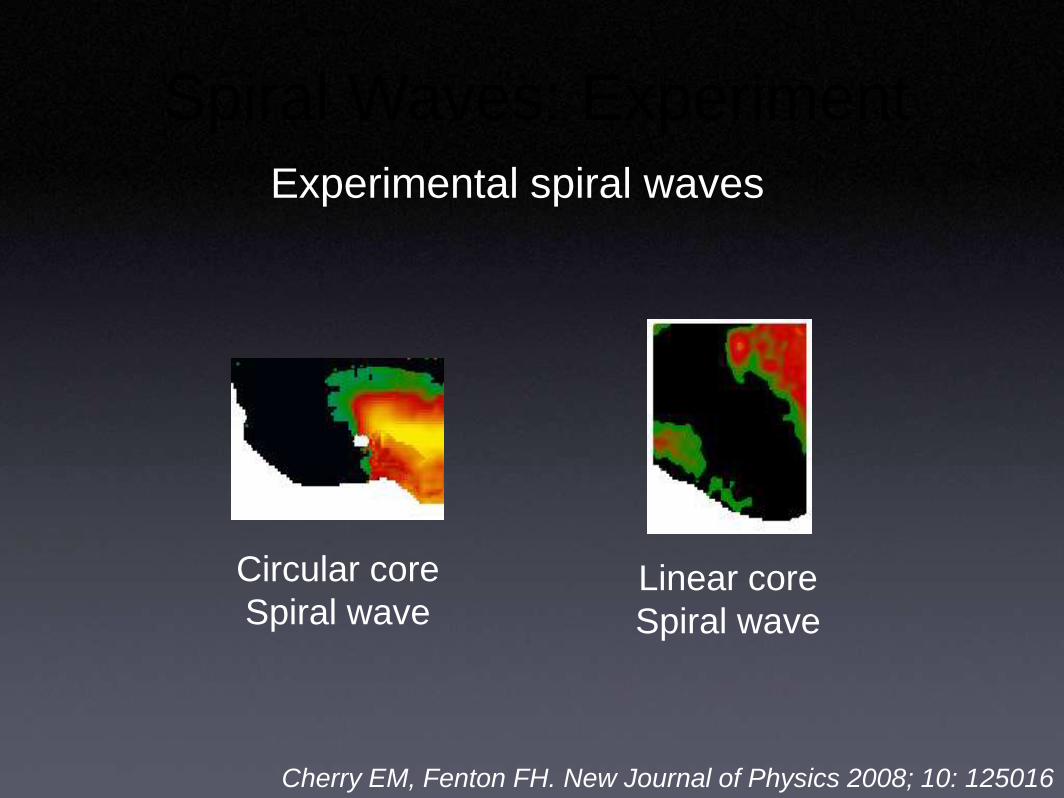
Spiral Waves: Experiment
Cherry EM, Fenton FH. New Journal of Physics 2008; 10: 125016
Circular core
Spiral waveLinear core
Spiral wave
Experimental spiral waves

2D 3D
Spiral waves Scroll waves
spiral tip vortex filament
How to Visualize Reentry in 3D?
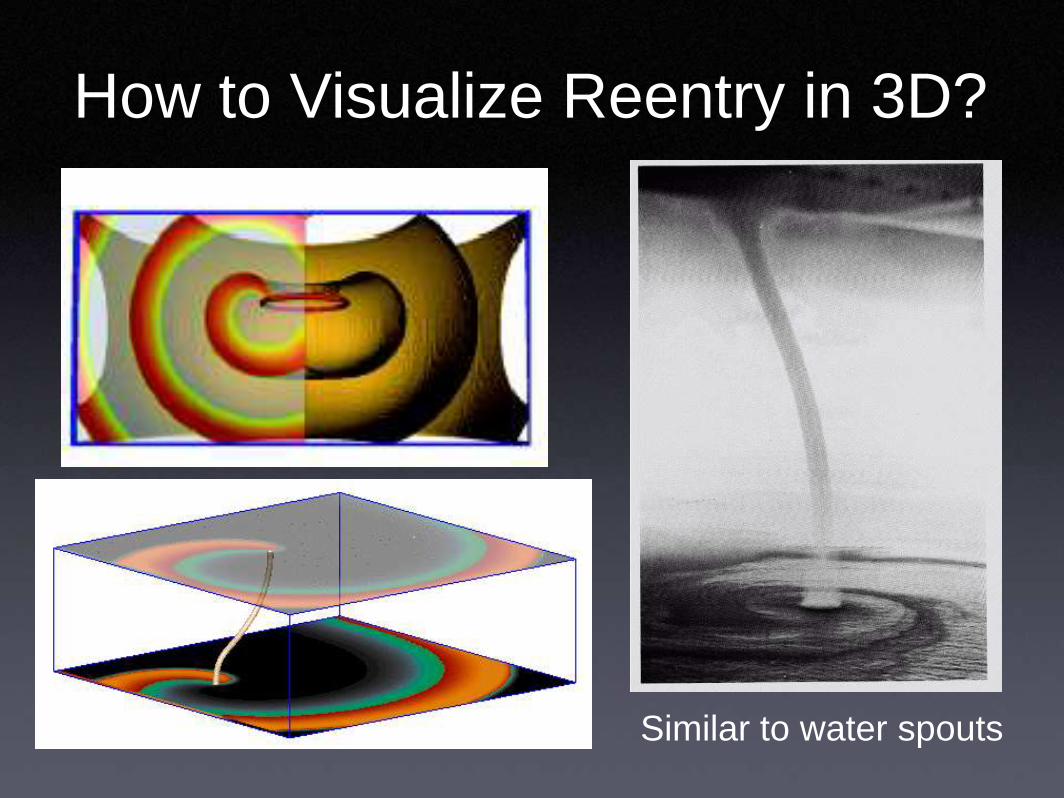
2D 3D
Spiral waves Scroll waves
spiral tip vortex filament
Similar to water spouts
How to Visualize Reentry in 3D?
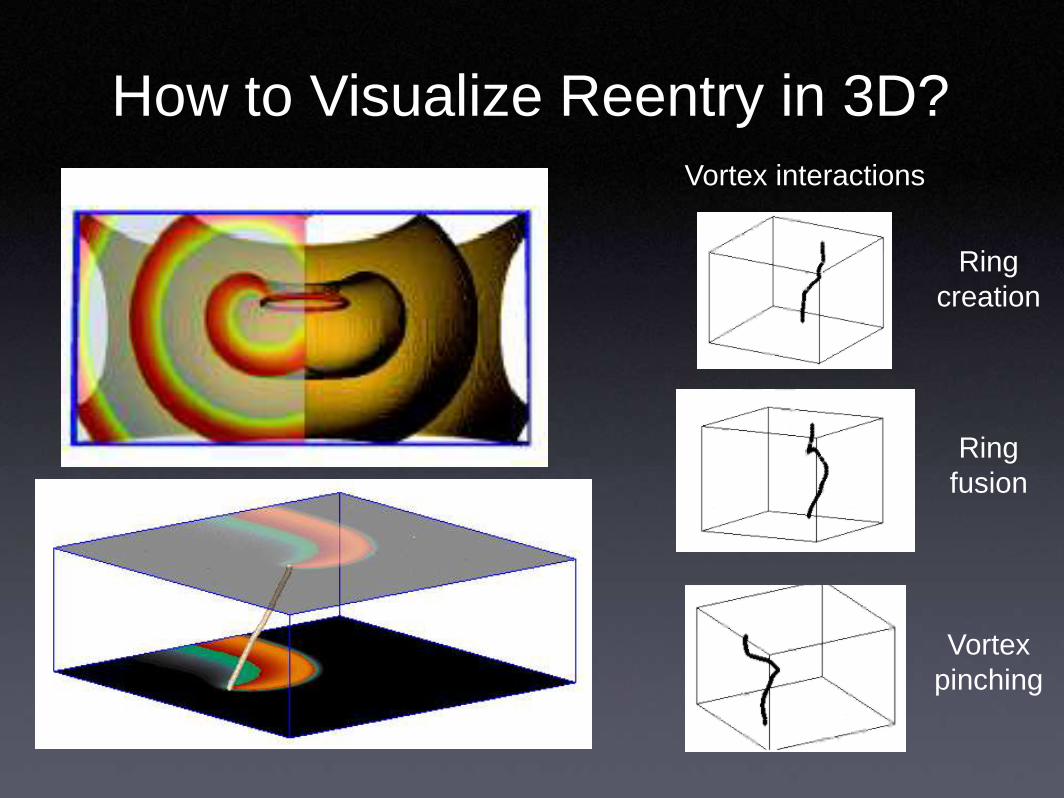
2D 3D
Spiral waves Scroll waves
spiral tip vortex filament
Vortex interactions
How to Visualize Reentry in 3D?
Ring
creation
Ring
fusion
Vortex
pinching
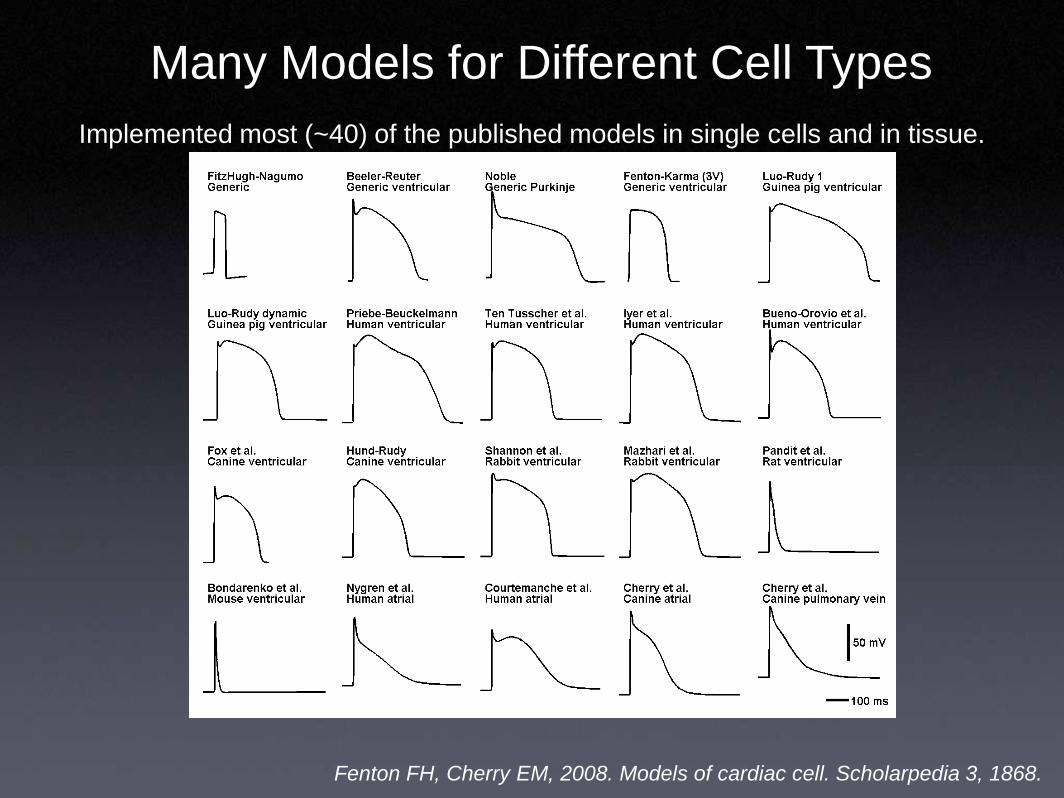
Fenton FH, Cherry EM, 2008. Models of cardiac cell. Scholarpedia 3, 1868.
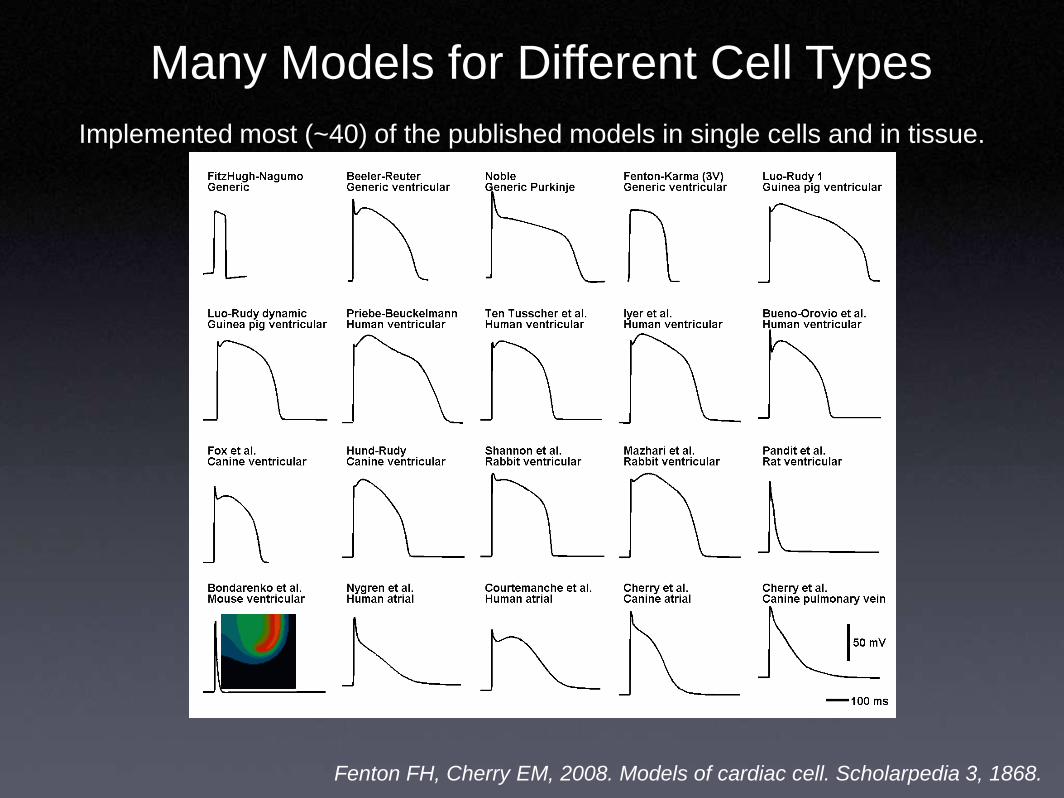
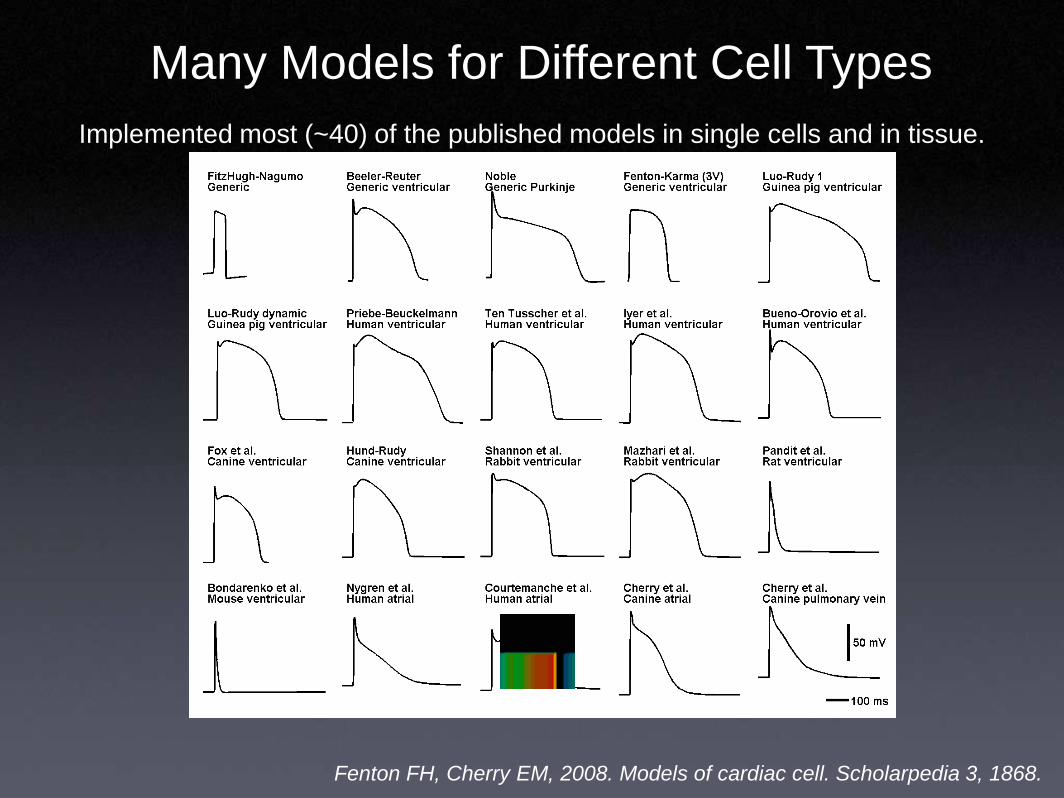
Many Models for Different Cell Types
Implemented most (~40) of the published models in single cells and in tissue.
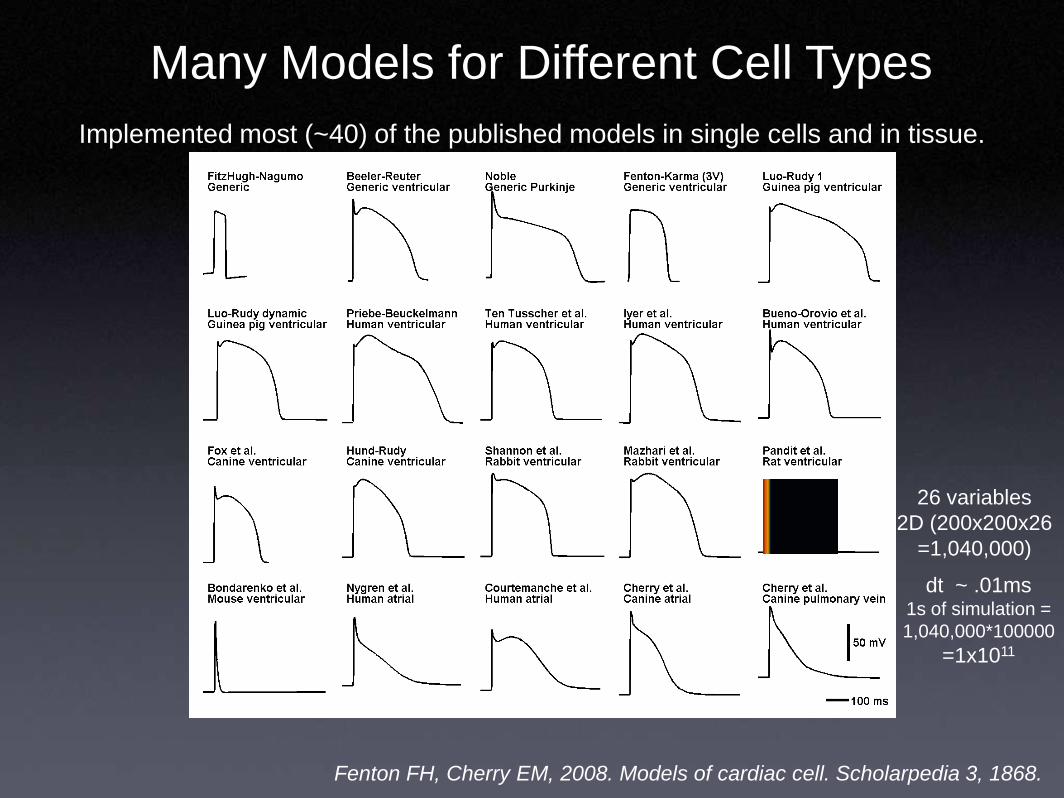
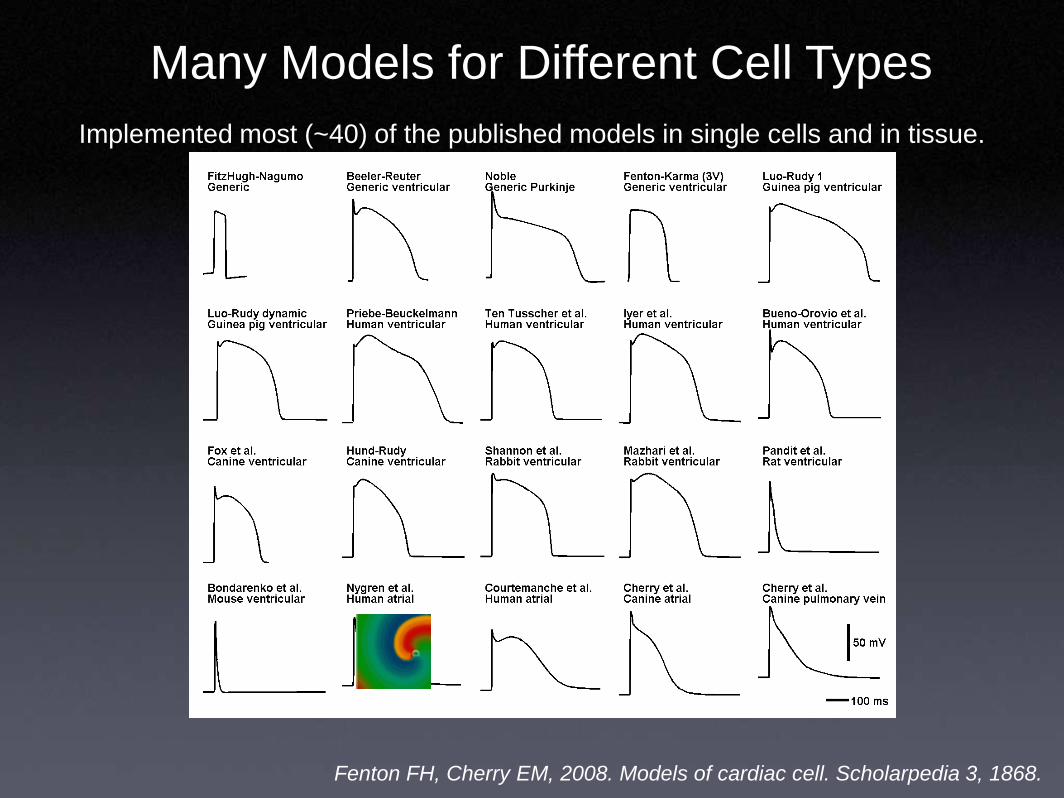
26 variables
2D (200x200x26
=1,040,000)
Fenton FH, Cherry EM, 2008. Models of cardiac cell. Scholarpedia 3, 1868.
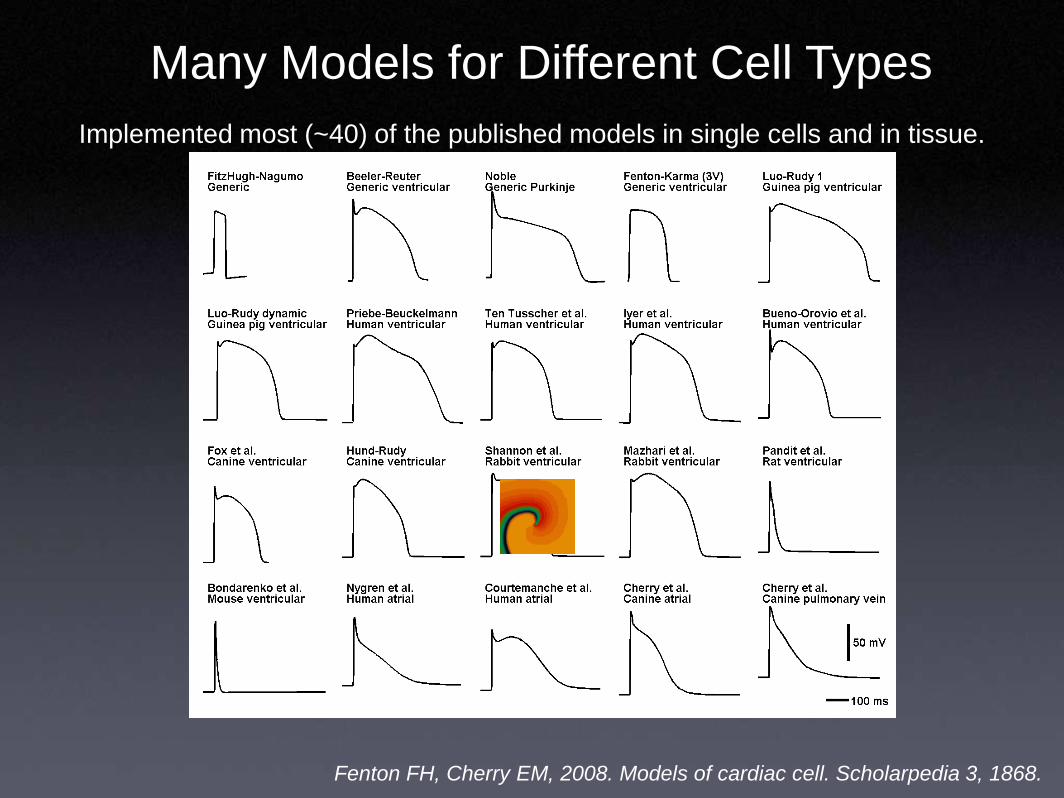
Many Models for Different Cell Types
Implemented most (~40) of the published models in single cells and in tissue.
dt ~ .01ms1s of simulation =
1,040,000*100000
=1x10¹¹
Fenton FH, Cherry EM, 2008. Models of cardiac cell. Scholarpedia 3, 1868.
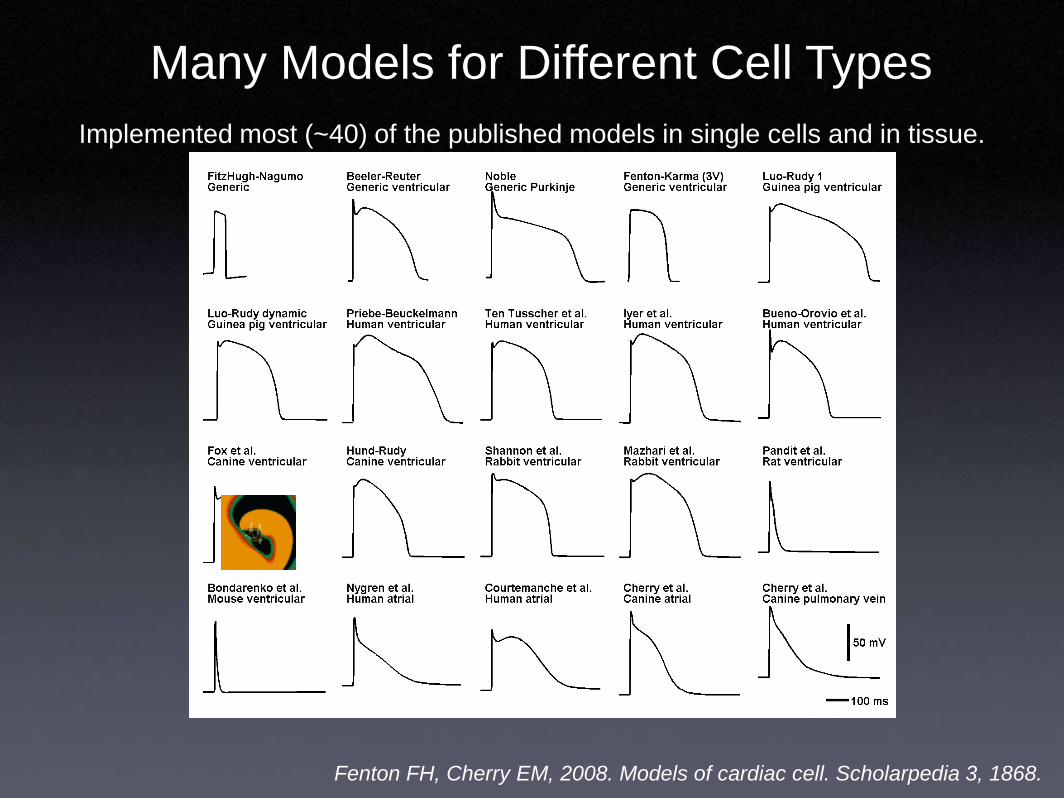
Many Models for Different Cell Types
Implemented most (~40) of the published models in single cells and in tissue.
Fenton FH, Cherry EM, 2008. Models of cardiac cell. Scholarpedia 3, 1868.
Many Models for Different Cell Types
Implemented most (~40) of the published models in single cells and in tissue.
Fenton FH, Cherry EM, 2008. Models of cardiac cell. Scholarpedia 3, 1868.
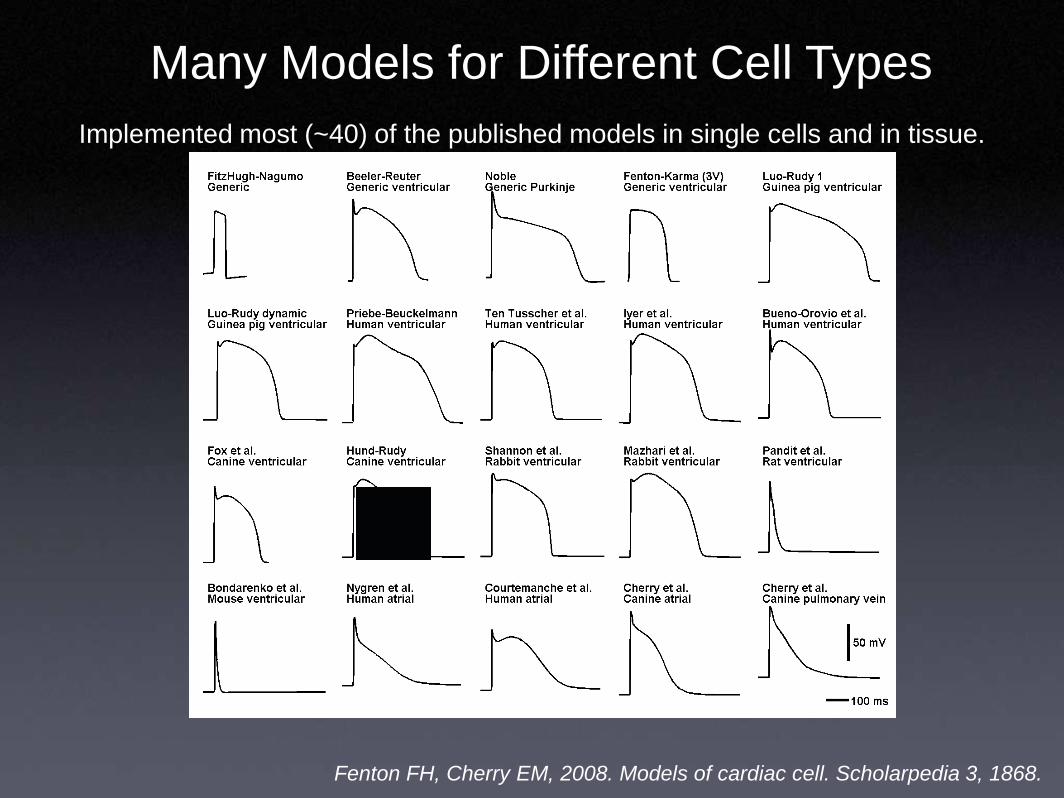
Many Models for Different Cell Types
Implemented most (~40) of the published models in single cells and in tissue.
Fenton FH, Cherry EM, 2008. Models of cardiac cell. Scholarpedia 3, 1868.
Many Models for Different Cell Types
Implemented most (~40) of the published models in single cells and in tissue.
Fenton FH, Cherry EM, 2008. Models of cardiac cell. Scholarpedia 3, 1868.
Many Models for Different Cell Types
Implemented most (~40) of the published models in single cells and in tissue.
Fenton FH, Cherry EM, 2008. Models of cardiac cell. Scholarpedia 3, 1868.
Many Models for Different Cell Types
Implemented most (~40) of the published models in single cells and in tissue.
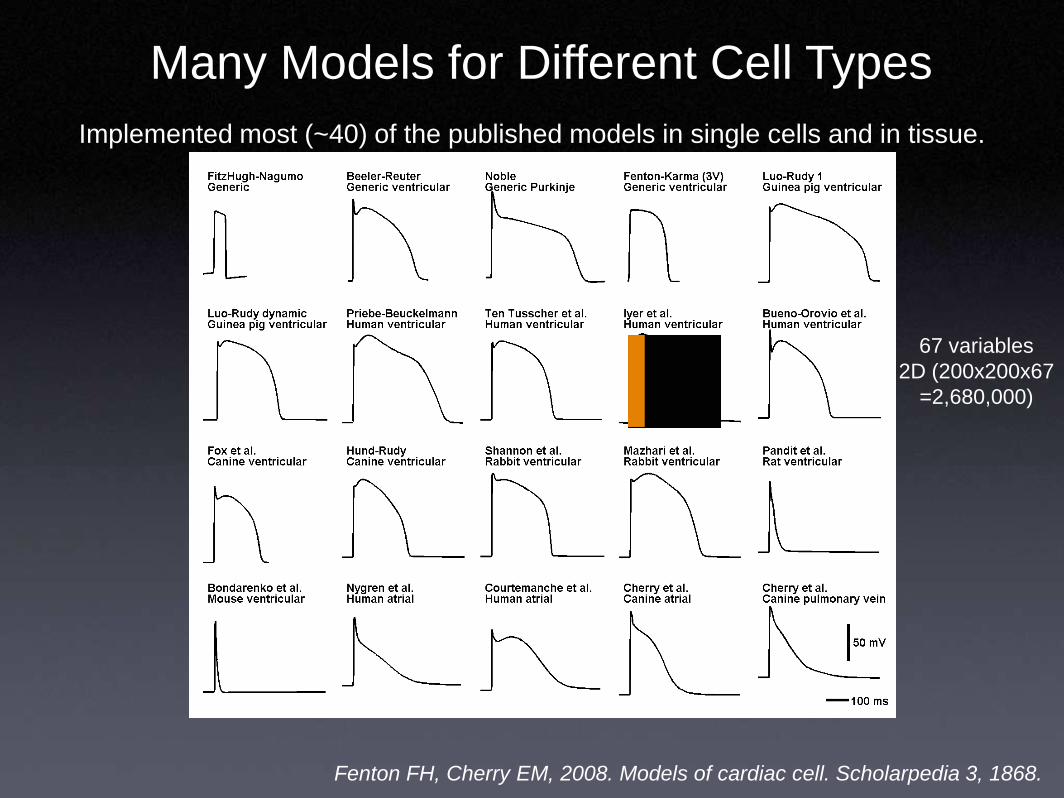
67 variables
2D (200x200x67
=2,680,000)
Fenton FH, Cherry EM, 2008. Models of cardiac cell. Scholarpedia 3, 1868.
Many Models for Different Cell Types
Implemented most (~40) of the published models in single cells and in tissue.

Fenton FH, Cherry EM, 2008. Models of cardiac cell. Scholarpedia 3, 1868.
Many Models for Different Cell Types
Implemented most (~40) of the published models in single cells and in tissue.
Fenton FH, Cherry EM, 2008. Models of cardiac cell. Scholarpedia 3, 1868.
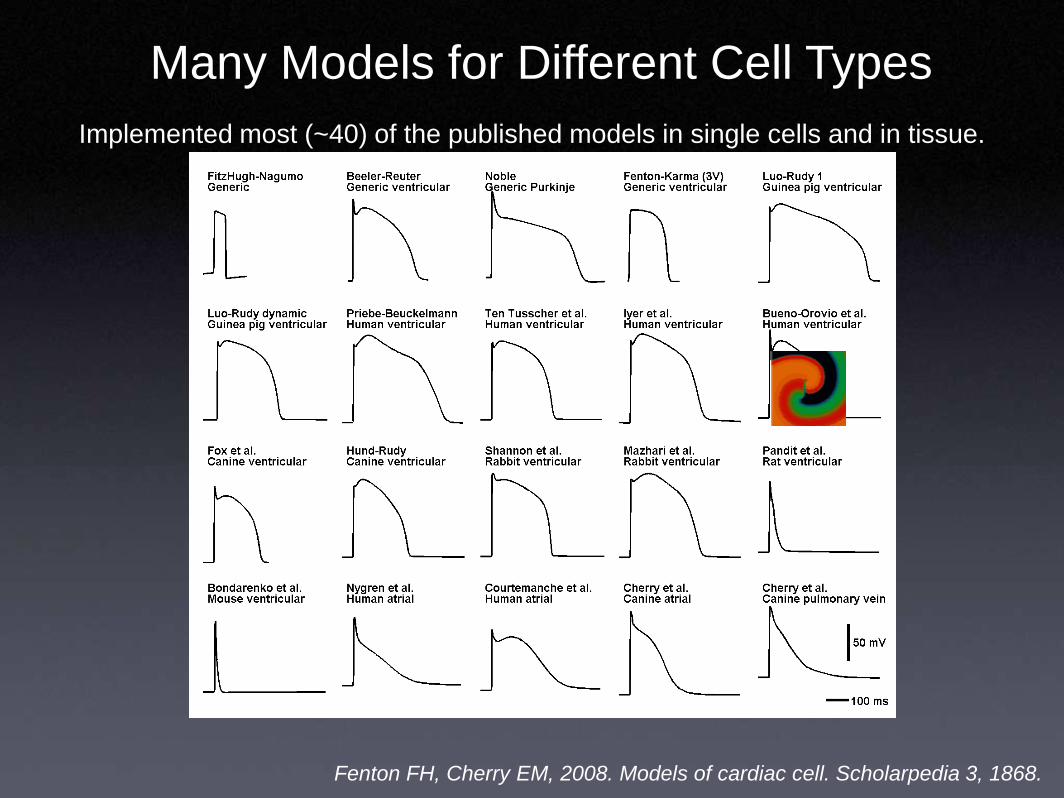
Many Models for Different Cell Types
Implemented most (~40) of the published models in single cells and in tissue.
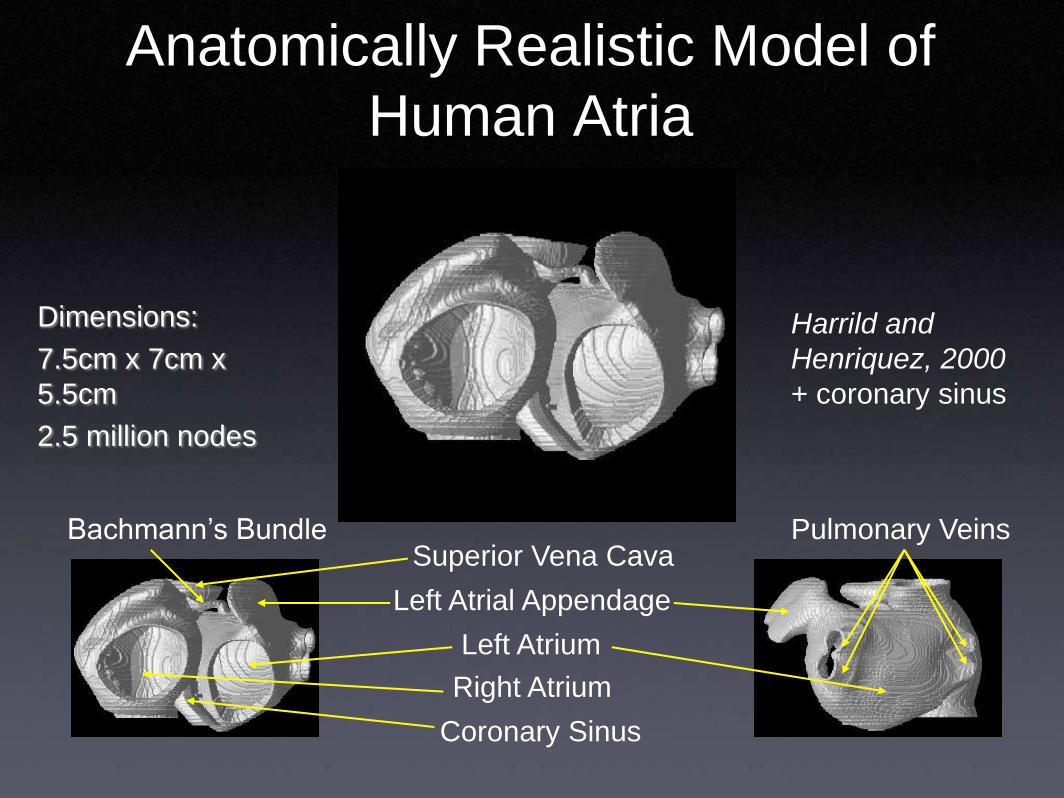
Anatomically Realistic Model of
Human Atria
Right Atrium
Pulmonary Veins
Left Atrium
Coronary Sinus
Bachmann’s Bundle
Left Atrial Appendage
Superior Vena Cava
Harrild and
Henriquez, 2000
+ coronary sinus
Dimensions:
7.5cm x 7cm x
5.5cm
2.5 million nodes
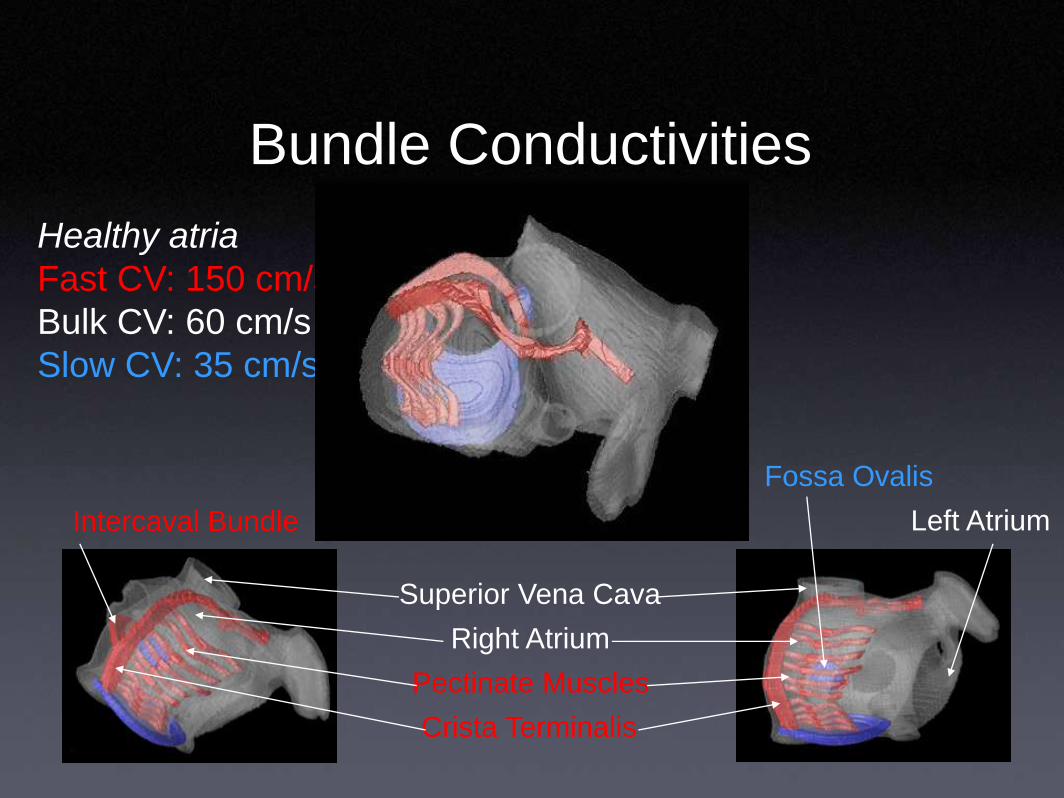
Bundle Conductivities
Right Atrium
Intercaval Bundle
Superior Vena Cava
Fossa Ovalis
Pectinate Muscles
Crista Terminalis
Left Atrium
Healthy atria
Fast CV: 150 cm/s
Bulk CV: 60 cm/s
Slow CV: 35 cm/s
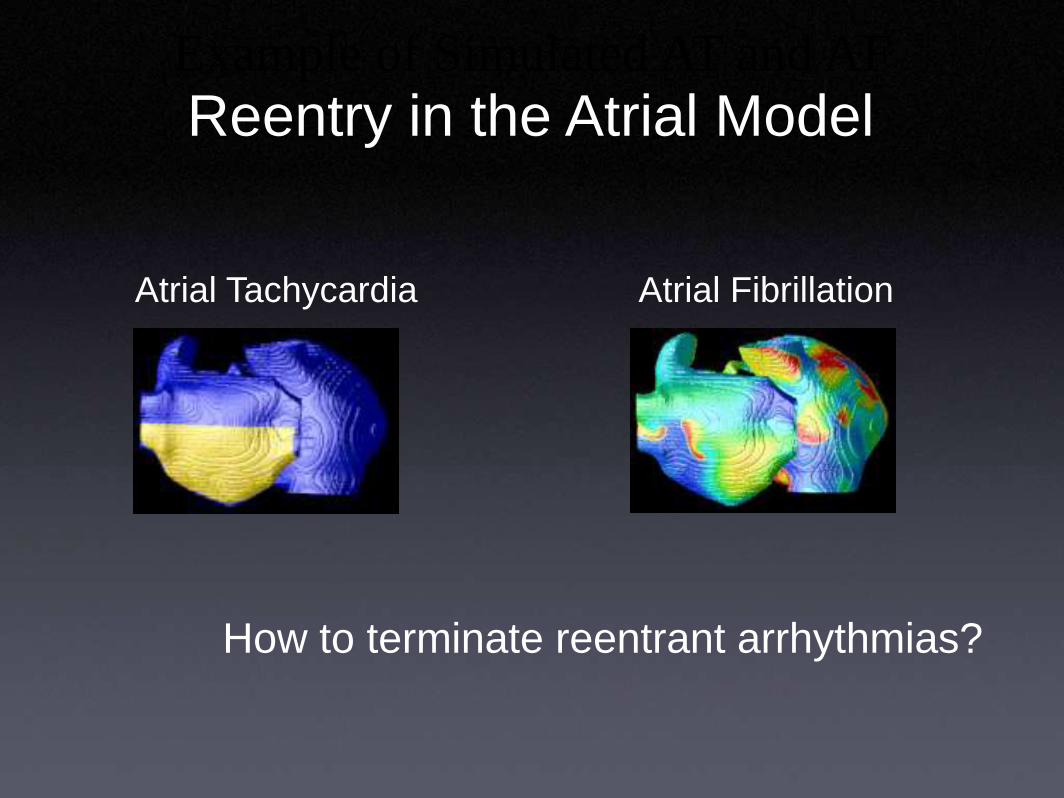
Example of Simulated AT and AF
Atrial Tachycardia Atrial Fibrillation
Reentry in the Atrial Model
How to terminate reentrant arrhythmias?
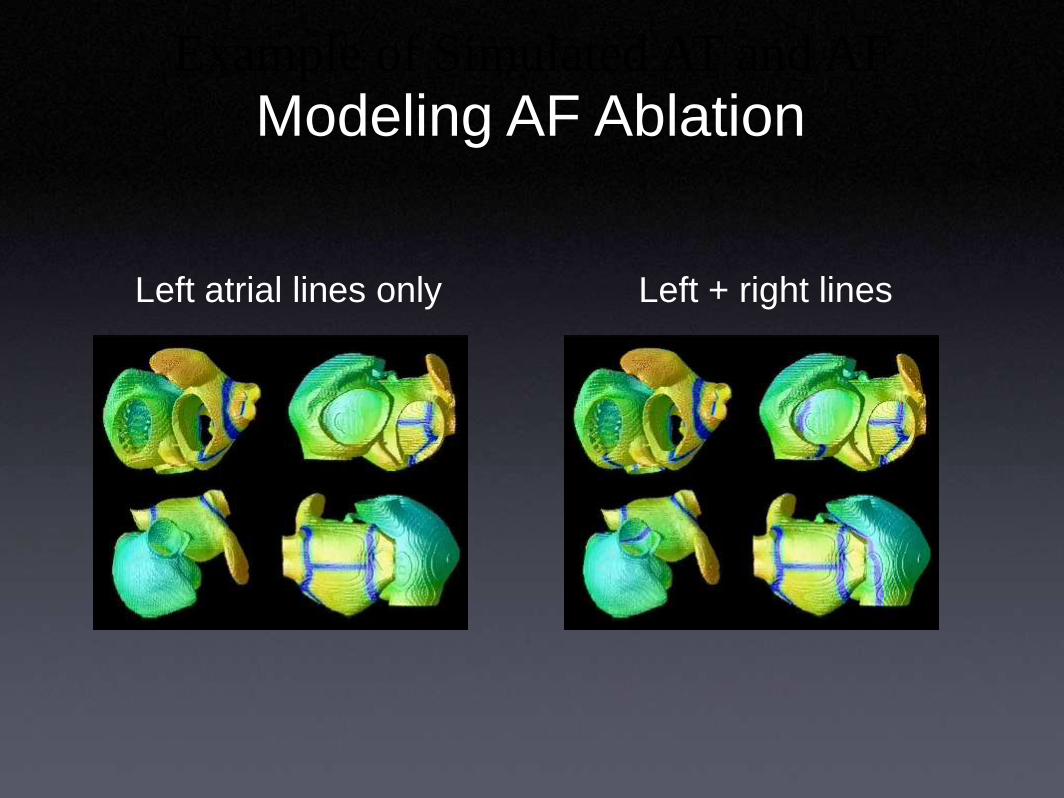
Example of Simulated AT and AF
Left atrial lines only Left + right lines
Modeling AF Ablation
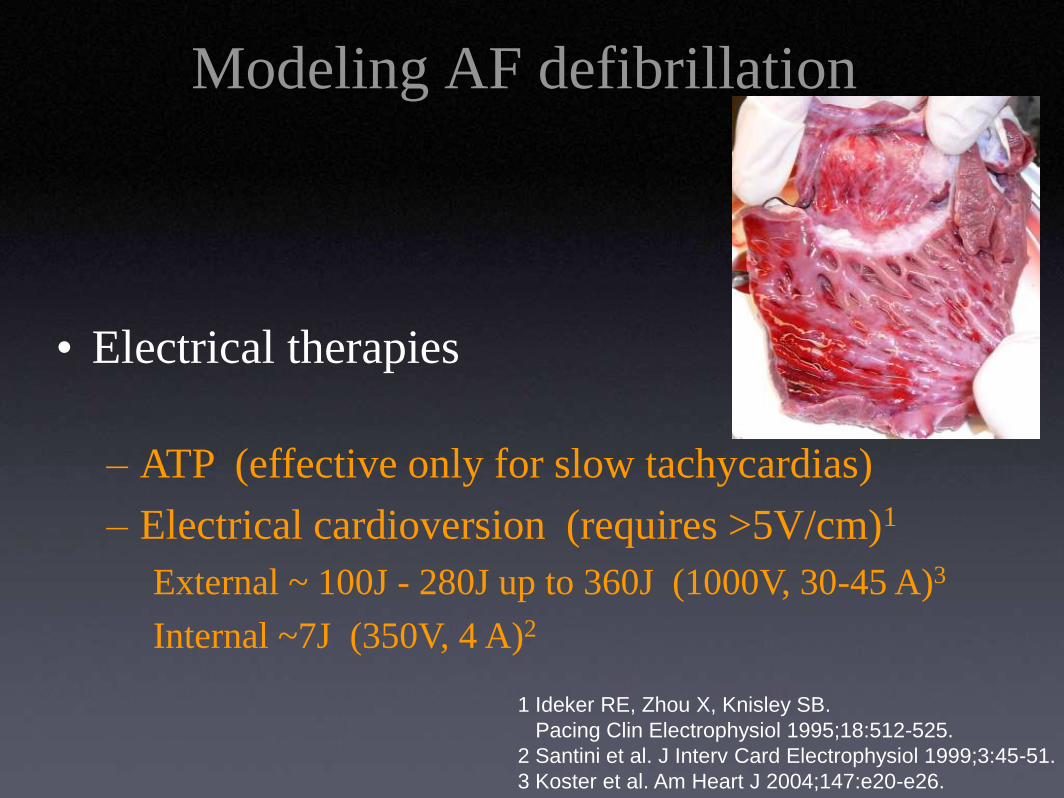
Modeling AF defibrillation
• Electrical therapies
– ATP (effective only for slow tachycardias)
– Electrical cardioversion (requires >5V/cm)1
External ~ 100J - 280J up to 360J (1000V, 30-45 A)3
Internal ~7J (350V, 4 A)2
1 Ideker RE, Zhou X, Knisley SB.
Pacing Clin Electrophysiol 1995;18:512-525.
2 Santini et al. J Interv Card Electrophysiol 1999;3:45-51.
3 Koster et al. Am Heart J 2004;147:e20-e26.
New method for defibrillation
• Demonstrate that cardioversion can be achieved by a
series of far-field low-energy pulses (~1.4V/cm)
delivered at a frequency close to the dominant
frequency of the arrhythmia.
• Internal ~7J (350V, 4 A) (requires >5V/cm)
• This method is based on the idea of recruitment of
virtual electrodes in cardiac tissue and global
synchronization.
Not only large holes but also smaller conductivity
discontinuities can act as “virtual electrodes.”
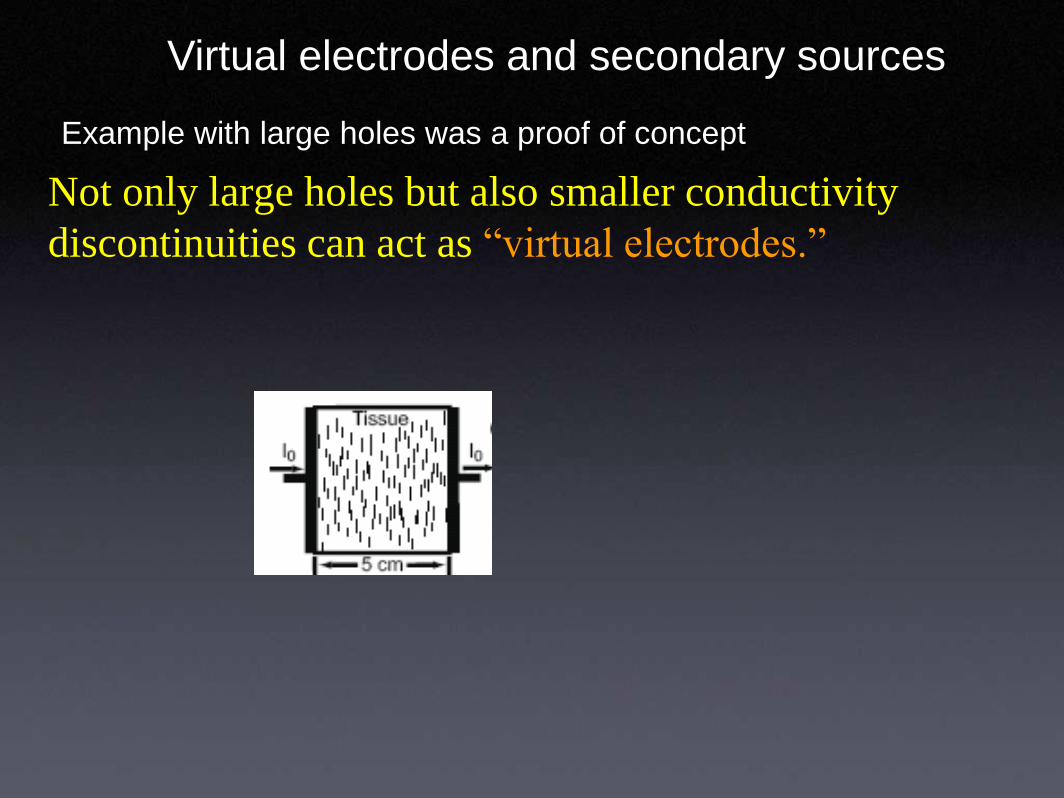
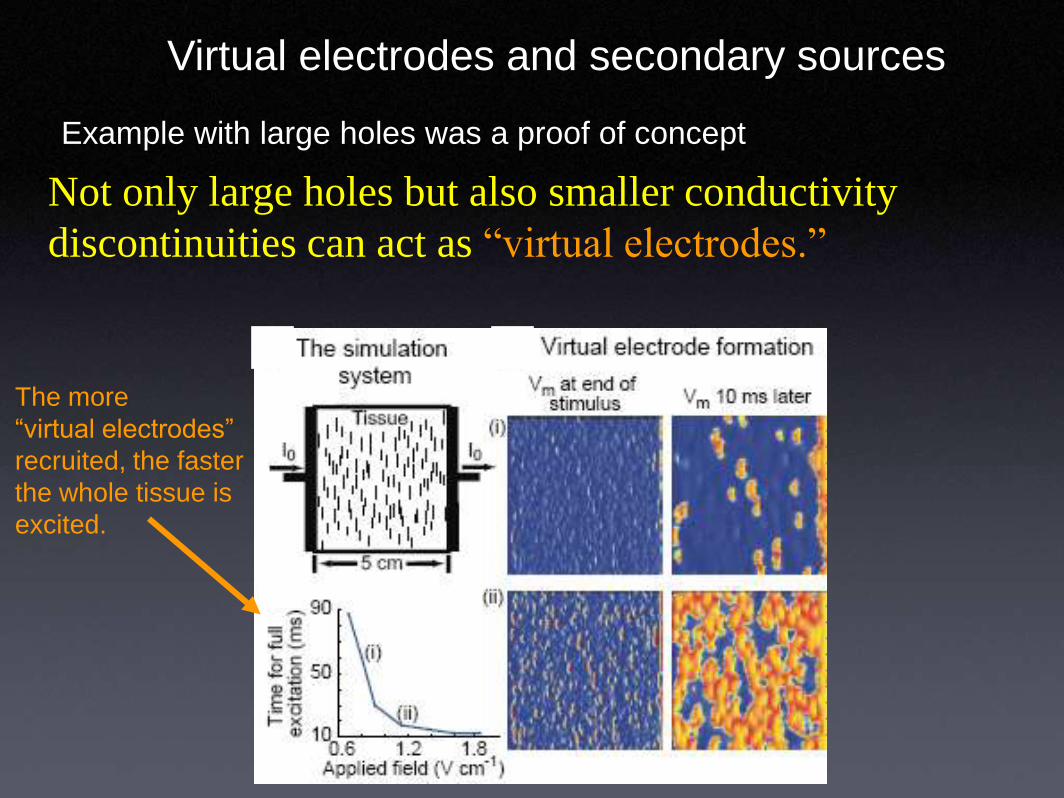
Virtual electrodes and secondary sources
Example with large holes was a proof of concept
Not only large holes but also smaller conductivity
discontinuities can act as “virtual electrodes.”
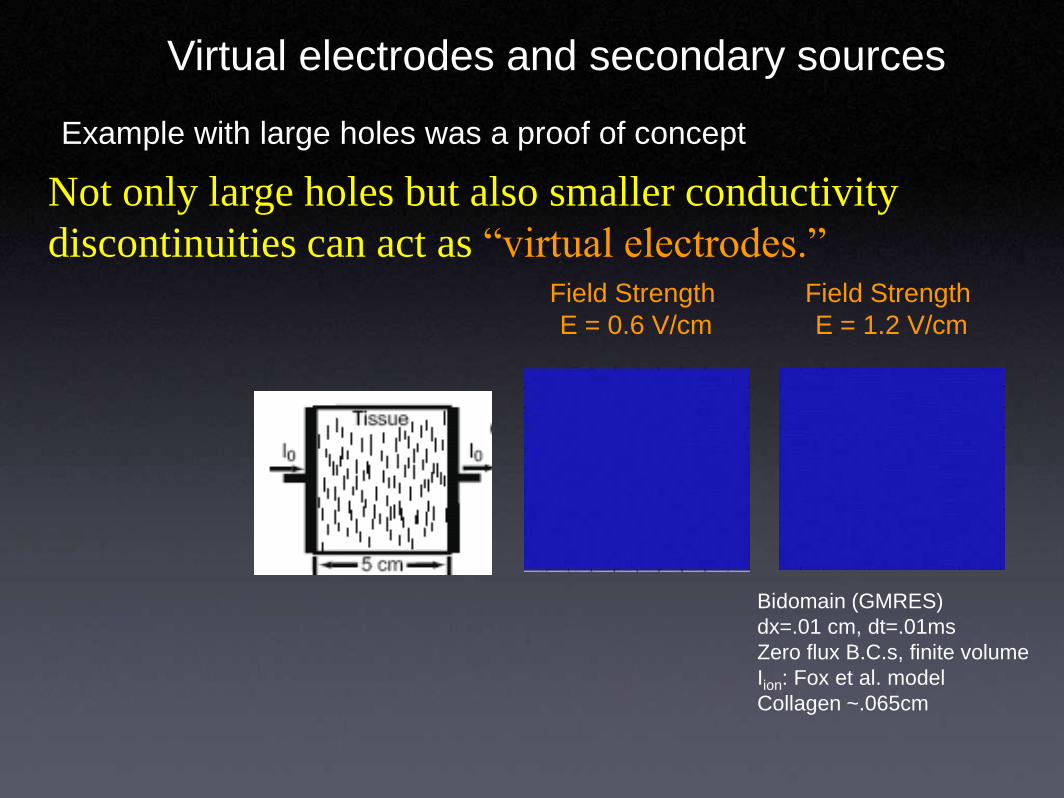
Virtual electrodes and secondary sources
Field Strength
E = 0.6 V/cm
Field Strength
E = 1.2 V/cm
Example with large holes was a proof of concept
Bidomain (GMRES)
dx=.01 cm, dt=.01ms
Zero flux B.C.s, finite volume
Iion: Fox et al. model
Collagen ~.065cm
Virtual electrodes and secondary sources
Not only large holes but also smaller conductivity
discontinuities can act as “virtual electrodes.”
The more
“virtual electrodes”
recruited, the faster
the whole tissue is
excited.
Example with large holes was a proof of concept
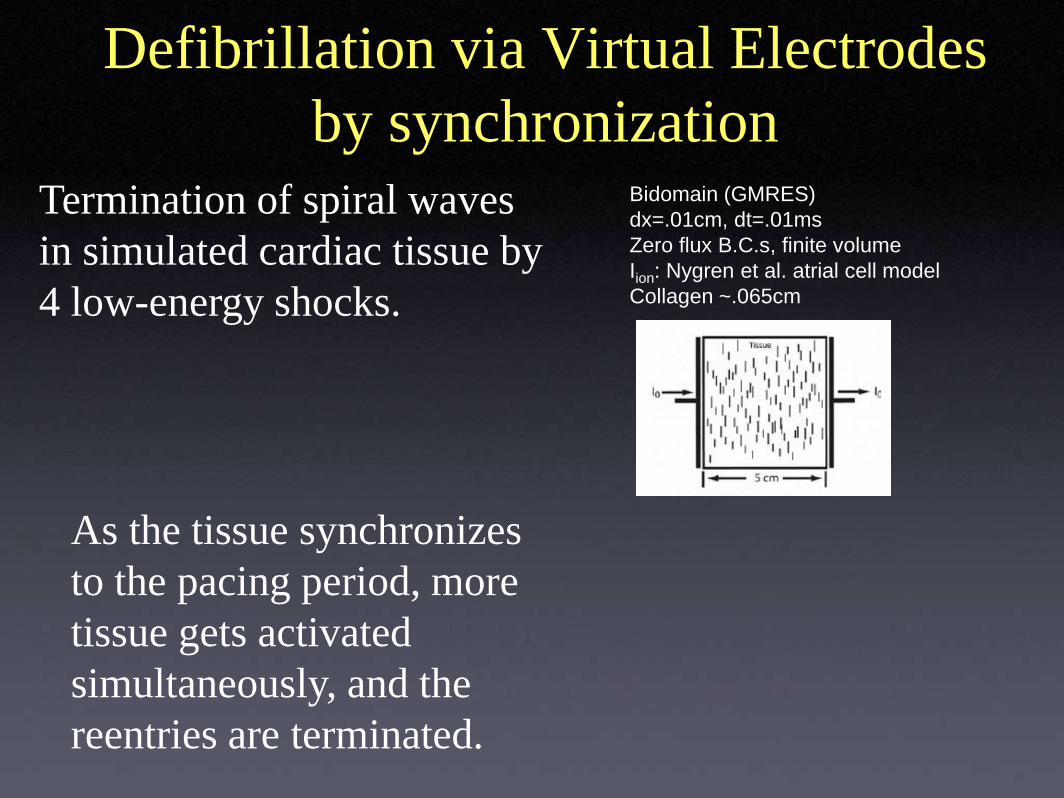
Defibrillation via Virtual Electrodes
by synchronization
Termination of spiral waves
in simulated cardiac tissue by
4 low-energy shocks.
As the tissue synchronizes
to the pacing period, more
tissue gets activated
simultaneously, and the
reentries are terminated.
Bidomain (GMRES)
dx=.01cm, dt=.01ms
Zero flux B.C.s, finite volume
Iion: Nygren et al. atrial cell model
Collagen ~.065cm
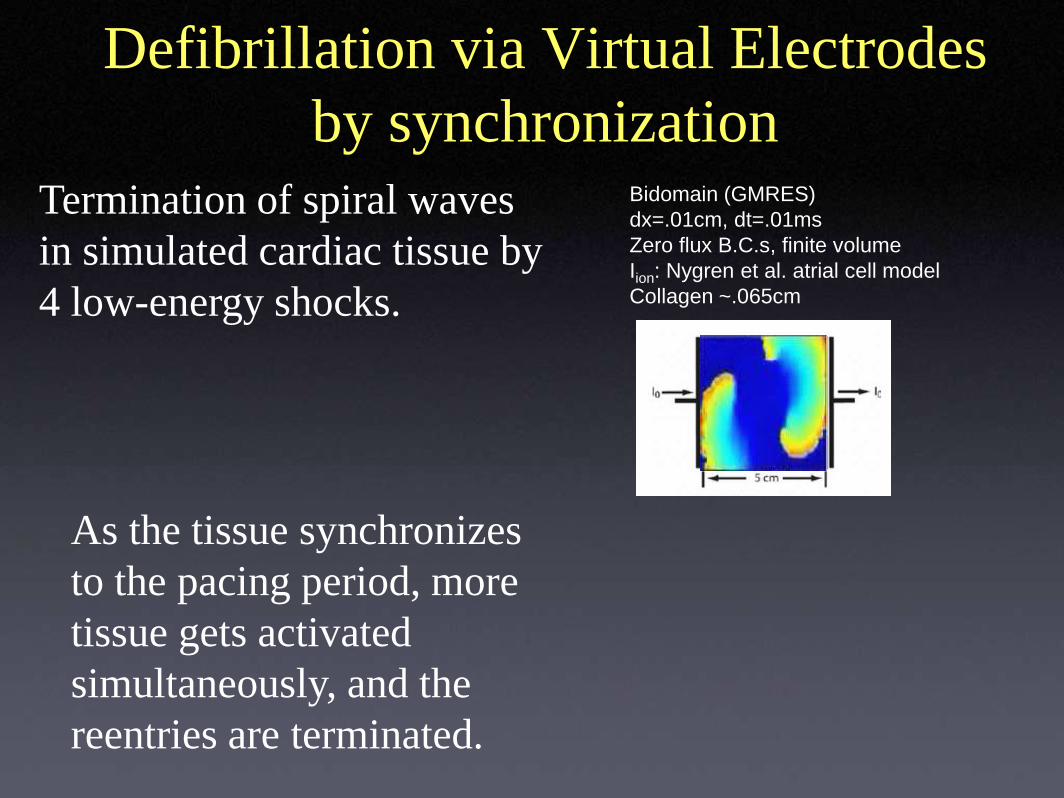
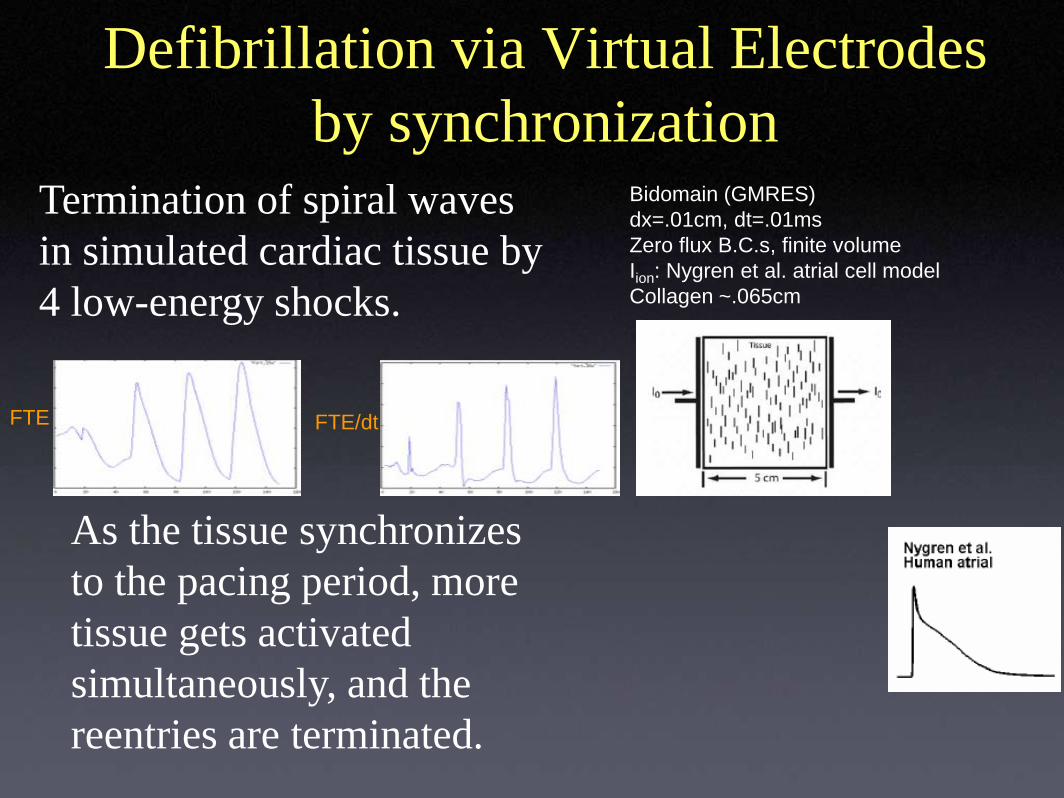
FTE FTE/dt
Examples of low-energy far-field stimulation

• Cardioversion successE=1.4 V/cm
5 Stimuli
Examples of low-energy far-field stimulation
Fenton et al., Circulation 2009;120:467-476
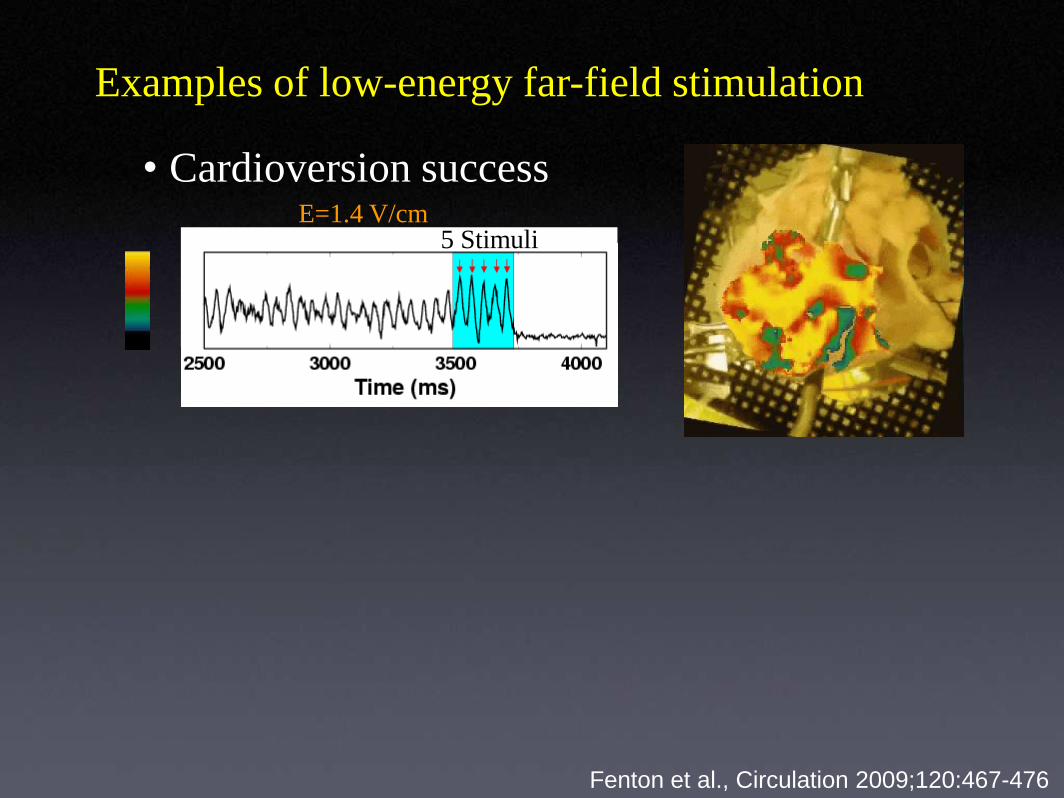
• Cardioversion successE=1.4 V/cm
5 Stimuli
Examples of low-energy far-field stimulation
Fenton et al., Circulation 2009;120:467-476
• Cardioversion successE=1.4 V/cm
5 Stimuli
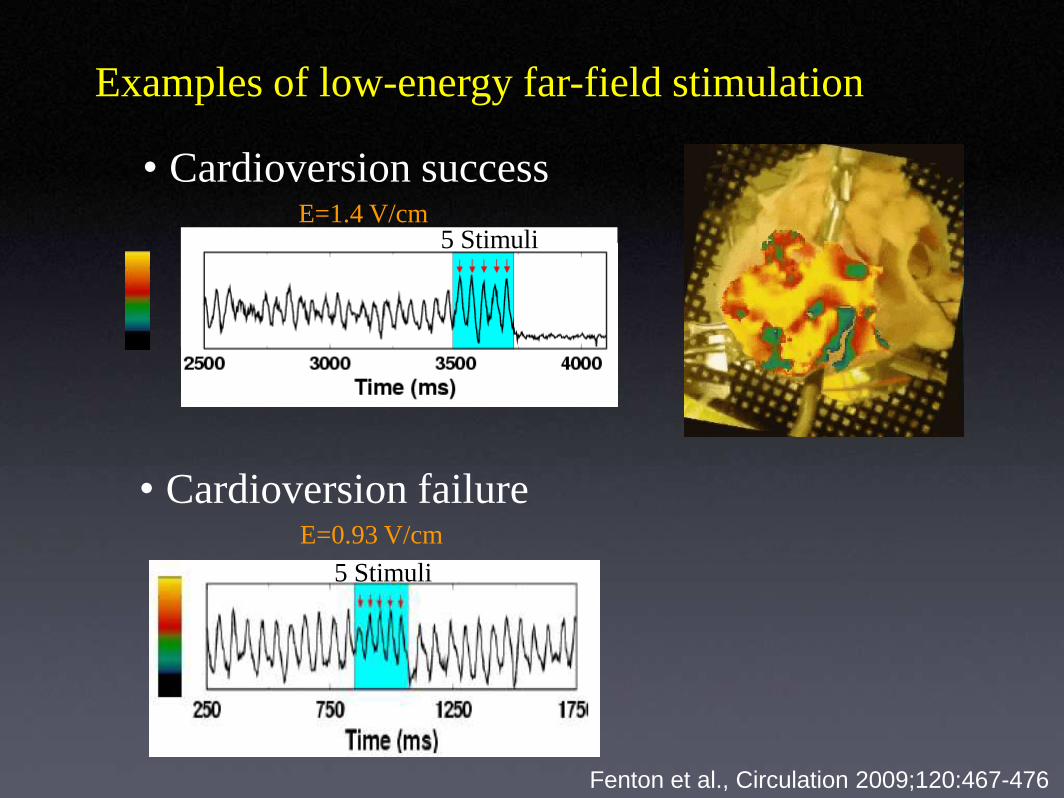
Examples of low-energy far-field stimulation
• Cardioversion failureE=0.93 V/cm
5 Stimuli
Fenton et al., Circulation 2009;120:467-476
• Cardioversion successE=1.4 V/cm
5 Stimuli
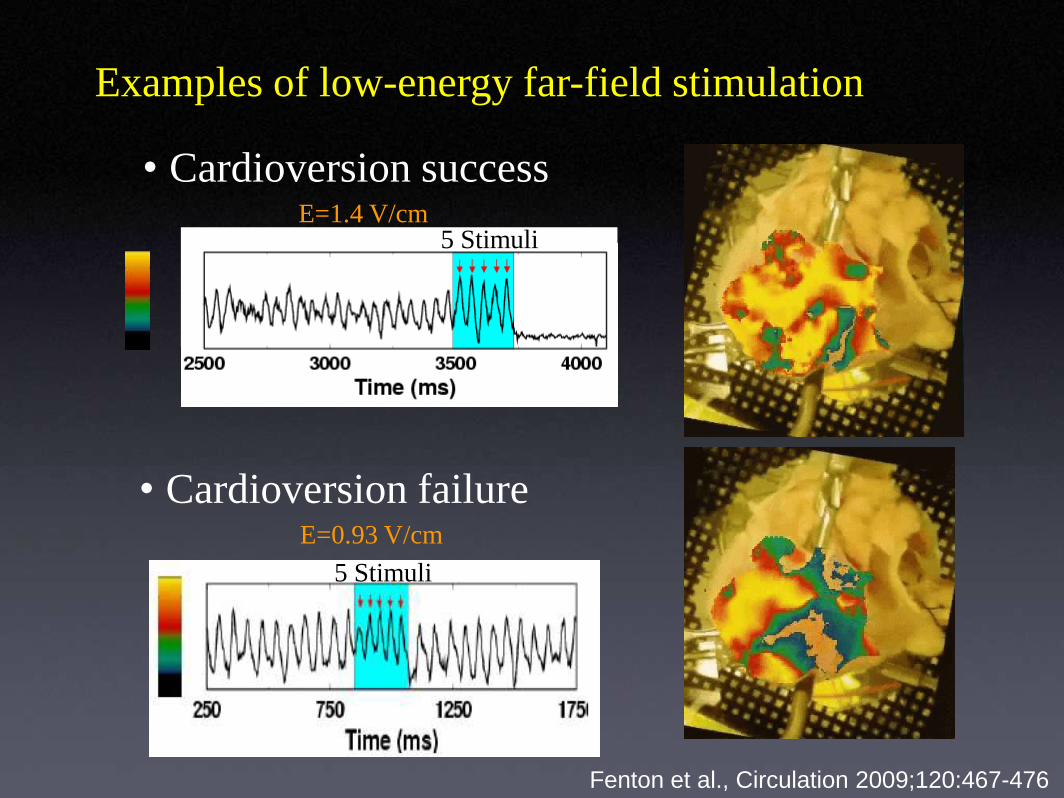
Examples of low-energy far-field stimulation
• Cardioversion failureE=0.93 V/cm
5 Stimuli
Fenton et al., Circulation 2009;120:467-476
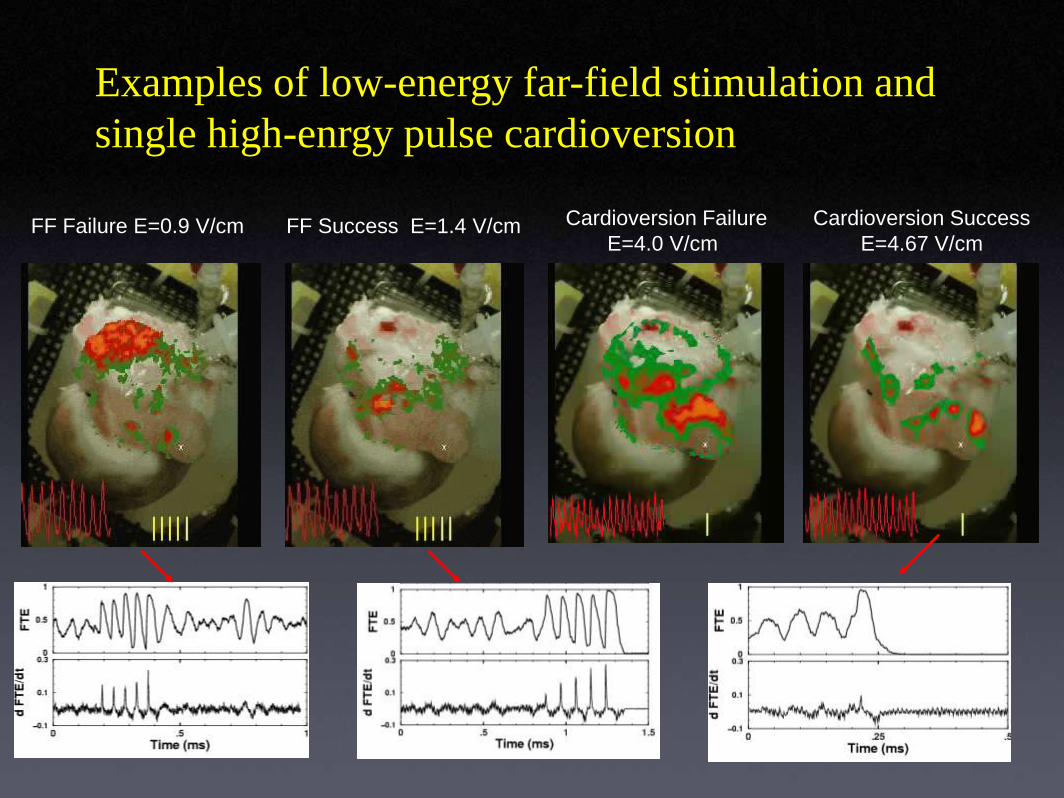
Examples of low-energy far-field stimulation and
single high-enrgy pulse cardioversion
FF Failure E=0.9 V/cm FF Success E=1.4 V/cm Cardioversion Success
E=4.67 V/cm
Cardioversion Failure
E=4.0 V/cm
e
f
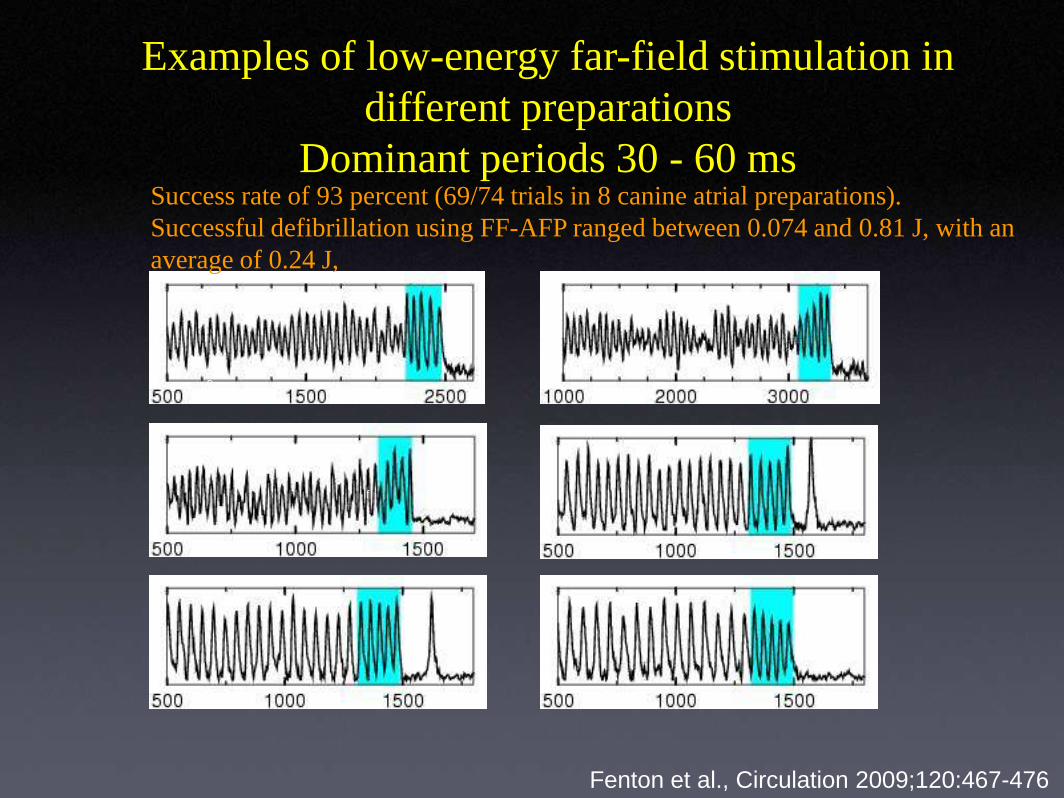
Examples of low-energy far-field stimulation in
different preparations
Dominant periods 30 - 60 ms
Fenton et al., Circulation 2009;120:467-476
Success rate of 93 percent (69/74 trials in 8 canine atrial preparations).
Successful defibrillation using FF-AFP ranged between 0.074 and 0.81 J, with an
average of 0.24 J,
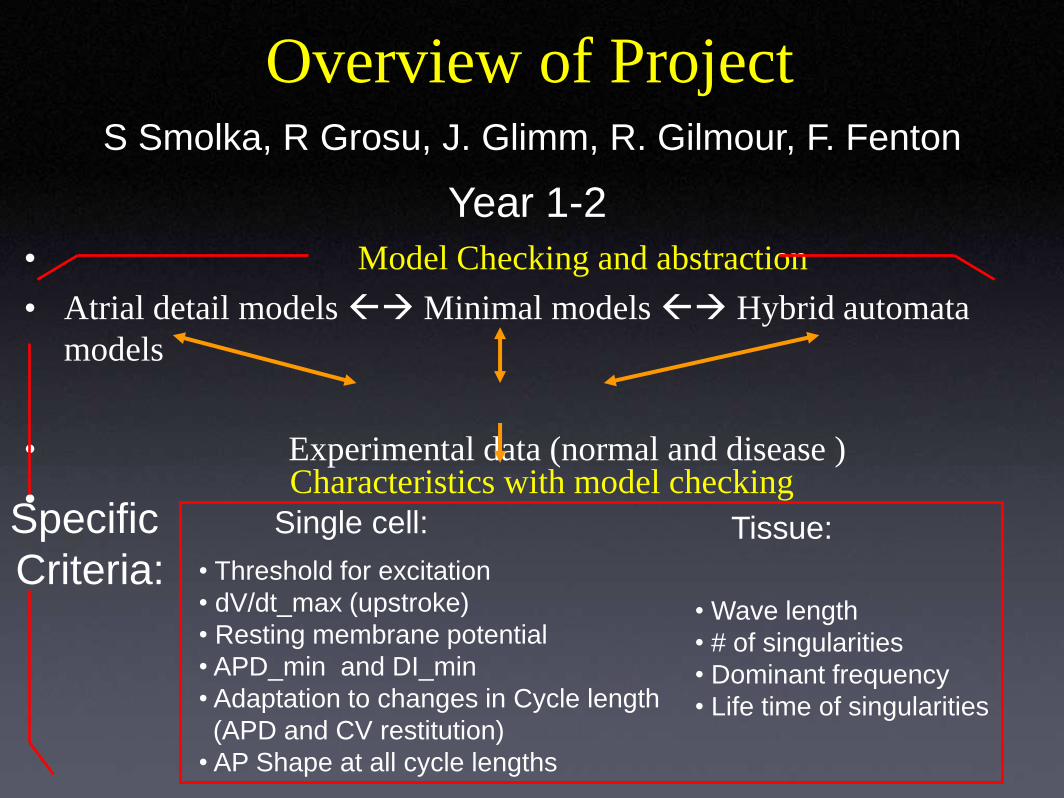
Overview of Project
• Model Checking and abstraction
• Atrial detail models Minimal models Hybrid automata
models
• Experimental data (normal and disease )
•Specific
Criteria: • Threshold for excitation
• dV/dt_max (upstroke)
• Resting membrane potential
• APD_min and DI_min
• Adaptation to changes in Cycle length
(APD and CV restitution)
• AP Shape at all cycle lengths
• Wave length
• # of singularities
• Dominant frequency
• Life time of singularities
Characteristics with model checking
Single cell: Tissue:
Year 1-2
S Smolka, R Grosu, J. Glimm, R. Gilmour, F. Fenton
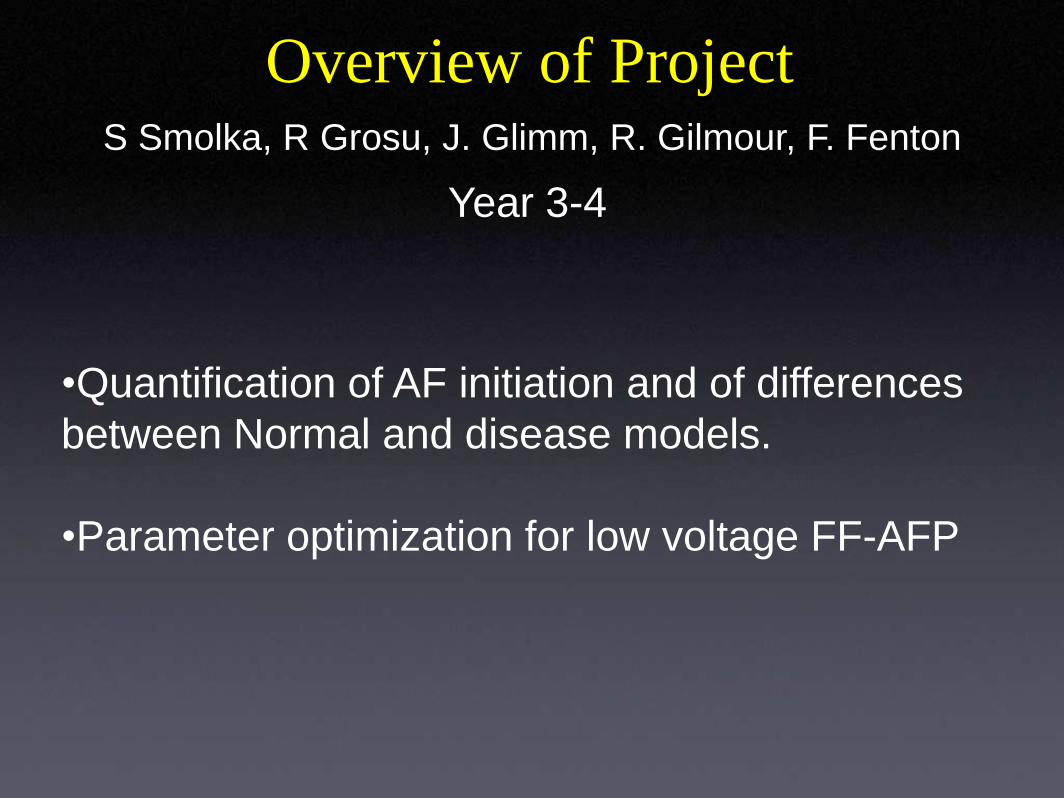
Overview of Project
Year 3-4
S Smolka, R Grosu, J. Glimm, R. Gilmour, F. Fenton
•Quantification of AF initiation and of differences
between Normal and disease models.
•Parameter optimization for low voltage FF-AFP


Future Directions
• Apply our expertise in cell modeling to
incorporate spatial variability in human
ventricular and atrial electrophysiology.
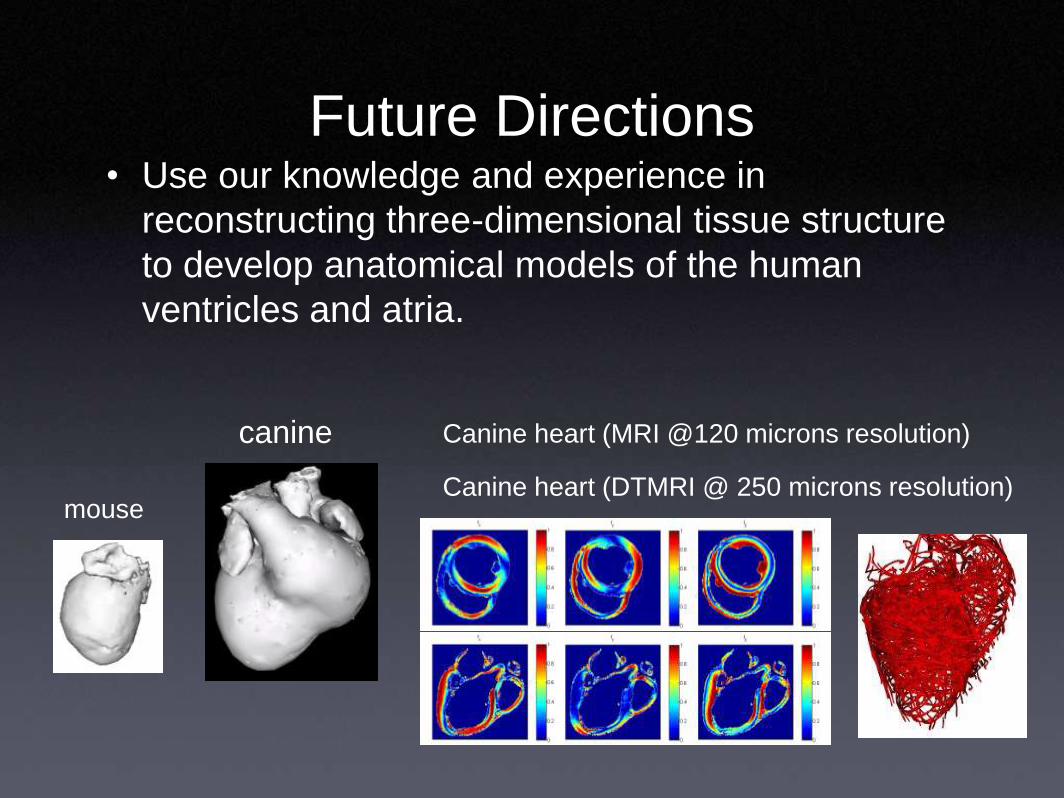
Future Directions• Use our knowledge and experience in
reconstructing three-dimensional tissue structure
to develop anatomical models of the human
ventricles and atria.
Canine heart (MRI @120 microns resolution)
Canine heart (DTMRI @ 250 microns resolution)mouse
canine
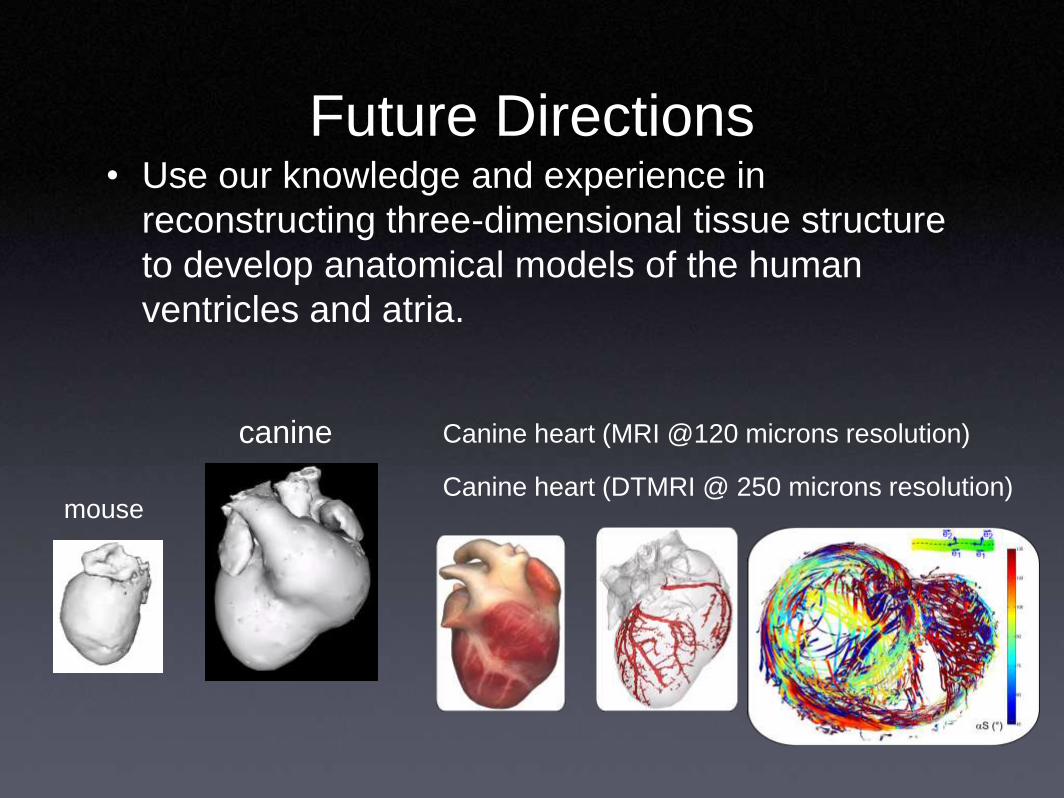
Future Directions• Use our knowledge and experience in
reconstructing three-dimensional tissue structure
to develop anatomical models of the human
ventricles and atria.
Canine heart (MRI @120 microns resolution)
Canine heart (DTMRI @ 250 microns resolution)mouse
canine
Future Directions• Use our knowledge and experience in
reconstructing three-dimensional tissue structure
to develop anatomical models of the human
ventricles and atria.

Future Directions• Apply optical mapping techniques to quantify the
properties of arrhythmias in human hearts.
Future Directions• Apply optical mapping techniques to quantify the
properties of arrhythmias in human hearts.
Collaborators
Robert F. Gilmour, Jr.
Eberhard Bodenschatz
Ulrich Parlitz
Stephan Lehnart
http://TheVirtualHeart.org
Support: NSF #0824399 (EMC) and #0800793 (FHF and EMC)
NIH HL075515-S03,-S04 (FHF)
EU FP7 (FHF and SL)