Flashiness Analysis of Gaged Michigan Rivers and Streams · Application of the . Richards-Baker...
149
Application of the Richards-Baker Flashiness Index to Gaged Michigan Rivers and Streams Dave Fongers Hydrologic Studies and Dam Safety Unit Water Resources Division With Assistance from Robert Day Joseph Rathbun Nonpoint Source Unit Water Resources Division May 3, 2012 MI/DEQ/WRD-12/028
Transcript of Flashiness Analysis of Gaged Michigan Rivers and Streams · Application of the . Richards-Baker...

Application of the Richards-Baker Flashiness Index to Gaged Michigan Rivers and Streams
Dave Fongers Hydrologic Studies and Dam Safety Unit Water Resources Division With Assistance from Robert Day Joseph Rathbun Nonpoint Source Unit Water Resources Division
May 3, 2012
MI/DEQ/WRD-12/028
This Nonpoint Source Pollution Control project has been funded wholly by the United States Environmental Protection Agency through a Part 319 grant to the Michigan Department of Environmental Quality. The contents of this document do not necessarily reflect the views and policies of the United States Environmental Protection Agency, nor does the mention of trade names or commercial products constitute endorsement or recommendation for use. For more information, please visit www.michigan.gov/nps. The cover depicts the United States Geological Survey gages analyzed using the Richards-Baker Flashiness Index method. For comments or questions relating to this document, please contact Dave Fongers at: Michigan Department of Environmental Quality Water Resources Division P.O. Box 30458 Lansing, Michigan 48909-7958 [email protected]

Table of Contents Summary .................................................................................................................................. 1 Introduction .............................................................................................................................. 2 Methodology............................................................................................................................. 3
Gage Selection ...................................................................................................................... 3 Calculation of Yearly and Characteristic R-B Index Values .................................................... 5 General Changes in Methodology since the 2007 Report ....................................................... 6 Gage-Specific Changes in Methodology since the 2007 Report ............................................. 7
R-B Index Value Analysis ........................................................................................................ 8 Trend Analysis ........................................................................................................................12 Changes in Results since the 2007 Report ...........................................................................17 Understanding the Flashiness Results .................................................................................22
Application to NPS BMP Selection ........................................................................................22 Flashiness Changes and Hydrologic Alterations....................................................................22
Dams .................................................................................................................................23 Land Use, Soil, and Imperviousness .................................................................................23
Gage-Specific Flashiness Information ..................................................................................30
Information by Gage Site .......................................................................................................30 Statistical Analysis Summary .............................................................................................. 126
References ............................................................................................................................ 141 Appendices ........................................................................................................................... A-1
Appendix A: Explanation of Cusum Analysis ....................................................................... A-1 Appendix B: Michigan’s Major Watersheds ......................................................................... B-1

1
Summary Stream flashiness is a stream flow response to storms. Streams that rise and fall quickly are considered flashier than those that maintain a steadier flow. An increase in flashiness, often due to changing land use, is a common cause of stream channel instability. The Richards-Baker Flashiness Index (R-B Index) uses data from United States Geological Survey (USGS) gaging stations to quantify the frequency and rapidity of short-term changes in stream flow. The Michigan Department of Environmental Quality (MDEQ) Nonpoint Source (NPS) Program staff calculated R-B Index values and assessed trends for 308 USGS gages in Michigan watersheds that had at least five years of data through the end of water year 2011. The NPS Program encourages grant recipients to incorporate this information in their stream stability assessments and watershed management plans. Watershed stakeholders should also find it useful as an aid to Best Management Practices (BMPs) selection and design. The NPS Program may also use the information to guide future grant goals. The information should also be useful to those interpreting other data, such as watershed development trends, stream bank erosion rates, or biological survey data. The characteristic R-B Index values for Michigan watersheds are unitless and range from 0.005 to 1.009. Fluctuations over time are apparent in a stream’s R-B Index values. Some fluctuations in the R-B Index values are expected from year to year simply because of natural weather variations. Longer term trends result from hydrologic alterations within the watershed. Trends identified at gages in operation during the past 25 years should be influencing the streams’ morphology today. For the 204 gages in operation during the past 25 years, 31 have decreasing trends and 39 have increasing trends. For gages included in the 2007 report that have updated trend analyses, 10 gages have morphologically destabilizing flashiness trend changes and 33 have morphologically stabilizing or stable trend changes. An increase in flashiness, due to higher peak flows or more frequent bankfull flows, may result in measurable changes to the channel shape – width, depth, sinuosity, and slope. These changes occur by erosion. Reducing excessive erosion is a common NPS project objective. A frequent dilemma in selecting and siting NPS BMPs is assessing the scale of the stream channel stability problem versus the scale of the problem’s cause. The R-B Index is one tool for diagnosing the scale of a particular stream channel problem. This report is intended to describe the flashiness analysis methodology and results. It does not attempt to fully explain changes in R-B Index values at specific sites. Further analysis of a specific site or sites within a watershed would be more efficiently and practically performed by local watershed groups and other stakeholders who can often apply watershed-specific and other local information to the interpretation. The R-B Index values and trends apply only to the stream in the vicinity of the gage. Conditions throughout the watershed may vary. For example, flashy flows in a stream above the gage may be masked by the combined flows of other streams at the gage. Similarly, streams that are increasingly flashy at one gaged location may become stable downstream due to attenuation of flashy flows by tributary flows downstream of the gage.

2
Introduction The term flashiness reflects the frequency and rapidity of short-term changes in stream flow (Baker et al., 2004). A stream described as flashy responds to rainfall by rising and falling quickly. Conversely, a stream that is not flashy would rise and fall less for an equivalent rainfall and would typically derive more of its overall flow from groundwater. One approach to quantifying flashiness was proposed by Baker et al (2004). The method measures the path length of flow oscillations for data from gaged streams. Longer paths correlate with flashier streams, while more constant flows have shorter path lengths. Values for the R-B Index could theoretically range from zero to two. The R-B Index value would have a value of zero if the stream flow were absolutely constant. The R-B Index value increases as the path length, and flashiness, increase. An example of R-B Index values for two Michigan streams with similar drainage areas is shown in Figure 1. The Au Sable River and Lower River Rouge gaged drainage areas are 97 and 84 square miles, respectively. For water year 1991, both gages recorded similar total flows; 900 and 790 billion cubic feet for the Au Sable River and Lower Rouge River, respectively. Despite similar drainage areas and total discharges, the Lower Rouge River exhibited much flashier flows than the Au Sable River, with R-B Index values of 0.56 and 0.05, respectively. This is presumably due primarily to three factors: vegetation, soils, and imperviousness. The Au Sable River watershed has more vegetation and sandier, more permeable soils. The Lower Rouge River watershed has more impervious surface cover.
Figure 1 – Hydrographs for Two Michigan Streams. One complication in interpreting R-B Index values is the effect of watershed size. Specifically, smaller watersheds naturally tend to have flashier flows. There is a natural tendency for flashiness

3
to decrease as the drainage area increases because varied timing of tributary flows helps attenuate main channel peak flows, and because soils and land uses tend to become more varied as the watershed size increases. This is reflected in the Baker et al (2004) results, as summarized in Figure 2, which shows that maximum R-B Index values decrease as watershed size increases.
Figure 2 – Summary of the Richards-Baker Data for 515 Gages in Six Midwestern States, including Michigan.
Methodology
Gage Selection This flashiness analysis for Michigan watersheds uses average daily flow data from 308 USGS gages (Figure 3). The selection criteria was that each gage had at least five years of daily data (P. Richards, personal communication, 2005) and that the flow data be available for at least 90 percent of the water year. For this report, data was available through the end of water year 2011, which was September 30, 2011. We did not limit the age of the data, preferring that watershed groups and other users of the results draw their own conclusions with regard to the validity and usefulness of the results, particularly with regard to discontinued gages, for their watershed. Of the 308 gages, 104 were discontinued over 25 years ago. Another 61 were discontinued 2 to 25 years ago. Refer also to Figure 3. Flashiness rankings for discontinued gages may not reflect current conditions. Occasionally, a gage is moved and assigned a new number. If the gages are considered equivalent, the discontinued gage’s flow record is included in the new gage’s record. Only the newer gage, with the complete record, is included in this analysis. These gages are noted in the “Information by Gage Site” section.

4
Figure 3 – USGS Gage Status for Michigan Watersheds.

5
Calculation of Yearly and Characteristic R-B Index Values Yearly R-B Index values are calculated by summing the absolute values of daily flow differences and dividing by the sum of the daily flows for each year, as shown in Figure 4. If flow data is not available for one day, the difference equation spans the one day gap. For gaps of two days or more, the difference equation is reset at the beginning of the gap. Days reported as “ICE” are excluded from this analysis and are the most common reason for a data gap. More detail can be obtained from the journal article by Baker et al (2004).
Figure 4 – Calculation of Yearly R-B Index Values. A characteristic R-B Index value for each gage is calculated from that gage’s yearly values. Refer also to Figure 5.
• Linear regression is used to estimate the characteristic R-B Index value at the last year when data were collected when there is a statistically significant trend. For this report, statistical significance means linear regression p value is less than or equal to 0.05. In other words, the characteristic R-B Index value is the point on the trend line at the last year of data collection. This point is highlighted on the graphs in “Information by Gage Site” section.
• If there is not a trend, the characteristic R-B Index value is the average of yearly R-B Index values.

6
The F-Test Two-Sample for Variances analysis was applied to gages with large yearly data gaps. If P(F<=f) one-tail is less than 0.05, the variances are different and only the more recent data is analyzed for linear regression. If greater than 0.05, all data are used. Visual examination of the data plots for each gage indicates that some gages have experienced trend changes. A statistical technique, termed cusum, was then applied to the data, and then the first derivative of the five-year moving average cusum data was plotted. Extremes in the first derivative plots were used to identify possible trend breaks. Where a possible trend change was identified, an additional regression analysis was performed on the gage’s more recent yearly R-B Index values. This technique is further explained in Appendix A. If a statistically significant change occurred, only the more recent data were used for the trend analysis and to calculate the characteristic R-B Index value. Serially correlated data and data with heterogeneous variance were excluded from the linear regression analysis. The linear trend lines shown in the “Information by Gage Site” section do not guarantee a linear relationship between flashiness and time for those streams, nor can they be used to predict future flashiness trends for those streams. The physical processes causing the changes are undoubtedly complex. The trends identified are only intended to objectively identify streams experiencing flow changes that may be physically altering the stream’s channel morphology today.
Figure 5 – Examples of Characteristic R-B Index Values.
General Changes in Methodology since the 2007 Report Data through water year 2011 were added. Gages outside the state of Michigan were added if they are in a watershed that includes Michigan. A few new gages within Michigan were also added. The term “Average R-B Index Value” was replaced with “Characteristic R-B Index Value” because averages are no longer used when there is a statistically significant trend. Other statistical criteria were revised as described below:
1. The yearly analyses were restricted to only include water years that have flow data for at least 90 percent of the water year, or at least 329 days. Ice days are excluded. This revision was applied to all data, resulting in the deletion of some previously reported R-B Index yearly values and the elimination of one gage from the analysis.
2. The F-Test Two-Sample for Variances analysis was applied to gages with significant data gaps.
3. Statistical significance is reported only if the p value is less than or equal to 0.05. In the 2007 report, we included p values of 0.05 to 0.10.
Characteristic R-B Index Value

7
4. Where there is a statistically significant trend, linear regression is used to estimate the characteristic R-B Index value at the last year when data were collected. Previously, the average of the yearly R-B Index values for the years spanned by the trend line was used for what is termed the characteristic R-B Index value in this report.
Gage-Specific Changes in Methodology since the 2007 Report Gage 04065000 (Menominee River near Iron Mountain), included in the first report, is no longer included because the data does not meet criterion number 1 listed under “General Changes.” Thirty gages were added (Figure 6). Most are in Indiana or Wisconsin, but located in a watershed that includes Michigan. A few new gages in Michigan that now have enough data to be analyzed have been added. Four of the added gages have statistically significant increasing trends. Four have statistically significant decreasing trends. This information will be useful to someone considering BMPs for a site in Michigan, but upstream or downstream of one of the added gages. See also the “Application to NPS BMP Selection” section.
Figure 6 – Gages Added to the Analysis Since the 2007 Report.

8
List of Added Gages: • Streams Tributary to Lake Superior
o 04028000, Montreal River at Ironwood, Michigan o 04029000, West Branch Montreal River at Gile, Wisconsin o 04029990, Montreal River at Saxon Falls near Saxon, Wisconsin o 04043150, Silver River near L'Anse, Michigan o 04043244, East Branch Salmon Trout River near Dodge City, Michigan o 04043275, Yellow Dog River near Big Bay, Michigan
• Streams Tributary to Lake Michigan, Upper Peninsula
o 04063700, Popple River near Fence, Wisconsin o 04064000, Pine River near Florence, Wisconsin o 04064500, Pine River below Pine River Powerplant near Florence, Wisconsin o 04065106, Menominee River at Niagara, Wisconsin (decreasing trend) o 04066030, Menominee River at White Rapids Dam near Banat, Michigan o 04066500, Pike River at Amberg, Wisconsin o 04067500, Menominee River near McAllister, Wisconsin (decreasing trend)
• Streams Tributary to Lake Michigan, Southern Lower Peninsula
o 04096100, Galena River near Laporte, Indiana o 04097970, Lime Lake Outlet at Panama, Indiana o 04099510, Pigeon Creek near Angola, Indiana (decreasing trend) o 04099610, Pretty Lake Inlet near Stroh, Indiana o 04099750, Pigeon River near Scott, Indiana (increasing trend) o 04099808, Little Elkhart River at Middlebury, Indiana o 04099850, Pine Creek near Elkhart, Indiana o 04100222, North Branch Elkhart River at Cosperville, Indiana (decreasing trend) o 04100252, Forker Creek near Burr Oak, Indiana (increasing trend) o 04100295, Rimmell Branch near Albion, Indiana o 04100377, Solomon Creek near Syracuse, Indiana (increasing trend) o 04100465, Turkey Creek at Syracuse, Indiana o 04100500, Elkhart River at Goshen, Indiana o 04101000, St. Joseph River at Elkhart, Indiana (increasing trend) o 04101370, Juday Creek near South Bend, Indiana o 04108670, Kalamazoo River near New Richmond, Michigan
• Streams Tributary to Detroit River
o 04168580, Ecorse River at Dearborn Heights, Michigan R-B Index Value Analysis The R-B Index values for Michigan watersheds range from 0.005 to 1.009, as shown in Table 1. For comparison, the R-B Index values for the Richards-Baker six-state study of 515 midwestern gages ranged from 0.030 to 1.323. The Richards-Baker six-state study used data from 1975 through 2001. Results of this R-B flashiness analysis are summarized in Figures 7 and 8. Figure 7 is similar to Figure 2, which summarizes the six-state Richards-Baker data. The 3,000-square mile drainage

9
area break point used in that study was omitted in this study because only eight gages in this study exceed that size. Figure 8 illustrates the quartile rankings. Most of the flashiest steams are in the southeastern portion of the Lower Peninsula or the western end of the Upper Peninsula. This is likely a combination of developed land uses and heavier soils. The cluster of less flashy streams in the northern portion of the Lower Peninsula is likely the result of extensive natural land uses and sandy soils. In itself, a high or low ranking is not necessarily good or bad. The rankings may be used to identify areas where methods to reduce flashiness can be employed, or to identify areas where extra effort is warranted to protect our most sensitive and exceptional streams. This is discussed further in the “Flashiness Changes and Hydrologic Alterations, Land Use” section. Detailed information for each gage is provided in the “Gage-Specific Flashiness Information” section. Table 1 – Summary of R-B Flashiness Analysis Statistics.
MDEQ Analysis for Michigan
Drainage Area (sq. miles) 0-30 30-100 100-300 300-1000 1000+
Number of Gages 49 80 75 65 39 Mean 0.356 0.222 0.138 0.129 0.092
Minimum 0.005 0.046 0.026 0.029 0.047 25th Percentile 0.156 0.101 0.076 0.067 0.060
Median/50th Percentile 0.294 0.173 0.104 0.105 0.077 75th Percentile 0.489 0.289 0.172 0.149 0.100
Maximum 0.957 1.009 0.492 0.429 0.229

10
Figure 7 – Summary of Michigan R-B Index values.

11
Figure 8 – Quartile Ranking of Michigan R-B Index Values.
Flashiness rankings are for gages with at least five years of data. Many gages have been discontinued. Rankings may not reflect current conditions. Rankings are for the gage locations only. Conditions throughout the watershed may vary.

12
Trend Analysis Fluctuations over time are common in a stream’s R-B Index values. Some fluctuations in the R-B Index values are expected from year to year simply because of natural weather variations. Longer-term trends result from hydrologic alterations, such as a change in land use or removal or change in operation of a dam. Figure 9 illustrates two examples. An increase in flashiness, due to higher peak flows or more frequent bankfull flows, can result in changes to the channel shape: width, depth, sinuosity, and slope. This is especially true for stream channels that are steep and composed of noncohesive materials (Rhoads and Miller, 1991). Changes in stream channel shape, in turn, can have significant impacts on aquatic organism populations (Richards et al., 1997; Van Steeter and Pitlick, 1998). Because a stream can take 50 years or more to adapt to flow changes (Caraco, 2000), we restricted the trend analysis to gages in operation during the past 25 years. The identified trends, which may span part or all of the gage record, should therefore be influencing each stream’s morphology today and provide a comparative reference of the present condition of Michigan’s streams.
Figure 9 – Examples of Changing Stream Flashiness over Time. As noted earlier, R-B Index values tend to decrease as the watershed sizes increase, which is accounted for in the quartile rankings. With regard to the trend analysis, smaller watersheds are also more likely to register an increase in flashiness, as shown in Figure 10. For example, 41 percent of the gages with an increasing trend have watersheds smaller than 100 square miles, compared to only 19 percent of the gages with decreasing trends. The results of the trend analysis are shown in Figure 11 and Tables 2 and 3. Statistically significant trends in the R-B Index values are identified for 70 of the 204 gages in operation during the past 25 years. Thirty-one of the gages have decreasing trends. Thirty-nine of the gages have increasing trends. Detailed information for each gage is provided in the “Gage-Specific Flashiness Information” section. Trends are for the gage location only. Streams that are increasingly flashy at one location may become stable downstream due to attenuation of flashy flows by tributary flows downstream of the gage. Similarly, flashy flows in a stream above the gage may be masked by the combined flows of other streams at the gage.
Increasing Flashiness Decreasing Flashiness

13
Figure 10 – Scaling Comparison of Gages with Increasing and Decreasing R-B Index Trends.

14
Figure 11 – Flashiness Trend by Gage.
Flashiness trends are for gaged sites in operation during the past 25 years. Some gages have been discontinued and trends may not reflect current conditions. Trends are for the gage locations only. Conditions throughout the watershed may vary.
15
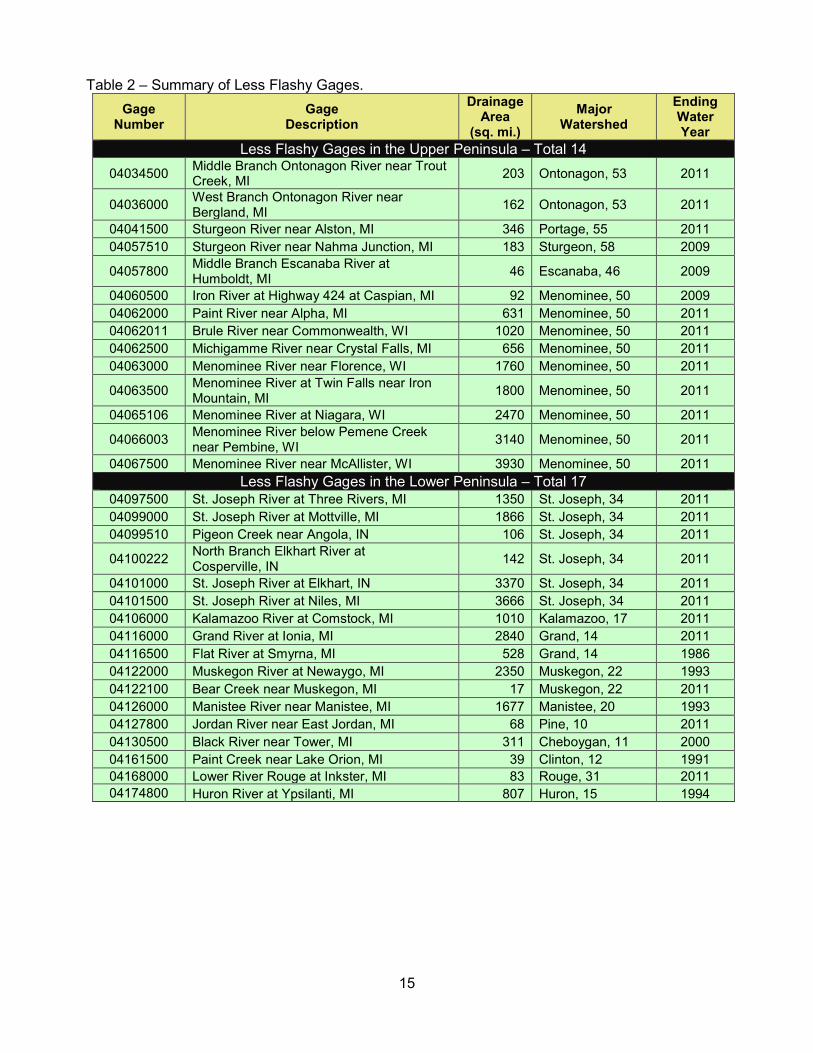
Table 2 – Summary of Less Flashy Gages. Gage
Number Gage
Description Drainage
Area (sq. mi.)
Major Watershed
Ending Water Year
Less Flashy Gages in the Upper Peninsula – Total 14 04034500 Middle Branch Ontonagon River near Trout
Creek, MI 203 Ontonagon, 53 2011
04036000 West Branch Ontonagon River near Bergland, MI 162 Ontonagon, 53 2011
04041500 Sturgeon River near Alston, MI 346 Portage, 55 2011 04057510 Sturgeon River near Nahma Junction, MI 183 Sturgeon, 58 2009
04057800 Middle Branch Escanaba River at Humboldt, MI 46 Escanaba, 46 2009
04060500 Iron River at Highway 424 at Caspian, MI 92 Menominee, 50 2009 04062000 Paint River near Alpha, MI 631 Menominee, 50 2011 04062011 Brule River near Commonwealth, WI 1020 Menominee, 50 2011 04062500 Michigamme River near Crystal Falls, MI 656 Menominee, 50 2011 04063000 Menominee River near Florence, WI 1760 Menominee, 50 2011
04063500 Menominee River at Twin Falls near Iron Mountain, MI 1800 Menominee, 50 2011
04065106 Menominee River at Niagara, WI 2470 Menominee, 50 2011
04066003 Menominee River below Pemene Creek near Pembine, WI 3140 Menominee, 50 2011
04067500 Menominee River near McAllister, WI 3930 Menominee, 50 2011 Less Flashy Gages in the Lower Peninsula – Total 17
04097500 St. Joseph River at Three Rivers, MI 1350 St. Joseph, 34 2011 04099000 St. Joseph River at Mottville, MI 1866 St. Joseph, 34 2011 04099510 Pigeon Creek near Angola, IN 106 St. Joseph, 34 2011
04100222 North Branch Elkhart River at Cosperville, IN 142 St. Joseph, 34 2011
04101000 St. Joseph River at Elkhart, IN 3370 St. Joseph, 34 2011 04101500 St. Joseph River at Niles, MI 3666 St. Joseph, 34 2011 04106000 Kalamazoo River at Comstock, MI 1010 Kalamazoo, 17 2011 04116000 Grand River at Ionia, MI 2840 Grand, 14 2011 04116500 Flat River at Smyrna, MI 528 Grand, 14 1986 04122000 Muskegon River at Newaygo, MI 2350 Muskegon, 22 1993 04122100 Bear Creek near Muskegon, MI 17 Muskegon, 22 2011 04126000 Manistee River near Manistee, MI 1677 Manistee, 20 1993 04127800 Jordan River near East Jordan, MI 68 Pine, 10 2011 04130500 Black River near Tower, MI 311 Cheboygan, 11 2000 04161500 Paint Creek near Lake Orion, MI 39 Clinton, 12 1991 04168000 Lower River Rouge at Inkster, MI 83 Rouge, 31 2011 04174800 Huron River at Ypsilanti, MI 807 Huron, 15 1994

16
Table 3 – Summary of More Flashy Gages. Gage
Number Gage
Description Drainage
Area (sq. mi.)
Major Watershed
Ending Water Year
More Flashy Gages in the Upper Peninsula – Total 1 04037500 Cisco Branch Ontonagon River at Cisco
Lake Outlet, MI 51 Ontonagon, 53 2011
More Flashy Gages in the Lower Peninsula – Total 38 04096515 South Branch Hog Creek near Allen, MI 49 St. Joseph, 34 2010 04096900 Nottawa Creek near Athens, MI 162 St. Joseph, 34 1997 04099750 Pigeon River near Scott, IN 307 St. Joseph, 34 2011 04100252 Forker Creek near Burr Oak, IN 19 St. Joseph, 34 2003 04100377 Solomon Creek near Syracuse, IN 36 St. Joseph, 34 2003 04101800 Dowagiac River at Sumnerville, MI 255 St. Joseph, 34 2011 04102500 Paw Paw River at Riverside, MI 390 St. Joseph, 34 2011 04102700 South Branch Black River near Bangor, MI 84 Black, 7 2011 04104945 Wanadoga Creek near Battle Creek, MI 48 Kalamazoo, 17 2011 04105000 Battle Creek at Battle Creek, MI 241 Kalamazoo, 17 2011 04105500 Kalamazoo River near Battle Creek, MI 824 Kalamazoo, 17 2011 04105700 Augusta Creek near Augusta, MI 39 Kalamazoo, 17 2011 04106180 Portage Creek at Portage, MI 17 Kalamazoo, 17 2006
04106320 West Fork Portage Creek near Oshtemo, MI 13 Kalamazoo, 17 1996
04106500 Portage Creek at Kalamazoo, MI 47 Kalamazoo, 17 1986 04108600 Rabbit River near Hopkins, MI 71 Kalamazoo, 17 2011 04111379 Red Cedar River near Williamston, MI 163 Grand, 14 2011 04112500 Red Cedar River at East Lansing, MI 355 Grand 14 2011 04118000 Thornapple River near Caledonia, MI 773 Grand 14 1994 04121944 Little Muskegon River near Oak Grove, MI 345 Muskegon, 22 2011 04121970 Muskegon River near Croton, MI 2313 Muskegon, 22 2011 04122500 Pere Marquette River at Scottville, MI 681 Pere Marquette, 25 2011 04124000 Manistee River near Sherman, MI 857 Manistee, 20 2011
04128990 Pigeon River at Sturgeon Valley Road near Vanderbilt, MI 58 Cheboygan, 11 2011
04135500 Au Sable River at Grayling, MI 110 Au Sable, 2 1993
04135700 South Branch Au Sable River near Luzerne, MI 401 Au Sable, 2 2011
04136000 Au Sable River near Red Oak, MI 1108 Au Sable, 2 2011 04137005 Au Sable River near Curtisville, MI 1598 Au Sable, 2 2011 04147500 Flint River near Otisville, MI 530 Saginaw, 32 2011 04148140 Kearsley Creek near Davison, MI 99 Saginaw, 32 2011 04148500 Flint River near Flint, MI 956 Saginaw, 32 2011 04160600 Belle River at Memphis, MI 151 Belle, 3 2011 04161100 Galloway Creek near Auburn Heights, MI 18 Clinton, 12 1991 04161540 Paint Creek at Rochester, MI 71 Clinton, 12 2011 04161580 Stony Creek near Romeo, MI 26 Clinton, 12 2011 04164000 Clinton River near Fraser, MI 444 Clinton, 12 2011
04165500 Clinton River at Moravian Drive at Mount Clemens, MI 734 Clinton, 12 2004
04176000 River Raisin near Adrian, MI 463 Raisin, 29 2011

17
Changes in Results since the 2007 Report Many of the characteristic R-B Index values were recalculated as trend line endpoints at the last year of data collection instead of as averages. Data with large gaps were also reevaluated using F-Test Two-Sample for Variances analysis. Some gages therefore have revised characteristic R-B Index values due only to refinements in the methodology, not because of a change in the stream’s flashiness. Further, one gage was dropped and 30 gages were added, mostly in neighboring states, but located in a watershed that includes Michigan. Because of these revisions, the summary statistics, Table 1, and trend counts, Table 2, should not be directly compared to the 2007 report. Seventy-two of the gages with trends can be reviewed for changes from the 2007 report to this report. These 72 gages are summarized in Table 4 and on Figure 12 with the results grouped as follows:
• Destabilizing – unnatural steambank erosion is possible
o Decreasing trend updated to increasing trend o No trend updated to increasing trend o Continued increasing trend
• Stabilizing – unnatural steambank erosion rate is not worsening and may be improving
o Increasing trend updated to no trend o Increasing trend updated to decreasing trend
• Stable – unnatural steambank erosion rate is not expected
o Decreasing trend updated to no trend o No trend updated to decreasing trend o Continued decreasing trend
Table 4 – Summary of Trend Comparison from 2007 to 2012 Report.
Morphologic Impact
Trend Changed
Trend Continuing Unchanged Total
Destabilizing 11 18 29 Stabilizing 14 * 14
Stable 19 10 29 *As defined above, all gages classified as stabilizing must have a trend change from the 2007 report.
Twenty-eight gages were excluded from the comparison as described in Table 5. Table 6 provides details for each of the gages as compared to the 2007 report. Forty-four gages with additional data had revised trend analysis. Twenty-eight gages have additional data analyzed for this report, but the reported trend did not change.

18
Table 5 – Gages Excluded from Comparison, Sorted by Gage Number.
Gage Comment 04065106, Menominee River at Niagara, WI Not in 2007 report, neighboring state, decreasing trend 04065393, East Branch Sturgeon River below Skunk Creek near Felch, MI Data now over 25 years old, was decreasing trend
04067500, Menominee River near McAllister, WI Not in 2007 report, neighboring state, decreasing trend
04096900, Nottawa Creek Near Athens, MI Static Analysis, Increasing Trend, but gage was discontinued and had no additional data to analyze
04099510, Pigeon Creek near Angola, IN Not in 2007 report, neighboring state, decreasing trend 04099750, Pigeon River near Scott, IN Not in 2007 report, neighboring state, increasing trend 04100222, North Branch Elkhart River at Cosperville, IN Not in 2007 report, neighboring state, decreasing trend
04100252, Forker Creek near Burr Oak, IN Not in 2007 report, neighboring state, increasing trend 04100377, Solomon Creek near Syracuse, IN Not in 2007 report, neighboring state, increasing trend
04101000, St. Joseph River at Elkhart, IN Not in 2007 report, neighboring state, increasing trend 04106320, West Fork Portage Creek Near Oshtemo, MI
Static Analysis, Increasing Trend, but gage was discontinued and had no additional data to analyze
04106500, Portage Creek At Kalamazoo, MI Static Analysis, Increasing Trend, but gage was discontinued and had no additional data to analyze
04116500, Flat River At Smyrna, MI Static Analysis, Decreasing Trend, but gage was discontinued and had no additional data to analyze
04118000, Thornapple River Near Caledonia, MI
Static Analysis, Increasing Trend, but gage was discontinued and had no additional data to analyze
04122000, Muskegon River At Newaygo, MI Static Analysis, Decreasing Trend, but gage was discontinued and had no additional data to analyze
04126000, Manistee River Near Manistee, MI
Static Analysis, Decreasing Trend, but gage was discontinued and had no additional data to analyze
04135500, Au Sable River At Grayling, MI Static Analysis, Increasing Trend, but gage was discontinued and had no additional data to analyze
04135600, East Branch Au Sable River at Grayling, MI Data now over 25 years old, was increasing trend
04140500, Rifle River at State Road at Selkirk, MI Data now over 25 years old, was decreasing trend
04143500, North Branch Kawkawlin River near Kawkawlin, MI Data now over 25 years old, was decreasing trend
04144000, Shiawassee River at Byron, MI Data now over 25 years old, was decreasing trend 04152500, Tobacco River at Glidden Road at Beaverton, MI Data now over 25 years old, was decreasing trend
04161100, Galloway Creek Near Auburn Heights, MI
Static Analysis, Increasing Trend, but gage was discontinued and had no additional data to analyze
04161500, Paint Creek near Lake Orion, MI No trend changed to decreasing trend based on revised analysis, no new data
04162900, Big Beaver Creek near Warren, MI
Increasing trend changed to no trend based on revised analysis, no new data
04165500, Clinton River At Mount Clemens, MI
Static Analysis, Increasing Trend, but gage was discontinued and had no additional data to analyze
04174800, Huron River At Ypsilanti, MI Static Analysis, Decreasing Trend, but gage was discontinued and had no additional data to analyze
04175700, River Raisin near Tecumseh, MI Data now over 25 years old, was decreasing trend

19
Table 6 – Gages with Updated Trend Analysis Compared to 2007 Report, Sorted by Gage Number.
Gage Trend Change Morphologic Impact
UP,
Lak
e Su
perio
r
04033000, Middle Branch Ontonagon River near Paulding, MI Increasing Trend to No Trend Stabilizing
04034500, Middle Branch Ontonagon River near Trout Creek, MI
Increasing Trend to Decreasing Trend Stabilizing
04036000, West Branch Ontonagon River Near Bergland, MI Decreasing Trend Continuing Stable
04037500, Cisco Branch Ontonagon River At Cisco Lake Outlet, MI Increasing Trend Continuing Destabilizing 04041500, Sturgeon River near Alston, MI No Trend to Decreasing Trend Stable 04044724, AuTrain River at Forest Lake, MI Increasing Trend to No Trend Stabilizing
UP,
Lak
e M
ichi
gan
04057510, Sturgeon River near Nahma Junction, MI No Trend to Decreasing Trend Stable 04057800, Middle Branch Escanaba River at Humboldt, MI No Trend to Decreasing Trend Stable 04058100, Middle Branch Escanaba River near Princeton, MI Decreasing Trend to No Trend Stable 04059000, Escanaba River at Cornell, MI Decreasing Trend to No Trend Stable 04060500, Iron River at Highway 424 at Caspian, MI No Trend to Decreasing Trend Stable 04062000, Paint River near Alpha, MI No Trend to Decreasing Trend Stable 04062011, Brule River Near Commonwealth, WI Decreasing Trend Continuing Stable 04062500, Michigamme River Near Crystal Falls, MI Decreasing Trend Continuing Stable 04063000, Menominee River near Florence, WI No Trend to Decreasing Trend Stable 04063500, Menominee River at Twin Falls near Iron Mountain, MI No Trend to Decreasing Trend Stable 04066003, Menominee River Below Pemene Creek Near Pembine, WI Decreasing Trend Continuing Stable
LP, S
outh
ern
Lake
Mic
higa
n
04096015, Galien River near Sawyer, MI Decreasing Trend to No Trend Stable 04096515, South Branch Hog Creek Near Allen, MI Increasing Trend Continuing Destabilizing 04097500, St. Joseph River At Three Rivers, MI Decreasing Trend Continuing Stable 04099000, St. Joseph River At Mottville, MI Decreasing Trend Continuing Stable 04101500, St. Joseph River At Niles, MI Decreasing Trend Continuing Stable 04101800,Dowagiac River At Sumnerville, MI Increasing Trend Continuing Destabilizing 04102500,Paw Paw River At Riverside, MI Increasing Trend Continuing Destabilizing 04102700, South Branch Black River near Bangor, MI No Trend to Increasing Trend Destabilizing 04104945, Wanadoga Creek near Battle Creek, MI No Trend to Increasing Trend Destabilizing 04105000,Battle Creek At Battle Creek, MI Increasing Trend Continuing Destabilizing 04105500, Kalamazoo River near Battle Creek, MI Decreasing Trend to Increasing
Trend Destabilizing
04105700,Augusta Creek Near Augusta, MI Increasing Trend Continuing Destabilizing 04106000, Kalamazoo River at Comstock, MI No Trend to Decreasing Trend Stable 04106180,Portage Creek At Portage, MI Increasing Trend Continuing Destabilizing 04106400, West Fork Portage Creek at Kalamazoo, MI Increasing Trend to No Trend Stabilizing 04108600,Rabbit River Near Hopkins, MI Increasing Trend Continuing Destabilizing 04109000, Grand River at Jackson, MI Decreasing Trend to No Trend Stable 04111000, Grand River at Eaton Rapids, MI Decreasing Trend to No Trend Stable 04111379, Red Cedar River near Williamston, MI No Trend to Increasing Trend Destabilizing 04112500,Red Cedar River At East Lansing, MI Increasing Trend Continuing Destabilizing

20
Gage Trend Change Morphologic Impact
04116000, Grand River at Ionia, MI No Trend to Decreasing Trend Stable LP
, Nor
ther
n L.
Mic
higa
n 04121900, Little Muskegon River near Morley, MI Increasing Trend to No Trend Stabilizing 04121944, Little Muskegon River near Oak Grove, MI No Trend to Increasing Trend Destabilizing
04121970, Muskegon River near Croton, MI No Trend to Increasing Trend Destabilizing 04122100, Bear Creek Near Muskegon, MI Decreasing Trend Continuing Stable 04122500,Pere Marquette River At Scottville, MI Increasing Trend Continuing Destabilizing 04124000, Manistee River near Sherman, MI No Trend to Increasing Trend Destabilizing 04127800, Jordan River Near East Jordan, MI Decreasing Trend Continuing Stable
LP, L
ake
Hur
on
04128990,Pigeon River Near Vanderbilt, MI Increasing Trend Continuing Destabilizing 04130500, Black River near Tower, MI No Trend to Decreasing Trend Stable 04135700, South Branch Au Sable River near Luzerne, MI No Trend to Increasing Trend Destabilizing 04136000, Au Sable River near Red Oak, MI No Trend to Increasing Trend Destabilizing 04137005, Au Sable River near Curtisville, MI No Trend to Increasing Trend Destabilizing 04137500, Au Sable River near Au Sable, MI Decreasing Trend to No Trend Stable 04147500,Flint River Near Otisville, MI Increasing Trend Continuing Destabilizing 04148140, Kearsley Creek near Davison, MI No Trend to Increasing Trend Destabilizing 04148500,Flint River Near Flint, MI Increasing Trend Continuing Destabilizing 04149000, Flint River near Fosters, MI Decreasing Trend to No Trend Stable
St. C
lair
R.
04159492, Black River near Jeddo, MI Increasing Trend to No Trend Stabilizing
04160600,Belle River At Memphis, MI Increasing Trend Continuing Destabilizing
L. S
t, C
lair
04161000, Clinton River at Auburn Heights, MI Increasing Trend to No Trend Stabilizing 04161540,Paint Creek At Rochester, MI Increasing Trend Continuing Destabilizing 04161580,Stony Creek Near Romeo, MI Increasing Trend Continuing Destabilizing 04164000,Clinton River Near Fraser, MI Increasing Trend Continuing Destabilizing 04164500, North Branch Clinton River near Mount Clemens, MI Increasing Trend to No Trend Stabilizing
Det
roit
Riv
er
04166000, River Rouge at Birmingham, MI Increasing Trend to No Trend Stabilizing 04166100, River Rouge at Southfield, MI Increasing Trend to No Trend Stabilizing 04166200, Evans Ditch at Southfield, MI Increasing Trend to No Trend Stabilizing 04166300, Upper River Rouge at Farmington, MI Increasing Trend to No Trend Stabilizing 04166500, River Rouge at Detroit, MI Increasing Trend to No Trend Stabilizing 04167000, Middle River Rouge near Garden City, MI Increasing Trend to No Trend Stabilizing 04168000, Lower River Rouge At Inkster, MI Decreasing Trend Continuing Stable
L. E
rie 04173500, Mill Creek near Dexter, MI Decreasing Trend to No Trend Stable
04174500, Huron River at Ann Arbor, MI Decreasing Trend to No Trend Stable 04176000,River Raisin Near Adrian, MI Increasing Trend Continuing Destabilizing

21
Figure 12 – Gages with Flashiness Trend Changes from the 2007 Report.
22
Understanding the Flashiness Results
Application to NPS BMP Selection An increase in flashiness, due to higher or more frequent flows, results in changes to the channel shape: width, depth, sinuosity, and slope. These changes occur by erosion. Reducing excessive erosion is a component of many NPS projects. A frequent dilemma in selecting and siting NPS BMPs is assessing the scale of the stream channel stability problem versus the scale of the problem’s cause. A bank erosion problem with a local, small-scale cause (e.g., cattle access) can be addressed by a local BMP (e.g., fencing), while a bank erosion problem with a large-scale cause (e.g., a watershed-wide increase in impervious area) can only be addressed with a similarly large-scale solution (e.g., regional storm water management practices). The R-B Index is one tool for diagnosing the scale of a particular stream channel problem. If the R-B Index values are steady over time, channel erosion problems in the vicinity of the USGS gage may have local causes that can be addressed with a local BMP. Conversely, if an R-B Index trend indicates that flashiness is increasing over time, channel erosion problems in the vicinity of the gage station may have large-scale causes and will require a large-scale solution. Note that “in the vicinity of the gage” is not well defined. Streams that are increasingly flashy at one location may become stable downstream due to attenuation of flashy flows by tributary flows downstream of the gage. Similarly, flashy flows in a stream above the gage may be masked by the combined flows of other streams at the gage.
Flashiness Changes and Hydrologic Alterations In general, flashiness changes result from hydrologic alterations. Some factors that can alter flashiness include:
• In-Stream Changes
Removal or change in operation of a dam Expansion or straightening of the drainage network
• Watershed Land Use Changes
Urbanization Forest regrowth Soil compaction Change in paved or other impervious areas Use of low impact development techniques Change in forestry practices Change in agricultural practices Change in runoff storage capacity
This report does not attempt to fully explain R-B Index value changes at specific sites. Thorough analysis of a specific site or sites within a watershed would be more efficiently and practically performed by local watershed groups and other stakeholders who can often apply watershed-specific and other local information to the interpretation. However, an overview of the results does generally illustrate the effect of some hydrologic alterations. These are discussed in more detail in the following sections.

23
Dams The influence of water control structures, especially dams, is one of many complicating factors when interpreting stream flashiness data. The MDEQ tracks over 2,500 dams in a statewide dam safety database. There are undoubtedly many more small dams present on the state’s rivers and streams. Dams, especially hydropower dams, can influence stream flow and therefore stream flashiness in both the short term (oscillations over hours or days) and the long term (trends over many years). This report does not try to identify all locations where a dam may influence the results of the R-B Index calculations. However, the “Information by Gage Site” section notes gages that may be affected by dam operations. This information is from the MDEQ’s Surface Water Assessment Section (Suppnick, personal communication, 2006) and from yearly USGS Water Resources Data books. This information should be considered a partial, provisional list. Gage 04170000 is an example of dam operation affecting R-B Index values, as shown in Figure 13. The USGS notes that prior to May 29, 1957, the flow was regulated by a power plant. Since then, there has been only occasional regulation for lake level control. R-B Index values are consistently lower after 1957. The installation or removal of a dam, or a change in the operation of the dam, can affect the R-B Index values. However, if a dam is operated to manage only lower flows, it is possible that the effect on stream morphology will be negligible.
Figure 13 – Changes in the R-B Index Following Changes in 1957 in the Operation of a Dam Upstream of USGS Gage 04170000.
Land Use, Soil, and Imperviousness It is almost axiomatic that urban areas have flashy streams and undeveloped areas do not. Figures 14 and 15 illustrate the land use throughout the state as of 2001, along with the flashiness rankings and trends. Although the figures suggest that there is some correlation of flashiness with developed land uses, land use does not completely predict flashiness rankings or trends. Certainly many of the flashier gages are in urban areas. However, some are also in areas with extensive natural areas, and some of the gages in the lower quartiles are in or near urban areas. Soils, Figure 16, are also a factor in the quartile rankings. Flashiness rankings and trends represent the stream’s response to many factors in a complex system - the watershed. When wise storm water management is employed, adverse stream impacts can be minimized.

24
Figure 14 – General 2001 Land Use Classifications with R-B Index Quartile Rankings.

25
Figure 15 – General 2001 Land Use Classifications with R-B Index Flashiness Trends.

26
Figure 16 – Soil Hydrogroups from the United States Department of Agriculture-Natural Resources Conservation Service’s (USDA-NRCS) Soil Survey Geographic Database, Dual Classified Soil Resolved using 1978 Land Use Data, with R-B Index Quartile Rankings.

27
Imperviousness within the watershed has received particular attention as an indicator of stream quality. The Center for Watershed Protection developed the Impervious Cover Model (ICM) for urban headwater streams, excerpted in Table 7 and detailed in The Importance of Imperviousness, The Practice of Watershed Protection (Schueler, 2000). In May 2008, three ICM refinements were presented by Tom Schueler, Chesapeake Stormwater Network, and Lisa Fraley-McNeal, Center for Watershed Protection, at the 2nd Symposium on Urbanization and Stream Ecology. Figure 17 shows the revised figure, adapted with permission.
The three refinements as described by Fraley-McNeal (personal communication, 2008) are:
1. The imperviousness/stream quality relationship is now a cone rather than a line. The conerepresents the observed variability in stream quality and also the typical range in expectedimprovement that could be attributed to subwatershed treatment. The cone illustrates thatmost regions show a generally continuous but variable gradient of stream degradation asimpervious cover increases.
2. The cone width is greatest for impervious cover values less than ten percent, which reflectsthe wide variability in stream quality observed for these streams. This prevents themisperception that streams with low impervious cover will automatically possess good orexcellent quality. The expected quality of streams in this range of impervious cover isgenerally influenced more by other watershed characteristics such as forest cover, roaddensity, riparian continuity, and cropping practices.
3. The transition between stream quality classifications is now a band rather than a fixed line.If specific values are used to separate stream categories, the values should be based onactual monitoring data for the ecoregion, the stream indicators of greatest concern, and thepredominant predevelopment regional land cover (e.g., crops or forest).
To properly apply and interpret the ICM in a watershed context:
• Watershed scale matters. The use of the ICM should generally be restricted to first to thirdorder alluvial streams.
• The ICM may not work well in subwatersheds with major pollutant point sources, orextensive impoundments or dams within the stream network.
• The ICM is best applied to subwatersheds located within the same physiographic region. Inparticular, stream slopes, as measured from the top to the bottom of subwatersheds, shouldbe in the same general range.
• The ICM is unreliable when management practices are poor, particularly when imperviouscover levels are low (e.g., deforestation, acid mine drainage, intensive row crops,denudation of riparian cover).
When these caveats are applied, the available science generally reinforces the validity of the ICM as a watershed planning tool to forecast the general response of freshwater and tidal streams as a result of future land development.
Percent imperviousness was analyzed using 1978 land cover data, 1995 Topologically Integrated Geographic Encoding and Referencing population density data, and the Impervious Surface Analysis Tool (ISAT) Geographic Information Systems extension. The population data is from the Michigan Geographic Data Library, http://gis-michigan.opendata.arcgis.com/. The population data was converted to 50 meter grids. The ISAT was provided by the National Oceanic and Atmospheric Administration. Percent imperviousness was

28
estimated using ISAT according to Table 8. The imperviousness values for residential, commercial, and industrial are from the USDA-NRCS (1986). Figure 18 illustrates the percent imperviousness and flashiness trends results. Compared to the 2007 report, fewer of the gages that are exhibiting increasing flashiness are in or near urban areas with over 25 percent imperviousness. This is probably due to slower development and improved storm water management. Refer also to the “Changes in Results since the 2007 Report” section.
Figure 17 - Impervious Cover Model, Adapted with Permission (Fraley-McNeal 2008). Table 7 - Classification of Urban Headwater Streams.
Urban Stream Classification Sensitive Impacted Nonsupporting Channel Stability Stable Unstable Highly unstable Water Quality Good Fair Fair-Poor Stream Biodiversity Good-Excellent Fair-Good Poor
Resource Objective
Protect biodiversity and channel stability
Maintain critical elements of stream quality
Minimize downstream pollutant loads
Excerpted from “The Practice of Watershed Protection” (Schueler, 2000, p. 15). Table 8 - Imperviousness Table for ISAT Analysis.
Class Description Assigned Imperviousness (percent) by Population
Density (people per square mile) Less than 250 250-1000 Over 1000
1 Residential 25 38 65 2 Commercial 85 85 85 3 Industrial 72 72 72 4 Road, Utilities 95 95 95
7, 8, 9 Agriculture 1 1 1 5, 6, 10-14 Natural land covers 0 0 0

29
Figure 18 – Statewide Imperviousness with Updated Flashiness Trends, 1978 Land Use.

30
Gage-Specific Flashiness Information
Information by Gage Site Graphs of the R-B Index values are shown for each site. The x-axis always ends at 2011, so that the comparative age of the data is more readily apparent. The y-axis is constrained to show gridlines for every 0.1 increment, allowing a sense of rank relative to other gages - more gridlines equate to higher values. The graphs for all gages with data encompassing at least part of the past 25 years have a soft blue border. The characteristic R-B Index values are either:
• The average of the yearly R-B Index values and is shown as a horizontal gold line spanning the years used to calculate the value.
• The endpoint of a statistically significant (i.e., p < 0.05) trend. If the trend encompasses at least part of the past 25 years, it is represented by a sloped purple line. If the trend is older, it is represented by a sloped gold line with soft edges. Where there is an identified trend, the characteristic R-B Index value is based on the point on the trend line at the last year of data collection and is represented by a brown circle.
Gage-specific information is included under each graph. Some, though likely not all, of the gages that may be affected by dam operations are noted. In a few cases, equivalent gages are noted. This is where a gage is moved and assigned a new number, but considered equivalent. In these cases, the flow record for the discontinued gage is included in the new gage. Only the newer gage, with the complete record, is included in this analysis. The graphs in this section are arranged in numerical order. In general, they are arranged by Great Lake (or connecting channel) watershed, in the following order:
• Streams tributary to Lake Superior (04001000-04045500), pages 30-37 • Streams tributary to Lake Michigan
o Upper Peninsula (04046000-04067500), pages 37-53 o Southern Lower Peninsula (04096015-04119000), pages 53-76 o Northern Lower Peninsula (04121000-04127800), pages 77-84
• Streams tributary to Lake Huron
o Upper Peninsula (04127918), page 84 o Lower Peninsula (04127997-04159010), pages 85-104
• Streams tributary to St. Clair River (04159492-04160600), pages 104-106 • Streams tributary to Lake St. Clair (04160800-04165500), pages 106-115 • Streams tributary to Detroit River (04166000-04168580), pages 115-119 • Streams tributary to Lake Erie (04169500-04176605), pages 119-124
As noted on the USGS Web site, http://pubs.usgs.gov/wdr/WDR-WA-03-1/pdf/ADR_F.pdf, “Since October 1, 1950, hydrologic-station records in USGS reports have been listed in order of downstream direction along the main stream. All stations on a tributary entering upstream from a main-stream station are listed before that station. A station on a tributary entering between two mainstream stations is listed between those stations.”

31
Streams Tributary to Lake Superior
USGS Gage 04001000, Washington Creek at Windigo, MI
Drainage Area (square miles): 13.2 Basin Number: 55 Characteristic R-B Index Value: 0.225 Rank: Lower Middle First Water Year: 1965 Last Water Year: 2003 Number of Water Years Analyzed: 39
USGS Gage 04028000, Montreal River at Ironwood, MI
Drainage Area (square miles): 61.4 Basin Number: 51 Characteristic R-B Index Value: 0.284 Rank: Upper Middle First Water Year: 1919 Last Water Year: 1954 Number of Water Years Analyzed: 9
Comments: Gage added for this report update.
USGS Gage 04029000, West Branch Montreal River at Gile, WI
Drainage Area (square miles): 78 Basin Number: 51 Characteristic R-B Index Value: 0.174 Rank: Upper Middle First Water Year: 1919 Last Water Year: 1947 Number of Water Years Analyzed: 12
Comments: Gage added for this report update.
USGS Gage 04029990, Montreal River at Saxon Falls near Saxon, WI
Drainage Area (square miles): 261 Basin Number: 51 Characteristic R-B Index Value: 0.179 Rank: Highest First Water Year: 1939 Last Water Year: 2010 Number of Water Years Analyzed: 56
Comments: Gage added for this report update.

32
Streams Tributary to Lake Superior (cont.)
USGS Gage 04030000, Montreal River near Saxon, WI
Drainage Area (square miles): 264 Basin Number: 51 Characteristic R-B Index Value: 0.144 Rank: Upper Middle p value: 0.01 First Water Year: 1939 Last Water Year: 1970 Number of Water Years Analyzed: 32
Comments: Diurnal fluctuation caused by Saxon Falls power plant 1.5 miles upstream. Flow regulated by Gile reservoir on West Branch Montreal River since April 1941.
USGS Gage 04031000, Black River near Bessemer, MI
Drainage Area (square miles): 200 Basin Number: 56 Characteristic R-B Index Value: 0.220 Rank: Highest First Water Year: 1955 Last Water Year: 2010 Number of Water Years Analyzed: 38
Comments: Flow included some ground water pumped from mines at Bessemer.
USGS Gage 04031500, Presque Isle River at Marenisco, MI
Drainage Area (square miles): 171 Basin Number: 56 Characteristic R-B Index Value: 0.113 Rank: Upper Middle First Water Year: 1946 Last Water Year: 1982 Number of Water Years Analyzed: 37
Comments: Since 1959, occasional regulation by Presque Isle Flooding Reservoir 2.5 miles upstream.
USGS Gage 04032000, Presque Isle River near Tula, MI
Drainage Area (square miles): 261 Basin Number: 56 Characteristic R-B Index Value: 0.138 Rank: Upper Middle First Water Year: 1946 Last Water Year: 1973 Number of Water Years Analyzed: 28
Comments: Occasional regulation for lake or pond level control at several places above station at Marenisco.

33
Streams Tributary to Lake Superior (cont.)
USGS Gage 04032500, Iron River near White Pine, MI
Drainage Area (square miles): 98.1 Basin Number: 56 Characteristic R-B Index Value: 0.266 Rank: Upper Middle p value: 0.03 First Water Year: 1953 Last Water Year: 1957 Number of Water Years Analyzed: 5
USGS Gage 04033000, Middle Branch Ontonagon River near Paulding, MI
Drainage Area (square miles): 164 Basin Number: 53 Characteristic R-B Index Value: 0.081 Rank: Lower Middle First Water Year: 1943 First Water Year Analyzed, if different: 1976 Last Water Year: 2009 Number of Water Years Analyzed: 29
Comments: Initially published an increasing trend for this gage. Additional data revises the analysis to no trend for this report update.
USGS Gage 04034500, Middle Branch Ontonagon River near Trout Creek, MI
Drainage Area (square miles): 203 Basin Number: 53 Characteristic R-B Index Value: 0.049 Rank: Lowest Trend: decrease, p value: 0.02 First Water Year: 1943 Last Water Year: 2011 Number of Water Years Analyzed: 69
Comments: • Regulation by Bond Falls Reservoir 7.5
miles upstream. • Initially published an increasing trend for this
gage. Additional data revises the analysis to decreasing trend for this report update.
USGS Gage 04035000, East Branch Ontonagon River near Mass, MI
Drainage Area (square miles): 272 Basin Number: 53 Characteristic R-B Index Value: 0.170 Rank: Upper Middle First Water Year: 1943 Last Water Year: 1979 Number of Water Years Analyzed: 37

34
Streams Tributary to Lake Superior (cont.)
USGS Gage 04035500, Middle Branch Ontonagon River near Rockland, MI
Drainage Area (square miles): 671 Basin Number: 53 Characteristic R-B Index Value: 0.233 Rank: Highest First Water Year: 1943 Last Water Year: 2008 Number of Water Years Analyzed: 66
Comments: Regulation by Bond Falls Reservoir 30 miles upstream.
USGS Gage 04036000, West Branch Ontonagon River near Bergland, MI
Drainage Area (square miles): 162 Basin Number: 53 Characteristic R-B Index Value: 0.060 Rank: Lowest Trend: decrease, p value: 0.00 First Water Year: 1943 First Water Year Analyzed, if different: 1978 Last Water Year: 2011 Number of Water Years Analyzed: 34
Comments: Flow regulated by Lake Gogebic.
USGS Gage 04037500, Cisco Branch Ontonagon River at Cisco Lake Outlet, MI
Drainage Area (square miles): 50.7 Basin Number: 53 Characteristic R-B Index Value: 0.281 Rank: Upper Middle Trend: increase, p value: 0.00 First Water Year: 1945 First Water Year Analyzed, if different: 1977 Last Water Year: 2011 Number of Water Years Analyzed: 35
Comments: Flow regulated by Cisco Lake.
USGS Gage 04039500, South Branch Ontonagon River at Ewen, MI
Drainage Area (square miles): 348 Basin Number: 53 Characteristic R-B Index Value: 0.141 Rank: Upper Middle First Water Year: 1943 Last Water Year: 1971 Number of Water Years Analyzed: 28
Comments: Some diversions from middle branch Ontonagon River by Bond Falls Canal. Some regulation at medium and low flows by Cisco Lake.

35
Streams Tributary to Lake Superior (cont.)
USGS Gage 04040000, Ontonagon River near Rockland, MI
Drainage Area (square miles): 1340 Basin Number: 53 Characteristic R-B Index Value: 0.181 Rank: Highest First Water Year: 1943 Last Water Year: 2010 Number of Water Years Analyzed: 68
Comments: Regulated by Lake Victoria power plant on west branch five miles upstream. Bonds Falls reservoir 24 miles upstream.
USGS Gage 04040500, Sturgeon River near Sidnaw, MI
Drainage Area (square miles): 171 Basin Number: 55 Characteristic R-B Index Value: 0.153 Rank: Upper Middle First Water Year: 1944 Last Water Year: 2010 Number of Water Years Analyzed: 67
USGS Gage 04041500, Sturgeon River near Alston, MI Drainage Area (square miles): 346
Basin Number: 55 Characteristic R-B Index Value: 0.123 Rank: Upper Middle Trend: decrease, p value: 0.00 First Water Year: 1933 First Water Year Analyzed, if different: 1963 Last Water Year: 2011 Number of Water Years Analyzed: 49
Comments: • Flow regulated by power plant at gage
station. • Initially published no trend for this gage.
Additional data revises the analysis to decreasing trend for this report update.
USGS Gage 04042500, Otter River near Elo, MI
Drainage Area (square miles): 162 Basin Number: 55 Characteristic R-B Index Value: 0.176 Rank: Highest First Water Year: 1943 Last Water Year: 1972 Number of Water Years Analyzed: 30

36
Streams Tributary to Lake Superior (cont.)
USGS Gage 04043000, Sturgeon River near Arnheim, MI
Drainage Area (square miles): 705 Basin Number: 55 Characteristic R-B Index Value: 0.095 Rank: Lower Middle First Water Year: 1943 Last Water Year: 1973 Number of Water Years Analyzed: 31
Comments: Occasional slight regulation caused by Prickett Dam at mile 45.
USGS Gage 04043050, Trap Rock River near Lake Linden, MI
Drainage Area (square miles): 28 Basin Number: 55 Characteristic R-B Index Value: 0.233 Rank: Lower Middle First Water Year: 1967 Last Water Year: 2010 Number of Water Years Analyzed: 44
USGS Gage 04043150, Silver River near L'Anse, MI
Drainage Area (square miles): 64.7 Basin Number: 48 Characteristic R-B Index Value: 0.250 Rank: Upper Middle First Water Year: 2002 Last Water Year: 2010 Number of Water Years Analyzed: 9
Comments: Gage added for this report update.
USGS Gage 04043244, East Branch Salmon Trout River near Dodge City, MI
Drainage Area (square miles): 10.2 Basin Number: 48 Characteristic R-B Index Value: 0.144 Rank: Lowest First Water Year: 2006 Last Water Year: 2010 Number of Water Years Analyzed: 5
Comments: Gage added for this report update.

37
Streams Tributary to Lake Superior (cont.)
USGS Gage 04043275, Yellow Dog River near Big Bay, MI
Drainage Area (square miles): 31.8 Basin Number: 48 Characteristic R-B Index Value: 0.117 Rank: Lower Middle First Water Year: 2006 Last Water Year: 2010 Number of Water Years Analyzed: 5
Comments: Gage added for this report update.
USGS Gage 04044400, Carp River at US-Highway 41 near Negaunee, MI
Drainage Area (square miles): 51.4 Basin Number: 45 Characteristic R-B Index Value: 0.088 Rank: Lowest First Water Year: 1962 Last Water Year: 1985 Number of Water Years Analyzed: 24
Comments: Flow regulated by Deer Lake storage reservoir five miles upstream.
USGS Gage 04044583, Cherry Creek near Harvey, MI
Drainage Area (square miles): 4.53 Basin Number: 43 Characteristic R-B Index Value: 0.005 Rank: Lowest First Water Year: 1966 Last Water Year: 1981 Number of Water Years Analyzed: 7
USGS Gage 04044724, AuTrain River at Forest Lake, MI
Drainage Area (square miles): 81 Basin Number: 39 Characteristic R-B Index Value: 0.046 Rank: Lowest First Water Year: 1994 Last Water Year: 2011 Number of Water Years Analyzed: 18
Comments: • Flow regulated by a power plant 800 feet
upstream and by the Au-Train Basin 0.6 miles upstream.
• Initially published an increasing trend for this gage. Additional data revises the analysis to no trend for this report update.

38
Streams Tributary to Lake Superior (cont.)
USGS Gage 04045500, Tahquamenon River near Paradise, MI
Drainage Area (square miles): 790 Basin Number: 60 Characteristic R-B Index Value: 0.055 Rank: Lowest First Water Year: 1954 Last Water Year: 2010 Number of Water Years Analyzed: 57
Streams Tributary to Lake Michigan, Upper Peninsula
USGS Gage 04046000, Black River near Garnet, MI
Drainage Area (square miles): 28 Basin Number: 41 Characteristic R-B Index Value: 0.128 Rank: Lowest First Water Year: 1952 Last Water Year: 2011 Number of Water Years Analyzed: 44
USGS Gage 04049500, Manistique River at Germfask, MI
Drainage Area (square miles): 341 Basin Number: 49 Characteristic R-B Index Value: 0.040 Rank: Lowest p value: 0.05 First Water Year: 1939 Last Water Year: 1970 Number of Water Years Analyzed: 32
Comments: Slight regulation on outlet of Manistique Lake about seven miles upstream beginning July 1948.
USGS Gage 04054500, Duck Creek near Blaney, MI
Drainage Area (square miles): 92 Basin Number: 49 Characteristic R-B Index Value: 0.092 Rank: Lowest First Water Year: 1939 Last Water Year: 1954 Number of Water Years Analyzed: 16

39
Streams Tributary to Lake Michigan, Upper Peninsula (cont.)
USGS Gage 04055000, Manistique River at Cookson Bridge near Blaney, MI
Drainage Area (square miles): 704 Basin Number: 49 Characteristic R-B Index Value: 0.048 Rank: Lowest First Water Year: 1938 Last Water Year: 1970 Number of Water Years Analyzed: 33
Comments: Since July 1948 slight regulation on outlet at Manistique Lake about 25 miles upstream.
USGS Gage 04056000, West Branch Manistique River near Manistique, MI
Drainage Area (square miles): 322 Basin Number: 49 Characteristic R-B Index Value: 0.058 Rank: Lowest First Water Year: 1939 Last Water Year: 1956 Number of Water Years Analyzed: 18
USGS Gage 04056500, Manistique River near Manistique, MI Drainage Area (square miles): 1100
Basin Number: 49 Characteristic R-B Index Value: 0.050 Rank: Lowest First Water Year: 1939 Last Water Year: 2009 Number of Water Years Analyzed: 71
Comments: Slight regulation by dam on outlet of Manistee Lake since July 1948.
USGS Gage 04057000, Indian River near Manistique, MI
Drainage Area (square miles): 302 Basin Number: 49 Characteristic R-B Index Value: 0.029 Rank: Lowest First Water Year: 1939 First Water Year Analyzed, if different: 1965 Last Water Year: 1993 Number of Water Years Analyzed: 8
Comments: Indian Lake regulated 1.5 miles below base gage.

40
Streams Tributary to Lake Michigan, Upper Peninsula (cont.)
USGS Gage 04057510, Sturgeon River near Nahma Junction, MI
Drainage Area (square miles): 183 Basin Number: 58 Characteristic R-B Index Value: 0.089 Rank: Lower Middle Trend: decrease, p value: 0.01 First Water Year: 1967 First Water Year Analyzed, if different: 1984 Last Water Year: 2009 Number of Water Years Analyzed: 26
Comments: Initially published no trend for this gage. Additional data revises the analysis to decreasing trend for this report update.
USGS Gage 04057800, Middle Branch Escanaba River at Humboldt, MI
Drainage Area (square miles): 46 Basin Number: 46 Characteristic R-B Index Value: 0.153 Rank: Lower Middle Trend: decrease, p value: 0.03 First Water Year: 1960 Last Water Year: 2009 Number of Water Years Analyzed: 50
Comments: • From July 1960 to June 1972 some
diversions 100 feet upstream by industry for iron ore processing.
• Initially published no trend for this gage. Additional data revises the analysis to decreasing trend for this report update.

41
Streams Tributary to Lake Michigan, Upper Peninsula (cont.)
USGS Gage 04057820, Middle Branch Escanaba River near Greenwood, MI
Drainage Area (square miles): 73.3 Basin Number: 46 Characteristic R-B Index Value: 0.101 Rank: Lower Middle First Water Year: 1973 Last Water Year: 1982 Number of Water Years Analyzed: 10
Comments: Since January 1973 flow diverted 2.3 miles upstream at Greenwood after Bay, to Green Creek for iron ore processing, some returned to middle branch Escanaba River 24 miles downstream via another Green Creek and some returned to East Branch Escanaba River via Goose Lake Outlet.
USGS Gage 04057900, Black River near Republic, MI
Drainage Area (square miles): 34.4 Basin Number: 46 Characteristic R-B Index Value: 0.154 Rank: Lower Middle First Water Year: 1962 Last Water Year: 1968 Number of Water Years Analyzed: 7
Comments: Records include effluent from industrial plant diverted into basin from Middle Branch Escanaba River.
USGS Gage 04058000, Middle Branch Escanaba River near Ishpeming, MI
Drainage Area (square miles): 128 Basin Number: 46 Characteristic R-B Index Value: 0.131 Rank: Upper Middle First Water Year: 1955 Last Water Year: 1975 Number of Water Years Analyzed: 21
Comments: Some flow diverted and returned above station by iron ore processing plant.

42
Streams Tributary to Lake Michigan, Upper Peninsula (cont.)
USGS Gage 04058100, Middle Branch Escanaba River near Princeton, MI
Drainage Area (square miles): 210 Basin Number: 46 Characteristic R-B Index Value: 0.090 Rank: Lower Middle First Water Year: 1962 First Water Year Analyzed, if different: 1996 Last Water Year: 2011 Number of Water Years Analyzed: 15
Comments: • Flow regulated by power plant 400 feet
upstream from station. Since December 1972 additional regulation 27 miles upstream by Greenwood release. Since January 1973 some flow diverted to Green Creek via Greenwood Diversion 27 miles upstream. October 1979 some of the diversion returned five miles downstream via Goose Lake Outlet and East Branch Escanaba River. 1973 to 1991 discharges and runoff figures were adjusted for diversion and change in contents in Greenwood reservoir.
• Initially published decreasing trend for this gage. Additional data revises the analysis to no trend for this report update.
USGS Gage 04058200, Schweitzer Creek near Palmer, MI
Drainage Area (square miles): 23.6 Basin Number: 46 Characteristic R-B Index Value: 0.204 Rank: Lower Middle First Water Year: 1961 Last Water Year: 2009 Number of Water Years Analyzed: 49
Comments: Since August 1962 flow completely regulated by Schweitzer Reservoirs one mile upstream. Prior to June 1994 some diversions from headwaters of basin for municipal supply and effluent discharge to the Carp River basin. An average of 46 cubic feet per second was diverted from Schweitzer reservoirs by industry iron ore processing, some returned via Goose Lake Outlet and East Branch Escanaba River. Diversions into Schweitzer Reservoir from Greenwood Reservoir via Greenwood diversion.

43
Streams Tributary to Lake Michigan, Upper Peninsula (cont.)
USGS Gage 04058300, Warner Creek near Palmer, MI
Drainage Area (square miles): 14.2 Basin Number: 46 Characteristic R-B Index Value: 0.195 Rank: Lower Middle First Water Year: 1962 Last Water Year: 1978 Number of Water Years Analyzed: 13
USGS Gage 04058400, Goose Lake Outlet near Sands Station, MI
Drainage Area (square miles): 37.5 Basin Number: 46 Characteristic R-B Index Value: 0.084 Rank: Lowest p value: 0.05 First Water Year: 1966 Last Water Year: 1982 Number of Water Years Analyzed: 17
Comments: Flow includes an average of 9.6 cubic feet per second discharge into basin from mine tailings pond three miles upstream, the greater part diverted from Schweitzer Reservoir station. Diversion began October 1979.
USGS Gage 04058500, East Branch Escanaba River at Gwinn, MI
Drainage Area (square miles): 124 Basin Number: 46 Characteristic R-B Index Value: 0.133 Rank: Upper Middle First Water Year: 1955 Last Water Year: 1980 Number of Water Years Analyzed: 26
Comments: Since August 1962 some regulation by Schweitzer Reservoir about 16 miles upstream. An average of 2.2 cubic feet per second was diverted from headwaters of basin by the City of Ishpeming for municipal supply and effluent discharge to the Carp River Basin. An average of 34 cubic feet per second was diverted from Schweitzer reservoir by industry for iron ore processing, some returned to the Middle Branch Escanaba River via Green Creek and some returned to the East Branch Escanaba River via the Goose Lake Outlet. Diversion into Schweitzer Reservoir from Greenwood Reservoir via Greenwood Diversion.

44
Streams Tributary to Lake Michigan, Upper Peninsula (cont.)
USGS Gage 04059000, Escanaba River at Cornell, MI
Drainage Area (square miles): 870 Basin Number: 46 Characteristic R-B Index Value: 0.103 Rank: Lower Middle First Water Year: 1951 First Water Year Analyzed, if different: 1996 Last Water Year: 2009 Number of Water Years Analyzed: 14
Comments: • Diurnal fluctuation and occasional slight
regulation caused by Boney Falls power plant seven miles above station since 1950. Since August 1962 some regulation by Schweitzer reservoir at headwaters.
• Initially published decreasing trend for this gage. Additional data revises the analysis to no trend for this report update.
USGS Gage 04059400, Ten Mile Creek at Perronville, MI
Drainage Area (square miles): 39 Basin Number: 47 Characteristic R-B Index Value: 0.165 Rank: Lower Middle First Water Year: 1972 Last Water Year: 1977 Number of Water Years Analyzed: 6
USGS Gage 04059500, Ford River near Hyde, MI
Drainage Area (square miles): 450 Basin Number: 47 Characteristic R-B Index Value: 0.113 Rank: Upper Middle First Water Year: 1955 Last Water Year: 2009 Number of Water Years Analyzed: 55

45
Streams Tributary to Lake Michigan, Upper Peninsula (cont.)
USGS Gage 04060500, Iron River at Highway 424 at Caspian, MI
Drainage Area (square miles): 92.1 Basin Number: 50 Characteristic R-B Index Value: 0.069 Rank: Lowest Trend: decrease, p value: 0.00 First Water Year: 1949 Last Water Year: 2009 Number of Water Years Analyzed: 37
Comments: • Prior to August 1978 the average flow
includes mine pumpage and sewage effluent. Since August 1978 average flow includes about one foot per second sewage effluent.
• Initially published no trend for this gage. Additional data revises the analysis to decreasing trend for this report update.
USGS Gage 04060993, Brule River at US-2 near Florence, WI
Drainage Area (square miles): 366 Basin Number: 50 Characteristic R-B Index Value: 0.080 Rank: Lower Middle First Water Year: 1915 Last Water Year: 2009 Number of Water Years Analyzed: 66
Comments: Discharge includes some mine pumpage prior to August 1977, discontinued gage 04061000 considered equivalent.
USGS Gage 04061500, Paint River at Crystal Falls, MI
Drainage Area (square miles): 597 Basin Number: 50 Characteristic R-B Index Value: 0.109 Rank: Upper Middle First Water Year: 1945 Last Water Year: 1996 Number of Water Years Analyzed: 51
Comments: Diurnal fluctuations caused by power plant immediately upstream; since storage capacity is small, daily flows are not affected appreciably.

46
Streams Tributary to Lake Michigan, Upper Peninsula (cont.)
USGS Gage 04062000, Paint River near Alpha, MI
Drainage Area (square miles): 631 Basin Number: 50 Characteristic R-B Index Value: 0.051 Rank: Lowest Trend: decrease, p value: 0.00 First Water Year: 1953 First Water Year Analyzed, if different: 1981 Last Water Year: 2011 Number of Water Years Analyzed: 30
Comments: • Flow completely regulated by Lower Paint
Dam 0.6 miles upstream. • Initially published no trend for this gage.
Additional data revises the analysis to decreasing trend for this report update.
USGS Gage 04062011, Brule River near Commonwealth, WI
Drainage Area (square miles): 1020 Basin Number: 50 Characteristic R-B Index Value: 0.072 Rank: Lower Middle Trend: decrease, p value: 0.00 First Water Year: 1990 Last Water Year: 2011 Number of Water Years Analyzed: 22
Comments: Flow regulated by power plant 900 feet upstream and by Lower Paint Dam 8.2 miles upstream.
USGS Gage 04062100, Peshekee River near Michigamme, MI Drainage Area (square miles): 66.5
Basin Number: 50 Characteristic R-B Index Value: 0.197 Rank: Upper Middle First Water Year: 1962 Last Water Year: 1995 Number of Water Years Analyzed: 9

47
Streams Tributary to Lake Michigan, Upper Peninsula (cont.)
USGS Gage 04062200, Peshekee River near Champion, MI
Drainage Area (square miles): 133 Basin Number: 50 Characteristic R-B Index Value: 0.169 Rank: Upper Middle First Water Year: 1962 First Water Year Analyzed, if different: 2001 Last Water Year: 2009 Number of Water Years Analyzed: 9
USGS Gage 04062230, Michigamme River near Michigamme, MI
Drainage Area (square miles): 194 Basin Number: 50 Characteristic R-B Index Value: 0.061 Rank: Lowest First Water Year: 1969 Last Water Year: 1982 Number of Water Years Analyzed: 14
Comments: Gage may be affected by dam operations.
USGS Gage 04062270, Michigamme River near Champion, MI
Drainage Area (square miles): 231 Basin Number: 50 Characteristic R-B Index Value: 0.065 Rank: Lowest First Water Year: 1965 Last Water Year: 1969 Number of Water Years Analyzed: 5
USGS Gage 04062300, Michigamme River at Republic, MI
Drainage Area (square miles): 240 Basin Number: 50 Characteristic R-B Index Value: 0.083 Rank: Lower Middle First Water Year: 1962 First Water Year Analyzed, if different: 1964 Last Water Year: 1975 Number of Water Years Analyzed: 12
Comments: Prior to June 1, 1963 diurnal fluctuation caused by power plant 0.4 miles above station; power plant abandoned and only occasional regulation since. Since June 1, 1963 water diverted 0.5 miles above station for industrial use and returned to river by Gambles Creek five miles downstream.

48
Streams Tributary to Lake Michigan, Upper Peninsula (cont.)
USGS Gage 04062400, Michigamme River near Witch Lake, MI
Drainage Area (square miles): 316 Basin Number: 50 Characteristic R-B Index Value: 0.075 Rank: Lower Middle First Water Year: 1965 Last Water Year: 1980 Number of Water Years Analyzed: 16
Comments: Water discharge records good except those from the winter period, which are fair. Occasional regulation 14 miles upstream. Some flow diverted and returned to the above station by an iron ore processing plant.
USGS Gage 04062500, Michigamme River near Crystal Falls, MI
Drainage Area (square miles): 656 Basin Number: 50 Characteristic R-B Index Value: 0.048 Rank: Lowest Trend: decrease, p value: 0.00 First Water Year: 1945 First Water Year Analyzed, if different: 1972 Last Water Year: 2011 Number of Water Years Analyzed: 40
Comments: Regulated by power plant and Michigan reservoir five miles upstream.

49
Streams Tributary to Lake Michigan, Upper Peninsula (cont.)
USGS Gage 04063000, Menominee River near Florence, WI
Drainage Area (square miles): 1760 Basin Number: 50 Characteristic R-B Index Value: 0.086 Rank: Upper Middle Trend: decrease, p value: 0.00 First Water Year: 1915 First Water Year Analyzed, if different: 1952 Last Water Year: 2011 Number of Water Years Analyzed: 60
Comments: • Prior to July 1950 discharge determined
from power plant records, flow regulated by power plants, Michigamme Reservoir, Peavy Pond, and many smaller reservoirs upstream from station.
• Initially published no trend for this gage. Additional data revises the analysis to decreasing trend for this report update.
USGS Gage 04063500, Menominee River at Twin Falls near Iron Mountain, MI
Drainage Area (square miles): 1800 Basin Number: 50 Characteristic R-B Index Value: 0.076 Rank: Lower Middle Trend: decrease, p value: 0.00 First Water Year: 1915 First Water Year Analyzed, if different: 1963 Last Water Year: 2011 Number of Water Years Analyzed: 49
Comments: • Prior to 1957 discharge determined from
power plant records. Flow regulated by power plants, Michigamme Reservoir, Peavy Pond, and many smaller reservoirs upstream from station.
• Initially published no trend for this gage. Additional data revises the analysis to decreasing trend for this report update.

50
Streams Tributary to Lake Michigan, Upper Peninsula (cont.)
USGS Gage 04063700, Popple River near Fence, WI
Drainage Area (square miles): 139 Basin Number: 50 Characteristic R-B Index Value: 0.098 Rank: Lower Middle First Water Year: 1964 Last Water Year: 2011 Number of Water Years Analyzed: 47
Comments: Gage added for this report update.
USGS Gage 04064000, Pine River near Florence, WI
Drainage Area (square miles): 510 Basin Number: 50 Characteristic R-B Index Value: 0.067 Rank: Lowest First Water Year: 1914 Last Water Year: 1923 Number of Water Years Analyzed: 10
Comments: Gage added for this report update.
USGS Gage 04064500, Pine River below Pine River Powerplant near Florence, WI
Drainage Area (square miles): 533 Basin Number: 50 Characteristic R-B Index Value: 0.106 Rank: Upper Middle First Water Year: 1924 First Water Year Analyzed, if different: 1997 Last Water Year: 2011 Number of Water Years Analyzed: 14
Comments: Gage added for this report update.
USGS Gage 04065106, Menominee River at Niagara, WI
Drainage Area (square miles): 2470 Basin Number: 50 Characteristic R-B Index Value: 0.069 Rank: Lower Middle Trend: decrease, p value: 0.00 First Water Year: 1993 Last Water Year: 2011 Number of Water Years Analyzed: 19
Comments: Gage added for this report update.

51
Streams Tributary to Lake Michigan, Upper Peninsula (cont.)
USGS Gage 04065300, West Branch Sturgeon River near Randville, MI
Drainage Area (square miles): 56.1 Basin Number: 50 Characteristic R-B Index Value: 0.183 Rank: Upper Middle First Water Year: 1959 Last Water Year: 1981 Number of Water Years Analyzed: 23
Comments: Since December 1958 diversion above for industrial use; figures of runoff adjusted thereafter. Small diversions for sprinkler irrigation.
USGS Gage 04065393, East Branch Sturgeon River below Skunk Creek near Felch, MI
Drainage Area (square miles): 61.8 Basin Number: 50 Characteristic R-B Index Value: 0.137 Rank: Lower Middle First Water Year: 1974 Last Water Year: 1984 Number of Water Years Analyzed: 11
Comments: Since June 1975 occasional regulation during low flows by Gene Lake Reservoir three miles upstream.
USGS Gage 04065397, East Branch Sturgeon River at Hardwood, MI
Drainage Area (square miles): 90.8 Basin Number: 50 Characteristic R-B Index Value: 0.093 Rank: Lowest First Water Year: 1978 Last Water Year: 1983 Number of Water Years Analyzed: 6
Comments: Occasional regulation during low flows by Gene Lake Reservoir in headwater and hardwood reservoir 1.2 miles upstream.
USGS Gage 04065500, Sturgeon River near Foster City, MI
Drainage Area (square miles): 237 Basin Number: 50 Characteristic R-B Index Value: 0.109 Rank: Upper Middle First Water Year: 1955 Last Water Year: 1980 Number of Water Years Analyzed: 26
Comments: Since December 1958 diversion above station for industrial use; figures of runoff adjusted thereafter. Since June 1975 occasional regulation during low flows by reservoirs in headwaters from East Branch. Small diversions for sprinkler irrigation.

52
Streams Tributary to Lake Michigan, Upper Peninsula (cont.)
USGS Gage 04065600, Pine Creek near Iron Mountain, MI
Drainage Area (square miles): 17 Basin Number: 50 Characteristic R-B Index Value: 0.156 Rank: Lowest First Water Year: 1972 Last Water Year: 1961 Number of Water Years Analyzed: 10
Comments: Flow includes an average of 5.6 cubic feet per second diverted from West Branch Sturgeon River basin.
USGS Gage 04065722, Menominee River near Vulcan, MI
Drainage Area (square miles): 2900 Basin Number: 50 Characteristic R-B Index Value: 0.089 Rank: Upper Middle First Water Year: 1989 Last Water Year: 2011 Number of Water Years Analyzed: 23
Comments: Flow regulated by power plants, Michigamme Reservoir, Peavy Pond, and many smaller reservoirs upstream from station.
USGS Gage 04066003, Menominee River below Pemene Creek near Pembine, WI
Drainage Area (square miles): 3140 Basin Number: 50 Characteristic R-B Index Value: 0.080 Rank: Upper Middle Trend: decrease, p value: 0.00 First Water Year: 1950 Last Water Year: 2011 Number of Water Years Analyzed: 61
Comments: Flow regulated by power plants, Michigamme Reservoir, Peavy Pond, and many smaller reservoirs upstream from station. Discontinued Gage 04066000 considered equivalent.
USGS Gage 04066030, Menominee River at White Rapids Dam near Banat, MI
Drainage Area (square miles): 3190 Basin Number: 50 Characteristic R-B Index Value: 0.102 Rank: Highest First Water Year: 1999 Last Water Year: 2011 Number of Water Years Analyzed: 13
Comments: Gage added for this report update.

53
Streams Tributary to Lake Michigan, Upper Peninsula (cont.)
USGS Gage 04066500, Pike River at Amberg, WI
Drainage Area (square miles): 255 Basin Number: 50 Characteristic R-B Index Value: 0.090 Rank: Lower Middle First Water Year: 1915 Last Water Year: 2011 Number of Water Years Analyzed: 66
Comments: Gage added for this report update.
USGS Gage 04066800, Menominee River at Koss, MI
Drainage Area (square miles): 3700 Basin Number: 50 Characteristic R-B Index Value: 0.090 Rank: Upper Middle First Water Year: 1914 First Water Year Analyzed, if different: 1999 Last Water Year: 2011 Number of Water Years Analyzed: 12
Comments: • Flow regulated by power plants,
Michigamme Reservoir, Peavy Pond on Michigamme River, and by smaller reservoirs above station.
• Gage listed as 04066700 in previous report.

54
Streams Tributary to Lake Michigan, Upper Peninsula (cont.)
USGS Gage 04067500, Menominee River near McAllister, WI
Drainage Area (square miles): 3930 Basin Number: 50 Characteristic R-B Index Value: 0.081 Rank: Upper Middle Trend: decrease, p value: 0.01 First Water Year: 1946 First Water Year Analyzed, if different: 1980 Last Water Year: 2011 Number of Water Years Analyzed: 24
Comments: Gage added for this report update.
Streams Tributary to Lake Michigan, Southern Lower Peninsula
USGS Gage 04096015, Galien River near Sawyer, MI
Drainage Area (square miles): 80.7 Basin Number: 34 Characteristic R-B Index Value: 0.304 Rank: Highest First Water Year: 1996 Last Water Year: 2010 Number of Water Years Analyzed: 15
Comments: Initially published decreasing trend for this gage. Additional data revises the analysis to no trend for this report update.
USGS Gage 04096100, Galena River near Laporte, IN
Drainage Area (square miles): 17.2 Basin Number: 34 Characteristic R-B Index Value: 0.229 Rank: Lower Middle First Water Year: 1970 Last Water Year: 2003 Number of Water Years Analyzed: 34
Comments: Gage added for this report update.

55
Streams Tributary to Lake Michigan, Southern Lower Peninsula (cont.)
USGS Gage 04096272, Beebe Creek at Moore Road near Hillsdale, MI
Drainage Area (square miles): 42.4 Basin Number: 34 Characteristic R-B Index Value: 0.173 Rank: Lower Middle First Water Year: 1975 Last Water Year: 1980 Number of Water Years Analyzed: 6
Comments: Occasional regulation by Lake Belair about five miles above location.
USGS Gage 04096405, St. Joseph River at Burlington, MI
Drainage Area (square miles): 206 Basin Number: 34 Characteristic R-B Index Value: 0.063 Rank: Lowest First Water Year: 1963 Last Water Year: 2011 Number of Water Years Analyzed: 49
Comments: Discontinued gage 04096400 considered equivalent.
USGS Gage 04096500, Sauk River at Jay Street at Coldwater, MI
Drainage Area (square miles): 60 Basin Number: 34 Characteristic R-B Index Value: 0.100 Rank: Lowest First Water Year: 1938 Last Water Year: 1962 Number of Water Years Analyzed: 25
Comments: Drainage area indeterminate due to infrequent contribution to or from Coldwater Lake. Regulation caused by dam at outlet of Marble Lake.
USGS Gage 04096515, South Branch Hog Creek near Allen, MI
Drainage Area (square miles): 48.7 Basin Number: 34 Characteristic R-B Index Value: 0.141 Rank: Lower Middle Trend: increase, p value: 0.00 First Water Year: 1970 Last Water Year: 2010 Number of Water Years Analyzed: 42

56
Streams Tributary to Lake Michigan, Southern Lower Peninsula (cont.)
USGS Gage 04096600, Coldwater River near Hodunk, MI
Drainage Area (square miles): 293 Basin Number: 34 Characteristic R-B Index Value: 0.078 Rank: Lower Middle First Water Year: 1963 Last Water Year: 1989 Number of Water Years Analyzed: 27
Comments: Diurnal fluctuation caused by mills upstream above station.
USGS Gage 04096900, Nottawa Creek near Athens, MI
Drainage Area (square miles): 162 Basin Number: 34 Characteristic R-B Index Value: 0.084 Rank: Lower Middle Trend: increase, p value: 0.02 First Water Year: 1967 Last Water Year: 1997 Number of Water Years Analyzed: 31
USGS Gage 04097170, Portage River at W Avenue near Vicksburg, MI
Drainage Area (square miles): 68.2 Basin Number: 34 Characteristic R-B Index Value: 0.047 Rank: Lowest First Water Year: 1947 First Water Year Analyzed, if different: 1965 Last Water Year: 1979 Number of Water Years Analyzed: 15
USGS Gage 04097200, Gourdneck Creek near Schoolcraft, MI
Drainage Area (square miles): 7.29 Basin Number: 34 Characteristic R-B Index Value: 0.094 Rank: Lowest First Water Year: 1965 Last Water Year: 1972 Number of Water Years Analyzed: 8
Comments: Gourdneck canal diverts water from stream 100 feet above station to sustain lake levels.

57
Streams Tributary to Lake Michigan, Southern Lower Peninsula (cont.)
USGS Gage 04097500, St. Joseph River at Three Rivers, MI
Drainage Area (square miles): 1350 Basin Number: 34 Characteristic R-B Index Value: 0.062 Rank: Lower Middle Trend: decrease, p value: 0.01 First Water Year: 1954 Last Water Year: 2011 Number of Water Years Analyzed: 49
Comments: Flow regulated by power plant upstream from station.
USGS Gage 04097540, Prairie River near Nottawa, MI
Drainage Area (square miles): 106 Basin Number: 34 Characteristic R-B Index Value: 0.056 Rank: Lowest First Water Year: 1963 Last Water Year: 2010 Number of Water Years Analyzed: 48
Comments: Since 1987 some diversion by pumping for sprinkler irrigation.
USGS Gage 04097970, Lime Lake Outlet at Panama, IN
Drainage Area (square miles): 17.5 Basin Number: 34 Characteristic R-B Index Value: 0.062 Rank: Lowest First Water Year: 1970 Last Water Year: 1986 Number of Water Years Analyzed: 17
Comments: Gage added for this report update.
USGS Gage 04098500, Fawn River near White Pigeon, MI
Drainage Area (square miles): 192 Basin Number: 34 Characteristic R-B Index Value: 0.051 Rank: Lowest First Water Year: 1958 Last Water Year: 1975 Number of Water Years Analyzed: 18
Comments: Small diurnal fluctuation caused by power plants above station.

58
Streams Tributary to Lake Michigan, Southern Lower Peninsula (cont.)
USGS Gage 04099000, St. Joseph River at Mottville, MI
Drainage Area (square miles): 1866 Basin Number: 34 Characteristic R-B Index Value: 0.050 Rank: Lowest Trend: decrease, p value: 0.00 First Water Year: 1925 Last Water Year: 2011 Number of Water Years Analyzed: 87
Comments: Flow regulated by power plants upstream from station.
USGS Gage 04099510, Pigeon Creek near Angola, IN
Drainage Area (square miles): 106 Basin Number: 34 Characteristic R-B Index Value: 0.079 Rank: Lower Middle Trend: decrease, p value: 0.04 First Water Year: 1946 First Water Year Analyzed, if different: 1996 Last Water Year: 2011 Number of Water Years Analyzed: 16
Comments: Gage added for this report update.
USGS Gage 04099610, Pretty Lake Inlet near Stroh, IN
Drainage Area (square miles): 1.96 Basin Number: 34 Characteristic R-B Index Value: 0.281 Rank: Lower Middle First Water Year: 1964 Last Water Year: 1981 Number of Water Years Analyzed: 18
Comments: Gage added for this report update.

59
Streams Tributary to Lake Michigan, Southern Lower Peninsula (cont.)
USGS Gage 04099750, Pigeon River near Scott, IN
Drainage Area (square miles): 307 Basin Number: 34 Characteristic R-B Index Value: 0.068 Rank: Lower Middle Trend: increase, p value: 0.00 First Water Year: 1969 Last Water Year: 2011 Number of Water Years Analyzed: 43
Comments: Gage added for this report update.
USGS Gage 04099808, Little Elkhart River at Middlebury, IN
Drainage Area (square miles): 91.7 Basin Number: 34 Characteristic R-B Index Value: 0.154 Rank: Lower Middle First Water Year: 1980 Last Water Year: 2003 Number of Water Years Analyzed: 24
Comments: Gage added for this report update.
USGS Gage 04099850, Pine Creek near Elkhart, IN
Drainage Area (square miles): 31 Basin Number: 34 Characteristic R-B Index Value: 0.200 Rank: Upper Middle First Water Year: 1980 Last Water Year: 2003 Number of Water Years Analyzed: 24
Comments: Gage added for this report update.
USGS Gage 04100222, North Branch Elkhart River at Cosperville, IN
Drainage Area (square miles): 142 Basin Number: 34 Characteristic R-B Index Value: 0.053 Rank: Lowest Trend: decrease, p value: 0.05 First Water Year: 1972 Last Water Year: 2011 Number of Water Years Analyzed: 40
Comments: Gage added for this report update.

60
Streams Tributary to Lake Michigan, Southern Lower Peninsula (cont.)
USGS Gage 04100252, Forker Creek near Burr Oak, IN
Drainage Area (square miles): 19.2 Basin Number: 34 Characteristic R-B Index Value: 0.198 Rank: Lower Middle Trend: increase, p value: 0.04 First Water Year: 1970 Last Water Year: 2003 Number of Water Years Analyzed: 34
Comments: Gage added for this report update.
USGS Gage 04100295, Rimmell Branch near Albion, IN
Drainage Area (square miles): 10.7 Basin Number: 34 Characteristic R-B Index Value: 0.446 Rank: Upper Middle First Water Year: 1981 Last Water Year: 2001 Number of Water Years Analyzed: 21
Comments: Gage added for this report update.
USGS Gage 04100377, Solomon Creek near Syracuse, IN
Drainage Area (square miles): 36.1 Basin Number: 34 Characteristic R-B Index Value: 0.108 Rank: Lower Middle Trend: increase, p value: 0.02 First Water Year: 1988 Last Water Year: 2003 Number of Water Years Analyzed: 16
Comments: Gage added for this report update.
USGS Gage 04100465, Turkey Creek at Syracuse, IN
Drainage Area (square miles): 43.8 Basin Number: 34 Characteristic R-B Index Value: 0.065 Rank: Lowest First Water Year: 1970 Last Water Year: 1987 Number of Water Years Analyzed: 18
Comments: Gage added for this report update.

61
Streams Tributary to Lake Michigan, Southern Lower Peninsula (cont.)
USGS Gage 04100500, Elkhart River at Goshen, IN
Drainage Area (square miles): 594 Basin Number: 34 Characteristic R-B Index Value: 0.102 Rank: Lower Middle First Water Year: 1932 First Water Year Analyzed, if different: 1955 Last Water Year: 2011 Number of Water Years Analyzed: 57
Comments: Gage added for this report update.
USGS Gage 04101000, St. Joseph River at Elkhart, IN
Drainage Area (square miles): 3370 Basin Number: 34 Characteristic R-B Index Value: 0.051 Rank: Lowest Trend: decrease, p value: 0.00 First Water Year: 1948 Last Water Year: 2011 Number of Water Years Analyzed: 64
Comments: Gage added for this report update.
USGS Gage 04101370, Juday Creek near South Bend, IN
Drainage Area (square miles): 38 Basin Number: 34 Characteristic R-B Index Value: 0.093 Rank: Lowest First Water Year: 1993 Last Water Year: 2010 Number of Water Years Analyzed: 18
Comments: Gage added for this report update.
USGS Gage 04101500, St. Joseph River at Niles, MI
Drainage Area (square miles): 3666 Basin Number: 34 Characteristic R-B Index Value: 0.059 Rank: Lowest Trend: decrease, p value: 0.00 First Water Year: 1931 Last Water Year: 2011 Number of Water Years Analyzed: 80
Comments: Flow regulated by power plants upstream from station.

62
Streams Tributary to Lake Michigan, Southern Lower Peninsula (cont.)
USGS Gage 04101800, Dowagiac River at Sumnerville, MI
Drainage Area (square miles): 255 Basin Number: 34 Characteristic R-B Index Value: 0.092 Rank: Lower Middle Trend: increase, p value: 0.00 First Water Year: 1961 First Water Year Analyzed, if different: 1973 Last Water Year: 2011 Number of Water Years Analyzed: 39
Comments: Flow regulated by millpond and lake-level control dam upstream from station.
USGS Gage 04102000, St. Joseph River at Berrien Springs, MI
Drainage Area (square miles): 4081 Basin Number: 34 Characteristic R-B Index Value: 0.085 Rank: Upper Middle First Water Year: 1902 Last Water Year: 1956 Number of Water Years Analyzed: 10
USGS Gage 04102500, Paw Paw River at Riverside, MI
Drainage Area (square miles): 390 Basin Number: 34 Characteristic R-B Index Value: 0.070 Rank: Lower Middle Trend: increase, p value: 0.00 First Water Year: 1952 First Water Year Analyzed, if different: 1971 Last Water Year: 2011 Number of Water Years Analyzed: 41
Comments: Diurnal fluctuation, principally during low flow, caused by paper mill upstream from station.
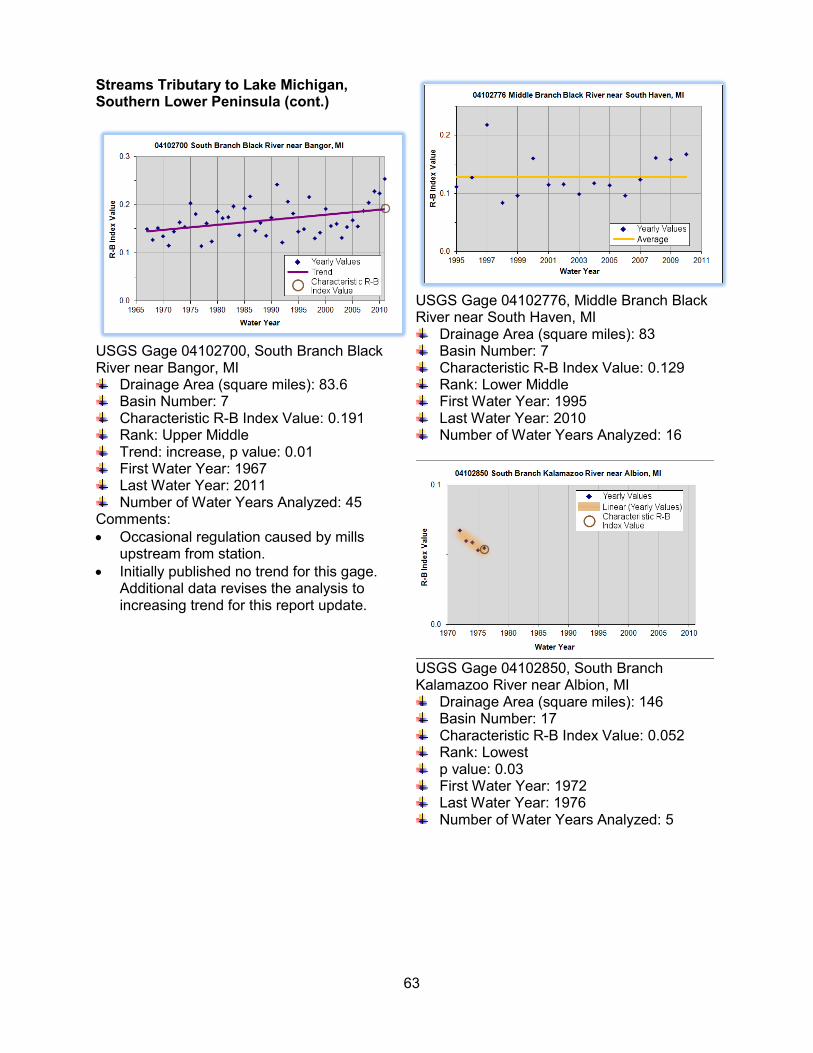
63
Streams Tributary to Lake Michigan, Southern Lower Peninsula (cont.)
USGS Gage 04102700, South Branch Black River near Bangor, MI
Drainage Area (square miles): 83.6 Basin Number: 7 Characteristic R-B Index Value: 0.191 Rank: Upper Middle Trend: increase, p value: 0.01 First Water Year: 1967 Last Water Year: 2011 Number of Water Years Analyzed: 45
Comments: • Occasional regulation caused by mills
upstream from station. • Initially published no trend for this gage.
Additional data revises the analysis to increasing trend for this report update.
USGS Gage 04102776, Middle Branch Black River near South Haven, MI
Drainage Area (square miles): 83 Basin Number: 7 Characteristic R-B Index Value: 0.129 Rank: Lower Middle First Water Year: 1995 Last Water Year: 2010 Number of Water Years Analyzed: 16
USGS Gage 04102850, South Branch Kalamazoo River near Albion, MI
Drainage Area (square miles): 146 Basin Number: 17 Characteristic R-B Index Value: 0.052 Rank: Lowest p value: 0.03 First Water Year: 1972 Last Water Year: 1976 Number of Water Years Analyzed: 5

64
Streams Tributary to Lake Michigan, Southern Lower Peninsula (cont.)
USGS Gage 04103010, Kalamazoo River near Marengo, MI
Drainage Area (square miles): 267 Basin Number: 17 Characteristic R-B Index Value: 0.063 Rank: Lowest First Water Year: 1987 Last Water Year: 2011 Number of Water Years Analyzed: 25
Comments: Some diversion by pumping for irrigation.
USGS Gage 04103500, Kalamazoo River at Marshall, MI Drainage Area (square miles): 449
Basin Number: 17 Characteristic R-B Index Value: 0.074 Rank: Lower Middle First Water Year: 1949 First Water Year Analyzed, if different: 2002 Last Water Year: 2011 Number of Water Years Analyzed: 10
Comments: Flow regulated by power plant upstream from station.
USGS Gage 04104945, Wanadoga Creek near Battle Creek, MI
Drainage Area (square miles): 48.3 Basin Number: 17 Characteristic R-B Index Value: 0.198 Rank: Upper Middle Trend: increase, p value: 0.01 First Water Year: 1995 Last Water Year: 2011 Number of Water Years Analyzed: 17
Comments: Initially published no trend for this gage. Additional data revises the analysis to increasing trend for this report update.
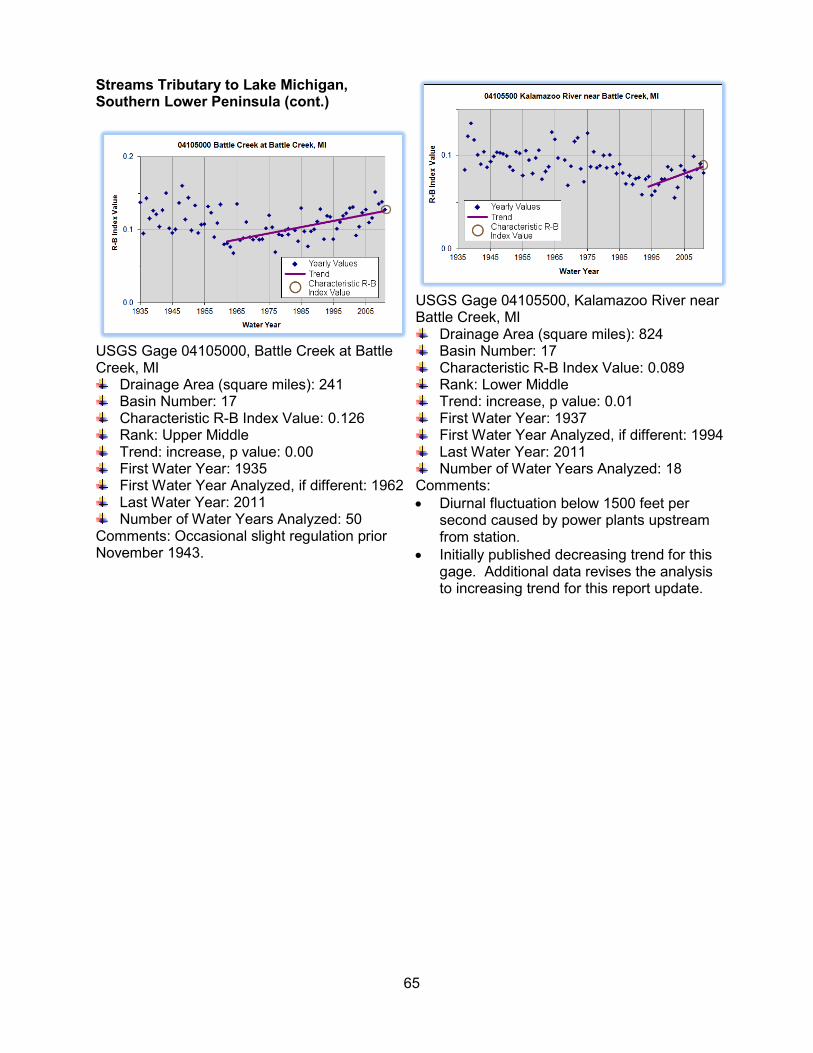
65
Streams Tributary to Lake Michigan, Southern Lower Peninsula (cont.)
USGS Gage 04105000, Battle Creek at Battle Creek, MI
Drainage Area (square miles): 241 Basin Number: 17 Characteristic R-B Index Value: 0.126 Rank: Upper Middle Trend: increase, p value: 0.00 First Water Year: 1935 First Water Year Analyzed, if different: 1962 Last Water Year: 2011 Number of Water Years Analyzed: 50
Comments: Occasional slight regulation prior November 1943.
USGS Gage 04105500, Kalamazoo River near Battle Creek, MI
Drainage Area (square miles): 824 Basin Number: 17 Characteristic R-B Index Value: 0.089 Rank: Lower Middle Trend: increase, p value: 0.01 First Water Year: 1937 First Water Year Analyzed, if different: 1994 Last Water Year: 2011 Number of Water Years Analyzed: 18
Comments: • Diurnal fluctuation below 1500 feet per
second caused by power plants upstream from station.
• Initially published decreasing trend for this gage. Additional data revises the analysis to increasing trend for this report update.

66
Streams Tributary to Lake Michigan, Southern Lower Peninsula (cont.)
USGS Gage 04105700, Augusta Creek near Augusta, MI
Drainage Area (square miles): 38.9 Basin Number: 17 Characteristic R-B Index Value: 0.105 Rank: Lower Middle Trend: increase, p value: 0.00 First Water Year: 1965 First Water Year Analyzed, if different: 1972 Last Water Year: 2011 Number of Water Years Analyzed: 40
USGS Gage 04105800, Gull Creek at 37th Street near Galesburg, MI
Drainage Area (square miles): 38.1 Basin Number: 17 Characteristic R-B Index Value: 0.060 Rank: Lowest First Water Year: 1965 Last Water Year: 1972 Number of Water Years Analyzed: 8
Comments: Occasional regulation by many dams upstream.
USGS Gage 04106000, Kalamazoo River at Comstock, MI
Drainage Area (square miles): 1010 Basin Number: 17 Characteristic R-B Index Value: 0.077 Rank: Lower Middle Trend: decrease, p value: 0.02 First Water Year: 1933 Last Water Year: 2011 Number of Water Years Analyzed: 74
Comments: • Flow regulation by power plant 1.2 miles
upstream from station. • Initially published no trend for this gage.
Additional data revises the analysis to decreasing trend for this report update.
USGS Gage 04106180, Portage Creek at Portage, MI
Drainage Area (square miles): 16.5 Basin Number: 17 Characteristic R-B Index Value: 0.091 Rank: Lowest Trend: increase, p value: 0.01 First Water Year: 1983 Last Water Year: 2006 Number of Water Years Analyzed: 24

67
Streams Tributary to Lake Michigan, Southern Lower Peninsula (cont.)
USGS Gage 04106300, Portage Creek near Kalamazoo, MI
Drainage Area (square miles): 22.4 Basin Number: 17 Characteristic R-B Index Value: 0.109 Rank: Lowest First Water Year: 1965 First Water Year Analyzed, if different: 1988 Last Water Year: 2008 Number of Water Years Analyzed: 21
Comments: Flow includes water which is pumped from ground water sources by industry and discharge into stream two miles upstream from station.
USGS Gage 04106320, West Fork Portage Creek near Oshtemo, MI
Drainage Area (square miles): 13 Basin Number: 17 Characteristic R-B Index Value: 0.098 Rank: Lowest Trend: increase, p value: 0.00 First Water Year: 1973 Last Water Year: 1996 Number of Water Years Analyzed: 24
Comments: At times flow is affected by ground water withdrawals.

68
Streams Tributary to Lake Michigan, Southern Lower Peninsula (cont.)
USGS Gage 04106400, West Fork Portage Creek at Kalamazoo, MI
Drainage Area (square miles): 18.7 Basin Number: 17 Characteristic R-B Index Value: 0.088 Rank: Lowest First Water Year: 1960 First Water Year Analyzed, if different: 1995 Last Water Year: 2011 Number of Water Years Analyzed: 17
Comments: • At times water is affected by water
withdrawals. • Initially published increasing trend for this
gage. Additional data revises the analysis to no trend for this report update.
USGS Gage 04106500, Portage Creek at Kalamazoo, MI
Drainage Area (square miles): 46.8 Basin Number: 17 Characteristic R-B Index Value: 0.121 Rank: Lower Middle Trend: increase, p value: 0.01 First Water Year: 1948 Last Water Year: 1986 Number of Water Years Analyzed: 22
Comments: Some regulation by mill ponds upstream from station. Flow includes water which is pumped from groundwater sources by industry and discharged into stream five miles upstream from station.

69
Streams Tributary to Lake Michigan, Southern Lower Peninsula (cont.)
USGS Gage 04108500, Kalamazoo River near Fennville, MI
Drainage Area (square miles): 1600 Basin Number: 17 Characteristic R-B Index Value: 0.108 Rank: Highest First Water Year: 1930 Last Water Year: 1993 Number of Water Years Analyzed: 63
Comments: Flow regulated at low and medium flow stages by power plant upstream from station and since June 1936 by Calkins Dam and power plant four miles upstream.
USGS Gage 04108600, Rabbit River near Hopkins, MI
Drainage Area (square miles): 71.4 Basin Number: 17 Characteristic R-B Index Value: 0.269 Rank: Upper Middle Trend: increase, p value: 0.00 First Water Year: 1966 Last Water Year: 2011 Number of Water Years Analyzed: 46
USGS Gage 04108670, Kalamazoo River near New Richmond, MI
Drainage Area (square miles): 1994 Basin Number: 17 Characteristic R-B Index Value: 0.071 Rank: Lower Middle First Water Year: 1995 Last Water Year: 2010 Number of Water Years Analyzed: 9
Comments: Gage added for this report update.
USGS Gage 04108800, Macatawa River near Zeeland, MI
Drainage Area (square miles): 65.8 Basin Number: 8 Characteristic R-B Index Value: 0.571 Rank: Highest First Water Year: 1961 Last Water Year: 2011 Number of Water Years Analyzed: 51
Comments: Prior to October 1978 published as Black River near Zeeland. Discontinued gage 04108801 considered equivalent.

70
Streams Tributary to Lake Michigan, Southern Lower Peninsula (cont.)
USGS Gage 04109000, Grand River at Jackson, MI
Drainage Area (square miles): 174 Basin Number: 14 Characteristic R-B Index Value: 0.095 Rank: Lower Middle First Water Year: 1936 Last Water Year: 2011 Number of Water Years Analyzed: 21
Comments: • Slight regulation by mill upstream, flow
includes 20 cubic feet per second as sewage effluent which originates from ground water sources from the City of Jackson.
• Initially published decreasing trend for this gage. Additional data revises the analysis to no trend for this report update.
USGS Gage 04109500, Portage River at Portage Lake Road near Munith, MI
Drainage Area (square miles): 55 Basin Number: 14 Characteristic R-B Index Value: 0.101 Rank: Lowest p value: 0.04 First Water Year: 1945 Last Water Year: 1956 Number of Water Years Analyzed: 12
USGS Gage 04110000, Orchard Creek at State Highway 106 at Munith, MI
Drainage Area (square miles): 49 Basin Number: 14 Characteristic R-B Index Value: 0.226 Rank: Upper Middle First Water Year: 1945 Last Water Year: 1956 Number of Water Years Analyzed: 12

71
Streams Tributary to Lake Michigan, Southern Lower Peninsula (cont.)
USGS Gage 04111000, Grand River at Eaton Rapids, MI
Drainage Area (square miles): 661 Basin Number: 14 Characteristic R-B Index Value: 0.087 Rank: Lower Middle First Water Year: 1951 First Water Year Analyzed, if different: 1996 Last Water Year: 2011 Number of Water Years Analyzed: 16
Comments: • Flow regulated by Smithville Dam and mills
at Eaton Rapids. • Initially published decreasing trend for this
gage. Additional data revises the analysis to no trend for this report update.
USGS Gage 04111379, Red Cedar River near Williamston, MI
Drainage Area (square miles): 163 Basin Number: 14 Characteristic R-B Index Value: 0.174 Rank: Highest Trend: increase, p value: 0.04 First Water Year: 1976 Last Water Year: 2011 Number of Water Years Analyzed: 9
Comments: • Flow is regulated at times by pumpage for
irrigation. • Initially published no trend for this gage.
Additional data revises the analysis to increasing trend for this report update.
USGS Gage 04111500, Deer Creek near Dansville, MI
Drainage Area (square miles): 16.3 Basin Number: 14 Characteristic R-B Index Value: 0.370 Rank: Upper Middle First Water Year: 1954 Last Water Year: 2011 Number of Water Years Analyzed: 58

72
Streams Tributary to Lake Michigan, Southern Lower Peninsula (cont.)
USGS Gage 04112000, Sloan Creek near Williamston, MI
Drainage Area (square miles): 9.34 Basin Number: 14 Characteristic R-B Index Value: 0.460 Rank: Upper Middle First Water Year: 1955 Last Water Year: 2011 Number of Water Years Analyzed: 56
Comments: At times flow is regulated by pumpage from irrigation.
USGS Gage 04112500, Red Cedar River at East Lansing, MI
Drainage Area (square miles): 355 Basin Number: 14 Characteristic R-B Index Value: 0.175 Rank: Highest Trend: increase, p value: 0.02 First Water Year: 1932 First Water Year Analyzed, if different: 1988 Last Water Year: 2011 Number of Water Years Analyzed: 24
Comments: Prior to 1975 occasional regulation at low flow by mill at Williamston, 16 miles upstream.
USGS Gage 04112850, Sycamore Creek at Holt Road near Holt, MI
Drainage Area (square miles): 80.6 Basin Number: 14 Characteristic R-B Index Value: 0.229 Rank: Upper Middle First Water Year: 1976 Last Water Year: 1997 Number of Water Years Analyzed: 9

73
Streams Tributary to Lake Michigan, Southern Lower Peninsula (cont.)
USGS Gage 04113000, Grand River at Lansing, MI
Drainage Area (square miles): 1230 Basin Number: 14 Characteristic R-B Index Value: 0.127 Rank: Highest First Water Year: 1901 First Water Year Analyzed, if different: 1965 Last Water Year: 2011 Number of Water Years Analyzed: 47
Comments: Large diurnal fluctuation at low flow and medium flow caused by power plants upstream from station.
USGS Gage 04113097, Carrier Creek near Lansing, MI
Drainage Area (square miles): 12.1 Basin Number: 14 Characteristic R-B Index Value: 0.451 Rank: Upper Middle First Water Year: 1976 Last Water Year: 1980 Number of Water Years Analyzed: 5
USGS Gage 04114000, Grand River at Portland, MI
Drainage Area (square miles): 1385 Basin Number: 14 Characteristic R-B Index Value: 0.122 Rank: Highest First Water Year: 1953 Last Water Year: 2011 Number of Water Years Analyzed: 52
Comments: Slight diurnal fluctuation caused by power plants upstream from station.
USGS Gage 04114498, Looking Glass River near Eagle, MI
Drainage Area (square miles): 280 Basin Number: 14 Characteristic R-B Index Value: 0.100 Rank: Lower Middle First Water Year: 1945 Last Water Year: 2011 Number of Water Years Analyzed: 62
Comments: Small intermittent diversions at times into Lake Geneva when discharge is above fifty cubic feet per second.

74
Streams Tributary to Lake Michigan, Southern Lower Peninsula (cont.)
USGS Gage 04115000, Maple River at Maple Rapids, MI
Drainage Area (square miles): 434 Basin Number: 14 Characteristic R-B Index Value: 0.114 Rank: Upper Middle First Water Year: 1945 Last Water Year: 2011 Number of Water Years Analyzed: 68
Comments: At times water is pumped from the river about eight miles upstream to fill the wetlands in the Maple River State Game Area. Some of the water is returned to the river at a later date, when the water levels are lowered.
USGS Gage 04115265, Fish Creek near Crystal, MI
Drainage Area (square miles): 39.7 Basin Number: 14 Characteristic R-B Index Value: 0.180 Rank: Upper Middle First Water Year: 1988 Last Water Year: 2011 Number of Water Years Analyzed: 24
Comments: At times low flow is affected by pumpage for irrigation.

75
Streams Tributary to Lake Michigan, Southern Lower Peninsula (cont.)
USGS Gage 04116000, Grand River at Ionia, MI
Drainage Area (square miles): 2840 Basin Number: 14 Characteristic R-B Index Value: 0.098 Rank: Upper Middle Trend: decrease, p value: 0.00 First Water Year: 1952 Last Water Year: 2011 Number of Water Years Analyzed: 60
Comments: • Diurnal fluctuation below approximately
5,000 cubic feet per second caused by power plants upstream from station.
• Initially published no trend for this gage. Additional data revises the analysis to decreasing trend for this report update.
USGS Gage 04116500, Flat River at Smyrna, MI
Drainage Area (square miles): 528 Basin Number: 14 Characteristic R-B Index Value: 0.066 Rank: Lowest Trend: decrease, p value: 0.00 First Water Year: 1951 Last Water Year: 1986 Number of Water Years Analyzed: 36
Comments: Diurnal fluctuation caused by power plants above station prior to September 1956; occasional diurnal fluctuation since.
USGS Gage 04117000, Quaker Brook near Nashville, MI
Drainage Area (square miles): 7.6 Basin Number: 14 Characteristic R-B Index Value: 0.301 Rank: Upper Middle First Water Year: 1955 Last Water Year: 2011 Number of Water Years Analyzed: 38

76
Streams Tributary to Lake Michigan, Southern Lower Peninsula (cont.)
USGS Gage 04117500, Thornapple River near Hastings, MI
Drainage Area (square miles): 385 Basin Number: 14 Characteristic R-B Index Value: 0.112 Rank: Upper Middle First Water Year: 1945 First Water Year Analyzed, if different: 1978 Last Water Year: 2011 Number of Water Years Analyzed: 34
USGS Gage 04118000, Thornapple River near Caledonia, MI
Drainage Area (square miles): 773 Basin Number: 14 Characteristic R-B Index Value: 0.110 Rank: Upper Middle Trend: increase, p value: 0.00 First Water Year: 1952 First Water Year Analyzed, if different: 1971 Last Water Year: 1994 Number of Water Years Analyzed: 22
Comments: Prior to December 1958 and since October 1983 large diurnal fluctuation at low and medium flow and occasional regulation during high flow, caused by power plant upstream from station; occasional fluctuation during the interim period.

77
Streams Tributary to Lake Michigan, Southern Lower Peninsula (cont.)
USGS Gage 04118500, Rogue River near Rockford, MI
Drainage Area (square miles): 234 Basin Number: 14 Characteristic R-B Index Value: 0.104 Rank: Lower Middle First Water Year: 1953 Last Water Year: 2011 Number of Water Years Analyzed: 54
Comments: Some regulation caused by dam two miles upstream from station.
USGS Gage 04119000, Grand River at Grand Rapids, MI
Drainage Area (square miles): 4900 Basin Number: 14 Characteristic R-B Index Value: 0.074 Rank: Lower Middle First Water Year: 1902 First Water Year Analyzed, if different: 1989 Last Water Year: 2011 Number of Water Years Analyzed: 23
Comments: Moderate diurnal fluctuation at low and medium flow caused by power plants upstream from station.

78
Streams Tributary to Lake Michigan, Northern Lower Peninsula
USGS Gage 04121000, Muskegon River near Merritt, MI
Drainage Area (square miles): 355 Basin Number: 22 Characteristic R-B Index Value: 0.040 Rank: Lowest p value: 0.00 First Water Year: 1947 Last Water Year: 1973 Number of Water Years Analyzed: 27
Comments: Occasional regulation by manipulation of stop logs at Reedsburg Dam.
USGS Gage 04121300, Clam River at Vogel Center, MI
Drainage Area (square miles): 243 Basin Number: 22 Characteristic R-B Index Value: 0.079 Rank: Lower Middle First Water Year: 1967 Last Water Year: 2011 Number of Water Years Analyzed: 45
Comments: Some regulation at low flow by dams upstream from station.
USGS Gage 04121500, Muskegon River at Evart, MI
Drainage Area (square miles): 1433 Basin Number: 22 Characteristic R-B Index Value: 0.057 Rank: Lowest First Water Year: 1935 First Water Year Analyzed, if different: 1960 Last Water Year: 2011 Number of Water Years Analyzed: 52
Comments: Some regulation at low flow by dams upstream from station.

79
Streams Tributary to Lake Michigan, Northern Lower Peninsula (cont.)
USGS Gage 04121900, Little Muskegon River near Morley, MI
Drainage Area (square miles): 121 Basin Number: 22 Characteristic R-B Index Value: 0.109 Rank: Upper Middle First Water Year: 1967 First Water Year Analyzed, if different: 1979 Last Water Year: 1996 Number of Water Years Analyzed: 18
Comments: • Some regulation by dam above station. • Initially published increasing trend for this
gage. Tighter p value standard changes this to no trend for this report update.
USGS Gage 04121944, Little Muskegon River near Oak Grove, MI
Drainage Area (square miles): 345 Basin Number: 22 Characteristic R-B Index Value: 0.108 Rank: Upper Middle Trend: increase, p value: 0.05 First Water Year: 1996 Last Water Year: 2011 Number of Water Years Analyzed: 16
Comments: Initially published no trend for this gage. Additional data revises the analysis to an increasing trend for this report update.

80
Streams Tributary to Lake Michigan, Northern Lower Peninsula (cont.)
USGS Gage 04121970, Muskegon River near Croton, MI
Drainage Area (square miles): 2313 Basin Number: 22 Characteristic R-B Index Value: 0.077 Rank: Lower Middle Trend: increase, p value: 0.01 First Water Year: 1996 Last Water Year: 2011 Number of Water Years Analyzed: 16
Comments: • Flow completely regulated by Croton Dam
1,000 feet upstream. • Initially published no trend for this gage.
Additional data revises the analysis to an increasing trend for this report update.
USGS Gage 04122000, Muskegon River at Newaygo, MI
Drainage Area (square miles): 2350 Basin Number: 22 Characteristic R-B Index Value: 0.098 Rank: Upper Middle Trend: decrease, p value: 0.01 First Water Year: 1910 Last Water Year: 1993 Number of Water Years Analyzed: 71
Comments: Flow regulated by power plants upstream from station, the largest of which are Croton Dam, Hardy Dam, and Rogers Dam. Since December 27, 1965 power plant at Newaygo is non-operative. In January 1969, dam at Newaygo was removed.

81
Streams Tributary to Lake Michigan, Northern Lower Peninsula (cont.)
USGS Gage 04122100, Bear Creek near Muskegon, MI
Drainage Area (square miles): 16.7 Basin Number: 22 Characteristic R-B Index Value: 0.172 Rank: Lower Middle Trend: decrease, p value: 0.00 First Water Year: 1966 Last Water Year: 2011 Number of Water Years Analyzed: 46
Comments: Some regulation during low flow by dams and irrigation upstream from station.
USGS Gage 04122200, White River near Whitehall, MI
Drainage Area (square miles): 406 Basin Number: 37 Characteristic R-B Index Value: 0.066 Rank: Lowest First Water Year: 1958 Last Water Year: 2011 Number of Water Years Analyzed: 54
USGS Gage 04122500, Pere Marquette River at Scottville, MI
Drainage Area (square miles): 681 Basin Number: 25 Characteristic R-B Index Value: 0.055 Rank: Lowest Trend: increase, p value: 0.00 First Water Year: 1940 Last Water Year: 2011 Number of Water Years Analyzed: 74
USGS Gage 04123000, Big Sable River near Freesoil, MI
Drainage Area (square miles): 127 Basin Number: 5 Characteristic R-B Index Value: 0.037 Rank: Lowest First Water Year: 1943 Last Water Year: 1972 Number of Water Years Analyzed: 30

82
Streams Tributary to Lake Michigan, Northern Lower Peninsula (cont.)
USGS Gage 04123500, Manistee River near Grayling, MI
Drainage Area (square miles): 123 Basin Number: 20 Characteristic R-B Index Value: 0.026 Rank: Lowest First Water Year: 1943 Last Water Year: 1973 Number of Water Years Analyzed: 31
USGS Gage 04124000, Manistee River near Sherman, MI
Drainage Area (square miles): 857 Basin Number: 20 Characteristic R-B Index Value: 0.041 Rank: Lowest Trend: increase, p value: 0.00 First Water Year: 1903 Last Water Year: 2011 Number of Water Years Analyzed: 90
Comments: Initially published no trend for this gage. Additional data revises the analysis to an increasing trend for this report update.
USGS Gage 04124200, Manistee River near Mesick, MI
Drainage Area (square miles): 1018 Basin Number: 20 Characteristic R-B Index Value: 0.047 Rank: Lowest First Water Year: 1998 Last Water Year: 2011 Number of Water Years Analyzed: 14
Comments: Flow completely regulated by Hodenpyl Dam 200 feet upstream.
USGS Gage 04124500, East Branch Pine River near Tustin, MI
Drainage Area (square miles): 60 Basin Number: 20 Characteristic R-B Index Value: 0.195 Rank: Upper Middle First Water Year: 1953 Last Water Year: 2011 Number of Water Years Analyzed: 31

83
Streams Tributary to Lake Michigan, Northern Lower Peninsula (cont.)
USGS Gage 04125000, Pine River near Leroy, MI
Drainage Area (square miles): 128 Basin Number: 20 Characteristic R-B Index Value: 0.114 Rank: Upper Middle p value: 0.05 First Water Year: 1953 Last Water Year: 1963 Number of Water Years Analyzed: 11
USGS Gage 04125460, Pine River at High School Bridge, near Hoxeyville, MI
Drainage Area (square miles): 245 Basin Number: 20 Characteristic R-B Index Value: 0.066 Rank: Lowest First Water Year: 1953 Last Water Year: 2011 Number of Water Years Analyzed: 45
Comments: Discontinued gage 04125500 considered equivalent.
USGS Gage 04125550, Manistee River near Wellston, MI
Drainage Area (square miles): 1451 Basin Number: 20 Characteristic R-B Index Value: 0.050 Rank: Lowest First Water Year: 1997 Last Water Year: 2011 Number of Water Years Analyzed: 15
Comments: Flow completely regulated by Tippy Dam 700 feet upstream.
USGS Gage 04126000, Manistee River near Manistee, MI
Drainage Area (square miles): 1677 Basin Number: 20 Characteristic R-B Index Value: 0.066 Rank: Lower Middle Trend: decrease, p value: 0.00 First Water Year: 1952 First Water Year Analyzed, if different: 1983 Last Water Year: 1993 Number of Water Years Analyzed: 11
Comments: Flow regulated at all stages by Tippy Hydroelectric Power Plant 21 miles upstream.

84
Streams Tributary to Lake Michigan, Northern Lower Peninsula (cont.)
USGS Gage 04126200, Little Manistee River near Freesoil, MI
Drainage Area (square miles): 178 Basin Number: 20 Characteristic R-B Index Value: 0.037 Rank: Lowest First Water Year: 1957 Last Water Year: 1975 Number of Water Years Analyzed: 19
Comments: Some regulation above station.
USGS Gage 04126740, Platte River at Honor, MI
Drainage Area (square miles): 125 Basin Number: 28 Characteristic R-B Index Value: 0.039 Rank: Lowest First Water Year: 1991 Last Water Year: 2011 Number of Water Years Analyzed: 21
Comments: Some diversion for fish hatchery six miles upstream from station.
USGS Gage 04126970, Boardman River above Brown Bridge Road, near Mayfield, MI
Drainage Area (square miles): 141 Basin Number: 9 Characteristic R-B Index Value: 0.040 Rank: Lowest First Water Year: 1988 Last Water Year: 2011 Number of Water Years Analyzed: 14
USGS Gage 04127000, Boardman River near Mayfield, MI
Drainage Area (square miles): 182 Basin Number: 9 Characteristic R-B Index Value: 0.091 Rank: Lower Middle p value: 0.00 First Water Year: 1953 Last Water Year: 1989 Number of Water Years Analyzed: 37
Comments: Flow regulated by hydroelectric power plant nine miles above station.

85
Streams Tributary to Lake Michigan, Northern Lower Peninsula (cont.)
USGS Gage 04127800, Jordan River near East Jordan, MI
Drainage Area (square miles): 67.9 Basin Number: 10 Characteristic R-B Index Value: 0.055 Rank: Lowest Trend: decrease, p value: 0.01 First Water Year: 1967 First Water Year Analyzed, if different: 1984 Last Water Year: 2011 Number of Water Years Analyzed: 28
Comments: Some regulation at low flow by fish hatchery upstream from station.
Streams Tributary to Lake Huron
USGS Gage 04127918, Pine River near Rudyard, MI
Drainage Area (square miles): 184 Basin Number: 54 Characteristic R-B Index Value: 0.184 Rank: Highest First Water Year: 1973 Last Water Year: 2010 Number of Water Years Analyzed: 38
Comments: This gage is in the Upper Peninsula.

86
Streams Tributary to Lake Huron (cont.)
USGS Gage 04127997, Sturgeon River at Wolverine, MI
Drainage Area (square miles): 192 Basin Number: 11 Characteristic R-B Index Value: 0.079 Rank: Lower Middle First Water Year: 1943 First Water Year Analyzed, if different: 1973 Last Water Year: 2011 Number of Water Years Analyzed: 39
Comments: discontinued gage 04128000 considered equivalent. Prior to July 1975 intermittent regulation low flows from pond 2.4 miles upstream.
USGS Gage 04128990, Pigeon River at Sturgeon Valley Road near Vanderbilt, MI
Drainage Area (square miles): 57.7 Basin Number: 11 Characteristic R-B Index Value: 0.158 Rank: Lower Middle Trend: increase, p value: 0.00 First Water Year: 1951 Last Water Year: 2011 Number of Water Years Analyzed: 61
Comments: Prior to May 1967 and since April 22, 1958 regulation by Lansing Club Dam one mile upstream.
USGS Gage 04129500, Pigeon River at Afton, MI
Drainage Area (square miles): 139 Basin Number: 11 Characteristic R-B Index Value: 0.094 Rank: Lower Middle First Water Year: 1942 First Water Year Analyzed, if different: 1946 Last Water Year: 1981 Number of Water Years Analyzed: 36
Comments: Prior to May 16, 1957 and since April 22, 1958 occasional regulation by Lansing Club Dam 22 miles above station.

87
Streams Tributary to Lake Huron (cont.)
USGS Gage 04130000, Cheboygan River near Cheboygan, MI
Drainage Area (square miles): 889 Basin Number: 11 Characteristic R-B Index Value: 0.036 Rank: Lowest p value: 0.00 First Water Year: 1943 Last Water Year: 1982 Number of Water Years Analyzed: 40
Comments: Flow regulated by dam in Cheboygan, prior to December 31, 1965 flow affected by variable backwater from power plant in Cheboygan 5.2 miles below station and by Alverno Power Plant.
USGS Gage 04130500, Black River near Tower, MI
Drainage Area (square miles): 311 Basin Number: 11 Characteristic R-B Index Value: 0.105 Rank: Lower Middle Trend: decrease, p value: 0.00 First Water Year: 1943 First Water Year Analyzed, if different: 1955 Last Water Year: 2000 Number of Water Years Analyzed: 45
Comments: • Completely regulated by Kebler Dam 400
feet upstream. • Initially published no trend for this gage.
Cusum analysis revises the analysis to a decreasing trend for this report update.
USGS Gage 04131000, Rainy River near Onaway, MI
Drainage Area (square miles): 79 Basin Number: 11 Characteristic R-B Index Value: 0.114 Rank: Lower Middle p value: 0.05 First Water Year: 1943 Last Water Year: 1952 Number of Water Years Analyzed: 10

88
Streams Tributary to Lake Huron (cont.)
USGS Gage 04131500, Rainy River near Ocqueoc, MI
Drainage Area (square miles): 87.9 Basin Number: 11 Characteristic R-B Index Value: 0.134 Rank: Lower Middle First Water Year: 1953 Last Water Year: 1979 Number of Water Years Analyzed: 27
USGS Gage 04132000, Black River near Cheboygan, MI
Drainage Area (square miles): 597 Basin Number: 11 Characteristic R-B Index Value: 0.063 Rank: Lowest p value: 0.00 First Water Year: 1944 Last Water Year: 1974
Number of Water Years Analyzed: 31 Comments: Flow regulated by Alverno Dam; prior to December 31, 1965 flow regulated by power plant at Alverno Dam.
USGS Gage 04132500, Thunder Bay River near Hillman, MI
Drainage Area (square miles): 232 Basin Number: 36 Characteristic R-B Index Value: 0.077 Rank: Lower Middle First Water Year: 1946 First Water Year Analyzed, if different: 1957 Last Water Year: 1972 Number of Water Years Analyzed: 16
Comments: Prior to May 12, 1950 diurnal fluctuation below about 500 cubic feet per second by power plant at Atlanta, occasional regulation from dams above station.
USGS Gage 04133501, Thunder Bay River at Herron Road near Bolton, MI
Drainage Area (square miles): 586 Basin Number: 36 Characteristic R-B Index Value: 0.086 Rank: Lower Middle First Water Year: 1946 First Water Year Analyzed, if different: 2003 Last Water Year: 2011 Number of Water Years Analyzed: 9
Comments: Occasional regulation by dams upstream from station, discontinued gage 04133500 considered equivalent.

89
Streams Tributary to Lake Huron (cont.)
USGS Gage 04134000, North Branch Thunder Bay River near Bolton, MI
Drainage Area (square miles): 184 Basin Number: 36 Characteristic R-B Index Value: 0.144 Rank: Upper Middle First Water Year: 1946 Last Water Year: 1980 Number of Water Years Analyzed: 35
Comments: Occasional regulation during low flows by dam above station.
USGS Gage 04135000, Thunder Bay River near Alpena, MI
Drainage Area (square miles): 1238 Basin Number: 36 Characteristic R-B Index Value: 0.188 Rank: Highest First Water Year: 1902 Last Water Year: 1993 Number of Water Years Analyzed: 21
Comments: Flow regulated at all stages by hydroelectric power plant 1,000 feet upstream.
USGS Gage 04135500, Au Sable River at Grayling, MI
Drainage Area (square miles): 110 Basin Number: 2 Characteristic R-B Index Value: 0.052 Rank: Lowest Trend: increase, p value: 0.00 First Water Year: 1956 Last Water Year: 1993 Number of Water Years Analyzed: 51
Comments: Prior to December 31, 1952 diurnal fluctuation caused by power plant 2.5 miles upstream.
USGS Gage 04135600, East Branch Au Sable River at Grayling, MI
Drainage Area (square miles): 76 Basin Number: 2 Characteristic R-B Index Value: 0.048 Rank: Lowest First Water Year: 1958 Last Water Year: 1984 Number of Water Years Analyzed: 28
Comments: Occasional regulation by MDNR ponds above station.

90
Streams Tributary to Lake Huron (cont.)
USGS Gage 04135700, South Branch Au Sable River near Luzerne, MI
Drainage Area (square miles): 401 Basin Number: 2 Characteristic R-B Index Value: 0.047 Rank: Lowest Trend: increase, p value: 0.02 First Water Year: 1967 Last Water Year: 2011 Number of Water Years Analyzed: 44
Comments: • Occasional regulation by dam upstream
from station. • Initially published no trend for this gage.
Additional data revises the analysis to an increasing trend for this report update.
USGS Gage 04136000, Au Sable River near Red Oak, MI
Drainage Area (square miles): 1108 Basin Number: 2 Characteristic R-B Index Value: 0.050 Rank: Lowest Trend: increase, p value: 0.05 First Water Year: 1909 Last Water Year: 2011 Number of Water Years Analyzed: 22
Comments: Initially published no trend for this gage. Additional data revises the analysis to an increasing trend for this report update.
USGS Gage 04136500, Au Sable River at Mio, MI
Drainage Area (square miles): 1361 Basin Number: 2 Characteristic R-B Index Value: 0.057 Rank: Lowest First Water Year: 1953 First Water Year Analyzed, if different: 1980 Last Water Year: 2011 Number of Water Years Analyzed: 32
Comments: Flow regulated by Mio Dam 500 feet upstream.

91
Streams Tributary to Lake Huron (cont.)
USGS Gage 04136900, Au Sable River near McKinley, MI
Drainage Area (square miles): 1513 Basin Number: 2 Characteristic R-B Index Value: 0.049 Rank: Lowest First Water Year: 1997 Last Water Year: 2011 Number of Water Years Analyzed: 15
USGS Gage 04137005, Au Sable River near Curtisville, MI
Drainage Area (square miles): 1598 Basin Number: 2 Characteristic R-B Index Value: 0.061 Rank: Lower Middle Trend: increase, p value: 0.03 First Water Year: 1997 Last Water Year: 2011 Number of Water Years Analyzed: 15
Comments: • Flow completely regulated by Alcona Dam
300 feet upstream. • Initially published no trend for this gage.
Additional data revises the analysis to an increasing trend for this report update.

92
Streams Tributary to Lake Huron (cont.)
USGS Gage 04137500, Au Sable River near Au Sable, MI
Drainage Area (square miles): 1739 Basin Number: 2 Characteristic R-B Index Value: 0.079 Rank: Upper Middle First Water Year: 1988 First Water Year Analyzed, if different: 2001 Last Water Year: 2011 Number of Water Years Analyzed: 11
Comments: • Flow regulated by Foote Dam 0.6 miles
upstream. • Initially published decreasing trend for this
gage. Additional data revises the analysis to no trend for this report update.
USGS Gage 04138000, East Branch Au Gres River at McIvor, MI
Drainage Area (square miles): 84 Basin Number: 1 Characteristic R-B Index Value: 0.137 Rank: Lower Middle First Water Year: 1951 Last Water Year: 1973 Number of Water Years Analyzed: 23
Comments: Some intermittent regulation at low and medium flow by dam 2.5 miles above station during period 1952-1966.
USGS Gage 04138500, Au Gres River at Cox Road near National City, MI
Drainage Area (square miles): 154 Basin Number: 1 Characteristic R-B Index Value: 0.223 Rank: Highest First Water Year: 1951 Last Water Year: 1981 Number of Water Years Analyzed: 31
Comments: Some regulation at low flows.

93
Streams Tributary to Lake Huron (cont.)
USGS Gage 04139000, Houghton Creek near Lupton, MI
Drainage Area (square miles): 29.7 Basin Number: 30 Characteristic R-B Index Value: 0.126 Rank: Lowest First Water Year: 1951 Last Water Year: 1972 Number of Water Years Analyzed: 22
Comments: Intermittent regulation at low flow by sawmill on Sandback Creek at Rose City prior to June 1955 and since November 1958.
USGS Gage 04139500, Rifle River at "The Ranch" near Lupton, MI
Drainage Area (square miles): 56.8 Basin Number: 30 Characteristic R-B Index Value: 0.101 Rank: Lower Middle First Water Year: 1951 Last Water Year: 1971 Number of Water Years Analyzed: 21
Comments: Occasional regulation by dams above station.
USGS Gage 04140000, Prior Creek near Selkirk, MI
Drainage Area (square miles): 21.4 Basin Number: 30 Characteristic R-B Index Value: 0.237 Rank: Lower Middle First Water Year: 1951 Last Water Year: 1972 Number of Water Years Analyzed: 22
Comments: Some regulation from dam at lake outlet.
USGS Gage 04140500, Rifle River at State Road at Selkirk, MI
Drainage Area (square miles): 117 Basin Number: 30 Characteristic R-B Index Value: 0.108 Rank: Upper Middle p value: 0.02 First Water Year: 1951 Last Water Year: 1982 Number of Water Years Analyzed: 32
Comments: Some regulation by dams above station.

94
Streams Tributary to Lake Huron (cont.)
USGS Gage 04141000, South Branch Shepards Creek near Selkirk, MI
Drainage Area (square miles): 1.15 Basin Number: 30 Characteristic R-B Index Value: 0.627 Rank: Highest First Water Year: 1952 Last Water Year: 1978 Number of Water Years Analyzed: 27
USGS Gage 04141500, West Branch Rifle River near Selkirk, MI
Drainage Area (square miles): 51 Basin Number: 30 Characteristic R-B Index Value: 0.184 Rank: Upper Middle First Water Year: 1952 Last Water Year: 1963 Number of Water Years Analyzed: 12
Comments: Occasional regulation from mill about seven miles upstream.
USGS Gage 04142000, Rifle River near Sterling, MI
Drainage Area (square miles): 320 Basin Number: 30 Characteristic R-B Index Value: 0.155 Rank: Highest First Water Year: 1938 First Water Year Analyzed, if different: 1991 Last Water Year: 2011 Number of Water Years Analyzed: 21
Comments: Occasional regulation by dams upstream from station.
USGS Gage 04143500, North Branch Kawkawlin River near Kawkawlin, MI
Drainage Area (square miles): 101 Basin Number: 18 Characteristic R-B Index Value: 0.197 Rank: Highest First Water Year: 1952 First Water Year Analyzed, if different: 1962 Last Water Year: 1982 Number of Water Years Analyzed: 21
Comments: Some diversions above station for irrigation. Some regulation during low flows by dams above station.

95
Streams Tributary to Lake Huron (cont.)
USGS Gage 04143900, Shiawassee River at Linden, MI
Drainage Area (square miles): 83.7 Basin Number: 32 Characteristic R-B Index Value: 0.070 Rank: Lowest First Water Year: 1968 Last Water Year: 2003 Number of Water Years Analyzed: 29
Comments: Flow regulated by dam at Linden since 1967.
USGS Gage 04144000, Shiawassee River at Byron, MI
Drainage Area (square miles): 365 Basin Number: 32 Characteristic R-B Index Value: 0.096 Rank: Lower Middle First Water Year: 1948 First Water Year Analyzed, if different: 1967 Last Water Year: 1983 Number of Water Years Analyzed: 17
Comments: Low flow slightly regulated at times by mills above station.
USGS Gage 04144500, Shiawassee River at Owosso, MI
Drainage Area (square miles): 538 Basin Number: 32 Characteristic R-B Index Value: 0.134 Rank: Upper Middle First Water Year: 1932 First Water Year Analyzed, if different: 1988 Last Water Year: 2011 Number of Water Years Analyzed: 24
Comments: Flow regulated approximately 800 cubic feet per second by power plant at Shiawassee town prior to February 1953, occasional regulation at low stages since.

96
Streams Tributary to Lake Huron (cont.)
USGS Gage 04145000, Shiawassee River near Fergus, MI
Drainage Area (square miles): 637 Basin Number: 32 Characteristic R-B Index Value: 0.141 Rank: Upper Middle First Water Year: 1941 Last Water Year: 2011 Number of Water Years Analyzed: 60
Comments: Some regulation at low stages by power plant at Shiawassee town prior to February 1953, occasional regulation at low stages since.
USGS Gage 04145500, Bad River at Hemlock Road near Brant, MI
Drainage Area (square miles): 89 Basin Number: 32 Characteristic R-B Index Value: 0.422 Rank: Highest First Water Year: 1950 Last Water Year: 1959 Number of Water Years Analyzed: 10
USGS Gage 04146000, Farmers Creek near Lapeer, MI
Drainage Area (square miles): 55.3 Basin Number: 32 Characteristic R-B Index Value: 0.130 Rank: Lower Middle First Water Year: 1934 Last Water Year: 2011 Number of Water Years Analyzed: 34
Comments: Prior to 1941 occasional regulation caused by Dam upstream from station.
USGS Gage 04146063, South Branch Flint River near Columbiaville, MI
Drainage Area (square miles): 221 Basin Number: 32 Characteristic R-B Index Value: 0.134 Rank: Upper Middle First Water Year: 1981 Last Water Year: 2011 Number of Water Years Analyzed: 31

97
Streams Tributary to Lake Huron (cont.)
USGS Gage 04147500, Flint River near Otisville, MI
Drainage Area (square miles): 530 Basin Number: 32 Characteristic R-B Index Value: 0.140 Rank: Upper Middle Trend: increase, p value: 0.01 First Water Year: 1953 Last Water Year: 2011 Number of Water Years Analyzed: 58
Comments: Flow regulated by Holloway reservoir 1.5 miles upstream from station. From 1954 to 1991 annual mean discharge and runoff adjusted for change in contents in Holloway Reservoir.
USGS Gage 04147990, Butternut Creek near Genesee, MI
Drainage Area (square miles): 34.7 Basin Number: 32 Characteristic R-B Index Value: 0.284 Rank: Upper Middle First Water Year: 1971 Last Water Year: 1983 Number of Water Years Analyzed: 13
USGS Gage 04148000, Flint River at Genesee, MI
Drainage Area (square miles): 593 Basin Number: 32 Characteristic R-B Index Value: 0.135 Rank: Upper Middle First Water Year: 1931 First Water Year Analyzed, if different: 1937 Last Water Year: 1952 Number of Water Years Analyzed: 16

98
Streams Tributary to Lake Huron (cont.)
USGS Gage 04148140, Kearsley Creek near Davison, MI
Drainage Area (square miles): 99.4 Basin Number: 32 Characteristic R-B Index Value: 0.190 Rank: Upper Middle Trend: increase, p value: 0.01 First Water Year: 1966 Last Water Year: 2011 Number of Water Years Analyzed: 46
Comments: • Some diurnal fluctuation caused by small
dams and occasional diversion from irrigation upstream from station.
• Initially published no trend for this gage. Additional data revises the analysis to an increasing trend for this report update.
USGS Gage 04148160, Gilkey Creek near Flint, MI
Drainage Area (square miles): 6.43 Basin Number: 32 Characteristic R-B Index Value: 0.693 Rank: Highest First Water Year: 1971 Last Water Year: 1983 Number of Water Years Analyzed: 13
USGS Gage 04148200, Swartz Creek near Holly, MI
Drainage Area (square miles): 12.1 Basin Number: 32 Characteristic R-B Index Value: 0.149 Rank: Lowest First Water Year: 1957 First Water Year Analyzed, if different: 1967 Last Water Year: 1975 Number of Water Years Analyzed: 9
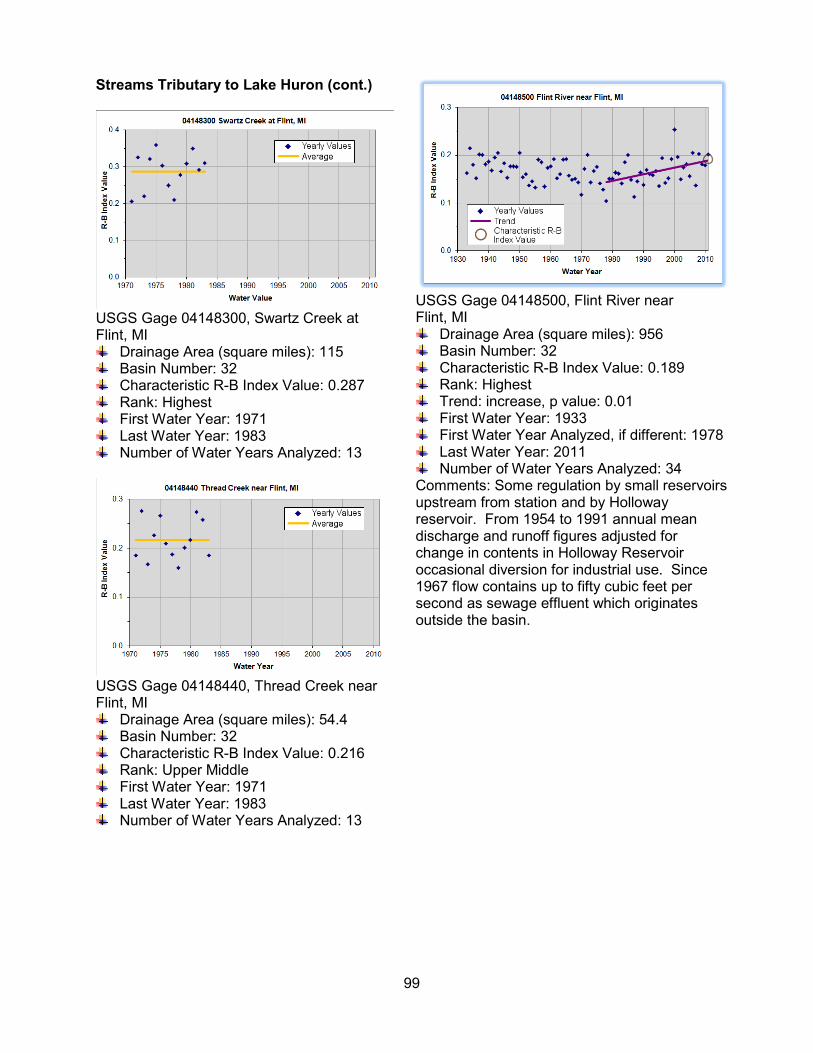
99
Streams Tributary to Lake Huron (cont.)
USGS Gage 04148300, Swartz Creek at Flint, MI
Drainage Area (square miles): 115 Basin Number: 32 Characteristic R-B Index Value: 0.287 Rank: Highest First Water Year: 1971 Last Water Year: 1983 Number of Water Years Analyzed: 13
USGS Gage 04148440, Thread Creek near Flint, MI
Drainage Area (square miles): 54.4 Basin Number: 32 Characteristic R-B Index Value: 0.216 Rank: Upper Middle First Water Year: 1971 Last Water Year: 1983 Number of Water Years Analyzed: 13
USGS Gage 04148500, Flint River near Flint, MI
Drainage Area (square miles): 956 Basin Number: 32 Characteristic R-B Index Value: 0.189 Rank: Highest Trend: increase, p value: 0.01 First Water Year: 1933 First Water Year Analyzed, if different: 1978 Last Water Year: 2011 Number of Water Years Analyzed: 34
Comments: Some regulation by small reservoirs upstream from station and by Holloway reservoir. From 1954 to 1991 annual mean discharge and runoff figures adjusted for change in contents in Holloway Reservoir occasional diversion for industrial use. Since 1967 flow contains up to fifty cubic feet per second as sewage effluent which originates outside the basin.

100
Streams Tributary to Lake Huron (cont.)
USGS Gage 04148720, Brent Run near Montrose, MI
Drainage Area (square miles): 20.8 Basin Number: 32 Characteristic R-B Index Value: 0.496 Rank: Highest First Water Year: 1971 Last Water Year: 1983 Number of Water Years Analyzed: 13
USGS Gage 04149000, Flint River near Fosters, MI
Drainage Area (square miles): 1153 Basin Number: 32 Characteristic R-B Index Value: 0.170 Rank: Highest First Water Year: 1940 Last Water Year: 2011 Number of Water Years Analyzed: 61
Comments: • Prior to October 1, 1992 water stage
records include flow of Birch Run, some regulation by reservoirs upstream from the City of Flint.
• Initially published a decreasing trend for this gage. Additional data revises the analysis to no trend for this report update.
USGS Gage 04150000, South Branch Cass River near Cass City, MI
Drainage Area (square miles): 238 Basin Number: 32 Characteristic R-B Index Value: 0.397 Rank: Highest First Water Year: 1949 Last Water Year: 1980 Number of Water Years Analyzed: 32

101
Streams Tributary to Lake Huron (cont.)
USGS Gage 04150500, Cass River at Cass City, MI
Drainage Area (square miles): 359 Basin Number: 32 Characteristic R-B Index Value: 0.333 Rank: Highest First Water Year: 1948 First Water Year Analyzed, if different: 1967 Last Water Year: 2011 Number of Water Years Analyzed: 41
USGS Gage 04150800, Cass River at Wahjamega, MI
Drainage Area (square miles): 645 Basin Number: 32 Characteristic R-B Index Value: 0.275 Rank: Highest First Water Year: 1969 Last Water Year: 1994 Number of Water Years Analyzed: 26
Comments: Some regulation by dam at Michigan Sugar Company 1.9 miles upstream from station.
USGS Gage 04151000, Cass River at Vassar, MI
Drainage Area (square miles): 710 Basin Number: 32 Characteristic R-B Index Value: 0.266 Rank: Highest p value: 0.04 First Water Year: 1949 Last Water Year: 1970 Number of Water Years Analyzed: 22
Comments: Some regulation by dam at Michigan Sugar Company 12.6 miles above station.
USGS Gage 04151500, Cass River at Frankenmuth, MI
Drainage Area (square miles): 841 Basin Number: 32 Characteristic R-B Index Value: 0.244 Rank: Highest First Water Year: 1936 First Water Year Analyzed, if different: 1962 Last Water Year: 2011 Number of Water Years Analyzed: 50
Comments: Occasional regulation by dams upstream from station. Prior to 1950 regulation at low and medium flows by mill upstream from station.

102
Streams Tributary to Lake Huron (cont.)
USGS Gage 04152238, South Branch Tobacco River near Beaverton, MI
Drainage Area (square miles): 160 Basin Number: 32 Characteristic R-B Index Value: 0.180 Rank: Highest First Water Year: 1988 Last Water Year: 2011 Number of Water Years Analyzed: 24
USGS Gage 04152500, Tobacco River at Glidden Road at Beaverton, MI
Drainage Area (square miles): 487 Basin Number: 32 Characteristic R-B Index Value: 0.149 Rank: Upper Middle p value: 0.00 First Water Year: 1949 Last Water Year: 1982 Number of Water Years Analyzed: 34
Comments: Prior to February 21, 1961 regulation at all stages by hydroelectric power plant one mile above station, occasional regulation since.
USGS Gage 04153500, Salt River near North Bradley, MI
Drainage Area (square miles): 138 Basin Number: 32 Characteristic R-B Index Value: 0.402 Rank: Highest First Water Year: 1935 Last Water Year: 1971 Number of Water Years Analyzed: 37
USGS Gage 04154000, Chippewa River near Mount Pleasant, MI
Drainage Area (square miles): 416 Basin Number: 32 Characteristic R-B Index Value: 0.089 Rank: Lower Middle First Water Year: 1934 First Water Year Analyzed, if different: 1978 Last Water Year: 2011 Number of Water Years Analyzed: 33
Comments: Diurnal fluctuation below 750 cubic feet per second caused by power plant at Mount Pleasant prior to 1962, occasional regulation at low flow since. Since July 30, 1968 occasional regulation from control structures on lake outlets.

103
Streams Tributary to Lake Huron (cont.)
USGS Gage 04154500, Chippewa River near Midland, MI
Drainage Area (square miles): 597 Basin Number: 32 Characteristic R-B Index Value: 0.112 Rank: Upper Middle p value: 0.00 First Water Year: 1948 Last Water Year: 1972 Number of Water Years Analyzed: 25
Comments: Diurnal fluctuation below 750 cubic feet per second caused by power plant at Mount Pleasant prior to 1962, occasional regulation at low flow since. Since July 30, 1968 occasional regulation from control structures on lake outlets.
USGS Gage 04155000, Pine River at Alma, MI
Drainage Area (square miles): 288 Basin Number: 32 Characteristic R-B Index Value: 0.121 Rank: Upper Middle First Water Year: 1931 First Water Year Analyzed, if different: 1980 Last Water Year: 2011 Number of Water Years Analyzed: 32
Comments: Flow regulated by dam 0.6 miles upstream from station, and by variable backwater from power plant at St. Louis 5.2 miles downstream.
USGS Gage 04155500, Pine River near Midland, MI
Drainage Area (square miles): 390 Basin Number: 32 Characteristic R-B Index Value: 0.178 Rank: Highest First Water Year: 1935 Last Water Year: 2011 Number of Water Years Analyzed: 64
Comments: Regulation at low and medium flows by hydroelectric power plant at St. Louis. Some diversions from station for irrigation.

104
Streams Tributary to Lake Huron (cont.)
USGS Gage 04156000, Tittabawassee River at Midland, MI
Drainage Area (square miles): 2400 Basin Number: 32 Characteristic R-B Index Value: 0.229 Rank: Highest First Water Year: 1937 Last Water Year: 2011 Number of Water Years Analyzed: 75
Comments: Prior to 1992 a diversion was used in computing annual mean discharge and runoff figures, extremes and daily discharge were not adjusted for diversion. Prior to May 20, 1970 discharge below 4,000 cubic feet per second regulated by dam 2,000 feet upstream from station; fixed crest dam.
USGS Gage 04156500, Tittabawassee River at Freeland, MI
Drainage Area (square miles): 2530 Basin Number: 32 Characteristic R-B Index Value: 0.189 Rank: Highest First Water Year: 1931 Last Water Year: 1936 Number of Water Years Analyzed: 6
USGS Gage 04157500, Sebewaing River State Drain near Sebewaing, MI
Drainage Area (square miles): 67.3 Basin Number: 33 Characteristic R-B Index Value: 0.630 Rank: Highest First Water Year: 1940 Last Water Year: 1954 Number of Water Years Analyzed: 15
USGS Gage 04158000, Columbia Drain at Gettel Road near Sebewaing, MI
Drainage Area (square miles): 33.9 Basin Number: 33 Characteristic R-B Index Value: 0.638 Rank: Highest First Water Year: 1941 Last Water Year: 1990 Number of Water Years Analyzed: 16
Comments: Some regulation by dam at Michigan Sugar Company 1.9 miles upstream from station.

105
Streams Tributary to Lake Huron (cont.)
USGS Gage 04158500, Pigeon River near Owendale, MI
Drainage Area (square miles): 53.2 Basin Number: 26 Characteristic R-B Index Value: 0.390 Rank: Highest First Water Year: 1953 Last Water Year: 1982 Number of Water Years Analyzed: 21
USGS Gage 04159010, Pigeon River near Caseville, MI
Drainage Area (square miles): 125 Basin Number: 26 Characteristic R-B Index Value: 0.375 Rank: Highest First Water Year: 1987 Last Water Year: 1993 Number of Water Years Analyzed: 7
Comments: Some diversions at low flows for agricultural irrigation.
Streams Tributary to St. Clair River
USGS Gage 04159492, Black River near Jeddo, MI
Drainage Area (square miles): 464 Basin Number: 6 Characteristic R-B Index Value: 0.429 Rank: Highest First Water Year: 1945 Last Water Year: 2011 Number of Water Years Analyzed: 17
Comments: • Diurnal fluctuation principally during low
flow, caused by an unknown source upstream from station.
• Initially published an increasing trend for this gage. Additional data revises the analysis to no trend for this report update.

106
Streams Tributary to St. Clair River (cont.)
USGS Gage 04159500, Black River near Fargo, MI
Drainage Area (square miles): 480 Basin Number: 6 Characteristic R-B Index Value: 0.335 Rank: Highest First Water Year: 1945 First Water Year Analyzed, if different: 1963 Last Water Year: 1991 Number of Water Years Analyzed: 29
USGS Gage 04159900, Mill Creek near Avoca, MI
Drainage Area (square miles): 169 Basin Number: 6 Characteristic R-B Index Value: 0.279 Rank: Highest First Water Year: 1964 First Water Year Analyzed, if different: 1988 Last Water Year: 2011 Number of Water Years Analyzed: 24
USGS Gage 04160000, Mill Creek near Abbottsford, MI
Drainage Area (square miles): 208 Basin Number: 6 Characteristic R-B Index Value: 0.200 Rank: Highest p value: 0.00 First Water Year: 1948 Last Water Year: 1964 Number of Water Years Analyzed: 17
USGS Gage 04160050, Black River near Port Huron, MI
Drainage Area (square miles): 684 Basin Number: 6 Characteristic R-B Index Value: 0.323 Rank: Highest First Water Year: 1933 Last Water Year: 1943 Number of Water Years Analyzed: 11

107
Streams Tributary to St. Clair River (cont.)
USGS Gage 04160570, North Branch Belle River at Imlay City, MI
Drainage Area (square miles): 18 Basin Number: 3 Characteristic R-B Index Value: 0.294 Rank: Lower Middle First Water Year: 1966 Last Water Year: 2011 Number of Water Years Analyzed: 36
Comments: Some diversion by pumping for sprinkler irrigation.
USGS Gage 04160600, Belle River at Memphis, MI
Drainage Area (square miles): 151 Basin Number: 3 Characteristic R-B Index Value: 0.338 Rank: Highest Trend: increase, p value: 0.00 First Water Year: 1963 Last Water Year: 2001 Number of Water Years Analyzed: 49
Streams Tributary to Lake St. Clair
USGS Gage 04160800, Sashabaw Creek near Drayton Plains, MI
Drainage Area (square miles): 20.9 Basin Number: 12 Characteristic R-B Index Value: 0.136 Rank: Lowest First Water Year: 1960 Last Water Year: 2009 Number of Water Years Analyzed: 50
USGS Gage 04160900, Clinton River near Drayton Plains, MI
Drainage Area (square miles): 79.2 Basin Number: 12 Characteristic R-B Index Value: 0.079 Rank: Lowest First Water Year: 1960 First Water Year Analyzed, if different: 1981 Last Water Year: 2009 Number of Water Years Analyzed: 29
Comments: Some regulation and occasional diversion for lake-level control at many lakes upstream from station.

108
Streams Tributary to Lake St. Clair (cont.)
USGS Gage 04161000, Clinton River at Auburn Heights, MI
Drainage Area (square miles): 123 Basin Number: 12 Characteristic R-B Index Value: 0.164 Rank: Upper Middle First Water Year: 1936 First Water Year Analyzed, if different: 2002 Last Water Year: 2011 Number of Water Years Analyzed: 8
Comments: • Some regulation by many lakes upstream
from station. Flow includes sewage effluent, most of which originates from sources outside the Basin.
• Initially published an increasing trend for this gage. Additional data revises the analysis to no trend for this report update.
USGS Gage 04161100, Galloway Creek near Auburn Heights, MI
Drainage Area (square miles): 17.9 Basin Number: 12 Characteristic R-B Index Value: 0.419 Rank: Upper Middle Trend: increase, p value: 0.00 First Water Year: 1960 First Water Year Analyzed, if different: 1972 Last Water Year: 1991 Number of Water Years Analyzed: 20

109
Streams Tributary to Lake St. Clair (cont.)
USGS Gage 04161500, Paint Creek near Lake Orion, MI
Drainage Area (square miles): 38.5 Basin Number: 12 Characteristic R-B Index Value: 0.094 Rank: Lowest Trend: decrease, p value: 0.02 First Water Year: 1956 First Water Year Analyzed, if different: 1966 Last Water Year: 1991 Number of Water Years Analyzed: 13
Comments: • Occasional regulation by Lake Orion. • Initially published no trend for this gage.
Cusum analysis revises the analysis to a decreasing trend for this report update.
USGS Gage 04161540, Paint Creek at Rochester, MI
Drainage Area (square miles): 70.9 Basin Number: 12 Characteristic R-B Index Value: 0.209 Rank: Upper Middle Trend: increase, p value: 0.00 First Water Year: 1960 Last Water Year: 2011 Number of Water Years Analyzed: 52
Comments: Occasional regulation by Lake Orion.
USGS Gage 04161580, Stony Creek near Romeo, MI
Drainage Area (square miles): 25.6 Basin Number: 12 Characteristic R-B Index Value: 0.195 Rank: Lower Middle Trend: increase, p value: 0.01 First Water Year: 1965 First Water Year Analyzed, if different: 1984 Last Water Year: 2011 Number of Water Years Analyzed: 28

110
Streams Tributary to Lake St. Clair (cont.)
USGS Gage 04161800, Stony Creek near Washington, MI
Drainage Area (square miles): 68.2 Basin Number: 12 Characteristic R-B Index Value: 0.130 Rank: Lower Middle First Water Year: 1959 Last Water Year: 2011 Number of Water Years Analyzed: 53
Comments: Occasional diurnal fluctuation caused by mills upstream from station prior to February 1963, occasional regulation by Stony Lake since.
USGS Gage 04161820, Clinton River at Sterling Heights, MI
Drainage Area (square miles): 309 Basin Number: 12 Characteristic R-B Index Value: 0.201 Rank: Highest First Water Year: 1979 First Water Year Analyzed, if different: 1997 Last Water Year: 2011 Number of Water Years Analyzed: 11
USGS Gage 04162010, Red Run near Warren, MI
Drainage Area (square miles): 34.2 Basin Number: 12 Characteristic R-B Index Value: 1.009 Rank: Highest First Water Year: 1980 Last Water Year: 1988 Number of Water Years Analyzed: 9
Comments: Diversions from Big Beaver Creek Basin via Henry-Graham Drain started in 1976 is ongoing and increasing with further development of new drains.

111
Streams Tributary to Lake St. Clair (cont.)
USGS Gage 04162900, Big Beaver Creek near Warren, MI
Drainage Area (square miles): 23.5 Basin Number: 12 Characteristic R-B Index Value: 0.957 Rank: Highest First Water Year: 1959 First Water Year Analyzed, if different: 1982 Last Water Year: 1988 Number of Water Years Analyzed: 7
Comments: • Diversions from the Henry-Graham Drain
started in 1976 is ongoing and increasing with further development for new drains.
• Initially published an increasing trend for this gage. Cusum analysis revises the analysis to no trend for this report update.
USGS Gage 04163400, Plum Brook at Utica, MI
Drainage Area (square miles): 16.5 Basin Number: 12 Characteristic R-B Index Value: 0.546 Rank: Highest First Water Year: 1966 Last Water Year: 2011 Number of Water Years Analyzed: 44
Comments: Prior to 1998 occasional diversion for sprinkler irrigation.
USGS Gage 04163500, Plum Brook near Utica, MI
Drainage Area (square miles): 22.9 Basin Number: 12 Characteristic R-B Index Value: 0.419 Rank: Upper Middle p value: 0.03 First Water Year: 1955 Last Water Year: 1966 Number of Water Years Analyzed: 12

112
Streams Tributary to Lake St. Clair (cont.)
USGS Gage 04164000, Clinton River near Fraser, MI
Drainage Area (square miles): 444 Basin Number: 12 Characteristic R-B Index Value: 0.305 Rank: Highest Trend: increase, p value: 0.00 First Water Year: 1948 Last Water Year: 2011 Number of Water Years Analyzed: 65
USGS Gage 04164010, North Branch Clinton River at Almont, MI
Drainage Area (square miles): 10 Basin Number: 12 Characteristic R-B Index Value: 0.420 Rank: Upper Middle First Water Year: 1963 Last Water Year: 1968 Number of Water Years Analyzed: 6
USGS Gage 04164050, North Branch Clinton River at 33 Mile Road near Romeo, MI
Drainage Area (square miles): 49.7 Basin Number: 12 Characteristic R-B Index Value: 0.412 Rank: Highest First Water Year: 1965 Last Water Year: 1969 Number of Water Years Analyzed: 5
USGS Gage 04164100, East Pond Creek at Romeo, MI
Drainage Area (square miles): 21.8 Basin Number: 12 Characteristic R-B Index Value: 0.162 Rank: Lower Middle First Water Year: 1959 Last Water Year: 2011 Number of Water Years Analyzed: 53
Comments: Occasional regulation upstream from station.

113
Streams Tributary to Lake St. Clair (cont.)
USGS Gage 04164150, North Branch Clinton River at 27 Mile Road near Meade, MI
Drainage Area (square miles): 89.6 Basin Number: 12 Characteristic R-B Index Value: 0.325 Rank: Highest First Water Year: 1968 Last Water Year: 1972 Number of Water Years Analyzed: 5
Comments: Occasional regulation at low flow by Mill Pond above station.
USGS Gage 04164200, Coon Creek at North Avenue near Armada, MI
Drainage Area (square miles): 9.56 Basin Number: 12 Characteristic R-B Index Value: 0.489 Rank: Upper Middle First Water Year: 1966 Last Water Year: 1970 Number of Water Years Analyzed: 5
Comments: Occasional diversion for sprinkler irrigation.
USGS Gage 04164250, Tupper Brook at Ray Center, MI
Drainage Area (square miles): 8.62 Basin Number: 12 Characteristic R-B Index Value: 0.669 Rank: Highest First Water Year: 1960 Last Water Year: 1964 Number of Water Years Analyzed: 5
USGS Gage 04164300, East Branch Coon Creek at Armada, MI
Drainage Area (square miles): 13 Basin Number: 12 Characteristic R-B Index Value: 0.633 Rank: Highest First Water Year: 1959 Last Water Year: 2011 Number of Water Years Analyzed: 53

114
Streams Tributary to Lake St. Clair (cont.)
USGS Gage 04164350, Highbank Creek at 32 Mile Road near Armada, MI
Drainage Area (square miles): 14.9 Basin Number: 12 Characteristic R-B Index Value: 0.537 Rank: Highest p value: 0.05 First Water Year: 1966 Last Water Year: 1970 Number of Water Years Analyzed: 5
Comments: Occasional diversion for sprinkler irrigation.
USGS Gage 04164360, East Branch Cook Creek at 29-Mile Road near New Haven, MI
Drainage Area (square miles): 36.1 Basin Number: 12 Characteristic R-B Index Value: 0.336 Rank: Highest p value: 0.05 First Water Year: 1968 Last Water Year: 1982 Number of Water Years Analyzed: 5
USGS Gage 04164400, Deer Creek at 25½ Mile Road near Meade, MI
Drainage Area (square miles): 12.7 Basin Number: 12 Characteristic R-B Index Value: 0.760 Rank: Highest First Water Year: 1961 Last Water Year: 1965 Number of Water Years Analyzed: 5
USGS Gage 04164450, McBride Drain at 24 Mile Road near Macomb, MI
Drainage Area (square miles): 5.79 Basin Number: 12 Characteristic R-B Index Value: 0.682 Rank: Highest First Water Year: 1960 Last Water Year: 1964 Number of Water Years Analyzed: 5

115
Streams Tributary to Lake St. Clair (cont.)
USGS Gage 04164500, North Branch Clinton River near Mount Clemens, MI
Drainage Area (square miles): 199 Basin Number: 12 Characteristic R-B Index Value: 0.346 Rank: Highest First Water Year: 1948 First Water Year Analyzed, if different: 1972 Last Water Year: 2011 Number of Water Years Analyzed: 41
Comments: • Some regulation by mill upstream. • Initially published an increasing trend for this
gage. Additional data revises the analysis to no trend for this report update.
USGS Gage 04164600, Middle Branch Clinton River at Schoenherr Road near Macomb, MI
Drainage Area (square miles): 22.2 Basin Number: 12 Characteristic R-B Index Value: 0.441 Rank: Upper Middle First Water Year: 1965 Last Water Year: 1969 Number of Water Years Analyzed: 5
USGS Gage 04164800, Middle Branch Clinton River at Macomb, MI
Drainage Area (square miles): 41 Basin Number: 12 Characteristic R-B Index Value: 0.439 Rank: Highest First Water Year: 1963 Last Water Year: 1982 Number of Water Years Analyzed: 19
USGS Gage 04165200, Gloede Ditch near Waldenburg, MI
Drainage Area (square miles): 16 Basin Number: 12 Characteristic R-B Index Value: 0.461 Rank: Upper Middle First Water Year: 1960 Last Water Year: 1964 Number of Water Years Analyzed: 5

116
Streams Tributary to Lake St. Clair (cont.)
USGS Gage 04165500, Clinton River at Moravian Drive at Mount Clemens, MI
Drainage Area (square miles): 734 Basin Number: 12 Characteristic R-B Index Value: 0.303 Rank: Highest Trend: increase, p value: 0.00 First Water Year: 1935 First Water Year Analyzed, if different: 1971 Last Water Year: 2004 Number of Water Years Analyzed: 34
Streams Tributary to Detroit River
USGS Gage 04166000, River Rouge at Birmingham, MI
Drainage Area (square miles): 33.3 Basin Number: 31 Characteristic R-B Index Value: 0.426 Rank: Highest First Water Year: 1951 First Water Year Analyzed, if different: 1998 Last Water Year: 2011 Number of Water Years Analyzed: 14
Comments: • Occasional regulation by Quarton Lake
upstream from station. • Initially published an increasing trend for this
gage. Additional data revises the analysis to no trend for this report update.

117
Streams Tributary to Detroit River (cont.)
USGS Gage 04166100, River Rouge at Southfield, MI
Drainage Area (square miles): 87.9 Basin Number: 31 Characteristic R-B Index Value: 0.479 Rank: Highest First Water Year: 1959 First Water Year Analyzed, if different: 1995 Last Water Year: 2011 Number of Water Years Analyzed: 17
Comments: Initially published an increasing trend for this gage. Additional data revises the analysis to no trend for this report update.
USGS Gage 04166200, Evans Ditch at Southfield, MI
Drainage Area (square miles): 9.49 Basin Number: 31 Characteristic R-B Index Value: 0.892 Rank: Highest First Water Year: 1959 First Water Year Analyzed, if different: 1998 Last Water Year: 2009 Number of Water Years Analyzed: 12
Comments: Initially published an increasing trend for this gage. Additional data revises the analysis to no trend for this report update.
USGS Gage 04166300, Upper River Rouge at Farmington, MI
Drainage Area (square miles): 17.5 Basin Number: 31 Characteristic R-B Index Value: 0.423 Rank: Upper Middle First Water Year: 1959 First Water Year Analyzed, if different: 1998 Last Water Year: 2011 Number of Water Years Analyzed: 14
Comments: Initially published an increasing trend for this gage. Additional data revises the analysis to no trend for this report update.

118
Streams Tributary to Detroit River (cont.)
USGS Gage 04166470, Upper River Rouge at Detroit, MI
Drainage Area (square miles): 67.3 Basin Number: 31 Characteristic R-B Index Value: 0.545 Rank: Highest First Water Year: 1998 Last Water Year: 2005 Number of Water Years Analyzed: 8
USGS Gage 04166500, River Rouge at Detroit, MI
Drainage Area (square miles): 187 Basin Number: 31 Characteristic R-B Index Value: 0.492 Rank: Highest First Water Year: 1931 First Water Year Analyzed, if different: 1990 Last Water Year: 2011 Number of Water Years Analyzed: 22
Comments: • Regulation by water retention structure
upstream from station and some diversion by pumping for sprinkler irrigation.
• Initially published an increasing trend for this gage. Additional data revises the analysis to no trend for this report update.

119
Streams Tributary to Detroit River (cont.)
USGS Gage 04167000, Middle River Rouge near Garden City, MI
Drainage Area (square miles): 99. 9 Basin Number: 31 Characteristic R-B Index Value: 0.377 Rank: Highest First Water Year: 1931 First Water Year Analyzed, if different: 1998 Last Water Year: 2011 Number of Water Years Analyzed: 14
Comments: • Regulation by storm water retention
structures and occasional regulation by reservoirs upstream of the station since 1956.
• Initially published an increasing trend for this gage. Additional data revises the analysis to no trend for this report update.
USGS Gage 04167150, Middle River Rouge at Dearborn, MI
Drainage Area (square miles): 110 Basin Number: 31 Characteristic R-B Index Value: 0.399 Rank: Highest First Water Year: 1998 Last Water Year: 2005 Number of Water Years Analyzed: 8
Comments: Regulation by storm water retention structures and occasional regulation by reservoirs upstream from station.
USGS Gage 04168000, Lower River Rouge at Inkster, MI
Drainage Area (square miles): 83.2 Basin Number: 31 Characteristic R-B Index Value: 0.400 Rank: Highest Trend: decrease, p value: 0.00 First Water Year: 1948 Last Water Year: 2011 Number of Water Years Analyzed: 64
Comments: Since 1995 flow contains effluent sewage treatment plant which originates outside the basin.

120
Streams Tributary to Detroit River (cont.)
USGS Gage 04168400, Lower River Rouge at Dearborn, MI
Drainage Area (square miles): 91 Basin Number: 31 Characteristic R-B Index Value: 0.370 Rank: Highest First Water Year: 1998 Last Water Year: 2004 Number of Water Years Analyzed: 7
Comments: Flow contains effluent from sewage treatment plant, which originates outside the basin.
USGS Gage 04168580, Ecorse River at Dearborn Heights, MI
Drainage Area (square miles): 10 Basin Number: 31 Characteristic R-B Index Value: 0.821 Rank: Highest First Water Year: 2003 Last Water Year: 2011 Number of Water Years Analyzed: 9
Comments: Gage added for this report update.
Streams Tributary to Lake Erie
USGS Gage 04169500, Huron River at Commerce, MI
Drainage Area (square miles): 57.3 Basin Number: 15 Characteristic R-B Index Value: 0.054 Rank: Lowest First Water Year: 1947 Last Water Year: 1975 Number of Water Years Analyzed: 29
Comments: Some regulation by dams operated for lake level control of Pontiac, Oxbow, and Union Lakes.

121
Streams Tributary to Lake Erie (cont.)
USGS Gage 04170000, Huron River at Milford, MI
Drainage Area (square miles): 132 Basin Number: 15 Characteristic R-B Index Value: 0.075 Rank: Lowest First Water Year: 1949 First Water Year Analyzed, if different: 1960 Last Water Year: 2011 Number of Water Years Analyzed: 52
Comments: Flow regulation about 300 cubic feet per second regulated by power plant 1.5 miles upstream from station prior to May 29, 1957. Occasional regulation for lake level control since.
USGS Gage 04170500, Huron River near New Hudson, MI
Drainage Area (square miles): 148 Basin Number: 15 Characteristic R-B Index Value: 0.075 Rank: Lowest First Water Year: 1949 First Water Year Analyzed, if different: 1968 Last Water Year: 2011 Number of Water Years Analyzed: 44
Comments: Occasional regulation by Kent Lake.
USGS Gage 04171500, South Ore Creek at Hamburg Road near Brighton, MI
Drainage Area (square miles): 33.7 Basin Number: 15 Characteristic R-B Index Value: 0.080 Rank: Lowest First Water Year: 1951 Last Water Year: 1968 Number of Water Years Analyzed: 18
Comments: Occasional regulation by lakes above station.

122
Streams Tributary to Lake Erie (cont.)
USGS Gage 04172000, Huron River near Hamburg, MI
Drainage Area (square miles): 308 Basin Number: 15 Characteristic R-B Index Value: 0.054 Rank: Lowest First Water Year: 1952 First Water Year Analyzed, if different: 1967 Last Water Year: 2011 Number of Water Years Analyzed: 45
Comments: Occasional regulation by Kent Lake 11 miles upstream.
USGS Gage 04172500, Portage River at Tiplady Road near Pinckney, MI
Drainage Area (square miles): 79.1 Basin Number: 15 Characteristic R-B Index Value: 0.058 Rank: Lowest First Water Year: 1946 Last Water Year: 2009 Number of Water Years Analyzed: 27
Comments: Regulation by Hiland Lake 2.5 miles above station. Data point for 2009 is from MDEQ data.
USGS Gage 04173000, Huron River near Dexter, MI
Drainage Area (square miles): 522 Basin Number: 15 Characteristic R-B Index Value: 0.143 Rank: Upper Middle p value: 0.00 First Water Year: 1947 First Water Year Analyzed, if different: 1962 Last Water Year: 1977 Number of Water Years Analyzed: 13
USGS Gage 04173500, Mill Creek near Dexter, MI
Drainage Area (square miles): 128 Basin Number: 15 Characteristic R-B Index Value: 0.196 Rank: Highest First Water Year: 1953 First Water Year Analyzed, if different: 1995 Last Water Year: 2011 Number of Water Years Analyzed: 17
Comments: Initially published a decreasing trend for this gage. Additional data revises the analysis to no trend for this report update.

123
Streams Tributary to Lake Erie (cont.)
USGS Gage 04174500, Huron River at Ann Arbor, MI
Drainage Area (square miles): 729 Basin Number: 15 Characteristic R-B Index Value: 0.094 Rank: Lower Middle First Water Year: 1915 First Water Year Analyzed, if different: 1999 Last Water Year: 2011 Number of Water Years Analyzed: 12
Comments: • Prior to 1955 diversion upstream from
station from Ann Arbor municipal supply had negligible effect on natural flow, annual mean discharge and runoff figures adjusted for diversion from 1955 to 1991. Flow regulation by power plants prior to May 1962. From June 1962 to 1975 occasional regulation for lake level control operations upstream from station. Since 1975 extensive regulation of flow exists due to automation of gates at dams upstream from station.
• Initially published a decreasing trend for this gage. Additional data revises the analysis to no trend for this report update.
USGS Gage 04174800, Huron River at Ypsilanti, MI
Drainage Area (square miles): 807 Basin Number: 15 Characteristic R-B Index Value: 0.104 Rank: Lower Middle Trend: decrease, p value: 0.00 First Water Year: 1975 Last Water Year: 1994 Number of Water Years Analyzed: 15
Comments: Considerable regulation caused by many dams upstream from station.
USGS Gage 04175340, Stony Creek at Oakville, MI
Drainage Area (square miles): 68 Basin Number: 35 Characteristic R-B Index Value: 0.335 Rank: Highest First Water Year: 1971 Last Water Year: 2003 Number of Water Years Analyzed: 12

124
Streams Tributary to Lake Erie (cont.)
USGS Gage 04175600, River Raisin near Manchester, MI
Drainage Area (square miles): 132 Basin Number: 29 Characteristic R-B Index Value: 0.092 Rank: Lower Middle First Water Year: 1971 Last Water Year: 2011 Number of Water Years Analyzed: 37
Comments: Occasional regulation caused by many dams upstream from station.
USGS Gage 04175700, River Raisin near Tecumseh, MI
Drainage Area (square miles): 267 Basin Number: 29 Characteristic R-B Index Value: 0.106 Rank: Upper Middle p value: 0.00 First Water Year: 1957 Last Water Year: 1980 Number of Water Years Analyzed: 24
Comments: Diurnal fluctuation caused by power plant 5.5 miles above station prior to June 27, 1968.
USGS Gage 04176000, River Raisin near Adrian, MI
Drainage Area (square miles): 463 Basin Number: 29 Characteristic R-B Index Value: 0.176 Rank: Highest Trend: increase, p value: 0.04 First Water Year: 1954 First Water Year Analyzed, if different: 1972 Last Water Year: 2011 Number of Water Years Analyzed: 27
Comments: Diurnal fluctuation caused by power plant at Tecumseh, 11 miles upstream from station prior to June 27, 1968 occasional regulation since.

125
Streams Tributary to Lake Erie (cont.)
USGS Gage 04176400, Saline River near Saline, MI
Drainage Area (square miles): 94.6 Basin Number: 29 Characteristic R-B Index Value: 0.308 Rank: Highest First Water Year: 1966 Last Water Year: 1977 Number of Water Years Analyzed: 12
Comments: Slight regulation for lake level control. Pumpage for irrigation diverts an indeterminate amount of water. Saline’s sewage effluent, which originates as ground water, is included in flow.
USGS Gage 04176500, River Raisin near Monroe, MI
Drainage Area (square miles): 1042 Basin Number: 29 Characteristic R-B Index Value: 0.160 Rank: Highest First Water Year: 1938 First Water Year Analyzed, if different: 1972 Last Water Year: 2011 Number of Water Years Analyzed: 40
Comments: Diurnal fluctuation caused by power plants upstream from station prior to June 27, 1968. At times flow is affected by irrigation pumpage.
USGS Gage 04176605, Otter Creek at Lasalle, MI
Drainage Area (square miles): 51 Basin Number: 29 Characteristic R-B Index Value: 0.471 Rank: Highest First Water Year: 1988 Last Water Year: 2011 Number of Water Years Analyzed: 24

126
Statistical Analysis Summary
Details of the R-B flashiness statistical analysis for each gaged site are provided in Table 9. The sites are ordered by gage number, which places them in the following order:
1. Streams Tributary to Lake Superior2. Streams Tributary to Lake Michigan, Upper Peninsula3. Streams Tributary to Lake Michigan, Southern Lower Peninsula4. Streams Tributary to Lake Michigan, Northern Lower Peninsula5. Streams Tributary to Lake Huron6. Streams Tributary to St. Clair River7. Streams Tributary to Lake St. Clair8. Streams Tributary to Detroit River9. Streams Tributary to Lake Erie
Table 9 lists R-B Index values and related statistics as calculated for all of the data and also as calculated for a selected portion of the data for those gages where cusum analysis indicated a trend change in the data. Total Water Years may be less than the ending water year minus the starting water year because of gaps in the data. The flashiness trend in the table is based on the trend slopes. Statistical significance is based on the ‘p’ value of the regression line. A p value of 0.05 or less equates to 95 percent statistical significance. The table also includes the major watershed number, as shown on the map of Michigan’s Major Watersheds, Appendix B, or www.michigan.gov/documents/deq/wrd-mi-watersheds_559937_7.pdf.

127
Table 9 - R-B Flashiness Statistical Analysis Details – Ordered by Gage Number. G
age
Num
ber
Gag
e
Des
crip
tion
Tota
l Dra
inag
e A
rea
(sq.
mi.)
Maj
or
Wat
ersh
ed
Wat
ersh
ed
Num
ber
Cha
ract
eris
tic
R-B
Inde
x Va
lue
Qua
rtile
Ran
k
Flas
hine
ss
Tren
d
p Va
lue
Firs
t Wat
er Y
ear
of R
ecor
d
Firs
t W
ater
Ye
ar A
naly
zed,
if
diffe
rent
Last
Wat
er Y
ear
Wat
er Y
ears
A
naly
zed
Streams Tributary to Lake Superior
04001000 Washington Creek at Windigo, MI 13 Portage 55 0.225 Lower Middle 1965 2003 39
04028000 Montreal River at Ironwood, MI 61 Montreal 51 0.284 Upper Middle 1919 1954 9
04029000 West Branch Montreal River at Gile, WI 78 Montreal 51 0.174 Upper Middle 1919 1947 12
04029990 Montreal River at Saxon Falls near Saxon, WI 261 Montreal 51 0.179 Highest 1939 2010 56
04030000 Montreal River near Saxon, WI 264 Montreal 51 0.144 Upper Middle 1939 1970 32
04031000 Black River near Bessemer, MI 200 Presque Isle 56 0.220 Highest 1955 2010 38
04031500 Presque Isle River at Marenisco, MI 171 Presque Isle 56 0.113 Upper
Middle 1946 1982 37
04032000 Presque Isle River near Tula, MI 261 Presque Isle 56 0.138 Upper
Middle 1946 1973 28
04032500 Iron River near White Pine, MI 98 Presque Isle 56 0.266 Upper
Middle 1953 1957 5
04033000 Middle Branch Ontonagon River near Paulding, MI 164 Ontonagon 53 0.081 Lower Middle 1943 1976 2009 29
04034500 Middle Branch Ontonagon River near Trout Creek, MI 203 Ontonagon 53 0.049 Lowest decrease 0.02 1943 2011 69
04035000 East Branch Ontonagon River near Mass, MI 272 Ontonagon 53 0.170 Upper Middle 1943 1979 37
04035500 Middle Branch Ontonagon River near Rockland, MI 671 Ontonagon 53 0.233 Highest 1943 2008 66 04036000 West Branch Ontonagon River near Bergland, MI 162 Ontonagon 53 0.060 Lowest decrease <0.01 1943 1978 2011 34
04037500 Cisco Branch Ontonagon River at Cisco Lake Outlet, MI 51 Ontonagon 53 0.281 Upper Middle increase <0.01 1945 1977 2011 35
04039500 South Branch Ontonagon River at Ewen, MI 348 Ontonagon 53 0.141 Upper Middle 1943 1971 28
04040000 Ontonagon River near Rockland, MI 1340 Ontonagon 53 0.181 Highest 1943 2010 68
04040500 Sturgeon River near Sidnaw, MI 171 Portage 55 0.153 Upper Middle 1944 2010 67
04041500 Sturgeon River near Alston, MI 346 Portage 55 0.123 Upper Middle decrease <0.01 1933 1963 2011 49
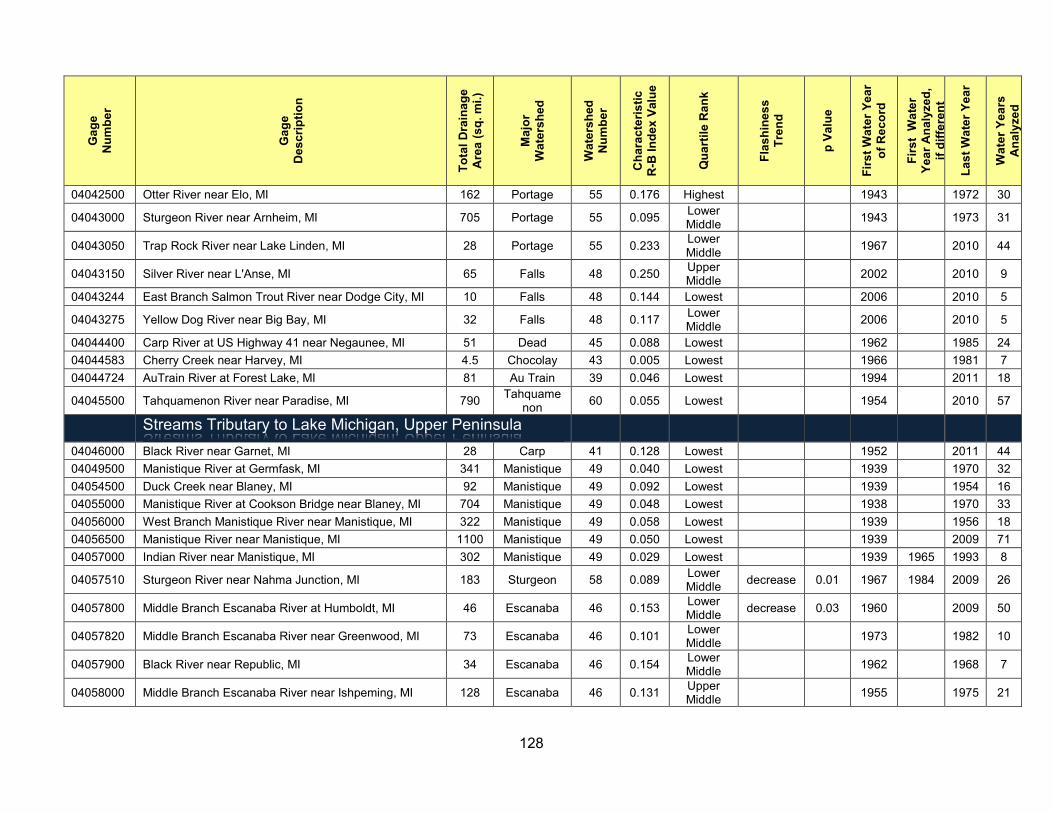
128
Gag
e N
umbe
r
Gag
e
Des
crip
tion
Tota
l Dra
inag
e A
rea
(sq.
mi.)
Maj
or
Wat
ersh
ed
Wat
ersh
ed
Num
ber
Cha
ract
eris
tic
R-B
Inde
x Va
lue
Qua
rtile
Ran
k
Flas
hine
ss
Tren
d
p Va
lue
Firs
t Wat
er Y
ear
of R
ecor
d
Firs
t W
ater
Ye
ar A
naly
zed,
if
diffe
rent
Last
Wat
er Y
ear
Wat
er Y
ears
A
naly
zed
04042500 Otter River near Elo, MI 162 Portage 55 0.176 Highest 1943 1972 30
04043000 Sturgeon River near Arnheim, MI 705 Portage 55 0.095 Lower Middle 1943 1973 31
04043050 Trap Rock River near Lake Linden, MI 28 Portage 55 0.233 Lower Middle 1967 2010 44
04043150 Silver River near L'Anse, MI 65 Falls 48 0.250 Upper Middle 2002 2010 9
04043244 East Branch Salmon Trout River near Dodge City, MI 10 Falls 48 0.144 Lowest 2006 2010 5
04043275 Yellow Dog River near Big Bay, MI 32 Falls 48 0.117 Lower Middle 2006 2010 5
04044400 Carp River at US Highway 41 near Negaunee, MI 51 Dead 45 0.088 Lowest 1962 1985 24 04044583 Cherry Creek near Harvey, MI 4.5 Chocolay 43 0.005 Lowest 1966 1981 7 04044724 AuTrain River at Forest Lake, MI 81 Au Train 39 0.046 Lowest 1994 2011 18
04045500 Tahquamenon River near Paradise, MI 790 Tahquamenon 60 0.055 Lowest 1954 2010 57
Streams Tributary to Lake Michigan, Upper Peninsula
04046000 Black River near Garnet, MI 28 Carp 41 0.128 Lowest 1952 2011 44 04049500 Manistique River at Germfask, MI 341 Manistique 49 0.040 Lowest 1939 1970 32 04054500 Duck Creek near Blaney, MI 92 Manistique 49 0.092 Lowest 1939 1954 16 04055000 Manistique River at Cookson Bridge near Blaney, MI 704 Manistique 49 0.048 Lowest 1938 1970 33 04056000 West Branch Manistique River near Manistique, MI 322 Manistique 49 0.058 Lowest 1939 1956 18 04056500 Manistique River near Manistique, MI 1100 Manistique 49 0.050 Lowest 1939 2009 71 04057000 Indian River near Manistique, MI 302 Manistique 49 0.029 Lowest 1939 1965 1993 8
04057510 Sturgeon River near Nahma Junction, MI 183 Sturgeon 58 0.089 Lower Middle decrease 0.01 1967 1984 2009 26
04057800 Middle Branch Escanaba River at Humboldt, MI 46 Escanaba 46 0.153 Lower Middle decrease 0.03 1960 2009 50
04057820 Middle Branch Escanaba River near Greenwood, MI 73 Escanaba 46 0.101 Lower Middle 1973 1982 10
04057900 Black River near Republic, MI 34 Escanaba 46 0.154 Lower Middle 1962 1968 7
04058000 Middle Branch Escanaba River near Ishpeming, MI 128 Escanaba 46 0.131 Upper Middle 1955 1975 21
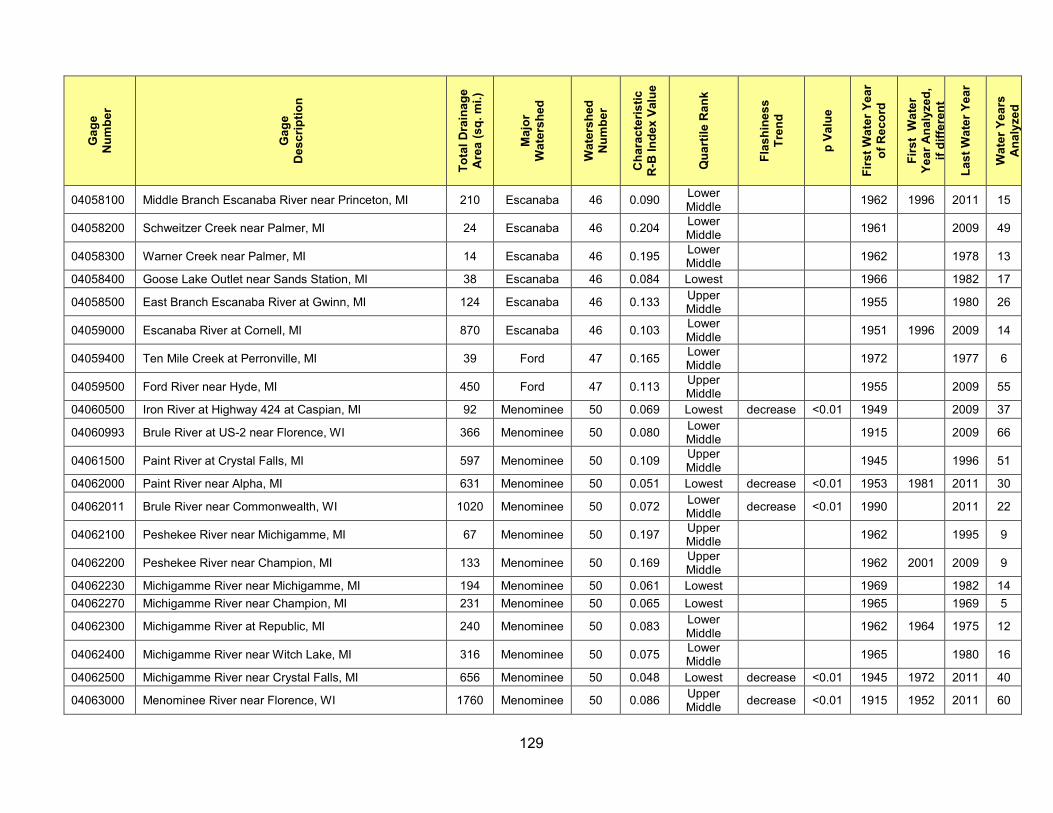
129
Gag
e N
umbe
r
Gag
e
Des
crip
tion
Tota
l Dra
inag
e A
rea
(sq.
mi.)
Maj
or
Wat
ersh
ed
Wat
ersh
ed
Num
ber
Cha
ract
eris
tic
R-B
Inde
x Va
lue
Qua
rtile
Ran
k
Flas
hine
ss
Tren
d
p Va
lue
Firs
t Wat
er Y
ear
of R
ecor
d
Firs
t W
ater
Ye
ar A
naly
zed,
if
diffe
rent
Last
Wat
er Y
ear
Wat
er Y
ears
A
naly
zed
04058100 Middle Branch Escanaba River near Princeton, MI 210 Escanaba 46 0.090 Lower Middle 1962 1996 2011 15
04058200 Schweitzer Creek near Palmer, MI 24 Escanaba 46 0.204 Lower Middle 1961 2009 49
04058300 Warner Creek near Palmer, MI 14 Escanaba 46 0.195 Lower Middle 1962 1978 13
04058400 Goose Lake Outlet near Sands Station, MI 38 Escanaba 46 0.084 Lowest 1966 1982 17
04058500 East Branch Escanaba River at Gwinn, MI 124 Escanaba 46 0.133 Upper Middle 1955 1980 26
04059000 Escanaba River at Cornell, MI 870 Escanaba 46 0.103 Lower Middle 1951 1996 2009 14
04059400 Ten Mile Creek at Perronville, MI 39 Ford 47 0.165 Lower Middle 1972 1977 6
04059500 Ford River near Hyde, MI 450 Ford 47 0.113 Upper Middle 1955 2009 55
04060500 Iron River at Highway 424 at Caspian, MI 92 Menominee 50 0.069 Lowest decrease <0.01 1949 2009 37
04060993 Brule River at US-2 near Florence, WI 366 Menominee 50 0.080 Lower Middle 1915 2009 66
04061500 Paint River at Crystal Falls, MI 597 Menominee 50 0.109 Upper Middle 1945 1996 51
04062000 Paint River near Alpha, MI 631 Menominee 50 0.051 Lowest decrease <0.01 1953 1981 2011 30
04062011 Brule River near Commonwealth, WI 1020 Menominee 50 0.072 Lower Middle decrease <0.01 1990 2011 22
04062100 Peshekee River near Michigamme, MI 67 Menominee 50 0.197 Upper Middle 1962 1995 9
04062200 Peshekee River near Champion, MI 133 Menominee 50 0.169 Upper Middle 1962 2001 2009 9
04062230 Michigamme River near Michigamme, MI 194 Menominee 50 0.061 Lowest 1969 1982 14 04062270 Michigamme River near Champion, MI 231 Menominee 50 0.065 Lowest 1965 1969 5
04062300 Michigamme River at Republic, MI 240 Menominee 50 0.083 Lower Middle 1962 1964 1975 12
04062400 Michigamme River near Witch Lake, MI 316 Menominee 50 0.075 Lower Middle 1965 1980 16
04062500 Michigamme River near Crystal Falls, MI 656 Menominee 50 0.048 Lowest decrease <0.01 1945 1972 2011 40
04063000 Menominee River near Florence, WI 1760 Menominee 50 0.086 Upper Middle decrease <0.01 1915 1952 2011 60

130
Gag
e N
umbe
r
Gag
e
Des
crip
tion
Tota
l Dra
inag
e A
rea
(sq.
mi.)
Maj
or
Wat
ersh
ed
Wat
ersh
ed
Num
ber
Cha
ract
eris
tic
R-B
Inde
x Va
lue
Qua
rtile
Ran
k
Flas
hine
ss
Tren
d
p Va
lue
Firs
t Wat
er Y
ear
of R
ecor
d
Firs
t W
ater
Ye
ar A
naly
zed,
if
diffe
rent
Last
Wat
er Y
ear
Wat
er Y
ears
A
naly
zed
04063500 Menominee River at Twin Falls near Iron Mt, MI 1800 Menominee 50 0.076 Lower Middle decrease <0.01 1915 1963 2011 49
04063700 Popple River near Fence, WI 139 Menominee 50 0.098 Lower Middle 1964 2011 47
04064000 Pine River near Florence, WI 510 Menominee 50 0.067 Lowest 1914 1923 10
04064500 Pine River below Pine River Powerplant near Florence, WI 533 Menominee 50 0.106 Upper
Middle 1924 1997 2011 14
04065106 Menominee River at Niagara, WI 2470 Menominee 50 0.069 Lower Middle decrease <0.01 1993 2011 19
04065300 West Branch Sturgeon River near Randville, MI 56 Menominee 50 0.183 Upper Middle 1959 1981 23
04065393 East Branch Sturgeon River below Skunk Creek near Felch, MI 62 Menominee 50 0.137 Lower
Middle 1974 1984 11
04065397 East Branch Sturgeon River at Hardwood, MI 91 Menominee 50 0.093 Lowest 1978 1983 6
04065500 Sturgeon River near Foster City, MI 237 Menominee 50 0.109 Upper Middle 1955 1980 26
04065600 Pine Creek near Iron Mountain, MI 17 Menominee 50 0.156 Lowest 1972 1961 10
04065722 Menominee River near Vulcan, MI 2900 Menominee 50 0.089 Upper Middle 1989 2011 23
04066003 Menominee River below Pemene Creek near Pembine, WI 3140 Menominee 50 0.080 Upper
Middle decrease <0.01 1950 2011 61
04066030 Menominee River at White Rapids Dam near Banat, MI 3190 Menominee 50 0.102 Highest 1999 2011 13
04066500 Pike River at Amberg, WI 255 Menominee 50 0.090 Lower Middle 1915 2011 66
04066800 Menominee River at Koss, MI 3700 Menominee 50 0.090 Upper Middle 1914 1999 2011 12
04067500 Menominee River near McAllister, WI 3930 Menominee 50 0.081 Upper Middle decrease 0.01 1946 1980 2011 24
Streams Tributary to Lake Michigan, Southern Lower Peninsula
04096015 Galien River near Sawyer, MI 81 St. Joseph 34 0.304 Highest 1996 2010 15
04096100 Galena River near Laporte, IN 17 St. Joseph 34 0.229 Lower Middle 1970 2003 34
04096272 Beebe Creek at Moore Road near Hillsdale, MI 42 St. Joseph 34 0.173 Lower Middle 1975 1980 6
04096405 St. Joseph River at Burlington, MI 206 St. Joseph 34 0.063 Lowest 1963 2011 49

131
Gag
e N
umbe
r
Gag
e
Des
crip
tion
Tota
l Dra
inag
e A
rea
(sq.
mi.)
Maj
or
Wat
ersh
ed
Wat
ersh
ed
Num
ber
Cha
ract
eris
tic
R-B
Inde
x Va
lue
Qua
rtile
Ran
k
Flas
hine
ss
Tren
d
p Va
lue
Firs
t Wat
er Y
ear
of R
ecor
d
Firs
t W
ater
Ye
ar A
naly
zed,
if
diffe
rent
Last
Wat
er Y
ear
Wat
er Y
ears
A
naly
zed
04096500 Sauk River at Jay Street at Coldwater, MI 60 St. Joseph 34 0.100 Lowest 1938 1962 25
04096515 South Branch Hog Creek near Allen, MI 49 St. Joseph 34 0.141 Lower Middle increase <0.01 1970 2010 42
04096600 Coldwater River near Hodunk, MI 293 St. Joseph 34 0.078 Lower Middle 1963 1989 27
04096900 Nottawa Creek near Athens, MI 162 St. Joseph 34 0.084 Lower Middle increase 0.02 1967 1997 31
04097170 Portage River at W Avenue near Vicksburg, MI 68 St. Joseph 34 0.047 Lowest 1947 1965 1979 15 04097200 Gourdneck Creek near Schoolcraft, MI 7.3 St. Joseph 34 0.094 Lowest 1965 1972 8
04097500 St. Joseph River at Three Rivers, MI 1350 St. Joseph 34 0.062 Lower Middle decrease 0.01 1954 2011 49
04097540 Prairie River near Nottawa, MI 106 St. Joseph 34 0.056 Lowest 1963 2010 48 04097970 Lime Lake Outlet at Panama, IN 18 St. Joseph 34 0.062 Lowest 1970 1986 17 04098500 Fawn River near White Pigeon, MI 192 St. Joseph 34 0.051 Lowest 1958 1975 18 04099000 St. Joseph River at Mottville, MI 1866 St. Joseph 34 0.050 Lowest decrease <0.01 1925 2011 87
04099510 Pigeon Creek near Angola, IN 106 St. Joseph 34 0.079 Lower Middle decrease 0.04 1946 1996 2011 16
04099610 Pretty Lake Inlet near Stroh, IN 2.0 St. Joseph 34 0.281 Lower Middle 1964 1981 18
04099750 Pigeon River near Scott, IN 307 St. Joseph 34 0.068 Lower Middle increase <0.01 1969 2011 43
04099808 Little Elkhart River at Middlebury, IN 92 St. Joseph 34 0.154 Lower Middle 1980 2003 24
04099850 Pine Creek near Elkhart, IN 31 St. Joseph 34 0.200 Upper Middle 1980 2003 24
04100222 North Branch Elkhart River at Cosperville, IN 142 St. Joseph 34 0.053 Lowest decrease 0.05 1972 2011 40
04100252 Forker Creek near Burr Oak, IN 19 St. Joseph 34 0.198 Lower Middle increase 0.04 1970 2003 34
04100295 Rimmell Branch near Albion, IN 11 St. Joseph 34 0.446 Upper Middle 1981 2001 21
04100377 Solomon Creek near Syracuse, IN 36 St. Joseph 34 0.108 Lower Middle increase 0.02 1988 2003 16
04100465 Turkey Creek at Syracuse, IN 44 St. Joseph 34 0.065 Lowest 1970 1987 18
04100500 Elkhart River at Goshen, IN 594 St. Joseph 34 0.102 Lower Middle 1932 1955 2011 57
04101000 St. Joseph River at Elkhart, IN 3370 St. Joseph 34 0.051 Lowest decrease <0.01 1948 2011 64

132
Gag
e N
umbe
r
Gag
e
Des
crip
tion
Tota
l Dra
inag
e A
rea
(sq.
mi.)
Maj
or
Wat
ersh
ed
Wat
ersh
ed
Num
ber
Cha
ract
eris
tic
R-B
Inde
x Va
lue
Qua
rtile
Ran
k
Flas
hine
ss
Tren
d
p Va
lue
Firs
t Wat
er Y
ear
of R
ecor
d
Firs
t W
ater
Ye
ar A
naly
zed,
if
diffe
rent
Last
Wat
er Y
ear
Wat
er Y
ears
A
naly
zed
04101370 Juday Creek near South Bend, IN 38 St. Joseph 34 0.093 Lowest 1993 2010 18 04101500 St. Joseph River at Niles, MI 3666 St. Joseph 34 0.059 Lowest decrease <0.01 1931 2011 80
04101800 Dowagiac River at Sumnerville, MI 255 St. Joseph 34 0.092 Lower Middle increase <0.01 1961 1973 2011 39
04102000 St. Joseph River at Berrien Springs, MI 4081 St. Joseph 34 0.085 Upper Middle 1902 1956 10
04102500 Paw Paw River at Riverside, MI 390 St. Joseph 34 0.070 Lower Middle increase <0.01 1952 1971 2011 41
04102700 South Branch Black River near Bangor, MI 84 Black 7 0.191 Upper Middle increase 0.01 1967 2011 45
04102776 Middle Branch Black River near South Haven, MI 83 Black 7 0.129 Lower Middle 1995 2010 16
04102850 South Branch Kalamazoo River near Albion, MI 146 Kalamazoo 17 0.052 Lowest 1972 1976 5 04103010 Kalamazoo River near Marengo, MI 267 Kalamazoo 17 0.063 Lowest 1987 2011 25
04103500 Kalamazoo River at Marshall, MI 449 Kalamazoo 17 0.074 Lower Middle 1949 2002 2011 10
04104945 Wanadoga Creek near Battle Creek, MI 48 Kalamazoo 17 0.198 Upper Middle increase 0.01 1995 2011 17
04105000 Battle Creek at Battle Creek, MI 241 Kalamazoo 17 0.126 Upper Middle increase <0.01 1935 1962 2011 50
04105500 Kalamazoo River near Battle Creek, MI 824 Kalamazoo 17 0.089 Lower Middle increase 0.01 1937 1994 2011 18
04105700 Augusta Creek near Augusta, MI 39 Kalamazoo 17 0.105 Lower Middle increase <0.01 1965 1972 2011 40
04105800 Gull Creek at 37th Street near Galesburg, MI 38 Kalamazoo 17 0.060 Lowest 1965 1972 8
04106000 Kalamazoo River at Comstock, MI 1010 Kalamazoo 17 0.077 Lower Middle decrease 0.02 1933 2011 74
04106180 Portage Creek at Portage, MI 17 Kalamazoo 17 0.091 Lowest increase 0.01 1983 2006 24 04106300 Portage Creek near Kalamazoo, MI 22 Kalamazoo 17 0.109 Lowest 1965 1988 2008 21 04106320 West Fork Portage Creek near Oshtemo, MI 13 Kalamazoo 17 0.098 Lowest increase <0.01 1973 1996 24 04106400 West Fork Portage Creek at Kalamazoo, MI 19 Kalamazoo 17 0.088 Lowest 1960 1995 2011 17
04106500 Portage Creek at Kalamazoo, MI 47 Kalamazoo 17 0.121 Lower Middle increase 0.01 1948 1986 22
04108500 Kalamazoo River near Fennville, MI 1600 Kalamazoo 17 0.108 Highest 1930 1993 63
04108600 Rabbit River near Hopkins, MI 71 Kalamazoo 17 0.269 Upper Middle increase <0.01 1966 2011 46

133
Gag
e N
umbe
r
Gag
e
Des
crip
tion
Tota
l Dra
inag
e A
rea
(sq.
mi.)
Maj
or
Wat
ersh
ed
Wat
ersh
ed
Num
ber
Cha
ract
eris
tic
R-B
Inde
x Va
lue
Qua
rtile
Ran
k
Flas
hine
ss
Tren
d
p Va
lue
Firs
t Wat
er Y
ear
of R
ecor
d
Firs
t W
ater
Ye
ar A
naly
zed,
if
diffe
rent
Last
Wat
er Y
ear
Wat
er Y
ears
A
naly
zed
04108670 Kalamazoo River near New Richmond, MI 1994 Kalamazoo 17 0.071 Lower Middle 1995 2010 9
04108800 Macatawa River near Zeeland, MI 66 Macatawa 8 0.571 Highest 1961 2011 51
04109000 Grand River at Jackson, MI 174 Grand 14 0.095 Lower Middle 1936 2011 21
04109500 Portage River at Portage Lake Road near Munith, MI 55 Grand 14 0.101 Lowest 1945 1956 12
04110000 Orchard Creek at State Highway 106 at Munith, MI 49 Grand 14 0.226 Upper Middle 1945 1956 12
04111000 Grand River at Eaton Rapids, MI 661 Grand 14 0.087 Lower Middle 1951 1996 2011 16
04111379 Red Cedar River near Williamston, MI 163 Grand 14 0.174 Highest increase 0.04 1976 2011 9
04111500 Deer Creek near Dansville, MI 16 Grand 14 0.370 Upper Middle 1954 2011 58
04112000 Sloan Creek near Williamston, MI 9.3 Grand 14 0.460 Upper Middle 1955 2011 56
04112500 Red Cedar River at East Lansing, MI 355 Grand 14 0.175 Highest increase 0.02 1932 1988 2011 24
04112850 Sycamore Creek at Holt Road near Holt, MI 81 Grand 14 0.229 Upper Middle 1976 1997 9
04113000 Grand River at Lansing, MI 1230 Grand 14 0.127 Highest 1901 1965 2011 47
04113097 Carrier Creek near Lansing, MI 12 Grand 14 0.451 Upper Middle 1976 1980 5
04114000 Grand River at Portland, MI 1385 Grand 14 0.122 Highest 1953 2011 52
04114498 Looking Glass River near Eagle, MI 280 Grand 14 0.100 Lower Middle 1945 2011 62
04115000 Maple River at Maple Rapids, MI 434 Grand 14 0.114 Upper Middle 1945 2011 68
04115265 Fish Creek near Crystal, MI 40 Grand 14 0.180 Upper Middle 1988 2011 24
04116000 Grand River at Ionia, MI 2840 Grand 14 0.098 Upper Middle decrease <0.01 1952 2011 60
04116500 Flat River at Smyrna, MI 528 Grand 14 0.066 Lowest decrease <0.01 1951 1986 36
04117000 Quaker Brook near Nashville, MI 7.6 Grand 14 0.301 Upper Middle 1955 2011 38
04117500 Thornapple River near Hastings, MI 385 Grand 14 0.112 Upper Middle 1945 1978 2011 34

134
Gag
e N
umbe
r
Gag
e
Des
crip
tion
Tota
l Dra
inag
e A
rea
(sq.
mi.)
Maj
or
Wat
ersh
ed
Wat
ersh
ed
Num
ber
Cha
ract
eris
tic
R-B
Inde
x Va
lue
Qua
rtile
Ran
k
Flas
hine
ss
Tren
d
p Va
lue
Firs
t Wat
er Y
ear
of R
ecor
d
Firs
t W
ater
Ye
ar A
naly
zed,
if
diffe
rent
Last
Wat
er Y
ear
Wat
er Y
ears
A
naly
zed
04118000 Thornapple River near Caledonia, MI 773 Grand 14 0.110 Upper Middle increase <0.01 1952 1971 1994 22
04118500 Rogue River near Rockford, MI 234 Grand 14 0.104 Lower Middle 1953 2011 54
04119000 Grand River at Grand Rapids, MI 4900 Grand 14 0.074 Lower Middle 1902 1989 2011 23
Streams Tributary to Lake Michigan, Northern Lower Peninsula
04121000 Muskegon River near Merritt, MI 355 Muskegon 22 0.040 Lowest 1947 1973 27
04121300 Clam River at Vogel Center, MI 243 Muskegon 22 0.079 Lower Middle 1967 2011 45
04121500 Muskegon River at Evart, MI 1433 Muskegon 22 0.057 Lowest 1935 1960 2011 52
04121900 Little Muskegon River near Morley, MI 121 Muskegon 22 0.109 Upper Middle 1967 1979 1996 18
04121944 Little Muskegon River near Oak Grove, MI 345 Muskegon 22 0.108 Upper Middle increase 0.05 1996 2011 16
04121970 Muskegon River near Croton, MI 2313 Muskegon 22 0.077 Lower Middle increase 0.01 1996 2011 16
04122000 Muskegon River at Newaygo, MI 2350 Muskegon 22 0.098 Upper Middle decrease 0.01 1910 1993 71
04122100 Bear Creek near Muskegon, MI 17 Muskegon 22 0.172 Lower Middle decrease <0.01 1966 2011 46
04122200 White River near Whitehall, MI 406 White 37 0.066 Lowest 1958 2011 54
04122500 Pere Marquette River at Scottville, MI 681 Pere Marquette 25 0.055 Lowest increase <0.01 1940 2011 74
04123000 Big Sable River near Freesoil, MI 127 Big Sable 5 0.037 Lowest 1943 1972 30 04123500 Manistee River near Grayling, MI 123 Manistee 20 0.026 Lowest 1943 1973 31 04124000 Manistee River near Sherman, MI 857 Manistee 20 0.041 Lowest increase <0.01 1903 2011 90 04124200 Manistee River near Mesick, MI 1018 Manistee 20 0.047 Lowest 1998 2011 14
04124500 East Branch Pine River near Tustin, MI 60 Manistee 20 0.195 Upper Middle 1953 2011 31
04125000 Pine River near Leroy, MI 128 Manistee 20 0.114 Upper Middle 1953 1963 11
04125460 Pine River at High School Bridge, near Hoxeyville, MI 245 Manistee 20 0.066 Lowest 1953 2011 45 04125550 Manistee River near Wellston, MI 1451 Manistee 20 0.050 Lowest 1997 2011 15

135
Gag
e N
umbe
r
Gag
e
Des
crip
tion
Tota
l Dra
inag
e A
rea
(sq.
mi.)
Maj
or
Wat
ersh
ed
Wat
ersh
ed
Num
ber
Cha
ract
eris
tic
R-B
Inde
x Va
lue
Qua
rtile
Ran
k
Flas
hine
ss
Tren
d
p Va
lue
Firs
t Wat
er Y
ear
of R
ecor
d
Firs
t W
ater
Ye
ar A
naly
zed,
if
diffe
rent
Last
Wat
er Y
ear
Wat
er Y
ears
A
naly
zed
04126000 Manistee River near Manistee, MI 1677 Manistee 20 0.066 Lower Middle decrease <0.01 1952 1983 1993 11
04126200 Little Manistee River near Freesoil, MI 178 Manistee 20 0.037 Lowest 1957 1975 19 04126740 Platte River at Honor, MI 125 Platte 28 0.039 Lowest 1991 2011 21
04126970 Boardman River above Brown Bridge Road, near Mayfield, MI 141 Boardman 9 0.040 Lowest 1988 2011 14
04127000 Boardman River near Mayfield, MI 182 Boardman 9 0.091 Lower Middle 1953 1989 37
04127800 Jordan River near East Jordan, MI 68 Pine 10 0.055 Lowest decrease 0.01 1967 1984 2011 28 Streams Tributary to Lake Huron
04127918 Pine River near Rudyard, MI 184 Pine 54 0.184 Highest 1973 2010 38
04127997 Sturgeon River at Wolverine, MI 192 Cheboygan 11 0.079 Lower Middle 1943 1973 2011 39
04128990 Pigeon River at Sturgeon Valley Road near Vanderbilt, MI 58 Cheboygan 11 0.158 Lower
Middle increase <0.01 1951 2011 61
04129500 Pigeon River at Afton, MI 139 Cheboygan 11 0.094 Lower Middle 1942 1946 1981 36
04130000 Cheboygan River near Cheboygan, MI 889 Cheboygan 11 0.036 Lowest <0.01 1943 1982 40
04130500 Black River near Tower, MI 311 Cheboygan 11 0.105 Lower Middle decrease <0.01 1943 1955 2000 45
04131000 Rainy River near Onaway, MI 79 Cheboygan 11 0.114 Lower Middle 1943 1952 10
04131500 Rainy River near Ocqueoc, MI 88 Cheboygan 11 0.134 Lower Middle 1953 1979 27
04132000 Black River near Cheboygan, MI 597 Cheboygan 11 0.063 Lowest 1944 1974 31
04132500 Thunder Bay River near Hillman, MI 232 Thunder Bay 36 0.077 Lower
Middle 1946 1957 1972 16
04133501 Thunder Bay River at Herron Road near Bolton, MI 586 Thunder Bay 36 0.086 Lower
Middle 1946 2003 2011 9
04134000 North Branch Thunder Bay River near Bolton, MI 184 Thunder Bay 36 0.144 Upper
Middle 1946 1980 35
04135000 Thunder Bay River near Alpena, MI 1238 Thunder Bay 36 0.188 Highest 1902 1993 21
04135500 Au Sable River at Grayling, MI 110 Au Sable 2 0.052 Lowest increase <0.01 1956 1993 51 04135600 East Branch Au Sable River at Grayling, MI 76 Au Sable 2 0.048 Lowest 1958 1984 28

136
Gag
e N
umbe
r
Gag
e
Des
crip
tion
Tota
l Dra
inag
e A
rea
(sq.
mi.)
Maj
or
Wat
ersh
ed
Wat
ersh
ed
Num
ber
Cha
ract
eris
tic
R-B
Inde
x Va
lue
Qua
rtile
Ran
k
Flas
hine
ss
Tren
d
p Va
lue
Firs
t Wat
er Y
ear
of R
ecor
d
Firs
t W
ater
Ye
ar A
naly
zed,
if
diffe
rent
Last
Wat
er Y
ear
Wat
er Y
ears
A
naly
zed
04135700 South Branch Au Sable River near Luzerne, MI 401 Au Sable 2 0.047 Lowest increase 0.02 1967 2011 44 04136000 Au Sable River near Red Oak, MI 1108 Au Sable 2 0.050 Lowest increase 0.05 1909 2011 22 04136500 Au Sable River at Mio, MI 1361 Au Sable 2 0.057 Lowest 1953 1980 2011 32 04136900 Au Sable River near McKinley, MI 1513 Au Sable 2 0.049 Lowest 1997 2011 15
04137005 Au Sable River near Curtisville, MI 1598 Au Sable 2 0.061 Lower Middle increase 0.03 1997 2011 15
04137500 Au Sable River near Au Sable, MI 1739 Au Sable 2 0.079 Upper Middle 1988 2001 2011 11
04138000 East Branch Au Gres River at McIvor, MI 84 Au Gres 1 0.137 Lower Middle 1951 1973 23
04138500 Au Gres River at Cox Road near National City, MI 154 Au Gres 1 0.223 Highest 1951 1981 31 04139000 Houghton Creek near Lupton, MI 30 Rifle 30 0.126 Lowest 1951 1972 22
04139500 Rifle River at "The Ranch" near Lupton, MI 57 Rifle 30 0.101 Lower Middle 1951 1971 21
04140000 Prior Creek near Selkirk, MI 21 Rifle 30 0.237 Lower Middle 1951 1972 22
04140500 Rifle River at State Road at Selkirk, MI 117 Rifle 30 0.108 Upper Middle 1951 1982 32
04141000 South Branch Shepards Creek near Selkirk, MI 1.2 Rifle 30 0.627 Highest 1952 1978 27
04141500 West Branch Rifle River near Selkirk, MI 51 Rifle 30 0.184 Upper Middle 1952 1963 12
04142000 Rifle River near Sterling, MI 320 Rifle 30 0.155 Highest 1938 1991 2011 21 04143500 North Branch Kawkawlin River near Kawkawlin, MI 101 Kawkawlin 18 0.197 Highest 1952 1962 1982 21 04143900 Shiawassee River at Linden, MI 84 Saginaw 32 0.070 Lowest 1968 2003 29
04144000 Shiawassee River at Byron, MI 365 Saginaw 32 0.096 Lower Middle 1948 1967 1983 17
04144500 Shiawassee River at Owosso, MI 538 Saginaw 32 0.134 Upper Middle 1932 1988 2011 24
04145000 Shiawassee River near Fergus, MI 637 Saginaw 32 0.141 Upper Middle 1941 2011 60
04145500 Bad River at Hemlock Road near Brant, MI 89 Saginaw 32 0.422 Highest 1950 1959 10
04146000 Farmers Creek near Lapeer, MI 55 Saginaw 32 0.130 Lower Middle 1934 2011 34
04146063 South Branch Flint River near Columbiaville, MI 221 Saginaw 32 0.134 Upper Middle 1981 2011 31
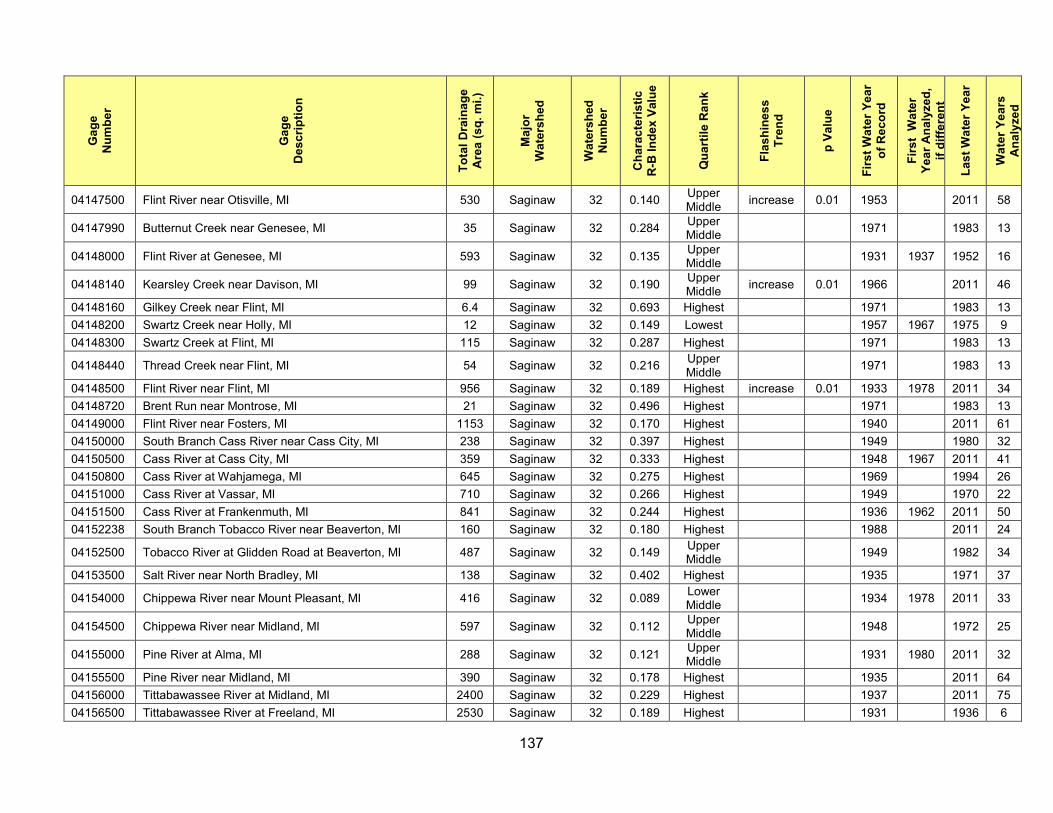
137
Gag
e N
umbe
r
Gag
e
Des
crip
tion
Tota
l Dra
inag
e A
rea
(sq.
mi.)
Maj
or
Wat
ersh
ed
Wat
ersh
ed
Num
ber
Cha
ract
eris
tic
R-B
Inde
x Va
lue
Qua
rtile
Ran
k
Flas
hine
ss
Tren
d
p Va
lue
Firs
t Wat
er Y
ear
of R
ecor
d
Firs
t W
ater
Ye
ar A
naly
zed,
if
diffe
rent
Last
Wat
er Y
ear
Wat
er Y
ears
A
naly
zed
04147500 Flint River near Otisville, MI 530 Saginaw 32 0.140 Upper Middle increase 0.01 1953 2011 58
04147990 Butternut Creek near Genesee, MI 35 Saginaw 32 0.284 Upper Middle 1971 1983 13
04148000 Flint River at Genesee, MI 593 Saginaw 32 0.135 Upper Middle 1931 1937 1952 16
04148140 Kearsley Creek near Davison, MI 99 Saginaw 32 0.190 Upper Middle increase 0.01 1966 2011 46
04148160 Gilkey Creek near Flint, MI 6.4 Saginaw 32 0.693 Highest 1971 1983 13 04148200 Swartz Creek near Holly, MI 12 Saginaw 32 0.149 Lowest 1957 1967 1975 9 04148300 Swartz Creek at Flint, MI 115 Saginaw 32 0.287 Highest 1971 1983 13
04148440 Thread Creek near Flint, MI 54 Saginaw 32 0.216 Upper Middle 1971 1983 13
04148500 Flint River near Flint, MI 956 Saginaw 32 0.189 Highest increase 0.01 1933 1978 2011 34 04148720 Brent Run near Montrose, MI 21 Saginaw 32 0.496 Highest 1971 1983 13 04149000 Flint River near Fosters, MI 1153 Saginaw 32 0.170 Highest 1940 2011 61 04150000 South Branch Cass River near Cass City, MI 238 Saginaw 32 0.397 Highest 1949 1980 32 04150500 Cass River at Cass City, MI 359 Saginaw 32 0.333 Highest 1948 1967 2011 41 04150800 Cass River at Wahjamega, MI 645 Saginaw 32 0.275 Highest 1969 1994 26 04151000 Cass River at Vassar, MI 710 Saginaw 32 0.266 Highest 1949 1970 22 04151500 Cass River at Frankenmuth, MI 841 Saginaw 32 0.244 Highest 1936 1962 2011 50 04152238 South Branch Tobacco River near Beaverton, MI 160 Saginaw 32 0.180 Highest 1988 2011 24
04152500 Tobacco River at Glidden Road at Beaverton, MI 487 Saginaw 32 0.149 Upper Middle 1949 1982 34
04153500 Salt River near North Bradley, MI 138 Saginaw 32 0.402 Highest 1935 1971 37
04154000 Chippewa River near Mount Pleasant, MI 416 Saginaw 32 0.089 Lower Middle 1934 1978 2011 33
04154500 Chippewa River near Midland, MI 597 Saginaw 32 0.112 Upper Middle 1948 1972 25
04155000 Pine River at Alma, MI 288 Saginaw 32 0.121 Upper Middle 1931 1980 2011 32
04155500 Pine River near Midland, MI 390 Saginaw 32 0.178 Highest 1935 2011 64 04156000 Tittabawassee River at Midland, MI 2400 Saginaw 32 0.229 Highest 1937 2011 75 04156500 Tittabawassee River at Freeland, MI 2530 Saginaw 32 0.189 Highest 1931 1936 6

138
Gag
e N
umbe
r
Gag
e
Des
crip
tion
Tota
l Dra
inag
e A
rea
(sq.
mi.)
Maj
or
Wat
ersh
ed
Wat
ersh
ed
Num
ber
Cha
ract
eris
tic
R-B
Inde
x Va
lue
Qua
rtile
Ran
k
Flas
hine
ss
Tren
d
p Va
lue
Firs
t Wat
er Y
ear
of R
ecor
d
Firs
t W
ater
Ye
ar A
naly
zed,
if
diffe
rent
Last
Wat
er Y
ear
Wat
er Y
ears
A
naly
zed
04157500 Sebewaing River State Drain near Sebewaing, MI 67 Sebewaing 33 0.630 Highest 1940 1954 15 04158000 Columbia Drain at Gettel Road near Sebewaing, MI 34 Sebewaing 33 0.638 Highest 1941 1990 16 04158500 Pigeon River near Owendale, MI 53 Pigeon 26 0.390 Highest 1953 1982 21 04159010 Pigeon River near Caseville, MI 125 Pigeon 26 0.375 Highest 1987 1993 7 Streams Tributary to St. Clair River
04159492 Black River near Jeddo, MI 464 Black 6 0.429 Highest 1945 2011 17 04159500 Black River near Fargo, MI 480 Black 6 0.335 Highest 1945 1963 1991 29 04159900 Mill Creek near Avoca, MI 169 Black 6 0.279 Highest 1964 1988 2011 24 04160000 Mill Creek near Abbottsford, MI 208 Black 6 0.200 Highest 1948 1964 17 04160050 Black River near Port Huron, MI 684 Black 6 0.323 Highest 1933 1943 11
04160570 North Branch Belle River at Imlay City, MI 18 Belle 3 0.294 Lower Middle 1966 2001 36
04160600 Belle River at Memphis, MI 151 Belle 3 0.338 Highest increase <0.01 1963 2011 49 Streams Tributary to Lake St. Clair
04160800 Sashabaw Creek near Drayton Plains, MI 21 Clinton 12 0.136 Lowest 1960 2009 50 04160900 Clinton River near Drayton Plains, MI 79 Clinton 12 0.079 Lowest 1960 1981 2009 29
04161000 Clinton River at Auburn Heights, MI 123 Clinton 12 0.164 Upper Middle 1936 2002 2011 8
04161100 Galloway Creek near Auburn Heights, MI 18 Clinton 12 0.419 Upper Middle increase <0.01 1960 1972 1991 20
04161500 Paint Creek near Lake Orion, MI 39 Clinton 12 0.094 Lowest decrease 0.02 1956 1966 1991 13
04161540 Paint Creek at Rochester, MI 71 Clinton 12 0.209 Upper Middle increase <0.01 1960 2011 52
04161580 Stony Creek near Romeo, MI 26 Clinton 12 0.195 Lower Middle increase 0.01 1965 1984 2011 28
04161800 Stony Creek near Washington, MI 68 Clinton 12 0.130 Lower Middle 1959 2011 53
04161820 Clinton River at Sterling Heights, MI 309 Clinton 12 0.201 Highest 1979 1997 2011 11 04162010 Red Run near Warren, MI 34 Clinton 12 1.009 Highest 1980 1988 9 04162900 Big Beaver Creek near Warren, MI 24 Clinton 12 0.957 Highest 1959 1982 1988 7 04163400 Plum Brook at Utica, MI 17 Clinton 12 0.546 Highest 1966 2011 44

139
Gag
e N
umbe
r
Gag
e
Des
crip
tion
Tota
l Dra
inag
e A
rea
(sq.
mi.)
Maj
or
Wat
ersh
ed
Wat
ersh
ed
Num
ber
Cha
ract
eris
tic
R-B
Inde
x Va
lue
Qua
rtile
Ran
k
Flas
hine
ss
Tren
d
p Va
lue
Firs
t Wat
er Y
ear
of R
ecor
d
Firs
t W
ater
Ye
ar A
naly
zed,
if
diffe
rent
Last
Wat
er Y
ear
Wat
er Y
ears
A
naly
zed
04163500 Plum Brook near Utica, MI 23 Clinton 12 0.419 Upper Middle 1955 1966 12
04164000 Clinton River near Fraser, MI 444 Clinton 12 0.305 Highest increase <0.01 1948 2011 65
04164010 North Branch Clinton River at Almont, MI 10 Clinton 12 0.420 Upper Middle 1963 1968 6
04164050 North Branch Clinton River at 33 Mile Road near Romeo, MI 50 Clinton 12 0.412 Highest 1965 1969 5
04164100 East Pond Creek at Romeo, MI 22 Clinton 12 0.162 Lower Middle 1959 2011 53
04164150 North Branch Clinton River at 27 Mile Road near Meade, MI 90 Clinton 12 0.325 Highest 1968 1972 5
04164200 Coon Creek at North Avenue near Armada, MI 9.6 Clinton 12 0.489 Upper Middle 1966 1970 5
04164250 Tupper Brook at Ray Center, MI 8.6 Clinton 12 0.669 Highest 1960 1964 5 04164300 East Branch Coon Creek at Armada, MI 13 Clinton 12 0.633 Highest 1959 2011 53 04164350 Highbank Creek at 32 Mile Road near Armada, MI 15 Clinton 12 0.537 Highest 1966 1970 5
04164360 East Branch Cook Creek at 29-Mile Road near New Haven, MI 36 Clinton 12 0.336 Highest 1968 1982 5
04164400 Deer Creek at 25 1/2 Mile Road near Meade, MI 13 Clinton 12 0.760 Highest 1961 1965 5 04164450 McBride Drain at 24 Mile Road near Macomb, MI 5.8 Clinton 12 0.682 Highest 1960 1964 5 04164500 North Branch Clinton River near Mount Clemens, MI 199 Clinton 12 0.346 Highest 1948 1972 2011 41
04164600 Middle Branch Clinton River at Schoenherr Road near Macomb, MI 22 Clinton 12 0.441 Upper
Middle 1965 1969 5
04164800 Middle Branch Clinton River at Macomb, MI 41 Clinton 12 0.439 Highest 1963 1982 19
04165200 Gloede Ditch near Waldenburg, MI 16 Clinton 12 0.461 Upper Middle 1960 1964 5
04165500 Clinton River at Moravian Drive at Mount Clemens, MI 734 Clinton 12 0.303 Highest increase <0.01 1935 1971 2004 34 Streams Tributary to Detroit River
04166000 River Rouge at Birmingham, MI 33 Rouge 31 0.426 Highest 1951 1998 2011 14 04166100 River Rouge at Southfield, MI 88 Rouge 31 0.479 Highest 1959 1995 2011 17 04166200 Evans Ditch at Southfield, MI 9.5 Rouge 31 0.892 Highest 1959 1998 2009 12
04166300 Upper River Rouge at Farmington, MI 18 Rouge 31 0.423 Upper Middle 1959 1998 2011 14
04166470 Upper River Rouge at Detroit, MI 67 Rouge 31 0.545 Highest 1998 2005 8

140
Gag
e N
umbe
r
Gag
e
Des
crip
tion
Tota
l Dra
inag
e A
rea
(sq.
mi.)
Maj
or
Wat
ersh
ed
Wat
ersh
ed
Num
ber
Cha
ract
eris
tic
R-B
Inde
x Va
lue
Qua
rtile
Ran
k
Flas
hine
ss
Tren
d
p Va
lue
Firs
t Wat
er Y
ear
of R
ecor
d
Firs
t W
ater
Ye
ar A
naly
zed,
if
diffe
rent
Last
Wat
er Y
ear
Wat
er Y
ears
A
naly
zed
04166500 River Rouge at Detroit, MI 187 Rouge 31 0.492 Highest 1931 1990 2011 22 04167000 Middle River Rouge near Garden City, MI 100 Rouge 31 0.377 Highest 1931 1998 2011 14 04167150 Middle River Rouge at Dearborn, MI 110 Rouge 31 0.399 Highest 1998 2005 8 04168000 Lower River Rouge at Inkster, MI 83 Rouge 31 0.400 Highest decrease <0.01 1948 2011 64 04168400 Lower River Rouge at Dearborn, MI 91 Rouge 31 0.370 Highest 1998 2004 7 04168580 Ecorse River at Dearborn Heights, MI 10 Rouge 31 0.821 Highest 2003 2011 9 Streams Tributary to Lake Erie
04169500 Huron River at Commerce, MI 57 Huron 15 0.054 Lowest 1947 1975 29 04170000 Huron River at Milford, MI 132 Huron 15 0.075 Lowest 1949 1960 2011 52 04170500 Huron River near New Hudson, MI 148 Huron 15 0.075 Lowest 1949 1968 2011 44 04171500 South Ore Creek at Hamburg Road near Brighton, MI 34 Huron 15 0.080 Lowest 1951 1968 18 04172000 Huron River near Hamburg, MI 308 Huron 15 0.054 Lowest 1952 1967 2011 45 04172500 Portage River at Tiplady Road near Pinckney, MI 79 Huron 15 0.058 Lowest 1946 2009 27
04173000 Huron River near Dexter, MI 522 Huron 15 0.143 Upper Middle 1947 1962 1977 13
04173500 Mill Creek near Dexter, MI 128 Huron 15 0.196 Highest 1953 1995 2011 17
04174500 Huron River at Ann Arbor, MI 729 Huron 15 0.094 Lower Middle 1915 1999 2011 12
04174800 Huron River at Ypsilanti, MI 807 Huron 15 0.104 Lower Middle decrease <0.01 1975 1994 15
04175340 Stony Creek at Oakville, MI 68 Stony Creek 35 0.335 Highest 1971 2003 12
04175600 River Raisin near Manchester, MI 132 Raisin 29 0.092 Lower Middle 1971 2011 37
04175700 River Raisin near Tecumseh, MI 267 Raisin 29 0.106 Upper Middle 1957 1980 24
04176000 River Raisin near Adrian, MI 463 Raisin 29 0.176 Highest increase 0.04 1954 1972 2011 27 04176400 Saline River near Saline, MI 95 Raisin 29 0.308 Highest 1966 1977 12 04176500 River Raisin near Monroe, MI 1042 Raisin 29 0.160 Highest 1938 1972 2011 40 04176605 Otter Creek at Lasalle, MI 51 Raisin 29 0.471 Highest 1988 2011 24

141
References
Baker, D.B., P. Richards, T.L. Loftus, and J.W. Kramer. 2004. A New Flashiness Index: Characteristics and Applications to Midwestern Rivers and Streams. Journal of the American Water Resources Association 40(2):503 – 522
Caraco, D. 2000. Dynamics of Urban Stream Channel Enlargement. Article 19 (p. 99-104) in The Practice of Watershed Protection, T. Schueler and H. Holland, eds. Center for Watershed Protection. Ellicott City, MD. 2000.
Fraley-McNeal, L. 2008. Personal Communication.
Rhoads, B. and M. Miller. 1991. Impact of Flow Variability on the Morphology of a Low-Energy Meandering River. Earth Surface Processes and Landforms 16:357-367.
Richards, C., R. Haro, L. Johnson, and G. Host. 1997. Catchment and Reach-Scale Properties as Indicators of Macroinvertebrate Species Traits. Freshwater Biology 37:219-230.
Richards, P. 2005. Personal Communication.
Schueler, T. 2000. The Importance of Imperviousness, Article 1 (p. 7-18) in the Practice of Watershed Protection, T. Schueler and H. Holland, eds. Center for Watershed Protection. Ellicott City, MD.
Suppnick, J. 2006. Personal Communication.
USDA-NRCS. 1986. Urban Hydrology for Small Watersheds TR-55.
Van Steeter, M. and J. Pitlick. 1998. Geomorphology and Endangered Fish Habitats of the Upper Colorado River: 1. Historic Changes in Streamflow, Sediment Load, and Channel Morphology. Water Resources Research 34:287-302.

A-1
Appendices
Appendix A: Explanation of Cusum Analysis Visual examination of the gage data plots indicates that some gages have experienced trend changes. To identify where the trend change occurs, a cumulative sum statistical technique, termed cusum, was then applied to the data. For each gage in question, the differences between the yearly R-B Index value and the average R-B Index value were cumulatively summed, as shown in Table A1 and Figure A1. Cusum curve inflection points, rather than extremes, indicate the timing of trend changes, as shown in Figures A2 and A3. Taking the first derivative of the cusum curve therefore helps identify trend change points. In order to eliminate some of the annual variability associated with actual gage data, the first derivative of a five-year moving average of the cusum data was used for the flashiness analysis. Example graphs from trend analyses for two gages are shown in Figures A4 through A7. Gage 04127997 has a statistically significant increasing trend when evaluating all of the data, but no trend when performing a regression analysis on the data since 1973, Figures A4 and A5. Gage 04165500 has no statistically significant trend when evaluating all of the data, but a statistically significant increasing trend when performing a regression analysis on the 1972 to 2004 data, Figures A6 and A7. Both breakpoints are extremes on the first derivative cusum plots. Best professional judgment is applied to selection of breakpoints that best represent the gage. Table A1 – Sample Data and Cusum Calculation.
Year R-B
Index Value
Average Difference
Cusum
1995 0.115 0.100 0.015 0.015 1996 0.115 0.100 0.015 0.030 1997 0.100 0.100 0.000 0.030 1998 0.100 0.100 0.000 0.030 1999 0.100 0.100 0.000 0.030 2000 0.115 0.100 0.015 0.045 2001 0.092 0.100 -0.008 0.037 2002 0.068 0.100 -0.032 0.005 2003 0.085 0.100 -0.015 -0.010 2004 0.110 0.100 0.010 0.000
Figure A1 – Sample Data and Cusum Plots.

A-2
Figure A2 – Example of Cusum Analysis Showing no Trend Change.
Figure A3 – Example of Cusum Analysis Showing Trend Change at 1980.

A-3
Figure A4 – USGS Gage 04127997 R-B Index Values.
Figure A5 – Cusum Analysis, Defining Potential Breakpoint at 1974.
Statistically significant increasing trend overall, but no statistically significant trend starting in 1974
Maximum at 1974

A-4
Figure A6 – USGS Gage 04165500 R-B Index Values.
Figure A7 – Cusum Analysis, Defining Potential Breakpoint at 1972.
Statistically significant increasing trend starting in 1972
Minimum at 1972

B-1
Appendix B: Michigan’s Major Watersheds


![Are Tropjca] Streams Eco]ogjcally Djfferent from Temperate Streams?](https://static.fdocuments.us/doc/165x107/58a308011a28abb5488c1d3d/are-tropjca-streams-ecoogjcally-djfferent-from-temperate-streams.jpg)