Flash Floods in Hawaii The Flash Flood Problem in Hawaii€¦ · Flash Floods in Hawaii! The Flash...
11
Lecture 24 Flash Floods in Hawaii Hilo Flood November 2000 Oahu Flood November 1995 1 Previous lecture: Weather Hazards in Hawaii Midlatitude cyclones - cold fronts flooding high winds waves and swell Kona lows and upper-level troughs flooding high winds waves and swell Extra strong Hawaiian highs high trade winds waves and swell Tropical cyclones winds waves and swell storm surge flooding 2 Flash Floods in Hawaii ! The Flash Flood Problem ! Flood Ingredients • Weather Patterns • Terrain effects • Soil moisture ! Past Events ! Detection and Forecasting Tools ! NWS Advisories 3 The Flash Flood Problem in Hawaii ! 322 events in 40-year period ! 8.3 per year ! Causes most of the direct wx-related fatalities ! November is the worst month for storms (1-2 flash floods) ! June has the best weather 4
Transcript of Flash Floods in Hawaii The Flash Flood Problem in Hawaii€¦ · Flash Floods in Hawaii! The Flash...

Lecture 24 Flash Floods in Hawaii
Hilo Flood November 2000
Oahu Flood November 1995
1
Previous lecture: Weather Hazards in HawaiiMidlatitude cyclones - cold fronts
! flooding
! high winds
! waves and swell
Kona lows and upper-level
troughs
! flooding
! high winds
! waves and swell
Extra strong Hawaiian highs
! high trade winds
! waves and swell
Tropical cyclones
!winds
! waves and swell
! storm surge
! flooding
2
Flash Floods in Hawaii
! The Flash Flood Problem
! Flood Ingredients• Weather Patterns
• Terrain effects
• Soil moisture
! Past Events
! Detection and Forecasting Tools
! NWS Advisories
3
The Flash Flood Problem in Hawaii
! 322 events in 40-year period
! 8.3 per year
! Causes most of the direct wx-related fatalities
! November is the worst month for storms (1-2 flash floods)
! June has the best weather
4

Factors that Contribute to Flood Challenge
1. Small watersheds: Steep slopes and shallow soils make
the time between peak rain and peak discharge small, as
little as 15 minutes. Half of the State is within 5 miles of the
shore, therefore lead time for a response time is very short.
2. Terrain influences: The typical Hawaiian flood occurs when
a convective cloud becomes anchored to mountains.
3. Precipitation processes: Clouds may be deep
cumulonimbus or "shallow" warm rain clouds. Scale of
convective clouds is relatively small.
5
Ingredients for Heavy Rain! Moisture – lots of water vapor
" Large amounts of low level moisture results in unstable air and more rainfall
" Large amounts of mid-level moisture helps preserve parcel buoyancy
! Large upward motion" Low level convergence & upper
level divergence needed for heavy rainfall.
! Slow storm motion (i.e. long duration)" Increases total rainfall over
basin Enhanced IR image during peak rainfall period of the Nov. 2000 Big Island flood event.
6
Rainfall vs Water
Vapor
7
Hurricanes Possess Lots of Water Vapor
Hurricane Georges, September 1998
Blue line ~ Water vapor in columnRed line – Sea level pressure
8

Four Heavy Rain Patterns:Provide Moisture and Upward Motion
1. Cold front passage
2. Kona low• Slow moving
• Ample upward motion
• Advects moisture from deep tropics
3. Upper-level low or trough • over tropical system or its
remnants is very dangerous. e.g., Nov 2000 Flood
4. Tropical Cyclone• tropical storm
• hurricane
9
Kona Lows
Cause more flash floods in Hawaiithan any other storm system
10
Kona Low
A non-frontal subtropical cyclone that initially forms aloft.
11
Mesoscale or Island Scale Features
! Terrain forcing" Ideal lifting mechanism
for prolonged heavy rains" Rain maxima often over
slopes exposed to low level flow
! Lee-side convergence zones (a.k.a. “plumes”)" Enhanced low level
convergence." Southeasterly or
southerly flow can cause “plume” to drift over downstream islands
12
Hana Flood
Big Island Plume and Terrain Anchoring
13
Hana Flood
Big Island Plume and Terrain Anchoring
14
Rainfall Distribution: New Year’s Storm
24-hour rainfall in inches.
Distribution determined by
the terrain.
Contours for a 100-yr
rainfall event with overlay
of 20” rainfall contour.
15
Contributing Factors! Soil moisture content from previous rains
! Previous Rainfall: Rate, duration, pattern
! Soil type, depth and stratification: determines infiltration rate & flow type
Paauau Stream overtopping Belt Highway at Pahala during Nov. 2000 Big Island flood event.
16

Contributing Factors! Land use affects
basin response" Agriculture" Natural forest
" Urbanized
! Basin slope & size" Small, steep: < 1 hr
response time
! Channel condition" Debris dams?
Aerial view of Kaneohe, Oahu. Note encroachment of urban areas within small, steep-walled basins.
Geographic Aspects: Development of flash floods occurs in valleys and on unstable hillsides. Islands with narrow coastal transportation corridors can have large sections isolated by debris flows. This occurred on Oahu on New Years Eve, 1987 when all transport to East Oahu was severed.
17
Small Basins mean Fast Response
18
Notable Events! November 2000
" SE and E Big Island" $70 Mil." 37 inches/24-hrs (22 in./6-
hr)
! Dec 1991 Anahola Flood
" East Kauai" $5 Mil. & 4 fatalities
! Dec 1987/Jan 1988 “New Years Flood”
" East Oahu" 22 inches/24-hrs" $34 Mil.
! Nov 1996 “Election Day Storm”
" S. & Cen. Oahu" 14 inches/12-hrs" $13 Mil.
Bridge washout on Komohana St. in Hilo the day after the Nov. 2000 Big Island flood event.
19
Hilo Flood 1-2 November 2000
7170
7174
71707130
7016
7014
7000
Glenwood
Mountain
View
Waiakea
Uka
Piihonua Hilo Airport
25
30
25
20
701325
20 20
20
7170
7174
71707130
7016
7014
Glenwood
Hilo Airport
7016
Mountain
View
Waiakea
Uka
Piihonua Hilo Airport
25
30
25
20
25
20 20
207000
7170
7174
71707130
7014
7013
24.7
26.9
29.1
29.8
26.6
24-hour rainfall (solid)
and 100-year flood
rainfall (dashed).
20

Hilo Flood 1-2 November
2000
! 155.2 ! 155.15 ! 155.1 ! 155.05 ! 15519.65
19.7
19.75
19.8
19.85
7170
7174
7170
7130
7016
7014Waiakea
Uka
Piihonua Hilo Airport
2525
2020
7013
25
7170
7174
7170
7130
7016
7014
Hilo Airport7016
Waiakea
Uka
Piihonua Hilo Airport
25
7170
7174
7170
7130
7014
7013
24.7
26.9
29.1
24.7
26.9
29.1
3 miles
24-hr rainfall (solid)
and 100-yr flood
rainfall (dashed).
21
Hilo Flood 1-2 November
2000
Figure 1 Hourly rainfall rate (inches per hour)
for Hilo for the period 1 to 2 November 2000.
0
2
4
6
Ho
url
y R
ain
fall (
in/h
r) Hilo, HI
11/1/00 11/2/00
22
Oahu Flood 4 November 1996
Election Day Flood 1996
23
Analysis for 1200 UTC 25 January 1996 of 250 mb streamlines and isotachs (every 5 m/s).
Upper Level Divergence of Winds
24

Low Level Convergence of Winds
Analysis for 1200 UTC 25 January 1996 of sea-level pressure (mb).
25
January 1996
Flood Case
Display of radar reflectivity (dBZ) of storms located
over O'ahu at 1258 UTC 25 January 1996. (a) PPI and
(b) RHI located along black line in a). White numbers in
a) denote locations of LARC rain gages.
26
Storm Total Rainfall
Analysis for 1200 UTC 25 January 1996 of sea-level pressure (mb).
27
Oahu New Year’s Eve Flood
Contours for a 100-yr rainfall event
with overlay of 20” rainfall contour
from the New Year"s Eve Storm.
Kahena Street, Hahaione Valley
on January 2, 1988. Flood waters
gouged a 10–20 ft channel in the
roadway. (Photo courtesy of T.
Giambelluca).
28
Detection & Forecasting Tools
" Balloon and Aircraft Soundings
" Satellite Imagery and products
" Radar Imagery and products
" Rain gage data" Stream gage data" Numerical models" Spotters" Experience
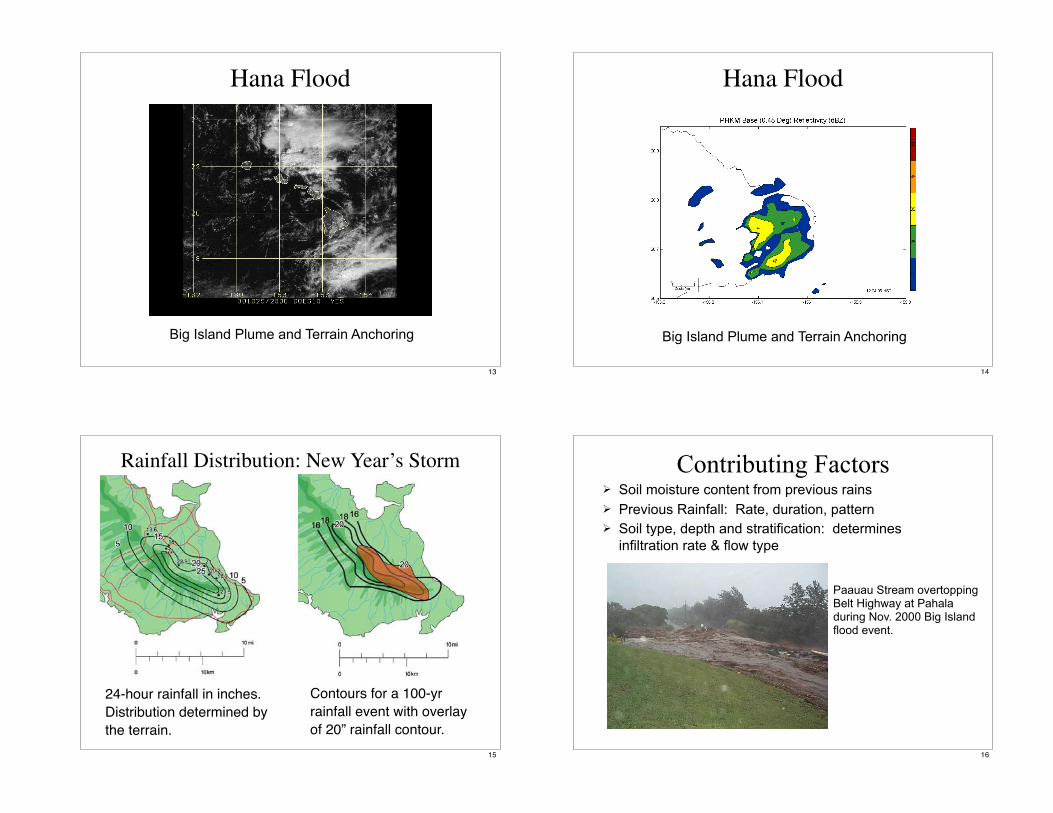
Manoa Valley flood Halloween 2004
29
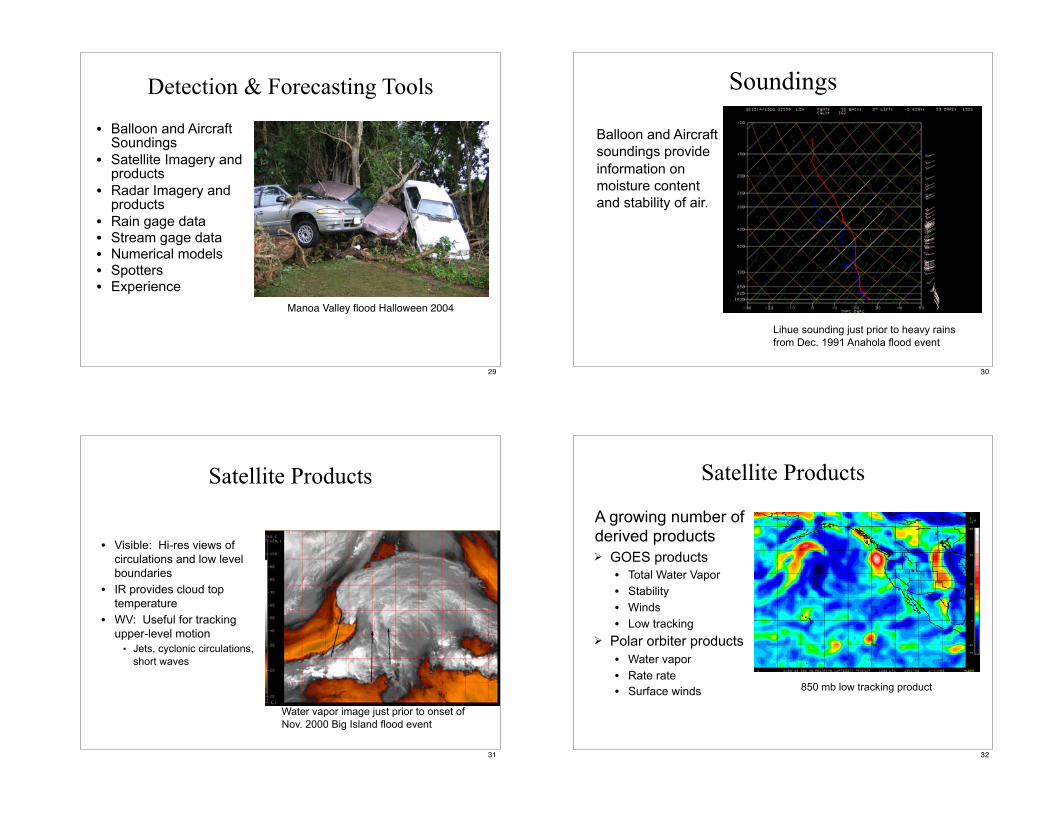
Soundings
Lihue sounding just prior to heavy rains from Dec. 1991 Anahola flood event
Balloon and Aircraft soundings provide
information on moisture content and stability of air.
30
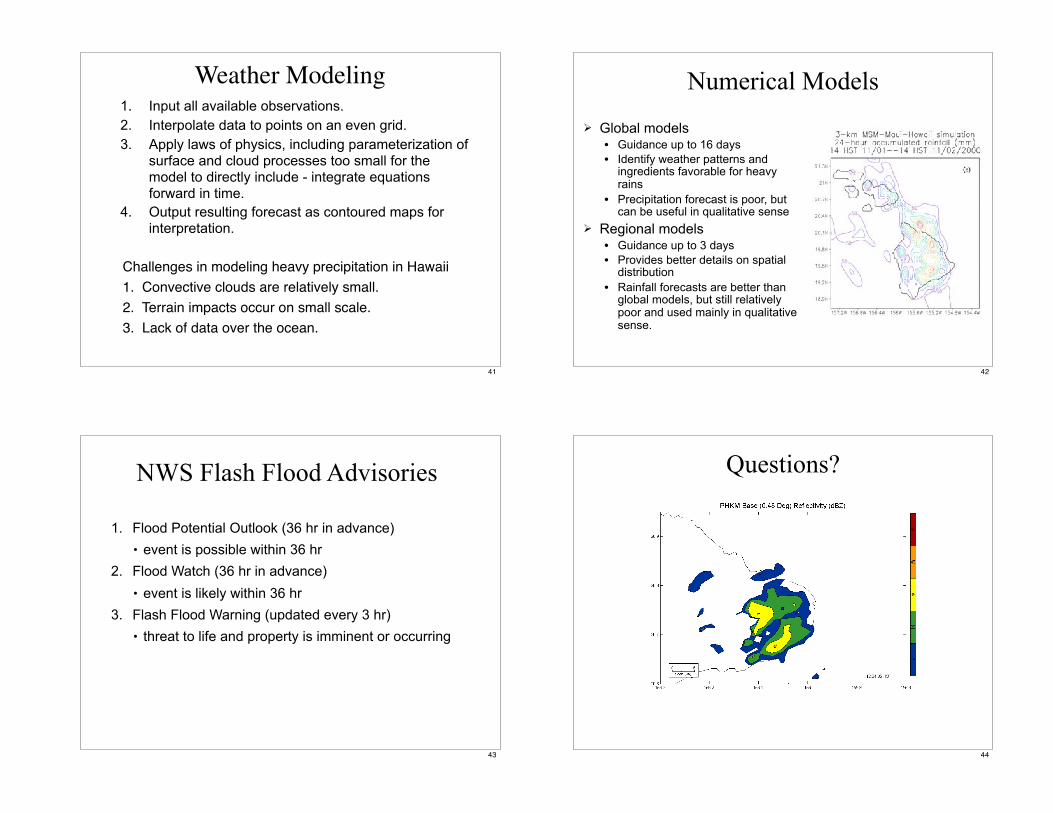
Satellite Products
" Visible: Hi-res views of circulations and low level boundaries
" IR provides cloud top temperature
" WV: Useful for tracking upper-level motion
• Jets, cyclonic circulations, short waves
Water vapor image just prior to onset of Nov. 2000 Big Island flood event
31
Satellite Products
A growing number of derived products! GOES products
" Total Water Vapor
" Stability
" Winds
" Low tracking
! Polar orbiter products" Water vapor
" Rate rate " Surface winds 850 mb low tracking product
32

Additional Forecast Tools
! Radar data" Short term forecast tool" Look for signs of heavy rain initiation
• Pre-existing lines of showers or outflow boundaries can intensify over mountainous terrain
! Surface data" Watch for changes in wind speed/direction, dew
point, and 24-hr pressure trend
! Experience" Years of looking at numerical and observational
data improves skill in most cases
33
Flash Flood Detection – Rain Gages
! Automated system provides alarm for intense rain.
! “Ground truth” on actual rainfall…but" Wind bias
" Intense rainfall low bias
" Spatial coverage limitations
! Provides some lead time
! 2 to 4 inches per hour significant
Automated rain gage with phone telemetry at Kokee radar station.
34
Anahola Flood 13-14 December 1991
Hourly rainfall from gage at Anahola during the 1991 Anahola flood.
35
Doppler Radar
Doppler radar measures
rainfall rates, wind speeds.
36

Radar Data & Derived Products
! Provides good spatial and temporal resolution" 1 deg x 1 km" Update every 5 to 6 minutes
! Excellent for cell motion! Cells with reflectivity cores >= 50
dBZ bear close monitoring" Slow moving?" terrain anchored?
! Cross-sections for vertical structure
! Rainfall estimates" 1-hr, Storm total, User defined" Bias problems…validate w/gages
! Vert. Integrated Liquid (VIL)" >=25 kg/m2 signficant
Storm total rainfall from Molokai WSR-88D covering December 1999 flood event.
37
Basin Areal-Mean Estimated Rainfall
! Derived from reflectivity data
! Radar “bins” assigned to stream basins" Basins delineated using digital
elevation model data
! Reflectivity converted to rain intensity
! Intensity values for each volume scan averaged over all bins in basin
! Basin accumulations determined
! Basin rainfall data compared to stream data to determine flash flood threshold rainfall
3-hr basin accumulation from January 1996 flood event
38
Stream Gages! Real-time capability on
growing number of sites
! 1- to 4-hour routine transmission interval
! Emergency broadcast capability available if flood threshold known
! Excellent “ground truth” of flood conditions
! Limited lead time for operations
! Data used for rainfall threshold calibration (AMBER)
USGS stream gage at Kahana Stream
39
Other Tools
• Spotters" “Eyes and ears” of NWS in the field
" Trained volunteers
" Law enforcement and emergency management officials
• Experience" Years of working flood events improves skill in
most cases
40
1. Input all available observations.
2. Interpolate data to points on an even grid.
3. Apply laws of physics, including parameterization of surface and cloud processes too small for the model to directly include - integrate equations forward in time.
4. Output resulting forecast as contoured maps for interpretation.
Weather Modeling
Challenges in modeling heavy precipitation in Hawaii
1. Convective clouds are relatively small.
2. Terrain impacts occur on small scale.
3. Lack of data over the ocean.
41
Numerical Models
! Global models" Guidance up to 16 days" Identify weather patterns and
ingredients favorable for heavy rains
" Precipitation forecast is poor, but can be useful in qualitative sense
! Regional models" Guidance up to 3 days" Provides better details on spatial
distribution" Rainfall forecasts are better than
global models, but still relatively poor and used mainly in qualitative sense.
42
NWS Flash Flood Advisories
1. Flood Potential Outlook (36 hr in advance)
• event is possible within 36 hr
2. Flood Watch (36 hr in advance)
• event is likely within 36 hr
3. Flash Flood Warning (updated every 3 hr)
• threat to life and property is imminent or occurring
43
Questions?
44


![Flash Flood Risk Estimation of Wadi Yutum (Southern Jordan ...tional for flash flood risk assessment. El-Maghraby et al. [54] employed morphometric analysis to evaluate the flash flood](https://static.fdocuments.us/doc/165x107/5f63b02dfde39d7cc462b8d3/flash-flood-risk-estimation-of-wadi-yutum-southern-jordan-tional-for-flash.jpg)