Flash-Flood Producing Mesoscale Convective Systems: A Statistical Analysis of Precipitation...
14
Flash-Flood Producing Mesoscale Convective Systems: A Statistical Analysis of Precipitation Efficiency Patrick S. Market Dept. of Atmospheric Science University of Missouri- Columbia Scott M. Rochette Dept. of the Earth Sciences SUNY, College at Brockport
-
date post
21-Dec-2015 -
Category
Documents
-
view
215 -
download
1
Transcript of Flash-Flood Producing Mesoscale Convective Systems: A Statistical Analysis of Precipitation...

Flash-Flood Producing Mesoscale Convective
Systems: A Statistical Analysis of Precipitation Efficiency
Patrick S. MarketDept. of Atmospheric
ScienceUniversity of Missouri-
Columbia
Scott M. RochetteDept. of the Earth
SciencesSUNY, College at
Brockport

Support
Funding: Outgrowth of a larger 2-year study with NOAA/NESDIS/ORA
Precipitation Data: NCEP - Brett McDonald and Michael Baker
Analysis: Stacy Allen (UMC) and Brian Pettegrew (CMC)

Problem Larger question
For a given PW: higher PE heavier rainfall ?
Present question Do MCSs with greater PE values produce
greater rainfall totals? OR… Is it necessary for an MCS to have large PE
to be a flash flood producer?

Method Data
MCS PE values of Market et al. (2002) NCDC online reports of flash flooding
Over Missouri During summers: 2000, 2001
33 PE calculations 9 PE calculation periods feature flash
flooding

Precipitation EfficiencyRatio of Precipitation (P) to Ingested Moisture (Q)
)(
6
1 6 igi
RP
6
6
1)(
iigiPW
Q
R=6-h gridpoint rainfall
Q=gridpoint precipitable water (6-h avg)
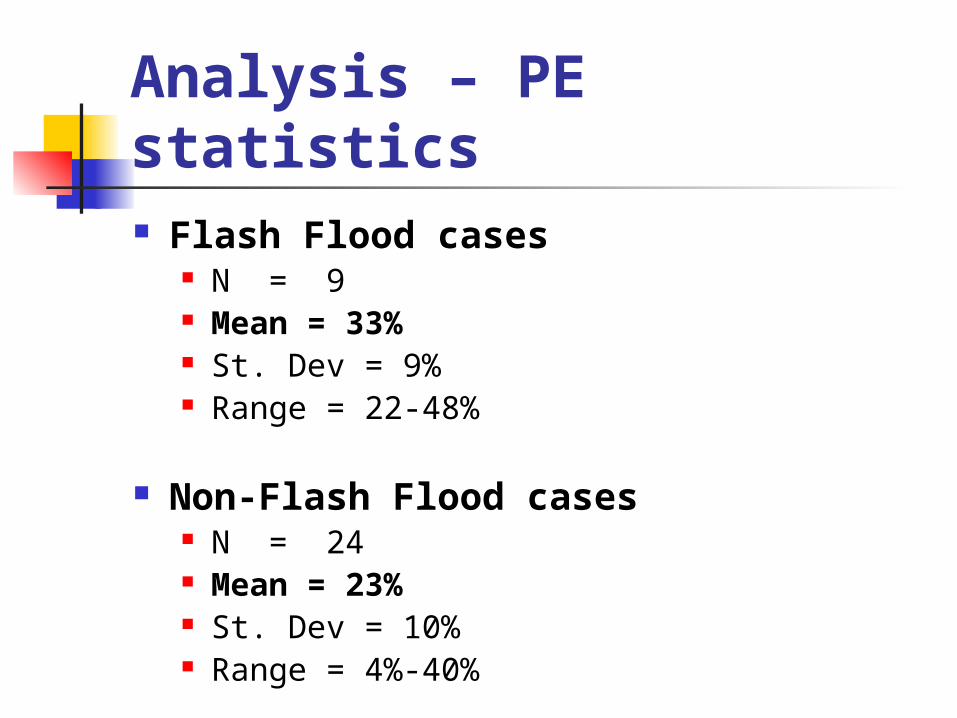
Analysis – PE statistics Flash Flood cases
N = 9 Mean = 33% St. Dev = 9% Range = 22-48%
Non-Flash Flood cases N = 24 Mean = 23% St. Dev = 10% Range = 4%-40%

Analysis – PE statistics Mann Whitney Wilcoxon rank sum test
Hypothesis: Median PE of FF sample > Median PE of NFF sample
p=0.0131 =0.05 p<
Reject null hypothesis (medians identical)
FF PE > NFF PE at 95% confidence

Analysis – PE statistics
Median
10th
25th
75th
90th

MCS Propagation and PE FF PE cases (N=9)
Less than half were quasi-stationary or regenerative
4 of 9
All cases (N=32) One third were QS or REGEN
10 of 32

MCS Propagation and PE Therefore, 6 cases were QS or
REGEN, but not associated with flash flooding
Suspect MCS behavior necessitates neither large PE nor flash flooding
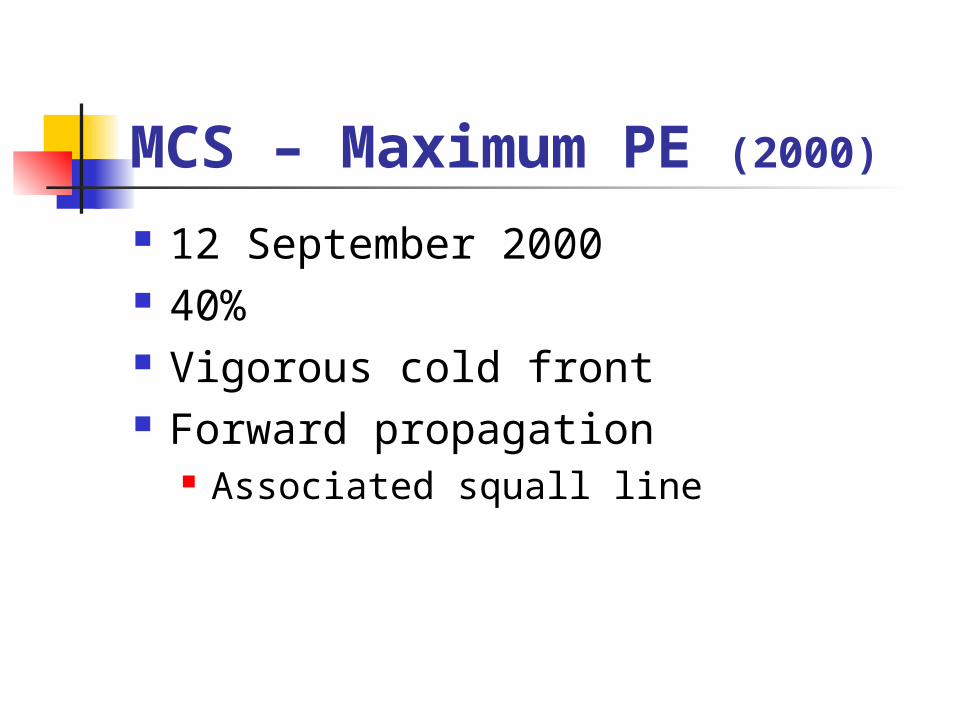
MCS – Maximum PE (2000)
12 September 2000 40% Vigorous cold front Forward propagation
Associated squall line

MCS – Minimum PE (2000)
17 August 2000 4% Elevated convection
North of warm front Scattered convection Forward propagation
Summary MCSs which produce Flash
Flooding are more likely to be efficient precipitators
Quasi-stationary or regenerative MCS motion does not require large PE or guarantee flash flooding