FJPH - health.gov.fj Journal of Public Health... · The call for submissions and a description of...
59
HEALTH SYSTEMS STRENGTHENING Health Systems Strengthening in Fiji In this Issue: Vol:3, Issue:1 Jan, Feb, March 2014 FIJI J URNAL OF PUBLIC HEALTH
Transcript of FJPH - health.gov.fj Journal of Public Health... · The call for submissions and a description of...

FJPHFiji Journal of Public Health
Published: Fiji Journal of Public Health ISSN: 2307-7484
COPYRIGHT C
HEALTH SYSTEMS STRENGTHENING
Health Systems Strengthening in Fiji
In this Issue:
Vol:3, Issue:1
Jan, Feb, March2014
FIJI J URNAL OF PUBLIC HEALTH

The FJPH, is a Fiji based Journal published for Public Health practitioners, public health researchers, clinicians and all allied health practitioners. Our goal is to provide evidence based information and analysis they need to enable them to make the right choices and decisions concerning their health and health services provided to ensure better health for all.
FJPH is published quarterly.
The format of FJPH accommodates three types of submissions:1. Original Academic/Scientific Research Papers - Research-based works addressing a specific area of public health or any other general topic in health- between 3,000 and 4,500 words. 2. Structured Abstracts- for original research & systematic reviews of specific public health interest - between 500 and 3,000 words. 3. Perspectives –Reviews, Opinion pieces that analyze or discuss a recent issue or development in public health - between 250 and 2,500 words.4. Field notes –Journal-style pieces, with a more personal voice, words.
Submission Procedures1. All manuscripts should be prepared according to the guidelines below2. The call for submissions and a description of the optional theme can be found in the Health Research web page.3. All manuscripts should be submitted via the online submissions form on the Research web page.
Publication Eligibility1. For each manuscript, at least one of the authors needs to be an undergraduate, medical, or graduate student at a nationally accredited institution.2. The submitted manuscript has not been published nor will be published in another publication at the undergraduate, graduate or professional level.3. The manuscript is the author’s own original work, and the authors are the sole authors of the manuscript.4. The primary author is willing and able to work with FJPH editors in revising the submission if it is selected as a likely candidate for publication.
Submission Types1. Original scientific Research - Research - based works addressing a specific area of public health or any other general topic in health2. Abstracts – structured abstracts for original research and 3. Perspectives –Reviews, Opinion pieces that analyze or discuss a recent issue or development in public health4. Field notes –Journal-style pieces, with a more personal voice, based on direct work in the field
Formatting• All manuscripts should be submitted as double-spaced, size 12, Times New Roman font in microsoft Format (.doc or .docx only).• Do not include the name of the manuscript’s authors any pages except the title page.
Content Guidelines for Perspectives and Field Notes Perspectives are opinion-based pieces. Field Notes take a more personal, informal tone that addresses public health work the author has done in the field. For both Perspectives and Field Notes, we are looking for submissions that address fresh and exciting developments in public health from an interdisciplinary perspective. Perspectives and Field Notes should be grounded in the preexisting literature base. For citations and references, use APA style. If tables and figures afe used, please include them at the end of the submission
Content Guidelines for Original Academic/Scientific ResearchPapers Papers The appropriate structure of Academic/scientific Research Papers varies based on the topic of the manuscript. With a few exceptions, following sections: a) Abstract, b)Introduction, c) Methods, d) Results, e) Discussion, f ) Acknowledgments and References, g) Tables and Figures.
Tables, Figures and Images• Tables, figures and images should be the original work of the manuscript’s authors and should be included at the end of each manuscript.• Captions should describe what the table/figure/image shows and the conclusion that should be drawn.• Labels and axes should be clearly marked and readable. all tables, figures, and images should be submitted in high resolution please.• References
The views and opinions expressed in FJPH do not necessarily reflect those of the Editorial Board, editorial staff, or their support organisations.
FJPH Contact: Ministry of Health, 88 Amy Street, Suva.Email: [email protected]: FJ PH, Skype: fj.ph1Website: www.fijijournalpublichealth.com.fj
For all enquiries, subscriptions to:Mere Delai, Health Research Office, Ministry of Health, Suva , FijiPhone: 00 679 3306177 Extension 340170Email: [email protected]
Proudly Sponsored by:
Subscription information: See inside back coverAcid Free Paper: This Journal has been printed on paper that meets the American National Standard Permanence od Paper for Publications
and Documents in Libraries and Archives (ANS/NISO z39.49. 1992(R1997) and the International Standard Information and Documentation – paper for documents – Requirements for Permanence (ISO 9706: 1994)
Volume 3, Issue 1, 2014
i
FIJI JOURNAL OF PUBLIC HEALTH
Volume 3, Issue 1, 2014
CONTENTSEDITORIALSGUEST EDITOR ii Dr. Wayne Irava
ORIGINAL RESEARCH• Rapid Assessment of the Health Care on 1 Air Radio Broadcast (2012)Tukana M, Kamunaga M, Waqa S, Glandon D• Catastrophic and poverty impacts of health 8 payments: results from the Health Income and Expenditure Survey (HIES) in Fiji Irava W• Coding Audit at Colonial War Memorial Hospital 12 Mataitoga K, Bali A, Delai M Y, Nand D• Evaluation of the Dengue Clinical Training 16 Package – Fiji Dengue Outbreak 2013-2014 Nand D, Matanicake J, Rabukawaqa I, Sahukhan A, Kama M,• A Snapshot of Health Financing in Fiji from 19 National Health Accounts Prasad R, Irava W, Khan I• Degree of dependence of health indicators on key 24 country statistics in Fiji Islands from 2003-2010 Mahakalanda.S.J, Soderberg. E
REVIEW• Data Requests and Approval Procedures; Ministry 30 of Health on the Republic of Fiji Bali A, Nand D• Literature Review on International Procedures 35 for Data Protection and Confidentiality Shankar S, Nand D
PERSPECTIVE• Equity in services for non- communicable diseases: 41 How can Fiji’s health systems respond better? Waqa G, Snowdon W, Raj A• Implementation of Laboratory Quality Management 43 System in Fiji Pathology Laboratory Services Tudravu L, Malupo N, Buadromo E, Nahapetyan K• Perceptions and Applications of Monitoring and 49 Evaluation in the Fiji Ministry of Health: 2009 –2014 Naidu S, Singh R, Glandon D, Cooray-Dias M
REFLECTION• Reflections on the role of managing the Global Fund 54 Grant Project ( TB and Health Systems strengthening) for the people of Fiji Taylor V.N
Patron• Dr Neil Sharma Minister for Health
Editor in Chief• Dr Josefa Koroivueta
Editorial Team• Dr Eric Rafai• Dr Wendy Snowdon• Dr Devina Nand• Dr Kim Sung-Hye• Dr Isimeli Tukana• Dr Dave Whippy• Dr Margaret Cornelius• Mrs Mere Delai (Coordinator)• Mr. Tomasi Bulimaibau (Graphic Designer)• Ms.Rosi Tubuitamana (Typist/Secretariat Support)
Fiji Journal of Public HealthISSN Print: 2307-7484

ii
FIJI JOURNAL OF PUBLIC HEALTH
Volume 3, Issue 1, 2014
EDITORIAL
GUEST EDITOR - Wayne Irava1*
The theme for this fourth issue of FJPH is Health Systems Strengthening (HSS). The World Health Organi-zation defines HSS broadly as the changes in policy and practice, and initiatives and strategies that can help improve one or more of the functions (financing, provision, stewardship, resource development) of the health system. Improve here pertains to improvements in access, coverage, quality and efficiency of health systems. Across the Pacific Island Countries (PICs) this definition is widely accepted and for most PICs the Ministries of Health are tasked with the responsibility of coordinating and monitoring country efforts and initiatives on HSS. However for most PICs there remain challenges in evaluating and measuring the effect of HSS initiatives and interventions. Limited ability to assess the performance of HSS programs and initiatives and their system wide effects on health systems remain an opportunity for improvement. Seizing the opportunity, the articles by Tukana et al. and Nand et al. report findings from evaluative assessments of two HSS programs “Health Care on Air” and the “Dengue Clinical Training Package”. Together these articles identify aspects of accessibility and quality and improvements that are required to strengthen health system initiatives. Three articles focus on health information systems and the efforts being undertaken to strengthen the processes, reporting and documenting of health information. The first article by Bali and Nand document the process of developing a HSS information tool “data request form” which provides a standardized format for requesting health information. The second article by Shankar and Nand discuss the issues pertaining to the confidentiality and privacy of health information in Fiji. Their article explores the options and processes that may need revision or implementation to protect individuals’ privacy. The third article by Mataitoga et al. reports the findings of a pilot study that looked at the coding quality of patient records at CWM hospital. They find that HSS efforts are required to improve the quality of coded data. The two articles in this issue by Irava and Prasad focus on the financing function of health systems. Both arti-cles report findings from HSS financing tools: National Health Accounts and Health Equity Analysis. Together these two articles showcase the HSS efforts currently being undertaken in Fiji to strengthen the financing function of health systems. Finally, the article by Mahakalanda and Soderberg, using regression analysis, tests whether country general indicators were significantly related to health indicators. Their results show that multi-sector wide efforts (such as strengthening education) in HSS may indeed have positive effects on the health status of a country. The original research articles and reviews presented in this issue cover a number of HSS themes. They docu-ment only a handful of the number of efforts that are currently underway, all working towards improving health systems. HSS is not a seasonal topic. HSS is continuous and will exist so as long as we have health systems. There will always be areas for improvement and advancement. I applaud the Ministry of Health for making HSS the theme of this issue and it has been an honor to write this guest editorial. Effort has been taken to write the articles. I trust you will also make some effort to read them. I am certain we can all learn something new.
1. Coordinator, Center for Health Information Policy and Systems Research, CMNHS,FNU* Address for Correspondence: [email protected]

1
FIJI JOURNAL OF PUBLIC HEALTH
Volume 3, Issue 1, 2014
ORIGINAL RESEARCH
Rapid Assessment of the Health Care on Air Radio Broadcast (2012)Tukana M1*, Kamunaga M2, Waqa S3, Glandon G1
1.Fiji Health Sector Support Program 2. Fiji Ministry of Health, National In-Service Training Program3.Fiji Ministry of Health, Nursing Services*Address for Correspondence: [email protected]/[email protected]
INTRODUCTIONBackground of studyCommunity Health Nurses (CHN) in Fiji are frontline health workers who need to be equipped with up to date health knowledge and skills in order to provide effective primary health care services to the commu-nities they serve. Yet it is common knowledge that CHNs in Fiji’s isolated rural stations and the maritime zone often miss out on regular in-service training (IST) sessions that urban and peri-urban sub divisional staffs can access routinely. In order to address this need, Fiji’s Ministry of Health developed and aired the “Health Care on Air” radio program in the mid-1990s as a distance learning program through which expert clinicians could share health care information with rural CHNs, especially in the remote islands of the Eastern and Western Divisions. However, this program ran only for about two years and was never audited nor evaluated. In response to the positive feedback to the initial broadcast, the 2012 Health Care on Air (HCA) program was organised and, after official approval by the Ministry’s National Health Executive Committee (NHEC), implemented by a working group run by the Nursing division of the Ministry of Health and chaired by the National IST Coordinator. The IST Coordina-tor for the Central and Eastern Divisions was the pri-mary host of the program, responsible for developing and delivering the key messages of the program,
which was broadcast weekly for thirty minutes per week (on Tuesdays from 10-10:30am, so as to coin-cide with “morning tea time” so that nurses could sit next to the radio during their break) between March-November of 2012, for a total of thirty-six broadcasts, as listed in Table 1. Given that the broadcast was also accessible to the general public, the content was also reviewed to filter out any content inappropriate for a non-clinical audience (e.g., information about diagno-sis, prescription, etc.). The Australian Aid-funded Fiji Health Sector Support Program (FHSSP) provided fi-nancial and technical support for this effort in order to support the core objectives of the program to support high quality delivery of maternal and child health services at the decentralized levels of the health system.
Keywords: community health nurse; in-service training; primary health care
ABSTRACTFiji’s Ministry of Health developed and aired the “Health Care on Air” (HCA) radio program in the mid-1990s as a distance learning program for community health nurses (CHN) in rural, remote posts. In response to posi-tive feedback from the initial broadcast, the program was repeated again in 2012, although it was never audited or evaluated. This rapid assessment was conducted in order to investigate the extent to which the program may have contributed to the desired outcomes articulated when the program was initiated. Data were collected through a telephone survey targeting the 117 CHNs in remote posts who were the primary audience for the HCA program. The survey contained a series of targeted questions related to the outcomes of interest using a five-point Likert scale (i.e., to generate quantitative data) as well as open-ended questions (to gather qualitative data). Results indicate a high perceived value of the Health Care on Air broadcast among the CHNs surveyed (109 out of 117 targeted) despite substantial limitations in terms of the reach of the program. The clear and con-sistent message from the surveyed CHNs is that they would like the broadcast to be repeated, albeit with adjust-ments to improve the accessibility, quality and delivery of the program.
No. Topics: 1. Updates from the Nursing Division 2. Roles & Responsibilities of Community Health Nurses (CHNs) 3. Communicable Disease – Leptospirosis 4. Communicable Disease – Typhoid & Dengue Fever 5. Maternal Child Health 6. Family Planning Updates & Motivation 7. Family Planning 8. Family Planning 9. Pap-‐smear 10. Oral Health 11. Oral Health 12. Health Information – Data Management 13. Health Information – Public Health Information System (PHIS) 14. Health Information update 15. CHNs Competency – 1 & 2 16. CHNs Competency – 3 -‐ 5 17. CHNs Competency – 6 -‐ 15 18. Expanded Program on Immunization (EPI) – Overview of EPI program 19. Expanded Program on Immunization (EPI) – Vaccine Logistics 20. Expanded Program on Immunization (EPI) – Cold Chain 21. Expanded Program on Immunization (EPI) – Logistics 22. New Vaccines 23. New Vaccines 24. New MCH card 25. New MCH Card 26. Triage Nursing 27. Roles of Supervisors -‐ Business Plan achievement updates 28. Customer Service 29. Customer Service 30. National Tuberculosis Program 31. Infant Feeding -‐ Malnutrition 32. Infant Feeding -‐ Malnutrition 33. New vaccines awareness 34. Disaster Preparedness 35. Disaster Preparedness 36. Healthy Setting awareness
Table 1: Schedule of Health Care on Air broadcasts (2012)
2
FIJI JOURNAL OF PUBLIC HEALTH
Volume 3, Issue 1, 2014
Key messages delivered through the broadcast included the emphasis on the importance of early booking for pregnant mothers, birth preparedness planning, and other topics related to the Fiji’s national Safe Mother-hood initiative and Child Health program. Further the working committee believed that the program would: increase CHN clinical and public health knowledge and improve service delivery through regular updates of key health messages; assist targeted CHNs with achieving the required annual points for Continuing Nursing Education (CNE), especially those in remote rural stations; and enhance communi-cation between nurses in rural stations and with their nursing supervisors.
Rationale and objectives of the rapid assessmentThis rapid assessment was conducted in order to inves-tigate the extent to which the program may have contributed to the desired outcomes articulated when the program was initiated as well as to identify poten-tial unintended effects (e.g., on the sense of communi-ty or connectedness among CHNs in remote stations, which had been mentioned anecdotally to the authors). The findings are intended to inform discussions within FHSSP and the Ministry of Health about whether the Health Care on Air program should be continued and, if so, whether any changes or adjustments are needed to make it more effective. To this end, the rapid assessment was designed to investigate the following:• Reach of the broadcast (i.e., number of nurses listening, frequency of listening, etc.)• Changes in knowledge, attitudes, and practices of rural nurses re: clinical care and outreach• Changes in behaviours of community related to key messages (e.g., increased early booking)• Contribution/utility for accumulating IST/CNE credit/accreditation• Changes in the sense of community/solidarity/ support among rural nurses• Qualitative perspectives and from respondents about their experience with the program• Respondent perspectives on whether the program should be continued/repeated and, if so, if/how it should be revised
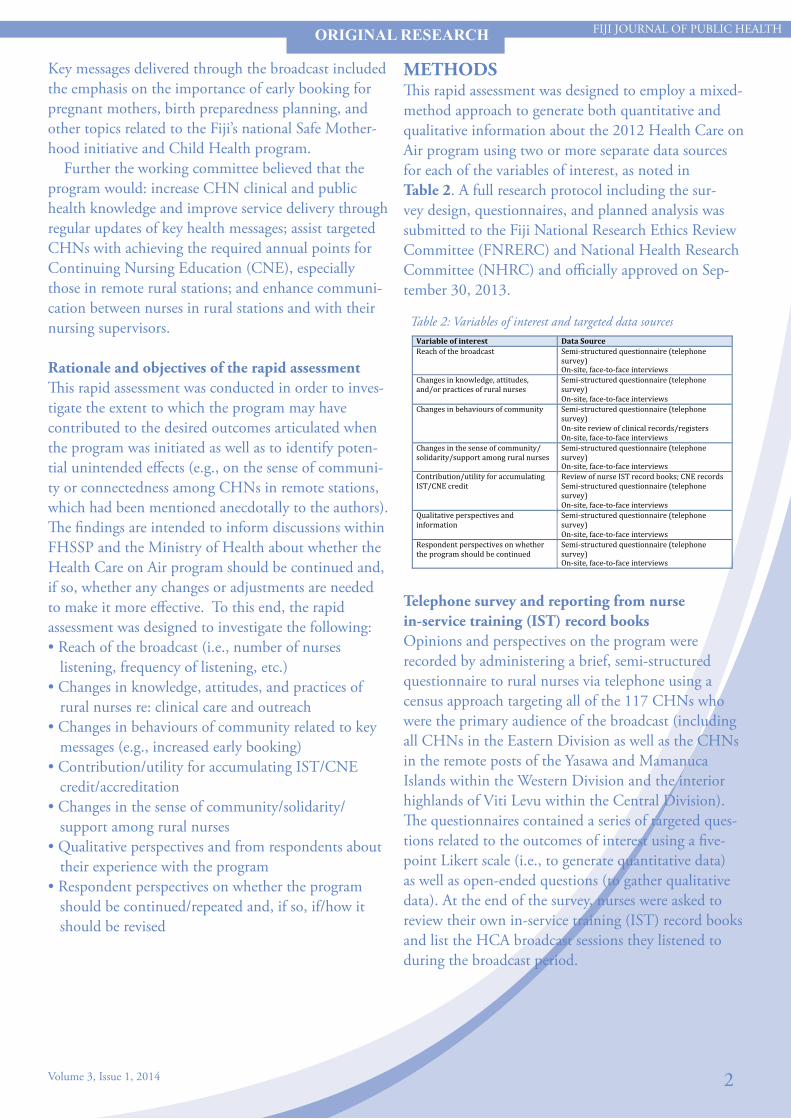
METHODSThis rapid assessment was designed to employ a mixed-method approach to generate both quantitative and qualitative information about the 2012 Health Care on Air program using two or more separate data sources for each of the variables of interest, as noted in Table 2. A full research protocol including the sur-vey design, questionnaires, and planned analysis was submitted to the Fiji National Research Ethics Review Committee (FNRERC) and National Health Research Committee (NHRC) and officially approved on Sep-tember 30, 2013.
ORIGINAL RESEARCH
Variable of interest Data Source Reach of the broadcast 1. Semi-‐structured questionnaire (telephone
survey) 2. On-‐site, face-‐to-‐face interviews
Changes in knowledge, attitudes, and/or practices of rural nurses
3. Semi-‐structured questionnaire (telephone survey)
4. On-‐site, face-‐to-‐face interviews Changes in behaviours of community 5. Semi-‐structured questionnaire (telephone
survey) 6. On-‐site review of clinical records/registers 7. On-‐site, face-‐to-‐face interviews
Changes in the sense of community/ solidarity/support among rural nurses
8. Semi-‐structured questionnaire (telephone survey)
9. On-‐site, face-‐to-‐face interviews Contribution/utility for accumulating IST/CNE credit
10. Review of nurse IST record books; CNE records 11. Semi-‐structured questionnaire (telephone survey)
12. On-‐site, face-‐to-‐face interviews Qualitative perspectives and information
13. Semi-‐structured questionnaire (telephone survey)
14. On-‐site, face-‐to-‐face interviews Respondent perspectives on whether the program should be continued
15. Semi-‐structured questionnaire (telephone survey)
16. On-‐site, face-‐to-‐face interviews
Telephone survey and reporting from nurse in-service training (IST) record booksOpinions and perspectives on the program were recorded by administering a brief, semi-structured questionnaire to rural nurses via telephone using a census approach targeting all of the 117 CHNs who were the primary audience of the broadcast (including all CHNs in the Eastern Division as well as the CHNs in the remote posts of the Yasawa and Mamanuca Islands within the Western Division and the interior highlands of Viti Levu within the Central Division). The questionnaires contained a series of targeted ques-tions related to the outcomes of interest using a five-point Likert scale (i.e., to generate quantitative data) as well as open-ended questions (to gather qualitative data). At the end of the survey, nurses were asked to review their own in-service training (IST) record books and list the HCA broadcast sessions they listened to during the broadcast period.
Table 2: Variables of interest and targeted data sources

3
FIJI JOURNAL OF PUBLIC HEALTH
Volume 3, Issue 1, 2014
Telephone surveys were administered by a three-person team of Suva-based data collectors, including the Principal Investigator and two additional data collec-tors, trained and supervised by the Principal Investiga-tor. Survey administrators were based in the FHSSP Head Office in Suva. Respondents responded to the telephone survey from their location when receiving the call.
Review of clinical registers and face-to-face interviewsBased on the study design, data collectors planned to ask nurses to report specific data items from the clinical register for key service delivery statistics during the time period of interest. The intended purpose of this was to gain a fuller, qualitative picture of the ef-fects of the broadcast on the target audience, including how the health messages delivered may have changed their actual clinical practices in their facilities and communities and thus influenced community health outcomes (e.g., increased early bookings). It was also planned for data collectors to follow with a series of site visits to actual facilities to cross-check the numbers reported from the clinical registers and the nurses’ IST record books. Due to the consistently low levels of exposure to the broadcast among survey respondents and the substantial variation in the key health messages delivered, however, the study team opted to omit this component of the study.
Face-to-face interviewIn addition to collecting data through the telephone survey for the purposes of the analysis, the data collection team also asked participants (at the end of the survey) whether they would be willing and able to participate in a follow-up face-to-face interview about the Health Care on Air broadcast to further discuss the issues discussed in the research. Of those participants willing to do a follow-up face-to-face interview, the data collection teams planned to identify five to ten sites to visit following completion of the telephone survey data collection period. The purpose of the face-to-face interview was to gather additional qualitative information about the reach, perceptions, and impact of the HCA broadcast. This component was also cancelled as none of the participants accepted the offer for an in-person interview.
Respondent SampleOf the targeted 117 community health nurses, 109 (93%) responded. Eight participants were not reached, either due to resignation, maternity leave with no for-warding address, or failure to reach them via telephone after five to six attempts. The distribution of postings in clinical facilities of the 109 respondents is summa-rized in Table 3.
RESULTSThis section includes a brief summary of the key results for each question. A full list of the survey responses and comments (grouped thematically) is provided in Table 4.
Table 4: Summary of survey responses by question
ORIGINAL RESEARCH
Designations (109 respondents) Nursing Stations
Health Centres
SD Hospitals
District Nurses 34 Zone Nurses & MCH Nurses 27 Hospital Nurses 33 CH Supervisors[HS/SSr] 10 Nurse Practitioners 5
Table 3: Breakdown of respondents by designation and facility type
Survey Question Response rate*
Avg. Score (out of 5) Interpretation of score
1. Were you aware of the Health Care on Air program last year? 100% 4.08 Was somewhat to very
familiar with it
Respondents found out through… Percentage Interpretation of comments
Supervisor/senior 55.0% (60/109) Over 70% of nurses heard about HCA by a supervisor or word of mouth; only 12% actually heard the official awareness campaign
Word of mouth 16.5% (18/109) HCA awareness 11.9%(13/109) No comments 11.9% (13/109) Not informed 5.5% (6/109)
Survey Question Response rate*
Avg. Score (out of 5) Interpretation of score
2. Did you listen to the Health Care on Air program? If so, how frequently did you tune in?
100% 2.87 Listened occasionally
Reasons for limited listening included… Percentage Interpretation of
comments No comment 32.1% (35/109) Nearly 70% of nurses
reported problems listening to the station, especially b/c of the network, work schedule, and lack of access to a radio
Reception/network 25.7% (28/109) Busy work schedule 22.0% (24/109) Lack of radio access 17.4% (19/109) Other 4.6% (5/109)
Survey Question Response rate*
Avg. Score (out of 5) Interpretation of score
3. If you listened to the program, how helpful would you say it was overall in teaching new knowledge or skills?
100% 4.15 Somewhat to very helpful
Reasons the program was helpful included… Percentage Interpretation of
comments Increased/updated knowledge 58.7% (64/109) Nearly 60% of nurses who
heard the program commented that they gained new knowledge; another 10% said it improved their work output
No comment 25.7% (28/109) Improved work output 10.1% (11/109) Enhanced clinical skills 6.4% (7/109)

4
FIJI JOURNAL OF PUBLIC HEALTH
Volume 3, Issue 1, 2014
ORIGINAL RESEARCH
Survey Question Response rate*
Avg. Score (out of 5) Interpretation of score
4. If you listened to the program, what was the extent to which the messages shared in the broadcast changed the way you carried out your work?
99% 3.89 Moderately to substantially changed
Comments on behaviour change included… Percentage Interpretation of
comments Led to improved service delivery 55.6% (60/108) Over 55% of nurses said HCA
helped them improve service delivery (in general); specific examples included immunisation coverage and documentation
No comment 22.2% (24/108) Led to improved immunization coverage
8.3% (9/108)
Led to improved documentation & reporting
8.3% (9/108)
Not enough listening time 7.4% (8/108)
Survey Question Response rate*
Avg. Score (out of 5) Interpretation of score
5. If you listened to the program, how useful would you say it was overall in helping you obtain points toward Continuing Nursing Education (CNE)?
100% 3.85 Somewhat to very useful
Comments on usefulness for CNE included… Percentage Interpretation of
comments Useful/very useful 50.5% (55/109) Half of the nurses said HCA
was useful for accumulating points toward continuing nursing education (CNE)
No comment 32.1% (35/109) Not informed 14.7% (16/109) Did not listen 3.7% (4/109)
Survey Question Response rate*
Avg. Score (out of 5) Interpretation of score
6. In your opinion, did the program have any effect on the sense of community or inclusion among nurses, particularly those posted in remote locations? If so, how so?
100% 4.77 Strong positive effect
Comments on sense of community/solidarity… Percentage Interpretation of
comments More informed, greater community awareness
47.7% (52/109) Nearly 80% of nurses said HCA contributed to a sense of community or solidarity among nurses
Greater sense of solidarity 32.1% (35/109) No comments 21.1% (23/109)
Survey Question Response rate*
Avg. Score (out of 5) Interpretation of score
7. In your opinion, do you think it would be worthwhile to repeat the Health Care on Air program?
100% 4.96 Very worthwhile
Comments about repeating the program…
Percentage Interpretation of comments
Yes, for capacity building, CNE points 49.5% (54/109) Nearly 50% of nurses proposed repeating HCA for the purpose of CNE; another 10% proposed a review/change of the content and timing
Repeat the program 26.6% (29/109) No comments 14.7% (16/109) Review program content and broadcasting time
10.1% (11/109)
Survey Question Response grouping Percentage Interpretation
8. What would you say were the most helpful or beneficial aspects of the broadcast?
Increased knowledge/information
59.6% (65/109)
The most commonly cited benefit of HCA was an increase in knowledge (59.6%), followed by improved service delivery (11.9%) and then a sense of connection/morale (6.4%) and for obtaining CNE points (6.4%)
No comment 20.2% (22/109)
Improved service delivery 11.9% (13/109)
Strengthened connection/morale
6.4% (7/109)
Helpful for CNE 6.4% (7/109) Community outreach 4.6% (5/109) No benefit 1.8% (2/109) Other 0.9% (1/109)
Survey Question Response grouping Percentage Interpretation
9. What would you say were the main weaknesses or limitations of the broadcast?
Network/reception issues 38.5% (42/109)
90% of nurses noted at least one weakness or limitation, with the most frequently cited problems relating to logistical issues such as reception (38.5%) and timing (31.2%)
Timing (inconvenient, too short...)
31.2% (34/109)
Program content/delivery 13.8% (15/109)
Lack of awareness 8.3% (9/109) Access to a radio 6.4% (7/109) No comment 6.4% (7/109) No limitations 4.6% (5/109)
Survey Question Response grouping Percentage Interpretation
10. If you were able to make changes to the program, how would you make it better?
Change timing 45.9% (50/109)
The most common suggestion was to make the timing of the program more convenient (45.9%), followed by suggestions about the approach to sharing the information (42.2%), and improving the content or delivery of the program (32.1%); less than 2% of people thought lack of awareness of HCA was an issue
Change content 19.3% (21/109)
Use different approach (e.g., CDs)
18.3% (20/109)
Improve network/reception 13.8% (15/109)
Improve delivery (pace, clarity…)
12.8% (14/109)
Listener interaction 10.1% (11/109)
No comment 8.3% (9/109) Provide a radio 2.8% (3/109)
Increase awareness 1.8% (2/109) Other 0.9% (1/109)
Survey Question Response rate* Avg. # Interpretation Average # of broadcasts listened to 93% 3.32 Respondents listed to an
average of 3.32 episodes
Question 1: Were you aware of the Health Care on Air program last year?Nearly 85% of the surveyed nurses said they were at least somewhat familiar with the HCA program during the broadcast period in 2012; 65% said they were very familiar with the program. When asked how they first learned about the program, over 70% of nurses said they heard about HCA from a nursing supervisor or by word of mouth; only 12% recall having heard or been exposed to the official awareness campaign messages or materials.
Figure 1: Number of episodes listened to by surveyed Community Health Nurses
5
FIJI JOURNAL OF PUBLIC HEALTH
Volume 3, Issue 1, 2014
ORIGINAL RESEARCH
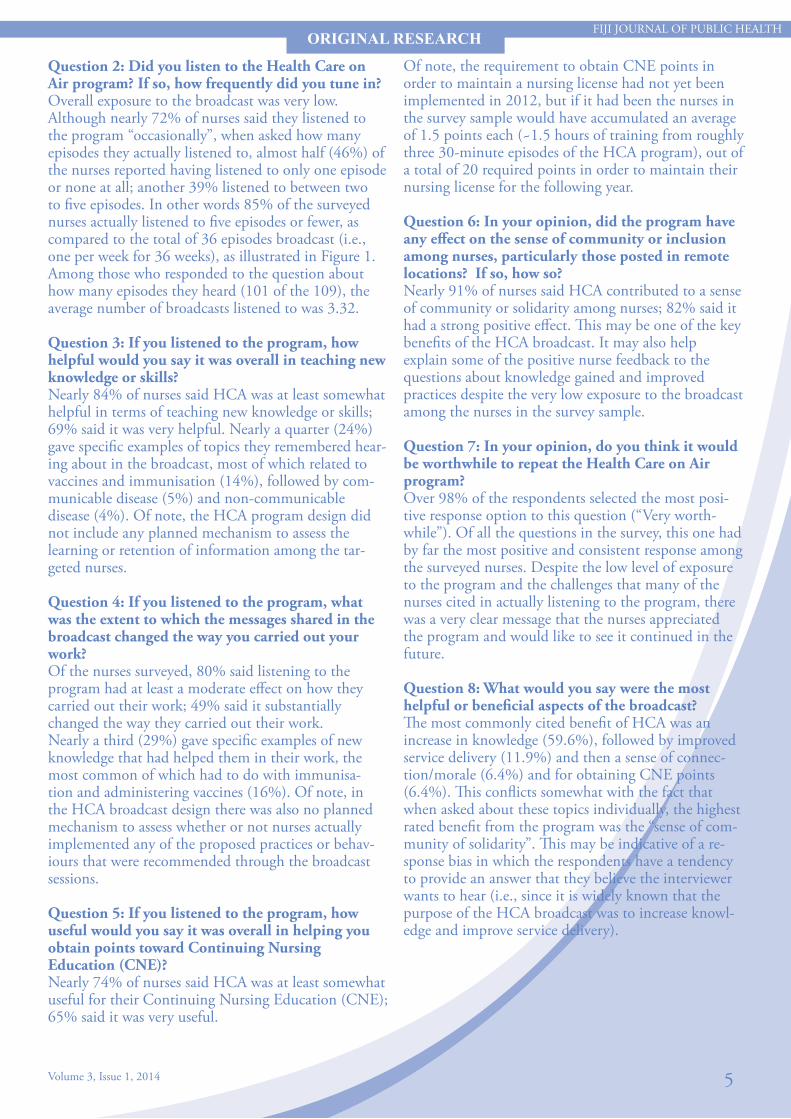
Question 2: Did you listen to the Health Care on Air program? If so, how frequently did you tune in?Overall exposure to the broadcast was very low. Although nearly 72% of nurses said they listened to the program “occasionally”, when asked how many episodes they actually listened to, almost half (46%) of the nurses reported having listened to only one episode or none at all; another 39% listened to between two to five episodes. In other words 85% of the surveyed nurses actually listened to five episodes or fewer, as compared to the total of 36 episodes broadcast (i.e., one per week for 36 weeks), as illustrated in Figure 1. Among those who responded to the question about how many episodes they heard (101 of the 109), the average number of broadcasts listened to was 3.32.
Question 3: If you listened to the program, how helpful would you say it was overall in teaching new knowledge or skills?Nearly 84% of nurses said HCA was at least somewhat helpful in terms of teaching new knowledge or skills; 69% said it was very helpful. Nearly a quarter (24%) gave specific examples of topics they remembered hear-ing about in the broadcast, most of which related to vaccines and immunisation (14%), followed by com-municable disease (5%) and non-communicable disease (4%). Of note, the HCA program design did not include any planned mechanism to assess the learning or retention of information among the tar-geted nurses.
Question 4: If you listened to the program, what was the extent to which the messages shared in the broadcast changed the way you carried out your work?Of the nurses surveyed, 80% said listening to the program had at least a moderate effect on how they carried out their work; 49% said it substantially changed the way they carried out their work.Nearly a third (29%) gave specific examples of new knowledge that had helped them in their work, the most common of which had to do with immunisa-tion and administering vaccines (16%). Of note, in the HCA broadcast design there was also no planned mechanism to assess whether or not nurses actually implemented any of the proposed practices or behav-iours that were recommended through the broadcast sessions.
Question 5: If you listened to the program, how useful would you say it was overall in helping you obtain points toward Continuing Nursing Education (CNE)?Nearly 74% of nurses said HCA was at least somewhat useful for their Continuing Nursing Education (CNE); 65% said it was very useful.
Of note, the requirement to obtain CNE points in order to maintain a nursing license had not yet been implemented in 2012, but if it had been the nurses in the survey sample would have accumulated an average of 1.5 points each (~1.5 hours of training from roughly three 30-minute episodes of the HCA program), out of a total of 20 required points in order to maintain their nursing license for the following year.
Question 6: In your opinion, did the program have any effect on the sense of community or inclusion among nurses, particularly those posted in remote locations? If so, how so? Nearly 91% of nurses said HCA contributed to a sense of community or solidarity among nurses; 82% said it had a strong positive effect. This may be one of the key benefits of the HCA broadcast. It may also help explain some of the positive nurse feedback to the questions about knowledge gained and improved practices despite the very low exposure to the broadcast among the nurses in the survey sample.
Question 7: In your opinion, do you think it would be worthwhile to repeat the Health Care on Air program?Over 98% of the respondents selected the most posi-tive response option to this question (“Very worth-while”). Of all the questions in the survey, this one had by far the most positive and consistent response among the surveyed nurses. Despite the low level of exposure to the program and the challenges that many of the nurses cited in actually listening to the program, there was a very clear message that the nurses appreciated the program and would like to see it continued in the future.
Question 8: What would you say were the most helpful or beneficial aspects of the broadcast?The most commonly cited benefit of HCA was an increase in knowledge (59.6%), followed by improved service delivery (11.9%) and then a sense of connec-tion/morale (6.4%) and for obtaining CNE points (6.4%). This conflicts somewhat with the fact that when asked about these topics individually, the highest rated benefit from the program was the “sense of com-munity of solidarity”. This may be indicative of a re-sponse bias in which the respondents have a tendency to provide an answer that they believe the interviewer wants to hear (i.e., since it is widely known that the purpose of the HCA broadcast was to increase knowl-edge and improve service delivery).

6
FIJI JOURNAL OF PUBLIC HEALTH
Volume 3, Issue 1, 2014
ORIGINAL RESEARCH
Question 9: What would you say were the main weaknesses or limitations of the broadcast?Roughly 90% of nurses noted at least one weakness or limitation, with the most frequently cited problems relating to logistical issues such as reception (38.5%), timing (31.2%), and program content/delivery (13.8%). These responses suggest that while there is a clear consensus among the rural nurses that the pro-gram should be continued, there is substantial room for improvement in terms of mode of delivery, timing, content, and other logistical aspects of the program.
Question 10: If you were able to make changes to the program, how would you make it better?The most common suggestion was to make the timing of the program more convenient (45.9%), followed by suggestions about the approach to sharing the informa-tion (42.2%), and improving the content or delivery of the program (32.1%); less than 2% of people thought lack of awareness of HCA was an issue. Detailed review of the specific suggestions offered would help refine and improve the HCA broadcast if it is to be repeated.
DISCUSSIONOverall the results from this rapid assessment indicate a relatively high level of perceived value and appre-ciation of the Health Care on Air broadcast from the rural community health nurse population that was targeted for the intervention despite substantial limitations in terms of the reach of the program. The clear and consistent message from the surveyed com-munity health nurses is that they would like to see the broadcast continued in the future, albeit modified and improved in several ways to make it easier for them to access and to improve the quality and delivery of the content. Although the majority of nurses said that they both gained new knowledge and improved the way they carry out their work as a result of the pro-gram, it is likely that these benefits were modest given that the nurses only listened to an average of roughly three 30-minute episodes each over the entire eight month broadcast period. One possible explanation for the nurses’ consistently positive feedback and positive perceptions of the broadcast is that it gave them a sense of inclusion or belonging to the group, which is rein-forced by the very strong affirmative response to the question about whether the HCA program contributed to a sense of community or inclusion, especially among nurses posted in remote locations. Limited in-service training opportunities in general may also have been a contributing factor.
A majority of the nurses felt that HCA contributed positively to their Continuing Nursing Education (CNE), although the low exposure to the broadcast meant that the actual amount of CNE points nurses were able to accumulate was very limited. The fact that the CNE points requirement to maintain a nursing license had not yet been implemented in 2012 means that the nurses did not have any formal obligation or incentive to listen to the program at that time. If the HCA broadcast is to be repeated in the future as an official mechanism for rural nurses to accumulate CNE points, there will likely be higher expectations from the nurses that the content will be made accessible to them. Another important consideration related to the potential use of the HCA program as an option for rural or remote nurses to accumulate CNE points is the cost of implementation. In this regard, it would be informative to do a cost analysis of CNE delivery via the HCA broadcast versus in-person training, such as at the closest sub-divisional hospitals, which routinely have in-service training opportunities. By factoring in all the associated costs, including transportation, lodging, food, etc. for the in-person training compared to the overall cost of delivering the HCA broadcasts, it would be possible to estimate an average “cost per nurse training hour” or “cost per CNE point” for the two different modes of delivering training. The financial factors should in turn be considered in the context of the impact of the training in terms of knowledge or skills gained. Listening to new in-formation on the radio is clearly a different learning experience from face-to-face presentations, facilitated discussion, group exercises, and interactive question-and-answer sessions. Similarly to how knowledge and skills are often assessed in a pre/post-test format during in-person trainings, it may be helpful for the National IST Program to consider incorporating a similar form of assessment into the HCA broadcast design if it is to be continued. There may be a variety of ways of implementing this but one possibility would be to co-ordinate the HCA training program with rural nurses’ visits to sub-divisional hospitals so that they have access to in-person sessions to assess, discuss, and rein-force the messages shared through the HCA broadcast.

FIJI JOURNAL OF PUBLIC HEALTHORIGINAL RESEARCH
As a next step, it is highly recommended that the National In-Service Training team and other relevant Ministry of Health stakeholders, including representa-tion from the rural nurses who are the target audience for the HCA program, review and discuss the findings from this rapid assessment (along with the proposed cost analysis) to determine the way forward, including whether or not the HCA broadcast should be continued. Some specific considerations include:• Review of various methods of dissemination to en-sure access by all targeted rural nurses, including issues of timing/availability, work schedules, network recep-tion, radio access, etc.• Quality assurance for the content, clarity and appro-priateness of messages delivered• Monitoring mechanism to track the number of pro-grams nurses actually listen to• Assessment mechanism to determine whether nurses have gained knowledge or skills as a result of the broadcast• Coordination of HCA with in-person training op-portunities to reinforce messages and learning• Opportunities for interactive discussion or question-and-answer sessions• Recorded broadcast sessions for easy dissemination, reference, and repeated use• Official approval of the HCA program as a source of CNE licensing points by the Nursing Council
ACKNOWLEDGMENTSThe authors wish to acknowledge the following per-sons and organisations for the implementation of the HCA program community health nurses in isolated and/or rural nursing stations:• Permanent Secretary for Health for facilitating the program as an official activity of the CHN• Staff of MOH Health Promotion Unit for their sup-port and technical assistance in the weekly recording of the sessions and in the preparations of the promo-tional and awareness materials amongst staff of the PH Services Division throughout the country.• The MOH Nursing Division in supporting the ini-tiative, and, the IST division for the lead role to host the programs.• The office of DMO and DHS Central for their kind support to the program.• FHSSP for supporting the initiative through budget-ary provision and for providing funding and technical assistance in completing the rapid assessment, with particular thanks to the data collection and technical support team, including Meliki Ceinaturaga, Oripa Niumataiwalu, and Iliesa Ravuci.
7Volume 3, Issue 1, 2014

8Volume 3, Issue 1, 2014
FIJI JOURNAL OF PUBLIC HEALTH
Keywords: Health Income and Expenditure Survey
Catastrophic and poverty impacts of health payments: results from the Health Income and Expenditure Survey (HIES) in Fiji
W Irava1*
INTRODUCTIONHealth care in most Pacific Island Countries (PICs) is mainly financed by Governments through general taxation. There are few exceptions such as in the case of the Federated States of Micronesia which receives most funds for health from the United States, although these funds are channeled through the Government system. The Pacific stands in contrast to Asia, where health care in most Asian countries is financed by out-of-pocket (OOP) payments by individuals (O’Donnell et al., 2008a). One cause of this difference is that the Pa-cific countries because of their isolation, small size and small populations, together with health systems that largely offer free government funded health services, results in an environment with little incentive and small demand towards developing a private health sec-tor. And thus subsequently, low levels of OOP towards funding health care. OOP payments for health have been cited as one of the major reasons for inequitable access to health services and contribute to increased impoverishment amongst households. Studies conducted by EQU-ITAP1 amongst countries in the Asia-Pacific region show evidence of this, although the results were more supportive amongst Asian countries but less so amongst Pacific Islands. It is thus unclear whether OOP drives households into health catastrophe and impoverishment amongst PICs. This paper attempts to answer that question using the context of Fiji. Amongst all the PICs, Fiji has one of the largest known shares of health expenditure that is funded by OOP. This is mainly due to the presence of a signifi-cant private health sector. In comparison to most PICs Fiji also has a more advanced health system that offers a variety of specialized health care services which often caters for referred patients from smaller neighboring PICs. In 2012, Fiji National Health Accounts esti-mate OOP as representing 27% of current total health expenditure.
OBJECTIVEThe objective of this study was to ascertain whether OOP drives households into health catastrophe and impoverishment in the Fiji Islands.
METHODSData sourceThe unit of analysis is health expenditure related to total consumption at the household level. Data were obtained from the Fiji Household Income and Expenditure Survey (HIES) 2010. This survey con-tained a nationally represented sample. This household survey is conducted by the Fiji Bureau of Statistics (FBOS) every five years and the sample households are not necessarily the same every time the survey is under-taken. The numbers of sampled households in the survey was 3567. Records of household consumption ex-penditure over 12-month period covered all items of household spending, including payments for self-med-ication and patient services at various levels of health-care facilities. This is the only such survey published in Fiji. The HIES collected data on household living standards, including healthcare spending and covered all provinces in Fiji. The HIES includes a detailed household consumption module, which is used here to categorize the population into equal quintiles, ranked according to relative living standards, measured using consumption per adult-equivalent. This measure takes into account production of food and other goods by families for their own use, as well as the effect of gifts.
Measures of catastrophic expenditure and impoverishmentThe definitions and measures of catastrophic expendi-ture and impoverishment have been described clearly in literature (O’Donnell et al., 2008b). Catastrophic expenditure results when household resources are used for the payment of healthcare services, and where this expenditure upsets the living standard of the house-hold. Impoverishment occurs when a household falls below a certain poverty line due to the incurrence of health expenditures. The World Bank defined poverty lines at $1.08 per day, 2.15 per day and the Fiji Na-tional Poverty Line (FNPL) was used for measuring impoverishment.
1. Centre for Health Information Policy and Systems Research (CHIPSR), College of Medicine Nursing and Health Sciences, Fiji National University, Address for Correspondence : [email protected]
ORIGINAL RESEARCH
9
FIJI JOURNAL OF PUBLIC HEALTH
Volume 3, Issue 1, 2014
Data analysisVersion 12 of the Stata statistical software was used to undertake all analysis. Respondents were weighted according to the probability of each household unit being sampled to reflect the entire Fiji population. Weighting factors were provided by the FBOS.
RESULTS AND FINDINGS
Incidence Catastrophic health expenditureThe numbers of households with catastrophic health expenditure in 2010 were calculated as a percentage of all households at four threshold levels of 5%, 10%, 15% and 25%. This was done for overall household ex-penditure and household non-food expenditure (total household expenditure less food expenditure). This is shown in Figure 1.
Figure 1 Incidence of catastrophic health expenditure
In general the incidence of catastrophe in households in Fiji is small. In terms of total household expendi-ture, less that 1% of households face catastrophic expenditure at the 10% threshold level. Catastrophic incidence doubles when health expenditures are taken as a percentage of non-food household expenditure. At the 25% threshold level, catastrophic incidence is close to zero.
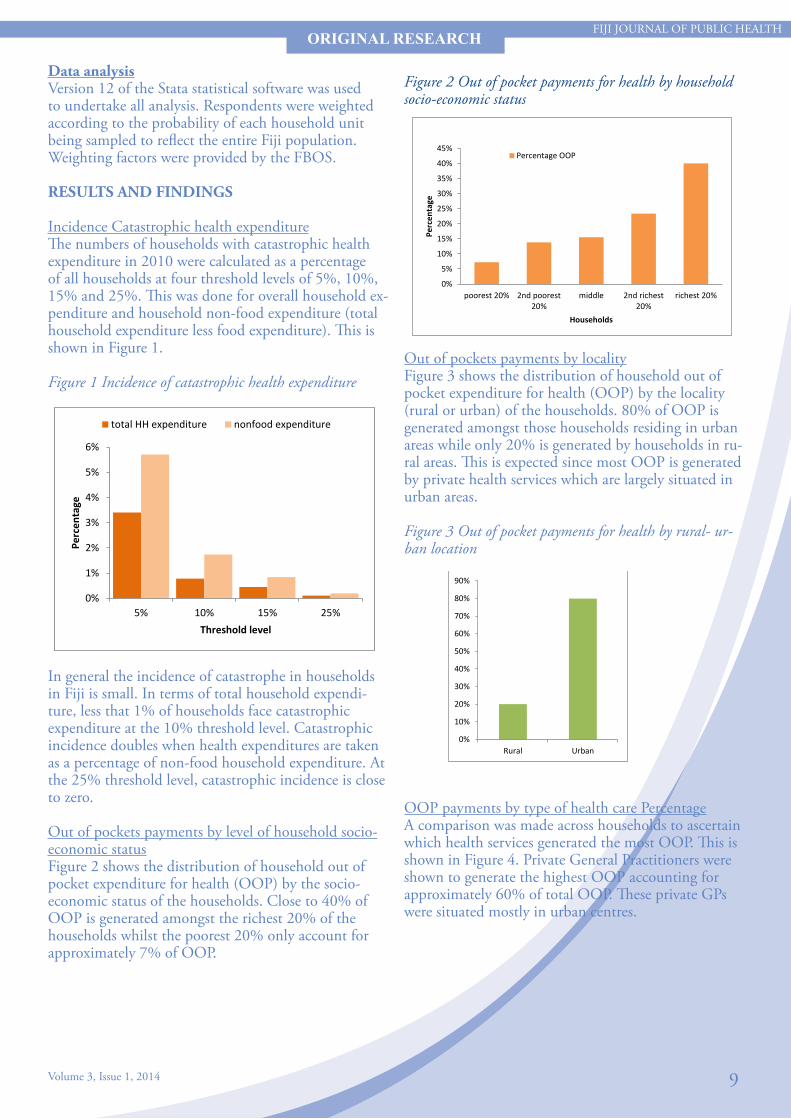
Out of pockets payments by level of household socio-economic statusFigure 2 shows the distribution of household out of pocket expenditure for health (OOP) by the socio-economic status of the households. Close to 40% of OOP is generated amongst the richest 20% of the households whilst the poorest 20% only account for approximately 7% of OOP.
ORIGINAL RESEARCH
In general the incidence of catastrophe in households in Fiji is small. In terms of total household expenditure, less that 1% of households face catastrophic expenditure at the 10% threshold level. Catastrophic incidence doubles when health expenditures are taken as a percentage of non-food household expenditure. At the 25% threshold level, catastrophic incidence is close to zero. Out of pockets payments by level of household socio-economic status Figure 2 shows the distribution of household out of pocket expenditure for health (OOP) by the socio-economic status of the households. Close to 40% of OOP is generated amongst the richest 20% of the households whilst the poorest 20% only account for approximately 7% of OOP. Figure 2 Out of pocket payments for health by household socio-economic status
0%
1%
2%
3%
4%
5%
6%
5% 10% 15% 25%
Perc
enta
ge
Threshold level
total HH expenditure nonfood expenditure
Figure 2 Out of pocket payments for health by household socio-economic status
Out of pockets payments by localityFigure 3 shows the distribution of household out of pocket expenditure for health (OOP) by the locality (rural or urban) of the households. 80% of OOP is generated amongst those households residing in urban areas while only 20% is generated by households in ru-ral areas. This is expected since most OOP is generated by private health services which are largely situated in urban areas.
Figure 3 Out of pocket payments for health by rural- ur-ban location
OOP payments by type of health care PercentageA comparison was made across households to ascertain which health services generated the most OOP. This is shown in Figure 4. Private General Practitioners were shown to generate the highest OOP accounting for approximately 60% of total OOP. These private GPs were situated mostly in urban centres.
Out of pockets payments by locality Figure 3 shows the distribution of household out of pocket expenditure for health (OOP) by the locality (rural or urban) of the households. 80% of OOP is generated amongst those households residing in urban areas while only 20% is generated by households in rural areas. This is expected since most OOP is generated by private health services which are largely situated in urban areas. Figure 3 Out of pocket payments for health by rural- urban location
OOP payments by type of health care
0%
5%
10%
15%
20%
25%
30%
35%
40%
45%
poorest 20% 2nd poorest20%
middle 2nd richest20%
richest 20%
Perc
enta
ge
Households
Percentage OOP
20%
80%
0%
10%
20%
30%
40%
50%
60%
70%
80%
90%
Rural Urban

10
FIJI JOURNAL OF PUBLIC HEALTH
Volume 3, Issue 1, 2014
ORIGINAL RESEARCH
Figure 4 Out-of-pocket spending for health by type of health service
A comparison was made across households to ascertain which health services generated the most OOP. This is shown in Figure 4. Private General Practitioners were shown to generate the highest OOP accounting for approximately 60% of total OOP. These private GPs were situated mostly in urban centres. Figure 4 Out-of-pocket spending for health by type of health service
OOP payments and household budgets The frequency of catastrophic health expenditures is relatively low in Fiji when compared with other Asian countries. Only 0.9% of households in Fiji allocated more than 10% of their budget to health. The primary reason for the low frequency of catastrophic expenditures is the low overall level of household spending (see Figure 5). Figure 5 Percentage of population spending more than 10% of household budget on health
OOP payments and household budgetsThe frequency of catastrophic health expenditures is relatively low in Fiji when compared with other Asian countries. Only 0.9% of households in Fiji allocated more than 10% of their budget to health. The primary reason for the low frequency of catastrophic expendi-tures is the low overall level of household spending (see Figure 5).
Figure 5 Percentage of population spending more than 10% of household budget on health
Source of data for other countries: Eddy Van Doorslaer et. al. (2007)
Impoverishment due to health payments Pre-OOP impoverishment referred to those households whose consumptions were already below the poverty line before deduction of any OOP health payments. Post-OOP impoverishment referred to those households who moved from above to below the poverty line when OOP expenditure is taken into account. Thus households were considered impoverished by health payments if after making these health payments, their average consumption was found to move below a threshold poverty line. Figure 6 shows the percentage of the population falling below the international poverty line of PPP $1.08/day after accounting for OOP. In comparison to some Asian countries, the impact of OOP on impoverishment of households is minimal. One possible reason for this is that Fiji’s health system largely provides free health services that are funded and managed by the Government, with a small private sector that caters mainly for the urban population. Figure 6 Percentage of population falling below the international poverty line of PPP $1.08/day
Thus households were considered impoverished by health payments if after making these health payments, their average consumption was found to move below a threshold poverty line. Figure 6 shows the percentage of the population fall-ing below the international poverty line of PPP $1.08/day after accounting for OOP. In comparison to some Asian countries, the impact of OOP on impoverish-ment of households is minimal. One possible reason for this is that Fiji’s health system largely provides free health services that are funded and managed by the Government, with a small private sector that caters mainly for the urban population.
Figure 6 Percentage of population falling below the inter-national poverty line of PPP $1.08/day
LIMITATIONSOther than a small sample size, the Fiji HIES design suffers from one significant limitation that restricts what health equity analyses can be done and reduces its usefulness compared to HIES surveys in the region (example PNG and Solomon Islands). The survey lacks questions on healthcare utilization; a section that is commonly found in most other HIES in the region. Thus analyses relating to utilization of health services are not possible. There is ongoing dialogue between the Ministry of Health and the Fiji Bureau of Statistics (FBOS) on expanding the HIES to include more health related questions pertaining to healthcare expenditure and utilization.
DISCUSSION AND CONCLUSIONThis is the first reported study in Fiji that has used the Household Income and Expenditure Survey to estimate household spending on health, and examine whether these health payments lead to catastrophic health expenditures or impoverishment in households.Analysis of the Fiji HIES 2010 enables us to present an overview of health spending patterns in Fiji. Majority of health providers in Fiji are Government owned and health services are provided at no cost. Thus overall OOP on health in Fiji is not high.
Source of data for other countries: Eddy Van Doorslaer et. al. (2006)
Limitations Other than a small sample size, the Fiji HIES design suffers from one significant limitation that restricts what health equity analyses can be done and reduces its usefulness compared to HIES surveys in the region (example PNG and Solomon Islands). The survey lacks questions on healthcare utilization; a section that is commonly found in most other HIES in the region. Thus analyses relating to utilization of health services are not possible. There is ongoing dialogue between the Ministry of Health and the Fiji Bureau of Statistics (FBOS) on expanding the HIES to include more health related questions pertaining to healthcare expenditure and utilization. Discussion and Conclusion This is the first reported study in Fiji that has used the Household Income and Expenditure Survey to estimate household spending on health, and examine whether these health payments lead to catastrophic health expenditures or impoverishment in households. Analysis of the Fiji HIES 2010 enables us to present an overview of health spending patterns in Fiji. Majority of health providers in Fiji are Government owned and health services are provided at no cost. Thus overall OOP on health in Fiji is not high. OOP health spending in Fiji is concentrated amongst the richer urban population. This is because all private health facilities that charge fees for health services are located in urban centres. While there are some user fees charged at government owned health facilities, these are minimal. Because majority of OOP spending on health is incurred by the richer households of the population, consequently in Fiji OOP does not result in high impoverishment or catastrophic financial impacts since the richer urban population have a higher propensity to be able to pay for charged health services. This is not to say that the poor have no financial barriers to access healthcare. In-kind costs and indirect costs incurred due to accessing healthcare such as transport, lodgings and traditional
Impoverishment due to health paymentsPre-OOP impoverishment referred to those house-holds whose consumptions were already below the poverty line before deduction of any OOP health payments. Post-OOP impoverishment referred to those households who moved from above to below the poverty line when OOP expenditure is taken into account.

FIJI JOURNAL OF PUBLIC HEALTH
Volume 3, Issue 1, 2014 11
OOP health spending in Fiji is concentrated amongst the richer urban population. This is because all private health facilities that charge fees for health services are located in urban centres. While there are some user fees charged at government owned health facilities, these are minimal. Because majority of OOP spending on health is incurred by the richer households of the population, consequently in Fiji OOP does not result in high impoverishment or catastrophic financial impacts since the richer urban population have a higher propensity to be able to pay for charged health services. This is not to say that the poor have no financial barriers to access healthcare. In-kind costs and indi-rect costs incurred due to accessing healthcare such as transport, lodgings and traditional healers (not cap-tured in the HIES) are perhaps costs more likely to be incurred by the rural and poorer households in Fiji. Expanding the questions in the HIES to ask about healthcare utilization will also be most useful in assess-ing the equity of healthcare utilization in Fiji. In 2011 the Government slightly revised user-fee charges at government health facilities, and so it is expected that health spending patterns (today) may have changed slightly from what is presented in this analysis. The National Statistics Office (FBOS) is currently under-taking the next HIES and it would be interesting to compare trends and changes in health spending. In the Pacific where the private sector is expand-ing, public-private partnerships are being promoted, visiting health specialist teams are becoming more frequent, and where there is an increasing rate in overseas referrals for specialized clinical care, policy-makers should consider introducing effective measures to monitor the impact of OOP on households, and regulate price, quantity and quality of care provided.
REFERENCESEQUITAP. Equity in Asia-Pacific health systems – EQUITAP Project. Available at: http://www.equitap.org Doorslaer, E., O. O’Donnell, et al. (2006). “Effect of payments for health care on pov-erty estimates in 11 countries in Asia: an analysis of household survey data.” Lancet 368(9544): 1357-1364Doorslaer, E., O. O’Donnell, et al. (2007). “Catastrophic payments for health care in Asia.” Health Economics 16(11): 1159-1184.Fiji National Health Accounts 2009-2010 (2012), Fiji Ministry Of Health, Suva. Fiji. Health Income and Expenditure Data (2010), Fiji Bureau of Statistics (FBOS), FijiO. O’Donnell, Doorslaer, E. V. & Rannan-Eliya, R. P. 2008a. Who pays for health care in Asia? Journal of Health Economics, 27, 460-475.O. O’Donnell., Doorslaer, E. V., Wagstaff, A. & Lindelow, M. 2008b. Analyzing health equity using household survey data: a guide to techniques and their implementation, Washington, DC, World Bank.
ORIGINAL RESEARCH

12
FIJI JOURNAL OF PUBLIC HEALTH
Volume 3, Issue 1, 2014
INTRODUCTION“Delivering quality health care depends on capturing accurate and timely medical data”1 to enable effective monitoring and evaluation of practice. Accuracy of clinical data is mainly reliant on the abilities of two key health care providers:• The ability of the recording Clinician to adequately provide sufficient information to reflect the patient’s encounter and justification for the diagnosis, treatment and end result; and• The ability of the Clinical coder to appropriately translate such information into coded formats that will also reflect the patient’s encounter with the health care facility.“Health information coding is the transformation of verbal descriptions of diseases, injuries, and procedures into numeric or alpha-numeric designations”1 Audit is the professional examination of the records and proce-dures. For clinical coding to be as valuable as possible it is critical the coder has access to a comprehensive and accurate medical record, the skills to extract all relevant data for coding and access to clinicians to ask questions and seek clarification.
Common sources of coding errors include: clerical (careless mistakes, transposing numbers); judgmental (wrong subjective decisions taken); knowledge (mistakes due to coder knowledge); systematic (errors in the process of coding or problems with the environment in which coders work); documentation (incomplete, inaccurate, ambiguous, conflicting, illegible documents). Indirectly this translates as documentation, incomplete medical records, data entry, workload, human resources, education and training, reference materials and infrastructural, social and political environments affecting the coding quality. Assessing the quality of coding was one of the ma-jor activities in the Health Information Business Plan 2013.The use of the Australian Coding Benchmark Audit (ACBA) tool was piloted at CWM Hospital in Suva, Fiji
ORIGINAL RESEARCH
CODING AUDIT AT COLONIAL WAR MEMORIAL HOSPITALMataitoga K1*, Nand D1, Delai M Y2, Bali A1
ABSTRACTMortality and morbidity coding is undertaken in the Republic of Fiji for health data. Consequently, regular audits assist in ascertaining coding quality. The Ministry of Health of the Republic of Fiji undertook a pilot study using the Australian Coding Benchmark Audit [ACBA]tool to assess coding quality at the Colonial War Memorial (CWM) Hospital in Suva in 2013. The audit was conducted on records from 1st January to 30th June 2013. Five percent (n= 582) of a total of 11640 discharges were audited. The results illustrate that there were coding errors in 40% of the sample audited. These errors encompassed both diagnosis (74%) and procedural code errors (26%). Out of these 98% were major diagnosis errors. In conclusion, health systems strengthening efforts are required to improve the quality of coded data.
1. Health Information Unit, Ministry of Health2. Research Unit, Ministry of Health* Address for Correspondence: [email protected]/[email protected]
Keywords: Coding audit
13
FIJI JOURNAL OF PUBLIC HEALTH
Volume 3, Issue 1, 2014
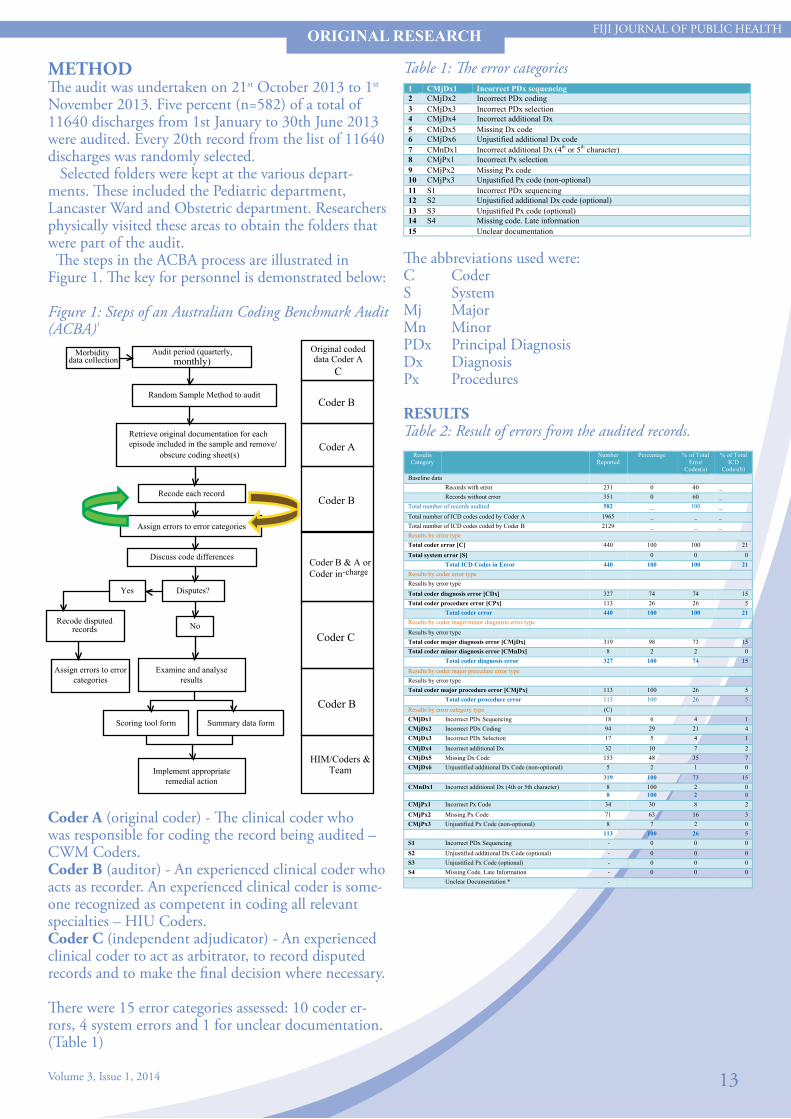
Table 1: The error categories
The abbreviations used were:C CoderS SystemMj MajorMn MinorPDx Principal DiagnosisDx DiagnosisPx Procedures
RESULTSTable 2: Result of errors from the audited records.
METHODThe audit was undertaken on 21st October 2013 to 1st November 2013. Five percent (n=582) of a total of 11640 discharges from 1st January to 30th June 2013 were audited. Every 20th record from the list of 11640 discharges was randomly selected. Selected folders were kept at the various depart-ments. These included the Pediatric department, Lancaster Ward and Obstetric department. Researchers physically visited these areas to obtain the folders that were part of the audit. The steps in the ACBA process are illustrated in Figure 1. The key for personnel is demonstrated below:
Figure 1: Steps of an Australian Coding Benchmark Audit (ACBA)1
ORIGINAL RESEARCH
Morbidity data collection
Audit period (quarterly, monthly)
Random Sample Method to audit
Retrieve original documentation for each episode included in the sample and remove/
obscure coding sheet(s)
Recode each record
Assign errors to error categories
Discuss code differences
Disputes?
Yes
Recode disputed records
No
Assign errors to error categories
Examine and analyse results
Scoring tool form
Summary data form
Implement appropriate remedial action
Original coded data Coder A
C
Coder B
Coder A
Coder B
Coder B & A or
Coder in-charge
Coder C
Coder B
HIM/Coders & Team
1 CMjDx1 Incorrect PDx sequencing 2 CMjDx2 Incorrect PDx coding 3 CMjDx3 Incorrect PDx selection 4 CMjDx4 Incorrect additional Dx 5 CMjDx5 Missing Dx code 6 CMjDx6 Unjustified additional Dx code 7 CMnDx1 Incorrect additional Dx (4th or 5th character) 8 CMjPx1 Incorrect Px selection 9 CMjPx2 Missing Px code 10 CMjPx3 Unjustified Px code (non-optional) 11 S1 Incorrect PDx sequencing 12 S2 Unjustified additional Dx code (optional) 13 S3 Unjustified Px code (optional) 14 S4 Missing code. Late information 15 Unclear documentation
Results Category
Number Reported
Percentage % of Total Error
Codes(a)
% of Total ICD
Codes(b) Baseline data Records with error 231 0 40 _ Records without error 351 0 60 _ Total number of records audited 582 _ 100 _ Total number of ICD codes coded by Coder A 1965 _ _ _ Total number of ICD codes coded by Coder B 2129 _ _ _ Results by error type Total coder error [C] 440 100 100 21 Total system error [S] 0 0 0 Total ICD Codes in Error 440 100 100 21 Results by coder error type Results by error type Total coder diagnosis error [CDx] 327 74 74 15 Total coder procedure error [CPx] 113 26 26 5 Total coder error 440 100 100 21 Results by coder major/minor diagnosis error type Results by error type Total coder major diagnosis error [CMjDx] 319 98 73 15 Total coder minor diagnosis error [CMnDx] 8 2 2 0 Total coder diagnosis error 327 100 74 15 Results by coder major procedure error type Results by error type Total coder major procedure error [CMjPx] 113 100 26 5 Total coder procedure error 113 100 26 5 Results by error category type (C) CMjDx1 Incorrect PDx Sequencing 18 6 4 1 CMjDx2 Incorrect PDx Coding 94 29 21 4 CMjDx3 Incorrect PDx Selection 17 5 4 1 CMjDx4 Incorrect additional Dx 32 10 7 2 CMjDx5 Missing Dx Code 153 48 35 7 CMjDx6 Unjustified additional Dx Code (non-optional) 5 2 1 0 319 100 73 15 CMnDx1 Incorrect additional Dx (4th or 5th character) 8 100 2 0 8 100 2 0 CMjPx1 Incorrect Px Code 34 30 8 2 CMjPx2 Missing Px Code 71 63 16 3 CMjPx3 Unjustified Px Code (non-optional) 8 7 2 0 113 100 26 5 S1 Incorrect PDx Sequencing - 0 0 0 S2 Unjustified additional Dx Code (optional) - 0 0 0 S3 Unjustified Px Code (optional) - 0 0 0 S4 Missing Code. Late Information - 0 0 0 Unclear Documentation * -
Coder A (original coder) - The clinical coder who was responsible for coding the record being audited – CWM Coders.Coder B (auditor) - An experienced clinical coder who acts as recorder. An experienced clinical coder is some-one recognized as competent in coding all relevant specialties – HIU Coders.Coder C (independent adjudicator) - An experienced clinical coder to act as arbitrator, to record disputed records and to make the final decision where necessary.
There were 15 error categories assessed: 10 coder er-rors, 4 system errors and 1 for unclear documentation. (Table 1)

14
FIJI JOURNAL OF PUBLIC HEALTH
Volume 3, Issue 1, 2014
ORIGINAL RESEARCH
Figure 2: Percentage of records with and without error Figure 5: Percentage by error category type - diagnosis
Figure 6:Percentage by error category type - procedure
Figure 3:Percentage by coder error type.
Figure 4: Percentage by coder major/minor diagnosis error by type
DISCUSSIONMajority of the audited records (60%) were correctly coded, with 40% incorrectly coded reports [Figure 2].
The total number of codes coded by Coders’ A was 1965 and the total number of codes coded by Coders B was 2129 which showed a difference of 164 codes. There was a discrepancy note in the number of records coded by Coders A and Coders B which demonstrated that some diseases or conditions had not been coded at all by Coders A (Table 2].
There was a 74% (n=327) coder diagnosis errors (CDx) and26% (n=113) coder procedure errors (CPx)of the total coder errors. Most of theseCDx errors were sub classified as follows:• Incorrect additional diagnosis 4th or 5th character (CMnDx1) - 2%• Incorrect principal diagnosis sequencing (CMjDx1) - 4%• Incorrect principal diagnosis coding (CMjDx2) - 21%• Incorrect principal diagnosis selection (CMjDx3) - 4%• Incorrect additional diagnosis (CMjDx4) - 7%• Missing diagnosis code (CMjDx5) - 35%• Unjustified additional diagnosis code (non-optional) (CMjDx6) - 1%

15
FIJI JOURNAL OF PUBLIC HEALTH
Volume 3, Issue 1, 2014
ORIGINAL RESEARCH
In addition, 98% (n=319) of the total coder errors were major diagnosis errors which included the spec-trum of missing codes, incorrect selection of principal diagnosis, incorrect code, incorrect principal selection and incorrect additional code [Figure 4]. This clearly indicates the need for regular audits, regular profes-sional development and skills retraining for the coders. Moreover, 47% (n=153) of the coder diagnosis errors were missing diagnosis codes where coders had omitted coding some of the diagnosis of infectious agents, vectors or complications of delivery. The CPx errors were as follows:• Incorrect procedure code (CMjPx1) - 8%• Missing procedure code (CMjPx2) - 16%• Unjustified procedure code (non-optional) (CMjPx3) - 2% Furthermore, therewere atotal of 113 coder proce-dure errors. Out of these 63% (n=71) were missing procedure codes, 30% (n=34) were incorrect procedure codes where the coders had omitted the coding of epi-siotomy repairs and allied health interventions [Figure 6]. Reiteration on the continual coder support and gov-ernance from the Health Information Unit is required to effectively respond to the errors in coding. This includes the entire spectrum of continual professional development, training, monitoring and evaluating, infrastructural facilitation. The duality of roles of coders in the Fiji setting may be a factor compounding the error rates. Currently, the coders perform both the duties of the recorder and coder making it difficult to realize coding errors.
LIMITATIONSThere were limitations in the number of human re-sources available for conducting and completing the coding audit. In addition logistic problems in accessing folders were noted: folders were kept in different wards (Paeds, Lan-caster, Maternity) consuming valuable time in retrieval; improper filing of folders; and a lack of space for filing.Missing folders were replaced by selecting another random sample to maintain the sample size.
RECOMMENDATION & CONCLUSION Health statistics are public goods needed not only by health institutions but by the government, the media, researchers, businesses, civil society, donors and other organizations. The health department needs accurate and quality health statistics to fully support national level decision making and initiate evidence based policy and planning discussions. Policymakers need accurate and quality health statis-tics to make the right health-related decisions. Public health professionals need accurate and quality health
statistics for planning preventative and control pro-grams, evaluating and re-planning existing programs and develop screening and surveillance programs. This potentiates the need to ensure correct coding to facili-tate correct analysis of health data in order to provide correct information for policymakers. There is a need to continually and regularly audit all coded records. This must be made a regular deliverable of the Health Information Unit and be embedded in routine practice for the Unit. A framework for coders must also be developed to mandatorily undertake cod-ing refreshers on a yearly basis. Consequently all coders must be administered under the management of the Health Information Unit. On an infrastructural note a consistent and stand-ardized practice of folder storage, filing systems and retrieval must be implemented to allow easy access of the folders for operational and research purposes.
ACKNOWLEDGEMENTThe Health Information Unit acknowledges the sup-port of the Medical Superintend Dr Jemesa Tudravu who endorsed the audit to be carried out at the CWM Hospital.We also acknowledge the endorsement by the National Health Information Committee for this exercise.
REFERENCES1. http://www.the-himan.org/ideal_coding.html2. http://www.docstoc.com/docs/47869346/Sample- Medical-Record-Audit-Form---PowerPoint3. Australian Coding Benchmark Audit (ACBA), National Centre for Classification in health, second edition 2001pp.4-14

FIJI JOURNAL OF PUBLIC HEALTH
Volume 3, Issue 1, 2014 16
Evaluation of the Dengue Clinical Training Package – Fiji Dengue Outbreak 2013-2014:
Nand D1*, Rabukawaqa I2, Kama M3, Jenkins K2,Nilles E.J4, Naidu R5, Jenney A.W.J 6, Sahukhan A3,Tikoduadua L5, Nasome J 7, Matanaicake J4
ABSTRACT
Dengue fever is endemic to Fiji and outbreaks are common in this setting. The current outbreak which extended from October 2013 to April 2014 was forecasted to collectively have between 12000 – 48 000 cases (modelling done by London School of Tropical Hygiene). The Dengue Fever Outbreak between December 2013 and March 2014 resulted in significant burden on the health care services in the Republic of Fiji. One of the strategies used to control this outbreak was standardiza-tion in the clinical management of the Dengue patient. The mode of training involved modification of the Dengue Clinical Practice Package from the World Health Organization to encompass the Pacific setting and the Fiji situation. A pre and post test was conducted for par-ticipants involved in this training to gauge the effectiveness of the package. The test revealed that there was a significant difference in uptake after the training for the Central and North-ern participants. However, there was no significant difference in uptake in the Western division although the post-tests marks were noted to be increased.
Keywords: Evaluation, Dengue Clinical Training Package, Dengue Outbreak
ORIGINAL RESEARCH
INTRODUCTIONDengue fever is endemic to Fiji. Dengue fever out-breaks in Fiji tend to impose a significant burden to the people of Fiji and in particular the Ministry of Health. The burden of the prevailing dengue fever outbreak which began in December last year, has sur-passed the impact of other dengue outbreaks over the last 4 decades. To adequately manage and coordinate the response to the current dengue outbreak, the Ministry of Health established a National Dengue Taskforce and under it four technical working groups namely, the Surveil-lance, Clinical Management, Communications and the Clinical Management working groups. With the increasing weekly incidence of dengue cases and dengue deaths from December 2013 to March 2014, together with the daily surge of patients presenting with dengue like illness at the hospitals, health centres around the country, the Dengue Task-force endorsed the Clinical Management working
groups recommendation for the formulation and roll-out of a training of trainers (TOT) on the WHO updated guidelines of Dengue clinical management for the three health divisions (Central, Northern and Western). Accordingly, the Dengue Clinical Management Training of trainers was conducted in three sites from 10- 14 March, namely at the CWM Hospital in the Central division, Lautoka (Western division) and in Labasa (Northern division). Nominations were made by the Divisional Medical Officers and Medical Su-perintendents to attend training of trainer’s workshop from the three health divisions. The Taskforce implemented a monitoring frame-work that tracked the trainers planned activities to up-skill and standardize clinical practice forfellow doctors and nurses in their medical areas. The updated guide-lines were made available to all doctors and nurses around the country (private and public).
OBJECTIVETo conduct training of trainers in clinical manage-ment of dengue to standardize clinical practice and to evaluate the TOT package for Clinical Management of Dengue (process evaluation)
1. Health Information Unit, Ministry of Health2. Fiji Health Sector Support Programme3. Fiji Centre for Communicable Disease Control, Ministry of Health4. WHO, Representative Office for the South Pacific, Fiji5. Colonial War Memorial Hospital, Ministry of Health6. College of Medicine, Nursing & Health Sciences, Fiji National University7. Fiji College of General Practitioners* Address for Correspondence: [email protected]

FIJI JOURNAL OF PUBLIC HEALTH
Volume 3, Issue 1, 2014 17
METHODParticipants for this dengue clinical management training of trainer workshop were nominated to attend the training from the 4 health divisions. Participants were provided hardcopies of the presentations dur-ing the training to serve as a guide. Each participant was also offered a USB that had copies of the training package. The package included:1. A TOT PowerPoint presentation (3 hours)2. Continuing Medical Education PowerPoint slides (1 hour)3. Pre and post Test4. Dengue lIke illness Line list (excel format) The training sessions were conducted at specific venues within the 3 health divisions. Infectious disease personnel from the Ministry of Health, World Health Organization South Pacific Office, and the College of Medicine Nursing and Health Sciences of the Fiji National University facilitated the conduct of these training of trainer’s workshop. For each of the training sessions, the Clinical Man-agement Technical Working Group of the Dengue Taskforce ensured the availability of three facilitators to undertake the training. The training procedure was largely power-point presentations by the facilitators. Interactive discussions were encouraged during or at the end of each presenta-tion. The topics that were covered during the training included: I. Dengue VirusII. TransmissionIII. EpidemiologyIV. Case definition and clinical courseV. Clinical diagnosis and differential diagnosisVI. Clinical and laboratory assessment (with case studies)VII. Management and Treatment (with case studies) The facilitators shared the presentations for the first 6 topics then undertook an interactive session with participants for topic VII. Participants were encour-aged and inspired enough by the training to present and discuss complicated cases of dengue for topic VII.A pre and post evaluation was conducted to gauge their overall level of understanding on the clinical manage-ment of dengue fever.
RESULTS
ORIGINAL RESEARCH
Division Doctors Nurses Others Private Sector Total Central 8 0 5 2 15 Western 13 12 9 2 36 Northern 11 18 3 1 33 Total 32 30 17 5 84
Table 1.0 Participant Distribution
Table 2.0 Number of participants tested for pre-test and post-test
Table 3.0 Pre-test and post-test data analysis
A total of 83 health personnel from various cadres participated in the training of trainer’s workshop as demonstrated by table 1.0. Of this number 32 were doctors from Government health facilities, 4 were doctors from the private health sector, 30 were nurses from Government and 17 other cadres particularly the lab and the health inspectors.
Table 2.0 indicates that not all participants completed the pre- and post-test training evaluation with most (n=23) not completing the post-test evaluation. This suggests a proportion of trainees were not assessed on their knowledge of dengue fever clinical management following the training due to constraints in human resources and the inability of the participants to complete the training due to the outbreak situation.
Table 3.0 demonstrates that the knowledge of par-ticipants on dengue fever clinical management im-proved significantly after the training particularly for the North and the Central division participants. The Central division participants demonstrated good knowledge of dengue clinical management before and after the training, perhaps because they were doctors compared to the other two divisions which had various health cadres participating.
Division Pre-‐test Post-‐test Central 14 13 Western 29 29 Northern 31 24 Total 74 66
C-‐Pre-‐test (n=14)
C-‐Post-‐test (n=13)
N-‐Pre-‐test(n=31)
N-‐Post-‐test(n=24)
W-‐Pre-‐test(29)
W-‐Post Test(29)
Total 77/140 100/130 151/310 188/240 149/290 189/290 Median 5 8 4 9 5 7 Mode 5 8 8 9 5 7 Mean 6 8 5 8 5 7 Minimum 3 4 0 3 0 3 Maximum 9 10 8 10 9 10 Standard Deviation 1.911504 1.702186 2.55267096 2.078182037 2.460025231 1.724211821 Sample Variance 3.653846 2.897436 6.516129032 4.31884058 6.05172414 2.972906404 CI 95% 95% 95% 95% 95% 95% Critical value -‐1.7011 -‐1.6448 -‐1.6448 T-‐test -‐3.1377 -‐1.8389 -‐1.5232 Df 25 53 56

FIJI JOURNAL OF PUBLIC HEALTH
Volume 3, Issue 1, 2014 18
ORIGINAL RESEARCH
LimitationsThe limitations included:1. The time factor required to undertake this training. The training was done in the midst of an outbreak and required sensitivity in the outbreak environment including human resource constraints and opportunity costs. 2. The inability to control the type of participants for the training. The package was for clinical management and required those in clinical practice to attend.3. The ability to follow each participant to monitor their subsequent training activities and assess align-ment with the national training.
Recommendations and ConclusionsWith the successful completion of the training of training exercise in all the health divisions, the clinical management working group of the Dengue Taskforce recommends the following:1. That the DMO’s and MS’s in the divisions obliges each of their nominees to the training to conduct at least one training session at their health facility within 2 weeks of completing the training of trainers work-shop. 2. The trained trainers submit their training activity plan to the focal person to the focal secretariat of the clinical management working group outlining their needs for the training that they anticipate to conduct.3. The Dengue Taskforce support each of the division with a laptop computer and a multi-media projector for the trainings that need to ensue4. The divisions arrange logistics for their trained trainers in order for them to access health workers in remote areas that need to be trained on the guideline5. That the trained trainers provide report of their training activity to the Divisional Medical Officers or Medical Superintendent’s and an accompanying report to the focal secretariat for the clinical management working group the intensiveness of the 3 hours train-ing, participants from other health cadres in the North and West health divisions may need a little bit more time to review and adequately digest the principles of management outlined in the training package.
ACKNOWLEDGEMENTThe clinical management working group of the dengue taskforce acknowledges and appreciates the support provided by the following institutions and persons for making this training of trainers activity possible:The Ministry Health Senior ManagementThe World Health Organization South PacificThe Fiji Health Sector Support ServicesThe College of Medicine Nursing and Health Sciences of the Fiji National UniversityThe United States of America Centre for Disease Con-trol (CDC) for sharing their training materials The training facilitators namely, Dr Ravi Naidu, Dr Adam Jenny, Dr Eric Nilles, Dr Devina Nand, Dr Mike Kama, Dr Axelle Ronsse, Dr SewakThe secretariat team for the ToT, namely Kylie Jenkins, Jane Matanaicake, Isireli Rabukawaqa, Kesa Rawasa and Josaia RaisogoAll participants A special acknowledgement to Dr Devina Nand, Director Epidemiology, Health Information Unit, Ministry of Health for modifying the training package materials and taking the initiative to provide a pre-test and post-test questionnaire to allow the report to reflect the participants understanding of the knowledge of the WHO updated dengue fever clinical manage-ment guidelines.
REFERENCES1. Heymann, D. (2008); Control of Communicable Diseases Manual; American Public Health Association.
FIJI JOURNAL OF PUBLIC HEALTH
Volume 3, Issue 1, 2014 19
A Snapshot of Health Financing in Fiji from National Health AccountsPrasad R1, Irava W1* Khan I2
ABSTRACTFinancing issues are among the most difficult problems in health care. The World Health Organization (WHO) 2000 refers to health financing as the function of a health system concerned with the mobilization, accumulation and allocation of money to cover the health needs of the people, individually and collectively, in the health sys-tem. The purpose of health financing is to make funding available, as well as to set the right financial incentives to providers, to ensure that all individuals have access to effective public health and personal health care (WHO 2000). This paper summaries some results of the Fiji National Health Accounts (NHA) 2011-2012 with some trends analysis of the total health expenditure (THE) , GDP per capita and THE per capita. It also includes a brief discussion on the distribution of government current health expenditure (GCHE) amongst the fifteen provinces in Fiji.
Keywords: Health Financing; National Health Accounts
ORIGINAL RESEARCH
INTRODUCTIONFinancing issues are among the most difficult problems in health care. The 2000 World Health Report argues that when focusing on performance of health systems, a key dimension for its determination is the fairness of its health financing. According to Panda (2003) there are many options for health care financing that have been formulated and tried in developed and develop-ing countries. Some of these include private health insurance, social health insurance, community financ-ing, user pay system (out of pocket), health savings account, government taxation, overseas loans and aid funding. The World Bank and WHO recommend that healthcare financing should be seen as the backbone to achieve the objectives of any health system in short, medium and long term goals and universal health coverage. Health care financing enables mobilization of funds for health care, allocation of funds to the regions and population group and for specific types of health care and mechanisms for paying health care. Governments need to actively participate in health financing to avoid market failures as health is consid-ered a public good. In striving towards some of the common health care systems goal of equity, efficiency and effectiveness of care, one of the key question for policy makers “How much do we spend on health and is it measured in a comparable way?”. According to WHO Africa Office Ministries of Health should
devote more effort in building capacity to obtain health expenditure and utilize health financing and economic evidence to formulate plans and polices and guide intervention for improving systems of health financing and social protection. Health financing is not only a concern for the ministries of health but it’s also a global issue discussed amongst policy makers to achieve universal health coverage. Even, the United States of America the larg-est world economy is struggling with issues of health financing. This research paper seeks to discuss the sources of health financing in Fiji and its proportion to some important economic indicators such as gross domes-tic product (GDP), general government expenditure (GGE) and per capita health expenditure. The paper further discusses government health expenditure by region in Fiji to provide some policy implication as how MOH can in future distribute health spending equally and fairly. The rest of the paper is structured as follows: Section 1 provides a brief discussion on the systems of Health Accounts Methodology (SHA) 2011 and its importance and key components. Section 2 presents results of the NHA 2011-2012 report and includes some trend analysis. The final section of this paper provides conclusion and implication of NHA on health financing, policy and development.
1. Centre for Health Information Policy and Systems Research, CMNHS, FNU2. Health Policy Planning Development Unit, Ministry of Health* Address for Correspondence: [email protected]

FIJI JOURNAL OF PUBLIC HEALTH
Volume 3, Issue 1, 2014 20
ORIGINAL RESEARCH
METHODOLOGYHealth resources tracking is a vital component of health systems strengthening as it provides stakeholders with information on the values of the health care goods and services purchased and patterns in the financing, provision, and consumption of health care resources. After the dramatic slowdown in growth due to eco-nomic crises, the ongoing concern with regards to the adequacy of financial resources for health care and the way resources are used continue to interest policy mak-ers and researchers. Due to the high demand for de-tailed and comparative information on health care ex-penditure, in response the OECD A System of Health Accounts (SHA) manual, first published in 2000 and now revised in 2011, provides a standard framework for producing a set of comprehensive, consistent and internationally comparable accounts to meet the needs of public and private-sector health analysts and policy-makers. The SHA manual establishes a conceptual basis of statistical reporting rules that are compatible with other economic and social statistics. The SHA is an internationally standardized frame-work that systematically tracks the flow of expenditures in the health system. Some key features and compo-nents of the SHA framework are:Revenues of financing schemes (FS): Types of rev-enue received or collected by financing schemes such as direct foreign financial transfers; voluntary prepayment from employers; transfers from the ministry of finance to other governmental agencies.Health Care financing schemes (Financing Agents) (HF): Institutional units that manage health financing schemes, for example ministry of Health, commercial insurance companies, and international organizations.Health care providers (HP): organizations and actors that, either primarily or as part of the multiple activi-ties in which they are engaged, deliver health care such as Hospitals, clinics, health centers, and pharmacies.Health care functions (HC): Types of health goods and services consumed and activities performed such as Curative care, information, education, and counseling programs, medical goods such as supplies and pharma-ceuticals, governance and health system administration (includes national-level surveys).Factors of provision (FP): Types of inputs used in producing the goods and services or activities con-ducted inside the SHA 2011 “health” boundary. For example wages, utilities, rent, materials, and services used.Beneficiary characteristics (disease): Characteristics of those who receive the health care goods and services or benefit from those activities, for example Disease by ICD-10 classifications.
Beneficiary characteristics (age, gender, socio-eco-nomic group): Characteristics of those who receive the health care goods and services or benefit from those activities, for instance by Age, gender, and socio-eco-nomic group.Capital formation: Types of investments that health providers have made during the accounting period that are used for more than one year in the production of health services, for example Infrastructure, machinery, and equipment (capital formation); formal training, Research and Development. Some of the key benefits of SHA 2011 are that it leads to improvement in data quality, ability to reflect a country’s financing mechanism, its linkage to other international classification such as ICD-10 and it provides a more comprehensive picture of health care expenditure. The use of National Health Accounts (NHA) as a monitoring and evaluation tool can assist countries to achieve the objective of universal health coverage through evidence based decision making on health care financing and spending.
Results and DiscussionFigure 1 depicts that over a six year period total health expenditure (THE) has significantly increased since 2007 from FJ$ 204.3 million to FJ$ 271.5 million in 2012. This approximately represents a 33% increase. The THE has continued to increase since 2007 with a slight drop of FJ$ 0.9 million in 2011. In 2012, there was a significant increase in health expenditure by FJ$ 22.0 million. The significant increase is due to a substantial increase in government spending (public) by FJ$ 9.9 million, private expenditure on health by FJ$ 8.5 million and donor spending by FJ$ 3.7 mil-lion. Overall on average over the six year period, THE in Fiji was FJ$ 236 million per year.
Figure1: Total Health Expenditure, 2007 to 2012
Source: National Health Accounts (2007-2008, 2009-2010, 2011-2012)
Figure 2 show that THE as a percent of GDP on aver-age was 4.5% over the six years while THE as a percent of GGE was 14% on average. The THE as a percent of GDP has fluctuated between 4.2 to 4.8 percent while THE as a percent GDP fluctuated between 13.4 to 15 percent.
Beneficiary characteristics (age, gender, socio-economic group): Characteristics of those who receive the health care goods and services or benefit from those activities, for instance by Age, gender, and socio-economic group. Capital formation: Types of investments that health providers have made during the accounting period that are used for more than one year in the production of health services, for example Infrastructure, machinery, and equipment (capital formation); formal training, Research and Development. Some of the key benefits of SHA 2011 are that it leads to improvement in data quality, ability to reflect a country’s financing mechanism, its linkage to other international classification such as ICD-10 and it provides a more comprehensive picture of health care expenditure. The use of National Health Accounts (NHA) as a monitoring and evaluation tool can assist countries to achieve the objective of universal health coverage through evidence based decision making on health care financing and spending. Results and Discussion Figure 1 depicts that over a six year period total health expenditure (THE) has significantly increased since 2007 from FJ$ 204.3 million to FJ$ 271.5 million in 2012. This approximately represents a 33% increase. The THE has continued to increase since 2007 with a slight drop of FJ$ 0.9 million in 2011. In 2012, there was a significant increase in health expenditure by FJ$ 22.0 million. The significant increase is due to a substantial increase in government spending (public) by FJ$ 9.9 million, private expenditure on health by FJ$ 8.5 million and donor spending by FJ$ 3.7 million. Overall on average over the six year period, THE in Fiji was FJ$ 236 million per year. Figure1: Total Health Expenditure, 2007 to 2012
Source: National Health Accounts (2007-2008, 2009-2010, 2011-2012) Figure 2 show that THE as a percent of GDP on average was 4.5% over the six years while THE as a percent of GGE was 14% on average. The THE as a percent of GDP has fluctuated between 4.2 to 4.8 percent while THE as a percent GDP fluctuated between 13.4 to 15 percent. WHO
204.3 205.8 236 250.4 249.5
271.5
0
50
100
150
200
250
300
2007 2008 2009 2010 2011 2012
FJS
mill
ion
Year

FIJI JOURNAL OF PUBLIC HEALTH
Volume 3, Issue 1, 2014 21
ORIGINAL RESEARCH
West Pacific Region in the WHO Health Financ-ing Strategy 2010-2015 (World Health Organization Western Pacific Region and South-East Asia Region, 2005, World Health Organization Western Pacific Region, 2008) recommend that in order to attain universal coverage countries should ensure that (1) out-of-pocket spending should not exceed 30%-40% of total health expenditure, and (2) total health expendi-ture should be at least 5% of the GDP. Fiji remains below the par or bench mark of 5%. In 2012, THE as a percent of GDP and GGE was 4.5% and 13.5% respectively. The high value in terms of GGE as a percentage of THE shows a promising commitment by the Government in allocating resources to health.
Figure 2: THE as a % of GDP and General Government Expenditure (GGE
Source: National Health Accounts (2007-2008, 2009-2010, and 2011-2012) & Global Health expenditure database (Accessed 11 April 2014))
Figure 3 show that GDP per capita at current price and THE per capita at current prices has sustained an increasing trend over the six years. The per capita GDP and THE at constant price has both fluctuated and generally declining over the years. In 2012 the THE and GDP per capita at constant price stands at FJ$237.6 and FJ$5086 respectively. On average, over the six years THE per capita at constant and current prices was FJ$236 and FJ$279 respectively.
Figure 3: THE and GDP per capita
Source: National Health Accounts (2007-2008, 2009-2010, 2011-2012)
Figure 3 shows that public funding for health remains the largest financial source for healthcare expenditure in Fiji. Private expenditure accounts for approximate one quarter of total health spending in 2007 but has continued to steadily increase up until 2012. This in-dicates a growing investment of the private sector into health. Funding by development partners (commonly called donors) has fluctuated with the highest alloca-tion of 9% in 2010 and lowest 3% in 2007. Fluctua-tions in donor funds mean that reliance on donors to fund health expenditure can incur some risk. In 2012, government health expenditure repre-sented 60% of total health expenditure, lower than all other Pacific island countries, but relatively high when compared internationally. Private health expenditure has increased and is now 34% of total health expendi-ture in 2012. This increase is driven by out-of-pocket expenditure which has more than doubled over the period 2005 (12%) to 2012 (27%).
Figure 3: Health Financing by Revenue of Financing Schemes
Source: National Health Accounts (2007-2008, 2009-2010, 2011-2012)
Table 1 demonstrates health expenditure per capita at current prices. Overall, the per capita THE, CHE and GCHE have all increased. In 2012, THE, CHE and GCHE per capita shows an increase of FJ$ 24.5, FJ$ 24.8 and FJ$ 12.9 respectively.
Table 1: Expenditure on health per capita (current prices), 2011-2012
Source: National Health Accounts (2007-2008, 2009-2010, 2011-2012)
West Pacific Region in the WHO Health Financing Strategy 2010-2015 (World Health Organization Western Pacific Region and South-East Asia Region, 2005, World Health Organization Western Pacific Region, 2008) recommend that in order to attain universal coverage countries should ensure that (1) out-of-pocket spending should not exceed 30%-40% of total health expenditure, and (2) total health expenditure should be at least 5% of the GDP. Fiji remains below the par or bench mark of 5%. In 2012, THE as a percent of GDP and GGE was 4.5% and 13.5% respectively. The high value in terms of GGE as a percentage of THE shows a promising commitment by the Government in allocating resources to health. Figure 2: THE as a % of GDP and General Government Expenditure (GGE)
Source: National Health Accounts (2007-2008, 2009-2010, and 2011-2012) & Global Health expenditure database (Accessed 11 April 2014) Figure 3 show that GDP per capita at current price and THE per capita at current prices has sustained an increasing trend over the six years. The per capita GDP and THE at constant price has both fluctuated and generally declining over the years. In 2012 the THE and GDP per capita at constant price stands at FJ$237.6 and FJ$5086 respectively. On average, over the six years THE per capita at constant and current prices was FJ$236 and FJ$279 respectively.
0.0%
2.0%
4.0%
6.0%
8.0%
10.0%
12.0%
14.0%
16.0%
2007 2008 2009 2010 2011 2012Year
THE as a % of GDP
THE as a % GGE
Figure 3: THE and GDP per capita
Source: National Health Accounts (2007-2008, 2009-2010, 2011-2012) Figure 3 shows that public funding for health remains the largest financial source for healthcare expenditure in Fiji. Private expenditure accounts for approximate one quarter of total health spending in 2007 but has continued to steadily increase up until 2012. This indicates a growing investment of the private sector into health. Funding by development partners (commonly called donors) has fluctuated with the highest allocation of 9% in 2010 and lowest 3% in 2007. Fluctuations in donor funds mean that reliance on donors to fund health expenditure can incur some risk. In 2012, government health expenditure represented 60% of total health expenditure, lower than all other Pacific island countries, but relatively high when compared internationally. Private health expenditure has increased and is now 34% of total health expenditure in 2012. This increase is driven by out-of-pocket expenditure which has more than doubled over the period 2005 (12%) to 2012 (27%). Figure 3: Health Financing by Revenue of Financing Schemes
Source: National Health Accounts (2007-2008, 2009-2010, 2011-2012)
010002000300040005000600070008000
2007 2008 2009 2010 2011 2012
FJ$
GDP per Capita (Current)GDP per Capita (Constant)
0.050.0
100.0150.0200.0250.0300.0350.0
2007 2008 2009 2010 2011 2012
FJ$
THE per capita (Current)THE per capita (constant)
71% 70% 63% 61% 62% 60%
25% 24% 31% 30% 33% 34%
3% 6% 6% 9% 5% 6%
0%
10%
20%
30%
40%
50%
60%
70%
80%
90%
100%
2007 2008 2009 2010 2011 2012Year
Donors
Private
Public
Table 1 demonstrates health expenditure per capita at current prices. Overall, the per capita THE, CHE and GCHE have all increased. In 2012, THE, CHE and GCHE per capita shows an increase of FJ$ 24.5, FJ$ 24.8 and FJ$ 12.9 respectively. Table 1: Expenditure on health per capita (current prices), 2011-2012 2011 2012 THE per capita 291.9 316.4 CHE per capita 274.5 299.3 GCHE per capita 167.0 179.9 Source: National Health Accounts (2007-2008, 2009-2010, 2011-2012) Table 2 show government health expenditure spending in 2012 by provinces. This health expenditure distribution removes spending on specialist health facilities (most of which are located in one province) and divisional hospitals which are national referral hospitals that accommodate patients from all over the country. The expenditure distribution is therefore largely expenditure incurred by health centres and nursing stations. The province of Ba which has the largest population also incurs the largest portion of health spending. Rewa and Macuata also have big populations (with respect to other provinces) although incur low health spending. This may be because two main divisional hospitals are located in these provinces (CWM hospital in Rewa and Labasa Hospital in Macuata) which also provide health services that cater for the health needs of the population in these provinces. In terms of per capita spending, the province of Rotuma has the highest amount with approximately $299.7 dollars spent per person in the year 2012. The lowest per capita spending is in the provinces of Rewa and Macuata when divisional hospital costs are excluded (vice-versa if otherwise). Table 2: Government Current Health Expenditure by Province, 2012
Province Amount Share Population Share Per FJ$m (%) % Capita
Ba 7.0 19.4% 231760 27.7% 30.20 Naitasiri 3.3 9.2% 160760 19.2% 20.53 Rewa 0.8 2.2% 100995 12.1% 7.92 Macuata 0.6 1.7% 72441 8.7% 8.28 Nadroga/Navosa 3.4 9.4% 58387 7.0% 58.23 Tailevu 5.9 16.4% 55692 6.7% 105.94 Cakaudrove 4.1 11.4% 49344 5.9% 83.09 Ra 2.0 5.6% 29464 3.5% 67.88 Serua 1.7 4.7% 18249 2.2% 93.16 Lomaiviti 1.6 4.4% 16253 1.9% 98.44 Bua 1.6 4.4% 14176 1.7% 112.87 Lau 2.1 5.8% 10683 1.3% 196.57

FIJI JOURNAL OF PUBLIC HEALTH
Volume 3, Issue 1, 2014 22
ORIGINAL RESEARCH
Table 2 show government health expenditure spending in 2012 by provinces. This health expenditure distri-bution removes spending on specialist health facili-ties (most of which are located in one province) and divisional hospitals which are national referral hospitals that accommodate patients from all over the coun-try. The expenditure distribution is therefore largely expenditure incurred by health centres and nursing stations. The province of Ba which has the largest popula-tion also incurs the largest portion of health spending. Rewa and Macuata also have big populations (with respect to other provinces) although incur low health spending. This may be because two main divisional hospitals are located in these provinces (CWM hospital in Rewa and Labasa Hospital in Macuata) which also provide health services that cater for the health needs of the population in these provinces. In terms of per capita spending, the province of Rotuma has the highest amount with approximately $299.7 dollars spent per person in the year 2012. The lowest per capita spending is in the provinces of Rewa and Macuata when divisional hospital costs are exclud-ed (vice-versa if otherwise).
Table 2: Government Current Health Expenditure by Province, 2012
Source: National Health Accounts (2007-2008, 2009-2010, 2011-2012)
Figure 4 shows the how GCHE and the population is distributed across the provinces. If we take the most common assumption that more densely popu-lated areas should receive a greater portion of health resources, then clearly the provinces of Ba, Naitasiri, Rewa and Macuata are receiving less than what other provinces are receiving according to their population size. If expenditure for the divisional hospitals were included, then the provinces of Ba, Rewa and Macu-ata would be receiving the highest shares of GCHE since these provinces are where the divisional hospi-tals are situated.
Figure 4: Actual GCHE and GCHE by Population -2012
Source: National Health Accounts 2011-2012
The national GCHE per capita is $FJD 43 in 2012 (excludes Divisional hospitals and Specialized services). Figure 5 show that the provinces of Ba, Naitasiri, Rewa, Macuata and Namosi lie below this national value. Since Ba, Rewa and Macuata are provinces which house the divisional hospitals, the low per capita spending in Naitasiri and Namosi is of some concern.The provinces of Rotuma, Kadavu and Lau show per capita figures that far exceed the national per capita health spending of $FJD 43. These three provinces happen to represent perhaps the most isolated regions of the country. Remoteness and isolation are therefore largely the cost drivers of the high per capita GCHE spending in these provinces.
Figure 5: Variation of GCHE per capita by province -2012
Source: National Health Accounts 2011-2012
CONCLUSIONThe development of National health Accounts allows countries to better understand the flow of financial resources from health care financing schemes, to pro-viders of health care and to health function. National health accounts are not only descriptive statements but contain information that can be used to improve the capacity of planners to manage the health sector. They can help in formulating and monitoring new sectorial strategies and in evaluating the impact of interven-tions. They form the basis for examining the allocation of resources and for such techniques as cost-effective-ness analysis and priority setting. If they are sufficiently detailed, they can also describe the flow of resources between households and institutions.
Table 1 demonstrates health expenditure per capita at current prices. Overall, the per capita THE, CHE and GCHE have all increased. In 2012, THE, CHE and GCHE per capita shows an increase of FJ$ 24.5, FJ$ 24.8 and FJ$ 12.9 respectively. Table 1: Expenditure on health per capita (current prices), 2011-2012 2011 2012 THE per capita 291.9 316.4 CHE per capita 274.5 299.3 GCHE per capita 167.0 179.9 Source: National Health Accounts (2007-2008, 2009-2010, 2011-2012) Table 2 show government health expenditure spending in 2012 by provinces. This health expenditure distribution removes spending on specialist health facilities (most of which are located in one province) and divisional hospitals which are national referral hospitals that accommodate patients from all over the country. The expenditure distribution is therefore largely expenditure incurred by health centres and nursing stations. The province of Ba which has the largest population also incurs the largest portion of health spending. Rewa and Macuata also have big populations (with respect to other provinces) although incur low health spending. This may be because two main divisional hospitals are located in these provinces (CWM hospital in Rewa and Labasa Hospital in Macuata) which also provide health services that cater for the health needs of the population in these provinces. In terms of per capita spending, the province of Rotuma has the highest amount with approximately $299.7 dollars spent per person in the year 2012. The lowest per capita spending is in the provinces of Rewa and Macuata when divisional hospital costs are excluded (vice-versa if otherwise). Table 2: Government Current Health Expenditure by Province, 2012
Province Amount Share Population Share Per FJ$m (%) % Capita
Ba 7.0 19.4% 231760 27.7% 30.20 Naitasiri 3.3 9.2% 160760 19.2% 20.53 Rewa 0.8 2.2% 100995 12.1% 7.92 Macuata 0.6 1.7% 72441 8.7% 8.28 Nadroga/Navosa 3.4 9.4% 58387 7.0% 58.23 Tailevu 5.9 16.4% 55692 6.7% 105.94 Cakaudrove 4.1 11.4% 49344 5.9% 83.09 Ra 2.0 5.6% 29464 3.5% 67.88 Serua 1.7 4.7% 18249 2.2% 93.16 Lomaiviti 1.6 4.4% 16253 1.9% 98.44 Bua 1.6 4.4% 14176 1.7% 112.87 Lau 2.1 5.8% 10683 1.3% 196.57
Kadavu 1.2 3.3% 10167 1.2% 118.03 Namosi 0.1 0.3% 6898 0.8% 14.50 Rotuma 0.6 1.7% 2002 0.2% 299.70
36.0 100% 837271 100% Source: National Health Accounts (2007-2008, 2009-2010, 2011-2012) Figure 4 shows the how GCHE and the population is distributed across the provinces. If we take the most common assumption that more densely populated areas should receive a greater portion of health resources, then clearly the provinces of Ba, Naitasiri, Rewa and Macuata are receiving less than what other provinces are receiving according to their population size. If expenditure for the divisional hospitals were included, then the provinces of Ba, Rewa and Macuata would be receiving the highest shares of GCHE since these provinces are where the divisional hospitals are situated. Figure 4: Actual GCHE and GCHE by Population -2012
Source: National Health Accounts 2011-2012 The national GCHE per capita is $FJD 43 in 2012 (excludes Divisional hospitals and Specialized services). Figure 5 show that the provinces of Ba, Naitasiri, Rewa, Macuata and Namosi lie below this national value. Since Ba, Rewa and Macuata are provinces which house the divisional hospitals, the low per capita spending in Naitasiri and Namosi is of some concern. The provinces of Rotuma, Kadavu and Lau show per capita figures that far exceed the national per capita health spending of $FJD 43. These three provinces happen to represent perhaps the most isolated regions of the country. Remoteness and isolation are therefore largely the cost drivers of the high per capita GCHE spending in these provinces.
7.00
0.80
5.90
2.10
9.96
4.34
2.39 0.46
0.00
2.00
4.00
6.00
8.00
10.00
12.00
Actual GCHE by Province
Share of GCHE by population
Figure 5: Variation of GCHE per capita by province -2012
Source: National Health Accounts 2011-2012
Conclusion The development of National health Accounts allows countries to better understand the flow of financial resources from health care financing schemes, to providers of health care and to health function. National health accounts are not only descriptive statements but contain information that can be used to improve the capacity of planners to manage the health sector. They can help in formulating and monitoring new sectorial strategies and in evaluating the impact of interventions. They form the bases for examining the allocation of resources and for such techniques as cost-effectiveness analysis and priority setting. If they are sufficiently detailed, they can also describe the flow of resources between households and institutions. In this paper we have reported some of the results from the National Health Accounts 2011-2012 for Fiji. Some of the key indicators discussed were the increasing trend in total health expenditure, THE as a proportion of GDP and GGE. In addition, trends in per capita THE and sources of health financing in Fiji were highlighted. It was noted that about 60% of the THE is funded by the government of Fiji while the remainder is contributed by the private sector and donor agencies. The private sector contribution in Fiji has significantly increased over the period of six years while the public share of spending as a proportion of THE is declining. However, the nominal dollar contribution has substantially increased for public sector spending since 2007. The per capita THE has also increased. Furthermore, the paper also provided brief discussion on the distribution of GCHE by province in Fiji. There are 15 provinces in Fiji. It was noticed that the GCHE distribution is not proportional to the share of population in each province. To conclude, the MOH Fiji should be fortunate that they have produced their fourth round of NHA under the new SHA 2011 methodology when compared to other PICs. Thus I recommend that the MOH should use the
30.20 58.23
105.94 112.87
196.57
14.50
299.70
0.00
50.00
100.00
150.00
200.00
250.00
300.00
350.00
Ba
Nai
tasir
i
Rew
a
Mac
uata
Nad
roga
/Nav
osa
Taile
vu
Caka
udro
ve Ra
Seru
a
Lom
aivi
ti
Bua
Lau
Kada
vu
Nam
osi
Rotu
ma
GCHE per capita per province
GCHE per capita

FIJI JOURNAL OF PUBLIC HEALTH
Volume 3, Issue 1, 2014 23
ORIGINAL RESEARCH
In this paper we have reported some of the results from the National Health Accounts 2011-2012 for Fiji. Some of the key indicators discussed were the increasing trend in total health expenditure, THE as a proportion of GDP and GGE. In addition, trends in per capita THE and sources of health financing in Fiji were highlighted. It was noted that about 60% of the THE is funded by the government of Fiji while the remainder is contributed by the private sector and do-nor agencies. The private sector contribution in Fiji has significantly increased over the period of six years while the public share of spending as a proportion of THE is declining. However, the nominal dollar contribution has substantially increased for public sector spending since 2007. The per capita THE has also increased. Furthermore, the paper also provided brief discus-sion on the distribution of GCHE by province in Fiji. There are 15 provinces in Fiji. It was noticed that the GCHE distribution is not proportional to the share of population in each province. To conclude, the MOH Fiji should be fortunate that they have produced their fourth round of NHA under the new SHA 2011 methodology when compared to other PICs. Thus I recommend that the MOH should use the Ba Naitasiri Rewa Macuata Nadroga/Navosa Tailevu Cakaudrove Ra Serua Lomaiviti Bua Lau Kadavu Namosi Rotuma results of NHA report to develop policy briefs, cabinet papers and other policy document for planning and developing sustainable health financing in future align with the current government initiative to make a better Fiji.
REFERENCES Cogswell, Heather, Catherine Connor, Tesfaye Dereje, Avril Kaplan and Sharon Nakhimovsky. September 2013. Systems of Health Accounts 2011 What is SHA 2011 and How are SHA 2011 Data Produced and Used? Bethesda, MD: Health finance & Governance Project, Abt Associates Inc. Fiji Health Accounts (2012). Fiji Health Accounts 2009-2010.Suva: Ministry of Health Fiji. Fiji Health Accounts (2010). Fiji Health Accounts 2007-2008.Suva: Ministry of Health Fiji. Fiji Health Accounts (2013). Fiji Health Accounts 2011-2012.Suva: Ministry of Health Fiji. Lingan.D and Roberts.G (2009). Forty Six Yers of Health Financing in Fiji (1962-2008): Public Health Dialog, Vol. 15, No: 2. World Health Organization (WHO) (2014).(website) Global Health Expenditure Database. Geneva: world Health Organization. (http://www.who.int/nha/expenditure_database/en/accessed 7 April 2014). World Health Organization (WHO) (2009). Health financ-ing strategy for the Asia Pacific region 2010-2015.Geneva: World Health Organization. OECD (2011). Systems of Health Accounts 2011 Edition. Paris: Organization for Economic Cooperation and Develop-ment. Panda.M (2003). Health financing options for Fiji’s Health System; Pacific Health Dailog Vol 10. No.2. Pande.M (2006). Health financing: the Fijian experience; Papua New Guinea Medical Journal: Vol 49, No 3-4.Rannan-Eliya.R.P and Berman .P (1993). National Health Accounts in Developing Countries: Improving the Foundation. Department of Population and International Health: Har-vard Scholl of Public Health.

FIJI JOURNAL OF PUBLIC HEALTH
Volume 3, Issue 1, 2014 24
ORIGINAL RESEARCH
Degree of dependence of health indicators on key country statistics in Fiji Islands from 2003-2010
Mahakalanda S.J1*, Soderberg. E 2
Keywords: Health Indicators
INTRODUCTIONThe effect of personal, social, economic and environ-mental factors on healthcare is significant. Populations receiving quality education, employment stability, safer living environments with access to preventive services have a higher potential of having healthier lives and vice versa (HealthyPeople.gov, 2014). How these fac-tors influence healthcare outcomes is worthy of further exploration. Healthcare indicators are being developed for every country periodically alongside many other perfor-mance indicators. These indicators directly correlate to outcomes in each sector. This study looks at how the recognized key perfor-mance indicators of Fiji relate to selected health indica-tors.
GOALThe goal of this study was to establish whether the gen-eral country indicators had a significant relationship with recognized country health indicators.
METHODSThe publications of Fiji Island Bureau of Statistics (FIBOS) were consulted in selection of key country performance indicators. Thereafter selected specialists in health economics were consulted to determine any other indicators that should be included for the study. Then the same documents were consulted to identify the selected health indicators. The key country indicators and the indicators se-lected via expert interviews were considered to be the independent variables whist the health outcomes were considered to be the dependent variables. The period from 2003 to 2010 was selected as that was the period where most of the data was comprehensively available. All the dependent variables were checked for their relationship with time to determine whether any of the variables automatically change over time. The correla-tion of determination was used to assess the relation-ship with time, and if there were any dependent variables that were strongly correlated with time (over 70% dependence), that variable was studied with time as an independent variable in a different model of vari-ables. The others were studied assuming that time is not a factor for consideration.
All the independent variables were then checked for their relationship to each other via the Pearson prod-uct-moment correlation coefficient through multiple regression techniques. If the relationship was almost linear with over 0.9 or more reading of correlation, such variables were not considered together as such different indicator models were developed separating them out. Then these models were run through multi-ple regression tools to evaluate their relationship with health indicators individually. Subsequently the inde-pendent variable model/s with best/strongest relation-ship for each of the dependent variable was used for further analysis. Where ever the figures could not be located within the FIBOS publications, other sources such as Reserve of Fiji, WHO and UN records were referred to and data was located.
Results and discussionThe Fiji Bureau of Statistics has recognized the follow-ing indicators as key country performance indicators.
1. Visitor arrivals adjusted for seasonal variations2. Consumer price index (the base year changed during the period considered, thus all prices were re-worked to 1993=100 index)3. Building material price index (the base year changed during the period considered, thus all prices were re-worked to 1989=100 index)4. Total exports (FJD 000’s)5. Total imports (FJD 000’s)6. Trade balance (FJD 000’s)7. Government current account surplus/ deficit (FJD 000’s)8. Money supply M19. Money supply M310. Total foreign exchange reserves
In addition the following indicators were selected after key informant interviews with subject specialists.
1. Consumer price index weighted price for foods (base line was re-worked to 1995=100)2. Consumer price index weighted price for alcohol and tobacco (base line was re-worked to 1995=100)3. Total government expenditure on education4. Total government expenditure on health5. Total government expenditure on housing, community development, and sanitary services1. Centre for Health Information Policy & Systems Research, CMNHS, FNU
2. Fiji Islands Bureau of Statistics*Address for Correspondence: [email protected]

FIJI JOURNAL OF PUBLIC HEALTH
Volume 3, Issue 1, 2014 25
ORIGINAL RESEARCH
6. Total government expenditure on social security and welfare
The above lists of indicators were used as the independ-ent variables.
The following list of indicators has been identified in the FIBOS publications as the key health indicators for Fiji.
1. Total live births2. Crude birth rate per 1000 population3. Crude death rate per 1000 population4. Infant mortality rate per 1000 live births5. Perinatal mortality rate per 1000 live births6. Neonatal mortality rate per 1000 live births7. Post natal mortality rate per 1000 live births8. Under five mortality rate per 1000 live births9. Maternal mortality rate per 100,000 live births10. Gross fertility rate per 1000 child bearing age females11. Family planning protection rate
The above list was used as the dependent variables.
As per figures 1.a and 1.b, none of the dependent variables have a coefficient of determination above 0.7, as such none of the dependent variables can be described by changes of time as an independent variable to a reliable degree hence there is no strong linear relationship between time and any of the de-pendent variables. Therefore all dependent variables were studied without time being incorporated in to the independent variables list. Then the independent variables were checked for their correlation between each other via multiple regression techniques.
Dr. S. J. Mahakalanda, CHIPSR, College of Medicine, FNU & Emali Soderberg, Fiji islands Bureau of Statistics Page 3
The above list was used as the dependent variables.
As per figures 1.a and 1.b, none of the dependent variables have a coefficient of determination above 0.7, as such none of the dependent variables can be described by changes of time as an independent variable to a reliable degree hence there is no strong linear relationship between time and any of the dependent variables. Therefore all dependent variables were studied without time being incorporated in to the independent variables list.
Than the independent variables were checked for their correlation between each other via multiple regression techniques.
Pearson Correlation
VISI
TORS
CPI
BMPI
EXPO
RTS
IMPO
RTS
TRAD
E_BA
LANC
E
CURR
ENT_
ACCO
UNT
MS_
M1
MS_
M3
FORE
X_RE
S
CPI_
FOO
D
CPI_
ALCO
_TO
B
EDUC
ATIO
N
HEAL
TH
SOCI
AL_S
EC_W
F
HOUS
ING
_CO
MDE
V
VISITORS 1 0.577 0.258 0.501 0.817 -0.77 -0.05 0.601 0.558 0.378 0.763 0.76 0.725 0.714 0.515 0.484
CPI 0.577 1 0.256 0.429 0.679 -0.64 -0.42 0.722 0.705 0.341 0.687 0.65 0.737 0.742 0.495 0.488
BMPI 0.258 0.256 1 0.119 0.234 -0.24 -0.13 0.116 0.082 0.012 0.293 0.282 0.277 0.325 0.11 0.359
EXPORTS 0.501 0.429 0.119 1 0.665 -0.27 -0.24 0.476 0.454 0.45 0.285 0.262 0.219 0.217 0.126 -0.04
IMPORTS 0.817 0.679 0.234 0.665 1 -0.88 -0.21 0.599 0.554 0.212 0.77 0.754 0.768 0.721 0.58 0.449
TRADE_BALANCE -0.77 -0.64 -0.24 -0.27 -0.88 1 0.134 -0.52 -0.47 -0.05 -0.8 -0.79 -0.85 -0.79 -0.69 -0.6
CURRENT_ACCOUNT -0.05 -0.42 -0.13 -0.24 -0.21 0.134 1 -0.51 -0.53 -0.19 -0.2 -0.15 -0.09 -0.12 0.122 0.064
MS_M1 0.601 0.722 0.116 0.476 0.599 -0.52 -0.51 1 0.993 0.667 0.608 0.569 0.526 0.493 0.333 0.171
MS_M3 0.558 0.705 0.082 0.454 0.554 -0.47 -0.53 0.993 1 0.672 0.569 0.529 0.483 0.447 0.3 0.154
FOREX_RES 0.378 0.341 0.012 0.45 0.212 -0.05 -0.19 0.667 0.672 1 0.177 0.172 0.026 0.046 0.175 -0.07
CPI_FOOD 0.763 0.687 0.293 0.285 0.77 -0.8 -0.2 0.608 0.569 0.177 1 0.995 0.863 0.855 0.507 0.606
CPI_ALCO_TOB 0.76 0.65 0.282 0.262 0.754 -0.79 -0.15 0.569 0.529 0.172 0.995 1 0.853 0.849 0.527 0.616
EDUCATION 0.725 0.737 0.277 0.219 0.768 -0.85 -0.09 0.526 0.483 0.026 0.863 0.853 1 0.954 0.689 0.726
HEALTH 0.714 0.742 0.325 0.217 0.721 -0.79 -0.12 0.493 0.447 0.046 0.855 0.849 0.954 1 0.67 0.767
SOCIAL_SEC_WF 0.515 0.495 0.11 0.126 0.58 -0.69 0.122 0.333 0.3 0.175 0.507 0.527 0.689 0.67 1 0.701
HOUSING_COMDEV 0.484 0.488 0.359 -0.04 0.449 -0.6 0.064 0.171 0.154 -0.07 0.606 0.616 0.726 0.767 0.701 1
Table 1: Independent variables’ relationship with each other. (Cells highlighted in green are the relationships that are significant i.e. over 0.7 correlations. Marked in red are the relationships that are closest to linear i.e. over 0.9 correlation)
Figure 1.a: Trends and relationships between total live births, crude birth rate, crude death rate, rate of natural increase and infant mortality rate with time
Figure 1.b: Trends and relationships between perinatal mortality rate, neonatal mortality rate, post-natal mortality rate, under five mortality rate, maternal mortality rate, gross fertility rate and family planning protection rate with time
Table 1: Independent variables’ relationship with each other.
(Cells highlighted in green are the relationships that are significant i.e. over 0.7 correlations. Marked in red are the relationships that are closest to linear i.e. over 0.9 correlation)
Based on table 1, it was discovered that variables such as Money supply M1 & Money supply M3, Consumer price index weighted price for foods (base line was re-worked to 1995=100) & Consumer price index weighted price for alcohol and tobacco (base line was re-worked to 1995=100) and Total govern-ment expenditure on education & Total government expenditure on health cannot be used together in the same list any more due to their strong linear relation-ships to each other, i.e. they significantly depend on each other. Therefore the following mutually exclu-sive independent variable models were developed.
Table 2: Mutually exclusive models of independent vari-ables
Each of the dependent variables were individually tested for their dependence on each of the models separately and the following results were obtained.
Dr. S. J. Mahakalanda, CHIPSR, College of Medicine, FNU & Emali Soderberg, Fiji islands Bureau of Statistics Page 4
Based on table 1, it was discovered that variables such as Money supply M1 & Money supply M3, Consumer price index weighted price for foods (base line was re-worked to 1995=100) & Consumer price index weighted price for alcohol and tobacco (base line was re-worked to 1995=100) and Total government expenditure on education & Total government expenditure on health cannot be used together in the same list any more due to their strong linear relationships to each other, i.e. they significantly depend on each other. Therefore the following mutually exclusive independent variable models were developed.
M1, CPI-FOOD, HEALTH M1, CPI-FOOD, EDUCATION M1, CPI-ALCOHOL&TOBACCO, HEALTH M1, CPI-ALCOHOL&TOBACCO, EDUCATION
Visitor arrivals adjusted for seasonal variations Consumer price index (the base year changed during the period considered, thus all prices were re-worked to 1993=100 index) Building material price index (the base year changed during the period considered, thus all prices were re-worked to 1989=100 index) Total exports (FJD 000’s) Total imports (FJD 000’s) Trade balance (FJD 000’s) Government current account surplus/ deficit (FJD 000’s) Money supply M1 Total foreign exchange reserves Consumer price index weighted price for foods (base line was re-worked to 1995=100) Total government expenditure on health Total government expenditure on housing, community development, and sanitary services
Visitor arrivals adjusted for seasonal variations Consumer price index (the base year changed during the period considered, thus all prices were re-worked to 1993=100 index) Building material price index (the base year changed during the period considered, thus all prices were re-worked to 1989=100 index) Total exports (FJD 000’s) Total imports (FJD 000’s) Trade balance (FJD 000’s) Government current account surplus/ deficit (FJD 000’s) Money supply M1 Total foreign exchange reserves Consumer price index weighted price for foods (base line was re-worked to 1995=100) Total government expenditure on education Total government expenditure on housing, community development, and sanitary services
Visitor arrivals adjusted for seasonal variations Consumer price index (the base year changed during the period considered, thus all prices were re-worked to 1993=100 index) Building material price index (the base year changed during the period considered, thus all prices were re-worked to 1989=100 index) Total exports (FJD 000’s) Total imports (FJD 000’s) Trade balance (FJD 000’s) Government current account surplus/ deficit (FJD 000’s) Money supply M1 Total foreign exchange reserves Consumer price index weighted price for alcohol and tobacco (base line was re-worked to 1995=100) Total government expenditure on health Total government expenditure on housing, community development, and sanitary services
Visitor arrivals adjusted for seasonal variations Consumer price index (the base year changed during the period considered, thus all prices were re-worked to 1993=100 index) Building material price index (the base year changed during the period considered, thus all prices were re-worked to 1989=100 index) Total exports (FJD 000’s) Total imports (FJD 000’s) Trade balance (FJD 000’s) Government current account surplus/ deficit (FJD 000’s) Money supply M1 Total foreign exchange reserves Consumer price index weighted price for alcohol and tobacco (base line was re-worked to 1995=100) Total government expenditure on education Total government expenditure on housing, community development, and sanitary services
M3, CPI-FOOD, HEALTH M3, CPI-FOOD, EDUCATION M3, CPI-ALCOHOL&TOBACCO, HEALTH M3, CPI-ALCOHOL&TOBACCO, EDUCATION
Visitor arrivals adjusted for seasonal variations Consumer price index (the base year changed during the period considered, thus all prices were re-worked to 1993=100 index) Building material price index (the base year changed during the period considered, thus all prices were re-worked to 1989=100 index) Total exports (FJD 000’s) Total imports (FJD 000’s) Trade balance (FJD 000’s) Government current account surplus/ deficit (FJD 000’s) Money supply M3 Total foreign exchange reserves Consumer price index weighted price for foods (base line was re-worked to 1995=100) Total government expenditure on health Total government expenditure on housing, community development, and sanitary services
Visitor arrivals adjusted for seasonal variations Consumer price index (the base year changed during the period considered, thus all prices were re-worked to 1993=100 index) Building material price index (the base year changed during the period considered, thus all prices were re-worked to 1989=100 index) Total exports (FJD 000’s) Total imports (FJD 000’s) Trade balance (FJD 000’s) Government current account surplus/ deficit (FJD 000’s) Money supply M3 Total foreign exchange reserves Consumer price index weighted price for foods (base line was re-worked to 1995=100) Total government expenditure on education Total government expenditure on housing, community development, and sanitary services
Visitor arrivals adjusted for seasonal variations Consumer price index (the base year changed during the period considered, thus all prices were re-worked to 1993=100 index) Building material price index (the base year changed during the period considered, thus all prices were re-worked to 1989=100 index) Total exports (FJD 000’s) Total imports (FJD 000’s) Trade balance (FJD 000’s) Government current account surplus/ deficit (FJD 000’s) Money supply M3 Total foreign exchange reserves Consumer price index weighted price for alcohol and tobacco (base line was re-worked to 1995=100) Total government expenditure on health Total government expenditure on housing, community development, and sanitary services
Visitor arrivals adjusted for seasonal variations Consumer price index (the base year changed during the period considered, thus all prices were re-worked to 1993=100 index) Building material price index (the base year changed during the period considered, thus all prices were re-worked to 1989=100 index) Total exports (FJD 000’s) Total imports (FJD 000’s) Trade balance (FJD 000’s) Government current account surplus/ deficit (FJD 000’s) Money supply M3 Total foreign exchange reserves Consumer price index weighted price for alcohol and tobacco (base line was re-worked to 1995=100) Total government expenditure on education Total government expenditure on housing, community development, and sanitary services
Table 2: Mutually exclusive models of independent variables
Each of the dependent variables were individually tested for their dependence on each of the models separately and the following results were obtained.

FIJI JOURNAL OF PUBLIC HEALTH
Volume 3, Issue 1, 2014 26
ORIGINAL RESEARCH
Table 3: Adjusted R2 between different independent vari-able models and dependent variables.
Discussion Total live births
Crude birth rate per 1000 population
Crude death rate per 1000 population
Infant mortality rate per 1000 live birth
Perinatal mortality rate per 1000 live birthsDr. S. J. Mahakalanda, CHIPSR, College of Medicine, FNU & Emali Soderberg, Fiji islands Bureau of Statistics Page 5
INDEPENDENT VARIABLES MODEL
LIVE
_ BI
RTHS
CBR
CDR
IMR
Pent
MR
NMR
Pont
MR
U5_M
R
MM
R
GFR
FPPR
M1, CPI-FOOD, HEALTH 0.779 0.776 0.42 0.629 0.749 0.539 0.772 0.296 0.648 0.525 0.901
M1, CPI-FOOD, EDUCATION 0.769 0.778 0.523 0.653 0.766 0.591 0.703 0.428 0.715 0.545 0.901
M1, CPI-ALCOHOL&TOBACCO, HEALTH 0.775 0.788 0.408 0.65 0.756 0.551 0.785 0.271 0.645 0.524 0.923
M1, CPI-ALCOHOL&TOBACCO, EDUCATION 0.765 0.789 0.516 0.683 0.772 0.612 0.714 0.421 0.707 0.545 0.923
M3, CPI-FOOD, HEALTH 0.798 0.781 0.425 0.621 0.771 0.569 0.782 0.29 0.659 0.554 0.91
M3, CPI-FOOD, EDUCATION 0.783 0.781 0.531 0.651 0.784 0.635 0.705 0.428 0.718 0.569 0.91
M3, CPI-ALCOHOL&TOBACCO, HEALTH 0.791 0.792 0.411 0.642 0.776 0.582 0.795 0.264 0.655 0.551 0.931
M3, CPI-ALCOHOL&TOBACCO, EDUCATION 0.779 0.792 0.525 0.68 0.788 0.653 0.716 0.421 0.71 0.569 0.931
Table 3: Adjusted R2 between different independent variable models and dependent variables.
Discussion
Total live births
R R Square
Adjusted R
Square
Std. Error of the Estimate
.927 0.859 0.798 1049.521
As per the findings all models are relevant in describing total live births i.e. all models demonstrate a correlation of determination of over 0.7. However the model M3, CPI-FOOD, HEALTH has the highest correlation of 0.798. Therefore the independent variables considered in model M3, CPI-FOOD, HEALTH explain 79.8% of variability of total live births in Fiji Islands for the period from 2003 to 2010.
Figure 2a: The histogram for the model on live births shows reasonable overlapping on a normal distribution
Figure 2b: The regression standard residual plot demonstrates close proximity of observations to the line of best fit
Table 4: Model summary for M3, CPI-FOOD, HEALTH and Total live births
Dr. S. J. Mahakalanda, CHIPSR, College of Medicine, FNU & Emali Soderberg, Fiji islands Bureau of Statistics Page 5
INDEPENDENT VARIABLES MODEL
LIVE
_ BI
RTHS
CBR
CDR
IMR
Pent
MR
NMR
Pont
MR
U5_M
R
MM
R
GFR
FPPR
M1, CPI-FOOD, HEALTH 0.779 0.776 0.42 0.629 0.749 0.539 0.772 0.296 0.648 0.525 0.901
M1, CPI-FOOD, EDUCATION 0.769 0.778 0.523 0.653 0.766 0.591 0.703 0.428 0.715 0.545 0.901
M1, CPI-ALCOHOL&TOBACCO, HEALTH 0.775 0.788 0.408 0.65 0.756 0.551 0.785 0.271 0.645 0.524 0.923
M1, CPI-ALCOHOL&TOBACCO, EDUCATION 0.765 0.789 0.516 0.683 0.772 0.612 0.714 0.421 0.707 0.545 0.923
M3, CPI-FOOD, HEALTH 0.798 0.781 0.425 0.621 0.771 0.569 0.782 0.29 0.659 0.554 0.91
M3, CPI-FOOD, EDUCATION 0.783 0.781 0.531 0.651 0.784 0.635 0.705 0.428 0.718 0.569 0.91
M3, CPI-ALCOHOL&TOBACCO, HEALTH 0.791 0.792 0.411 0.642 0.776 0.582 0.795 0.264 0.655 0.551 0.931
M3, CPI-ALCOHOL&TOBACCO, EDUCATION 0.779 0.792 0.525 0.68 0.788 0.653 0.716 0.421 0.71 0.569 0.931
Table 3: Adjusted R2 between different independent variable models and dependent variables.
Discussion
Total live births
R R Square
Adjusted R
Square
Std. Error of the Estimate
.927 0.859 0.798 1049.521
As per the findings all models are relevant in describing total live births i.e. all models demonstrate a correlation of determination of over 0.7. However the model M3, CPI-FOOD, HEALTH has the highest correlation of 0.798. Therefore the independent variables considered in model M3, CPI-FOOD, HEALTH explain 79.8% of variability of total live births in Fiji Islands for the period from 2003 to 2010.
Figure 2a: The histogram for the model on live births shows reasonable overlapping on a normal distribution
Figure 2b: The regression standard residual plot demonstrates close proximity of observations to the line of best fit
Table 4: Model summary for M3, CPI-FOOD, HEALTH and Total live births
As per the findings all models are relevant in de-scribing total live births i.e. all models demonstrate a correlation of determination of over 0.7. However the model M3, CPI-FOOD, HEALTH has the high-est correlation of 0.798. Therefore the independ-ent variables considered in model M3, CPI-FOOD, HEALTH explain 79.8% of variability of total live births in Fiji Islands for the period from 2003 to 2010.
As per the findings all mod-els are relevant in describing Crude birth rate per 1000 population i.e. all models demonstrate a correlation of determination of over 0.7. However the models M3, CPI-ALCOHOL&TOBACCO, HEALTH and M3, CPI- ALCOHOL&TOBACCO, EDUCATION have the high-est correlation of 0.792.
Dr. S. J. Mahakalanda, CHIPSR, College of Medicine, FNU & Emali Soderberg, Fiji islands Bureau of Statistics Page 6
Crude birth rate per 1000 population
R R Square
Adjusted R Square
Std. Error of the Estimate
.924 0.855 0.792 0.17984
.925 0.855 0.792 0.17967
Crude death rate per 1000 population
R R Square
Adjusted R
Square
Std. Error of the Estimate
.820 0.673 0.531 0.17605
As per the findings all models are relevant in describing Crude birth rate per 1000 population i.e. all models demonstrate a correlation of determination of over 0.7. However the models M3, CPI-ALCOHOL&TOBACCO, HEALTH and M3, CPI-ALCOHOL&TOBACCO, EDUCATION have the highest correlation of 0.792. However the model M3, CPI-ALCOHOL&TOBACCO, EDUCATION demonstrates a lower standard error estimate than the model M3, CPI-ALCOHOL&TOBACCO, HEALTH. Therefore the independent variables considered in model M3, CPI-FOOD, HEALTH explain 79.2% of variability of Crude birth rate per 1000 population in Fiji Islands with a lower standard error estimate for the period from 2003 to 2010.
Table 5: Model summaries for M3, CPI-FOOD, HEALTH and M3, CPI-ALCOHOL&TOBACCO, EDUCATION With Crude birth rate per 1000 population
Figure 3a: The histogram for both the models on Crude birth rate reasonably overlapping on a normal distribution; however the distributions of frequencies are not identical. Though the second model shows a lower standard error, the distribution overlaps better on a normal distribution.
Figure 3b: The regression standard residual plot demonstrates close proximity of observations to the line of best fit. Even though both the models show similar figures, the dispersion from the line of best fir is not identical for the two models
Table 6: Model M3, CPI-FOOD, EDUCATION with Crude death rate per 1000 population
Figure 4a: The histogram for crude death rate shows a skewed distribution.
Figure 4b: The regression standard residual plot demonstrates distance of variables from the line of beat fit and the non-linear nature of the relationship explaining the low correlation of determination
As per the findings none of models are relevant in describing Crude death rate per 1000 population i.e. all models demonstrate a correlation of determination of below 0.7. The best correlation found was for model M3, CPI-FOOD, EDUCATION. It stood at 0.531 which still indicates a weak relationship. This explains that the variation of Crude death rate per 1000 population cannot be attributed to any of the variables considered in this model.
However the models M3, CPI- ALCOHOL&TOBACCO, EDU-CATION demonstrates a lower standard error estimate than the model M3, CPI-ALCOHOL&TOBACCO, HEALTH. Therefore the independent variables considered in model M3, CPI- FOOD, HEALTH explain 79.2% of variability of Crude birth rate per 1000 population in Fiji Islands with a lower standard error esti-mate for the period from 2003 to 2010.
As per the findings none of models are relevant in describing Crude death rate per 1000 population i.e. all models demonstrate a cor-relation of determination of below 0.7. The best correla-tion found was for model M3, CPI-FOOD, EDUCA-TION. It stood at 0.531 which still indicates a weak relationship. This explains that the variation of Crude death rate per 1000 popula-tion cannot be attributed to any of the variables consid-ered in this model.
As per the findings none of the models are relevant in describing Infant mor-tality rate i.e. all models demonstrate a correlation of determination of below 0.7. The model M1, CPI-ALCOHOL&TOBACCO, EDUCATION has the high-est correlation of 0.683. Thus none of the models reach the 0.7 cutoff. Hence none of the models adequately explains the variability of Infant mortality rate per 1000 live births in Fiji islands for the period from 2003 to 2010.
As per the findings all models are relevant in describing Infant mortal-ity rate i.e. all models demonstrate a correlation of determination of over 0.7. The model M3, CPI-ALCOHOL&TOBACCO, EDUCATION has the highest correlation of 0.788. Thus the model M3, CPI-ALCOHOL&TOBACCO, EDUCATION best describes the variability of Perinatal mortality rate per 1000 live births in Fiji islands for the period from 2003 to 2010.
Dr. S. J. Mahakalanda, CHIPSR, College of Medicine, FNU & Emali Soderberg, Fiji islands Bureau of Statistics Page 6
Crude birth rate per 1000 population
R R Square
Adjusted R Square
Std. Error of the Estimate
.924 0.855 0.792 0.17984
.925 0.855 0.792 0.17967
Crude death rate per 1000 population
R R Square
Adjusted R
Square
Std. Error of the Estimate
.820 0.673 0.531 0.17605
As per the findings all models are relevant in describing Crude birth rate per 1000 population i.e. all models demonstrate a correlation of determination of over 0.7. However the models M3, CPI-ALCOHOL&TOBACCO, HEALTH and M3, CPI-ALCOHOL&TOBACCO, EDUCATION have the highest correlation of 0.792. However the model M3, CPI-ALCOHOL&TOBACCO, EDUCATION demonstrates a lower standard error estimate than the model M3, CPI-ALCOHOL&TOBACCO, HEALTH. Therefore the independent variables considered in model M3, CPI-FOOD, HEALTH explain 79.2% of variability of Crude birth rate per 1000 population in Fiji Islands with a lower standard error estimate for the period from 2003 to 2010.
Table 5: Model summaries for M3, CPI-FOOD, HEALTH and M3, CPI-ALCOHOL&TOBACCO, EDUCATION With Crude birth rate per 1000 population
Figure 3a: The histogram for both the models on Crude birth rate reasonably overlapping on a normal distribution; however the distributions of frequencies are not identical. Though the second model shows a lower standard error, the distribution overlaps better on a normal distribution.
Figure 3b: The regression standard residual plot demonstrates close proximity of observations to the line of best fit. Even though both the models show similar figures, the dispersion from the line of best fir is not identical for the two models
Table 6: Model M3, CPI-FOOD, EDUCATION with Crude death rate per 1000 population
Figure 4a: The histogram for crude death rate shows a skewed distribution.
Figure 4b: The regression standard residual plot demonstrates distance of variables from the line of beat fit and the non-linear nature of the relationship explaining the low correlation of determination
As per the findings none of models are relevant in describing Crude death rate per 1000 population i.e. all models demonstrate a correlation of determination of below 0.7. The best correlation found was for model M3, CPI-FOOD, EDUCATION. It stood at 0.531 which still indicates a weak relationship. This explains that the variation of Crude death rate per 1000 population cannot be attributed to any of the variables considered in this model.
Dr. S. J. Mahakalanda, CHIPSR, College of Medicine, FNU & Emali Soderberg, Fiji islands Bureau of Statistics Page 7
Infant mortality rate per 1000 live birth
R R Square
Adjusted R
Square
Std. Error of the Estimate
.882 0.779 0.683 0.31398
Perinatal mortality rate per 1000 live births
R R Square
Adjusted R Square
Std. Error of the
Estimate
.923 0.852 0.788 1.06988
Table 7: Model M1, CPI-ALCOHOL&TOBACCO, EDUCATION with Infant mortality rate per 1000 live births
Figure 5a: The histogram for infant mortality rate shows a slight skewness in distribution. The central tendency is very close to the central tendency of the normal distribution but does not meet the center adequately to form in to a reliable model.
Figure 5b: The regression standard residual plot demonstrates distance of variables from the line of beat fit and the non-linear nature of the relationship explaining the low correlation of determination. What is noticeable is that the distribution is not well balanced on either side of the line.
As per the findings none of the models are relevant in describing Infant mortality rate i.e. all models demonstrate a correlation of determination of below 0.7. The model M1, CPI-ALCOHOL&TOBACCO, EDUCATION has the highest correlation of 0.683. Thus none of the models reach the 0.7 cutoff. Hence none of the models adequately explains the variability of Infant mortality rate per 1000 live births in Fiji islands for the period from 2003 to 2010.
Table 8: Model, M3, CPI-ALCOHOL&TOBACCO, EDUCATION with Perinatal mortality rate per 1000 live births
As per the findings all models are relevant in describing Infant mortality rate i.e. all models demonstrate a correlation of determination of over 0.7. The model M3, CPI-ALCOHOL&TOBACCO, EDUCATION has the highest correlation of 0.788. Thus the model M3, CPI-ALCOHOL&TOBACCO, EDUCATION best describes the variability of Perinatal mortality rate per 1000 live births in Fiji islands for the period from 2003 to 2010.
Figure 6a: The histogram for the model on perinatal mortality shows reasonable overlapping on a normal distribution. The central tendencies do not meet the normal distributions central tendencies perfectly; still the skewness is not too far off the norm.
Figure 6b: The regression standard residual plot demonstrates close proximity of observations to the line of best fit. The spread is not symmetrical from the linear indicator; however the observations are close to the line of best fit.

FIJI JOURNAL OF PUBLIC HEALTH
Volume 3, Issue 1, 2014 27
ORIGINAL RESEARCH
Under five mortality rate per 1000 live births
Maternal mortality rate per 100,000 live births
Gross fertility rate per 1000 child bearing age females
Family planning protection rateFPPR (M3, CPI-ALCOHOL&TOBACCO, HEALTH) and (M3, CPI-ALCOHOL&TOBACCO, EDUCATION )
CONCLUSIONThis study examined whether the indicators for coun-try performance indicators recognized by the Fiji Islands Bureau of Statistics have a significant relation-ship with the health indicators identified by the same. The combination of variables Visitor arrivals adjusted for seasonal variations, Consumer price index (the base year changed during the period considered, thus all prices were re-worked to 1993=100 index), Build-ing material price index (the base year changed during the period considered, thus all prices were re-worked to 1989=100 index), Total exports (FJD 000’s), Total imports (FJD 000’s), Trade balance (FJD 000’s), Gov-ernment current account surplus/ deficit (FJD 000’s), Money supply M1, Total foreign exchange reserves, Consumer price index weighted price for foods (base line was re-worked to 1995=100), Total government expenditure on health, Total government expenditure on housing, community development, and sanitary services does not rank top amongst the models consid-ered here for any of the health indicators. The combination of variables Visitor arrivals adjust-ed for seasonal variations Consumer price index (the base year changed during the period considered, thus all prices were re-worked to 1993=100 index), Build-ing material price index (the base year changed during the period considered, thus all prices were re-worked
Dr. S. J. Mahakalanda, CHIPSR, College of Medicine, FNU & Emali Soderberg, Fiji islands Bureau of Statistics Page 8
Under five mortality rate per 1000 live births
R R Square
Adjusted R Square
Std. Error of the Estimate
.775 0.601 0.428 0.21094
.775 0.601 0.428 0.21094
Maternal mortality rate per 100,000 live births
R R Square
Adjusted R Square
Std. Error of the Estimate
.896 0.803 0.718 2.24474
Figure 7a: The histogram for under five mortality rate shows poor overlapping with the normal distribution, indicating a poor relationship
Figure 7b: The regression standard residual plots demonstrates distance of variables from the line of beat fit and the non-linear nature of the relationship explaining the low correlation of determination
Table 8: Models for Under five mortality rate per 1000 live births M1, CPI-FOOD, EDUCATION and M3, CPI-FOOD, EDUCATION
As per the findings none of models are relevant in describing Under five mortality rate per 1000 live births i.e. all models demonstrate a correlation of determination of below 0.7. The best correlations found were for models M1, CPI-FOOD, EDUCATION and M3, CPI-FOOD. Both the models had identical correlations in describing Under five mortality rate, recording a correlation of determination of 0.428. Hence none of the models considered here adequately describes Under five mortality rate’s variability in Fiji islands for the period 2003-2010
Table 9: Modes for Maternal mortality rate per 1000 live births M3, CPI-FOOD, EDUCATION
Figure 8a: The histogram for the model on mortality shows reasonable overlapping on a normal distribution. The central tendencies meet the normal distributions central tendencies well.
Figure 8b: The regression standard residual plot demonstrates close proximity of observations to the line of best fit. The spread is not symmetrical from the linear indicator; however the observations on either side nullify the distances
As per the findings 4 out of 8 models are relevant in describing Infant mortality rate i.e. all models demonstrate a correlation of determination of over 0.7. The model M3, CPI-FOOD, EDUCATION has the highest correlation of 0.718. Thus the model M3, CPI-FOOD, EDUCATION best describes the variability of Maternal mortality rate per 1000 live births in Fiji islands for the period from 2003 to 2010.
As per the findings none of models are relevant in describing Under five mortality rate per 1000 live births i.e. all models demonstrate a correlation of determination of below 0.7. The best correlations found were for models M1, CPI-FOOD, EDUCATION and M3, CPI-FOOD. Both the models had identical correlations in describing Under five mortality rate, record-ing a correlation of determina-tion of 0.428. Hence none of the models considered here adequately describes Under five mortality rate’s variability in Fiji islands for the period 2003-2010
As per the findings none of models are relevant in describ-ing Family planning protection rate i.e. all models demonstrate a correlation of determina-tion of above 0.7. The best correlations found were for models M3, CPI-FOOD, EDUCATION and M3, CPI- ALCOHOL&TOBACCO, EDUCATION. Both the mod-els had similar correlations with varied standard error estimates in describing Family planning protection rate, recording a very strong correlation of determina-tion of 0.931. However the M3, CPI-FOOD, EDUCATION has a lower standard error esti-mate thus it could be consid-ered the best model to describe Family planning protection rate variability in Fiji islands for the period 2003-2010
As per the findings 4 out of 8 models are relevant in describing Infant mortality rate i.e. all models demonstrate a correlation of deter-mination of over 0.7. The model M3, CPI-FOOD, EDUCATION has the highest correlation of 0.718. Thus the model M3, CPI- FOOD, EDUCATION best de-scribes the variability of Maternal mortality rate per 1000 live births in Fiji islands for the period from 2003 to 2010.
As per the findings none of models are relevant in describ-ing Gross fertility rate per 1000 child bearing age females i.e. all models demonstrate a correlation of determination of below 0.7. The best correlations found were for models M3, CPI-FOOD, EDUCATION and M3, CPI-ALCOHOL&TOBACCO, EDUCATION. Both the models had similar correlations with varied standard error estimates in describing Gross fertility rate per 1000 child bearing age females, re-cording a correlation of determina-tion of 0.569. Hence none of the models considered here adequately describes Gross fertility rate per 1000 child bearing age females variability in Fiji islands for the period 2003- 2010
Dr. S. J. Mahakalanda, CHIPSR, College of Medicine, FNU & Emali Soderberg, Fiji islands Bureau of Statistics Page 9
Gross fertility rate per 1000 child bearing age females
R R Square Adjusted R Square
Std. Error of the
Estimate .836 0.699 0.569 0.78482 .836 0.699 0.569 0.78486
Table 10: Models for Gross fertility rate per 1000 child bearing aged females with M3, CPI-FOOD, EDUCATION and M3, CPI-ALCOHOL&TOBACCO, EDUCATION
Figure 7a: The histograms for Gross fertility rate shows poor overlapping with the normal distribution, indicating a poor relationship
Figure 7b: The regression standard residual plots demonstrates distance of variables from the line of beat fit and the non-linear nature of the relationship explaining the low correlation of determination
As per the findings none of models are relevant in describing Gross fertility rate per 1000 child bearing age females i.e. all models demonstrate a correlation of determination of below 0.7. The best correlations found were for models M3, CPI-FOOD, EDUCATION and M3, CPI-ALCOHOL&TOBACCO, EDUCATION. Both the models had similar correlations with varied standard error estimates in describing Gross fertility rate per 1000 child bearing age females, recording a correlation of determination of 0.569. Hence none of the models considered here adequately describes Gross fertility rate per 1000 child bearing age females variability in Fiji islands for the period 2003-2010
Dr. S. J. Mahakalanda, CHIPSR, College of Medicine, FNU & Emali Soderberg, Fiji islands Bureau of Statistics Page 10
Family planning protection rate
FPPR (M3, CPI-ALCOHOL&TOBACCO, HEALTH) and (M3, CPI-ALCOHOL&TOBACCO, EDUCATION )
R R Square
Adjusted R Square
Std. Error of the
Estimate
.976 0.952 0.931 1.38524
.976 0.952 0.931 1.38553
Conclusion
This study examined whether the indicators for country performance indicators recognized by the Fiji Islands Bureau of Statistics have a significant relationship with the health indicators identified by the same. The combination of variables Visitor arrivals adjusted for seasonal variations, Consumer price index (the base year changed during the period considered, thus all prices were re-worked to 1993=100 index), Building material price index (the base year changed during the period considered, thus all prices were re-worked to 1989=100 index), Total exports (FJD 000’s), Total imports (FJD 000’s), Trade balance (FJD 000’s), Government current account surplus/ deficit (FJD 000’s), Money supply M1, Total foreign exchange reserves, Consumer price index weighted price for foods (base line was re-worked to
Table 11: Models for Family planning protection rate with M3, CPI-FOOD, EDUCATION and M3, CPI-ALCOHOL&TOBACCO, EDUCATION
Figure 10a: The histograms for family planning protection rate shows good overlapping with the normal distribution, very strong relationship
Figure 10b: The regression standard residual plots demonstrate distance of variables from the line of beat fit and the linear nature of the relationship explaining the high correlation of determination. The distances nullify well on either side of the line.
As per the findings none of models are relevant in describing Family planning protection rate i.e. all models demonstrate a correlation of determination of above 0.7. The best correlations found were for models M3, CPI-FOOD, EDUCATION and M3, CPI-ALCOHOL&TOBACCO, EDUCATION. Both the models had similar correlations with varied standard error estimates in describing Family planning protection rate, recording a very strong correlation of determination of 0.931. However the M3, CPI-FOOD, EDUCATION has a lower standard error estimate thus it could be considered the best model to describe Family planning protection rate variability in Fiji islands for the period 2003-2010

FIJI JOURNAL OF PUBLIC HEALTH
Volume 3, Issue 1, 2014 28
ORIGINAL RESEARCH
to 1989=100 index), Total exports (FJD 000’s), Total imports (FJD 000’s), Trade balance (FJD 000’s), Gov-ernment current account surplus/ deficit (FJD 000’s), Money supply M1, Total foreign exchange reserves, Consumer price index weighted price for foods (base line was re-worked to 1995=100), Total government expenditure on education, Total government ex-penditure on housing, community development, and sanitary services only ranks top amongst the variables models for under five mortality. However the correla-tion is not strong enough to explain the variability of under-five mortality successfully. The combination of variables Visitor arrivals adjust-ed for seasonal variations, Consumer price index (the base year changed during the period considered, thus all prices were re-worked to 1993=100 index), Build-ing material price index (the base year changed during the period considered, thus all prices were re-worked to 1989=100 index), Total exports (FJD 000’s), Total imports (FJD 000’s), Trade balance (FJD 000’s), Gov-ernment current account surplus/ deficit (FJD 000’s), Money supply M1, Total foreign exchange reserves, Consumer price index weighted price for alcohol and tobacco (base line was re- worked to 1995=100), Total government expenditure on health, Total government expenditure on housing, community development, and sanitary services did not rank top amongst the models considered here for any of the health indicators. The combination of variables Visitor arrivals adjust-ed for seasonal variations, Consumer price index (the base year changed during the period considered, thus all prices were re-worked to 1993=100 index), Build-ing material price index (the base year changed during the period considered, thus all prices were re-worked to 1989=100 index), Total exports (FJD 000’s), Total imports (FJD 000’s), Trade balance (FJD 000’s), Gov-ernment current account surplus/ deficit (FJD 000’s), Money supply M1, Total foreign exchange reserves, Consumer price index weighted price for alcohol and tobacco (base line was re- worked to 1995=100), Total government expenditure on education, Total govern-ment expenditure on housing, community develop-ment, and sanitary services ranked top amongst the variables models considered here for infant mortal-ity rate. However the correlation was not significant enough to explain its variability successfully. The combination of variables Visitor arrivals adjust-ed for seasonal variations, Consumer price index (the base year changed during the period considered, thus all prices were re-worked to 1993=100 index), Build-ing material price index (the base year changed during the period considered,
thus all prices were re-worked to 1989=100 index), Total exports (FJD 000’s), Total imports (FJD 000’s), Trade balance (FJD 000’s), Government current ac-count surplus/ deficit (FJD 000’s), Money supply M3, Total foreign exchange reserves, Consumer price index weighted price for foods (base line was re-worked to 1995=100), Total government expenditure on health, Total government expenditure on housing,community development, and sanitary services only ranks top amongst the variables models for under total live births. The correlation is strong enough to explain the variability of total live births successfully. The combination of variables Visitor arrivals adjust-ed for seasonal variations, Consumer price index (the base year changed during the period considered, thus all prices were re-worked to 1993=100 index), Build-ing material price index (the base year changed during the period considered, thus all prices were re-worked to 1989=100 index), Total exports (FJD 000’s), Total imports (FJD 000’s), Trade balance (FJD 000’s), Gov-ernment current account surplus/ deficit (FJD 000’s), Money supply M3, Total foreign exchange reserves, Consumer price index weighted price for foods (base line was re-worked to 1995=100), Total government expenditure on education, Total government expendi-ture on housing, community development, and sani-tary services ranks top amongst the variables models for crude death rate, under five mortality, maternal mortality and gross fertility rate. However, the only strong correlation was with maternal mortality rate. The combination of variables Visitor arrivals adjust-ed for seasonal variations, Consumer price index (the base year changed during the period considered, thus all prices were re-worked to 1993=100 index), Build-ing material price index (the base year changed during the period considered, thus all prices were re-worked to 1989=100 index), Total exports (FJD 000’s), Total imports (FJD 000’s), Trade balance (FJD 000’s), Gov-ernment current account surplus/ deficit (FJD 000’s), Money supply M3, Total foreign exchange reserves, Consumer price index weighted price for alcohol and tobacco (base line was re- worked to 1995=100), Total government expenditure on health, Total government expenditure on housing, community development, and sanitary services ranks top amongst the variables mod-els for crude birth rate, post natal mortality rate and family planning protection rate. This model had strong and significant correlations with all the three health indicators mentioned here. The correlation with family planning protection rate was as high as 93.1%.

FIJI JOURNAL OF PUBLIC HEALTH
Volume 3, Issue 1, 2014 29
ORIGINAL RESEARCH
These findings indicate that the seemingly non-health indicators have a significant bearing on the health indi-cators whilst for some health indicators, what matters more is the efforts on education than that on health.
LimitationsThe availability of data and consistency of data was one of the most limiting issues encountered by the authors. The other concern was in the means of calculations changing from time to time. Most of the country indicators were available quarterly, however the health indicators were annual. Hence the relationships were based on that assumption health indicators remain constant through out the four quarters.
ReferencesHealthyPeople.gov, 2014: available on http://www.healthypeople.gov/2020/LHI/socialDeterminants.aspx ac-cessed on 17th April 2014 1. Fiji islands bureau of statistics (2003, March) Key statistics. Fiji islands bureau of statistics, Suva2. Fiji islands bureau of statistics (2003, June) Key statistics. Fiji islands bureau of statistics, Suva3. Fiji islands bureau of statistics (2003, September) Key statistics. Fiji islands bureau of statistics, Suva 4. Fiji islands bureau of statistics (2003, December) Key statistics. Fiji islands bureau of statistics, Suva 5. Fiji islands bureau of statistics (2004, March) Key statistics. Fiji islands bureau of statistics, Suva6. Fiji islands bureau of statistics (2004, June) Key statis-tics. Fiji islands bureau of statistics, Suva7. Fiji islands bureau of statistics (2004, September) Key statistics. Fiji islands bureau of statistics, Suva8. Fiji islands bureau of statistics (2004, December) Key statistics. Fiji islands bureau of statistics, Suva 9. Fiji islands bureau of statistics (2005, March) Key statistics. Fiji islands bureau of statistics, Suva10. Fiji islands bureau of statistics (2005, June) Key sta-tistics. Fiji islands bureau of statistics, Suva11. Fiji islands bureau of statistics (2005, September) Key statistics. Fiji islands bureau of statistics, Suva 12. Fiji islands bureau of statistics (2005, December) Key statistics. Fiji islands bureau of statistics, Suva 13. Fiji islands bureau of statistics (2006, March) Key statistics. Fiji islands bureau of statistics, Suva14. Fiji islands bureau of statistics (2006, June) Key sta-tistics. Fiji islands bureau of statistics, Suva15. Fiji islands bureau of statistics (2006, September) Key statistics. Fiji islands bureau of statistics, Suva
16. Fiji islands bureau of statistics (2006, December) Key statistics. Fiji islands bureau of statistics, Suva 17. Fiji islands bureau of statistics (2007, March) Key statistics. Fiji islands bureau of statistics, Suva18. Fiji islands bureau of statistics (2007, June) Key sta-tistics. Fiji islands bureau of statistics, Suva19. Fiji islands bureau of statistics (2007, September) Key statistics. Fiji islands bureau of statistics, Suva 20. Fiji islands bureau of statistics (2007, December) Key statistics. Fiji islands bureau of statistics, Suva21. Fiji islands bureau of statistics (2008, March) Key statistics. Fiji islands bureau of statistics, Suva22. Fiji islands bureau of statistics (2008, June) Key sta-tistics. Fiji islands bureau of statistics, Suva23. Fiji islands bureau of statistics (2008, September) Key statistics. Fiji islands bureau of statistics, Suva 24. Fiji islands bureau of statistics (2008, December) Key statistics. Fiji islands bureau of statistics, Suva 25. Fiji islands bureau of statistics (2009, March) Key statistics. Fiji islands bureau of statistics, Suva26. Fiji islands bureau of statistics (2009, June) Key sta-tistics. Fiji islands bureau of statistics, Suva27. Fiji islands bureau of statistics (2009, September) Key statistics. Fiji islands bureau of statistics, Suva 28. Fiji islands bureau of statistics (2009, December) Key statistics. Fiji islands bureau of statistics, Suva29. Fiji islands bureau of statistics (2010, March) Key statistics. Fiji islands bureau of statistics, Suva30. Fiji islands bureau of statistics (2010, June) Key sta-tistics. Fiji islands bureau of statistics, Suva31. Fiji islands bureau of statistics (2010, September) Key statistics. Fiji islands bureau of statistics, Suva32. Fiji islands bureau of statistics (2010, December) Key statistics. Fiji islands bureau of statistics, Suva33. WHO Maternal Mortality profiles available on www.who.int/gho/maternal_health/countries/en accessed on 20th April 201434. WHO, 2012: Trends in maternal mortality 1990-2010, UNICEF, UNFPA & World bank Estimates available on www.who.int/trends_in_maternal_mortal-ity_A4-1.pdf accessed on 20th April 201435. WHO, 2001: World Health Report available on www. 36. WHO.int accessed on 20th April 2014 World Bank, 2014: available on www.data.worldbank.org accessed on 20th April 201437. Country service delivery profiles available on www.wpro.who.int/health- services/service_delivery_profile_fiji.pdf accessed on 22nd April 201438. Fiji Islands Health Systems Review available on www.wpro.int/fiji_islands_health_systems_review.pdf accessed on 21st April 2014
FIJI JOURNAL OF PUBLIC HEALTH
Volume 3, Issue 1, 2014 30
ABSTRACTHealth information comprises a wide array of information pertaining to healthcare. Information is not limited to health but matters that impinge on health including demographics, social determinants of health, financing, amongst others. Hence the use of this information may also vary from operational to strategic planning and decision making, evidence based policy and research. The Ministry of Health in Fiji is guided by the Health Information Policy (2011) for any data requested pertaining to health. However, a standardized format for data requests was unavailable. The formulation of the standardized format was undertaken and completed in 2013 with a subsequent revision in 2014.
REVIEW
Keywords: Data Request, Data Approval Procedures
DATA REQUESTS AND APPROVAL PROCEDURES; MINISTRY OF HEALTH OF THE REPUBLIC OF FIJI
Bali A1, Nand D1*
INTRODUCTIONHealth information systems (HIS) are information management systems that capture and display data related to the delivery of health care services. A HIS is not just a system of computers and software it includes clinical guidelines, medical terminology dictionaries, and interfaces the various diagnostic devices and other clinical and business information databases, such as laboratory, pharmacy and diagnostic imaging. It is also used for public health and medical research purposes1 .In 2012 there was 123 data requests compared to 2011 where there were only 48 data requests. This was an increase in data requests by 156% over one year. Health Information in Fiji comprises but is not lim-ited to population growth, births, marriages, mortality and morbidity, disease outbreaks, social determinants of health (such as nutrition, environment, and oral health), access, coverage and quality of services, financ-ing, human resources for health, and other health data. Various tools and data collection methods are available including vital registration and census systems, surveys (household, facility and regional), routine facility-based data collection systems, patient monitoring and medical records, disease surveillance and research. Fiji is pursuing HIS strengthening in order to have a well-functioning health system and delivery of better qual-ity health services resulting in better individual health outcomes and better evidence for all levels of decision making. The various HIS stakeholders; i.e. patients, communities, service providers, programme manag-ers, policy-makers, non-governmental organizations (NGOs), bi- and multilateral cooperating partners like
AusAID, Global Fund, WHO, JICA and other global agencies and organizations, all need information in order to measure overall performance, impact of their own respective programs and activities and the quality of services provided. Health information therefore also serves as the basis for planning, implementation, and monitoring &evaluation of all components required to improve disease-specific and general service delivery systems2. The remarkable and wide use of health information in all levels of decision making, policy and planning indicated the need for formulation of a standardized template for data requests. The Health Information Policy (2011) supported the formulation of this docu-ment as part of the data request cycle. Consequently a literature review was undertaken and results from this literature review were utilized to formulate the data request form.
METHODThe following information on Data Request has been collected through various websites as stated below:1. Wikipedia site2. Google site3. Yahoo website4. BMJ site
Literature Review1. Definition2. Making a data request3. Purpose of data request forms4. Procedure to be followed for approval of data request in MoH
1.Health Information Unit, Ministry of Health* Address for Correspondence: [email protected]
FIJI JOURNAL OF PUBLIC HEALTH
Volume 3, Issue 1, 2014 31
Ministry of Health’s Health Information Unit produces wide range of information for data request each year. The HIU has its own policy on the data protection and data request procedure to follow in order to secure and summited vital information by any type of user. All information produced is used by different stakehold-ers for various developments including improvements to population health status in the Republic of Fiji. According to the Freedom of Information Act, data requests must be made in writing and submitted to the Department’s Information Officer and should be documented3 .
DefinitionsThe word Data4 [a noun] is a plural of datum. It is used with a plural verb for example; individual facts, statistics and items of information. It is also used with a singular verb such as a body of facts, information. In addition, data is available from different sources and has a great impact in healthcare.The information repre-sents the results of analysis done after entry of manual data in the selected databases. Data is entered by data entry officers for immediate processing using computer software and is interpreted both electronically and manually for modifying the information to the context of the situation. The word Request5 [a noun] is the act of asking for something to be given or done as in the state of being asked for; demand, especially politely or formally as a favorsuch as solicitation or petition. It can be in a form of a written statement of petition to meet ones need. Information Request Definition: A request for information (RFI) is a standard business process whose purpose is to collect written information for a purpose. This is also a request for secure, accurate, complete and timely information sharing pertaining to health. With data theft on the rise, many companies are forced to improve their network security. And although they spend millions of dollars every year on securing these networks, the focus has largely been on securing the access to the network rather than protecting the infor-mation itself
6.
Making a Data Request7 Requests for data must be made by filling a data request form, which may then be submitted electroni-cally or throughmanually through a formal request letter. The following information must be included for the data request:
1. Your contact information: name, business/organiza-tion name, mailing address, voice and fax telephone numbers, and e-mail address.2. Type of data needed.3. Scope and coverage of information needed.4. Brief description of the information needed5. Explanation of how the information will be used and a project or site name.6. The time frame of the data request to be submitted to you.7. If requesting another person’s personal or medical information, a signed release or court order authorizing such disclosure is required.
Note: currently there is no fee charged for data request by Ministry of Health Fiji only proper authorization is needed to get information8, however, this may change.
The purpose of the time frame for response9 The purpose of the time frame is for an effective and efficient response to the user. Data requests are processed in the order in which they are received. The response time is approximately one week from the date of approvable by the Permanent Secretary of Health, although large or complex data requests may take longer. Most responses are made electronically and are relayedas an e-mail attachment. In some situations the result may also be sent by fax depending on the size of the request.
What is Included10 Data request must include reliable information that is of optimal quality (specifying the exact type of data needed with disaggregation if applicable), accuracy and complete. All data requests should be well defined and with a focus on clarity of final use for the Health Infor-mation Unit (HIU) to effectively comprehendthe needs of the person or institution requesting the data.
Purpose of data request forms11 A request for information (RFI)is primarily used to gather information to assist in evidence based decision making. RFIs are therefore seldom the final stage and are instead often used in combination with the follow-ing: request for proposal12 (RFP), request for tender13 (RFT), and request for quotation14 (RFQ). In addition to gathering basic information, an RFI is often used as a solicitation sent to a broad base of potential stake-holders for the purpose of conditioning for developing strategy, building a database, and preparing for an RFP, RFT, or RFQ15 .
REVIEW
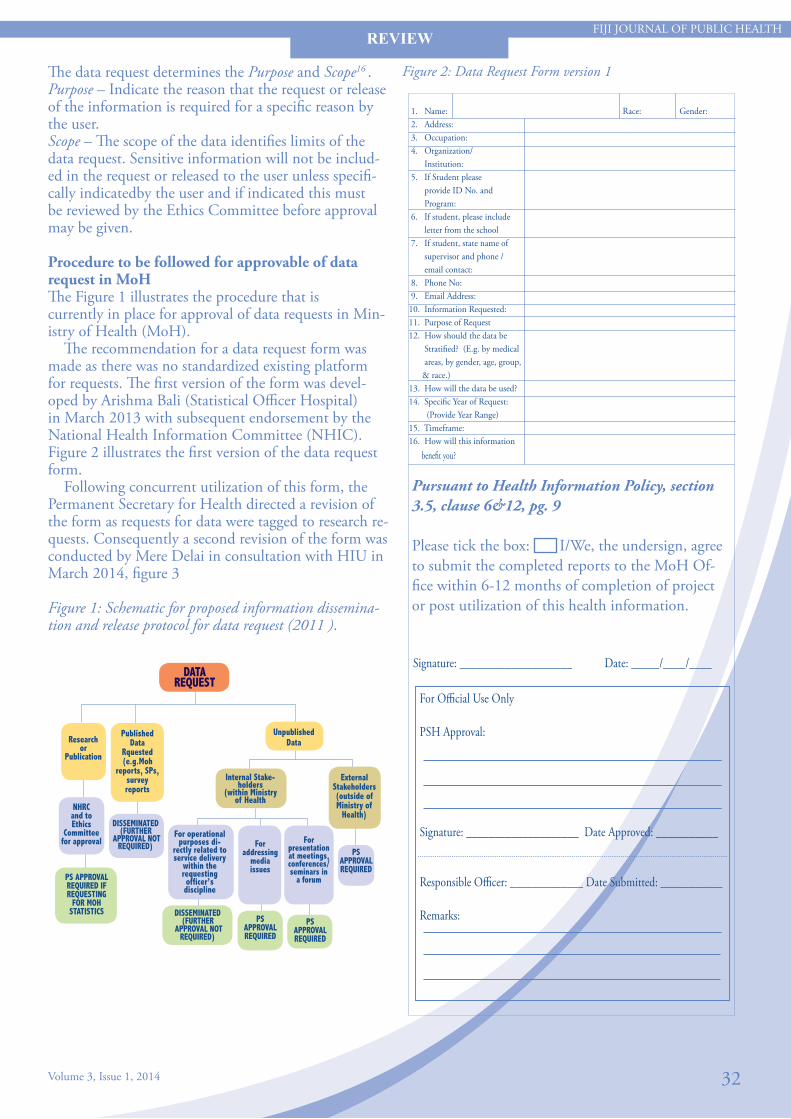
Figure 2: Data Request Form version 1
Pursuant to Health Information Policy, section 3.5, clause 6&12, pg. 9
Please tick the box: I/We, the undersign, agree to submit the completed reports to the MoH Of-fice within 6-12 months of completion of project or post utilization of this health information.
FIJI JOURNAL OF PUBLIC HEALTH
Volume 3, Issue 1, 2014 32
The data request determines the Purpose and Scope16 .Purpose – Indicate the reason that the request or release of the information is required for a specific reason by the user. Scope – The scope of the data identifies limits of the data request. Sensitive information will not be includ-ed in the request or released to the user unless specifi-cally indicatedby the user and if indicated this must be reviewed by the Ethics Committee before approval may be given.
Procedure to be followed for approvable of data request in MoHThe Figure 1 illustrates the procedure that is currently in place for approval of data requests in Min-istry of Health (MoH). The recommendation for a data request form was made as there was no standardized existing platform for requests. The first version of the form was devel-oped by Arishma Bali (Statistical Officer Hospital) in March 2013 with subsequent endorsement by the National Health Information Committee (NHIC). Figure 2 illustrates the first version of the data request form. Following concurrent utilization of this form, the Permanent Secretary for Health directed a revision of the form as requests for data were tagged to research re-quests. Consequently a second revision of the form was conducted by Mere Delai in consultation with HIU in March 2014, figure 3
Figure 1: Schematic for proposed information dissemina-tion and release protocol for data request (2011 ).
REVIEW
DATA REQUEST
Unpublished Data
Internal Stake-holders
(within Ministry of Health
Researchor
Publication
NHRCand toEthics
Committee for approval
Published Data
Rquested(e.g.Moh
reports, SPs, survey reports
ExternalStakeholders(outside ofMinistry of
Health)DISSEMINATED
(FURTHER APPROVAL NOT
REQUIRED)
PS APPROVAL REQUIRED IF REQUESTING
FOR MOH STATISTICS
PS APPROVAL REQUIRED
For operational purposes di-
rectly related to service delivery
within the requesting officer’s discipline
For addressing
media issues
For presentation at meetings, conferences/seminars in
a forum
DISSEMINATED(FURTHER
APPROVAL NOT REQUIRED)
PS APPROVAL REQUIRED
PS APPROVAL REQUIRED
Signature: ____________________ Date: _____/____/____
For Official Use Only
PSH Approval:
Signature: ____________________ Date Approved: ___________
Responsible Officer: _____________ Date Submitted: ___________
Remarks:
1. Name: Race: Gender: 2. Address: 3. Occupation: 4. Organization/ Institution: 5. If Student please provide ID No. and Program: 6. If student, please include letter from the school 7. If student, state name of supervisor and phone / email contact: 8. Phone No: 9. Email Address: 10. Information Requested:11. Purpose of Request 12. How should the data be Stratified? (E.g. by medical areas, by gender, age, group, & race.) 13. How will the data be used? 14. Specific Year of Request: (Provide Year Range) 15. Timeframe: 16. How will this information benefit you?

FIJI JOURNAL OF PUBLIC HEALTH
Volume 3, Issue 1, 2014 33
Figure 3: Data Request Form version 2
Request Number:(For Official Use Only)
REQUESTOR DETAILS
1. Name: 2. Race:(highlight or place a tick where 3. Gender: (highlight or place a tick where appropriate) appropriate) I-Taukei Fijian Other Male Female 4. Address: 5. Occupation: 6. Department/Organisation:
7. Type of Organisation: (highlight 8. If Student, please provide ID No. 9. Your Contacts: or place a tick where appropriate) and Program:
• Within MoH 8.1 ID:______________________ Email:________________ • Local govt 8.2 Program:__________________ • Hospital (Public) Phone #: ______________ • Hospital (Private) Supervisors Name & Contact: • Educational Name:_______________________ Fax #: __________________ • Private Organisation Phone #:_____________________ • Media Email:
REQUEST DETAILS10. Is this an update or extension 10.1 Previous Request 10.2 Previous Requestor:(Name
of a previous data request? No: of the person who requested the data)
Yes No (if yes, please provide request number/name)
11. Information Requested:
12. Purpose of Request:
13. How should the data be (e.g by medical areas, by gender, age, group, race, etc)
14. How will the data be used?
15. (Provide Year Range)
16. Timeframe
17. Who will use the information or who is the information for?
18. How will this information If yes please provide details below:
19. Does your request require an Ethics Approval from CHRERC/FNRERC?
20. Will this data be published? If yes, please provide below information about where the publishing will occur?
REVIEW

FIJI JOURNAL OF PUBLIC HEALTH
Volume 3, Issue 1, 2014 34
Pursuant to Health Information Policy 2011, section 3.5, clauses 6 & 12, pg 9
Please tick the box yes I agree.
I We the undersign, agree to submit the completed reports to the MoH Office within
6-12 months of completion of project or post utilization of this health information.
Signature: ____________________ Date: ________________ For Official Use Only
1.0 Data Assessment & Verification1.1 Snr Statistician Comments/Recommendations: (on availability& accessibility of data)___________________________________________________________________________________________________________________Signature_______________________ Date:___________________
1.2 Health Research Officer Comments/Recommendations:(if re-quested data is for research purposes)________________________________________________________________________________________________________________________Signature_______________________ Date:___________________
1.3 Director Epidemiologist Recommendations :( for data quality assessment)________________________________________________________________________________________________________________________Signature_______________________ Date:___________________
2.0 ApprovalPSH Final Decision:Approved Not Approved
________________________________________________________________________________________________________________________Signature_______________________ Date:___________________
3.0 Data Submission(For Health Information Unit Use Only After Approval)
Data Collated by:(Name & Initial) ____________________ Date: ______________Verified by: (Name & Initial) _________________________ Date: ______________ Submitted by: (Name & Initial) _____________________ Date: ______________
Remarks:_________________________________________________________________________________________________________________________________________________________________________________
CONCLUSIONThe data request form will be reviewed on an annual basis with subsequent revisions documented, endorsed by respective com-mittees and circulated, after appropriate awareness and training on the forms.
ACKNOWLEDGEMENT Health Information Unit of the Ministry of Health Republic of Fiji Stakeholders – both internal and external who continue to request for health information for evidence based decision mak-ing, research, policy and planning.
REFERENCES1. Health Information System definition: http://www.ehow.com/ list_6860442_types-health-information-systems.html#page=02. Fiji Ministry of Health-Health Information Policy 2011. Pg 1.3. The freedom of information act: http://www.idph.state.il. us/about/foia_10.htm4. Data definition: http://dictionary.reference.com/browse/data5. Request definition: http://dictionary.reference.com/browse/ request6. Information request definition: http://www.technologyevalu ation.com/search/for/Information-Request-Definition.html7. Making a data request: http://www.utsa.edu/ir/DataRequest. html8. MoH policy on Data request.MoH Assistant. Statistical officer , HIU.9. HIU team view on data request response and website search on making a data request: http://www.utsa.edu/ir/DataRe quest.html10. What to include in data request: http://www.ncddr.org/kt/ products/focus/focus9/11. Purpose of the data request form: https://secure1.info.gov. hk/ssl-cgi/police/epol-forms/DataAccessRequest_v2.2.cgi12. Request for proposal. Wikipedia site: http://en.wikipedia. org/wiki/Request_for_proposal13. Request for tender. Wikipedia site: http://en.wikipedia.org/ wiki/Request_for_tender14. Request for quotation. Wikipedia site: http://en.wikipedia. org/wiki/Request_for_quotation15. Request for information (RFI).Purpose of data request. Wikipedia site: http://en.wikipedia.org/wiki/Request_for_ information16. Purpose and scope: http://www.hmsa.com/customerservice/ forms/hipaa/requestreleasememberinformation.aspx17. Fiji Ministry of Health-Health Information Policy 2011. Pg 35.
REVIEW

FIJI JOURNAL OF PUBLIC HEALTH
Volume 3, Issue 1, 2014 35
INTRODUCTIONThe mission, vision and objectives of the current Health Information Policy 2011 [HIP 2011] relate to the Ministry of Health’s aim to integrate and harness health data in quality dimensions for improving the healthcare status of individuals, communities and the country as whole1 . Health information gathered is essential in facilitating evidence based decision making, planning, policy formulation, research and tracking performance towards attainment of its human development targets such as the Millennium Development Goals [MDGs]2 and the United Nations Human Development Index [HDI]. The whole purpose of MDG’s is to improve population status. The following illustrate the aims of the MDGs: 1. Eradicate poverty and hunger 2. Achieve universal primary education 3. Promote gender equality 4. Reduce child mortality rate (mortality rate is the rate of death in a certain area or place) 5. Improve maternal health (maternal is relating to a mother) 6. Combat HIV/AIDS, malaria, and many other diseases 7. Ensure environmental sustainability 8. Ensure global partnerships for development
RATIONALECurrently, the Republic of Fiji has minimal legislation protecting individual level information. Particularly, in health care settings, where individual or client privacy
may be subject to multiple health practitioners and health service administrators having access to this level of information. Consequently, there must be robust legislation and policies in place to protect individual client information being made available for public consumption.
AIMS AND OBJECTIVES To identify the purpose of an act, law and policy in the protection of the flow of health information. To identify countries internationally and regionally that has existing data protection and data privacy legislation in place. For those countries that have existing legislation document the year the data protection legislation was enacted and implemented and compare the degree of protection offered under the various legislations.
METHOD
Literature Review on International Procedures for Data Protection and Confidentiality
Shankar S1,Nand D1*
ABSTRACTOne of the most challenging issues faced in the world of information systems is the lack of protection and confidentiality of personal information or personal records. There is an abject lack of information on data privacyin the Republic of Fiji and this includes legislation to protect confidentiality and privacy. Personal information collected in the health arena is used typically, to collate information for decision making, strategic planning, evidence based policy and other monitoring and evaluation purposes. This information may be subject to breaches of personal privacy through increasing advances in technology, networking, sharing of information among governmental institutions; other international and development agencies (current policy) in the Republic of Fiji. It is therefore only natural to explore means of protecting the individual‘s privacy when accessing healthcare.
1. Health Information Unit, Ministry of Health* Address of Correspondence: [email protected]
REVIEW

FIJI JOURNAL OF PUBLIC HEALTH
Volume 3, Issue 1, 2014 36
The sites that were used in the collection and reviewing of various types of information on health related data protection included: Google, Yahoo, Govnet, Wikipedia,PubMed, British Medical Journal, Booklets, reports, articles and journals. All reviewed sites are referenced in this report. The review looks at the three important key points that are; Country and Year the Data protection act was implemented, Purpose of the act, law and policy put in place and Importance’s of the act, law and policy put in place.
RESULTSKey Definitions“Data” (noun) is factual information that is measurable or statistics that can be used as a basis for reasoning, discussion, or calculation and the data is plentiful and easily available according to H. A. Gleason. Data can also be regarded as information output by a sensing device or organ that includes both useful and irrelevant or redundant information and must be processed to be meaningful and can be information in numerical form that can be digitally transmitted or processed . “Protection” (noun) is defined as the act of protecting such as the state of being protected or to protect something that is of great importance. In reference to health information, protection is afforded to keep data safe andsecure. In order to progress this security various countries and institutions have levels of authorization and clearance to access sensitive health information. “Confidentiality” an adjective that’s defined as spoken, written, acted on, in strict privacy, secrecy, in secret and/ or can be regarded as a confidential remark that indicates confidence, sensitivity or intimacy, or imparting private matters in a confidential tone of voice. It also can be stated as having another’s trust or confidence or being entrusted with secrets or private affairs such as a confidential secretary. Confidentiality can be classified at different levels and has connotations of limitations and levels of authorization to use infor-mation, documents, that are sensitive or classified in this category. Information privacy or data privacy is the relation-ship between collection and dissemination of infor-mation, the public expectation of privacy, the legal and political issues surrounding information use and dissemination within the channel or medium of in-country technology.
Rationale for Law Privacy concerns exist wherever personally identifiable information is collected, disseminated and stored in database format connected to a network system or kept in storage as paperbase records. Improper or non-existent disclosure of confidentiality information
can be the root cause for privacy issues. Data privacy issues can arise in response to information from a wide range of sources, such as the health care records, criminal records, financial records, patient’s biological records and geographic records. The challenge in data privacy is to share data while protecting personally identifiable information. The Purpose of the act, law and policy put in place on data protection is to keep information safe, secure and confidential in order to protect the rights of indi-viduals in reference to personal information and limits the level of access to this identifiable information. In addition, the decree or act on data protection, privacy and confidentiality clearly identifiesthe legal bounda-ries which the individuals and institutions must adhere to, validates the importance of health information and the need for securing individual identifiable informa-tion and specifically determines the enforcement [who enforces, roles and responsibilities, breaches]. This then affords the individual, institutions and the coun-try with boundaries in which to ensure data protec-tion, data privacy and confidentiality.
International Data Protection LegislationsInternational data Privacy
Country The act Year of enactment detail Argentina Personal Data Protection Act (aka Habeas Data) 2000 Austria Data Protection Act, Austrian Federal Law
Gazette part I No. 165 1st publish in 1999 than revised and republish on 2000
Australia Privacy Act 1988 Belgium Belgium Data Protection Law and Belgian Data
Privacy Commission Privacy Blog 1988
Brazil: Privacy currently governed by Article 5 of the 1988 UK Constitution
1988
Bulgaria The Bulgarian Personal Data Protection Act.
Was adopted on December 21, 2001 and entered into force on January 1, 2002. More information at the Bulgarian Data Protection Authority
Canada The Privacy Act on Personal Information Protection and Electronic Data Act (PIPEDA) (Bill C-‐6)
1st publish in July 1983 than revised and republish on 2000
Chile Act on the Protection of Personal Data. August 1998 Colombia 1. Two laws affecting data privacy - Law 1266
2. Law 1273 on the constitution provides any person the right to update their personal information
1. 2008 (in Spanish) 2. 2009 (in Spanish)
Czech Republic Act on Protection of Personal Data No. 101 April 2000 Denmark Act on Processing of Personal Data, Act No. 429. May 2000 Estonia Personal Data Protection Act June 1996, Consolidated July 2002.
Adopted 2003 European Union 1. European Union Data Protection
2. EU Internet Privacy Law 1. 1998 2. 2002 Both Documents are Directives
Finland Act on the Amendment of the Personal Data Act (#986)
2000
France Data Protection Act 1978 (revised in 2004) Germany Federal Data Protection Act of 2001 2001 Greece Law No.2472 on the Protection of Individuals
with Regard to the Processing of Personal Data. April,1997
Greece Law No.2472 on the Protection of Individuals with Regard to the Processing of Personal Data.
April,1997
Guernsey Data Protection (Bailiwick of Guernsey) Law. 2001 Hong Kong Personal Data Ordinance (The "Ordinance") 1st Publish in 1995, revised in 2010, 2nd Publication in
2012 amendment done in 2013 Hungary Act LXIII on the Protection of Personal Data and
the Publicity of Data of Public Interests 1992(excerpts in English)
Iceland Act of Protection of Individual; Processing Personal Data
Jan 2000
Ireland Data Protection (Amendment) Act, Number 6 2003 India Information Technology Act 2000 Italy:Italy: 1. Data Protection Code
2. Processing of Personal Data Act I. 2003 II. Jan 1997
Japan:
1. Personal Information Protection Law (Act) 2. Law for the Protection of Computer
Processed Data Held by Administrative Organs.
• (Official English Translation) Law Summary from Jonesday Publishing
• Dec 1988
Korea
Act on Personal Information Protection of Public Agencies Act on Information and Communication Network Usage
2005
Latvia Personal Data Protection Law. 23rd March 2000 Lithuania Law on Legal Protection of Personal Data June 1996 Luxembourg Law on Protection of Persons with Regard to the
Processing of Personal Data 2nd August 2002
Malaysia Common Law principle of confidentiality Personal data Protection Bill
(Not finalized) Supported by Banking and Financial Institutions Act of 1989 privacy provisions. Related to the UK data protection Law.
Malta Data Protection Act (Act XXVI of 2001), Amended March 22, 2002,
REVIEW

37
FIJI JOURNAL OF PUBLIC HEALTH
Volume 3, Issue 1, 2014
Discussion The Data Protection Act was first established in 1988 for countries within the European Union and the United Kingdom in relation to personal data that included the disclosure of information extracted from different data sources, transfer of such statistics and information gathered and distribution of analyzed and interpreted data to different stakeholders.The Data Protection Act of 1998 was implemented on March 1st, 2000, with most of its provisions being effective from 24th October 2001. It replaced and broadened the Data Protection Act of 1984. The purpose of the Act was to protect the rights and privacy of individuals, and to ensure that personal data were not processed without their knowledge and processed with individual consent wherever possible. The Act covers personal data relating to living indi-viduals, and defines a category of sensitive personal data that are subject to more stringent conditions in processing than other personal data. The Data Protection Act covers data held in electronic formats, and also applies to manual data. While this might appear to limit the categories of non-electronic data to which the Act applies, the definitions of personal data in the Data Protection Act have been broadened by the Freedom of Information Act 2000 in respect of public authorities . The Data Protection Act, 1988 defines United Kingdom’s law on the processing of data on identifiable living people. It is the main piece of legislation that governs the protection of personal data in the United Kingdom (UK, 2000). The definition of personal data is data which relates to a living individ-ual, it can be sensitive personal data that concerns the subject’s race, ethnicity, politics, religion, trade union status, health, sex life or criminal record Although the Act itself does not mention privacy, it was enacted to bring United Kingdom’s law into line with the Euro-pean Union data protection directive of 1995 which required member states to protect people’s fundamen-tal rights and freedoms and in particular their right to privacy with respect to the processing of personal data. In practice it provides a way for individuals to control information about themselves. Anyone holding personal data for other purposes is legally obliged to comply with this Act, subject to some exemptions .
Local Data Privacy Documents Fiji Act/Policy Year of Enactment Fiji Official Secrets Act [1911] (1 & 2 Geo. 5 c. 28) MoH Medical Records Policy [MRP] 1985 MoH Health Information Policy[HIP] 2011
The Act defines eight data protection principles of good practice. These principles are:1. Fairly and lawfully processed; 2. Processed for limited purposes and not in any manner incompatible with those purposes; 3. Adequate, relevant and not excessive; 4. Accurate and where necessary, up to date; 5. Not kept for longer than is necessary; 6. Processed in line with the data subject’s rights; 7. Security; and 8. Personal information shall not be transferred to countries outside the European Economic Area without adequate protection .
These data protection principles are maintained to protect against the misuse of sensitive information. Most countries put in place acts and policies to safeguard and protect vital and personal information . Alternatively,the United States of America [USA] Data Protection Law, has a ‘Sectoral’ approach to data protection. This relies on a combination of legislation, regulation and self-regulation, rather than governmental regulation alone. As recommended by the former U.S.A President Bill Clinton and former Vice-President Al Gore explicitly in their “Framework for Global Electronic Commerce” that the private sector should lead, and companies should implement self-regulation in reaction to issues brought on by internet technology. To date, the USA has no single data protection law comparable to the EU’s Data Protection Directive. Privacy legislation in the United States tends to be adopted on an adhoc basis, with legislation arising when certain sectors and circumstances require.13
Australia, on the other hand, has a very short history of data protection legislation. The data protection laws that existed prior to 1988 were merely incidental provisions in other acts. In 1988, the Privacy Act was passed. The Privacy Act contains eleven Information Privacy Principles that apply to Commonwealth and governmental agencies .
These Principles are : Principle 1 - Manner and purpose of collection of personal information;Principle 2 - Solicitation of personal information from individual concerned;Principle 3 - Solicitation of personal information generally;Principle 4 - Storage and security of personal information;Principle 5 - Information relating to records kept by record-keeper;Principle 6 - Access to records containing personal information;
REVIEW

38
FIJI JOURNAL OF PUBLIC HEALTH
Volume 3, Issue 1 2014
Principle 7 - Alteration of records containing personal information;Principle 8 - Record-keeper to check accuracy of personal information before use;Principle 9 - Personal information to be used only for relevant purposes;Principle 10 - Limits on use of personal information; andPrinciple 11 - Limits on disclosure of personal information.
Following this the Privacy Amendment (Private Sector) Act 2000 came into force on 21st December 2001, and added ten National Privacy Principles that applied to the private sector and all health service providers. These National Privacy Principles are:Principle 1 - Collection; Principle 2 - Use and disclosure; Principle 3 - Data quality; Principle 4 - Data security; Principle 5 - Openness; Principle 6 - Access and correction; Principle 7 - Identifiers; Principle 8 - Anonymity; Principle 9 - Transborder data flows; and Principle 10 - Sensitive information. These are found in Schedule 3 of the amended Privacy Act.15
The Australian privacy laws are contained in a variety of Commonwealth, State and Territory Acts. The “Pri-vacy Acts” are data protection laws which regulate the collection, use and disclosure of personal information about individuals; they do not protect privacy of the individual in a broader sense. Internet and other telecommunications services, ISPs and telephone service providers are also required to comply with the privacy protection provisions of the Telecommunications Act 1997 and the Telecom-munications (Interception) Act 1979 . A variety of other legislation contains privacy protection provisions relevant to particular types of entities and/or practices, for example, the Spam Act, Surveillance and Listening Devices Acts, and many others . New Zealand has its own Privacy Act of 1993 for personal information. The Privacy Act of New Zealand is similar to the European Privacy Act on data protection, as it is the only omnibus national law outside Europe covering both the public and private sectors. It is therefore something of a paradox that the New Zealand Privacy Act may be judged “inadequate” as a data protection measure in the eyes of the Euro-pean Union. The overview of the New Zealand Privacy Act highlights that New Zealand is no newcomer to data protection. Although it is a small nation depend-ent on international trade, New Zealand did not pass the 1993 Act as a rushed or superficial response to the prospect of the EU Directive on Data Protection.20
The Privacy Act 1993 built upon many years experi-ence of statutory data protection and following con-siderable study and consultation. Indeed, the New Zealand Government, in its Privacy Commissioner Bill 1975, was one of the first in the world to propose establishing a Privacy Commissioner by law. This was a milestone for New Zealand as a Nation.21
Most countries have implemented data protection legislation according to in-country needs.
Official Secret ActThe Official Secrets Act 1911 (1 & 2 Geo. 5 c. 28) is an Act of the Parliament of the United Kingdom. It replaces the Official Secrets Act 1889. The Act applies in the United Kingdom, the Isle of Man, the Channel Islands, and in overseas crown territories and colonies. It also applies to British subjects anywhere else in the world. The Republic of Fiji has its own Official Secrets Act 1911[Arrangement of Sections # 2 on Wrongful Communication, &c. of information22. The Act comes under Her Majesty, the Queen of England. The Act protects the information and belongings of Her Majesty, the Queen of England. Since, we are no longer under Her Majesty the Queen of England, the Republic of Fiji should consider enacting legislation on protection and privacy which may address the issue of personal information collection, disclosure and dis-semination.
Medical Record Policy – FijiThe terms medical record, health record, and medical chart are used somewhat interchangeably to describe the systematic documentation of a single patient’s medical history and care across time within one par-ticular health care provider’s jurisdiction23. The medi-cal record includes a variety of information that is entered over time by health care professionals such as recorded observations and administration of drugs and therapies, orders for the administration of drugs and therapies, test results, x-rays, reports, etc. According to the Medical Records Policy [1985], the maintenance of complete and accurate medical records is a requirement from all health care providers because many considerthe information in medical records to be sensitive per-sonal information covered by expectations of privacy, many ethical and legal issues are implicated in their maintenance, such as third-party access and appropri-ate storage and disposal. Although the storage equip-ment for medical records generally is the property ofthe health care provider, the actual record is considered to be the property of the patient, who may obtain cop-ies upon request as stated in the Medical Record Policy.
REVIEW

39
FIJI JOURNAL OF PUBLIC HEALTH
Volume 3, Issue 1, 2014
“The Fiji Government Information Technology Poli-cies and Principles “state that there is a need for the medical record policy to include accessibility and confidentiality concerning online information systems. The levels of accessibility and authorization need to be considered in the review of this policy. The Medi-cal Records Policy also needs to be embedded in the Health Information Policy to ensure that one policy comprehensively addresses health information protec-tion and privacy.
CONCLUSIONThere are 8 data protection principles:24
1. Personal data shall be processed fairly and lawfully and, in particular, shall not be processed unless; (a) at least one of the conditions in Schedule 2 is met, and(b) in the case of sensitive personal data, at least one of the conditions in Schedule 3 is also met.2. Personal data shall be obtained only for one or more specified and lawful purposes, and shall not be further processed in any manner incompatible with that purpose or those purposes.3. Personal data shall be adequate, relevant and not excessive in relation to the purpose or purposes for which they are processed.4. Personal data shall be accurate and, where necessary, kept up to date.5. Personal data processed for any purpose or purposes shall not be kept for longer than is necessary for that purpose or those purposes.6. Personal data shall be processed in accordance with the rights of data subjects under this Act.7. Appropriate technical and organizational measures shall be taken against unauthorized or unlawful processing of personal data and against accidental loss or destruction of, or damage to, personal data.8. Personal data shall not be transferred to a country or territory outside the European Economic Area unless that country or territory ensures an adequate level of protection for the rights and freedoms of data subjects in relation to the processing of personal data.
Code of Ethics for Medical Coding In many Countries, Medical coding is done for the transformation of narrative descriptions of diseases, injuries, and healthcare procedures into numeric or alphanumeric designations (that is, code numbers). The code numbers are detailed in order to accurately describe the diagnoses (that is, what is wrong with the patient) and the procedures performed to test or cor-rect these diagnoses. Because medicine is not always an exact science, codes were developed to identify all reasons for seeking healthcare.
Coding health-related data permits access to health records according to diagnoses and procedures for use in clinical care, research, and education. Common uses of medical codes in healthcare include: identifying symptoms that must be evaluated and to alert other healthcare professionals to life-threatening allergies; reporting services performed for reimbursement; helping with administrative functions such as staff-ing, scheduling, and adding or decreasing healthcare services; and comparing facilities and planning for new services in underserved areas. Medical Billing and Coding is an ethical Concern for any country as it is handled by Medical billers and coders who work with highly sensitive personal and financial information that makes it imperative for them to maintain the highest level of ethical standards. A Code of Ethics must be developed to ensure thatthe medical industry adheres to strict guidelines and ethical safeguards for the protection of patients and medical workers. The field of medical coding falls under the same ethical guidelines as any other part of the medical industry:26
• Impartiality27 /Objectivity28
Conflicts of interest should be minimized or absent when dealing with medical billing. Medical billers and coders must adhere to a set of procedures and should not show a preference toward any patient or insurance company.• Confidentiality29 Medical personnel must keep medical information private and not discuss a patient’s medical history to third parties. The only parties that should have any knowledge of the patient’s health is the patient’s health insurance company.• Medical Records Integrity30 Patient’s have the right to see their medical records and contest medical bills. The medical billing and coding specialist must comply with a patient’s request to view records.• Patient’s Rights31 A medical coding and billing specialist, like all medical personnel, must uphold the rights of the patient above all else. Everything that can be done to help the patient must be implemented, while anything that may harm the patient must be avoided.• Professional Integrity32
Medical coders and billing specialists must faithfully report all medical codes to health insurance companies. Medical and coding professionals must put their full effort into completing each medical reimbursement that they process.All data protection guidelines, policies and legislation must adhere to international codes of practice and encompass the country needs for privacy.
REVIEW

40
FIJI JOURNAL OF PUBLIC HEALTH
Volume 3, Issue 1, 2014
REFERENCES1. Health Information Policy - 2011.Ministry of Health, Fiji.2. MDGs: http://library.thinkquest.org/06aug/00400/id9.htm3. Data definition: http://www.merriam-webster.com/diction ary/data4. Protection definition: http://www.merriam-webster.com/ dictionary/protection5. Confidentiality definition: http://dictionary.reference.com/ browse/confidentiality6. Data privacy: http://en.wikipedia.org/wiki/Information_ privacy7. Data protection act 1988: http://www.irishstatutebook. ie/1988/en/act/pub/0025/8. Data protection act 1998 background: http://www.soas. ac.uk/infocomp/dpa/policy/overview/9. Booth, S., Jenkins, R. Moxon, D., Semmens, N., Spencer, C., Taylor, M. Townend, D. (2004). What are ‘Personal Data’?. A study conducted for the UK Information Commissioner. The University of Sheffield. Readings pgs. 72-89.10.UK Data protection act 1998. Wikipedia site: http:// en.wikipedia.org/wiki/Data_Protection_Act_199811.Eight data protection principles: http://dataprotectionact. org/1.html12. Bygrave, A. (2010). “Privacy & data protection in an international perspective”.Stockholm Insitute for Scandinavian Law.Readings. www.scandinavianlaw.se/. 13.PRIVIREAL_Privacy in Research Ethics & Law. Australia- Data Protection.(2005). “History of Data Protection in Australia”. Article http://www.privireal.org/ content/dp/australia.php14.Information Sheet (Public Sector) 1 - Information Privacy Principles under the Privacy Act 1988. Australian Govnet site: http://www.privacy.gov.au/materials/types/infos heets/view/654115.Telecommunications Act 1997(C’th):http://www.austlii. edu.au/au/legis/cth/consol_act/ta1997214/16.Telecommunications (Interception) Act 1979 (C’th): http:// www.austlii.edu.au/au/legis/cth/consol_act/taaa1979410/
17. Data Protection Laws/ Privacy Acts: http://wwwefa.org.au/Issues/Pri vacy/privacy.html18. You can view the full Privacy Act 1993 on http://www.legislation.govt. nz/act/public/1993/0028/latest/DLM296639.html/19. Speech by Blair Stewart, Assistant Privacy Commissioner, 12th Privacy Laws and Business Annual International Conference, “New Data Protection Law, Issues, Solutions, Action”, Cambridge, U.K, 29 June 1999. Address Site: http://privacy.org.nz/adequacy-of-data- protection-measures-the-new-zealand-case/20. The full title of the directive, hereafter referred to simply as “the EU Directive”, is Directive 95/46/EC of the European Parliament and of the Council on the Protection of Individuals with Regard to the Processing of Personal Data and on the Free Movement of Such Data, 24 October 199521. Adequacy of data protection measures in New Zealand: http://privacy. org.nz/adequacy-of-data-protection-measures-the-new-zealand-case/22. Official Secrets Act (1911): http://en.wikipedia.org/wiki/Official_ Secrets_Act_191123. Medical Record definition: http://en.wikipedia.org/wiki/Medical_ record24. 8 data protection principles for personal data.http://www.ico.gov.uk/ for_organisations/data_protection/the_guide/the_principles.aspx25. AHIMA_Medical Coding: http://www.ahima.org/coding/26. Code of Ethics for Medical Coding/Billing Specialists and more reading articles see: http://www.ehow.com/facts_6770974_code- ethics-medical-coding_billing-specialists.html27. Impartiality definition- unbiased, unprejudiced, equitable or fair:http://dictionary.reference.com/browse/impartiality28. Objective definition- something that one’s efforts or actions are intended to attain or accomplish; purpose; goal; target:http://dictionary. reference.com/browse/Objectivity29. Confidentiality definition - spoken, written, acted on, etc., in strict privacy or secrecy;secret:http://dictionary.reference.com/browse/ confidence30. Medical Records Integrity.Managing the Integrity of Patient Identity in Health Information Exchange, see http://library. ahma.org/xpedio/groups/public/documents/ahima/bok1_044000. hcsp?dDocName=bok1_04400031. Patient’s Rights; see for more information on;http://ask.healthline. com/galecontent/patient-rights-132. Professional Integrity Definition; http://www.northgeorgia.edu/ 2011-12%20Graduate%20Catalog/3948.htm
REVIEW

Equity in services for non-communicable diseases: How can Fiji’s health systems respond better?
Waqa G1, Snowdon W1 2, Raj A1
Non-communicable diseases [NCD] including cardio-vascular disease, diabetes, cancers, chronic respiratory diseases and diabetes have been reported as the most common cause of death and disability globally1 and most NCD deaths now occur in low- and middle-income countries. The World Health Organisation (WHO) has projected that NCDs will be responsible for a significantly increased total number of deaths in the next decade 2, and the economic costs imposed by NCDs in low- and middle income countries alone is projected to reach USD21 trillion by 2030 3. In tackling the growing NCD epidemics in low-resource settings, the WHO Global status report on non com-municable diseases 2010 4indicated that the social determinants of health largely explain inequalities in health outcome and particularly for NCDs5. People of lower socioeconomic status in poorer countries are more vulnerable and socially disadvantaged as a result of NCDs when compared with higher socioeconomic status in high income countries; as in the latter, most health-care costs are paid by patients out-of-pocket that create significant strain on household budgets, particularly for lower-income families 4. Equity in healthcare requires that health inequalities are targeted and people are treated fairly according to need. Equity in health can be defined as the absence of systematic disparities in health (or in the major social determinants of health) between social groups who have different levels of underlying social advantage/disadvantage 6. The notion of equal opportunities to be healthy is fundamental to the concept of equity in health and closely linked with the concept of equal rights to health. Inequalities have been found to ex-ist globally in financial and physical access to health care, and health-care use and the quality of health care provided 8, leading to inequalities in NCD screening, diagnosis, and treatment. People in low-income coun-tries and those with low socioeconomic status have lessaccess to health care for timely diagnosis and treatment of NCDs than do those in high-income countries or those with higher socioeconomic status8. Low access to treatment leads to poor prognosis and survival in patients with NCDs in low and middle income coun-tries 9.
Leprosy) of permanent and long-term disability in the world (Wynd, Melrose, Durrheim, Carron, & Gyapong, 2007). In 2011 the Nossal Institute for Global Health developed a framework (referred to as Robinson & Hort framework)10 to assist low-and middle-income countries with assessing their health systems’ readiness to respond to NCDs. The Pacific Research Centre for the Prevention of Obesity and Non-communicable diseases (C-POND) under the College of Medicine Nursing and Health Sciences and Deakin University were invited to assess health system responses to NCDs in Fiji using the Robinson & Hort framework. Data collection included desk-top study, consultation with selected individuals, and literature search. This analy-sis/report looked more carefully at the issue of equity, and found issues. Overall, progress for equity in health services for NCDs was found to be very limited. No evidence was found of specific actions to ensure equity of health services or financial support structures for low income households to assist with healthcare costs. While ser-vices are free, there is no subsidy or support for travel costs 11, which can be burdensome given the remote-ness of many communities. Out of pocket expenses as a percent of health care costs have been found to be increasing11 according to a recent study. While parts of the population suffer more from some of the NCDs than others12, there has been insufficient attention paid to disaggregation of data by income and it is there-fore unknown if income is related to risk of NCDs, as has been found elsewhere. Given the requirement for transport and medicine costs, it is highly likely that those with NCDs would experience financial stress and hardship. Although equity and universal access is a key commitment of the current government13 and Min-istry of Health, there was little evidence of actions to tackle inequity within health service provision. Given the significant problem of poverty in Fiji 14-16, this area deserves more attention.
FIJI JOURNAL OF PUBLIC HEALTH
Volume 3, Issue 1, 2014
PERSPECTIVE
41
1. Pacific Research Centre for the Prevention of Obesity and Non-Communicable diseases (C-POND)2. WHO Collaborating Centre for Obesity Prevention, Deakin University, Melbourne, Victoria, Australia.• Address for Correspondence: [email protected]
Keywords: Equity, Non-Communicable Disease

Insufficient data may be hampering ability to act on inequity in NCDs. While surveillance and data gathering is increasing for NCDs, there has been relatively little analysis of data by income or location, although data on these variables is routinely col-lected. The disaggregation of data collected on NCDs is essential to ensure that Ministry of Health has the evidence needed to inform targeting of activities, and this can be supported by its development partners. The ability to access evidence on the extent of inequity and the factors underlying, it will be critical to allow the targeting of interventions to high-risk groups and the social determinants of health. Strategies are needed in the health sector that can reduce inequity. Access to specialist health services and care for chronic diseases is not equitable across the country, with rural areas heavily disadvantaged. In ad-dition, services for the aged, mentally ill and disabled people are not yet widely available across the country. While efforts by the Ministry of Health to extend the reach and accessibility of specialist services for NCDs are showing benefits, it is clear that access is still a problem and that additional effort and activities will be needed.
REFERENCES1. Alwan A, Maclean DR, Riley LM, d’Espaignet ET, Mathers CD, Stevens GA, Bettcher D: Monitoring and surveillance of chronic noncommunicable diseases: progress and capacity in high-burden countries. The Lancet 2010, 376:1861-1868.2. WHO: The global burden of disease: 2004 update Geneva: World Health Organization; 2008.3. World Economic Forum and Harvard School of Public Health: The Global Economic Burden of Non-communicable Disease. September 2011.4. World Health Organization: Global status report on non-communicable diseases. Edited by Organization WH. Geneva; 2011.5. Frohlich KL: The social determinants of what?Int J Public Health 2010, 55:235-236.6. Braveman P, Gruskin S: Defining equity in health J Epidemiol Community Health 2003, 57(4):254-258.
FIJI JOURNAL OF PUBLIC HEALTH
Volume 3, Issue 1, 2014
PERSPECTIVE
42
7. Hosseinpoor AR, Bergen N, Kunst A, Harper S, Guthold R, Rekve D, d’Espaignet ET, Naidoo N, Chatterji S: Socioeconomic inequalities in risk factors for non communicable diseases in low-income and middle-income countries: results from the World Health Survey. BMC Public Health 2012 12:912 8. Di Cesare M, Khang Y, Asaria P, Blakely T, Cowan MJ, Farzadfar F, Guerrero R, Ikeda N, Kyobutungi C, Msyamboza KP et al: Non-Communicable Diseases 3. Inequalities in non-communicable diseases and effective responses. Lancet 2013, 381:585-597.9. Yusuf S, Islam S, Chow CK, Rangarajan S, Dagenais G, Diaz R, Gupta R, Kelishadi R, Iqbal R, Avezum A et al: Use of secondary prevention drugs for cardiovascular disease in the community in high-income, middle-income, and low-income countries (the PURE Study): a prospective epidemio logical survey Lancet 2011, 378:1231-1243.10. Robinson H, Hort K: Non-communicable diseases and health systems reform in low- and middle-income countries, in Working paper Series, Health Policy and Health Finance Hub, Editor. 2011, Melbourne University: Melbourne.11. Roberts G, Irava W, Tuiketei T, Nadakuitavuki R, Otealagi S, Singh S, Pellny M, Fong M, MoHammed J, Chang O: The Fiji Islands Health System Review. Health Systems in Transition 2011, 1(1).12. Cornelius M, et al: Fiji Non-Communicable Diseases (NCD) Steps Survey. Suva: Minstry of health 2002.13. Government of Fiji: Roadmap for democracy and sustainable socio-economic development Edited by Ministry of Planning. Suva 2009.14. Bureau of Statistics: Key Statistics. Suva: Burea of Statistics; 2010.15. Narsey W: Report on the 2002-03 Household Income and Expenditure Survey. Suva: Fiji Islands Bureau of Statistics; 2006.16. Narsey W: Report on the 2004-2005 Employment and Unemployment Survey. Suva: Fiji Islands Bureau of Statistics; 2007.

FIJI JOURNAL OF PUBLIC HEALTH
Volume 3, Issue 1, 2014
PERSPECTIVE
43
INTRODUCTIONPathology laboratory services in Fiji were established more than six decades ago. The very first laboratory was established in the Colonial War Memorial (CWM) hospital; later on Lautoka and Labasa hospital labo-ratories were set up, with further expansion of the laboratory network to sub-divisions over the years. In 1946, Assistant Laboratory Technicians Program was established in the Fiji School of Medicine, which was later renamed Medical Laboratory Technology Program. Pathologist service was provided by expatri-ate pathologists and based at CWM hospital until 1970s when local Medical officers were trained in New Zealand and returned to take up posts in CWM and Lautoka hospitals. Local pathologist training at the Fiji National University has been recently established in 2012. Fiji Pathology Laboratory Services have a three-tier structure, with the National Reference Laboratory located at CWM hospital (this laboratory also covers the Central/Eastern division), two divisional labora-tories for the Western and Northern divisions located at the Lautoka and Labasa hospitals, respectively, and 15 sub-divisional hospital laboratories. The system also includes two specialized laboratories: Fiji Center for Communicable Disease Control Laboratory (aka Mataika House) and Daulako Mycobacterium Refer-ence Laboratory. There are 147 sample collection cent-ers: 56 of them in the Central/Eastern division, 51 in the Western, and 40 in the Northern divisions. Fiji Pathology Laboratory Services come under direct supervision of the Deputy Secretary for Hospital Services. Overall administrative management is imple-mented by the National Manager for Laboratory Services and divisional laboratory superintendents, while responsibility for clinical and technical manage-ment lies with the Consultant Pathologist and supervi-sory technical officers. The laboratory network of Fiji has an estimated an-nual budget of FJD 4 million and currently employs 137 staff. Every year, an estimated 940,000 patients are served and about 4,000,000 tests conducted.
Need for changeThe weaknesses of laboratory services in Fiji were exposed in the year 2000 when CWM hospital faced a possibility of mass disaster during mutiny of the Fiji military camp. CWM laboratory did not have enough supply of blood, consumables and reagents; documen-tation was lacking in all areas including laboratory supply distribution and storage location; there were no written procedures for urgent cross-match or handling of massive transfusion needs. The situation prompted communication between the Head of Pathology ser-vices at the time with World Health Organization and laboratory experts abroad. The concept of Laboratory Quality Management was promoted as the way for-ward to improve Fiji laboratory and blood transfusion services and to meet the trends of modern medicines, with greater reliance on technology and increased dependence of medical officers on laboratory investiga-tions, along with raising expectations for accuracy and reliability of laboratory results. The laboratory quality management system (LQMS) was initially introduced in the CWM hospital in 2002. A part-time laboratory quality manager was appointed in CWM hospital in the same year and he was sent to attend the following regional meeting with the hope that he would champion the implementation of LQMS not only in CWM hospital but throughout all laboratories in Fiji. There were also two LQMS train-ings offered at the PPTC in the following years that were attended by Fiji laboratory personnel. Due to lack of funding, local LQMS training was only possible at CWM hospital where the implementation was done in a disjointed manner, depending on the availability of laboratory staff time and with their own resources. The gap between CWM hospital laboratory and other laboratories, however, was quite apparent in the years that followed. Further collaboration with WHO resulted in the decision to lobby for Global Fund support in 2008 with the understanding that the laboratories would not be able to adequately support the two disease programs, namely HIV and TB, with-out the implementation of laboratory quality manage-ment system throughout Fiji. An official proposal for a more comprehensive Laboratory Health System Strengthening program in Fiji under the Global Fund TB grant followed shortly after and was awarded in the same year.
Implementation of Laboratory Quality Management System in Fiji Pathology Laboratory Services
Tudravu L1, Malupo N1, Buadromo E, Nahapetyan K 2*
Keywords: Laboratory Quality Management System (LQMS), Pathology Services, Fiji
1. Colonial War Memorial Hospital Laboratory, Ministry of Health2. WHO, Representative Office for the South Pacific, Fiji • Address for Correspondence: [email protected]

FIJI JOURNAL OF PUBLIC HEALTH
Volume 3, Issue 1, 2014
PERSPECTIVE
44
Theory of change
The theory of change that underpins implementation of the laboratory quality management system (LQMS) in Fiji Pathology Laboratory services is summarized in Figure 1. The outcome of LQMS implementation corresponds to the mission statement of the National Laboratory Policy “to provide an equitable and accessible, quality laboratory service”. To achieve this outcome, several major strategies have been employed:1. Creating commitment to quality. Quality is everyone’s responsibility; LQMS can only be implemented if everyone in the organization under-stands the need for it and implements it in their daily work.2. Creating a coherent national regulatory frame-work for laboratory services. Fundamental principles of LQMS should be built into the national laboratory regulations that communicate Ministry of Health’s commitment and create a mandatory framework for implementation.3. Building human capacity for LQMS. Involvement of laboratory staff is a key determinant of successful LQMS implementation. Employees’ acceptance of and participation in LQMS should be achieved through system ownership, training and knowledge sharing.4. Documenting LQMS. Documentation is the back-bone around which the quality management system is built. It helps the organization establish effective control over its processes and provide evidence of quality practices to its customers.5. Monitoring, evaluating and improving LQMS. Quality management system is continuously improved and fine-tuned through ongoing collection of evidence on laboratory services’ performance. As a roadmap and reference for LQMS implementa-tion, Fiji laboratory services used WHO Asia Pacific Strategy for Strengthening Health Laboratory Services (2010-2015), ISO 15189:2007 standard and Clinical and Laboratory Standards Institute approved guide-lines HS1-A2 – A Quality Management System Model for Health Care and GP26-A3 – Application of a Quality Man-agement System Model for Laboratory Services. We appreciate financial assistance from the Global Fund and technical assistance from WHO, as well as leader-ship and performance scrutiny on the part of Grant Management Unit of the Ministry of Health, without which the implementation of LQMS in Fiji would have been much longer and thornier.
LQMS implementation process
Strategic assessment of laboratory servicesInitial stages of LQMS implementation in Fiji were informed by the Situational analysis of pathology laboratories and pathology workforce review
conducted in 2010 that provided a comprehensive picture of the baseline status of laboratory services and identified priority areas in need of change. In particu-lar, findings of these reviews served as a basis for devel-opment of the national laboratory regulations.
Creating commitment for qualitySystematic implementation of LQMS requires sus-tained and significant effort and resources; it also introduces a serious change in the “business as usual” of any laboratory and as any change, runs the risk of being resisted. Therefore, creating commitment for quality from both the laboratory leadership and regular laboratory staff is crucial for successful implementa-tion. To promote commitment, an informal National Core Group for LQMS Implementation was estab-lished. The Group consisted of technical experts and even though its composition varied over time, it usu-ally included the consultant pathologists and selected pathology registrars, laboratory superintendents and quality managers from CWMH and divisional hospi-tals, as well as representatives from private laboratories and academia. Although not having official terms of reference, the Group played several important func-tions: (1) advocated for LQMS before the executive management of the Ministry of Health, (2) developed early drafts of regulatory documents (see below), (3) developed laboratory policies, (4) overseen and steered the overall LQMS implementation process. At the same time, part-time quality manager positions were established at CWMH and divisional hospitals. Their role was to obtain staff buy-in for LQMS through coaching, mentoring, and serving as a role model and oversee implementation at their respective divisional and sub-divisional laboratories. Important role for obtaining staff commitment was played by the LQMS trainings (see below). LQMS implementation was greatly facilitated by the receptive and supportive at-titude of MOH.
Development of the national regulatory framework for LQMSDraft regulatory documents were first developed and discussed by the National Laboratory Core Group that consisted of highly qualified, senior laboratory professionals representing both public and private sectors, as well as academia. Draft documents then went through a rigorous consultative process with involvement of wide range of stakeholders, including medical profession, private laboratories, administrators and program managers, consumer rights organization, international agencies, academia and others.

FIJI JOURNAL OF PUBLIC HEALTH
Volume 3, Issue 1, 2014
PERSPECTIVE
45
The consultative process included a series of stakehold-er reviews and workshops and resulted in the develop-ment of final versions of the national laboratory policy, plan and quality standards that were submitted for Government endorsement. Fiji National Laboratory Policy and National Laboratory Strategic Plan 2011-2015 were endorsed by the National Health Executive Committee in November 2010, while National Qual-ity Standards for the Health Laboratory in July 2011. In 2012-2013, draft legislation for medical laboratories licensing and accreditation (working title “Medical Laboratories Decree”) was developed through the simi-lar process. The legislation is currently being vetted by Fiji Government. Coherent national framework is a key strategic ele-ment for strengthening quality of laboratory services. Each component of the national framework is indis-pensable and plays its own distinct part in smooth functioning of LQMS. Thus, National Laboratory Policy communicates commitment of Fiji health au-thorities to laboratory quality, defines goals and objec-tives of the national laboratory system, and provides basis for strategic planning and resource allocation. National Laboratory Strategic Plan provides framework for implementation of the national laboratory policy, while National Laboratory Quality Standards specify quality objectives and performance targets of the laboratory services. Finally, national laboratory legisla-tion ensures enforcement of the LQMS requirements through laboratory accreditation and licensing mecha-nisms. For the country’s health authorities, the regula-tory framework is a practical managerial tool that, in addition to the above functions, can serve for resource mobilization, coordination of donors and development partners, and ultimately provides for sustainability of the entire laboratory system. To ensure coherence of national framework, laboratory regulatory documents were aligned with each other and with the Fiji Ministry of Health Strategic Plan 2011-2015.
Building human capacity for LQMSHuman capacity building for LQMS was done in three-level training activities: (1) basic LQMS training for all laboratory personnel irrespective of their career level;(2) advanced LQMS training for quality managers and other supervisory staff;(3) specialized trainings and attachments for divisional quality managers.
Basic LQMS training aimed at providing staff with general knowledge of LQMS, its major components (Quality System Essentials), means for their implementation, measurement and monitoring.
Basic training was based on the LQMS Training Toolkit jointly developed by WHO, CDC and CLSI and was delivered with technical assistance of WHO. A series of 3-day intensive training courses were con-ducted in 2011 to cover almost all laboratory person-nel of the country. To evaluate course effectiveness in terms of short-term increase in knowledge, participants were administered pre- and post-test questionnaires based on the topics discussed during the course and percent increase in knowledge was calculated. The average increase in knowledge across all trainings was 31.8%. Longer term attrition of knowledge was meas-ured through a knowledge retention survey conducted within 6 to 8 months after completion of basic train-ing. The survey also served to identify knowledge gaps in LQMS area that required further re-training and reinforcement. Knowledge retention was shown to be 107%, indicating 7% knowledge gain. This meant that, on average, the participants of the survey not only maintained the knowledge they obtained during the LQMS training, but in fact their knowledge had improved. Apparently, they had been actively using LQMS knowledge during the retention interval. This might be attributed to aggressive implementation of the quality management systems in Fiji clinical labo-ratories as well as coaching and mentoring performed by the divisional quality managers during supervisory visits and daily communication with the laboratories.Based on the knowledge gap analysis of survey results, a re-training course has been designed and conducted in 2013-2014. Knowledge transfer to the workplace was evaluated based on the results of the external as-sessments conducted annually in all operational labora-tories (see below). Advanced LQMS trainings were more hands-on and focused on the most important managerial skills necessary for practical implementation of LQMS. Specialized trainings and attachments included TOT trainings designed to ensure sustainability of LQMS implementation. In particular, divisional qual-ity managers were trained in external assessment and supportive supervision skills, as well as in teaching and facilitation skills necessary to teach basic LQMS courses. They have also been trained in the Fiji Na-tional University TOT course to be certified as trainers. Three divisional quality managers also passed 4-week attachments at internationally recognized New Zealand laboratories in order to observe application of LQMS in daily laboratory practice. Large-scale trainings allowed staff to familiarize themselves with the concept of LQMS, acquire skills in practical implementation, as well as helped national laboratory management obtain staff’s acceptance of and commitment to quality in their work, which eventually resulted in establishment of a culture of quality in Fiji medical laboratories.
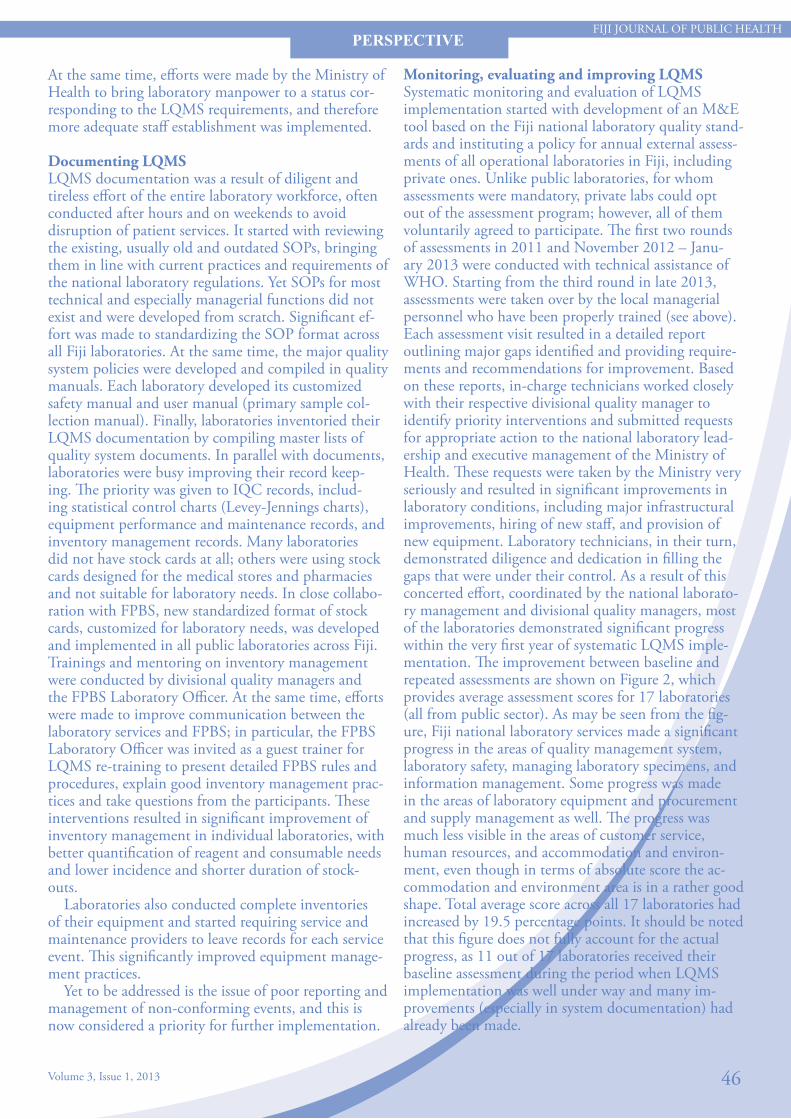
FIJI JOURNAL OF PUBLIC HEALTH
Volume 3, Issue 1, 2013
PERSPECTIVE
46
At the same time, efforts were made by the Ministry of Health to bring laboratory manpower to a status cor-responding to the LQMS requirements, and therefore more adequate staff establishment was implemented.
Documenting LQMSLQMS documentation was a result of diligent and tireless effort of the entire laboratory workforce, often conducted after hours and on weekends to avoid disruption of patient services. It started with reviewing the existing, usually old and outdated SOPs, bringing them in line with current practices and requirements of the national laboratory regulations. Yet SOPs for most technical and especially managerial functions did not exist and were developed from scratch. Significant ef-fort was made to standardizing the SOP format across all Fiji laboratories. At the same time, the major quality system policies were developed and compiled in quality manuals. Each laboratory developed its customized safety manual and user manual (primary sample col-lection manual). Finally, laboratories inventoried their LQMS documentation by compiling master lists of quality system documents. In parallel with documents, laboratories were busy improving their record keep-ing. The priority was given to IQC records, includ-ing statistical control charts (Levey-Jennings charts), equipment performance and maintenance records, and inventory management records. Many laboratories did not have stock cards at all; others were using stock cards designed for the medical stores and pharmacies and not suitable for laboratory needs. In close collabo-ration with FPBS, new standardized format of stock cards, customized for laboratory needs, was developed and implemented in all public laboratories across Fiji. Trainings and mentoring on inventory management were conducted by divisional quality managers and the FPBS Laboratory Officer. At the same time, efforts were made to improve communication between the laboratory services and FPBS; in particular, the FPBS Laboratory Officer was invited as a guest trainer for LQMS re-training to present detailed FPBS rules and procedures, explain good inventory management prac-tices and take questions from the participants. These interventions resulted in significant improvement of inventory management in individual laboratories, with better quantification of reagent and consumable needs and lower incidence and shorter duration of stock-outs. Laboratories also conducted complete inventories of their equipment and started requiring service and maintenance providers to leave records for each service event. This significantly improved equipment manage-ment practices. Yet to be addressed is the issue of poor reporting and management of non-conforming events, and this is now considered a priority for further implementation.
Monitoring, evaluating and improving LQMSSystematic monitoring and evaluation of LQMS implementation started with development of an M&E tool based on the Fiji national laboratory quality stand-ards and instituting a policy for annual external assess-ments of all operational laboratories in Fiji, including private ones. Unlike public laboratories, for whom assessments were mandatory, private labs could opt out of the assessment program; however, all of them voluntarily agreed to participate. The first two rounds of assessments in 2011 and November 2012 – Janu-ary 2013 were conducted with technical assistance of WHO. Starting from the third round in late 2013, assessments were taken over by the local managerial personnel who have been properly trained (see above). Each assessment visit resulted in a detailed report outlining major gaps identified and providing require-ments and recommendations for improvement. Based on these reports, in-charge technicians worked closely with their respective divisional quality manager to identify priority interventions and submitted requests for appropriate action to the national laboratory lead-ership and executive management of the Ministry of Health. These requests were taken by the Ministry very seriously and resulted in significant improvements in laboratory conditions, including major infrastructural improvements, hiring of new staff, and provision of new equipment. Laboratory technicians, in their turn, demonstrated diligence and dedication in filling the gaps that were under their control. As a result of this concerted effort, coordinated by the national laborato-ry management and divisional quality managers, most of the laboratories demonstrated significant progress within the very first year of systematic LQMS imple-mentation. The improvement between baseline andrepeated assessments are shown on Figure 2, which provides average assessment scores for 17 laboratories (all from public sector). As may be seen from the fig-ure, Fiji national laboratory services made a significant progress in the areas of quality management system, laboratory safety, managing laboratory specimens, and information management. Some progress was made in the areas of laboratory equipment and procurement and supply management as well. The progress was much less visible in the areas of customer service, human resources, and accommodation and environ-ment, even though in terms of absolute score the ac-commodation and environment area is in a rather good shape. Total average score across all 17 laboratories had increased by 19.5 percentage points. It should be noted that this figure does not fully account for the actual progress, as 11 out of 17 laboratories received their baseline assessment during the period when LQMS implementation was well under way and many im-provements (especially in system documentation) had already been made.
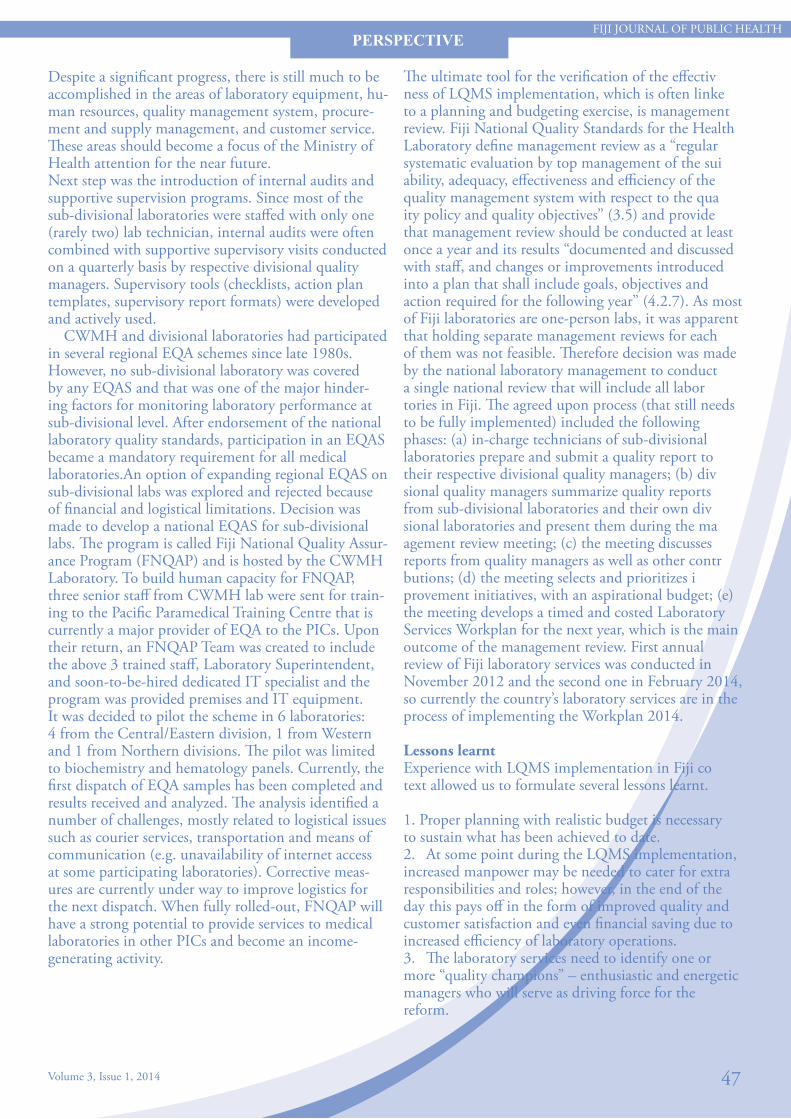
FIJI JOURNAL OF PUBLIC HEALTH
Volume 3, Issue 1, 2014
PERSPECTIVE
47
Despite a significant progress, there is still much to be accomplished in the areas of laboratory equipment, hu-man resources, quality management system, procure-ment and supply management, and customer service. These areas should become a focus of the Ministry of Health attention for the near future.Next step was the introduction of internal audits and supportive supervision programs. Since most of the sub-divisional laboratories were staffed with only one (rarely two) lab technician, internal audits were often combined with supportive supervisory visits conducted on a quarterly basis by respective divisional quality managers. Supervisory tools (checklists, action plan templates, supervisory report formats) were developed and actively used. CWMH and divisional laboratories had participated in several regional EQA schemes since late 1980s. However, no sub-divisional laboratory was covered by any EQAS and that was one of the major hinder-ing factors for monitoring laboratory performance at sub-divisional level. After endorsement of the national laboratory quality standards, participation in an EQAS became a mandatory requirement for all medical laboratories.An option of expanding regional EQAS on sub-divisional labs was explored and rejected because of financial and logistical limitations. Decision was made to develop a national EQAS for sub-divisional labs. The program is called Fiji National Quality Assur-ance Program (FNQAP) and is hosted by the CWMH Laboratory. To build human capacity for FNQAP, three senior staff from CWMH lab were sent for train-ing to the Pacific Paramedical Training Centre that is currently a major provider of EQA to the PICs. Upon their return, an FNQAP Team was created to include the above 3 trained staff, Laboratory Superintendent, and soon-to-be-hired dedicated IT specialist and the program was provided premises and IT equipment. It was decided to pilot the scheme in 6 laboratories: 4 from the Central/Eastern division, 1 from Western and 1 from Northern divisions. The pilot was limited to biochemistry and hematology panels. Currently, the first dispatch of EQA samples has been completed and results received and analyzed. The analysis identified a number of challenges, mostly related to logistical issues such as courier services, transportation and means of communication (e.g. unavailability of internet access at some participating laboratories). Corrective meas-ures are currently under way to improve logistics for the next dispatch. When fully rolled-out, FNQAP will have a strong potential to provide services to medical laboratories in other PICs and become an income-generating activity.
The ultimate tool for the verification of the effectivness of LQMS implementation, which is often linketo a planning and budgeting exercise, is managementreview. Fiji National Quality Standards for the HealthLaboratory define management review as a “regularsystematic evaluation by top management of the suiability, adequacy, effectiveness and efficiency of thequality management system with respect to the quaity policy and quality objectives” (3.5) and providethat management review should be conducted at leastonce a year and its results “documented and discussedwith staff, and changes or improvements introducedinto a plan that shall include goals, objectives andaction required for the following year” (4.2.7). As mostof Fiji laboratories are one-person labs, it was apparentthat holding separate management reviews for eachof them was not feasible. Therefore decision was madeby the national laboratory management to conducta single national review that will include all labortories in Fiji. The agreed upon process (that still needsto be fully implemented) included the followingphases: (a) in-charge technicians of sub-divisionallaboratories prepare and submit a quality report totheir respective divisional quality managers; (b) divsional quality managers summarize quality reportsfrom sub-divisional laboratories and their own divsional laboratories and present them during the maagement review meeting; (c) the meeting discussesreports from quality managers as well as other contrbutions; (d) the meeting selects and prioritizes iprovement initiatives, with an aspirational budget; (e)the meeting develops a timed and costed LaboratoryServices Workplan for the next year, which is the mainoutcome of the management review. First annualreview of Fiji laboratory services was conducted inNovember 2012 and the second one in February 2014,so currently the country’s laboratory services are in theprocess of implementing the Workplan 2014.
Lessons learntExperience with LQMS implementation in Fiji cotext allowed us to formulate several lessons learnt.
1. Proper planning with realistic budget is necessaryto sustain what has been achieved to date.2. At some point during the LQMS implementation,increased manpower may be needed to cater for extraresponsibilities and roles; however, in the end of theday this pays off in the form of improved quality andcustomer satisfaction and even financial saving due toincreased efficiency of laboratory operations.3. The laboratory services need to identify one ormore “quality champions” – enthusiastic and energeticmanagers who will serve as driving force for the reform.

FIJI JOURNAL OF PUBLIC HEALTH
Volume 3, Issue 1, 2014
PERSPECTIVE
48
4. Laboratory leadership should involve technical staff as equal partners in implementation, thus overcoming resistance to change and creating an atmosphere of col-laboration and ownership.5. High attrition of staff necessitates continuous capac-ity building to maintain and sustain LQMS effort.6. Permanent attention to sub-divisional staff (who usually are alone in their laboratories) in the form of supervisory visits, phone calls and frequent email com-munication creates supportive and motivating envi-ronment conducive to LQMS implementation. It also increases effectiveness of trainings.7. Transparency of implementation, constant commu-nication and information sharing with all stakeholders from laboratory staff to clinical colleagues to Ministry officials facilitates LQMS implementation by building common understanding of goals, objectives and perfor-mance targets, as well as exposing challenges.8. Continuous focus on LQMS changes the perspec-tive of staff allowing them to see a human face behind a sample and making them more customer-focused and professional.9. LQMS places quality safeguards (such as SOPs and proper record keeping) that make staff and customers to feel more protected and confident.
Next steps and mechanisms for sustainabilityContinuous quality improvement is at the heart of any sustainability strategy and LQMS is not an exception. In order to improve the performance of laboratory services further, introduction of the following perfor-mance monitoring tools is planned for the years to come:- Quality indicator management program, - Competency assessment program,- Systematic customer satisfaction surveys. Sustainability can only be achieved with a constant capacity building of all levels of staff. Fiji laboratory services currently have a pool of qualified trainers to ensure continued in-house training in LQMS and laboratory safety – both for new staff and as refresher trainings for staff who have already been trained before.
To address financial sustainability, it will be of utmost importance to establish a national laboratory budget for LQMS, including EQAS as a budgetary line item, as well as to build resource mobilization capac-ity, evidence-based planning and budgeting skills of managerial personnel. Finally, staff attrition that has traditionally been a significant issue for Fiji laboratory workforce will have to be addressed and a workable strategy for staff retention developed to this end.
Figure 1. Theory of change for the LQMS implementation in Fiji
Figure 2. Results of baseline and repeated assessments of 17 laboratories in Fiji

FIJI JOURNAL OF PUBLIC HEALTH
Volume 3, Issue 1, 2014
PERSPECTIVE
49
Perceptions and Applications of Monitoring and Evaluation in the Fiji Ministry of Health: 2009 – 2014
Naidu S*1, Singh R2, Glandon D*3, Cooray-Dias M3
Keywords: Monitoring and Evaluation, Fiji
OVERVIEWThis case study examines the progression in percep-tions and applications of monitoring and evaluation (M&E) within the Fiji Ministry of Health (MoH) over the period from 2009 to 2014, highlighting the impe-tus for the increased interest in program monitoring at the beginning of the period, followed by the Ministry’s efforts to strengthen monitoring processes to improve implementation and accountability, and finally the recent shift of focus toward results-based planning and management with technical support from the Austral-ian government-funded Fiji Health Sector Support Program (FHSSP), as highlighted in Figure 1.
This case study is the first of a multi-part series on M&E within the Fiji Ministry of Health. The intent of this first study is to position the topic of M&E within its historical context and to briefly introduce developments in the 2013-2014 period. Subsequent case studies will expand upon other components of the Ministry’s M&E strengthening initiative, including organizational capacity, processes, systems, motivation, and other topics.
What does “M&E” really mean and why does it matter?For many people “M&E” is much easier to talk about than to actually implement. The number of times the letters “M&E” appear in strategic plans, operational plans, policies, proposals, reports, and other docu-ments can seem overwhelmingly high, especially within social sectors like health, and yet individuals working in these areas are often hard-pressed to think of clear and tangible examples of M&E systems or processes that have been useful for them or for their organisa-tion. Part of the reason for this is that M&E is interpreted as different things by people For some, the primary purpose of M&E is to hold individuals
accountable for assigned tasks whereas for others M&E is the foundation of planning, implementation, and assessment for an entire program or organization. This case study represents an ongoing transition within the Ministry of Health from the former, compliance-ori-ented view of M&E toward the latter, results-oriented view. From the results-oriented perspective, program monitoring can be defined as, ”the systematic docu-mentation of aspects of program performance that are indicative of whether the program is functioning as intended or according to some appropriate stand-ard” (Rossi, Lipsey & Freeman, 2004). Monitoring is typically carried out on a continuous basis, providing routine information on implementation progress or changes in outcomes of interest over time. In contrast, evaluation is often carried out on a periodic basis and answers questions about effectiveness, impact, and whether a program has achieved its objectives. In this way, evaluation can be defined as “the use of social research methods to systematically investigate the ef-fectiveness of social intervention programs in ways that are adapted to their political and institutional environ-ments and are designed to inform social action to im-prove social conditions” (Rossi et al., 2004). Although there is no universal definition for M&E or for the individual terms, one shorthand way to remember the essence of each is to imagine two friends Manasa and Eva working closely together on a health program in Fiji, each with their own priorities; Manasa (monitor-ing) always asks “what happened?” while Eva’s (evalua-tion) favourite question is “so what?”. Yet while these questions can provide us with a use-ful guide to how we might apply both monitoring and evaluation in our work, it is also important to recog-nize that M&E is more than just the sum of its parts.As illustrated in Figure 2, M&E as a concept can be thought of as a continuous cycle or loop, starting with the planning phase, continuing through implemen-tation, and including timely and appropriate assess-ments, which in turn, should be used to guide further planning. Arguably, if an M&E process or system fails to “close the loop” to facilitate improvement, it should not be considered M&E at all. In other words, it’s not enough for Manasa and Eva to sit around talking all day; they have to find a way to put their observations into action. 1. Health Information Research Analysis Division, Ministry of Health
2. Health Planning, Policy Development Unit, Ministry of Health3. Fiji Health Sector Support Program (implemented by Abt JTA on behalf of the Australian Government)• Address for Correspondence: [email protected]; [email protected] Information Research Analysis Division, Ministry of Health
Figure 1: Key periods in the progression of M&E within the Fiji Ministry of Health

50
FIJI JOURNAL OF PUBLIC HEALTH
Volume 3, Issue 1, 2014
PERSPECTIVE
How does the Fiji MoH carry out M&E?In some form or another, every staff member of the MoH has contributed to some aspect of M&E; many even have M&E-related responsibilities written into their job description. Everyone would agree that it is important for the MoH to monitor the work that has been done and to evaluate whether what has been done is actually working. In this way, M&E has been seen as a priority within the MoH for years. What has changed over time, however – especially in the past five years – are the Ministry’s perceptions of the purpose and value of M&E and the associated implications for putting it into practice. As illustrated in the timeline in Figure 3, 2009 was a pivotal year for M&E within Fiji’s public sector, with the release of Fiji’s whole-of-government Roadmap for Democracy and Sustainable Socio-Economic Development (Road-map) along with its Key Performance Indicators (KPIs)
Figure 2: Closing the Loop in the Monitoring and Evaluation Cycle
Figure 3: Timeline of key M&E milestones in the Fiji Ministry of Health from 2009 to 2014
for each ministry. In 2010, the government created a national monitoring body to ensure that the Road-map is integrated into all ministries’ strategic plans and annual operational plans, also known as Annual Corporate Plans (ACP), and to “monitor, audit, and analyse implementation” (SFCCO, 2013). After receiv-ing an “average” performance rating in 2010, MoH leadership promptly initiated an effort to strengthen the timeliness and completeness of reporting on im-plementation of the Ministry’s ACP, which resulted in substantial improvements in 2011 and 2012. Building on that success, the MoH began shifting the focus of M&E beyond reporting the amount of work done to also address the larger question of whether that work was actually making a difference, requesting technical assistance from the Fiji Health Sector Support Program (FHSSP) in late 2012 to help facilitate the transition. This historical progression of M&E within the Minis-try of Health can be roughly categorized into three key time periods, which are further detailed in the sections below.
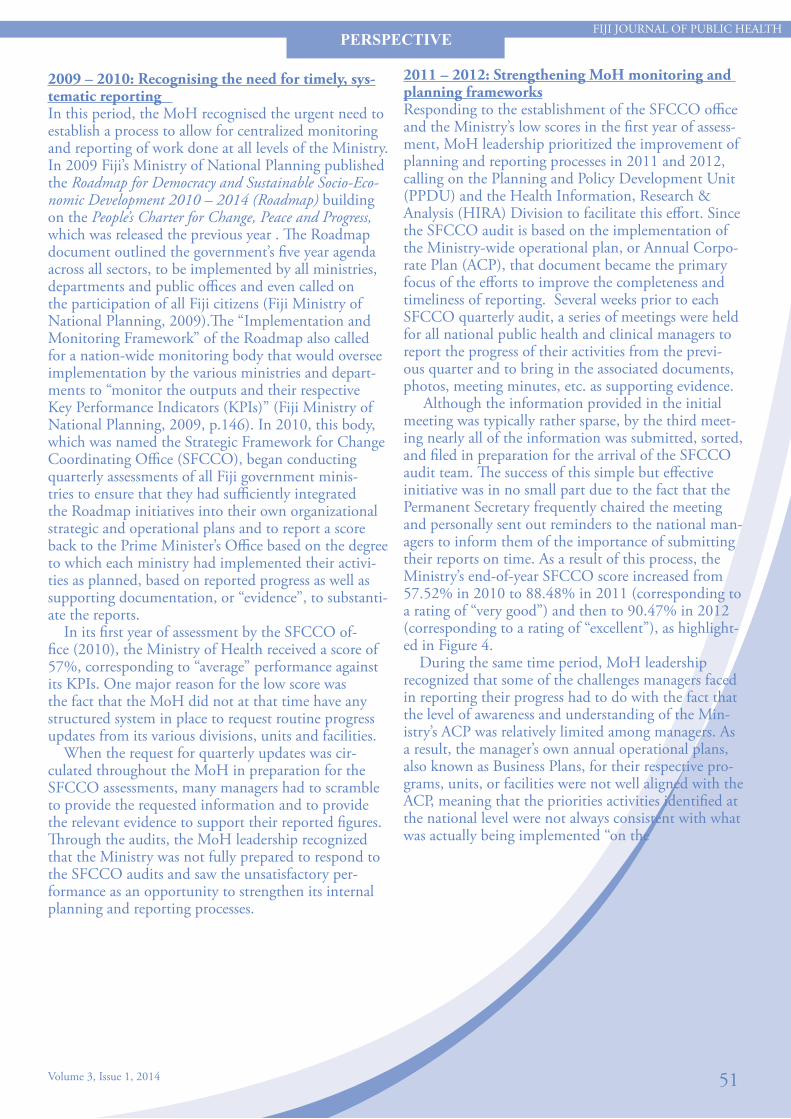
51
FIJI JOURNAL OF PUBLIC HEALTH
Volume 3, Issue 1, 2014
PERSPECTIVE
2011 – 2012: Strengthening MoH monitoring and planning frameworksResponding to the establishment of the SFCCO office and the Ministry’s low scores in the first year of assess-ment, MoH leadership prioritized the improvement of planning and reporting processes in 2011 and 2012, calling on the Planning and Policy Development Unit (PPDU) and the Health Information, Research & Analysis (HIRA) Division to facilitate this effort. Since the SFCCO audit is based on the implementation of the Ministry-wide operational plan, or Annual Corpo-rate Plan (ACP), that document became the primary focus of the efforts to improve the completeness and timeliness of reporting. Several weeks prior to each SFCCO quarterly audit, a series of meetings were held for all national public health and clinical managers to report the progress of their activities from the previ-ous quarter and to bring in the associated documents, photos, meeting minutes, etc. as supporting evidence. Although the information provided in the initial meeting was typically rather sparse, by the third meet-ing nearly all of the information was submitted, sorted, and filed in preparation for the arrival of the SFCCO audit team. The success of this simple but effective initiative was in no small part due to the fact that the Permanent Secretary frequently chaired the meeting and personally sent out reminders to the national man-agers to inform them of the importance of submitting their reports on time. As a result of this process, the Ministry’s end-of-year SFCCO score increased from 57.52% in 2010 to 88.48% in 2011 (corresponding to a rating of “very good”) and then to 90.47% in 2012 (corresponding to a rating of “excellent”), as highlight-ed in Figure 4. During the same time period, MoH leadership recognized that some of the challenges managers faced in reporting their progress had to do with the fact that the level of awareness and understanding of the Min-istry’s ACP was relatively limited among managers. As a result, the manager’s own annual operational plans, also known as Business Plans, for their respective pro-grams, units, or facilities were not well aligned with the ACP, meaning that the priorities activities identified at the national level were not always consistent with what was actually being implemented “on the
2009 – 2010: Recognising the need for timely, sys-tematic reporting In this period, the MoH recognised the urgent need to establish a process to allow for centralized monitoring and reporting of work done at all levels of the Ministry. In 2009 Fiji’s Ministry of National Planning published the Roadmap for Democracy and Sustainable Socio-Eco-nomic Development 2010 – 2014 (Roadmap) building on the People’s Charter for Change, Peace and Progress, which was released the previous year . The Roadmap document outlined the government’s five year agenda across all sectors, to be implemented by all ministries, departments and public offices and even called on the participation of all Fiji citizens (Fiji Ministry of National Planning, 2009).The “Implementation and Monitoring Framework” of the Roadmap also called for a nation-wide monitoring body that would oversee implementation by the various ministries and depart-ments to “monitor the outputs and their respective Key Performance Indicators (KPIs)” (Fiji Ministry of National Planning, 2009, p.146). In 2010, this body, which was named the Strategic Framework for Change Coordinating Office (SFCCO), began conducting quarterly assessments of all Fiji government minis-tries to ensure that they had sufficiently integrated the Roadmap initiatives into their own organizational strategic and operational plans and to report a score back to the Prime Minister’s Office based on the degree to which each ministry had implemented their activi-ties as planned, based on reported progress as well as supporting documentation, or “evidence”, to substanti-ate the reports. In its first year of assessment by the SFCCO of-fice (2010), the Ministry of Health received a score of 57%, corresponding to “average” performance against its KPIs. One major reason for the low score was the fact that the MoH did not at that time have any structured system in place to request routine progress updates from its various divisions, units and facilities. When the request for quarterly updates was cir-culated throughout the MoH in preparation for the SFCCO assessments, many managers had to scramble to provide the requested information and to provide the relevant evidence to support their reported figures. Through the audits, the MoH leadership recognized that the Ministry was not fully prepared to respond to the SFCCO audits and saw the unsatisfactory per-formance as an opportunity to strengthen its internal planning and reporting processes.
52
FIJI JOURNAL OF PUBLIC HEALTH
Volume 3, Issue 1, 2014
PERSPECTIVE
M&E processes to move beyond the compliance focus of the previous years to also ask the bigger picture questions about whether the interventions were mak-ing a difference, and if not, where and how improve-ments could be made. Key aims in the 2013 to 2014 period included: • Strengthening planning and monitoring capacity across all health system levels• Improving data quality and reporting at all levels; developing systems to capture data where they are lacking• Establishing indicators to measure the efficiency, effectiveness and impact of programs and interventions• Strengthening capacity at national, divisional and sub-divisional levels in use of surveys and research• Developing a ministry M&E framework and providing guidance on reporting against the Although there was strong support from MoH leadership for these objectives, it was also clear that they represented a transition away from the Ministry’s previous understanding and application of M&E, which created some important challenges. Some of the key challenges that became apparent in early 2013 included the fact that there was still a widespread per-ception among staff that the primary purpose of M&E was accountability rather than measuring results. Since the SFCCO “M&E” process was focused almost entirely on providing evidence of work com-pleted, the natural assumption for many participants attending an M&E workshop was that they would be learning about how to more effectively monitor and report the implementation of their activities. Similarly, the term “indicator” sounded quite similar to the Key Performance Indicators of the SFCCO assessments, which focused on the tangible outputs or deliverables of work completed. Other challenges ranged from concerns about the quality and completeness of data from the Ministry’s information systems to limited and fragmented technical expertise in M&E to high staff turnover, among other issues. To address these challenges, HIRA and PPDU worked with FHSSP to develop a multi-pronged ap-proach for strengthening M&E within the Ministry. Making use of a well-known framework for organiza-tional performance developed by Lusthaus et al. (2002) the main focus areas of this effort can be roughly bro-ken into three categories: capacity (i.e., the ability to perform), motivation (i.e., the drive to perform), and environment (i.e., the opportunity to perform). The initial focus during the 2013 to 2014 period was on the first category, capacity, which can be further broken down into several main areas, including people (e.g., individual technical knowledge and skills); processes (e.g., annual planning cycle, routine reporting); and
ground”. To address this, MoH leadership provided ad-ditional support to managers in late 2012 to guide the development of their Business Plan for 2013 in order to improve alignment with the ACP and also to move towards a standardized reporting format from all levels of the Ministry. Consequently, the percentage of divi-sions, units, and hospitals that submitted a completed Business Plan to the MoH headquarters increased from 0% in 2012 to 30% in 2013 (and would subsequently increase to 100% for 2014).
2013 – 2014: Shifting the focus from compliance to resultsGiven the Ministry’s impressive achievements in im-proving the SFCCO scores between 2010 and 2013, internal discussions relating to M&E among MoH managers and leadership began to focus more on the significance and implications of what was being re-ported. If a 13% improvement in waste management in health facilities had been reported, what did that really mean in concrete terms? What was actually being measured? If more community outreach activities had been completed, what was the effect? If Manasa and Eva (M&E) were having a conversation at the table, these questions would be like Eva speaking up and ask-ing “so what?” after Manasa’s detailed descriptions of what happened. In order to more fully and systematically promote this focus on results within the Ministry, the MoH requested technical assistance from the Australian gov-ernment through FHSSP, specifically in the form of a Long-Term Advisor for M&E. Starting from Decem-ber 2012, the M&E Advisor joined the MoH to work alongside PPDU and HIRA, which were turn were re-sponsible for engaging the relevant clinical and public health program managers and frontline health workers for their input and feedback throughout the process. Leveraging the technical support from FHSSP, the Ministry sought to expand and elevate the focus of its framework
Figure 4: Ministry of Health end-of-year SFCCO scores for ACP implementation: 2010-2013

53
FIJI JOURNAL OF PUBLIC HEALTH
Volume 3, Issue 1, 2014
PERSPECTIVE
between programs and divisions. Effectively addressing these challenges and meeting the information needs of staff at all levels will need to be a substantial part of the ongoing efforts to strengthen and make M&E more meaningful to all. Going forward, it is clear that M&E will continue to be a Ministry priority so that staff can actually meas-ure the impact of their work and continuously “close the M&E loop” to refine and improve their programs and interventions. A key part of this effort will be mak-ing M&E more accessible and helpful for all staff to help guide their own work, which means providing the necessary knowledge, skills, and tools to all programs, hospitals, divisions and sub-divisions. MoH units will still need to report the progress and performance of their activities, just as before, but managers will have more flexibility to monitor the information that is most meaningful for their own decision-making. As presented at the end of each FHSSP-supported M&Eworkshop delivered throughout the Ministry, the key take away message and recurrent theme of the entire initiative is that M&E is not something that can be done effectively by one person or even one unit; each of us has a role to play in monitoring and evaluating the work at our own level. Thinking about the results of our work and how we can increase our positive im-pact is not something we can outsource: m+e=me.
REFERENCESFiji Ministry of National Planning. (2009). Roadmap for Democracy and Sustainable Socio-Economic Development 2010-2014: A Better Fiji for All. Suva, Fiji. Retrieved from http://www.fiji.gov.fj/getattachment/Govt--Publications/Peo-ples-Charter/RSSED.pdf.aspx Lusthaus, C., Adrien, M. H., Anderson, G., Carden, F., & Montalván, G., P. (2002). Organizational assessment: A framework for improving performance. Ottawa: International Development Research Centre. Role of the Strategic Framework for Change Coordinating Office (SFCCO). (2013). In Strategic Framework for Change Coordinating Office. Retrieved April 12, 2014, from http://www.sfcco.gov.fj/role-of-the-strategic-framework-for-change-coordinating-office-sfcco/ Rossi, P. H., Lipsey, M. W., & Freeman, H. E. (2004). Evaluation: A Systematic Approach (7th ed.). Thousand Oaks, CA: Sage Publications.
systems & tools (e.g., planning and M&E frameworks, standardized performance indicators, information systems, etc.). As this case study goes to press in April 2014, this period is still very much a work in progress, so the challenges, interventions, results, and lessons learned associated with each of these themes will be addressed in subsequent case studies. The key take away messages from the 2013 to 2014 period come from the comments of some of the MoH managers themselves as they reflect on how M&E in the Ministry has changed in recent years. Not sur-prisingly, given the historical role of M&E as a tool for holding people accountable for completing their assigned responsibilities and tasks, comments from managers about M&E tend to revolve around planning and implementation – that is, the practical, opera-tional aspects of the Ministry’s work. At the same time, some managers have also clearly highlighted the use of M&E to make sure that the work being done actually achieves the desired results. Quotes from two manag-ers are illustrative of the transition of M&E over time and the anticipation of continued improvements going forward: “The M&E support has helped us significantly to move toward a more targeted approach to implementing our activities – by helping us measure what’s important and identify the specific gaps we need to address.”
– Dr. Rachel Devi, National Advisor Family Health
“The process of thinking about M&E, writing it down, and doing it has progressed in the last 3 years in the Ministry of Health as we move from being service delivery-oriented toward being more results-oriented. In 2012 we talked M&E; in 2013 we put it on paper; in 2014 we’re doing it.”
– Dr. Isimeli Tukana, National Advisor Wellness & Non-Communicable Disease
Looking Ahead: M&E as a continuous work in progressInitial results from the current MoH initiative to strengthen M&E have been encouraging thus far, but the effort is far from completed. For every manager who sees M&E as a means to measure impact and fa-cilitate improvement, there are likely a half dozen more who see M&E as a process for making sure their staff get their work done. Although the MoH has steadily improved and expanded information systems over the years, technical limitations continue to exist. Data col-lection and reporting for M&E purposes continue to be inconsistent, with variable quality and completeness
FIJI JOURNAL OF PUBLIC HEALTH
Volume 3, Issue 1, 2014
REFLECTION
54
Reflections on the role of managing the Global Fund Grant Project (TB and Health Systems Strengthening) for the people of Fiji
Taylor V.N1*
Keywords: Global Fund Grant Project; Tuberculosis (TB), Fiji
BackgroundFiji is a low TB Burden country with the estimated in-cidence 27 (21-33), prevalence 40 (16-70) per 100,000 population in 20101. The treatment success rate of 2010 and 2011 cohorts have improved from 67% to 93% respectively in the adoption of the Wellness ap-proach for healthy living targets. The goals of the Grant - reduce the burden of TB from 40/100,000 population to 20/100,000 popula-tion in 2014 aligned to the MDG 6 and to strengthen health systems by means of improving management of strategic health information. The Ministry of Health is the Principal Recipient of the inaugural USD 9.06 million grant implemented over two phases for a duration of five years from April 2010 to December 2014 for the people of Fiji. The Global Fund commissioned a consultant in 2009, to assess the Ministry of Health capacity in man-aging and co-ordinating the Grant given the perfor-mance based funding principles of the Geneva institu-tion – raise it, use it and prove it. The report highlighted some capacity issues includ-ing – poor implementation rate of donor supported projects, low “burn rate” of donor funds that resulted in diversion of funds to main treasury, minimal moni-toring & evaluation systems in place and ability to report in a timely manner. This resulted in the most significant recommenda-tion as Conditions Precedent to first disbursement that the Ministry of Health establish an operational Grant Management Unit with key staff recruited, including a suitably qualified Grant Manager, finance Officer and Monitoring & Evaluation Officer. The Grant Management Unit continues to manage and coordinate the Global Fund Grant for the Ministry of Health under the leadership of the Deputy Secretary Public Health and oversight from the Fiji Country Coordinating Mechanism.
Reflections – Making things right!
Political Will and CommitmentOwnership in endorsing a Grant/Project Management Unit solely dedicated to manage and coordinate donor funds. A submission was made to Cabinet (the highest authority in Fiji) to concur with the Global Fund com-missioned report – this ensures confidence of donors that the appropriately structured Unit is able imple-ment, monitor and report requirements in a timely manner pertaining to its investment. Program managers continue to focus on program-matic areas whilst the Unit will focus on management of the project. The Public Service Commission Functional Review Team report highlighted the capacity of the Grant Management Unit to manage and coordinate all donor funds to the Ministry of Health.
Avoid parallel systemsHarmonisation, alignment and integration to recipi-ent country systems2 are critical to reduce duplication and improve wise use of resources for efficiency gains. Critical that any project is aligned to the recipient country policy, planning, financial, monitoring and re-porting systems in sustaining activities that the recipi-ent country can continue to manage. The Global Fund Grant financial, monitoring and reporting systems is aligned to the Ministry of Health requirements with same output and outcome indica-tors and targets in annual corporate plans that are reported to the Prime Minister’s office on a quarterly basis using the ; generic national matrix; disbursements via the Government of Fiji channel; Global Fund budget is reflected annually in the Government of Fiji budget as grant in aid; quarterly reports submitted to the Global Fund, Ministry of Health and Overseas De-velopment Agency (ODA) of the Ministry of Finance; On-site data verification conducted with both Ministry of Health & ODA; integration into the public health systems in the area of Wellness – targets for healthy living and the Grant Management Unit is a member of the senior executive forum that meets/reports on a fortnightly basis chaired by the Permanent Secretary – Health.
1. Grant Management Unit, Ministry of Health* Address for Correspondence: [email protected]

FIJI JOURNAL OF PUBLIC HEALTH
Volume 3, Issue 1, 2014
REFLECTION
55
The Ministry of Health initiated the establishment of the Donor Coordination Committee in 2010 to col-lectively address country health needs based on evi-dence based data for donors to assist via grant in kind or grant in aid. This “round table” approach minimises risk of duplication, encourages sharing of challenges and success stories and brings about trust and confidence.
Constant CommunicationCommunicate! Communicate! Communicate! Clear, concise and regular communication is one of the key wins of the Grant Management Unit in this mar-riage! Communicating Grant issues in the fortnightly senior executive meetings; TB Beat and Fiji Public Health Bulletins; Donor Coordination Committee and recognition as a key partner in aspects of Health is a milestone!
Take home messageCountry Ownership with clear lines of communica-tion; programmatic and financial requirements aligned to national framework and donors to proactively par-ticipate and understand country needs will surely bring about success in implementing projects. The Grant Management Unit is a testimony to this rich and fulfilling relationship with the Ministry of Health – average of 90% rating in Phase 1 of the Global Fund Grant.
REFERENCES1. WHO Global TB report 20112. Paris Declaration 2005