fj.nlcsk.orgfj.nlcsk.org/images/pdf/Rocnik_62/Cislo_3_2016/Issue_3-2016.pdf · DOI:...
59
DOI: 10.1515/forj-2016-0018 Evaluation of winter food quality and its variability for red deer in forest environment: overwintering enclosures vs. free-ranging areas Michaela Holá, Miloš Ježek*, Tomáš Kušta, Jaroslav Červený Czech University of Life Sciences Prague, Faculty of Forestry and Wood Sciences, Kamýcká 129, CZ – 165 21 Prague 6 – Suchdol, Czech Republic Abstract Populations of European ungulates have grown substantially over recent decades, resulting in considerable environmental and socio-e- conomic impacts. Availability and quality of natural and supplemental food sources are among the main factors driving their population dynamics. Detailed knowledge of food quality of management-targeted species is therefore of primary importance for their successful management. The main aim of this study was to evaluate winter food quality and its variability for an important ungulate species in the Czech Republic - i.e. red deer, using faecal indices (faecal nitrogen, faecal acid detergent fibre, faecal neutral detergent fibre) and near infrared reflectance spectroscopy. We compared food quality for red deer and its possible differences between overwintering enclosures (i.e. fenced areas where red deer spend harsh winter conditions) and neighbouring unfenced free-ranging areas within two study areas. The results obtained showed that winter food quality and its variability for red deer are of different quality and variability in the overwin- tering enclosure and neighbouring free-ranging area. The observed differences in concentrations and amounts of variation of faecal indi- ces are most probably related to animal densities at individual study areas. Wildlife managers should therefore keep animals in overwin- tering enclosures at moderate densities and to provide high quality forage to all individuals in order to balance nutrition of both the indi- viduals inside and outside the enclosures. Nevertheless, further studies are needed in order to provide deeper knowledge on red deer food quality and its variability in space and time. Key words: deer diet; nutrition; near infrared reflectance spectroscopy; nitrogen; fibre Editor: Bohdan Konôpka *Corresponding author. Miloš Ježek, e-mail: jezekm@fld.czu.cz 1. Introduction Numbers of free-ranging ungulates have been recently incre- asing throughout the whole Europe (Apollonio et al. 2010). These overabundant ungulate populations may have signi- ficant impacts on the structure and functioning of their envi- ronment, resulting in considerable economic losses in agri- culture and forestry (Weisberg & Bugmann 2003; Côté 2004; Massei & Genov 2004). Food quality and availability are among the main factors determining condition, survival and reproductive success of free-ranging ungulates, as well as one of the main driving forces influencing their distribu- tion and habitat selection (Pettorelli et al. 2003; Parker et al. 2009; Van Beest et al. 2010). Accordingly, detailed informa- tion on food quality for large ungulates is essential for their efficient management. Red deer (Cervus elaphus) feed opportunistically on mixed diet of grass and concentrate food items such as browse, forbs and fruits (e.g. Gebert & Verheyden-Tixier 2001; Krojerová-Prokešová et al. 2010). Food quality (i.e. in terms of the content of nutrients, digestible energy and digestibility-reducing compounds) is of particular impor- tance to red deer (Robbins 1993; Van Soest 1994). They do not simply consume any plant species they encounter, but demonstrate preferences for plant species containing higher amounts of nitrogen and digestible energy and lower amo- unts of digestibility-reducing substances, such as fibre and secondary metabolites (e.g. Robbins 1993; Forsyth et al. 2005; Iason 2005). Direct measurements of food quality for herbivorous ungulates can be both time-consuming and expensive (Leslie et al. 2008). An alternative approach is to measure a nutriti- onal characteristics of faeces that bear a relationship to the quality of ingested diet (Holechek et al. 1982a; Leslie & Star- key 1985). Faecal material offers a convenient, non-invasive method as it is readily available and easy to obtain. There are several faecal constituents demonstrating the relationship with food quality of herbivorous ungulates (Belovsky 1981; Robbins 1993). Among the most widely applied faecal indi- ces of food quality are faecal nitrogen (FN), faecal acid deter- gent fibre (FADF), and faecal neutral detergent fibre (FNDF; Leslie et al. 2008; Dixon & Coates 2009). Despite its broad application, the use of FN as an indicator of food quality for ungulates remains controversial (see review by Leslie et al. 2008). The digestibility of the diet affects the FN levels as the bacterial fermentation activity as well as turnover incre- ases with higher digestibility (Robbins 1993). This results in a positive linear relationship between digestibility and FN (Holechek et al. 1982b). Since nitrogen content shows a posi- tive linear relationship with digestibility in plants, FN also correlates with dietary nitrogen, which is one of the most important parameters of food quality for herbivorous ungu- lates (e.g. Robbins 1993; Leslie & Starkey 1985; Hodgman et al. 1996). However, woody plant species contain secondary ORIGINAL PAPER http://www.nlcsk.sk/fj/ Lesn. Cas. For. J. 62 (2016) 139–145
Transcript of fj.nlcsk.orgfj.nlcsk.org/images/pdf/Rocnik_62/Cislo_3_2016/Issue_3-2016.pdf · DOI:...
DOI: 10.1515/forj-2016-0018
Evaluation of winter food quality and its variability for red deer in forest environment: overwintering enclosures vs. free-ranging areas
Michaela Holá, Miloš Ježek*, Tomáš Kušta, Jaroslav Červený
Czech University of Life Sciences Prague, Faculty of Forestry and Wood Sciences, Kamýcká 129, CZ – 165 21 Prague 6 – Suchdol, Czech Republic
AbstractPopulations of European ungulates have grown substantially over recent decades, resulting in considerable environmental and socio-e-conomic impacts. Availability and quality of natural and supplemental food sources are among the main factors driving their population dynamics. Detailed knowledge of food quality of management-targeted species is therefore of primary importance for their successful management. The main aim of this study was to evaluate winter food quality and its variability for an important ungulate species in the Czech Republic - i.e. red deer, using faecal indices (faecal nitrogen, faecal acid detergent fibre, faecal neutral detergent fibre) and near infrared reflectance spectroscopy. We compared food quality for red deer and its possible differences between overwintering enclosures (i.e. fenced areas where red deer spend harsh winter conditions) and neighbouring unfenced free-ranging areas within two study areas. The results obtained showed that winter food quality and its variability for red deer are of different quality and variability in the overwin-tering enclosure and neighbouring free-ranging area. The observed differences in concentrations and amounts of variation of faecal indi-ces are most probably related to animal densities at individual study areas. Wildlife managers should therefore keep animals in overwin-tering enclosures at moderate densities and to provide high quality forage to all individuals in order to balance nutrition of both the indi-viduals inside and outside the enclosures. Nevertheless, further studies are needed in order to provide deeper knowledge on red deer food quality and its variability in space and time.Key words: deer diet; nutrition; near infrared reflectance spectroscopy; nitrogen; fibre
Editor: Bohdan Konôpka
*Corresponding author. Miloš Ježek, e-mail: [email protected]
1. IntroductionNumbers of free-ranging ungulates have been recently incre-asing throughout the whole Europe (Apollonio et al. 2010). These overabundant ungulate populations may have signi-ficant impacts on the structure and functioning of their envi-ronment, resulting in considerable economic losses in agri-culture and forestry (Weisberg & Bugmann 2003; Côté 2004; Massei & Genov 2004). Food quality and availability are among the main factors determining condition, survival and reproductive success of free-ranging ungulates, as well as one of the main driving forces influencing their distribu-tion and habitat selection (Pettorelli et al. 2003; Parker et al. 2009; Van Beest et al. 2010). Accordingly, detailed informa-tion on food quality for large ungulates is essential for their efficient management.
Red deer (Cervus elaphus) feed opportunistically on mixed diet of grass and concentrate food items such as browse, forbs and fruits (e.g. Gebert & Verheyden-Tixier 2001; Krojerová-Prokešová et al. 2010). Food quality (i.e. in terms of the content of nutrients, digestible energy and digestibility-reducing compounds) is of particular impor-tance to red deer (Robbins 1993; Van Soest 1994). They do not simply consume any plant species they encounter, but demonstrate preferences for plant species containing higher amounts of nitrogen and digestible energy and lower amo-unts of digestibility-reducing substances, such as fibre and
secondary metabolites (e.g. Robbins 1993; Forsyth et al. 2005; Iason 2005).
Direct measurements of food quality for herbivorous ungulates can be both time-consuming and expensive (Leslie et al. 2008). An alternative approach is to measure a nutriti-onal characteristics of faeces that bear a relationship to the quality of ingested diet (Holechek et al. 1982a; Leslie & Star-key 1985). Faecal material offers a convenient, non-invasive method as it is readily available and easy to obtain. There are several faecal constituents demonstrating the relationship with food quality of herbivorous ungulates (Belovsky 1981; Robbins 1993). Among the most widely applied faecal indi-ces of food quality are faecal nitrogen (FN), faecal acid deter-gent fibre (FADF), and faecal neutral detergent fibre (FNDF; Leslie et al. 2008; Dixon & Coates 2009). Despite its broad application, the use of FN as an indicator of food quality for ungulates remains controversial (see review by Leslie et al. 2008). The digestibility of the diet affects the FN levels as the bacterial fermentation activity as well as turnover incre-ases with higher digestibility (Robbins 1993). This results in a positive linear relationship between digestibility and FN (Holechek et al. 1982b). Since nitrogen content shows a posi-tive linear relationship with digestibility in plants, FN also correlates with dietary nitrogen, which is one of the most important parameters of food quality for herbivorous ungu-lates (e.g. Robbins 1993; Leslie & Starkey 1985; Hodgman et al. 1996). However, woody plant species contain secondary
ORIGINAL PAPER http://www.nlcsk.sk/fj/
Lesn. Cas. For. J. 62 (2016) 139–145

metabolites which are known to bind with plant proteins and gastrointestinal enzymes during chewing and digestive pro-cesses. These complexes are not digestible at rumen pH and are excreted in the faeces, thereby inflating concentrations of FN (Robbins 1993; Palo & Robbins 1991). Nevertheless, it has been suggested that under natural conditions, where free-ranging herbivores can make their own choice of what plant species they will consume, a relatively consistent corre-lation exists between FN and dietary nitrogen (Palo & Rob-bins 1991).
Regarding the fibre fractions in faeces, NDF consists pre-dominantly of hemicellulose, cellulose and lignin (Van Soest et al. 1991) and it has been demonstrated that increasing levels of NDF in diet reduce voluntary food intake (Van Soest 1994). A subset of NDF is ADF, which represents lignin, cel-lulose and cutin – i.e. the least digestible compounds for most herbivores (Van Soest et al. 1991). As content of ADF in diet increases, digestibility as well as available energy decreases (Van Soest 1994). Red deer are known to show higher prefe-rences for plant species containing lower levels of fibre (For-syth et al. 2005). Adequate levels of fibre in diet are howe-ver required to maintain normal rumen function (Van Soest 1994).
Plant nutrients and thus quality of food consumed by herbivorous ungulates are highly variable in space and time (e.g. Palo & Robbins 1991; Crawley 1997; Holá 2012). To efficiently evaluate variation in food quality, however, requi-res large number of samples and the wet-chemistry methods used to measure FN, FADF, and FNDF in faeces frequently become very time-consuming and expensive. Near infrared reflectance spectroscopy (NIRS) provides a useful tool to overcome these drawbacks since it allows rapid, low-cost, chemical-free, and non-destructive analyses of a large num-ber of samples (Foley et al. 1998). NIRS has been widely used in wildlife nutrition research over the past four decades and numerous studies have used NIRS to measure food quality through faecal indices in herbivorous ungulates (Kamler et al. 2004; Dixon & Coates 2009; Showers et al. 2006).
In recent decades, the use of fenced overwintering enclo-sures for free-ranging ungulates is a common management practice in many central European countries, including the Czech Republic. The main purpose of these enclosures is to reduce damage to forest stands and to assist animal survival over harsh winter conditions. Enclosures are 10 – 50 ha and animals are usually kept inside for about a half-year (i.e. from the beginning of December until the beginning of growing season; Putman & Staines 2004; Pepin et al. 2006). Sup-plementary feeding is a major food source for animals kept inside the enclosures. Therefore, temporarily confining the animals into a restricted fenced area may be reflected in their feeding habits and quality of food consumed. Considering the importance of food quality for herbivorous ungulates, it is essential to evaluate the quality of foods consumed inside the enclosures in comparison to foods consumed outside them.
Our purpose here was thus to evaluate winter food qua-lity and its variability for red deer using faecal indices (i.e. FN, FADF, FNDF) and NIRS. We compared food quality for red deer and its possible differences between overwinte-ring enclosures (i.e. fenced areas where red deer spend harsh winter conditions) and neighbouring unfenced free-ranging
areas within two study areas in the Czech Republic. We selec-ted winter since this time period is of particular importance for red deer. Plants available in winter are usually less diges-tible and have lower amounts of necessary nutrients (Van Soest 1994). Severe winter conditions and related reduction in food quality are thus among the main factors influencing survival and reproduction success of red deer populations (Christianson & Creel 2007).
2. Materials and Methods
2.1. Study areasFaecal samples of red deer were collected during winter 2013 in two study areas in the Czech Republic: (i) military train-ing area Hradiště (Karlovy Vary region; hereinafter MTA Hradiště), and (ii) military training area Boletice (South Bohemia region; hereinafter MTA Boletice; Fig. 1). The cli-The cli-matic conditions of study areas is describe in the Table 1.
Fig. 1. Location of the study areas (indicated by grey circles) with-in Europe and the Czech Republic.
Table 1. Climatic conditions during winter 2013.January February March April
Average monthly temperature [°C] MTA Boletice −4.2 −5.1 −3.9 4.2MTA Doupov −2.8 −3.5 −2.7 6.8
Duration of snow cower [day] MTA Boletice 28 28 25 8MTA Doupov 21 20 17 6
The MTA Hradiště (50°16´ N, 13°7´ E) is situated in the Doupovské hory Mountains and has a total acreage of 331 km2. Forests cover 41% of the area, agricultural land 8%, other land cover types 51%, and water surfaces 0.2%. Deciduous forests with Norway spruce (Picea abies), Euro-pean larch (Larix decidua), and pine (Pinus sylvestris, Pinus nigra) cover 71%. Broad-leaved forests with beech (Fagus sylvatica), sycamore maple (Acer pseudoplatanus), and ash (Fraxinus excelsior) cover 29%. The predominant forest type is herb-rich beech forest. The other forest types are ravine forests, alluvial forests, oak-hornbeam forests, and thermo-philous oak forests (Vojta & Kopecký 2006).
The MTA Boletice (48°49´ N, 4°13´ E) has a total acre-age of 219 km2. Forests cover 60% of the area, agricultural land 10%, and shrubs and natural open areas 30%. Spruce forests with Norway spruce (Picea abies) and rowan (Sor-bus aucuparia) are the dominating cover. Flowering beech forests and acidophilus beech forest mostly with European beech (Fagus sylvatica) and sycamore maple (Acer pseudo-platanus), and fir forests with silver fir (Abies alba) are found at altitudes between 600 and 1000 m a.s.l. Large complexes of semi natural treeless areas occur at lower altitudes.
140
M. Holá et al. / Lesn. Cas. For. J. 62 (2016) 139–145

Regarding the overwintering enclosures in our study areas in 2013, the enclosure in the MTA Hradiště had a total acreage of 12 ha with 280 individuals of red deer (90%), and sika deer (10%; Cervus nippon), and the enclosure in the MTA Boletice had 8 ha with 35 individuals of red deer. Supplemen-tal feed (i.e. corn and meadow hay) was regularly provided to free-ranging ungulates, including red deer, in the overwinte-ring enclosures and neighbouring free-ranging areas in both study areas from November to May.
2.2. Sampling and chemical analysesWe randomly collected fresh red deer faeces from fenced overwintering enclosures and neighbouring unfenced areas within each study area during winter 2013 (n = 149 in MTA Hradiště, n = 161 in MTA Boletice). All faecal samples were oven-dried to constant weight at 50 °C and subsequently ground to pass 1 mm sieve.
A subset of faecal samples (i.e. calibration (n = 100), further used for NIRS interpolation of chemical constitu-ents in the remaining samples, was assayed by standard che-mical methods to determine the exact concentrations of FN, FADF, and FNDF. Total FN content was determined using an automated C/N analyser TruSpec (LECO Corporation, USA) after oxygen combustion in an oven at 950 °C. Total FADF and FNDF concentrations were determined by stan-dard methods of the Association of Official Analytical Che-mists (AOAC 1984). The results of the chemical assays were then used to calibrate NIRS as described by Foley (1998). All faecal samples were scanned from1 100 to 2 500 nm using a Thermo Nicolet NEXUS 670 scanning spectrophotometer and an OMNIC 7.4 software (Thermo ScientificTM, USA). The spectrum of each sample was the average of 32 succes-sive scans at a resolution of 4 cm−1. Each spectrum was recor-ded as the logarithm of the reciprocal of reflectance (log 1/R).
Prior to calibrations, the scatter correction of standard normal variate (SNV) and detrend was applied to the spectral data, along with a number of possible combinations of deri-vative (1,2), gap (4,10), and smoothing (4,10; Barnes et al. 1989). The calibrations were performed by partial least squ-are (PLS) regressions with internal cross-validation (Shenk & Westerhaus 1991). Outliers were detected by using the residual sample variance plot after the PLS regression. The predictive ability of the PLS equations was evaluated on the basis of coefficient of determination (R2) of the linear regression of predicted against measured values, the root mean square errors of calibration (RMSEC), the root mean square errors of cross-validation (RMSECV), and the ratio of performance deviation (RPD), which is the ratio of the standard deviation of the reference values and the root mean square errors of prediction (RMSEP). Good predictions are regarded as having an R2 > 0.81 and an RPD > 2. Predicti-ons having 0.66 < R2 < 0.80 and 1.5 < RPD < 2 are consi-dered to be approximate and predictions having R2 <0.65 and an RPD < 1.5 are considered to be poor (Shepherd & Walsh 2007).
Statistical analysisThe Kendall´s tau τ correlation coefficients were calculated in order to evaluate whether there was any relationships among FN, FADF, and FNDF in individual study areas.
The amounts of individual faecal indices of food quality within and outside the overwintering enclosures in individual study areas were compared by Student´s t-tests or Wilco-xon signed-rank test depending on the normality of the data.
To quantify the degree of variation in food quality in overwintering enclosures and neighbouring free-ranging areas, the coefficients of variation (i.e. CV, standard error divided by mean) for concentrations of FN, FADF, and FNDF were estimated. Significance was tested at α = 0.05 level. All statistical analyses were performed with the R software, ver-sion 3.1.1 (R Development Core Team, 2014).
3. ResultsOverall, a total of 310 red deer faecal samples, including 149 from the MTA Hradiště and 161 from the MTA Boletice, was analysed for concentrations of FN, FADF, and FNDF.
The developed calibration models (derived from the absorbance spectra of faeces) confirmed the high poten-tial of near infrared reflectance spectroscopy for analysing a large number of samples and accurate determination of major faecal indices of food quality for red deer (Table 2).
Table 2. Developed calibration models. Predictive power of par-tial least square regression with cross-validation for modelling the relationship between spectral characteristics of faecal sam-ples of red deer and concentrations of faecal nitrogen (FN), fae-cal acid detergent fibre (FADF), and faecal neutral detergent fibre (FNDF).
Constituent N R2 RMSEC RMSECV RPDN 100 0.99 0.03 0.18 2.8
ADF 100 0.98 1.21 4.42 2.9NDF 100 0.99 0.58 3.55 2.4
Note: N = number of samples used for calibration; R2 = the degree of correlation between the predicted values and the actual measured values; RMSEC = root mean square error of calibration; RMSECV = root mean square error of cross-validation; RPD = ratio of standard deviation of laboratory reference values and the root mean square error of prediction; RPD ≥ 2 indicates good models.
Concentrations of FN, FADF and FNDF showed the basic values in red deer feaces collected within and outside the overwintering enclosures in individual study areas (Table 3).
Table 3. Concentrations of FN, FADF, and FNDF in red deer fae-ces. The mean (±SD), minimum, and maximum values of faecal nitrogen (FN), faecal acid detergent fibre (FADF), and faecal neutral detergent fibre (FNDF) in red deer faeces collected from fenced overwintering enclosures and neighbouring unfenced ar-eas within two study areas (MTA Hradiště and MTA Boletice) dur-ing winter 2013.
enclosure Free-ranging areaFN µ±SD n Min Max µ±SD n Min MaxMTA Hradiště 2.17 ± 0.34 107 1.50 2.88 1.88 ± 0.19 42 1.34 2.28MTA Boletice 2.21 ± 0.31 79 1.66 3.04 2.27 ± 0.31 82 1.75 3.26 FADF µ±SD n Min Max µ±SD n Min MaxMTA Hradiště 44.24 ± 5.13 107 28.10 55.40 47.84 ± 4.22 42 37.10 56.20MTA Boletice 41.67 ± 4.02 79 33.70 52.30 45.78 ± 3.15 82 36.20 55.00 FNDF µ±SD n Min Max µ±SD n Min MaxMTA Hradiště 56.61 ± 5.62 107 38.80 73.80 60.710 ± 3.76 42 52.40 68.00MTA Boletice 61.48 ± 7.67 79 48.10 75.00 60.80 ± 4.50 82 51.20 71.30
Note: μ – mean, SD – standard deviation; n – number of collected faeces. All values expressed as % dry matter.
141
M. Holá et al. / Lesn. Cas. For. J. 62 (2016) 139–145

The Kendall´s tau τ correlation coefficient showed signi-ficant negative relationship between FN and FADF (τMTA HRA-
DIŠTĚ = −0.40, p < 0.5; τMTA BOLETICE = −0.12, p < 0.5), as well as FNDF (τMTA HRADIŠTĚ = −0.65, p < 0.5; τMTA BOLETICE = −0.78, p < 0.5) in both study areas. The relationships between FADF and FNDF were positive (τMTA HRADIŠTĚ = 0.67, p < 0.5; τMTA
BOLETICE = 0.16, p < 0.5). Regarding the differences in individual faecal indices
between overwintering enclosure and outside it in the MTA Hradiště, the FN contents were higher in the enclosure compared to the neighbouring area (Wilcox.t.: Z=-4.582; p<0.0001, Fig. 2). The levels of FADF and FNDF showed the opposite trend, with higher levels found in the free-ranging areas compared to the enclosure (ADF: Wilcox. t.: Z=4.040; p<0.0001, Fig. 3; NDF: Student. t-test.: t=4.337; p<0.0001, Fig. 4).
Turning now to the MTA Boletice, the amounts of FN showed a different trend in comparison to MTA Hradiště. The FN levels in the MTA Boletice were similar in the overwintering enclosure and in neighbouring free-ranging area (Wilcox. t.: Z = −0.955; p < 0.3394, Fig. 5). Similarly
the concentrations of FADF and FNDF were comparable in the overwintering enclosure and outside it (ADF: Wilcox. t.: Z = −0.544; p < 0.5861, Fig. 6; NDF: Wilcox. t.: Z = −0.8928; p < 0.3720, Fig. 7).
The amounts of variation in faecal indices of red deer food quality showed interesting patterns in individual study areas. In the MTA Hradiště, the amount of variation was higher in the overwintering enclosure compared to free-ranging area for all studied faecal indices. In the MTA Boletice, on the other hand, the amounts of variation were comparable between the overwintering enclosure and outside it (Table 4).
Table 4. The amounts of variation in faecal indices. Coefficients of variation [%] for faecal indices of food quality for red deer in overwintering enclosures and neighbouring free-ranging areas in MTA Hradiště and MTA Boletice.
MTA Hradiště MTA Boleticeenclosure Free-ranging area enclosure Free-ranging area
FN 16 10 14 14FADF 12 9 7 6FNDF 10 6 8 7
Coefficient of variation (%) was estimated as the ratio of the standard deviation to the mean.
Fig. 2. Volume of nitrogen. Box and whisker plots showing the median, minimum, maximum, upper and lower quartile for the concentrations of faecal nitrogen in red deer faeces collected in the overwintering fenced enclosures and neighbouring free-ranging areas in the MTA Hradiště.
Fig. 3. Volume of ADF. Box and whisker plots showing the me-dian, minimum, maximum, upper and lower quartile for the concentrations of faecal acid detergent fibre in red deer faeces col-lected in the overwintering fenced enclosures and neighbouring free-ranging areas in the MTA Hradiště.
Fig. 4. Volume of NDF. Box and whisker plots showing the me-dian, minimum, maximum, upper and lower quartile for the con-centrations of faecal neutral detergent fibre in red deer faeces col-lected in the overwintering fenced enclosures and neighbouring free-ranging areas in the MTA Hradiště.
Fig. 5. Volume of nitrogen. Box and whisker plots showing the median, minimum, maximum, upper and lower quartile for the concentrations of faecal nitrogen in red deer faeces collected in the overwintering fenced enclosures and neighbouring free-ranging areas in the MTA Boletice.
142
M. Holá et al. / Lesn. Cas. For. J. 62 (2016) 139–145

4. DiscussionThe use of FN as a proxy for food quality of herbivorous ungu-lates is based on the fact, that there is a positive relationship between dietary N and FN (e.g. Leslie & Starkey 1985; Hodg-man et al. 1996). Nevertheless, it cannot always be assumed that dietary N is directly reflected in the faeces, particularly due to possible effects of secondary metabolites (e.g. Palo & Robbins 1991; Leslie et al. 2008). Therefore, conclusions based only on the FN levels should be strengthened by the use of multiple nutritional indices, such as fibre fractions in faeces (FADF and FNDF). These indices should be more sensitive to fluctuations in food quality than FN, especially when diets contain high amounts of secondary metabolites such as tannins (Hodgman et al. 1996; Leslie et al. 2008). As expected, our results showed a strong negative relationships between FN and FADF, as well as FNDF. This is due to the FN levels being lower if the diet contains more indigestible compounds, such as fibre components, since FN is associ-ated with indigestible fibre (Van Soest 1994).
Our analyses showed that in the MTA Hradiště, the FN concentrations were higher in the overwintering enclosures compared to neighbouring free-ranging areas. The FADF and FNDF levels showed the opposite trends. On the other hand, the food quality indices were similar in the overwinte-ring enclosure and outside it in the MTA Boletice. The obser-ved differences in concentrations of faecal indices at indivi-dual study areas are most probably related to animal densi-ties. The density of animals was significantly higher in the overwintering enclosure in the MTA Hradiště (i.e. animal density ranged from 22 to 24 individualsper ha) in compa-rison to the enclosure in the MTA Boletice, where the animal density was lower (i.e. 4 to 5 individuals per ha). Therefore, at high densities, there may be less plant species of higher quality for red deer as a consequence of over-browsing, thus favouring the growth of woody plant species which are less palatable for red deer (Suzuki et al. 2008). Such plant species have higher concentrations of tannins which are able to bind to plant proteins in the digestive tract of ruminants and thus reduce the levels of digestible protein and increase the excre-
tion of FN (Palo & Robbins 1991; Robbins 1993). This could explain the higher FN values observed in the overwintering enclosure in the MTA Hradiště. Similarly Carpio et al. (2015) have found the highest FN values in areas with the highest red deer densities and tannin concentrations in faeces. On the other hand, other studies focusing on ungulate diets have observed a negative relationship between FN and popula-tion density, for example Sams et al. (1998) for white-tailed deer (Odocoileus virginianus), and Asada & Ochiai (1999) for sika deer (Cervus nippon). These authors have argued that as population density increases, competition for high qua-lity plant species is higher and consequently the high quality plant species are rapidly depleted and the consumed food is of lower quality resulting in decreased FN levels (Sams et al. 1998; Asada & Ochiai 1999).
Another possible explanation for the observed trends in faecal indices in the MTA Hradiště could be the fact that the red deer in the overwintering enclosure were to a larger extent dependent on supplemental foods provided by hun-ters, which is of better nutritional value and more palatable than winter plant species available outside the enclosure. As reported by Carpio et al. (2015), a positive relationship was found between FN and dietary N in plants on hunting esta-tes with a supplemental food supply, whereas no relationship was observed in the absence of supplementary feeding.
The different degrees of variation in food quality obser-ved in this study may be again attributed to the differen-ces in animal density. Increased population densities may lead to intensified competition for food resources and thus only highly socially ranked individuals are more successful at obtaining foods of high quality (Clutton-Brock & Albon 1985; Putman & Staines 2004). The higher amounts of varia-tion in food quality observed in the enclosure in the MTA Hra-diště could hence be attributed to the differential access to high quality foods related to social rank (e.g. Appleby 1980; Thouless 1990). In the MTA Boletice, on the other hand, the amounts of variation were similar in the enclosure and out-side it, most probably due to adequate population densities in the area and not intense competition for food resources.
143
M. Holá et al. / Lesn. Cas. For. J. 62 (2016) 139–145
Fig. 6. Volume of ADF. Box and whisker plots showing the me-dian, minimum, maximum, upper and lower quartile for the concentrations of faecal acid detergent fibre in red deer faeces col-lected in the overwintering fenced enclosures and neighbouring free-ranging areas in the MTA Boletice.
Fig. 7. Volume of NDF. Box and whisker plots showing the me-dian, minimum, maximum, upper and lower quartile for the con-centrations of faecal neutral detergent fibre in red deer faeces col-lected in the overwintering fenced enclosures and neighbouring free-ranging areas in the MTA Hradiště.

Forsyth, D. M., Richardson, S. J., Menchenton, K., 2005: Foliar fibre predicts diet selection by invasive Red Deer Cervus elaphus scoticus in a temperate New Zeland forest. Functional Ecology, 19:495–504.
Gebert, C., Verheyden-Tixier, H., 2001: Variations of diet com-position of Red Deer (Cervus elaphus L.) in Europe. Mammal Review, 31:3–4.
Hodgman, T. P., Davitt, B. B., Nelson, J. R., 1996: Monitoring mule deer diet quality and intake with fecal indices. Journal of Range Management, 49:215–222.
Holá, M., 2012: Spatial and Temporal Variation in the Quality of Summer Foods for Herbivores along a Latitudinal Gradient. MSc. Thesis, Faculty of Forestry, Dept. of Wildlife, Fish, and Environmental Studies, Swedish University of Agricultural Sciences, Umeå, 33 p.
Holechek, J. L., Vavra, M., Pieper, R. D., 1982a: Botanical composi-tion determination of range herbivore diets-a review. Journal of Range Management, 35:309–315.
Holechek, J. L., Vavra, M., Arthun, D., 1982b: Relationships between performance, intake, diet nutritive quality and fecal nutritive quality of cattle on mountain range. Journal of Range Management, 35:741–744.
Iason, G., 2005: The role of plant secondary metabolites in mam-malian herbivory: ecological perspectives. Proceedings of the Nutrition Society, 64:123–131.
Kamler, J., Homolka, M., Čižmár, D., 2004: Suitability of NIRS analysis for estimating diet quality of free-living red deer Cervus elaphus and roe deer Capreolus capreolus. Wildlife Biology, 10: 235–240.
Krojerová-Prokešová, J., Barančeková, M., Šustr, P., Heurich, M., 2010: Feeding patterns of red deer Cervus elaphus along an alti-tudinal gradient in the Bohemian Forest: effect of habitat and season. Wildlife Biology, 16:173–184.
Leslie, D. M., Starkey, E. E., 1985: Fecal indices to dietary quality of cervids in old-growth forests. The Journal of Wildlife Manage-ment, 49:142–146.
Leslie, D. M., Bowyer, R. T., Jenks, J. A., 2008: Facts From Feces: Nitrogen Still Measures Up as a Nutritional Index for Mam-malian Herbivores. The Journal of Wildlife Management, 7:1420–1433.
Massei, G., Genov, P. V., 2004: The environmental impact of wild boar. Galemys, 16:135–145.
Palo, R. T., Robbins, C. T. (ed.), 1991: Plant Defenses Against Mammalian Herbivory. CRC Press. Inc. Boca Raton, Florida.
Parker, K. L., Barboza, P. S., Gillingham, M. P., 2009: Nutrition integrates environmental responses of ungulates. Functional Ecology, 23:57–69.
Pepin, D., Renaud, P. C., Boscardin, Y., Goulard, M., Mallet, C., Anglard, F. et al. 2006: Relative impact of browsing by red deer on mixed coniferous and broad-leaved seedlings – An enclosure-based experiment. Forest Ecology and Management, 222:302–313.
Pettorelli, N., Dray, S., Gaillard, J.-M., Chessel, D., Duncan, P., Illius, A. et al., 2003: Spatial variation in springtime food resources influences the winter body mass of roe deer fawns. Oecologia, 137:363–369.
Putman, R. J., Staines, B. W., 2004: Supplementary winter feeding of wild red deer Cervus elaphus in Europe and North America: justifications, feeding practice an effectiveness. Mammal Review, 34:285–306.
R Core Team, 2014: A language and environment for statistical computing. Version 3.0.3 [computer program]. R Foundation for Statistical Computing. Vienna, Austria. Available: http:/www.R-project.org; 2014. Accessed 10 April 2014.
Robbins, C. T., 1993: Wildlife Feeding and Nutrition. Second Edi-tion. Academic Press, San Diego.
To sum up, the results obtained suggest that the red deer food is of different quality and variability in the overwintering enclosure and neighbouring free-ranging area most probably due to high population density. Therefore, it is necessary to keep animals in overwintering enclosures at moderate den-sities and to provide high quality forage to all individuals in order to balance nutrition of both the individuals inside and outside the enclosures. Moreover, the analyses confirmed the high potential of NIRS for analysing large numbers of samples necessary for monitoring purposes of red deer diets. However, further studies are needed in order to provide dee-per knowledge on red deer food quality and its variability in space and time. The further studies should aim to evaluate the differences in each sex and age classes especially.
Acknowledgements This study was supported by the Ministry of Agriculture of the Czech Republic, Grant No. QJ1220314 and Internal grant agency of CULLS, Grant No. 20164312.
ReferencesAOAC, 1984: Official methods of analysis. Association of Official
Agricultural Chemists, Washington.Appleby, M. C., 1980: Social rank and food access in red deer stags.
Behaviour, 74:294–309.Apollonio, M., Andersen, R., Putman R. (eds.), 2010: European
Ungulates and Their Management in the 21st Century. Cam-bridge University Press, Cambridge, UK.
Asada, M., Ochiai, K., 1999: Nitrogen content in feces and the diet of Sika deer on the Bose Peninsula, central Japan. Ecological Research, 14:249–253.
Barnes, R. J., Dhanoa, M. S., Lister, S. J., 1989: Standard normal variate transformation and de-trending of near-infrared diffuse reflectance spectra. Applied Spectroscopy, 43:772–772.
Belovsky, G. E., 1981: Food plant selection by a generalist herbiv-ore: the moose. Ecology, 62:1020–1030.
Carpio, A. J., Guerrero-Casado, J., Ruiz-Aizpurua, L., Tortosa, F. S., Vicente, J., 2015: Interpreting faecal nitrogen as a non-inva-sive indicator of diet quality and body condition in contexts of high ungulate density. European Journal of Wildlife Research, 61:557–562.
Christianson, D. A., Creel, S., 2007: A Review of Environmental Factors Affecting Elk Winter Diets. Journal of Wildlife Man-agement, 76:164–176.
Clutton-Brock, T.H., Albon, S.D., 1985: Competition and popula-tion regulation in social mammals. In: Sibly, R. M., Smith, R. H. (eds.): Behavioural ecology. Oxford Blackwell Scientific, Oxford, p. 557–576.
Côté, S. D., Rooney, T. P., Tremblay, J. P., Dussault, Ch., Waller, D.M., 2004: Ecological Impacts of Deer Overabundance. Annual Review of Ecology and Systematics, 35:113–147.
Crawley, M. J., 1997. Plant Ecology. Second Edition. Blackwell Science, Oxford.
Dixon, R., Coates, D., 2009: Review: Near infrared spectroscopy of faeces to evaluate the nutrition and physiology of herbivores. Journal of Near Infrared Spectroscopy, 17:1–31.
Foley, W. J., McIlwee, A., Lawler, I., Aragones, L., Woolnough, A.P., Berding, N., 1998: Ecological applications of near infra-red reflectance spectroscopy-a tool for rapid, cost-effective prediction of the composition of plant and animal tissues and aspects of animal performance. Oecologia, 116:293–305.
144
M. Holá et al. / Lesn. Cas. For. J. 62 (2016) 139–145
Sams, M. G., Lochmiller, R. L., Qualls, C. W., Leslie, D. M., 1998: Sensitivity of condition indices to changing density in a white-tailed deer population. Journal of Wildlife Diseases, 34:110–125.
Shenk, J. S., Westerhaus, M. O., 1991: New standardization and calibration procedures for near infrared reflectance spectros-copy. Crop Science, 31:469–474.
Shepherd, K. D., Walsh, M. G., 2007: Infrared spectroscopy: Ena-bling an evidence-based diagnostic surveillance approach to agricultural and environmental management in developing countries. Journal of Near Infrared Spectroscopy, 15:1–19.
Showers, S. E., Tolleson, D. R., Stuth, J. W., Kroll, J. C., Koerth, B. H., 2006: Predicting diet quality of white-tailed deer via NIRS fecal profiling. Rangeland Ecology & Management., 59:300–307.
Suzuki, M., Miyashita, T., Kabaya, H., Ochiai, K., Asada, M., Tange, T., 2008: Deer density affects ground-layer vegetation differ-ently in conifer plantations and hardwood forests on the Boso Peninsula, Japan. Ecological Research, 23:151–158.
145
M. Holá et al. / Lesn. Cas. For. J. 62 (2016) 139–145
Thouless, C. R., 1990: Feeding competition between grazing red deer hinds. Animal Behaviour, 40:105–111.
Van Beest, F. M., Mysterud, A., Loe, L. E., Milner, J. M., 2010: For-age quantity, quality and depletion as scale-dependent mecha-nism driving habitat selection of a large browsing herbivore. Journal of Animal Ecology, 79:910–922.
Van Soest, P. J., 1994: Nutritional ecology of the ruminant, 2nd ed. Cornell University Press, Ithaca, New York.
Van Soest, P. J., Robertson, J. B., Lewis, B. A., 1991: Methods for dietary fiber, neutral detergent fiber, and nonstarch polysaccha-rides in relation to animal nutrition. Journal of Dairy Science, 74:3583–3597.
Vojta, J., Kopecký, M., 2006: Vegetation of secondary forests and shrubs in Doupovské hory hills. Zprávy České botanické společnosti , Praha, 21:209–225.
Weisberg, P. J., Bugmann, H., 2003: Forest dynamics and ungulate herbivory: from leaf to landscape. Forest Ecology and Manage-ment, 181:1–12.
Spatial considerations of an area restriction model for identifying harvest blocks at commercial forest plantations
Jan Kašpar1*, Gerardo F. E. Perez2, Adelaide Cerveira3, Róbert Marušák1
1Czech University of Life Sciences Prague, Faculty of Forestry and Wood Sciences, Kamýcká 129, CZ – 165 21 Prague 6 – Suchdol,Czech Republic 2Universidade Federal do Paraná (UFPR), Rua dos Funcionários, 1540, Juvevê – Curitiba – Paraná, Brazil3University of Trás-os-Montes e Alto-Douro, 5001-801, Vila Real and INESC TEC, Portugal
AbstractIn the past few decades, ecological and environmental issues have dominated the forest industry worldwide, but economic aspects have been much less studied in this dynamic period. However, a sustainable and efficient forest biomass supply is critical for socio-economic development in many regions, particularly in rural areas. Nature protection efforts have contributed to reduced harvesting quotas, which have resulted in an imbalance of the environmental functions of the forests and forest management, particularly wood supply.Considering the size and distribution of forest production management units and the forest stands that compose those units, there is a clear need for improved decision-making tools that help forest managers in planning harvest sequences. The optimization of harvest sche-duling should consider economic and spatial factors, which may reduce production costs by increasing the logistic efficiency. Moreover, incorporating maximum harvesting opening size constraints into planning can help preserve biodiversity.This article presents a new spatial harvest scheduling model based on the integer programming method; it was developed using real data from a forest production unit located in the northern part of the southeast region of Brazil. The goal of the proposed scheduling appro-ach is to maximize the net present value and concentrate the harvesting locations in each period. In spite of the fact that the object of the study is plantation forest under management different to common conditions in Europe or North America, the model is flexible and can be used in management of forest in Central Europe.Keywords: Eucalyptus; plantation management; spatial harvest scheduling; harvest-flow constraints
Editor: Bohdan Konôpka
*Corresponding author. Jan Kašpar, e-mail: [email protected], phone: +420 22439 3796
1. IntroductionThe importance of exact mathematical methods in deci-sion-making processes is indisputable, especially in forest management, which is faced with very complex scenarios due to the spatial and temporal aspects of decision models with many sources of uncertainty. Furthermore, forest mana-gers often have to find a balance between goals of multiple participants (owner, public society, nature protection orga-nizations, etc.) in most cases.
According to Baskent & Keles (2005), forest planning can be defined as the organization of the various activities to be undertaken over time in a forest to meet the objecti-ves of the project, while also ensuring long-term sustaina-bility of forest resources and the steady flow of wood pro-ducts. Buongiorno & Gilles (2003) recognized that the stra-tegic planning of wood production involves managing large forested areas, and many operations and people; often dif-ferent aspects of the production process compete for the same resources, which makes the allocation of this resour-ces a complex task. Thus, to achieve a satisfactory return on investment, it is necessary to implement a detailed forest management plan efficiently allocating production factors to achieve the established objectives. According to Falcão & Borges (2003), management models that consider the geo-
graphical locations of forest activities contribute to avoid segregation across levels of strategic and operational plan-ning. They can also provide necessary information to address problems related to the transport of forest products and / or the spatial arrangement of cultural operations.
A key aspect of spatial forest planning is the combination of optimal harvest scheduling with the spatial dispersion of harvesting units; variations in either of these factors involve not only environmental impacts, but also consideration of operational logistics. Scheduling of forest harvesting invol-ves identifying a series of areas to be cut to ensure maximum profit for the landowner and guarantee a balance in the har-vested amount of wood or area over a defined period. Howe-ver, more traditional forest planning methods did not consi-der spatial dispersion of harvesting units, so it is difficult to evaluate the tradeoffs of a harvest plan in terms of logistical and environmental impacts versus financial goals.
By introducing spatial variables in forest planning prob-lems, it is possible to find an optimal solution between econo-mic, environmental, and logistical objectives within the con-straints provided. According to Öhman & Eriksson (2010), including spatial parameters in strategic planning of forest harvesting increases its complexity. One reason for the incre-ased complexity is that to represent the aggregation of mana-gement units into the models, integer variables need to be
DOI: 10.1515/forj-2016-0017
ORIGINAL PAPER http://www.nlcsk.sk/fj/
Lesn. Cas. For. J. 62 (2016) 146–151
2. Material and methods
2.1. ModelA very simple area restriction harvest scheduling binary programing model was created for the purpose of our case study. The model is presented in Equations 1–7:
subject to:
Maximum distance constraints:
Harvest volume-flow constraints:
Maximum opening size constraints:
The objective function [1] maximizes the net present value (NPV) from all harvested forest stands, i = 1, …, N, and from all planned years, p = 1, …, P, while the cip parame-ter expresses the NPV from harvested wood in Euro (€), and xip, for i = 1, …, N and p = 1, …, P, is the decision variable that takes value 1 if stand is harvested in period p and 0 otherwise. The first constraint, equation 2, ensures that each unit is har-vested only once during the planning horizon. Equations 3 and 4 ensure the distance between selected stands, dij, cal-culated as a Euclidean distance between centroids of stands i and j, is less than parameter D, the maximum distance allowed between those stands. The zijp, for p = 1, …, P; i, j = 1, … N, i < j, are decision variables taking value 1 if both stands i and j are harvested in period p and 0 otherwise. Equ-ation 5 ensures an annual balanced harvest volume throu-ghout the planning horizon. A harvest volume is allowed to vary by ∝(%) from one period to the next. The T variable is a new general variable that defines the potential harvest level for each year, and vi is the absolute value of the wood volume of stand i. The constraint (6) are known as the path constra-ints, impose area limit in the opening areas. These constra-ints prohibit to harvest too large clusters, that is, clusters whose area exceed the imposed area limit. The set ℑ consists of all possible minimal infeasible clusters, that is, all possible clusters that cannot be harvested as a whole and are mini-
[1]
[4]
[5]
[2]
[3]
[6]
[7]
introduced to specify the type of management regime that will be applied to each unit; in addition, specific information about adjacent units also needs to be considered, not solely for each isolated harvest unit.
In traditional unit restriction models (URM), harvest clusters are formed a priori by the forest planner (Murray 1999). This approach is often used in countries where laws limit the size and/or shape of harvest units (Kašpar et al. 2016). Underestimation of objective function values is one of the major disadvantages of URM (Richards & Gunn 2000). However, Hokans (1983) and Lockwood & Moore (1993) proposed a modelling approach to create harvest clusters during the optimization process; this approach is referred as the area restriction model (ARM). One of the possible exact integer programming formulations is called the Path formu-lation, originally proposed by McDill et al. (2002), which is based on enumerating all feasible clusters that cannot be harvested as a whole and which are minimal. Each of these clusters is a continuous group of stands with total area exce-eding the limit size and does not contain any cluster with area exceeding the limit size. So, it is necessary to remove only one of the stands, in such a cluster, before it becomes feasible (Crowe et al. 2003), that is, if |C|1 is the cardinality of cluster C then at most |C| – 1 of them can be harvested simultaneously. We consider that two sands are adjacent if the boundary that they share is not a discrete set of points.
Harvesting units sparsely dispersed in a forest manage-ment area have lower environmental impacts because they present fewer problems related to erosion after harvesting and they promote wildlife protection. However, this disper-sion may cause logistical problems in the harvesting and transport of the timber, thus increasing production costs. So, in reality, environmental and economic goals often conflict with one another; we attempt to find a compromise between them by using a maximum distance constraint and creating clusters of harvest units.
The complexity of spatial forest planning requires mathe-matical models and techniques within decision support sys-tems that consider adjacency restrictions. The Decision sup-port system (DSS) Optimal, developed for Central Europe forest management conditions, has been presented in seve-ral previous papers (Marušák & Kašpar 2015; Marušák et al. 2015; Vopěnka et al. 2015). The DSS Optimal is a power-ful tool used in the Czech Republic for harvest scheduling. Because DSS Optimal uses Java SDK for ArcGIS desktop extensions, it is easily modified to include different spatial constraints.
The goal of this paper is to present a basic harvest sche-duling model in the context of plantation management con-ditions in Brazil. We also present results of analyses based on alternative initial conditions. The model has been imple-mented into an updated version of DSS Optimal tool applied in countries of Central Europe. The newly developed DSS tool was used to analyze the alternative harvest scheduling scenarios.
1|C| denotes the cardinality of set C, that is the number of elements of set C.
147
J. Kašpar et al. / Lesn. Cas. For. J. 62 (2016) 146–151

mal. They assure that from each cluster C in set ℑ we can har-vest at the same period at most |C|– 1 stands, being |C| the cardinality of set C, that is, it is necessary to remove only one stand from the set C before it becomes feasible. Finally, the constraints (7) impose that all variables are binary.
2.2. Case study We used spatial and numerical data from a timber farm in north of the southeast region of Brazil for this study. The farm belongs to a private entity, thus we do not specify the location or the name of the farm. The total area is 2412 hectares and the number of forest stands is 105 (N) were their areas ran-ging from 1.07 hectares to 24.50 hectares with average value equal to 22.97 hectares. The location of this timber farm is presented in Fig. 1. The timber farm is on the border of two geographical regions - Cerrado and Mata Atlântica. There is a prevailing tropical climate, which influence the eucalyptus production of 30 – 40 m3/hectare/year.
Fig. 1. The location of the timber farm in Brazil.
Exlusively, Eucalyptus urophylla S.T. Blake, is planted at the timber farm while the wood would be used for commer-cial purposes, such as construction, power generation, fur-niture making, charcoal, pulp and paper production. Stands are harvested when the MAI (Mean Annual Increment) curve crosses the CAI (Current Annual Increment) curve; for E. urophylla, this occurs between 6 and 8 years of age. Stands younger than 5 years old cannot be harvested, and stands older than 8 years old are prioritized for harvesting. Age, site index, and stand volume data for all stands in each year were available.
We used several combinations of the following parame-ters to conduct the analysis, including: D =2.5 km, 5 km, and 10 km; ∝ = 5%, 10%, and 15%; and, C was tested at 25 ha, 50 ha, and 75 ha) were analyzed. The different combinati-ons of these alternative parameters were compared against the results of a null scenario that used no maximum distance between harvested stands in a given year (D), no limits on the percentage of volume harvested from year-to-year (∝), and no opening size constraints (C)
The total NPV of the 5-year planning horizon (P) was cal-culated for each scenario. The price of harvested wood, har-vest costs, and silviculture costs are included in the NPV cal-
culation; all monetary values are presented in Euro (€). The real prices of wood at the timber farm as well asreal Brazil interest rate of 14% were used for all analyses. The effects of different management conditions and input parameters on total NPV were evaluated.
3. ResultsThe final results of are presented in Tables 1 – 5. The objec-tive function values (total NPV) of the different alternatives are presented in Tables 1 – 4, which display scenarios with no maximum opening constraints, 75-ha maximum opening constraints; 50-ha maximum opening constraints, and 25-ha maximum opening constraints. A comparison of the objec-tive functions of all scenarios relative to the null scenario is presented in Table 5.
The highest potential objective function value, € 21,783,770, was found in the no maximum opening size, maximum distance, and harvest volume flow constraint sce-nario (Table 1). All other alternatives´ objective function values were lower (Tables 1 –4), which simply means that constraints on any of these factors limit the objective function value.
Maximum opening constraints and harvest volume flow constraints had the smallest effect on objective function values; the maximum distance constraints had the greatest impact on NPV. However, the constraints also displayed a synergistic effect; the maximum distance constraints most negatively decreased the objective function values when the maximum opening constraint was 25 ha.
As it can be seen in tables 1 to 4, the objective function value coincide without considering constraints about the maximum distance and considering 10 km as the maxi-mum distance. It means that without constraint in the dis-tance between the opening areas we get already a solution where the distance between them are less or equal than 10 km. Furthermore, in that solution the distance between some of the opening areas are greater than 5 km and so, with D = 5 km, the objective value decreases.
Table 1. NPVs (expressed in Euro) with no maximum opening size constraints using alternative harvest volume flow and maxi-mum distance constraints in an area restriction harvest schedul-ing binary programing model.
Harvest volume- flow constraints
Maximum distance constraintsno D = 10 km D = 5 km D = 2,5 km
no € 21,783,770 € 21,783,770 € 21,611,032 € 20,312,147∝ = 15% € 21,709,180 € 21,709,180 € 21,524,723 € 20,218,849∝ = 10% € 21,688,842 € 21,688,842 € 21,495,634 € 20,096,002∝ = 5% € 21,662,521 € 21,662,521 € 21,472,272 € 19,997,284
Table 2. NPVs (expressed in Euro) with 75-ha maximum opening size constraints using alternative harvest volume flow and maxi-mum distance constraints in an area restriction harvest schedul-ing binary programing model.
Harvest volume- flow constraints
Maximum distance constraintsno D = 10 km D = 5 km D = 2.5 km
no € 21,775,739 € 21,775,739 € 21,333,623 € 19,500,606∝ = 15% € 21,698,958 € 21,698,958 € 21,224,200 € 19,230,089 ∝ = 10% € 21,674,122 € 21,674,122 € 21,190,465 € 19,171,129∝ = 5% € 21,647,094 € 21,647,094 € 21,155,801 € 18,934,139
148
J. Kašpar et al. / Lesn. Cas. For. J. 62 (2016) 146–151
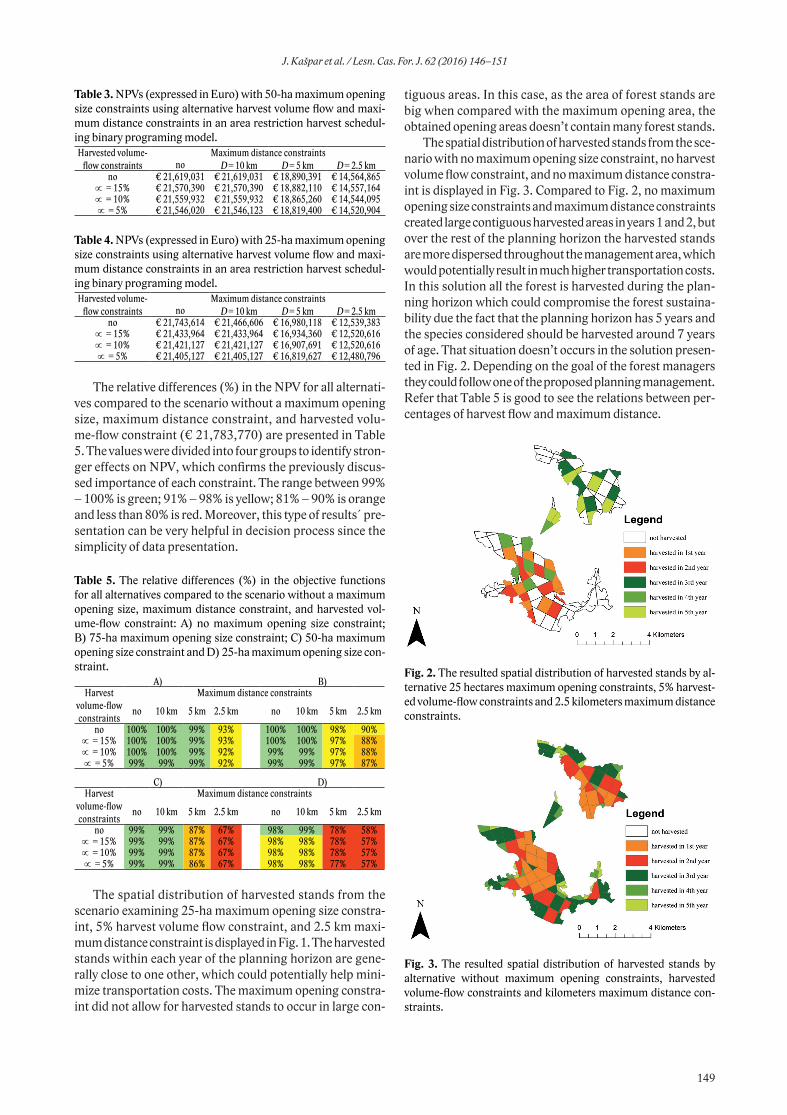
Table 3. NPVs (expressed in Euro) with 50-ha maximum opening size constraints using alternative harvest volume flow and maxi-mum distance constraints in an area restriction harvest schedul-ing binary programing model.
Harvested volume-flow constraints
Maximum distance constraintsno D = 10 km D = 5 km D = 2.5 km
no € 21,619,031 € 21,619,031 € 18,890,391 € 14,564,865∝ = 15% € 21,570,390 € 21,570,390 € 18,882,110 € 14,557,164 ∝ = 10% € 21,559,932 € 21,559,932 € 18,865,260 € 14,544,095∝ = 5% € 21,546,020 € 21,546,123 € 18,819,400 € 14,520,904
Table 4. NPVs (expressed in Euro) with 25-ha maximum opening size constraints using alternative harvest volume flow and maxi-mum distance constraints in an area restriction harvest schedul-ing binary programing model.
Harvested volume-flow constraints
Maximum distance constraintsno D = 10 km D = 5 km D = 2.5 km
no € 21,743,614 € 21,466,606 € 16,980,118 € 12,539,383∝ = 15% € 21,433,964 € 21,433,964 € 16,934,360 € 12,520,616 ∝ = 10% € 21,421,127 € 21,421,127 € 16,907,691 € 12,520,616∝ = 5% € 21,405,127 € 21,405,127 € 16,819,627 € 12,480,796
The relative differences (%) in the NPV for all alternati-ves compared to the scenario without a maximum opening size, maximum distance constraint, and harvested volu-me-flow constraint (€ 21,783,770) are presented in Table 5. The values were divided into four groups to identify stron-ger effects on NPV, which confirms the previously discus-sed importance of each constraint. The range between 99% – 100% is green; 91% – 98% is yellow; 81% – 90% is orange and less than 80% is red. Moreover, this type of results´ pre-sentation can be very helpful in decision process since the simplicity of data presentation.
Table 5. The relative differences (%) in the objective functions for all alternatives compared to the scenario without a maximum opening size, maximum distance constraint, and harvested vol-ume-flow constraint: A) no maximum opening size constraint; B) 75-ha maximum opening size constraint; C) 50-ha maximum opening size constraint and D) 25-ha maximum opening size con-straint.
A) B)Harvest
volume-flow constraints
Maximum distance constraints
no 10 km 5 km 2.5 km no 10 km 5 km 2.5 km
no 100% 100% 99% 93% 100% 100% 98% 90%∝ = 15% 100% 100% 99% 93% 100% 100% 97% 88% ∝ = 10% 100% 100% 99% 92% 99% 99% 97% 88%∝ = 5% 99% 99% 99% 92% 99% 99% 97% 87%
C) D)Harvest
volume-flow constraints
Maximum distance constraints
no 10 km 5 km 2.5 km no 10 km 5 km 2.5 km
no 99% 99% 87% 67% 98% 99% 78% 58%∝ = 15% 99% 99% 87% 67% 98% 98% 78% 57% ∝ = 10% 99% 99% 87% 67% 98% 98% 78% 57%∝ = 5% 99% 99% 86% 67% 98% 98% 77% 57%
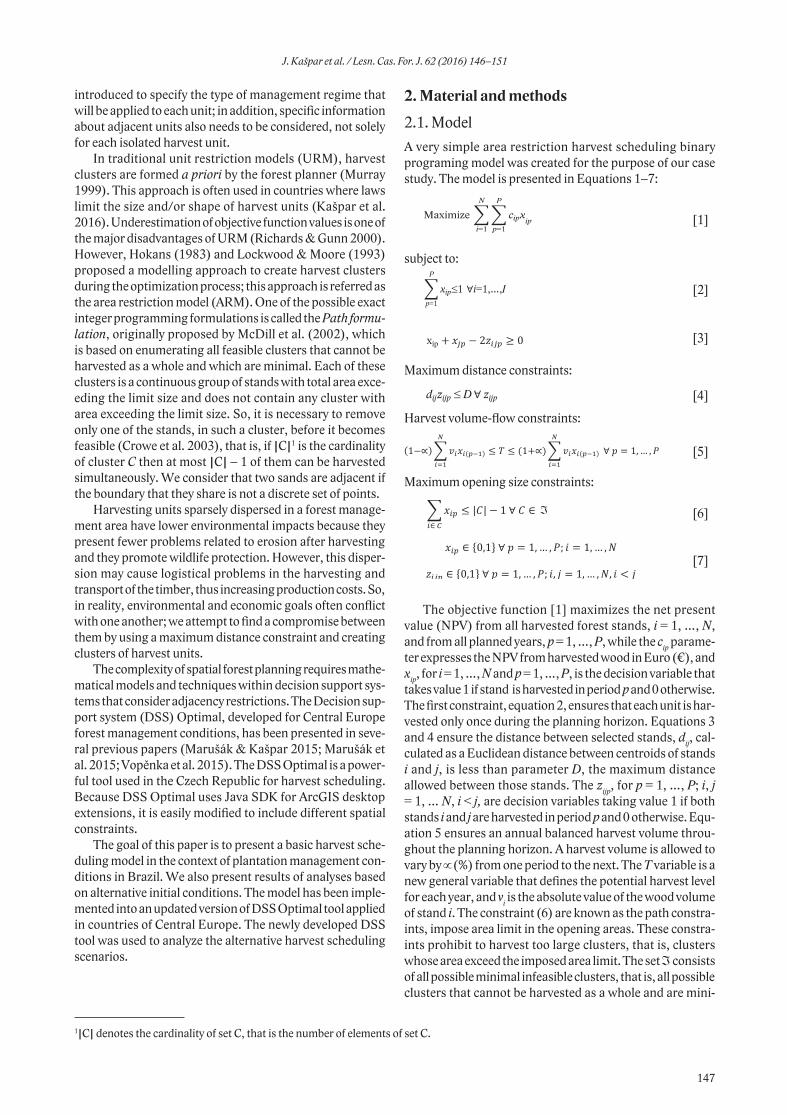
The spatial distribution of harvested stands from the scenario examining 25-ha maximum opening size constra-int, 5% harvest volume flow constraint, and 2.5 km maxi-mum distance constraint is displayed in Fig. 1. The harvested stands within each year of the planning horizon are gene-rally close to one other, which could potentially help mini-mize transportation costs. The maximum opening constra-int did not allow for harvested stands to occur in large con-
tiguous areas. In this case, as the area of forest stands are big when compared with the maximum opening area, the obtained opening areas doesn’t contain many forest stands.
The spatial distribution of harvested stands from the sce-nario with no maximum opening size constraint, no harvest volume flow constraint, and no maximum distance constra-int is displayed in Fig. 3. Compared to Fig. 2, no maximum opening size constraints and maximum distance constraints created large contiguous harvested areas in years 1 and 2, but over the rest of the planning horizon the harvested stands are more dispersed throughout the management area, which would potentially result in much higher transportation costs. In this solution all the forest is harvested during the plan-ning horizon which could compromise the forest sustaina-bility due the fact that the planning horizon has 5 years and the species considered should be harvested around 7 years of age. That situation doesn’t occurs in the solution presen-ted in Fig. 2. Depending on the goal of the forest managers they could follow one of the proposed planning management. Refer that Table 5 is good to see the relations between per-centages of harvest flow and maximum distance.
Fig. 2. The resulted spatial distribution of harvested stands by al-ternative 25 hectares maximum opening constraints, 5% harvest-ed volume-flow constraints and 2.5 kilometers maximum distance constraints.
Fig. 3. The resulted spatial distribution of harvested stands by alternative without maximum opening constraints, harvested volume-flow constraints and kilometers maximum distance con-straints.
149
J. Kašpar et al. / Lesn. Cas. For. J. 62 (2016) 146–151

4. DisccusionThis paper presents the effects of two different spatial con-straint types, maximum distance and maximum opening size, used in a harvest scheduling area restriction model. Maxi-mum distance constraints encourage the creation of cluste-red spatial harvest blocks, which helps minimize associated transportation costs (economic aspect), and maximum ope-ning size constraints limit the size of clear cuts (environmen-tal aspect). The harvest volume flow constraints are inherent parts of any harvest scheduling model and contribute to both economic and environmental aspects of harvest planning.
Many researchers have examined the economic aspects of different management approaches (for example, Tier-nan & Nieuwenhuis 2005 or Emmingham et al. 2002). In coincidence with other studies (see for example, Crowe et al. 2003), positive influence of maximum opening size on NPV was confirmed in our study. In addition to this, nega-tive impact constraints on NPV is evident in this study, simi-lar to the findings of Borges et al. (2015). The use of ARM in managed forests of central Europe is problematic because of the shape of harvest units´ legaly limitations (Kašpar et al. 2016). However, as Richards & Gunn (2000) demonstra-ted, URM are also subject to harvest units´ legaly limitati-ons, which could underestimate NPV. Murray & Weintraub (2001) estimated the difference could be as high as 16.5%. On the other hand, if NPV was the only constraint in the planning process, clear cut sizes would likely present envi-ronmental problems (e.g., erosion, wind damage). The size and shape of clear cuts is important in managing risk of wind damage (Zeng et al. 2004, 2009).
It is required to include orientation of harvest units in the model to reduce the effect of climatic conditions (wind) at the edge of the stand (Konôpka & Konôpka 2008). Many other conditions should be incorporated into the model if it is to be willingly adopted in Central Europe. For instance, the shel-terwood management system is an increasingly used silvicul-tural prescription in Central Europe and there are few papers that deal with spatial harvest scheduling under shelterwood management systems (see for example Marušák & Kašpar (2015)). Another important difference between plantation and managed forests in Central Europe is the length of crop rotation periods. The rotation of managed forests in Central Europe is over 100 years in most cases, compared to only a period of 6 to 8 years, as presented in this study. The longer the rotation period, managers will have to contend with grea-ter risk and uncertainty related to forest growth and also con-cerns about long-term health and stability of forest stands (Pasalodos-Tato et al. 2013). Stand characteristics play an important role in lowering the risk of windthrow events (Loh-mander & Helles 1987). Nevertheless the principle of the presented model is fully flexible to use in different spatial conditions by slight modification, which take into account specific management conditions. It makes the model utili-zable in Central Europe region but also in other management systems which are using optimization techniques. Following this the model can be used to analyze the currently used clear cut size, shape, and adjacency constraints in managed forests of Central Europe.
The maximum distance constraints played an important role in the economic aspects of the model. Unfortunately, this approach did not consider forest roads and associated rou-tes, so the creation of harvest blocks is only hypothetical and does not include the high capital costs of forest road building (Bruce et al. 2011). It would be necessary to use an exten-ded type of model that includes minimizing transportation infrastructure construction costs and more detailed infor-mation about transportation costs (see for example Palma, Nelson (2013)). Nevertheless, as a general rule, the total har-vest costs increase and productivity decreases with increased transportation distances (Spinelli et al. 2004). It is evident that concentrating harvesting activities will produce lower transportation infrastructure construction costs. However, this method can offer a spatial analysis of alternative harvest scenarios, or in areas without developed road networks, such as the timber farm presented in this case study. Maximum opening size had a lesser effect than the maximum distance constraints on NPV. No maximum opening size constra-ints produced similar NPV compared to the most restrictive maximum opening size constraint (25 ha).
It is necessary to mention that presented results are valid for specific spatial configuration of these forest stands, the assumed timber prices and interest rates, and the rapid growth of E. urophylla. However, based on the previous experience of the authors, one can assume that the general trends of our results will be similar even if other input data and proposed models were used in different management conditions.
5. ConclusionsOur study examined the question of whether considering different spatial aspects (economic and environmental) in forest harvest scheduling would have a significant influence on the total NPV of timber, one of the primary goals of every forest manager.
We presented different alternative constraints and con-cluded that including maximum opening size area limitation (environmental aspect) will reduce total NPV, but not to the same degree as the maximum distance limitation (economic aspect). Nevertheless, it is evident that the greater number of management goals included in harvest planning (presen-ted as constraints), the more complex the harvest scheduling problem becomes, and that exact mathematical methods and computer tools are needed to find the optimum balance of the desired goals.
Since the presented model is flexible, it could be used also for plantation management in Central Europe. Its imple-mentation in a variety of managed forests is specifically possible by the means of changed model´s parameters (len-gth of period, tree species, growth function etc.). The resul-ted values will be different in case of lower interest rate (0.5 – 2% usually used in Central Europe), however, the general relationships will remain the same.
150
J. Kašpar et al. / Lesn. Cas. For. J. 62 (2016) 146–151

AcknowledgmentsThis research was supported by the projects of the National Agency for Agriculture Research (No. QJ1320230 and No. QJ1330233) and the Internal Grant Agency of Faculty of Forestry and Wood Sciences Czech University of Life Sciences in Prague (No. B07/15).
ReferencesBaskent, E. Z., Keles, S., 2005: Spatial forest planning: A review.
Ecological Modelling, 188:145–173.Borges, P., Bergseng, E., Eid, T., Gobakken, T., 2015: Impact of
maximum opening area constraints on profitability and bio-mass avalability in forestry – A large, real world case. Silva Fennica 49:1–21.
Bruce, J. C., Han, H. S., Akay, A. E., Chung, W., 2011: ACCEL: Spreadsheet-Based Cost Estimation for Forest Road Construc-tion. Western Journal of Applied Forestry, 26:189–197.
Buongiorno, J., Gilles, J. K., 2003: Decision methods for forest resource management. Academic Press, 439 p.
Crowe, K. A., Nelson, J. D., Boyland, M., 2003: Solving the area-restricted harvest scheduling model using the branch and bound algorithm. Canadian Journal of Forest Resource, 33:1804–1814.
Emmingham, W. L., Oester, P., Bennett, M., Kukulka, F., Conrad, K., Michel, A., 2002: Comparing short-term financial aspects of four management options in Oregon: implications for uneven-aged management. Forestry, 75:489–494.
Falcão, A. O., Borges, J. G., 2003: Heuristics for integrating stra-tegic and operational levels in large scale forest management problems. Scientia Forestalis, 63:94–102.
Hokans, R. H., 1983: Evaluating spatial feasibility of harvest sched-ules with simulated stand-selection decisions. Journal of For-estry, 81:601–603.
Kašpar, J., Marušák, R., Bettinger P., 2016: Time Efficiency of Selected Types of Adjacency Constraints in Solving Unit Restriction Models. Forests, 7:102.
Konôpka, J., Konôpka, B., 2008: Prognóza náhodných ťažieb v smrečinách v dôsledku mechanicky pôsobiacich abiotických škodlivých činiteľov v oblasti Kysuce a Orava, Tatry, Spiš, Slovenské rudohorie. Lesnícky časopis - Forestry Journal, 54:325–346.
Lockwood, C., Moore, T., 1993: Harvest scheduling with spatial constraints: A simulated annealing approache. Canadian Jour-nal of Forest Resource, 23:468–478.
Lohmander, P., Helles, F., 1987: Windthrow probability as a func-tion of stand characteristics and shelter. Scandinavian Journal of Forest Research, 2:227–238.
Marušák, R., Kašpar, J., 2015: Spatially-constrained harvest sched-uling with respect to environmental requirements and silvicul-tural system. Lesnícky časopis-Forestry Journal, 61:71–77.
Marušák, R., Kašpar, J., Vopěnka, P., 2015: Decision Support Sys-tem (DSS) Optimal – A case study from the Czech Republic. Forests, 6:163–182.
McDill, M., Rebain, S., Braze, J., 2002: Harvest scheduling with area-based adjacency constraints. Forest Science, 48:631–642.
Murray, A. T., 1999: Spatial Restrictions in Harvest Scheduling. Forest Science, 45:45–52.
Murray, A. T., Weintraub, A., 2002: Scale and unit specification influences in harvest scheduling with maximum area restric-tions. Forest Science, 48:779–789.
Öhman, K., Eriksson, L. O., 2010: Aggregating harvest activities in long term forest planning by minimizing harvest area perim-eters. Silva Fennica, 44:77–89.
Palma, C. D., Nelson, J. D., 2013: A Robust Model for Protecting Road-Building and Harvest-Scheduling Decisions from Timber Estimate errors. Forest Science, 60:137–148.
Pasalodos-Tato, M., Mäkinen, A., Garcia-Gonzalo, J., Borges, J. G., Lämås, T., Eriksson, L. O., 2013: Review. Assessing uncer-tainty and risk in forest planning and decision support systems: review of classical methods and introduction of innovative approaches. Forest Systems, 22:282–303.
Richards, E. W., Gunn, E. A., 2000: A Model and Tabu Search Method to Optimize Stand Harvest and Road Construction Schdeules. Forest Science, 46:188–203.
Spinelli, R., Owende, P. M. O., Ward, S. M., Ronero, M., 2004: Comparison of Short-Wood Forwarding Systems Used in Ibe-ria. Silva Fennica, 38:85–94.
Tiernan, D., Nieuwenhuis, M., 2005. Financial optimisation of forest-level harvest scheduling in Ireland – A case study. Jour-nal of Forest Economics, 11:21–43.
Vopěnka, P., Kašpar, J., Marušák, R., 2015: GIS tool for optimi-zation of harvest-scheduling. Computers and Electronics in Agriculture, 113:254–259.
Zeng, H., Peltola, H., Talkkari, A., Venalainen, A., Strandmanm H., Kellomäki, S. et al., 2004: Influence of clear-cutting on the risk of wind damage at forests edges. Forest and Ecology Manage-ment, 203:77–88.
Zeng, H., Peltola, H., Väisänen, H., Kellomäki, S., 2009: The effects of fragmentation on the susceptinility of boreal forest ecosystem to wind damage. Forest Ecology and Management, 257:1165–1173.
151
J. Kašpar et al. / Lesn. Cas. For. J. 62 (2016) 146–151

DOI: 10.1515/forj-2016-0019
Structural analysis of the drivers and barriers to forest management in the Slovak regions of Podpoľanie and Kysuce
Rudolf Navrátil1, 2, 3*, Yvonne Brodrechtová1, Róbert Sedmák1, 2, Róbert Smreček1, Ján Tuček1
1Technical University in Zvolen, Faculty of Forestry, T. G. Masaryka 24, SK – 960 53 Zvolen, Slovak Republic2Czech University of Life Sciences Prague, Faculty of Forestry and Wood Sciences, Kamýcká 1176, CZ – 165 21 Praha 6 – Suchdol,Czech Republic 3 National Forest Centre - Institute for Forest Consulting and Education Zvolen, Sokolská 2, SK – 960 52 Zvolen, Slovak Republic
AbstractThe paper presents an application of structural analysis in search of key drivers and barriers of forest management in two Slovak regi-ons: Podpoľanie and Kysuce. A comparison with factors identified in selected European regions is also presented. First, various relevant factors affecting forest management were selected for both regions. The selections draw on the pool of primary data (structured in-per-son interviews) and secondary data (qualitative analysis of national and European documents). Second, factors were grouped accor-ding to the STEEP categories (Society, Technology, Economy, Ecology, and Policy). Subsequently, factors were rigorously assessed by the regional stakeholders in participatory workshops, and their answers were analysed by structural analysis with the help of Parmeni-des EIDOSTM software. The results show that in both Slovak regions political, economic, and ecological factors dominated over social and technological factors. The comparison with selected European regions revealed that in the Slovak and other European regions, the Policy category dominated due to having the highest number of factors and their overall impact on forest management. In contrast, the least important societal domain was Technology in both the Slovak and other European regions. However, while stakeholders across the selected European regions perceived the Society domain as significant, stakeholders in both Slovak regions perceived the Economy and Ecology domains as more significant.Key words: STEEP categories; regional stakeholders; participatory approach; forest management
Editor: Igor Štefančík
1. IntroductionTo address the challenges of diverse demands for ecosys-tem services in a future Europe requires a better knowledge of the drivers and barriers that forest management faces across various regions. These drivers and barriers influence the decisions made by forest owners, managers, and other stakeholders, which result in various approaches to forest management and the allocation of various ecosystem serv-ices (Brodrechtová et al. 2016). Knowledge of key influences and their interplay is crucial, as they play an important role in establishing consistent narratives and models for future developments in forest management in Europe (Sotirov et al. 2014). For instance, while almost a quarter of its area is either under EU and/or national nature conservation, in terms of forest management aims the provisioning services remain still crucial (Sotirov & Deuffic 2015; Brodrechtová et al. 2016). In this respect, a deeper understanding of for-est management’s key drivers and barriers can help elimi-nate existing discrepancies between social perspectives and demands that are reflected in incoherent policy aims, incon-sistent instruments, and management approaches for the conservation and sustainable management of forests across Europe (e.g. Volz 2006; Adams & Jeanrenaud 2008; Adams 2009; Arnouts & Arts 2009; Winkel et al. 2009). Moreover, as the implications of various drivers and barriers directly
*Corresponding author. Rudolf Navrátil, e-mail: [email protected], phone: +421 45 520 22 44
influence different forest management strategies, more emphasis should be placed on local context next to national and European levels (Sotirov et al. 2014; Sotirov & Deuffic 2015; Brodrechtová et al. 2016).
So far, these challenges of various drivers and barriers of forest management from the local perspective have not been addressed in European research (Sotirov & Deuffic 2015). The attempt has been done within an interdisciplinary INTE-GRAL project1. Drawing on various schools of thought (e.g., the Advocacy Coalition Framework adapted after Sabatier & Weible 2007, the Policy Arrangement Approach adapted after Arts et al. 2006) or on politicized Institutional Analysis and Development Framework (Ostrom 2005, 2007; Clement 2010) in the case of Slovakia (Brodrechtová et al. 2016), a broad set of ecological, social, economic, technological, and political factors across local, national, and European levels has been derived. Although all these factors might be impor-tant to forest management in the future, it has not been clear which factors are the key drivers and barriers to forest mana-gement. The goal of this study is therefore twofold: first, to look at selected Slovak regions and to identify the key factors and main societal domains affecting forest management in these regions; and second, to compare the results with factors identified in selected regions across Europe that are invol-
1 INTEGRAL project – Future oriented integrated management of Euro-pean forest landscapes – FP-7 project.
ORIGINAL PAPER http://www.nlcsk.sk/fj/
Lesn. Cas. For. J. 62 (2016) 152–163

ved in the INTEGRAL project. The selected European regi-ons differ in their basic biophysical conditions and socio-e-conomic circumstances related to forest management and conservation (Table 1).
The views of forest managers, owners, and other stake-holders from each region in Slovakia as well as across Europe are grasped via participatory workshops and with the use of the future-oriented research method called structural ana-lysis. The workshops are used as they enable to test scien-tific knowledge against the practical knowledge of forest managers, owners, and other stakeholders. Moreover, pub-lic participation in sustainable forestry may help to develop better informed and more widely accepted forest manage-ment outcomes (Sarvašová 2014). The structural analysis is method that can be applied within participatory workshops as it produces visible results in a time-span of a few hours. This method simulates the decision processes of policyma-kers, other actors, or consumers in choosing among alterna-tives. It allows studying relationships in order to identify the influential and dependent domain drivers, and it also enables
domain participants to find a method to share ideas, and to express their views and thinking about a specific problem (Glenn & Gordon 2005).
In this study, the systematic analysis is demonstrated in the Slovak regions of Podpoľanie and Kysuce. The results are compared with factors identified in other European regi-ons (Table 1). The differences and similarities found in the social, cultural, economic, and ecological contexts of forest management in Europe can generally support development of coherent policy, economic frameworks, and consistent policy instruments.
2. Material and Methods
2.1. Characteristics of INTEGRAL regionsThe INTEGRAL project study was conducted in 20 regions in 10 European countries (Table 1). Diversity among all the concerned areas derives not only from differences among
Table 1. INTEGRAL study regions (Betuch et al. 2015).
No. Region Country Acreage (1000 ha) Basic characteristics
1 Teteven
Bulg
aria 70 Mountainous rural area with predominance of beech forests. Dispersed rural settlements and traditional land use. Issues: wood
production, biodiversity, clean water, tourism and recreation.
2 Yundola 5 Wooded landscape with 90 % forest cover, managed by University of Forestry in Sofia. Rich physiographic and biological diversity, broad spectrum of vegetation and natural sightseeing, richness of mushrooms and herbs.
3 Pontenx
Fran
ce
102 Important rural landscape with 66% forest cover primarily of maritime pine. One of the largest cultivated and privately owned (92%) region in Europe. Issues: wood production, water regulation, biodiversity, recreation, hunting.
4 Munich South
Germ
any 60
City-near forest landscape with 72% forest cover. Urban conurbation with a high economic, ecologic and recreational value. Im-portant recreational area for urban population. Traditional forest use is in conflict with strong demand for recreational services as well as drinking water protection.
5 Upper Palatinate 300 Rural area with 53% forest cover. Predominance of small private forest owner (60%) and state of Bavaria (26%). Arising conflicts of the “new” forest biomass utilisation (mostly energy) with traditional forest products and conservation issues.
6 Newmarket
Irelan
d 75 Rural, agricultural area with 17% forest cover. State forests predominance. Conflicting objectives of timber production and biodi-versity conservation. Issues: wood, fuelwood, biodiversity, clean water, soil erosion.
7 Western Peatlands 211 Areas of peatlands, afforested in 1950s–1960s, many considered to be ‘in the wrong place’ with wrong objectives and systems. Important in terms of water quality, biodiversity and landscapes.
8 Asiago
Italy
47 High share of public (municipal) property. Asiago Plateau is a well-known tourist destination. Issues: wood production, recrea-tional activities, biodiversity.
9 Etna 25North-western area of Mount Etna with 20% forest cover. High fragmentation of forest ownership. Active forest management is marginal and related mainly to public forests. Biodiversity conservation and recreation are of primary concern within the Natural Park area.
10 Molise 42Mountain region with forest and rural environment. About 40% of state forests, the remaining forests are private with high frag-mentation problems. Biodiversity is not considered in active forest management. Issues: wood production, non-wood forest prod-ucts.
11 Suvalkija
Lith
uani
a 66 Region with coniferous-deciduous forests. State forests predominance. Commercial use of forests dominates with only small por-tion of protected areas.
12 Žemaitija 38 Medium productive mixed spruce forests on relatively unproductive agricultural land, abandoned agricultural lands, could be af-forested. Predominance of private forests. Management restrictions due to the presence of National park.
13 South-East Veluwe
Net
herla
nds
8 Conservation of natural and cultural history is the main objective while timber production is important especially for the estates. The high recreational pressure and the effects of (over) grazing are the main management concerns currently.
14 Chamusca
Portu
gal
75 The rural region with forests and scrublands. The main species are cork oak, eucalyptus and pines. Issues: sustainable product supply, wildfires, certification, collaboration, climate change (drought).
15 Vale do Sousa 16Region with high productive potential for Eucalyptus globulus and Pinus pinaster. Irregular topography, high number of small private owners with forest estates about 1.5 ha. Issues: sustainable timber supply and revenues, wildfires, collaborative forest man-agement.
16 Leiria National Forest 11 The region with largest and oldest national forests representing the state forest management system. Targeted mostly for timber
production and conservation or recreation. Issues: sustainable timber supply, wind protection and recreation.
17 Kysuce
Slov
akia 98
Agricultural-woodland highland territory. High fragmented forest ownership structure with large proportion of non-state owners and unsettled ownership. Coniferous spruce forests affected by intensive and widespread necrosis accompanied by an incidental felling.
18 Podpoľanie 21 Agricultural-forest highland landscape with varying land-uses. Dispersed rural settlements and traditional land use. A large part of the region under the nature protection. Very productive forests and rich biodiversity. State forests predominance.
19 Helgeå
Swed
en 152 Heavily forested region with private ownership predomination. Conflicting interests: timber production and biodiversity conserva-tion, rural development and urbanization.
20 Vilhelmina 850 Rural area with a low population density. Boreal forest is to a great extend used for timber, bio-fuel and reindeer herding. Conflict-ing interests: timber production and biodiversity conservation, timber production and reindeer herding.
153
R. Navrátil et al. / Lesn. Cas. For. J. 62 (2016) 152–163
countries, but also within national conditions. Applying a uniform methodology in different regions of Europe allowed us to capture differences or similarities in the social, cultural, economic and environmental contexts of an integrated forest management in Europe.
2.2. Characteristics of Podpoľanie and Kysuce regionsThe Podpoľanie and Kysuce regions are agricultural–wood-land landscapes with more than 50% of forest cover and typical for their long tradition of agricultural and forestry use. Despite these similarities, the ownership structure and current state of the forests are remarkably different in these two areas. While in Podpoľanie state forest ownership domi-nates, a very fragmented ownership structure is typical for Kysuce, with the ownership of large acreages of forested land unsettled due to an unfinished restitution process. Besides this, the forest stands in Podpoľanie are relatively stable, pro-ductive, and healthy, while the health of spruce forests in Kysuce in the last decades has declined (e.g. Konôpka 2004; Kulla 2009; Hlásny et al. 2010), resulting in a high proportion of incidental felling.
Podpoľanie region
The Podpoľanie region is located in the central part of Slo-vakia, within Banská Bystrica Region and District Detva. The area is agricultural-forest land, with forests in the north and mainly agricultural areas in the south. Beech, fir-beech, and spruce forests are typical for the very productive upper part of the forest area, in contrast to the lower part where the Carpathian oak-hornbeam forests prevail. The northern part of the region is predominantly under nature protection, belonging to the Poľana Protected Landscape Area. The area is dominated by the massif of Poľana Mt., which is the high-est extinct volcano in Central Europe; the entire mountain is part of the Carpathian arc. In a relatively small area mountain thermophile species of plants and animals also are present; thus, the region is known for its diversity and richness of flora and fauna. Moreover, the Podpoľanie region has a specific cultural landscape characterized by dispersed rural settlements and traditional land use by small private owners (Mojses & Petrovič 2013; Bezák & Mitchley 2014). Owner-ship of the forest land is split between the state (84.7%) and non-state entities (e.g. communal, private, and church own-ers), so State Enterprise Forests of the Slovak Republic is the strongest forestry subject in the region (Tuček et al. 2015).
Kysuce region
The Kysuce region is located in north-western Slovakia, bordering the Czech Republic in the west and Poland in the north. It belongs to the Žilina Region and completely covers two districts: Čadca and Kysucké Nové Mesto. The region is agricultural, with forests in the north and at higher altitudes (about 56%), and agricultural land mostly in the lower hollow basin and furrows separated by hills. Forest land ownership in the Kysuce region is characterized by very high fragmenta-
tion: state forest owners (19.5%), disputed ownership man-aged by state forest enterprise (33.9%), and non-state forest owners including private, communal, municipal, and church owners (46.3%) (Tuček et al. 2015). Almost half of the case study area is part of the Kysuce Protected Landscape Area covering the northeast and northwest parts of the territory. Tree species composition in the region has been significantly changed from the past. Spruce was previously considered a very economical fast-growing tree species; therefore, spruce monocultures have been commonly established in the region. In recent years, however, the region has been affected by intensive and widespread necrosis of spruce stands (Sitková et al. 2010; Bošeľa et al. 2014), which also interferes with pro-tected and valuable ecosystems within the Kysuce Protected Landscape Area. The cause of mortality is the critical health condition of spruce stands, caused by complex of abiotic, anthropogenic, and biotic harmful factors with the dominant effect of honey fungus (Armillaria) and an aggressive spe-cies of bark beetles (Hlásny & Sitková 2010). These factors are the cause of frequent calamities, so the Kysuce region belongs to the regions with the highest volume of incidental felling in Slovakia (e.g. in 2010 incidental felling represented 97% of total felling in Čadca District and 100% in Kysucké Nové Mesto District) (Vakula 2011).
2.3. Data collection
2.3.1 Primary and secondary data collectionWithin the INTEGRAL project the various drivers and bar-riers were analysed at (i) local level of study regions, (ii) national and (iii) European level. Identification of various determinants of forest management in different regions was based on primary data (structured in-person interviews) and secondary data (output of qualitative analysis of national and European documents).
In Slovakia primary data were obtained via 50 in-person interviews with forest owners, managers from the Podpo-ľanie and Kysuce regions, and other relevant actors at the sub-national and national levels (Brodrechtová et al. 2016). The output of this research phase was the identification of subset of 22 drivers and barriers of forest management deci-sion-making on regional level. More precisely, biophysical conditions and attributes of the community, including the politico-economic context, institutions, and discourses, were among the significant drivers affecting forest owners and managers, and their interactions and decisions concerning forest management in the Podpoľanie and Kysuce regions.
Analysis of secondary data in the form of desktop rese-arch was conducted parallel to the primary data collection. First, an extensive review of existing national documents (e.g. strategic and prognostic documents related to fore-stry, nature protection, and the rural economy) was conduc-ted. This resulted in the isolation of subset of 28 drivers and barriers, including bio-physical conditions and attributes of the community, politico-economic contexts, and institutions that can potentially determine decisions concerning forest management in Slovakia. Second, European Union (EU) documents (e.g. regulations and directives concerning fore-
154
R. Navrátil et al. / Lesn. Cas. For. J. 62 (2016) 152–163

stry, nature protection, and energy) were subsequently sys-tematically scrutinized, which resulted in the identification of subset of 35 potential drivers and barriers of forest mana-gement (Riemer, 2013). These factors concerning attribu-tes of the community, including demographic and techno-logy development, politico-economic context, institutions, and discourses provided a wide overview of possible barriers and drivers of forest management in Europe.
2.3.2 Selection of relevant factorsThe total set of 85 local, national, and EU drivers and bar-riers of forest management decision making as an outcome of broad diagnostic analysis represented a base for further investigation. More detailed analysis of the forest manage-ment factors with the help of structural analysis resulted in a required reduction to 15 – 25 relevant factors for each region (Schüll 2013).
Reduction to 15 – 25 relevant factors was completed at a workshop attended by 10 experts from Technical University and National Forest Centre, both in Zvolen, Slovakia. From the list of 85 factors, every expert chose 20 factors conside-red relevant for the further development of forest manage-ment decision making in the Podpoľanie and Kysuce regi-ons. Subsequently, the experts ranked every chosen factor from most important to least important. Finally, the factors were evaluated by the frequency analysis, taking into account the frequency and ranking of the factors. The findings of the analysis were set at 20 relevant factors for each region. The factors were afterwards thematically grouped according to the STEEP categories (Table 2). STEEP is an acronym for societal fields ‘society’, ‘technology’, ‘economy’, ‘ecology’ and ‘politics’. The allocation of factors to these categories helped to identify a possibly unbalanced selection.
2.4. Data analysis
2.4.1 Participatory workshops
To determine key drivers and barriers to future forest man-agement, a structural analysis was applied. The basic idea behind the analysis was to isolate and assess the relative mutual influences of the key factors affecting forest man-agement. Each factor was assessed according to its influ-ence on the other factors included in the analysis and also according to how strongly it was affected by the other fac-tors (Glenn & Gordon 2009). In order to grasp the view of regional stakeholders in Podpoľanie and Kysuce, and to decrease subjectivity in factors assessment, the structural analysis was carried out via participatory workshops. In each region, seven regional stakeholders participated (from 15 invited in Podpoľanie and from 11 invited in Kysuce) at a half-day workshop (Table 3).
2.4.2 Conducting structural analysis
The task of the workshop participants was to assess the relationship among 20 relevant factors that will significantly influence forest management in their regions. First, these factors were structured into STEEP categories and explained to participants. Each factor was introduced individually, with discussion about why it was considered a factor that will influence future forest management. Second, each par-ticipant received the structural analysis matrix worksheet printed in A3 format (Fig. 1). This matrix consisted of 20 relevant factors listed in columns and rows. Finally, the par-ticipants answered two questions for each pair of factors: (1) How strongly does one factor affect the other one? and (2) To what extent can the development of one factor be explained
Table 2. 20 relevant drivers and barriers of forest management for Podpoľanie and Kysuce regions.Level of evaluation Macro level Meso level Micro levelSTEEP category
Society SOC1 Demography development SOC3 Public opinion
SOC2 Qualified workforce SOC4 Codes of conduct
Technology TEC1 Innovation and technology TEC2 Wood processing industry
Economy ECN2 Timber market ECN3 Bioenergy market ECN4 Tourism ECN1 Forest owners economic situation
ECN5 Forest management Costs
Ecology ECO3 Climate changeECO1 State and structure of forest ECO2 Abiotic and biotic harmful factors ECO4 Non-wood ecosystem Services
PoliticsPOL1 Environmental policy and legislation POL2 Forest policy and legislation POL3 Rural Development policy
POL5 Subsidies and compensations POL4 Forest ownership Structure
Table 3. Basic characteristics of workshop participants in Podpoľanie and Kysuce regions.Podpoľanie region Kysuce region
Acto
rs
Position Education Age
Acto
rs
Position Education Age
D M H S 40+
50+
60+ D M H S 40+
50+
60+
State forest managers 1 1 1 1 1 1 1 1Private forest owners 1 1 1 1 2 2 1 1 2District government 1 1 1 1 2 1 1 2 1 1State nature protection 1 1 1 1 —National Forest Centre 1 1 1 1 1 1 1 1Slovak association of wood processors 1 1 1 1 —Non-state forest owner association 1 1 1 1 1 1 1 1Total 7 7
Abreviations: D – Director/Chairman; M – Manager; H – Higher; S – Secondary.
155
R. Navrátil et al. / Lesn. Cas. For. J. 62 (2016) 152–163
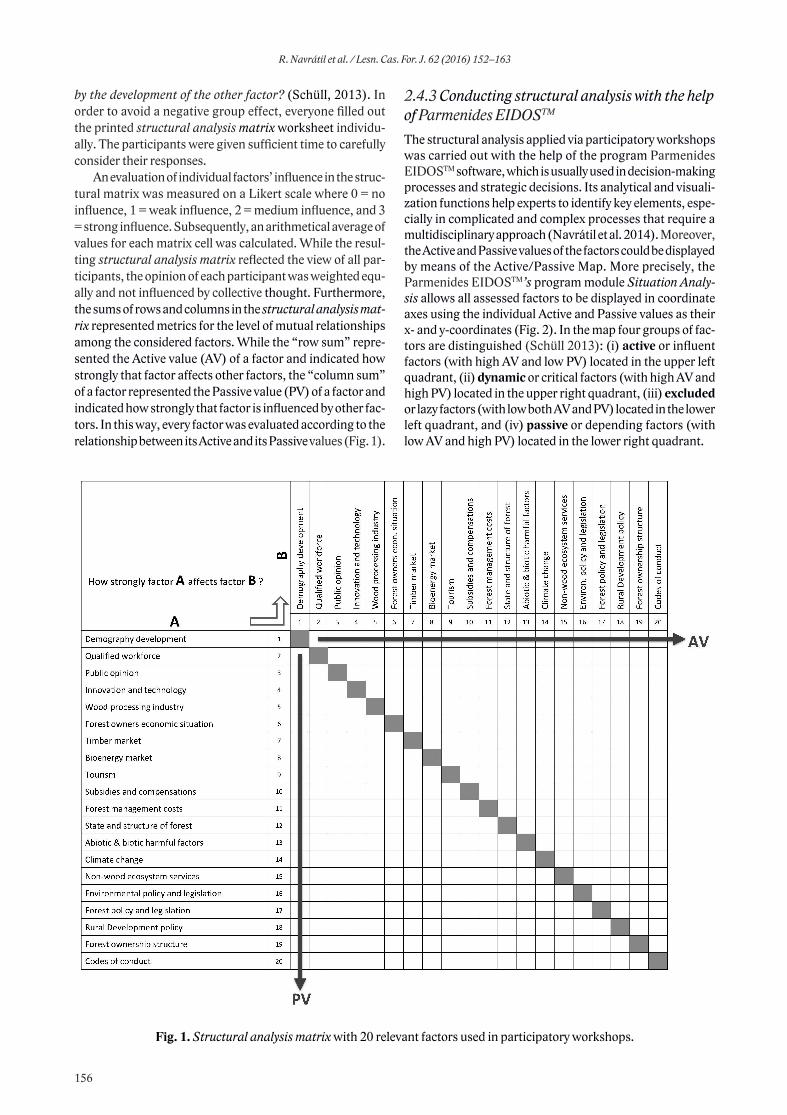
2.4.3 Conducting structural analysis with the help of Parmenides EIDOSTM
The structural analysis applied via participatory workshops was carried out with the help of the program Parmenides EIDOSTM software, which is usually used in decision-making processes and strategic decisions. Its analytical and visuali-zation functions help experts to identify key elements, espe-cially in complicated and complex processes that require a multidisciplinary approach (Navrátil et al. 2014). Moreover, the Active and Passive values of the factors could be displayed by means of the Active/Passive Map. More precisely, the Parmenides EIDOSTM’s program module Situation Analy-sis allows all assessed factors to be displayed in coordinate axes using the individual Active and Passive values as their x- and y-coordinates (Fig. 2). In the map four groups of fac-tors are distinguished (Schüll 2013): (i) active or influent factors (with high AV and low PV) located in the upper left quadrant, (ii) dynamic or critical factors (with high AV and high PV) located in the upper right quadrant, (iii) excluded or lazy factors (with low both AV and PV) located in the lower left quadrant, and (iv) passive or depending factors (with low AV and high PV) located in the lower right quadrant.
by the development of the other factor? (Schüll, 2013). In order to avoid a negative group effect, everyone filled out the printed structural analysis matrix worksheet individu-ally. The participants were given sufficient time to carefully consider their responses.
An evaluation of individual factors’ influence in the struc-tural matrix was measured on a Likert scale where 0 = no influence, 1 = weak influence, 2 = medium influence, and 3 = strong influence. Subsequently, an arithmetical average of values for each matrix cell was calculated. While the resul-ting structural analysis matrix reflected the view of all par-ticipants, the opinion of each participant was weighted equ-ally and not influenced by collective thought. Furthermore, the sums of rows and columns in the structural analysis mat-rix represented metrics for the level of mutual relationships among the considered factors. While the “row sum” repre-sented the Active value (AV) of a factor and indicated how strongly that factor affects other factors, the “column sum” of a factor represented the Passive value (PV) of a factor and indicated how strongly that factor is influenced by other fac-tors. In this way, every factor was evaluated according to the relationship between its Active and its Passive values (Fig. 1).
Fig. 1. Structural analysis matrix with 20 relevant factors used in participatory workshops.
156
R. Navrátil et al. / Lesn. Cas. For. J. 62 (2016) 152–163

For instance, active factors influence future forest deve-lopment more than they are influenced by other factors (i.e., they are very influential and have a low dependency). These factors are hard to steer and control given their low PV. Dynamic factors are very influential and at the same time very dependent; thus, any action on them has consequences on the other assessed factors. Since excluded factors have little influence and, at the same time, little dependence, they are rather isolated from the rest of the assessed factors. Pas-sive factors are influenced more strongly than they influence other factors. They are also sensitive to the development of other especially dynamic factors. In summary, the higher the position of a factor on the map, the stronger it affects the other factors. In contrast, the right-most position means that the factor is heavily affected by the other factors. Con-sequently, factors with high AV are factors of special impor-tance. While the active factors can probably serve as major key drivers or barriers for the future development of forest management, dynamic factors should receive special atten-tion, because they are more likely to change and more likely to be changed (Schüll 2013).
2.4.4 Selection of key factorsThe results of the structural analysis realized within the participatory workshops were twofold: (i) key factors were isolated according to Active and Passive values, and (ii) key factors were isolated according to Active/Passive maps. The Active and Passive values were used to compare key fac-tors from Slovak regions with factors in other INTEGRAL regions. However, the final selection of key factors in the Podpoľanie and Kysuce regions was based on Active/Pas-sive maps and subsequent discussion with stakeholders in participatory workshops. Distribution of factors in individual quadrants of maps was presented to stakeholders at the end of the workshops. The following discussions resulted in final identification of key drivers and barriers for forest manage-ment in the Podpoľanie and Kysuce regions.
Fig 2. Distribution of factors in Active/Passive map.
2.4.5 Comparison of results within project INTEGRALResulting Active and Passive values of factors from the Podpoľanie and Kysuce regions were compared with Active and Passive values of factors identified in other INTEGRAL regions. In order to ensure the comparability of results, Active and Passive values from the Podpoľanie and Kysuce regions were modified. First, as not all regions used the same Likert scale for their structural analysis (some used 0 – 3; some used 0 – 10), the results were adjusted to a consistent scale ranging from 0 to 10. Second, since the structural analysis across the INTEGRAL regions also differed by the number of involved factors, adjusted active and passive values of each factor were calculated using the following formulas:
(Avad – adjusted Active value and PVad – adjusted Passive value). The range of the scale used and the number of factors involved across INTEGRAL regions ensured comparability of the results (Hinterseer et al. 2014).
2.4.6 Analysis of factors according to STEEP categoriesThe factors were also assessed by their frequencies within the STEEP categories. This gave a picture of the importance of individual societal domains for the development of for-est management. However, the frequencies do not give any information about the overall influence of each STEEP cat-egory. Therefore, in both the Podpoľanie and Kysuce regions, the Global Active values for each STEEP category were cal-culated by adding the Active values of the individual factors. Subsequently, the results of Slovak regions were compared with the factors isolated in other INTEGRAL regions. Again, the adjusted Active values were used to ensure comparability.
3. Results and discussion
3.1. Active and Passive values – Podpoľanie and Kysuce regionsIn the Podpoľanie region (Table 4), the highest Active values were assigned to two policy factors (Subsidies and compensa-tions, Forest policy and legislation), followed by the economic factor (Forest owners’ economic situation). The factors with the highest Passive values, and therefore the factors most affected by other assessed factors, were Forest owners’ eco-nomic situation, State and structure of forest, and Forest management costs.
In the Kysuce region (Table 5), the regional stakeholders assigned the highest Active values to ecological factors (Cli-mate change, Abiotic and biotic harmful factors, State and
157
R. Navrátil et al. / Lesn. Cas. For. J. 62 (2016) 152–163
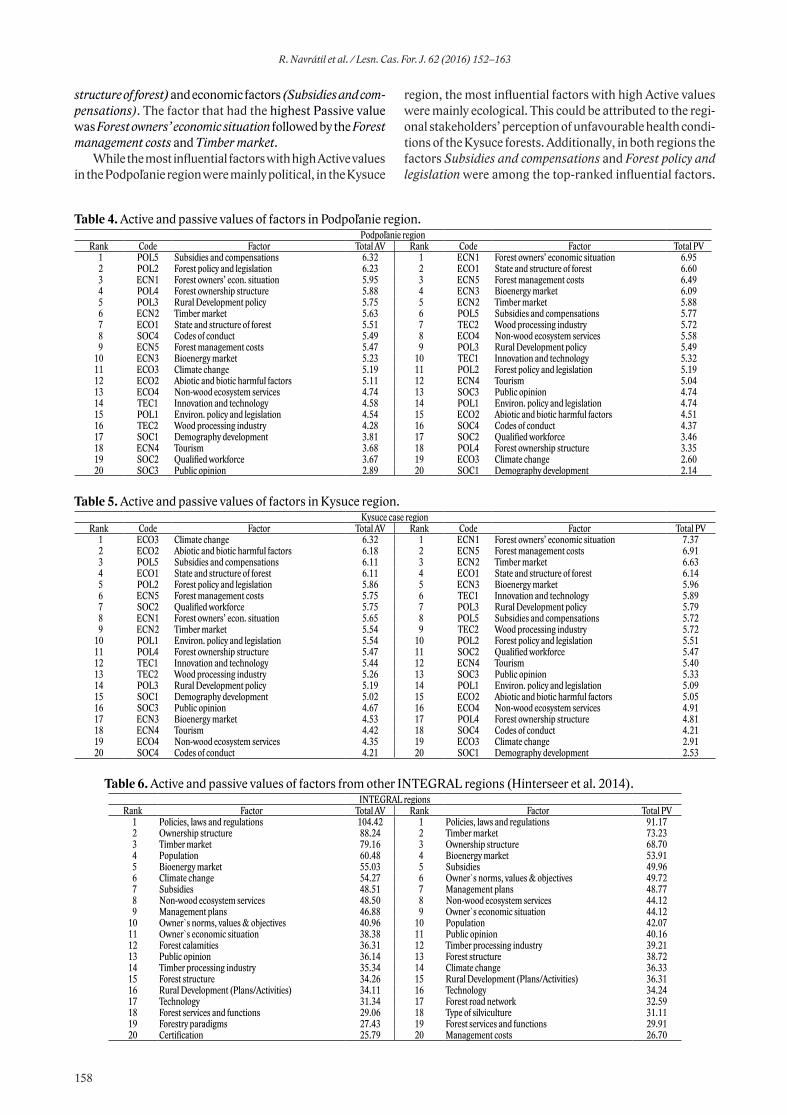
structure of forest) and economic factors (Subsidies and com-pensations). The factor that had the highest Passive value was Forest owners’ economic situation followed by the Forest management costs and Timber market.
While the most influential factors with high Active values in the Podpoľanie region were mainly political, in the Kysuce
region, the most influential factors with high Active values were mainly ecological. This could be attributed to the regi-onal stakeholders’ perception of unfavourable health condi-tions of the Kysuce forests. Additionally, in both regions the factors Subsidies and compensations and Forest policy and legislation were among the top-ranked influential factors.
Table 4. Active and passive values of factors in Podpoľanie region.Podpoľanie region
Rank Code Factor Total AV Rank Code Factor Total PV1 POL5 Subsidies and compensations 6.32 1 ECN1 Forest owners’ economic situation 6.952 POL2 Forest policy and legislation 6.23 2 ECO1 State and structure of forest 6.603 ECN1 Forest owners’ econ. situation 5.95 3 ECN5 Forest management costs 6.494 POL4 Forest ownership structure 5.88 4 ECN3 Bioenergy market 6.095 POL3 Rural Development policy 5.75 5 ECN2 Timber market 5.886 ECN2 Timber market 5.63 6 POL5 Subsidies and compensations 5.777 ECO1 State and structure of forest 5.51 7 TEC2 Wood processing industry 5.728 SOC4 Codes of conduct 5.49 8 ECO4 Non-wood ecosystem services 5.589 ECN5 Forest management costs 5.47 9 POL3 Rural Development policy 5.49
10 ECN3 Bioenergy market 5.23 10 TEC1 Innovation and technology 5.3211 ECO3 Climate change 5.19 11 POL2 Forest policy and legislation 5.1912 ECO2 Abiotic and biotic harmful factors 5.11 12 ECN4 Tourism 5.0413 ECO4 Non-wood ecosystem services 4.74 13 SOC3 Public opinion 4.7414 TEC1 Innovation and technology 4.58 14 POL1 Environ. policy and legislation 4.7415 POL1 Environ. policy and legislation 4.54 15 ECO2 Abiotic and biotic harmful factors 4.5116 TEC2 Wood processing industry 4.28 16 SOC4 Codes of conduct 4.3717 SOC1 Demography development 3.81 17 SOC2 Qualified workforce 3.4618 ECN4 Tourism 3.68 18 POL4 Forest ownership structure 3.3519 SOC2 Qualified workforce 3.67 19 ECO3 Climate change 2.6020 SOC3 Public opinion 2.89 20 SOC1 Demography development 2.14
Table 5. Active and passive values of factors in Kysuce region.Kysuce case region
Rank Code Factor Total AV Rank Code Factor Total PV1 ECO3 Climate change 6.32 1 ECN1 Forest owners’ economic situation 7.372 ECO2 Abiotic and biotic harmful factors 6.18 2 ECN5 Forest management costs 6.913 POL5 Subsidies and compensations 6.11 3 ECN2 Timber market 6.634 ECO1 State and structure of forest 6.11 4 ECO1 State and structure of forest 6.145 POL2 Forest policy and legislation 5.86 5 ECN3 Bioenergy market 5.966 ECN5 Forest management costs 5.75 6 TEC1 Innovation and technology 5.897 SOC2 Qualified workforce 5.75 7 POL3 Rural Development policy 5.798 ECN1 Forest owners’ econ. situation 5.65 8 POL5 Subsidies and compensations 5.729 ECN2 Timber market 5.54 9 TEC2 Wood processing industry 5.72
10 POL1 Environ. policy and legislation 5.54 10 POL2 Forest policy and legislation 5.5111 POL4 Forest ownership structure 5.47 11 SOC2 Qualified workforce 5.4712 TEC1 Innovation and technology 5.44 12 ECN4 Tourism 5.4013 TEC2 Wood processing industry 5.26 13 SOC3 Public opinion 5.3314 POL3 Rural Development policy 5.19 14 POL1 Environ. policy and legislation 5.0915 SOC1 Demography development 5.02 15 ECO2 Abiotic and biotic harmful factors 5.0516 SOC3 Public opinion 4.67 16 ECO4 Non-wood ecosystem services 4.9117 ECN3 Bioenergy market 4.53 17 POL4 Forest ownership structure 4.8118 ECN4 Tourism 4.42 18 SOC4 Codes of conduct 4.2119 ECO4 Non-wood ecosystem services 4.35 19 ECO3 Climate change 2.9120 SOC4 Codes of conduct 4.21 20 SOC1 Demography development 2.53
Table 6. Active and passive values of factors from other INTEGRAL regions (Hinterseer et al. 2014).INTEGRAL regions
Rank Factor Total AV Rank Factor Total PV1 Policies, laws and regulations 104.42 1 Policies, laws and regulations 91.172 Ownership structure 88.24 2 Timber market 73.233 Timber market 79.16 3 Ownership structure 68.704 Population 60.48 4 Bioenergy market 53.915 Bioenergy market 55.03 5 Subsidies 49.966 Climate change 54.27 6 Owner`s norms, values & objectives 49.727 Subsidies 48.51 7 Management plans 48.778 Non-wood ecosystem services 48.50 8 Non-wood ecosystem services 44.129 Management plans 46.88 9 Owner`s economic situation 44.12
10 Owner`s norms, values & objectives 40.96 10 Population 42.0711 Owner`s economic situation 38.38 11 Public opinion 40.1612 Forest calamities 36.31 12 Timber processing industry 39.2113 Public opinion 36.14 13 Forest structure 38.7214 Timber processing industry 35.34 14 Climate change 36.3315 Forest structure 34.26 15 Rural Development (Plans/Activities) 36.3116 Rural Development (Plans/Activities) 34.11 16 Technology 34.2417 Technology 31.34 17 Forest road network 32.5918 Forest services and functions 29.06 18 Type of silviculture 31.1119 Forestry paradigms 27.43 19 Forest services and functions 29.9120 Certification 25.79 20 Management costs 26.70
158
R. Navrátil et al. / Lesn. Cas. For. J. 62 (2016) 152–163

impact, with a huge gap between it and other categories in ranking. In sum, according to the Global Active values the STEEP categories Policy, Economy, and Ecology were consid-ered societal domains with the highest importance for future forest management in the regions of Podpoľanie and Kysuce.
From the European perspective, the comparison of STEEP categories by Global Active values revealed both similarities and differences with the Slovak regions. The Policy category was ranked the highest, whereas Technology had the lowest ranking (Table 8). In contrast, in the Slovak regions the Economy category was the second most impor-tant; in INTEGRAL regions the second most important cate-gory was Society. Thus, there were apparent dissimilarities between stakeholders’ perceptions of societal factors in Slo-vak and in other European regions involved in INTEGRAL.
Table 8. STEEP categories and their Global Active values.Podpoľanie region Kysuce region *INTEGRAL regions
Rank STEEP Category
Global AV Rank STEEP
CategoryGlobal
AV Rank STEEP category
Global AV
1. Policy 28.72 1. Policy 28.18 1. Policy 426.862. Economy 25.96 2. Economy 25.89 2. Society 344.723. Ecology 20.54 3. Ecology 22.95 3. Economy 319.284. Society 15.86 4. Society 19.65 4. Ecology 241.955. Technology 8.86 5. Technology 10.7 5. Technology 163.29
* Hinterseer et al. 2014.
3.4. Active/Passive maps – Podpoľanie and KysuceActive/Passive Maps were used for easier and transparent visualization of the results during participatory workshops and subsequent discussion of findings with regional stake-holders. The resulting distribution of factors in maps showed at a glance how strongly each factor acted on all other factors and how strongly it was affected by other factors (Fig. 3).
In Podpoľanie the distribution of factors and their concen-tration in the right upper quadrant demonstrates their dyna-mics as well as their strong connection among each other. Policy factors Subsidies and compensations (POL5), Forest policy and legislation (POL2), and Rural development policy (POL3) clearly formed the group of most dynamic factors. Similarly, the majority of economic and ecological factors were dynamic factors. Factors located in the upper left cor-ner, Ownership structure (POL1), Climate change (ECO3), and Demography development (SOC15), were determined to be active; thus, they were very influential and uncontrol-lable factors. Public opinion (SOC3) fell into the lower right quadrant as the only passive factor. No one factor was deter-mined to be an excluded factor.
The factors in Kysuce were more dispersed. The cur-rent unfavourable state of forests in the region was reflec-ted in the highest positions of the ecological factors Climate change (ECO3), State and structure of forest (ECO1), and Abiotic and biotic harmful factors (ECO2). The latter two fac-tors formed the group of dynamic factors along with Sub-sidies and compensations (POL5), Forest policy and legis-lation (POL2), Forest management costs (ECN5), Qua-lified workforce (SOC2), Forest owners’ economic situa-tion (ECN1), and Timber market (ECN2). Climate change (ECO3) and Forest ownership structure (SOC4) were deter-
Comparison of the Passive values in Podpoľanie and Kysuce revealed that the top five influenced factors (Forest owners’ economic situation, Forest management costs, State and structure of forest, Timber market, and Bioenergy market) were similar. According to their Active and Passive values, six factors (Forest owners’ economic situation, Subsidies and compensations, State and structure of forest, Forest mana-gement costs, Timber market, and Forest policy and legisla-tion) were therefore identified as key factors for future forest management of both the Podpoľanie and Kysuce regions.
3.2. Active and passive values – other INTEGRAL regions Comparison across INTEGRAL regions (Table 6) revealed that Policies; laws and regulations; Timber market; Owner-ship structure; Bioenergy market; Subsidies; and Owner`s norms, values, and objectives were important for future for-est management. Moreover, the first three factors have both the highest active and passive values, considerably higher than other factors. Accordingly, based on the perception of regional stakeholders across Europe, the Policies, laws and regulations, Timber market, and Ownership structure factors were crucial for future forest management in Europe.
If compared to the Slovak regions, the Policies, laws and regulations, Timber market, and Subsidies factors were uni-versal for both Slovak and other European regions. Howe-ver, for stakeholders from the Podpoľanie and Kysuce regi-ons, State and structure of forest, Forest management costs, and Forest owners’ economic situation were also important factors.
3.3. Evaluation of factors according to STEEP categoriesIn terms of frequency of factors within STEEP categories in the Podpoľanie and Kysuce regions, the Policy category had the highest number of factors (Table 7). Comparison across INTEGRAL regions showed similar results. There was a considerable gap between Policy and other categories such as Economy, Society and Ecology. Across all INTEGRAL regions, the Technology category was far behind all other cat-egories.
Table 7. Frequency of factors grouped by STEEP categories.
STEEP category FrequencyPodpoľanie and Kysuce regions INTEGRAL regions
Society 4 85Technology 2 46Economy 4 88Ecology 4 71Policy 5 102
In both Slovak regions, the ranking of STEEP categories according to Global Active values showed similar findings in the number of factors in each category (Table 8). Specifi-cally, in Podpoľanie and Kysuce, the Policy category had not only the highest frequency of identified key factors, but it also had the highest overall impact. The Global Active values of the Economy, Ecology, and Society categories indicated dif-ferences in their relevance despite the same number of fac-tors. In both regions, the Technology category had the least
159
R. Navrátil et al. / Lesn. Cas. For. J. 62 (2016) 152–163

mined to be active factors. The lower left quadrant contained the passive factors Public opinion (SOC3), Bioenergy mar-ket (ECN3), Tourism (ECN4), and Non-wood ecosystem ser-vices (ECO4). Two societal factors, Demography development (SOC1) and Codes of conduct (SOC4), formed the group of excluded factors.
3.5. Selection of key factors according to Active/Passive maps and discussion in participatory workshopsThe visualization of results via the Active/Passive maps (Fig. 3) supported discussion with workshops participants, who helped to detect the subtle differences between the Podpoľanie and Kysuce regions, which in turn aided the final selection of key factors for future forest management in both regions.
Comparison of the Active/Passive maps of Podpoľanie and Kysuce revealed apparent dissimilarities as well as com-monalities between the regions. The most dynamic factors in Podpoľanie were political and in Kysuce were ecological. In other words, in Kysuce the position of factors State and structure of forest (ECO1), and Abiotic and biotic harmful factors (ECO2), mirrored the current poor health of forest stands and excessive incidental felling, which was confirmed by Kysuce’s stakeholders in the workshop discussion.
Looking at the distribution of policy factors (Fig. 3), it is evident that in both regions all factors are in the right upper quadrant or on its border. While the Rural development policy (POL3) was classified by stakeholders in Podpoľanie as a clearly dynamic factor, in Kysuce it was located on the bor-der of passive factors. In both maps, the leftmost policy factor Forest ownership structure (POL4) influenced the remaining factors much more strongly than it was influenced. Despite the diametrically different situation in the ownership struc-ture between these two regions (state ownership predomi-
nance in Podpoľanie; highly fragmented ownership structure in Kysuce), stakeholders in both regions expressed the opi-nion that forest ownership significantly affects forest mana-gement, but it is hard to control its arrangement. Thus, Forest ownership structure was regarded by stakeholders as a stable factor, although stakeholders from Kysuce especially stres-sed the need for an adjustment of fragmented ownership structure.
With the exception of Tourism (ECN4) and Bioenergy market (ECN3, in Kysuce), in both maps all other economic factors were very influential and at the same time very depen-dent. The dynamic factors Forest owners’ economic situation (ECN1), Timber market (ECN2), and Forest management costs (ECN5) were in close proximity, situated furthest to the right of all factors. This illustrates the stakeholders’ percep-tion that those factors significantly affect forest management in their regions but, at the same time, could be seriously influ-enced by other factors. Thus, stakeholders from both regions stated during discussions that these factors might be classi-fied as crucial factors. While the Bioenergy market (ECN3) factor was classified as dynamic factors in Podpoľanie, sur-prisingly, it was classified as a passive factor in Kysuce. Sta-keholders from Kysuce have mentioned that they still consi-der the Timber market factor more important than the Bio-energy market factor.
In both regions, the factor Non-wood ecosystem services (ECO4) had the least importance of all ecological factors that were considered; even in Kysuce the factor was located on the boundary between excluded and passive factors. In both maps, the most affected (rightmost) ecological factor was State and structure of forest (ECO1). Contrariwise, the leftmost ecological factor Climate change (ECO3) illustra-tes the stakeholders’ perception that one of the major eco-logical drivers can be influenced very little.
The distribution of societal factors in both maps showed that in each region just one factor was determined to be dyna-mic. While in Podpoľanie the Codes of conduct (SOC4) was
Fig 3. Active/Passive Maps for Podpoľanie and Kysuce regions (Society – yellow, Technology – grey, Economy – red, Ecol-ogy – green, Policy – orange).
160
R. Navrátil et al. / Lesn. Cas. For. J. 62 (2016) 152–163
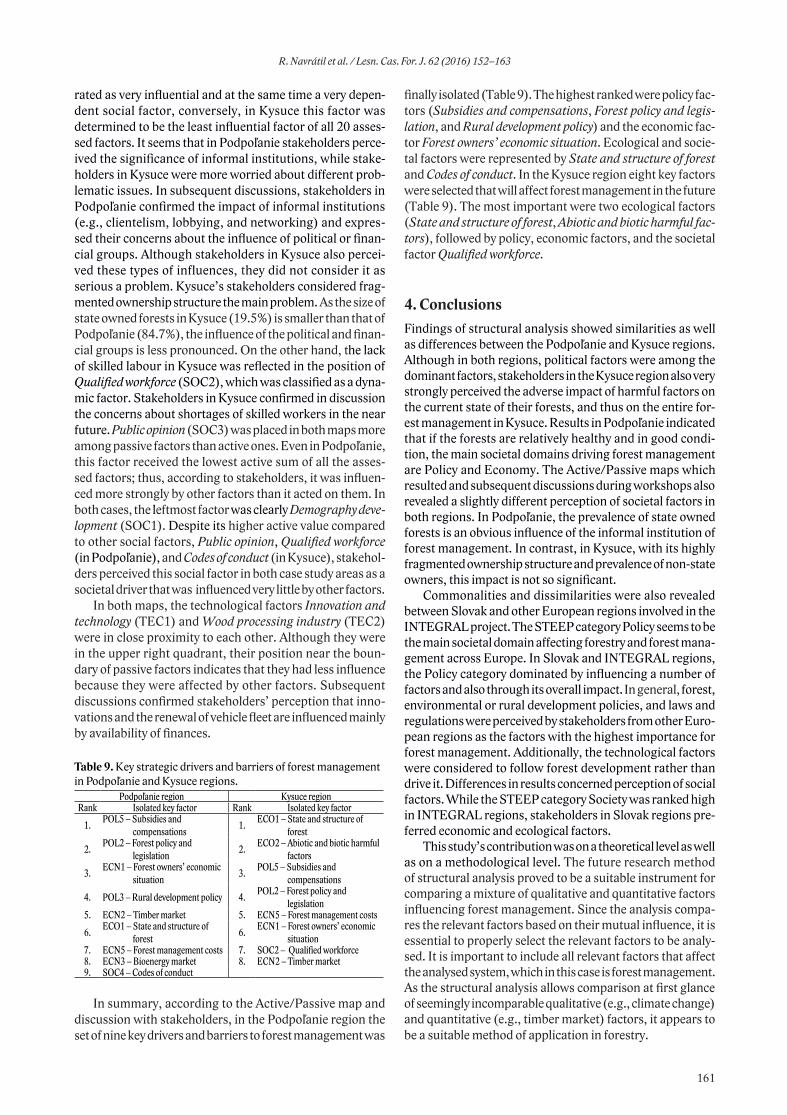
rated as very influential and at the same time a very depen-dent social factor, conversely, in Kysuce this factor was determined to be the least influential factor of all 20 asses-sed factors. It seems that in Podpoľanie stakeholders perce-ived the significance of informal institutions, while stake-holders in Kysuce were more worried about different prob-lematic issues. In subsequent discussions, stakeholders in Podpoľanie confirmed the impact of informal institutions (e.g., clientelism, lobbying, and networking) and expres-sed their concerns about the influence of political or finan-cial groups. Although stakeholders in Kysuce also percei-ved these types of influences, they did not consider it as serious a problem. Kysuce’s stakeholders considered frag-mented ownership structure the main problem. As the size of state owned forests in Kysuce (19.5%) is smaller than that of Podpoľanie (84.7%), the influence of the political and finan-cial groups is less pronounced. On the other hand, the lack of skilled labour in Kysuce was reflected in the position of Qualified workforce (SOC2), which was classified as a dyna-mic factor. Stakeholders in Kysuce confirmed in discussion the concerns about shortages of skilled workers in the near future. Public opinion (SOC3) was placed in both maps more among passive factors than active ones. Even in Podpoľanie, this factor received the lowest active sum of all the asses-sed factors; thus, according to stakeholders, it was influen-ced more strongly by other factors than it acted on them. In both cases, the leftmost factor was clearly Demography deve-lopment (SOC1). Despite its higher active value compared to other social factors, Public opinion, Qualified workforce (in Podpoľanie), and Codes of conduct (in Kysuce), stakehol-ders perceived this social factor in both case study areas as a societal driver that was influenced very little by other factors.
In both maps, the technological factors Innovation and technology (TEC1) and Wood processing industry (TEC2) were in close proximity to each other. Although they were in the upper right quadrant, their position near the boun-dary of passive factors indicates that they had less influence because they were affected by other factors. Subsequent discussions confirmed stakeholders’ perception that inno-vations and the renewal of vehicle fleet are influenced mainly by availability of finances.
Table 9. Key strategic drivers and barriers of forest management in Podpoľanie and Kysuce regions.
Podpoľanie region Kysuce regionRank Isolated key factor Rank Isolated key factor
1. POL5 – Subsidies and compensations 1. ECO1 – State and structure of
forest
2. POL2 – Forest policy and legislation 2. ECO2 – Abiotic and biotic harmful
factors
3. ECN1 – Forest owners’ economic situation 3. POL5 – Subsidies and
compensations
4. POL3 – Rural development policy 4. POL2 – Forest policy and legislation
5. ECN2 – Timber market 5. ECN5 – Forest management costs
6. ECO1 – State and structure of forest 6. ECN1 – Forest owners’ economic
situation7. ECN5 – Forest management costs 7. SOC2 – Qualified workforce8. ECN3 – Bioenergy market 8. ECN2 – Timber market9. SOC4 – Codes of conduct
In summary, according to the Active/Passive map and discussion with stakeholders, in the Podpoľanie region the set of nine key drivers and barriers to forest management was
finally isolated (Table 9). The highest ranked were policy fac-tors (Subsidies and compensations, Forest policy and legis-lation, and Rural development policy) and the economic fac-tor Forest owners’ economic situation. Ecological and socie-tal factors were represented by State and structure of forest and Codes of conduct. In the Kysuce region eight key factors were selected that will affect forest management in the future (Table 9). The most important were two ecological factors (State and structure of forest, Abiotic and biotic harmful fac-tors), followed by policy, economic factors, and the societal factor Qualified workforce.
4. ConclusionsFindings of structural analysis showed similarities as well as differences between the Podpoľanie and Kysuce regions. Although in both regions, political factors were among the dominant factors, stakeholders in the Kysuce region also very strongly perceived the adverse impact of harmful factors on the current state of their forests, and thus on the entire for-est management in Kysuce. Results in Podpoľanie indicated that if the forests are relatively healthy and in good condi-tion, the main societal domains driving forest management are Policy and Economy. The Active/Passive maps which resulted and subsequent discussions during workshops also revealed a slightly different perception of societal factors in both regions. In Podpoľanie, the prevalence of state owned forests is an obvious influence of the informal institution of forest management. In contrast, in Kysuce, with its highly fragmented ownership structure and prevalence of non-state owners, this impact is not so significant.
Commonalities and dissimilarities were also revealed between Slovak and other European regions involved in the INTEGRAL project. The STEEP category Policy seems to be the main societal domain affecting forestry and forest mana-gement across Europe. In Slovak and INTEGRAL regions, the Policy category dominated by influencing a number of factors and also through its overall impact. In general, forest, environmental or rural development policies, and laws and regulations were perceived by stakeholders from other Euro-pean regions as the factors with the highest importance for forest management. Additionally, the technological factors were considered to follow forest development rather than drive it. Differences in results concerned perception of social factors. While the STEEP category Society was ranked high in INTEGRAL regions, stakeholders in Slovak regions pre-ferred economic and ecological factors.
This study’s contribution was on a theoretical level as well as on a methodological level. The future research method of structural analysis proved to be a suitable instrument for comparing a mixture of qualitative and quantitative factors influencing forest management. Since the analysis compa-res the relevant factors based on their mutual influence, it is essential to properly select the relevant factors to be analy-sed. It is important to include all relevant factors that affect the analysed system, which in this case is forest management. As the structural analysis allows comparison at first glance of seemingly incomparable qualitative (e.g., climate change) and quantitative (e.g., timber market) factors, it appears to be a suitable method of application in forestry.
161
R. Navrátil et al. / Lesn. Cas. For. J. 62 (2016) 152–163

Using Active/Passive values was particularly appropriate for evaluation of the overall impact of individual STEEP cate-gories. Active/Passive maps allowed more detailed compa-rison of the various factors that were considered. The Par-menides EidosTM analytical tool allowed visualization of the individual stakeholder’s perception of a factor’s importance. Distribution of factors in the map’s quadrants is much more readable and transparent as simply Active or Passive values.
The application of the structural analysis in participatory manner proved to be very suitable for identification of drivers and barriers to forest management. For correct implementa-tion of the method it was necessary that the workshop parti-cipants represented different interest groups of regional sta-keholders. Our results confirmed other researches that sta-keholder’s participation in forestry decision-making might provide regional expertise, increase the legitimacy of final outcome (e.g. Beckley et al. 2005) and strength the involve-ment of local stakeholders in policy-making processes (e.g. Sarvašová 2014; Marzano et al. 2015; Sarvašová 2016).
AcknowledgmentsThis research study has received funding from the European Union’s Seventh Programme for research, technological development and demonstration under grant agreement No. 282887.
ReferencesAdams, W. M., Jeanreneaud, S., 2008: Transition to Sustainability:
Towards a Diverse and Humane World. IUCN, Gland, Swit-zerland.
Adams, W. M., 2009: Conservation, Carbon and Transition to Sus-tainability. Fauna & Flora International, Oryx, 42:469–470.
Arnouts, R., ARTS, B., 2009. Environmental governance failure: the ‘dark side’ of an essentially optimistic concept. In: Arts, B., Lagendijk, A. and van Houtum, H. (eds.), 2009: The disoriented state. Shifts in governmentality, territoriality and governance. Springer, p. 201–230.
Arts, B., Leroy, P., Van tatenhove, J., 2006: Political Moderniza-tion and Policy Arrangements: A Framework for Understanding Environmental Policy Change. Public Organization Review. 6:93–106.
Beckley, T., Parkins, J., Sheppard, S., 2005: Public Participation in Sustainable Forest Management: A Reference Guide. Edmon-ton, Sustainable Forest Management Network, 60.
Betuch, H., Polkau, M., Riemer, A., Schüll, E., Winkler, J., Zhirk-ova, I., 2015: Explorative Future Scenarios for Integrated Forest Management in Europe – An Overview of Scenario Storylines Developed in the Project INTEGRAL, Fraunhofer MOEZ, Leipzig, 63 p.
Bezák, P., Mitchley, J., 2014: Drivers of change in mountain farm-ing in Slovakia: from socialist collectivization to the common agricultural policy. Regional Environmental Change, 14:1343–1356.
Bošeľa, M., Sedmák, R., Sedmáková, D., Marušák, R., Kulla, L., 2014: Temporal shifts of climate–growth relationships of Nor-way spruce as an indicator of health decline in the Beskids, Slo-vakia. Forest Ecology and Management, 325:108–117.
Brodrechtová, Y., Navrátil, R., Sedmák, R., Tuček, J., 2016: Using the politicized IAD framework to assess integrated forest man-agement decision making in Slovakia. Land Use Policy.
Clement, F., 2010: Analysing decentralised natural resource gov-
ernance: proposition for a “politicised” institutional analysis and development framework. Policy Science, 43:129–156.
Glenn, J. C., Gordon, T. J., Jakil, A., 2005: Frontiers of futures research: What’s next?, Technological Forecasting and Social Change, Volume 72.
Glenn, J. C., Gordon, T. J., (eds.), 2009: The Millennium Project: Futures Research Methodology, Version 3.0.
Hinterseer, T., Koulelis, P., Jonsson, R., McDermott, C. L., Sall-näs, O., Schröter, W. et al., 2014: Synthesis Report on Inte-grated Forest Management Scenarios in Europe including the National Case Study Reports and the Report on the Role of EU Commodity Consumption, University of Applied Sciences Salzburg, 1517 p.
Hlásny, T., Fabrika, M., Sedmák, R., Barcza, Z., Štepánek, P., Turčáni, M., 2010: Future of forests in the Beskids under cli-mate change. In: Hlásny, T., Sitková, Z.(eds.): Spruce forests decline in the Beskids, National Forest Centre Zvolen & Czech University of Life Sciences Prague & Forestry and Game Man-agement Research Institute Jíloviště - Strnady, p. 157–173.
Hlásny, T., Sitková, Z. (eds.), 2010: Spruce forests decline in the Beskids. National Forest Centre - Forest Research Institute Zvolen & Czech University of Life Sciences Prague & Forestry and Game Management Research Institute Jíloviště - Strnady, 184 p.
Kulla, L., Merganič, J., Marušák, R., 2009: Analysis of natural regeneration in declining spruce forests on the Slovak part of the Beskydy Mts. Beskydy, 2:51–62.
Konôpka, J., 2004: Forest decline, especially spruce forests in Slo-vakia in the second half of the 20th century and measures to improve the situation. In: Zúbrik, M. (ed.): Decline of Spruce forest stands. Zvolen, Forest Research Institute Zvolen.
Marzano, M., Dandy, N., Bayliss, H. R., Porth, E., Potter, C., 2015: Part of the solution? Stakeholder awareness, information and engagement in tree health issues. Biological Invasions, 17: 1961–1977.
Mojses, M., Petrovič, F., 2013. Land use changes of historical struc-tures in the agricultural landscape at the local level – Hriňová case study. Ekológia, 32:1–12.
Navrátil, R., Sedmák, R., Brodrechtová, Y., Smreček, R., Tuček, J., 2014: The tool Parmenides EIDOS helps to see into the future In: Enviro-i-Fórum 2014: Conference Proceedings, Zvolen, p. 99–109.
Ostrom, E., 2005: Understanding Institutional Diversity. Princeton University Press, 349 p.
Ostrom, E., 2007: Institutional rational choice: an assessment of the institutional analysis and development framework. In: Sabatier, P. (ed.): Theories of the Policy Process, 2nd ed. Westview Press, Boluder (Co.), p. 21–64.
Riemer, A., Betuch, H., Zhirkova, I., Winkler, J., Wappler, S., Storch, S., 2013: Impact of selected structural factors on the forest-based sector in the European Union, Fraunhofer MOEZ, Leipzig, 61 p.
Sabatier, P., Weible, C., 2007: The Advocacy Coalition Framework: Innovations and Clarifications. In: Sabatier, P. (ed.): Theories of the Policy Process. Westview Press, Boulder (Co.), p. 189–220.
Sarvašová, Z., Dobšinská, Z., Šálka, J., 2014: Public participation in sustainable forestry: The case of forest planning in Slovakia. iForest – Biogeosciences and Forestry, 7:414–422.
Sarvašová, Z., Dobšinská, Z., 2016: Provision of ecosystem services in mountain forests - case study of experts’ and stakeholders’ perceptions from Slovakia. Journal of Forest Science, 62:380–387.
Sitková, Z., Pavlenda, P., Pavlendová, H., Priwitzer, T., Hlásny, T., 2010: Air pollution load and nutrient status of Norway spruce forest stands in the north-western part of Slovakia. Beskydy, 3:93–102.
162
R. Navrátil et al. / Lesn. Cas. For. J. 62 (2016) 152–163

Schüll, E., Schröter, W., 2013: Guideline for the conduction of participatory scenario processes in INTEGRAL, University of Applied Sciences Salzburg, 42 p.
Sotirov, M., Storch, S., Cappelmann, L., Sotomayor, M., Sergent, A., Deuffic, P. et al., 2014: WP 3.1 cross-case synthesis report. Final draft: 30th April 2014. INTEGRAL.
Sotirov, M., Deuffic, P., 2015. United in diversity? Typology, objec-tives and socio-economic characteristics of public and private forest owners in Europe. In: Živojinović, I., Lidestav, G., Feli-ciano, D., Hujala, T., Lawrence, A., Weiss, G., 2015: Concepts, methods and findings in forest ownership research in Europe. Mid-term Proceedings of the COST Action FP1201 Forest Land Ownership Changes in Europe: Significance for Management and Policy FACESMAP. EFICEEC-EFISEE Research Report. University of Natural Resources and Life Sciences, Vienna, 120 p. [Online publication].
Tuček, J., Navrátil, R., Sedmák, R., Brodrechtová, Y., Smreček, R., 2015: Participatory scenarios and backcasting in strategy planning of forest management. Zvolen, Technical University in Zvolen, 332 p.
Vakula, J., 2011: State of Forest Health and Appearance of Harm-ful Factors in the Regions of Slovakia according to inspectors of Forest Protection Service for 2010. los.sk, [online 20. Sep-Sep-tember 2015].
Volz, K. R., 2006: Prinzip Nachhaltigkeit - Ein Beitrag zum Umgang mit konstruierten Idealbildern. AFZ-Der Wald 61: 1154–1157.
Winkel, G., Kaphengst, T., Herbert, S., Robaey, Z., Rosenkranz, L., Sotirov, M., 2009: EU policy options for the protection of European forests against harmful impacts. Final Report to the tender: ENV.B.1/ETU/2008/0049: OJ 2008/S 112 – 149606.
163
R. Navrátil et al. / Lesn. Cas. For. J. 62 (2016) 152–163

Ultrasonic technique for evaluation of initial stadium of wood degradation in exterior conditions without ground contact
Miloš Pánek*, Kamil Trgala
Czech University of Life Sciences Prague, Faculty of Forestry and Wood Sciences, Kamýcká 129, CZ – 165 21 Prague 6 – Suchdol, Czech Republic
Abstract The experiment evaluate the possibility of using non-destructive measure techniques of the mechanical properties of wood using ultra-sonic to determine the initial stages of degradation by biotic and abiotic factors in the outdoors without ground contact. Nine tree spe-cies were tested: spruce, pine, Douglas fir, larch, oak, black locust, maple, poplar and alder. Test specimens were exposed to the exterior according to EN 927-3, Prague-Suchdol in the Czech Republic. Measuring changes in velocity of ultrasonic using the apparatus Ultraso-nic Timer and moisture content change were measured after 1, 2, 3, 4 and 6 months. Certain ways of detecting the initial stages of damage have been demonstrated to trees oak, larch and spruce. The initial stages of damage by molds at non-durable maple, alder and poplar had not a clear impact on the decrease in the speed of ultrasonic, as well as hairline surface cracks at the Douglas fir.Key words: wood; exterior; biotic and abiotic degradation; detection; ultrasonic velocity
Editor: Bohdan Konôpka
*Corresponding author. Miloš Pánek, e-mail: [email protected]
1. IntroductionExterior wood applications are widely used in building indus-try, in the garden architecture and for outdoor mobiliar, but also in various wood structures such as fences, wooden houses, bridges, etc. (Štefko & Reinprecht 2004). The advan-tages of wood as renewable raw material can be sorted by excellent workability, strength and structural characteristics in comparison with steel, ceramic and silicates (Požgaj et al. 1993). The downside is, particularly for non-durable wood species, the possibility of damage to the timber by biotic and abiotic factors. Especially fungi and insects are able to com-pletely disrupt the static function of the timber element or the whole building in a relatively short period of several years (Schmidt 2006; Reinprecht 2008). Abiotic degradation, par-ticularly atmospheric degradation is also not negligible detri-mental factor for the function of wood in construction. First cause esthetic color changes (Evans 2008), but there is also a significant formation of cracks that allow deeper penetration of water into the timber. This creates better conditions for the subsequent attack by decay fungi, which are tied up with wood moisture above 20%. For proper function of wooden buildings and structures is required regular maintenance and inspection status. To determine the degree of damage to the timber is possible to use a variety of diagnostic procedures (Koiber & Drdácký 2015). The simplest is a visual assess-ment, which is necessarily subjective, so it is advisable to use instrumentation and technical methods. These methods can be destructive – based on assessment of mechanical tests and as well as non-destructive techniques nowadays used in industrial practice (Rohanová 2013). Besides the use of sound (Bucur 2006), optical methods, including the use of
microscopy and SEM (Panek et al. 2009), of using radiog-raphy (Gardner et al. 1980) is available the use of ultrasonic.
Measurement of ultrasonic speed is suitable for determi-ning the mechanical properties of wood and damage of the elements (Bucur 2006; Tippner et al. 2016). Relatively well-researched areas is detection of damage by wood-destroying fungi (Wilcox 1988; Reinprecht & Hybky 2011), or wood-destroying insects (Reinprecht & Panek 2013).
Non-destructive testing using ultrasonic would allow quick and efficient detection of incipient damage and predict the next stage of serious action of atmospheric factors cau-sing cracks (Raczkowski 1980) and wood-destroying fungi causing white or brown rot (Wilcox 1988). Less explored area is the ability to detect damage to the timber at the initial stage of exposure outdoors (Raczkowski et al. 1999; Ober-hofnerová et al. 2016). Raczkowski et al. (1999) have demon-strated that even at low mass loss <1% due to the decay can be used detection method combining acoustic emission per-pendicular with the grain test compression in radial direc-tion. Research Oberhofnerová et al. (2016) focused on tes-ting spruce and oak exposed to weathering for four months. A trend of the decline in the velocity of propagation of ultra-sonic was observed but was not statistically significant.
For the detection of damage of the timber by waves of ultrasonic are used mainly anatomical measurements of the transverse directions (Kloiber & Drdácký 2015). It comes both from the possibility of access to most of the built-in ele-ments in wooden structures such as bridges, timber beams, poles etc. The cellular elements forming in transverse direc-tions with more interconnections as it is known from wood anatomy (Wagenführ 2002),brings further advantage of this detection method. Higher amount of damaged cell walls, or
DOI: 10.1515/forj-2016-0016
ORIGINAL PAPER http://www.nlcsk.sk/fj/
Lesn. Cas. For. J. 62 (2016) 164–168
To determine changes in velocity of ultrasonic in the experiment was used equation (Eq. 2):
where subscript v0 denotes the ultrasonic velocity values before exposure and v1 denotes the values after exposure.
During the experiment was before each measurement determined moisture content of wood, which is an impor-tant factor affecting the speed of ultrasonic (Mishiro 1995). Moisture content was calculated by weight method accor-ding to the equation (Eq. 3):
where mw is the weight of wet wood and m0 is the weight of absolutely dry wood.
Further was conducted a visual monitoring of evidence of cracks, molds and other damages with tenfold magnification.
For evaluation of the data with basic statistical charac-teristics, correlation tests and Duncan‘s test was used soft-ware Excell and Statistica.
3. ResultsResults of the measurement of ultrasonic velocity changes are shown in Fig. 2 and 3. Moisture content changes during exposure, affecting the measurement results are shown in Fig. 4. The correlation between moisture content, occurrence of initial timber damage and the drop velocity of ultrasonic is analyzed in Fig. 5 and Table 3.
Figures 2 and 3 indicates for hardwoods and softwoods some similarities and differences. For all tested tree species, there were various Δv during exposure, therefore it is obvious that the decisive factors in addition to the length of exposure and the variation of moisture content (Fig. 3), or other fac-tors that are further analyzed in Figs. 5 and Table 3. Overall, it can be deducted that for softwoods was a great variance of measured values (Fig. 2), making difficult correct interpre-tation of the results. By contrast for hardwoods were mea-sured values Δv relatively low and the variability of the ave-
cracks which arise mainly in the longitudinal direction may indicate attenuation of the ultrasonic velocity.
The aim of this experiment was to explore the possibi-lity of using ultrasonic velocity in the radial direction for the determination of the early stages of degradation of wood in the exterior without contact with the ground (use class 3 according to EN 335-2013) with nine tree species: spruce, pine, Douglas fir, larch, oak, black locust, maple, poplar and alder.
2. Material and MethodsSamples of nine tree species (Table 1) with dimensions of 375 × 78 × 20 mm (L × R × T) with the initial moisture content of 12% were exposed to the exterior without contact with the ground in a rack at 45 degrees south according to EN 927- 3 (2006). Exposure place was Prague-Suchdol time from 15th December 2014 to 15th June 2015 and the climatic conditi-ons during the experiment are shown in Table 2.
Measurement of ultrasonic velocity (v) with number of 12 measurements for each tree species was performed initially and after 1, 2, 3, 4, 6 months of exposure using the appara-tus Fakopp Ultrasonic Timer in the radial direction (Fig. 1) and for the calculation was used equation (Eq. 1):
Size is 78 mm in this experiment.
Fig. 1. Scheme of measurements and used testing equipment Fa-kopp Ultrasonic Timer.
[1]
[2]
[3]
Table 1. Tested wood species and their initial characteristics (initial value of ultrasonic velocity in radial direction, density and natural durability against fungi).
Wood species Latin name Ultrasonic velocity [m s–1] Density [kg m–3] Natural durability against fungi (EN 350-2015)
Norway spruce Picea abies L. Karst 858.75 (60.60) 533 4Scots Pine Pinus sylvestris L. 1095.47 (223.42) 698 3–4Douglasce fir Pseudotsuga menziesii (Mirb.) Franco 925.65 (29.03) 605 3European larch Larix decidua [Mill.] 854.06 (38.89) 559 3–4English oak Quercus robur L. 1451.34 (59.23) 710 2Black locust Robinia pseudoacacia L. 1367.57 (53.03) 827 1–2Poplar Populus sp. 1016.57 (20.77) 413 5Sycamore maple Acer pseudoplatanus L. 1183.61 (53.00) 599 5Black alder Alnus glutinosa (L.) Gaertn 1258.83 (203.05) 534 5
Note: Numbers in parentheses are standard deviations.
Table 2. An overview of climatic conditions during 12 months of natural weathering.Variable/month 0–1 1–2 2–3 3–4 4–5 5–6
Average temperature [°C] 3.2 0.7 3.4 7.0 12.3 15.9Average max. temperature [°C] 5.5 3.1 7.8 12.5 17.9 21.3Average min. temperature [°C] –0.3 –1.8 –1.1 1.5 6.4 10.7Average RH [%] 76.1 78.4 70.7 63.5 60.7 62.2Total precipitation [mm] 21.9 9.1 11.8 26.3 39.9 32.3Average global solar rad. [kJ/m2] 2086 3405 7453 12567 18164 19039
165
M. Pánek, K. Trgala / Lesn. Cas. For. J. 62 (2016) 164–168

rage values of the individual exposure times was not as great as for most softwoods (Fig. 3).
Fig. 2. Two sides confidence intervals of Δv in softwood species during exterior exposure.
Fig. 3. Two sides confidence intervals of Δv in hardwood species during exterior exposure.
Moisture content of samples decreases mostly during exposure and naturally follows the effects of climate factors shown in the Table 2.
Visual evaluation of samples revealed the presence of molds or wood-stain fungi on non-durable hardwood spe-cies, maple, alder and poplar 3 months after exposure and gradually grew up. For Douglas fir wood occurred hairline surface cracks and the other woody species including the above mentioned there were changes of color, graying, which is on a wood exposed outdoors well known (Evans 2008).
Linear relationship between ΔV and MC for all of the trees is relatively low (R2 = 0.11), what makes the assumption that changes in the velocity of propagation of ultrasonic to test
tree species were affected mainly by other factors. Mainly by incipient degradation caused by atmospheric agents and biodegradation (Fig. 5).
Fig. 4. Changes of moisture content (MC) of wooden samples dur-ing exterior exposition.
Fig. 5. Correlation between Δv and MC for all tested wood.
Separate analyses of each tested trees were conducted in next step (Table 3).
Table 3. Linear correlation between Δv and MC for each kind of wood and Duncan´s test for Δv changes after 1, 2, 3, 4 and 6 month of weathering.
Kind of wood Linear correlation
Coeficient of
determination [R2]
Duncan test*
Spruce Δv = −26.05 + 1.76*MC 0.56 d (only 6 months versus others c)
Pine Δv = 0.24 + 0.43*MC 0.07 d (for all cases)Douglas fir Δv = 13.26 − 0.98*MC 0.67 —
Larch Δv = −14.63 + 1.09*MC 0.30 d (only 6 months versus 1 and 3 months c)
Oak Δv = −4.67 + 0.11*MC 0.06d (only 1 months versus 2 and 3 monts c and versus 4 months b; 4 months versus 6 months c)
Black locust Δv = 0.79 − 0.22*MC 0.12 —Maple Δv = 9.89 − 1.06*MC 0.62 —Poplar Δv = 7.21 − 0.71*MC 0.77 —Alder Δv = 4.10 − 0.65*MC 0.79 —
Note: Duncan´s tests for each kind of wood and months of exposition was done for wood species, which did not confirm decrease of ultrasonic velocity with increase of moisture content in range 0 –Fi-bre saturation point (FSP): 99.9% significance level (a); 99% significance level (b); 95% significance level (c); and less as 95% significance level at p ³ 0.05 (d).“—“: wood species, which confirmed decrease of ultrasonic velocity with increase of moisture content in range 0 – Fibre saturation point (FSP).
Spruce Pine Douglas fir Larch
Time of exposure [months]
∆v [
%]
1 month 2 months 3 months 4 months 6 months–16
–12
–8
–4
0
4
8
12
16Changes of ultrasonic velocity during exterior exposure
Oak Black locust Maple Poplar Alder
Time of exposure [months]
∆v [
%]
1 month 2 months 3 months 4 months 6 months
–16
–12
–8
–4
0
4
8
12
16
Changes of ultrasonic velocity during exterior exposure
0
5
10
15
20
25
MC
[%
]
Wood specie
1 month 2 months 3 months
4 months 6 months
SprucePin
e
Dougla
s fir
LarchO
ak
Black lo
cust
Poplar
Maple
Alder
Δv
[%]
Linear correlation between Δv and MC of tested wooden samples
5 10 15 20
MC [%]
-10
-5
0
–5
–10
y = 0,4969*x – 6,8086;
R = 0,11302
166
M. Pánek, K. Trgala / Lesn. Cas. For. J. 62 (2016) 164–168
In Table 3 is analysed decreasing of ultrasonic velocity in dependence on the increase in moisture content. For wood maple, poplar, alder, black locust and Douglas fir, this depen-dence is confirmed (in addition to the black locust with high coefficient of determination), and therefore we can assume that it was the most important factor causing attenuation of ultrasonic. On the contrary, trees oak, spruce, pine and larch doesn’t confirm this trend, which makes the assumption of superiority of other influences caused by the degradation of wood. Therefore, their significance was further analysed for each tree species separately using Duncan’s test for different levels of significance (Table 3). For oak and pine was corre-lative dependence relatively low (see Coefficient of determi-nation in Table 3), but for oak were found statistically signi-ficant decreases of ultrasonic velocity at lower moisture con-tent after 6 months of exposure. The same results were also observed with spruce and larch, where have been recorded even higher coefficient of determination (Table 3).
4. DiscussionFor wood we can assume that with a decrease in moisture content within 0 - FSP will increase the speed of ultrasonic (Mishiro 1995; Montero et al. 2015), what was confirmed for Douglas fir, black locust, maple, poplar and alder. Thus, for these kinds of wood, the ultrasonic cannot clearly detect the initial stages of damage. This was reflected mainly in non-durable trees maple, poplar and alder, which was visible mold or wood-stain fungi damaged, but did not show what is expected to drop of ultrasonic velocity. Conversely, sim-ply copying the changes in humidity (Table 3). In Wilcox (1988) and a depth of Reinprecht (2011) was observed to reduce the speed of sound, but only at higher mass loss as 5 – 10% (Wilcox 1988). Such a big mass loss cannot be assu-med after just short-term exposure and as effects of wood coloring fungus (Fojutowski 2004). Conversely Raczkowski et al. (1999) demonstrated the sensitivity of ultrasonic detec-tion of damage to the timber by fungi already when the mass loss is less than 1%, but in combination with perpendicular to grain compression test in radial direction.
For woods spruce, pine, larch and oak cannot be assumed that the drop in moisture content led to an increase in velo-city of ultrasonic (see linear correlation in Table 3). Interes-ting result is the significant decrease in velocity of ultrasonic in spruce after 6 months of exposure that may relate to the fact that out of the softwoods has the lowest natural durabi-lity (Table 1). Although there was not found the evidence of fungus infestation, spruce belongs to the class of durability 4 (EN 350). Exposure of spruce to outdoor applications - the use of class 3 (EN 335) – without a barrier or chemical pro-tection is not recommended (EN 460). Ultrasonic propa-gation velocity changes in pine were not statistically signifi-cant for any of the tested months. For larch, like oak it is inte-resting to note that despite the low moisture content after 6 months of exterior exposure the velocity of ultrasonic in the radial direction was the lowest in several cases even signifi-cantly compared to the other values (Fig. 2 – 4 and Table 3). It is an interesting result because they are wood species with a relatively high natural durability (EN 350), which are often
used in outdoor applications and they can withstand long term exposure of biotic factors (Reinprecht 2008). Expla-nation is possible by a high content of extractive substan-ces in these woods, if larch arabinogalactans and in case of oak tannins (Bučko & Šutý 1988) which, after leaching from the cell walls caused the reduction of the velocity. This effect was confirmed also in work Farvardin et al. (2015) for per-sian silk wood. The effect of extractive substances leaching from some tree species has to be calculated using ultrasound as detection method in practice.
Oberhofnerová et al. (2016) investigated the effect of the exterior load of spruce and oak wood in outdoor areas without ground contact. There was observed a decrease in velocity of ultrasonic in native wood, but statistical signifi-cance was not demonstrated. It could be caused on the one hand by a shorter exposure time - only 4 months, on the other hand, the measurement in the longitudinal direction not so sensitively detects a beginning damage wood, due to fewer connection of cellular elements.
In contrast, the pine and Douglas fir resins and black locust extracts appearing to have stabilizing effect on the weather. On the basis of these results look out these extracts more stable as oak tannins.
Black locust belongs to a class of 1 – 2 natural durability (EN 350), and in pine wood is known relatively high con-tent of water resistant resins (Bučko & Šuty 1988), which also provide some hydrophobic protecting (Oberhofnerová & Panek 2016). Douglas fir also contains extractive sub-stances based resins but also biflavonoids dihydroquerce-tin, which causes a relatively high natural durability (Tay-lor et al. 2003).
From these results it is clear that the mere use of ultra-sonic does not provide sufficiently accurate information about initial wood damage by biotic and abiotic factors. It is mainly due sensitivity of the method, which is probably bet-ter suited to the detection of more serious damage of struc-tural timber, where the results are conclusive (Wilcox 1988). Initial stages are better diagnosed by the direct assessment of microscopic analyzes, which are visible hyphae infiltrating of cellular structure of wood (Pánek et al. 2009), or micro-ruptures caused by the abiotic degradation (Masaryková et al. 2010). More sensitive detection method seems to be the use of destructive testing - impact strength in bending (Sonderegger et al. 2015). This sensitively respond even to wood-staining fungi that still does not significantly deform cell walls of wood (Fojutowski 2004).
The disadvantage of both methods is the need to remove test samples from the tested structure and their subsequent analysis in the laboratory. By this method can be created reliable overview of the state of the structure, but more pre-cise and intensive measurements have to be done.
5. ConclusionFrom the above experimental results, it is possible to provide the following conclusions:1. The speed of ultrasonic in wood is affected during the ini-tial stages of degradation of wood exposed outdoors without ground contact without shelter, although the changes are
167
M. Pánek, K. Trgala / Lesn. Cas. For. J. 62 (2016) 164–168
relatively low. Statistically significant decrease was obser-ved in some kinds of tested woods: spruce, larch and oak, especially after 6 months of exposure. 2. Considerable infl uence as a degradation of biotic and abi-Considerable influence as a degradation of biotic and abi-otic agents is in the early stages of exposure for most kinds of wood tested, has especially fluctuations in wood moisture content due to the local climatic conditions. Therefore, this factor has to be calculated at any non-destructive testing of structures using the ultrasonic.3. There was not confirmed the possibility of using ultrasonic to determine the initial stages of fungal damages (Mainly by the molds or the wood-staining fungi) in non-durable woody species tested: maple, poplar and alder.4. Based on these results it can be stated that the mere use of ultrasonic as a screening method of initial stages of timber damage is inadequate and does not provide a perfect idea of their range in wood. Analysis can be refined using microsco-pic analysis and SEM analysis of damage. Another option is providing of destructive analysis where, for example, impact strength in bending sensitively detects the already emerging biotic damage. The disadvantage of both is the higher effort, the need for the sampling and subsequent laboratory eva-luation.
AcknowledgementThis research was supported by projects QJ1520006 of the Ministry of Agriculture of the Czech Republic.
ReferencesBucur, V., 2006: Acoustic of Wood. Berlin, Springer-Verlag, 455 p.Bučko, J., Šutý, L., Košík, M., 1988: Chemické spracovanie dreva.
Bratislava, Alfa, 312 p. EN 335, 2013: Durability of wood and wood-based products – Use
classes: Definitions, application to solid wood and wood-based panels. European Commitee for Standardization, Brussels, Bel-gium.
EN 350, 2015: Durability of wood and wood-based products – Testing and classification of the resistence to the biological agents, the permeability to water and the performance of wood and wood-based materials. European Commitee for Standar-dization, Brussels, Belgium.
EN 460, 1994: Durability of wood and wood-based products. Natu-ral durability of solid wood. Guide to the durability require-ments for wood to be used in hazard classes. European Com-mitee for Standardization, Brussels, Belgium.
EN 927-3, 2000: Paints and varnishes - Coating materials and coa-ting systems for exterior.
wood - Part 3: Natural weathering test. European Commitee for Standardization, Brussels, Belgium.
Evans, P. D., 2008: Weathering and photo-degradation of wood. Development of Wood Preservative Systems, ACS Washington DC – USA, p. 69–117.
Farvardin, F., Roohnia, M., Lashgari, A., 2015: The effect of extrac-tives on acoustical properties of persian silk wood (Albizia julibrissin). Maderas-Ciencia Y Tecnologia, 17:749–758.
Fojutowski, A., 2004: The effect of primary blue-staining fungi on the strength properties of Scots pine sapwood. IRG/WP/04-10515, Ljubljana.
Gardner, W. D., Jonston, R. S., Pitt, W., 1980: Detecting defects in standing poles by X-ray techniques. IRG/WP 2132, Stockholm.
Kloiber, M., Drdácký, M., 2015: Diagnostika dřevěných konstruk-cií. Praha, ČKAIT – Praha, 169 p.
Masaryková, M., Pánek, M., Reinprecht, L., 2010: Micro-structural analysis of coatings with nanoscale particles after ageing in Xenotest. Wood structure and properties ´10, Zvolen: Arbora Publishers, p. 209–216.
Mishiro, A., 1995: Ultrasonic velocity in wood and its moisture content. Effects of moisture content gradients on ultrasonic velocity in wood. Mokuzai Gakkaishi, 42:211–215.
Montero, M.J., de la Mata, J., Esteban, M., Hermoso, E., 2015: Influence of moisture content on the wave velocity to estimate the mechanical properties of large cross-section pieces for structurul use of Scots pine from Spain. Maderas Ciencia y tecnología, 17:407–420
Oberhofnerová, E., Arnetová, K., Holeček, T., Borůvka, V., Bomba, J., 2016: Determination of correlation between destructive and nondestructive test methods applied on modified wood exposed to natural weathering. BioResources, 11:5155–5168.
Oberhofnerová, E., Pánek, M., 2016: Surface wetting of selected wood species by water during initial stages of weathering. Wood Research, 61:545–552.
Pánek, M., Reinprecht, L., Mamoňová, M., 2009: Hnilobný atak vybraných druhov dreva pri kontakte so zemou hodnotený podľa EN 252 – výsledky po 1/2 roku. Drevoznehodnocujúce huby 2009, Zvolen, TU vo Zvolene, p. 73–81.
Požgaj, A., Chovanec, D., Kurjatko, S., Babiak, M., 1993: Štruktúra a vlastnosti dreva. Bratislava, Príroda, 486 p.
Raczkowski, J., 1980: Seasonal effects on the atmospheric corro-sion of spruce micro-sections. Holz als Roh und Werkstopf, 38:231–234.
Raczkowski, J., Lutomsky, K., Molinski, W., Wos, R., 1999: Detec-tion of early stages of wood decay by acoustic emission tech-nique. Wood Science and Technology, 33:353–358.
Rohanová, A., 2013: Predikcia parametrov kvality smrekového konštrukčného dreva. Zvolen, DF TU vo Zvolene, 79 p.
Reinprecht, L., 2008: Ochrana dreva. Zvolen, TU vo Zvolene, 453 p. Reinprecht, L., Hibký, M., 2011: The type and degree of decay in
spruce wood analyzed by the ultrasonic method in three ana-tomical directions. BioResources, 6:4953–4968.
Reinprecht, L., Pánek, M., 2013: Ultrasonic technique for evalua-tion of biodefects in wood: Part 2 – In situ and in vitro analyses of old beams using ultrasonic and bending tests, International Wood Products Journal, 4:22–29.
Schmidt, O., 2006: Wood and tree fungi – biology, damage, pro-tection, and use. Berlin, Heidelberg: Springer-Verlag, 329 p.
Sonderegger, W., Kránitz, K., Bues, C.T., Niemz, P., 2015: Aging effects on physical and mechanical properties of spruce, fir and oak wood. Journal of Cultural Heritage, 16:883–889.
Štefko, J., Reinprecht, L., 2004: Dřevěné stavby – konstrukce, ochrana a údržba. Bratislava, Jaga group, 207 p.
Taylor, M. A., Gartner, B. L., Morrell, J. J., 2003: Co-incident varia-tions in growth rate and heartwood extractive concentration in Douglas-fir. Forest Ecology and Management, 186:257–260.
Tippner, J., Hrivnák, J., Kloiber, M., 2016: Experimental evaluation of mechanical properties of softwood using acoustic methods. BioResources, 11:503–518.
Wagenführ, R., 2002: Dřevo – obrazový lexikon. I. vyd. Příbram. Tiskárny Pbtisk Příbram, 348 p.
Wilcox, W. W., 1988. Detection of early stages of wood decay with ultrasonic pulse velocity. Forest Product Journal, 38:68–73.
168
M. Pánek, K. Trgala / Lesn. Cas. For. J. 62 (2016) 164–168

DOI: 10.1515/forj-2016-0020
Effects of Northern red oak (Quercus rubra L.) and sessile oak(Quercus petraea (Mattusch.) Liebl.) on the forest soil chemical properties
Stanislav Miltner, Ivo Kupka*, Michal Třeštík
Czech University of Life Sciences in Prague, Faculty of Forestry and Wood Sciences, Kamýcká 129, CZ – 165 21 Prague 6, Czech Republic
AbstractNorthern red oak (Quercus rubra L.) is one of the most important introduced tree species in the Czech Republic, occupying about6,000 ha with ca. 900,000 m3 of the standing volume. The presented study aims to evaluate its soil forming effects on natural oak sites. Soil chemistry of the upper soil layers (F+H, Ah, B horizons) was studied in three pairs of stands of both species. In each stand, four bulk samples were taken separately for particular horizons, each consisting of 5 soil-borer cores. The soil characteristics analysed were: pH (active and potential), soil adsorption complex characteristics (content of bases, exchangeable cation capacity, base saturation), exchangeable acidity (exchangeable Al and H), total carbon and nitrogen content, and plant available nutrients content (P, K, Ca, Mg). Total macronutrient content (P, K, Ca, Mg) was analysed only in holorganic horizons. Results confirmed acidification effects of red oak on the upper forest soil layers such as decreased pH, base content, base saturation, all nutrient contents in total as well as plant-available form and increased soil exchangeable acidity (exchangeable Al) in comparison to the sessile oak stands, especially in holorganic horizons and in the uppermost mineral layer (Ah horizon). Northern red oak can be considered as a slightly site-soil degrading species in the studied sites and environmental conditions in comparison to native oak species.Key words: red oak; sessile oak; humus forms; forest sites; pedochemical characteristics
Editor: Erika Gömöryová
*Corresponding author. Ivo Kupka, e-mail: [email protected], phone: +420 22438 3791
1. IntroductionNorthern red oak (Quercus rubra L.) is one of the most important introduced tree species in many European coun-tries, including the Czech Republic. It was planted for gar-dening purposes and especially for timber production on less favourable and degraded soils. Nowadays, it is recognized as an invasive alien plant very often and its valuation changed to negative one (Oosterbaan & Olsthorn 2005; Chmura 2013). Its stand area is about 6,000 ha with the growing stock of 900,000 m3 in the Czech Republic according to summary forest management plans. The red oak area is like that of Douglas-fir even the latter species has higher growing stock (about 1,250,000 m3) having lower mean age (Kouba & Zahradník 2011). It should be stressed that Douglas fir is the most productive species of all introduced species with site improving effects in the stands of domestic coniferous species (Podrázský et al. 2013, 2014; Kubeček et al. 2014; Pulkrab et al. 2014, 2015). On the other hand, northern red oak is a species quite common in parks and it is used for resto-ration of spoil banks. It is not understood as a species impor-tant for its production capacity only. The other interesting aspect is its resistance to tracheomycosis which is higher than of domestic oaks (Burkovský 1985; Gubka & Špišák 2010; Štefančík & Strmeň 2011). Dressel and Jäger (2002) recommend rather dry and acid sites as suitable or tolerable for northern red oak. Quite rare studies demonstrate higher wood production of red oak when compared to domestic oaks (Seidel & Kenk 2003; Kouba & Zahradník 2011). There is very limited evidence on the soil forming effects of this spe-
cies comparing to native trees. The partial studies indicate no site improvement effects in European conditions, even slight soil degrading effects comparing to native broad-leaved spe-cies (Kantor 1989; Podrázský & Štěpáník 2002; Jonczak et al. 2015; Bonifacio et al. 2015). On the contrary, Northern red oak can significantly contribute to the afforestation of agricultural lands (Vopravil et al. 2015) due to its character of pioneer species.
The aim of the presented study is to evaluate the Northern red oak effects on the upper layers of forest soils in the stands of native Sessile oak (Quercus petraea (Mattusch.) Liebl.) and partly mitigate the lack of information on the effects of this species in the forest environment.
2. Material and methodsThe study was performed in oak stands in the North-West-ern Bohemia. The area is a West part of the Natural Forest Area PLO 17 Polabí Lowland. Location of plots is given in the Table 1. The altitude of all plots varied between 220 – 330 m a.s.l. The investigated stands grow on comparable forest type: acid to medium rich oak and oak-beech sites (Viewegh 2003). Mean annual temperature of the area is 9 °C and mean annual precipitation 520 mm. The soil form-ing substrate is represented prevailingly by deep blown sands; this soil types of Arenic Cambisol (with gleying indi-ces) developed prevailingly on this substrate (Němeček et al. 2011).
ORIGINAL PAPER http://www.nlcsk.sk/fj/
Lesn. Cas. For. J. 62 (2016) 169–172
There were three pairs of stands (red oak and sessile oak). In each stand, four bulk samples (distance ca. 50 m) were taken from particular horizons F+H, Ah, B. Each bulk sample consisted of 5 individual sampling cores (distance ca. 5 m) taken by soil borer of 6.5 cm diameter, separated for given horizons. Individual bulk samples were dried and analysed in the Laboratory Tomáš, Opočno, by standard methods (see e.g. Zbíral 2001; Špulák et al. 2016): – Active and potential pH in H2O and KCl respectively by
potentiometric method, – exchangeable acidity, content of exchangeable alumin-
ium and hydrogen, – sorption complex characteristics by Kappen (1929): S
– base content, CEC – cation exchange capacity, BS – saturation of sorption complex by bases),
– content of total nutrients in holorganic horizons (N, P, K, Ca, Mg) after digestion with sulphuric acid and with selenium as a catalyst (Zbíral 2001),
– content of combustible matters, percentage of total oxi-dizable carbon (humus) and nitrogen was determined according to Kjeldahl methods, the combustible matter and Cox according to Springer-Klee method (e.g. Cia-vatta et al. 1989; Kirk 1950),
– content of available nutrients (P, K, Ca, Mg) by Mehlich III method.In each sampled stand, a bulk sample of the litter from the
soil surface was collected, a part of it from particular cored points. Only content of total nutrients was determined for this material.
One way analysis of variance (ANOVA using software Statistica 12.1) was used after checking the normality of the data for soil analysis evaluation followed by post-hoc Tukey tests where corresponding horizons were compared on the usual level of significance (p < 0.05).
Table 1. Basic data on research plots of Northern red oak and ses-sile oak stands.
Species Age [years] Forest type Elevation a.s.l. [m] Latitude Longitude
Red oak49 1S6 276 50°21,575’ 14°19,288’50 1K1 276 50°21,737’ 14°19,398’
103 1S6 300 50°22,172’ 13°59,071’
Sessile oak73 1S6 275 50°21,721’ 14°19,964’
111 1S6 280 50°22,228’ 14°20,978’159 1C2 329 50°21,855’ 13°58,966’
Notes: Forest types – 1 – oak vegetation altitudinal zone, 2 – beech-oak vegetation altitudinal zone, K – acid sites, S – medium rich sites, C – drying sensitive; third digit indicates more detailed forest type.
3. ResultsThere were documented differences between different soil horizons (F+H, Ah, B), in both set of stands, which is typical for the dynamics of forest soils. Differences in the studied characteristics between both species for the same soil layer were much less distinct. The pH/H2O and pH/KCl in upper humus horizons and in horizons Ah, B under both species are given in Table 2. The pH/H2O in humus layers under both species did not differ significantly; however, pH/KCl under red oak stand is significantly lower than under sessile oak in holorganic layer. There is a tendency of higher values of pH in F+H and Ah horizons while the values were practically identical in the B horizons.
Table 2. Soil reaction in particular horizons under red oak and ses-sile oak stands.
Horizon pH/H2O pH/KClRed oak Sessile oak Red oak Sessile oak
F+H 4.47 a 4.73 a 3.53 a 3.94 bAh 4.18 a 4.25 a 3.38 a 3.47 aB 4.33 a 4.31 a 3.75 a 3.69 a
Note: The values with the same letter indicate no significant differences on the level (p < 0.05).
The exchangeable titration acidity was significantly higher in holorganic horizon under red oak as well as in organo-mineral horizon Ah (Table 3). The similar results show the Al3+ content. On the other hand, hydrogen content did not show significant differences under both species. The results suggest less favorable status of soils and tendency to acidification under red oak compared with sessile oak.
Table 3. Exchangeable acidity, hydrogen content and aluminium in particular horizons under red oak and sessile oak stands.
HorizonAcidity H+ Al3+
[meq kg–1]Red oak Sessile oak Red oak Sessile oak Red oak Sessile oak
F+H 44.66 a 24.26 b 9.70 a 8.69 a 34.96 a 15.57 bAh 62.31 a 47.57 b 2.20 a 2.75 a 60.11 a 44.82 bB 49.78 a 41.42 a 1.20 a 1.07 a 48.58 a 40.35 a
Note: The values with the same letter indicate no significant differences on the level (p < 0.05).
Base content and base saturation are significantly higher in the holorganic horizons in the sessile oak stands. The same tendency was observed also in the organomineral Ah horizons; however, the differences were not significant. The significant differences were not pronounced in lower hori-zons (Table 4).
Table 4. Soil adsorption complex characteristics of the soil hori-zons under red oak and sessile oak stands.
HorizonS CEC BS
[meq kg–1] [%]Red oak Sessile oak Red oak Sessile oak Red oak Sessile oak
F+H 27.39 a 41.79 b 72.15 a 78.88 a 37.35 a 52.53 bAh 1.60 a 3.84 a 18.23 a 23.77 a 8.56 a 14.28 aB 0.97 a 0.83 a 6.96 a 7.20 a 13.11 a 9.96 a
Note: The values with the same letter indicate no significant differences on the level (p < 0.05).
The content of combustible substances is lower under red oak but not significantly (Table 5). The same dynamics showed the total nitrogen and carbon content in the whole studied profile, the significant difference was documented for carbon in the Ah horizon while for nitrogen for both horizons Ah and B. This results in less favourable C/N ratio in the stands of red oak in all horizons (Table 5), even the differences were not significant.
Table 5. Total carbon and nitrogen content, its C/N ration and combustible substances in upper soil horizons under red oak and sessile oak.
Horizon
Total C ox Total N C/N Combustible substances [%][%]
Red oak
Sessile oak
Red oak
Sessile oak
Red oak
Sessile oak
Red oak
Sessile oak
F+H 30.33 a 29.34 a 1.78 a 1.87 a 17.07 a 15.69 a 78.62 a 74.49 aAh 6.46 a 8.64 b 0.40 a 0.60 b 18.38 a 14.96 a 18.62 a 24.85 aB 1.31 a 1.77 a 0.09 a 0.14 b 13.01 a 12.43 a 4.54 a 5.40 a
Note: The values with the same letter indicate no significant differences on the level (p < 0.05).
170
S. Miltner et al. / Lesn. Cas. For. J. 62 (2016) 169–172
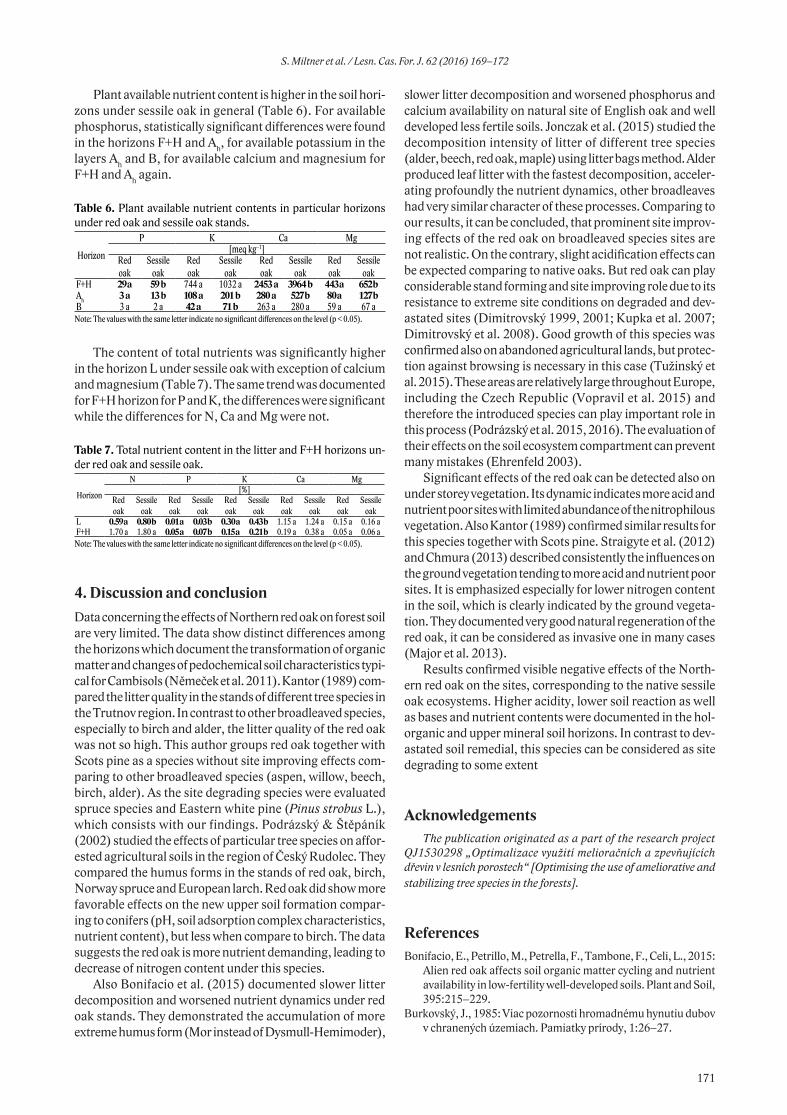
Plant available nutrient content is higher in the soil hori-zons under sessile oak in general (Table 6). For available phosphorus, statistically significant differences were found in the horizons F+H and Ah, for available potassium in the layers Ah and B, for available calcium and magnesium for F+H and Ah again.
Table 6. Plant available nutrient contents in particular horizons under red oak and sessile oak stands.
Horizon
P K Ca Mg[meq kg–1]
Red oak
Sessile oak
Red oak
Sessile oak
Red oak
Sessile oak
Red oak
Sessile oak
F+H 29 a 59 b 744 a 1032 a 2453 a 3964 b 443 a 652 bAh 3 a 13 b 108 a 201 b 280 a 527 b 80 a 127 bB 3 a 2 a 42 a 71 b 263 a 280 a 59 a 67 a
Note: The values with the same letter indicate no significant differences on the level (p < 0.05).
The content of total nutrients was significantly higher in the horizon L under sessile oak with exception of calcium and magnesium (Table 7). The same trend was documented for F+H horizon for P and K, the differences were significant while the differences for N, Ca and Mg were not.
Table 7. Total nutrient content in the litter and F+H horizons un-der red oak and sessile oak.
Horizon
N P K Ca Mg[%]
Red oak
Sessile oak
Red oak
Sessile oak
Red oak
Sessile oak
Red oak
Sessile oak
Red oak
Sessile oak
L 0.59 a 0.80 b 0.01 a 0.03 b 0.30 a 0.43 b 1.15 a 1.24 a 0.15 a 0.16 aF+H 1.70 a 1.80 a 0.05 a 0.07 b 0.15 a 0.21 b 0.19 a 0.38 a 0.05 a 0.06 a
Note: The values with the same letter indicate no significant differences on the level (p < 0.05).
4. Discussion and conclusionData concerning the effects of Northern red oak on forest soil are very limited. The data show distinct differences among the horizons which document the transformation of organic matter and changes of pedochemical soil characteristics typi-cal for Cambisols (Němeček et al. 2011). Kantor (1989) com-pared the litter quality in the stands of different tree species in the Trutnov region. In contrast to other broadleaved species, especially to birch and alder, the litter quality of the red oak was not so high. This author groups red oak together with Scots pine as a species without site improving effects com-paring to other broadleaved species (aspen, willow, beech, birch, alder). As the site degrading species were evaluated spruce species and Eastern white pine (Pinus strobus L.), which consists with our findings. Podrázský & Štěpáník (2002) studied the effects of particular tree species on affor-ested agricultural soils in the region of Český Rudolec. They compared the humus forms in the stands of red oak, birch, Norway spruce and European larch. Red oak did show more favorable effects on the new upper soil formation compar-ing to conifers (pH, soil adsorption complex characteristics, nutrient content), but less when compare to birch. The data suggests the red oak is more nutrient demanding, leading to decrease of nitrogen content under this species.
Also Bonifacio et al. (2015) documented slower litter decomposition and worsened nutrient dynamics under red oak stands. They demonstrated the accumulation of more extreme humus form (Mor instead of Dysmull-Hemimoder),
slower litter decomposition and worsened phosphorus and calcium availability on natural site of English oak and well developed less fertile soils. Jonczak et al. (2015) studied the decomposition intensity of litter of different tree species (alder, beech, red oak, maple) using litter bags method. Alder produced leaf litter with the fastest decomposition, acceler-ating profoundly the nutrient dynamics, other broadleaves had very similar character of these processes. Comparing to our results, it can be concluded, that prominent site improv-ing effects of the red oak on broadleaved species sites are not realistic. On the contrary, slight acidification effects can be expected comparing to native oaks. But red oak can play considerable stand forming and site improving role due to its resistance to extreme site conditions on degraded and dev-astated sites (Dimitrovský 1999, 2001; Kupka et al. 2007; Dimitrovský et al. 2008). Good growth of this species was confirmed also on abandoned agricultural lands, but protec-tion against browsing is necessary in this case (Tužinský et al. 2015). These areas are relatively large throughout Europe, including the Czech Republic (Vopravil et al. 2015) and therefore the introduced species can play important role in this process (Podrázský et al. 2015, 2016). The evaluation of their effects on the soil ecosystem compartment can prevent many mistakes (Ehrenfeld 2003).
Significant effects of the red oak can be detected also on under storey vegetation. Its dynamic indicates more acid and nutrient poor sites with limited abundance of the nitrophilous vegetation. Also Kantor (1989) confirmed similar results for this species together with Scots pine. Straigyte et al. (2012) and Chmura (2013) described consistently the influences on the ground vegetation tending to more acid and nutrient poor sites. It is emphasized especially for lower nitrogen content in the soil, which is clearly indicated by the ground vegeta-tion. They documented very good natural regeneration of the red oak, it can be considered as invasive one in many cases (Major et al. 2013).
Results confirmed visible negative effects of the North-ern red oak on the sites, corresponding to the native sessile oak ecosystems. Higher acidity, lower soil reaction as well as bases and nutrient contents were documented in the hol-organic and upper mineral soil horizons. In contrast to dev-astated soil remedial, this species can be considered as site degrading to some extent
AcknowledgementsThe publication originated as a part of the research project
QJ1530298 „Optimalizace využití melioračních a zpevňujících dřevin v lesních porostech“ [Optimising the use of ameliorative and stabilizing tree species in the forests].
ReferencesBonifacio, E., Petrillo, M., Petrella, F., Tambone, F., Celi, L., 2015:
Alien red oak affects soil organic matter cycling and nutrient availability in low-fertility well-developed soils. Plant and Soil, 395:215–229.
Burkovský, J., 1985: Viac pozornosti hromadnému hynutiu dubov v chranených územiach. Pamiatky prírody, 1:26–27.
171
S. Miltner et al. / Lesn. Cas. For. J. 62 (2016) 169–172

Ciavatta, C., Vittori Antisari, L., Sequi, P., 1989: Determination of organic carbon in soils and fertilizers. Communications in Soil Science and Plant Analysis, 20:759–773.
Dimitrovský, K., 1999: Metodika zemědělské, lesnické a hydrické rekultivace. Prha, Státní zemědělské nakladatelství, 66 p.
Dimitrovský, K., 2001: Tvorba nové krajiny na Sokolovsku. Praha, Státní zemědělské nakladatelství, 63 p.
Dimitrovský, K., Kupka, I., Kunt, M., Štibinger, J., 2008: Proble-matika obnovy lesů na výsypkových stanovištích, jejich vývoj, struktura a skladba. In: Neuhöferová (ed.): Obnova lesního pro-středí při zalesnění nelesních a devastovaných stanovišť. Kos-telec nad Černými lesy, ČZU, p. 13–20.
Dressel, R. D., Jäger, E. J., 2002: Beiträge zur Biologie der Gefäßpflanzen des herzynischen Raumes. 5. Quercus rubra L. (Roteiche) – Lebensgeschichte und agriophytische. Aus-breitung im Nationalpark Sächsische Schweiz. Hercynia N. F., 35:37–64.
Ehrenfeld, J. G., 2003: Effects of exotic plant invasions on soil nut-rient cycling processes. Ecosystems, 6:503–523.
Gubka, K., Špišák, J., 2010: Prirodzená obnova duba červeného (Q. rubra L.) na výskumných plochách Semerovce (LS Šahy). In: Knott, R., Peňáz, J., Vaněk, P. (eds): Pěstování lesů v niž-ších vegetačních stupních. Brno, Mendel University in Brno, p. 30–34.
Chmura, D., 2013: Impact of alien tree species Quercus rubra L. on understorey environment and flora: a study of the Silesian Upland (southern Poland). Polish Journal of Ecology, 61:431–442.
Jonczak, J., Parzych, A., Sobisz, Z., 2015: Decomposition of Four Tree Species Leaf Litters in Headwater Riparian Forest. Baltic Forestry, 21:133–143.
Kantor, P., 1989: Meliorační účinky porostů náhradních dřevin. Lesnictví, 35:1047–1066.
Kappen, H., 1929: Die Bodenazidität. Berlin, Springer, 363 p.Kirk, P. L., 1950: Kjeldahl method for total nitrogen. Analytical
Chemistry, 22:354–358.Kouba, J., Zahradník, D., 2011: Produkce nejdůležitějších intro-
dukovaných dřevin v ČR podle lesnické statistiky. In: Podraz-ský, V. (eds): Aktuality v pěstování méně častých dřevin v České republice ČZU, Kostelec nad Černými lesy, p. 52–66.
Kubeček, J., Štefančík, I., Podrázský, V., Longauer, R., 2014: Výsledky výzkumu douglasky tisolisté (Pseudotsuga menziesii /Mirb./ Franco) v České republice a na Slovensku – přehled. Lesnícky časopis - Forestry Journal, 60:120–129.
Kupka, I., Dimitrovský, K., Kastl, F., Kubát, J., 2007: Fundamental Criteria for forest establishment on spoil substrates. In: Neu-Neu-höferová (ed.): Obnova lesního prostředí při zalesňování neles-Obnova lesního prostředí při zalesňování neles-ních a degradovaných půd. Kostelec nad Černými lesy, ČZU, p. 117–120.
Major, K. C., Nosko, P., Kuehne, C., Campbel, Bauhus, J., 2013: Regeneration dynamics of non-native northern red oak (Quer-cus rubra L.) populations as influenced by environmental fac-tors: A case study in managed hardwood forests of southwest-ern Germany. Forest Ecology and Management, 291:144–153.
Nelson, D. W., Sommers, L. E., 1996: Total carbon, organic carbon, and organic matter. In: Sparks, D. L. (ed.): Methods of Soil Ana-lysis. Part 3. Chemical Methods. Madison, Soil Science Soci-ety of America, American Society of Agronomy: p. 961–1010.
Němeček, J., Mühlhanselová, M., Macku, J., Vokoun, J., Vavříček, D. et al., 2011: Taxonomický klasifikační systém půd České republiky. 2. upravené vydání. Praha, Česká zemědělská uni-versita, 94 p.
Oosterbaan, A., Olsthorn, A. F. M., 2005: Control strategies for Prunus serotina and Quercus rubra as exotic tree species in the Netherlands. In: Nentwig, W., Bacher, S., Cock, M. W. J., Dietz, H., Gigon, R. A.,(eds.): Wittenberg Biological Invasions from ecology to control, Neobiota, 6:177–181.
Podrázský, V., Štěpáník, R., 2002: Vývoj půd na zalesněných zemědělských plochách – oblast LS Český Rudolec. Zprávy lesnického výzkumu, 47:53–56.
Podrázský, V., Čermák, R., Zahradník, D., Kouba, J., 2013: Pro-duction of Douglas-fir in the Czech Republic based on national forest inventory data. Journal of Forest Science, 59:398–404.
Podrázský, V., Zahradník, D., Remeš, J., 2014: Potential conse-quences of tree species and age structure changes of forests in the Czech Republic – review of forest inventory data. Wood Research, 59:483–490.
Podrázský, V., Holubík, O., Vopravil, J., Khel, T., Moser, W. K. et al., 2015: Effects of afforestation on soil structure formation in two climatic regions of the Czech Republic. Journal of Forest Science, 61:225–234.
Podrázský, V., Fulín, M., Prknová, H., Beran, F., Třeštík, M., 2016: Changes of agricultural land characteristics as a result of affor-estation using introduced tree species. Journal of Forest Sci-ence, 62:72–79.
Pulkrab, K., Sloup, M., Zeman, M., 2014: Economic impact of Douglas-fir (Pseudotsuga menziesii [Mirb.] Franco) production in the Czech Republic. Journal of Forest Science, 60:297–306.
Pulkrab, K., Sloup, R., Podrázský, V., 2015: Production potential of the forests in the Czech Republic. BioResources, 10:4711–4725.
Seidel, J., Kenk, G., 2003: Wachstum und Wertleistung der Eichen-arten in Baden-Württemberg. Der Wald, 1:28–31.
Straigyte, L., Marozas, V., Žalkauskas, R., 2012: Morphological traits of red Oak (Quercus rubra L.) and ground vegetation in stands in different sites and Regions Of Lithuania. Baltic Forestry, 18:91–99.
Špulák, O., Souček, J., Dušek, D., 2016: Quality of organic and upper mineral horizons of mature mountain beech stands with respect to herb layer species. Journal of Forest Science, 62:163–174.
Štefančík, I., Strmeň, S., 2011: Vývoj dubového porastu (Quercus petraea Liebl.) postihnutého v minulosti hromadným hynutím. In: Jurásek (ed.): Proceedings of Central European Silviculture – 12th International Conference, Opočno, VÚLHM Jíloviště-Strnady, p. 101–112.
Tužinský, M., Kupka, I., Podrázský, V., Prknová, H., 2015: Influ-ence of the mineral rock alginite on survival rate and re-growth of selected tree species on agricultural land. Journal of Forest Science, 61:399–405.
Viewegh, J., 2003: Czech Forest (Site) Ecosystem Classification. Vopravil, J., Podrázský, V., Batysta, M., Novák, P., Havelková, L. et
al., 2015: Identification of agricultural soils suitable for affor-estation in the Czech Republic using a soil database. Journal of Forest Science, 61:141–147.
Zbíral, J., 2001: Porovnání extrakčních postupů pro stanovení zák-ladních živin v půdách ČR. Brno, Ústřední kontrolní a zkušební ústav zemědělský, 206 p.
172
S. Miltner et al. / Lesn. Cas. For. J. 62 (2016) 169–172
DOI: 10.1515/forj-2016-0021
Effect of different tree mortality patterns on stand development in the forest model SIBYLA
Jiří Trombik1, Ivan Barka1, 2, Tomáš Hlásny1, 2
1Czech University of Life Sciences Prague, Faculty of Forestry and Wood Sciences, Kamýcká 129, CZ – 165 21 Prague 6, Czech Republic2National Forest Centre - Forest Research Institute Zvolen, T. G. Masaryka 2175/22, SK – 960 92 Zvolen, Slovak Republic
AbstractForest mortality critically affects stand structure and the quality of ecosystem services provided by forests. Spruce bark beetle (Ips typographus) generates rather complex infestation and mortality patterns, and implementation of such patterns in forest models is chal-lenging. We present here the procedure, which allows to simulate the bark beetle-related tree mortality in the forest dynamics model Sibyla. We explored how sensitive various production and stand structure indicators are to tree mortality patterns, which can be gener-ated by bark beetles. We compared the simulation outputs for three unmanaged forest stands with 40, 70 and 100% proportion of spruce as affected by the disturbance-related mortality that occurred in a random pattern and in a patchy pattern. The used tree species and age class-specific mortality rates were derived from the disturbance-related mortality records from Slovakia. The proposed algorithm was developed in the SQLite using the Python language, and the algorithm allowed us to define the degree of spatial clustering of dead trees ranging from a random distribution to a completely clustered distribution; a number of trees that died in either mode is set to remain equal. We found significant differences between the long-term developments of the three investigated forest stands, but we found very little effect of the tested mortality modes on stand increment, tree species composition and diversity, and tree size diversity. Hence, our hypothesis that the different pattern of dead trees emergence should affect the competitive interactions between trees and regeneration, and thus affect selected productivity and stand structure indicators was not confirmed. Key words: Ips typographus; dispersal pattern; empirical forest modelling; tree mortality
Editor: Bohdan Konôpka
1. IntroductionModels of forest dynamics have become important tools that supported forest management and increased our under-standing of forest development under diverse management and natural conditions. Because forest damage is among the most important drivers of forest development with effect on the quality of ecosystems services provided by forests (Thom & Seidl 2015; Thom et al. 2016), a great deal of attention has been paid to the implementation of forest mortality pro-cesses into models (Pietsch & Hasenauer 2006; Merganičová & Merganič 2014; Seidl & Rammer 2016). At the same time, models were found highly sensitive to the mortality assump-tions adopted (Bircher et al. 2015; Hlásny et al. 2014), which highlights the importance of proper implementation of algorithms driving the mortality-related processes. Despite these efforts and increasing complexity of models, Keane et al. (2001) and Bircher et al. (2015) argue that mortality algorithms implemented in models are generally based on simple assumptions and insufficient data.
Bark beetles of the genus Ips, and particularly the spruce bark beetle Ips typographus (L., 1758) (Curculionidae: Sco-lytinae), are the most damaging biotic agents in central European forest (e.g. Berec et al. 2013). Bark beetle-related tree mortality is a highly complex process that is driven by both the host susceptibility, bark beetle population size and diverse environmental perturbations (Wermelinger 2004; Hlásny & Turčáni 2013). Interactions between the host
*Corresponding author. Jiří Trombik, e-mail: [email protected]
tree distribution, tree susceptibility and density-dependent bark beetle dispersal capacity, generate specific patterns of infested trees. Such patterns might range from the scattered occurrence of infested trees, which is typical of small beetle densities, to patchy and even a large scale infestations that typically occur when the populations are in the outbreak phase (Hlásny & Turčáni 2013). Because tree mortality patterns might affect stand structure and the quality of eco-system services in the period following the infestation, it is desired to include such information into forest models, which operate at a scale of trees.
Among such models, the forest model Sibyla (Fabrika & Ďurský 2005) has received an increased recognition in recent years (e.g. Vacek et al. 2013; Hlásny et al. 2011, 2014, 2016; Ambrož et al. 2015; Härtl et al. 2016). The model simulates mortality at a scale of trees and considers both the inherent tree mortality (Ďurský et al. 1996, 1997) and mortality related to disturbances (Fabrika & Vaculčiak 2009). Particularly the disturbance-related mortality shows significant differences between tree species, depending on tree species vulnerability to various disturbances. Hlásny et al. (2016) developed an application that simulates the disturbance-related mortality in the model Sibyla based on the species and age-specific mortality rates derived from the 10-year records on forest damage in Slovakia; this is the algorithm we use and evalu-ate in this study.
ORIGINAL PAPER http://www.nlcsk.sk/fj/
Lesn. Cas. For. J. 62 (2016) 173–180
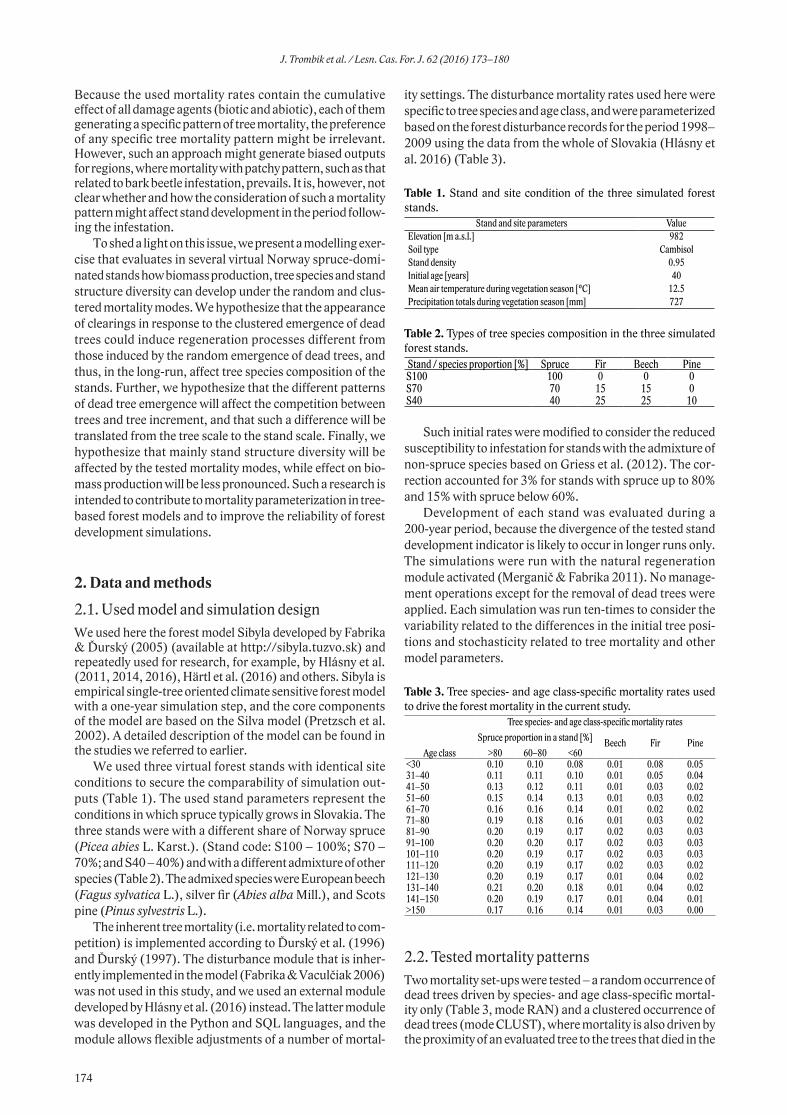
Because the used mortality rates contain the cumulative effect of all damage agents (biotic and abiotic), each of them generating a specific pattern of tree mortality, the preference of any specific tree mortality pattern might be irrelevant. However, such an approach might generate biased outputs for regions, where mortality with patchy pattern, such as that related to bark beetle infestation, prevails. It is, however, not clear whether and how the consideration of such a mortality pattern might affect stand development in the period follow-ing the infestation.
To shed a light on this issue, we present a modelling exer-cise that evaluates in several virtual Norway spruce-domi-nated stands how biomass production, tree species and stand structure diversity can develop under the random and clus-tered mortality modes. We hypothesize that the appearance of clearings in response to the clustered emergence of dead trees could induce regeneration processes different from those induced by the random emergence of dead trees, and thus, in the long-run, affect tree species composition of the stands. Further, we hypothesize that the different patterns of dead tree emergence will affect the competition between trees and tree increment, and that such a difference will be translated from the tree scale to the stand scale. Finally, we hypothesize that mainly stand structure diversity will be affected by the tested mortality modes, while effect on bio-mass production will be less pronounced. Such a research is intended to contribute to mortality parameterization in tree-based forest models and to improve the reliability of forest development simulations.
2. Data and methods
2.1. Used model and simulation designWe used here the forest model Sibyla developed by Fabrika & Ďurský (2005) (available at http://sibyla.tuzvo.sk) and repeatedly used for research, for example, by Hlásny et al. (2011, 2014, 2016), Härtl et al. (2016) and others. Sibyla is empirical single-tree oriented climate sensitive forest model with a one-year simulation step, and the core components of the model are based on the Silva model (Pretzsch et al. 2002). A detailed description of the model can be found in the studies we referred to earlier.
We used three virtual forest stands with identical site conditions to secure the comparability of simulation out-puts (Table 1). The used stand parameters represent the conditions in which spruce typically grows in Slovakia. The three stands were with a different share of Norway spruce (Picea abies L. Karst.). (Stand code: S100 – 100%; S70 – 70%; and S40 – 40%) and with a different admixture of other species (Table 2). The admixed species were European beech (Fagus sylvatica L.), silver fir (Abies alba Mill.), and Scots pine (Pinus sylvestris L.).
The inherent tree mortality (i.e. mortality related to com-petition) is implemented according to Ďurský et al. (1996) and Ďurský (1997). The disturbance module that is inher-ently implemented in the model (Fabrika & Vaculčiak 2006) was not used in this study, and we used an external module developed by Hlásny et al. (2016) instead. The latter module was developed in the Python and SQL languages, and the module allows flexible adjustments of a number of mortal-
ity settings. The disturbance mortality rates used here were specific to tree species and age class, and were parameterized based on the forest disturbance records for the period 1998–2009 using the data from the whole of Slovakia (Hlásny et al. 2016) (Table 3).
Table 1. Stand and site condition of the three simulated forest stands.
Stand and site parameters ValueElevation [m a.s.l.] 982Soil type CambisolStand density 0.95Initial age [years] 40Mean air temperature during vegetation season [°C] 12.5Precipitation totals during vegetation season [mm] 727
Table 2. Types of tree species composition in the three simulated forest stands.Stand / species proportion [%] Spruce Fir Beech PineS100 100 0 0 0S70 70 15 15 0S40 40 25 25 10
Such initial rates were modified to consider the reduced susceptibility to infestation for stands with the admixture of non-spruce species based on Griess et al. (2012). The cor-rection accounted for 3% for stands with spruce up to 80% and 15% with spruce below 60%.
Development of each stand was evaluated during a 200-year period, because the divergence of the tested stand development indicator is likely to occur in longer runs only. The simulations were run with the natural regeneration module activated (Merganič & Fabrika 2011). No manage-ment operations except for the removal of dead trees were applied. Each simulation was run ten-times to consider the variability related to the differences in the initial tree posi-tions and stochasticity related to tree mortality and other model parameters.
Table 3. Tree species- and age class-specific mortality rates used to drive the forest mortality in the current study. Tree species- and age class-specific mortality rates
Spruce proportion in a stand [%] Beech Fir PineAge class >80 60–80 <60
<30 0.10 0.10 0.08 0.01 0.08 0.0531–40 0.11 0.11 0.10 0.01 0.05 0.0441–50 0.13 0.12 0.11 0.01 0.03 0.0251–60 0.15 0.14 0.13 0.01 0.03 0.0261–70 0.16 0.16 0.14 0.01 0.02 0.0271–80 0.19 0.18 0.16 0.01 0.03 0.0281–90 0.20 0.19 0.17 0.02 0.03 0.0391–100 0.20 0.20 0.17 0.02 0.03 0.03101–110 0.20 0.19 0.17 0.02 0.03 0.03111–120 0.20 0.19 0.17 0.02 0.03 0.02121–130 0.20 0.19 0.17 0.01 0.04 0.02131–140 0.21 0.20 0.18 0.01 0.04 0.02141–150 0.20 0.19 0.17 0.01 0.04 0.01>150 0.17 0.16 0.14 0.01 0.03 0.00
2.2. Tested mortality patterns Two mortality set-ups were tested – a random occurrence of dead trees driven by species- and age class-specific mortal-ity only (Table 3, mode RAN) and a clustered occurrence of dead trees (mode CLUST), where mortality is also driven by the proximity of an evaluated tree to the trees that died in the
174
J. Trombik et al. / Lesn. Cas. For. J. 62 (2016) 173–180
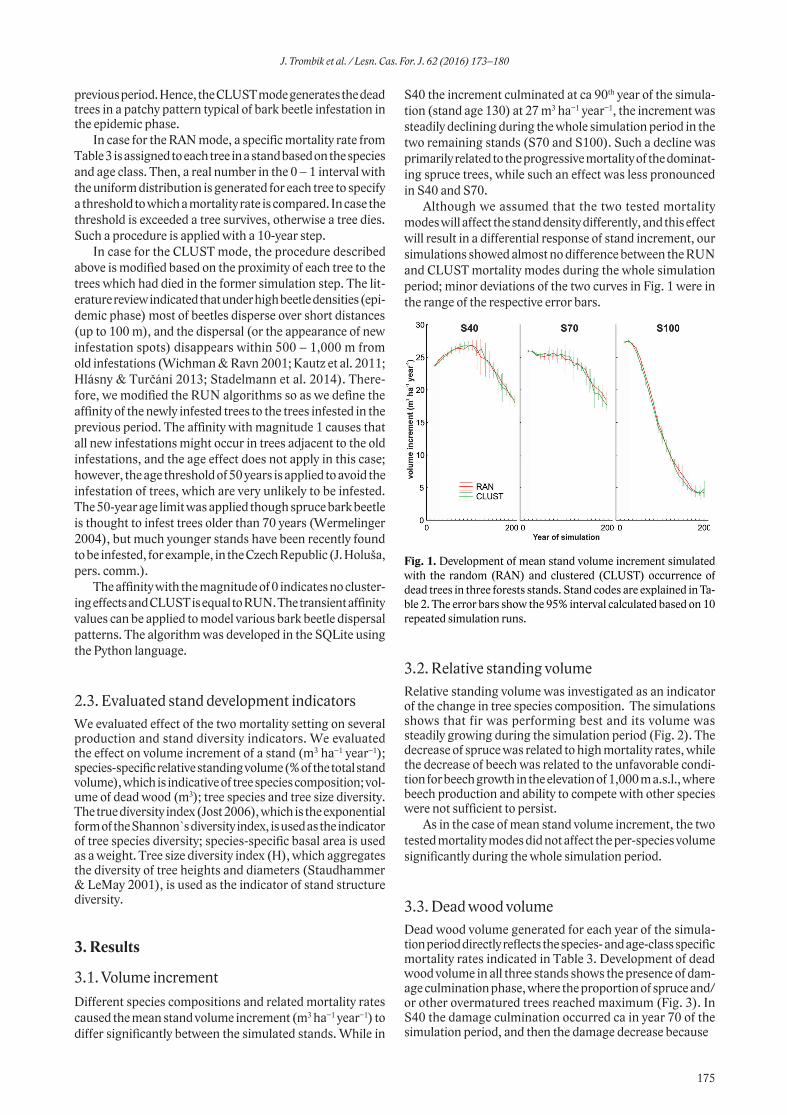
previous period. Hence, the CLUST mode generates the dead trees in a patchy pattern typical of bark beetle infestation in the epidemic phase.
In case for the RAN mode, a specific mortality rate from Table 3 is assigned to each tree in a stand based on the species and age class. Then, a real number in the 0 – 1 interval with the uniform distribution is generated for each tree to specify a threshold to which a mortality rate is compared. In case the threshold is exceeded a tree survives, otherwise a tree dies. Such a procedure is applied with a 10-year step.
In case for the CLUST mode, the procedure described above is modified based on the proximity of each tree to the trees which had died in the former simulation step. The lit-erature review indicated that under high beetle densities (epi-demic phase) most of beetles disperse over short distances (up to 100 m), and the dispersal (or the appearance of new infestation spots) disappears within 500 – 1,000 m from old infestations (Wichman & Ravn 2001; Kautz et al. 2011; Hlásny & Turčáni 2013; Stadelmann et al. 2014). There-fore, we modified the RUN algorithms so as we define the affinity of the newly infested trees to the trees infested in the previous period. The affinity with magnitude 1 causes that all new infestations might occur in trees adjacent to the old infestations, and the age effect does not apply in this case; however, the age threshold of 50 years is applied to avoid the infestation of trees, which are very unlikely to be infested. The 50-year age limit was applied though spruce bark beetle is thought to infest trees older than 70 years (Wermelinger 2004), but much younger stands have been recently found to be infested, for example, in the Czech Republic (J. Holuša, pers. comm.).
The affinity with the magnitude of 0 indicates no cluster-ing effects and CLUST is equal to RUN. The transient affinity values can be applied to model various bark beetle dispersal patterns. The algorithm was developed in the SQLite using the Python language.
2.3. Evaluated stand development indicatorsWe evaluated effect of the two mortality setting on several production and stand diversity indicators. We evaluated the effect on volume increment of a stand (m3 ha−1 year−1); species-specific relative standing volume (% of the total stand volume), which is indicative of tree species composition; vol-ume of dead wood (m3); tree species and tree size diversity. The true diversity index (Jost 2006), which is the exponential form of the Shannon`s diversity index, is used as the indicator of tree species diversity; species-specific basal area is used as a weight. Tree size diversity index (H), which aggregates the diversity of tree heights and diameters (Staudhammer & LeMay 2001), is used as the indicator of stand structure diversity.
3. Results
3.1. Volume incrementDifferent species compositions and related mortality rates caused the mean stand volume increment (m3 ha−1 year−1) to differ significantly between the simulated stands. While in
S40 the increment culminated at ca 90th year of the simula-tion (stand age 130) at 27 m3 ha−1 year−1, the increment was steadily declining during the whole simulation period in the two remaining stands (S70 and S100). Such a decline was primarily related to the progressive mortality of the dominat-ing spruce trees, while such an effect was less pronounced in S40 and S70.
Although we assumed that the two tested mortality modes will affect the stand density differently, and this effect will result in a differential response of stand increment, our simulations showed almost no difference between the RUN and CLUST mortality modes during the whole simulation period; minor deviations of the two curves in Fig. 1 were in the range of the respective error bars.
Fig. 1. Development of mean stand volume increment simulated with the random (RAN) and clustered (CLUST) occurrence of dead trees in three forests stands. Stand codes are explained in Ta-ble 2. The error bars show the 95% interval calculated based on 10 repeated simulation runs.
3.2. Relative standing volumeRelative standing volume was investigated as an indicator of the change in tree species composition. The simulations shows that fir was performing best and its volume was steadily growing during the simulation period (Fig. 2). The decrease of spruce was related to high mortality rates, while the decrease of beech was related to the unfavorable condi-tion for beech growth in the elevation of 1,000 m a.s.l., where beech production and ability to compete with other species were not sufficient to persist.
As in the case of mean stand volume increment, the two tested mortality modes did not affect the per-species volume significantly during the whole simulation period.
3.3. Dead wood volumeDead wood volume generated for each year of the simula-tion period directly reflects the species- and age-class specific mortality rates indicated in Table 3. Development of dead wood volume in all three stands shows the presence of dam-age culmination phase, where the proportion of spruce and/or other overmatured trees reached maximum (Fig. 3). In S40 the damage culmination occurred ca in year 70 of the simulation period, and then the damage decrease because
175
J. Trombik et al. / Lesn. Cas. For. J. 62 (2016) 173–180
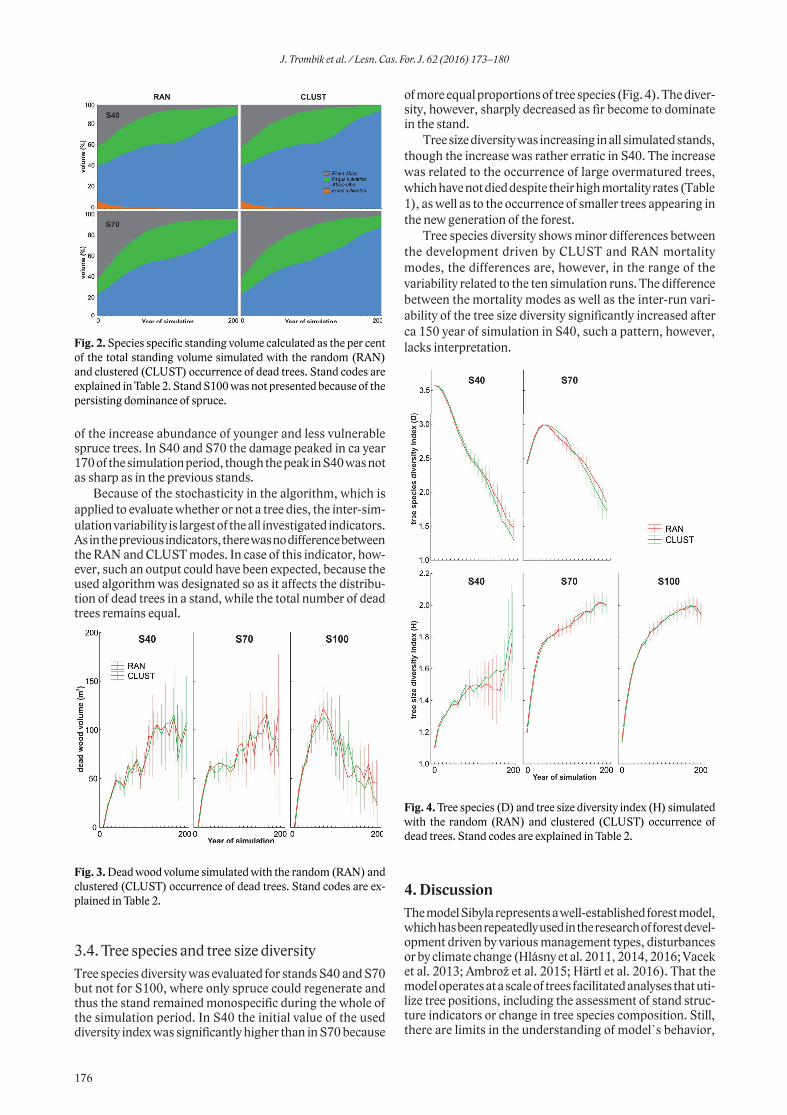
Fig. 2. Species specific standing volume calculated as the per cent of the total standing volume simulated with the random (RAN) and clustered (CLUST) occurrence of dead trees. Stand codes are explained in Table 2. Stand S100 was not presented because of the persisting dominance of spruce.
of the increase abundance of younger and less vulnerable spruce trees. In S40 and S70 the damage peaked in ca year 170 of the simulation period, though the peak in S40 was not as sharp as in the previous stands.
Because of the stochasticity in the algorithm, which is applied to evaluate whether or not a tree dies, the inter-sim-ulation variability is largest of the all investigated indicators. As in the previous indicators, there was no difference between the RAN and CLUST modes. In case of this indicator, how-ever, such an output could have been expected, because the used algorithm was designated so as it affects the distribu-tion of dead trees in a stand, while the total number of dead trees remains equal.
Fig. 3. Dead wood volume simulated with the random (RAN) and clustered (CLUST) occurrence of dead trees. Stand codes are ex-plained in Table 2.
3.4. Tree species and tree size diversityTree species diversity was evaluated for stands S40 and S70 but not for S100, where only spruce could regenerate and thus the stand remained monospecific during the whole of the simulation period. In S40 the initial value of the used diversity index was significantly higher than in S70 because
of more equal proportions of tree species (Fig. 4). The diver-sity, however, sharply decreased as fir become to dominate in the stand.
Tree size diversity was increasing in all simulated stands, though the increase was rather erratic in S40. The increase was related to the occurrence of large overmatured trees, which have not died despite their high mortality rates (Table 1), as well as to the occurrence of smaller trees appearing in the new generation of the forest.
Tree species diversity shows minor differences between the development driven by CLUST and RAN mortality modes, the differences are, however, in the range of the variability related to the ten simulation runs. The difference between the mortality modes as well as the inter-run vari-ability of the tree size diversity significantly increased after ca 150 year of simulation in S40, such a pattern, however, lacks interpretation.
Fig. 4. Tree species (D) and tree size diversity index (H) simulated with the random (RAN) and clustered (CLUST) occurrence of dead trees. Stand codes are explained in Table 2.
4. Discussion The model Sibyla represents a well-established forest model, which has been repeatedly used in the research of forest devel-opment driven by various management types, disturbances or by climate change (Hlásny et al. 2011, 2014, 2016; Vacek et al. 2013; Ambrož et al. 2015; Härtl et al. 2016). That the model operates at a scale of trees facilitated analyses that uti-lize tree positions, including the assessment of stand struc-ture indicators or change in tree species composition. Still, there are limits in the understanding of model`s behavior,
176
J. Trombik et al. / Lesn. Cas. For. J. 62 (2016) 173–180
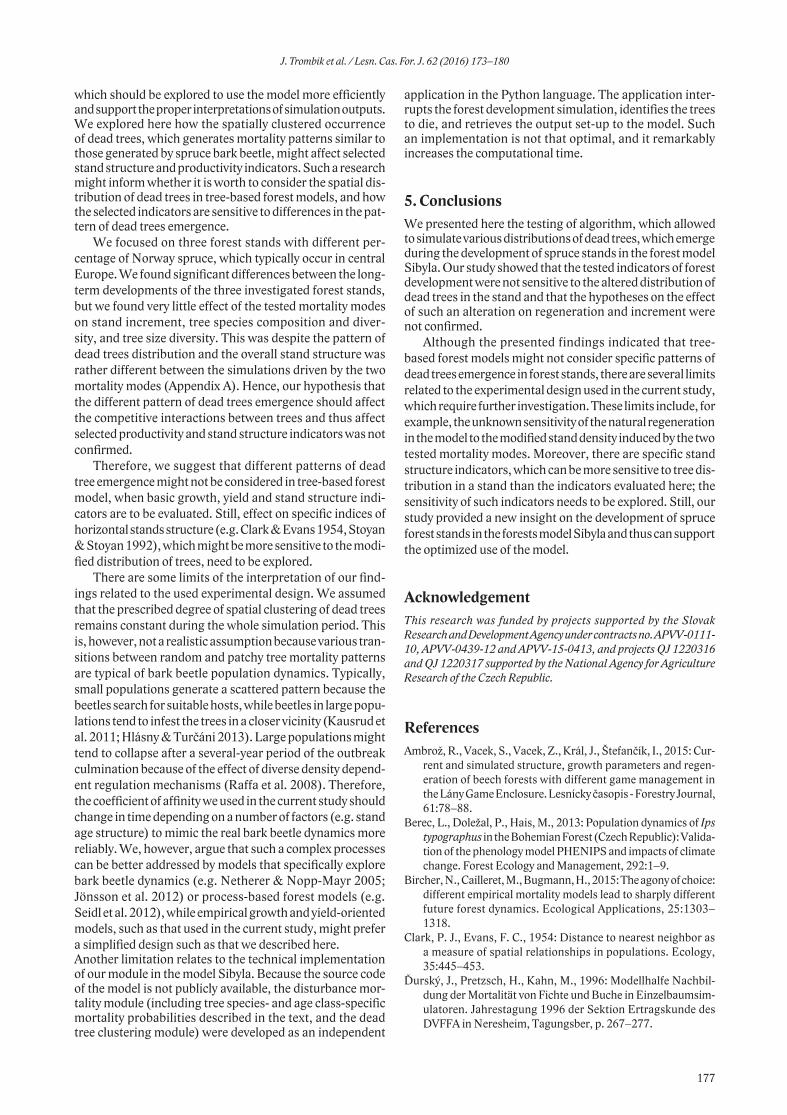
which should be explored to use the model more efficiently and support the proper interpretations of simulation outputs.We explored here how the spatially clustered occurrence of dead trees, which generates mortality patterns similar to those generated by spruce bark beetle, might affect selected stand structure and productivity indicators. Such a research might inform whether it is worth to consider the spatial dis-tribution of dead trees in tree-based forest models, and how the selected indicators are sensitive to differences in the pat-tern of dead trees emergence.
We focused on three forest stands with different per-centage of Norway spruce, which typically occur in central Europe. We found significant differences between the long-term developments of the three investigated forest stands, but we found very little effect of the tested mortality modes on stand increment, tree species composition and diver-sity, and tree size diversity. This was despite the pattern of dead trees distribution and the overall stand structure was rather different between the simulations driven by the two mortality modes (Appendix A). Hence, our hypothesis that the different pattern of dead trees emergence should affect the competitive interactions between trees and thus affect selected productivity and stand structure indicators was not confirmed.
Therefore, we suggest that different patterns of dead tree emergence might not be considered in tree-based forest model, when basic growth, yield and stand structure indi-cators are to be evaluated. Still, effect on specific indices of horizontal stands structure (e.g. Clark & Evans 1954, Stoyan & Stoyan 1992), which might be more sensitive to the modi-fied distribution of trees, need to be explored.
There are some limits of the interpretation of our find-ings related to the used experimental design. We assumed that the prescribed degree of spatial clustering of dead trees remains constant during the whole simulation period. This is, however, not a realistic assumption because various tran-sitions between random and patchy tree mortality patterns are typical of bark beetle population dynamics. Typically, small populations generate a scattered pattern because the beetles search for suitable hosts, while beetles in large popu-lations tend to infest the trees in a closer vicinity (Kausrud et al. 2011; Hlásny & Turčáni 2013). Large populations might tend to collapse after a several-year period of the outbreak culmination because of the effect of diverse density depend-ent regulation mechanisms (Raffa et al. 2008). Therefore, the coefficient of affinity we used in the current study should change in time depending on a number of factors (e.g. stand age structure) to mimic the real bark beetle dynamics more reliably. We, however, argue that such a complex processes can be better addressed by models that specifically explore bark beetle dynamics (e.g. Netherer & Nopp-Mayr 2005; Jönsson et al. 2012) or process-based forest models (e.g. Seidl et al. 2012), while empirical growth and yield-oriented models, such as that used in the current study, might prefer a simplified design such as that we described here. Another limitation relates to the technical implementation of our module in the model Sibyla. Because the source code of the model is not publicly available, the disturbance mor-tality module (including tree species- and age class-specific mortality probabilities described in the text, and the dead tree clustering module) were developed as an independent
application in the Python language. The application inter-rupts the forest development simulation, identifies the trees to die, and retrieves the output set-up to the model. Such an implementation is not that optimal, and it remarkably increases the computational time.
5. ConclusionsWe presented here the testing of algorithm, which allowed to simulate various distributions of dead trees, which emerge during the development of spruce stands in the forest model Sibyla. Our study showed that the tested indicators of forest development were not sensitive to the altered distribution of dead trees in the stand and that the hypotheses on the effect of such an alteration on regeneration and increment were not confirmed.
Although the presented findings indicated that tree-based forest models might not consider specific patterns of dead trees emergence in forest stands, there are several limits related to the experimental design used in the current study, which require further investigation. These limits include, for example, the unknown sensitivity of the natural regeneration in the model to the modified stand density induced by the two tested mortality modes. Moreover, there are specific stand structure indicators, which can be more sensitive to tree dis-tribution in a stand than the indicators evaluated here; the sensitivity of such indicators needs to be explored. Still, our study provided a new insight on the development of spruce forest stands in the forests model Sibyla and thus can support the optimized use of the model.
AcknowledgementThis research was funded by projects supported by the Slovak Research and Development Agency under contracts no. APVV-0111-10, APVV-0439-12 and APVV-15-0413, and projects QJ 1220316 and QJ 1220317 supported by the National Agency for Agriculture Research of the Czech Republic.
ReferencesAmbrož, R., Vacek, S., Vacek, Z., Král, J., Štefančík, I., 2015: Cur-
rent and simulated structure, growth parameters and regen-eration of beech forests with different game management in the Lány Game Enclosure. Lesnícky časopis - Forestry Journal, 61:78–88.
Berec, L., Doležal, P., Hais, M., 2013: Population dynamics of Ips typographus in the Bohemian Forest (Czech Republic): Valida-tion of the phenology model PHENIPS and impacts of climate change. Forest Ecology and Management, 292:1–9.
Bircher, N., Cailleret, M., Bugmann, H., 2015: The agony of choice: different empirical mortality models lead to sharply different future forest dynamics. Ecological Applications, 25:1303–1318.
Clark, P. J., Evans, F. C., 1954: Distance to nearest neighbor as a measure of spatial relationships in populations. Ecology, 35:445–453.
Ďurský, J., Pretzsch, H., Kahn, M., 1996: Modellhalfe Nachbil-dung der Mortalität von Fichte und Buche in Einzelbaumsim-ulatoren. Jahrestagung 1996 der Sektion Ertragskunde des DVFFA in Neresheim, Tagungsber, p. 267–277.
177
J. Trombik et al. / Lesn. Cas. For. J. 62 (2016) 173–180
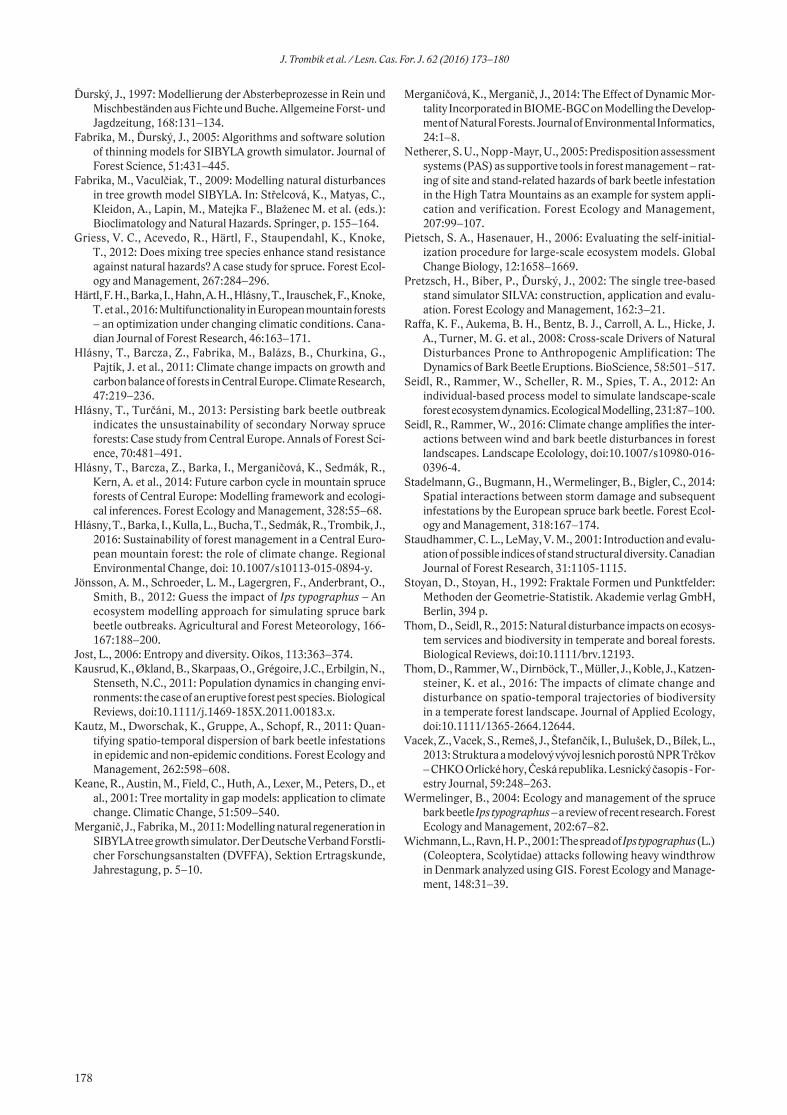
Ďurský, J., 1997: Modellierung der Absterbeprozesse in Rein und Mischbeständen aus Fichte und Buche. Allgemeine Forst- und Jagdzeitung, 168:131–134.
Fabrika, M., Ďurský, J., 2005: Algorithms and software solution of thinning models for SIBYLA growth simulator. Journal of Forest Science, 51:431–445.
Fabrika, M., Vaculčiak, T., 2009: Modelling natural disturbances in tree growth model SIBYLA. In: Střelcová, K., Matyas, C., Kleidon, A., Lapin, M., Matejka F., Blaženec M. et al. (eds.): Bioclimatology and Natural Hazards. Springer, p. 155–164.
Griess, V. C., Acevedo, R., Härtl, F., Staupendahl, K., Knoke, T., 2012: Does mixing tree species enhance stand resistance against natural hazards? A case study for spruce. Forest Ecol-ogy and Management, 267:284–296.
Härtl, F. H., Barka, I., Hahn, A. H., Hlásny, T., Irauschek, F., Knoke, T. et al., 2016: Multifunctionality in European mountain forests – an optimization under changing climatic conditions. Cana-dian Journal of Forest Research, 46:163–171.
Hlásny, T., Barcza, Z., Fabrika, M., Balázs, B., Churkina, G., Pajtík, J. et al., 2011: Climate change impacts on growth and carbon balance of forests in Central Europe. Climate Research, 47:219–236.
Hlásny, T., Turčáni, M., 2013: Persisting bark beetle outbreak indicates the unsustainability of secondary Norway spruce forests: Case study from Central Europe. Annals of Forest Sci-ence, 70:481–491.
Hlásny, T., Barcza, Z., Barka, I., Merganičová, K., Sedmák, R., Kern, A. et al., 2014: Future carbon cycle in mountain spruce forests of Central Europe: Modelling framework and ecologi-cal inferences. Forest Ecology and Management, 328:55–68.
Hlásny, T., Barka, I., Kulla, L., Bucha, T., Sedmák, R., Trombik, J., 2016: Sustainability of forest management in a Central Euro-pean mountain forest: the role of climate change. Regional Environmental Change, doi: 10.1007/s10113-015-0894-y.
Jönsson, A. M., Schroeder, L. M., Lagergren, F., Anderbrant, O., Smith, B., 2012: Guess the impact of Ips typographus – An ecosystem modelling approach for simulating spruce bark beetle outbreaks. Agricultural and Forest Meteorology, 166-167:188–200.
Jost, L., 2006: Entropy and diversity. Oikos, 113:363–374.Kausrud, K., Økland, B., Skarpaas, O., Grégoire, J.C., Erbilgin, N.,
Stenseth, N.C., 2011: Population dynamics in changing envi-ronments: the case of an eruptive forest pest species. Biological Reviews, doi:10.1111/j.1469-185X.2011.00183.x.
Kautz, M., Dworschak, K., Gruppe, A., Schopf, R., 2011: Quan-tifying spatio-temporal dispersion of bark beetle infestations in epidemic and non-epidemic conditions. Forest Ecology and Management, 262:598–608.
Keane, R., Austin, M., Field, C., Huth, A., Lexer, M., Peters, D., et al., 2001: Tree mortality in gap models: application to climate change. Climatic Change, 51:509–540.
Merganič, J., Fabrika, M., 2011: Modelling natural regeneration in SIBYLA tree growth simulator. Der Deutsche Verband Forstli-cher Forschungsanstalten (DVFFA), Sektion Ertragskunde, Jahrestagung, p. 5–10.
Merganičová, K., Merganič, J., 2014: The Effect of Dynamic Mor-tality Incorporated in BIOME-BGC on Modelling the Develop-ment of Natural Forests. Journal of Environmental Informatics, 24:1–8.
Netherer, S. U., Nopp -Mayr, U., 2005: Predisposition assessment systems (PAS) as supportive tools in forest management – rat-ing of site and stand-related hazards of bark beetle infestation in the High Tatra Mountains as an example for system appli-cation and verification. Forest Ecology and Management, 207:99–107.
Pietsch, S. A., Hasenauer, H., 2006: Evaluating the self-initial-ization procedure for large-scale ecosystem models. Global Change Biology, 12:1658–1669.
Pretzsch, H., Biber, P., Ďurský, J., 2002: The single tree-based stand simulator SILVA: construction, application and evalu-ation. Forest Ecology and Management, 162:3–21.
Raffa, K. F., Aukema, B. H., Bentz, B. J., Carroll, A. L., Hicke, J. A., Turner, M. G. et al., 2008: Cross-scale Drivers of Natural Disturbances Prone to Anthropogenic Amplification: The Dynamics of Bark Beetle Eruptions. BioScience, 58:501–517.
Seidl, R., Rammer, W., Scheller, R. M., Spies, T. A., 2012: An individual-based process model to simulate landscape-scale forest ecosystem dynamics. Ecological Modelling, 231:87–100.
Seidl, R., Rammer, W., 2016: Climate change amplifies the inter-actions between wind and bark beetle disturbances in forest landscapes. Landscape Ecolology, doi:10.1007/s10980-016-0396-4.
Stadelmann, G., Bugmann, H., Wermelinger, B., Bigler, C., 2014: Spatial interactions between storm damage and subsequent infestations by the European spruce bark beetle. Forest Ecol-ogy and Management, 318:167–174.
Staudhammer, C. L., LeMay, V. M., 2001: Introduction and evalu-ation of possible indices of stand structural diversity. Canadian Journal of Forest Research, 31:1105-1115.
Stoyan, D., Stoyan, H., 1992: Fraktale Formen und Punktfelder: Methoden der Geometrie-Statistik. Akademie verlag GmbH, Berlin, 394 p.
Thom, D., Seidl, R., 2015: Natural disturbance impacts on ecosys-tem services and biodiversity in temperate and boreal forests. Biological Reviews, doi:10.1111/brv.12193.
Thom, D., Rammer, W., Dirnböck, T., Müller, J., Koble, J., Katzen-steiner, K. et al., 2016: The impacts of climate change and disturbance on spatio-temporal trajectories of biodiversity in a temperate forest landscape. Journal of Applied Ecology, doi:10.1111/1365-2664.12644.
Vacek, Z., Vacek, S., Remeš, J., Štefančík, I., Bulušek, D., Bílek, L., 2013: Struktura a modelový vývoj lesních porostů NPR Trčkov – CHKO Orlické hory, Česká republika. Lesnický časopis - For-estry Journal, 59:248–263.
Wermelinger, B., 2004: Ecology and management of the spruce bark beetle Ips typographus – a review of recent research. Forest Ecology and Management, 202:67–82.
Wichmann, L., Ravn, H. P., 2001: The spread of Ips typographus (L.) (Coleoptera, Scolytidae) attacks following heavy windthrow in Denmark analyzed using GIS. Forest Ecology and Manage-ment, 148:31–39.
178
J. Trombik et al. / Lesn. Cas. For. J. 62 (2016) 173–180
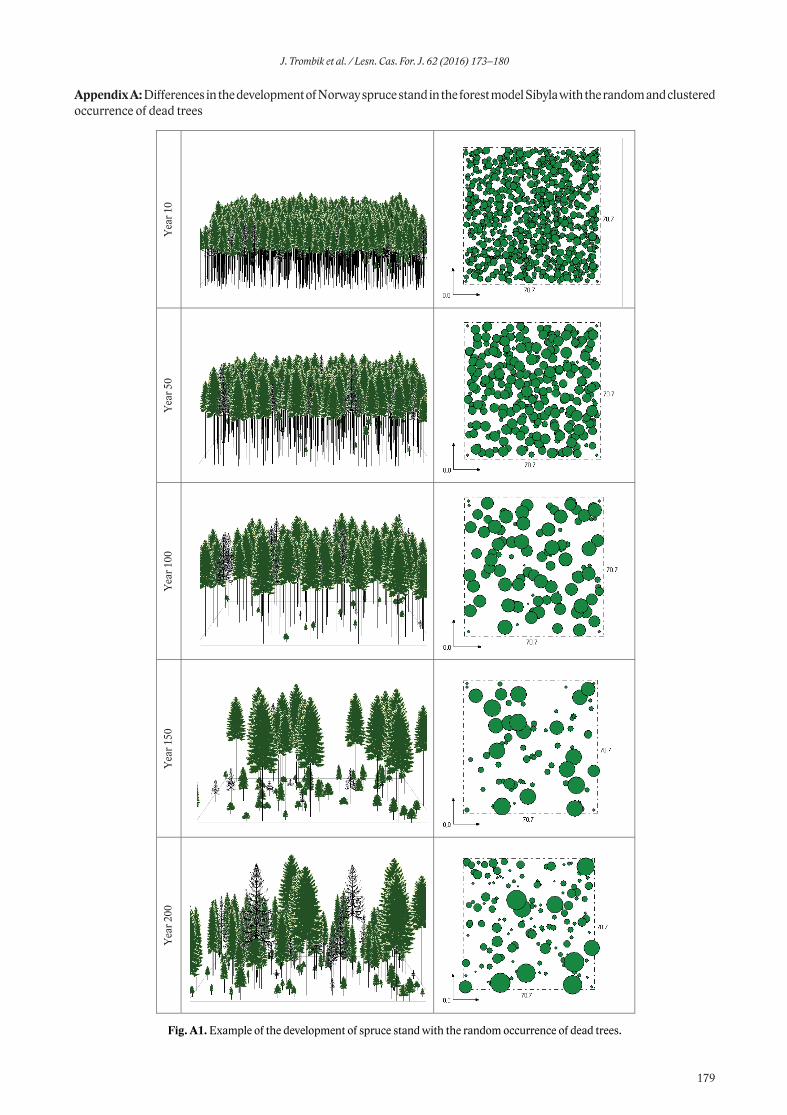
Appendix A: Differences in the development of Norway spruce stand in the forest model Sibyla with the random and clustered occurrence of dead trees
Fig. A1. Example of the development of spruce stand with the random occurrence of dead trees.
179
J. Trombik et al. / Lesn. Cas. For. J. 62 (2016) 173–180
pilna
Obdélník

Fig. A2. Example of the development of spruce stand with the clustered occurrence of dead trees.
180
J. Trombik et al. / Lesn. Cas. For. J. 62 (2016) 173–180
DOI: 10.1515/forj-2016-0022
Biodiversity and climate change: consequences for upper tree line in Slovakia
Jozef Minďaš1*, Jana Škvareninová2
1University of Central Europe in Skalica, Kráľovská 11, SK – 909 01 Skalica, Slovak Republic2Technical University in Zvolen, T. G. Masaryka 53, SK – 960 53 Zvolen, Slovak Republic
AbstractStudy of the effects of climate change on upper tree limit has mainly focused on the diversity of tree species as a result of the ability of spe-cies to tolerate temperature and moisture changes as well as some effects of disturbance regime changes. The tree species diversity chan-ges due to climate change has been analysed via gap model and biodiversity indices. Gap models are individually based on simulations of establishment, growth, and mortality of each tree on the forest plot. Input ecological data for model calculations have been taken from the permanent research plots located in primeval forests in mountainous regions in Slovakia. The results of regional scenarios of the clima-tic change for the territory of Slovakia have been used, from which the values according to the CGCM3.1 (global) model, KNMI and MPI (regional) models. Model results for conditions of the climate change scenarios suggest a shift of the upper forest limit to the region of the present subalpine zone, in supramontane zone. The most significant tree species diversity changes have been identified for the upper tree line and current belt of dwarf pine (Pinus mugo) occurrence. Hill’s index of biodiversity in the upper forest line increased by 30 – 35% for horizon of 2050, resp. by 45 – 50% modeled for the horizon of 2075. Calculated values of Shannon’s index show an even higher increase due to climate change. For horizon 2050 is a roughly of three fold increase and horizon for 2075 by almost fivefold increase in the value of the index. Results from the gap model indicate the increase of tree species diversity 2 – 2,5 times. Key words: tree species diversity; climatic factors; upper tree line; forest management, Slovakia
Editor: Bohdan Konôpka
1. IntroductionUnderstanding how species and ecosystems respond to cli-mate change has become a major focus of ecology and con-servation biology. Modelling approaches provide important tools for making future projections, but current models of the climate-biosphere interface remain overly simplistic, undermining the credibility of projections (McMahon et al. 2011). Global circulation models of climate change predict an increase in mean annual temperature between 2.1 and 4.6 °C by 2080 in the northern temperate zone. The associ-ated changes in the ratio of extinctions and colonizations at the boundaries of species ranges are expected to result in northward range shifts for a lot of species. However, net spe-cies colonization at northern boundary ranges, necessary for a northward shift and for range conservation, may be ham-pered because of habitat fragmentation (Honnay et al. 2002).Climate change can also affect forests and their diversity through disturbances. Disturbances are a natural and inte-gral part of forest ecosystems, and climate change would alter these natural interactions. When disturbances exceed their natural range of variation, the change in forest structure and function may be extreme. Each disturbance affects forests differently. Some disturbances have tight interactions with the species and forest communities which can be disrupted by climate change (Dalea et al. 2000; Mezei et al. 2014).
The high altitude limit of forests, commonly referred to as tree line, timber line or forest line represents one of the most obvious vegetation ecotones. Most authors define tree line as the connecting line between the uppermost forest patches in an area, with trees upright, growing in groups, and at least 3 m in height (Švajda 2008). The upper limit of timber line is conditional on the cumulative effects of several factors. The factor that primarily determines timber line can be used to define types of timber line. Plesník (1971) recognized four types of upper timber line: climatic, orographic, avalanche and edaphic. More recently, Jodłowski (ex Švajda 2008) has distinguished five boundary types using the example of dwarf pine (Pinus mugo). These include: orographic, morphologi-cal, edaphic, mechanically lowered and anthropogenic dwarf pine line. An orographic timber line is located in the valley bottoms or on the watershed ridges and is controlled by cli-matic factors (e.g. solar radiation, and wind). An edaphic timber line results from lack of soil cover on talus slopes with block covers. A morphological line corresponds with slope-breaks or footsteps of rockfaces. A mechanically low-ered timber line is controlled by avalanches or debris flows. Finally, an anthropogenic timber line exists where sites with intensive mountain-pine reconstruction have moved trees several hundred meters upslope and there is an abrupt tran-sition between mountain-pine thickets and alpine meadows (Švajda 2008).
*Corresponding author. Jozef Minďáš, e-mail: [email protected], phone: +421 911 444 543
ORIGINAL PAPER http://www.nlcsk.sk/fj/
Lesn. Cas. For. J. 62 (2016) 181–185
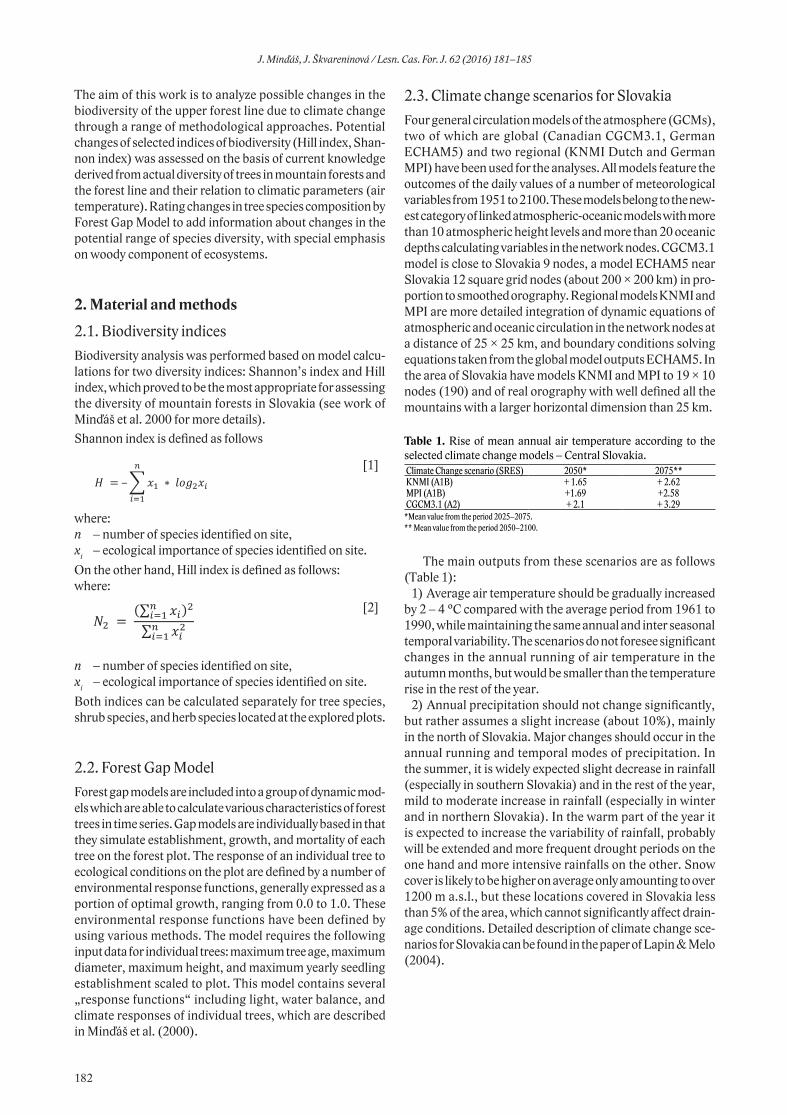
The aim of this work is to analyze possible changes in the biodiversity of the upper forest line due to climate change through a range of methodological approaches. Potential changes of selected indices of biodiversity (Hill index, Shan-non index) was assessed on the basis of current knowledge derived from actual diversity of trees in mountain forests and the forest line and their relation to climatic parameters (air temperature). Rating changes in tree species composition by Forest Gap Model to add information about changes in the potential range of species diversity, with special emphasis on woody component of ecosystems.
2. Material and methods
2.1. Biodiversity indicesBiodiversity analysis was performed based on model calcu-lations for two diversity indices: Shannon’s index and Hill index, which proved to be the most appropriate for assessing the diversity of mountain forests in Slovakia (see work of Minďáš et al. 2000 for more details).Shannon index is defined as follows
where:n – number of species identified on site,xi – ecological importance of species identified on site.On the other hand, Hill index is defined as follows:where:
n – number of species identified on site,xi – ecological importance of species identified on site.Both indices can be calculated separately for tree species, shrub species, and herb species located at the explored plots.
2.2. Forest Gap ModelForest gap models are included into a group of dynamic mod-els which are able to calculate various characteristics of forest trees in time series. Gap models are individually based in that they simulate establishment, growth, and mortality of each tree on the forest plot. The response of an individual tree to ecological conditions on the plot are defined by a number of environmental response functions, generally expressed as a portion of optimal growth, ranging from 0.0 to 1.0. These environmental response functions have been defined by using various methods. The model requires the following input data for individual trees: maximum tree age, maximum diameter, maximum height, and maximum yearly seedling establishment scaled to plot. This model contains several „response functions“ including light, water balance, and climate responses of individual trees, which are described in Minďáš et al. (2000).
2.3. Climate change scenarios for SlovakiaFour general circulation models of the atmosphere (GCMs), two of which are global (Canadian CGCM3.1, German ECHAM5) and two regional (KNMI Dutch and German MPI) have been used for the analyses. All models feature the outcomes of the daily values of a number of meteorological variables from 1951 to 2100. These models belong to the new-est category of linked atmospheric-oceanic models with more than 10 atmospheric height levels and more than 20 oceanic depths calculating variables in the network nodes. CGCM3.1 model is close to Slovakia 9 nodes, a model ECHAM5 near Slovakia 12 square grid nodes (about 200 × 200 km) in pro-portion to smoothed orography. Regional models KNMI and MPI are more detailed integration of dynamic equations of atmospheric and oceanic circulation in the network nodes at a distance of 25 × 25 km, and boundary conditions solving equations taken from the global model outputs ECHAM5. In the area of Slovakia have models KNMI and MPI to 19 × 10 nodes (190) and of real orography with well defined all the mountains with a larger horizontal dimension than 25 km.
Table 1. Rise of mean annual air temperature according to the selected climate change models – Central Slovakia.Climate Change scenario (SRES) 2050* 2075**KNMI (A1B) + 1.65 + 2.62MPI (A1B) +1.69 +2.58CGCM3.1 (A2) + 2.1 + 3.29
*Mean value from the period 2025–2075.** Mean value from the period 2050–2100.
The main outputs from these scenarios are as follows (Table 1):
1) Average air temperature should be gradually increased by 2 – 4 °C compared with the average period from 1961 to 1990, while maintaining the same annual and inter seasonal temporal variability. The scenarios do not foresee significant changes in the annual running of air temperature in the autumn months, but would be smaller than the temperature rise in the rest of the year.
2) Annual precipitation should not change significantly, but rather assumes a slight increase (about 10%), mainly in the north of Slovakia. Major changes should occur in the annual running and temporal modes of precipitation. In the summer, it is widely expected slight decrease in rainfall (especially in southern Slovakia) and in the rest of the year, mild to moderate increase in rainfall (especially in winter and in northern Slovakia). In the warm part of the year it is expected to increase the variability of rainfall, probably will be extended and more frequent drought periods on the one hand and more intensive rainfalls on the other. Snow cover is likely to be higher on average only amounting to over 1200 m a.s.l., but these locations covered in Slovakia less than 5% of the area, which cannot significantly affect drain-age conditions. Detailed description of climate change sce-narios for Slovakia can be found in the paper of Lapin & Melo (2004).
[1]
[2]
182
J. Minďáš, J. Škvareninová / Lesn. Cas. For. J. 62 (2016) 181–185
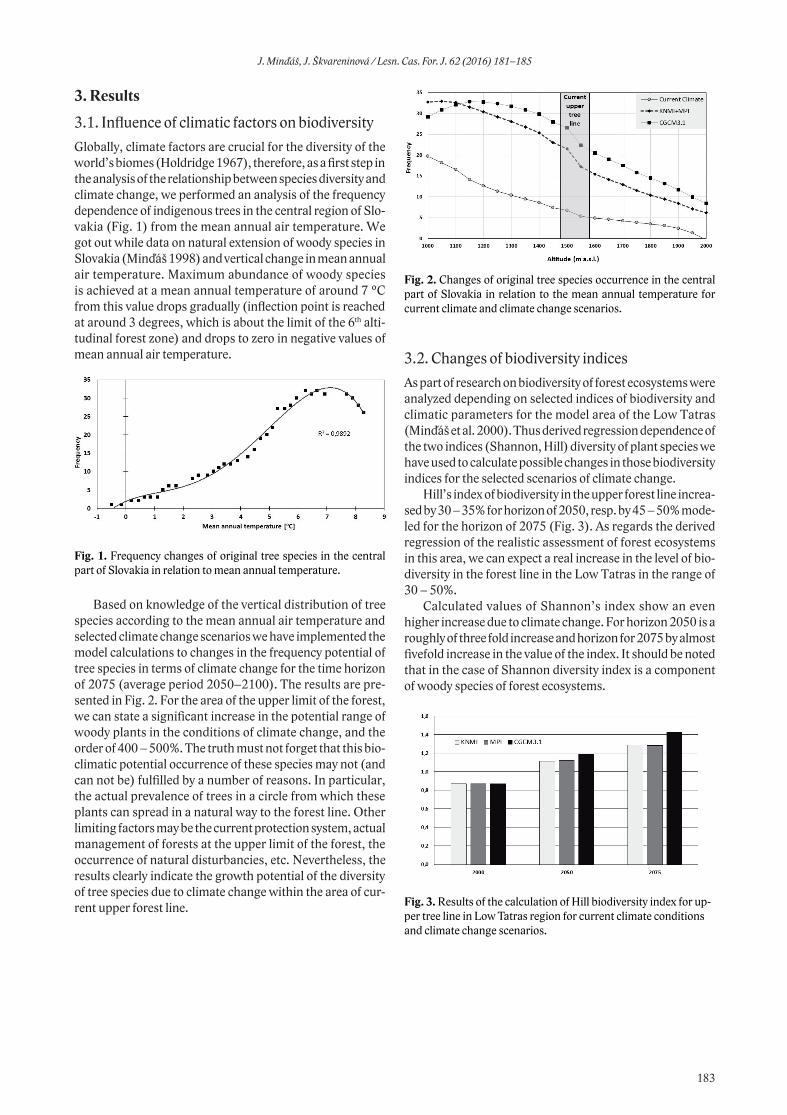
3. Results
3.1. Influence of climatic factors on biodiversityGlobally, climate factors are crucial for the diversity of the world’s biomes (Holdridge 1967), therefore, as a first step in the analysis of the relationship between species diversity and climate change, we performed an analysis of the frequency dependence of indigenous trees in the central region of Slo-vakia (Fig. 1) from the mean annual air temperature. We got out while data on natural extension of woody species in Slovakia (Minďáš 1998) and vertical change in mean annual air temperature. Maximum abundance of woody species is achieved at a mean annual temperature of around 7 °C from this value drops gradually (inflection point is reached at around 3 degrees, which is about the limit of the 6th alti-tudinal forest zone) and drops to zero in negative values of mean annual air temperature.
Fig. 1. Frequency changes of original tree species in the central part of Slovakia in relation to mean annual temperature.
Based on knowledge of the vertical distribution of tree species according to the mean annual air temperature and selected climate change scenarios we have implemented the model calculations to changes in the frequency potential of tree species in terms of climate change for the time horizon of 2075 (average period 2050–2100). The results are pre-sented in Fig. 2. For the area of the upper limit of the forest, we can state a significant increase in the potential range of woody plants in the conditions of climate change, and the order of 400 – 500%. The truth must not forget that this bio-climatic potential occurrence of these species may not (and can not be) fulfilled by a number of reasons. In particular, the actual prevalence of trees in a circle from which these plants can spread in a natural way to the forest line. Other limiting factors may be the current protection system, actual management of forests at the upper limit of the forest, the occurrence of natural disturbancies, etc. Nevertheless, the results clearly indicate the growth potential of the diversity of tree species due to climate change within the area of cur-rent upper forest line.
Fig. 2. Changes of original tree species occurrence in the central part of Slovakia in relation to the mean annual temperature for current climate and climate change scenarios.
3.2. Changes of biodiversity indicesAs part of research on biodiversity of forest ecosystems were analyzed depending on selected indices of biodiversity and climatic parameters for the model area of the Low Tatras (Minďáš et al. 2000). Thus derived regression dependence of the two indices (Shannon, Hill) diversity of plant species we have used to calculate possible changes in those biodiversity indices for the selected scenarios of climate change.
Hill’s index of biodiversity in the upper forest line increa-sed by 30 – 35% for horizon of 2050, resp. by 45 – 50% mode-led for the horizon of 2075 (Fig. 3). As regards the derived regression of the realistic assessment of forest ecosystems in this area, we can expect a real increase in the level of bio-diversity in the forest line in the Low Tatras in the range of 30 – 50%.
Calculated values of Shannon’s index show an even higher increase due to climate change. For horizon 2050 is a roughly of three fold increase and horizon for 2075 by almost fivefold increase in the value of the index. It should be noted that in the case of Shannon diversity index is a component of woody species of forest ecosystems.
Fig. 3. Results of the calculation of Hill biodiversity index for up-per tree line in Low Tatras region for current climate conditions and climate change scenarios.
183
J. Minďáš, J. Škvareninová / Lesn. Cas. For. J. 62 (2016) 181–185
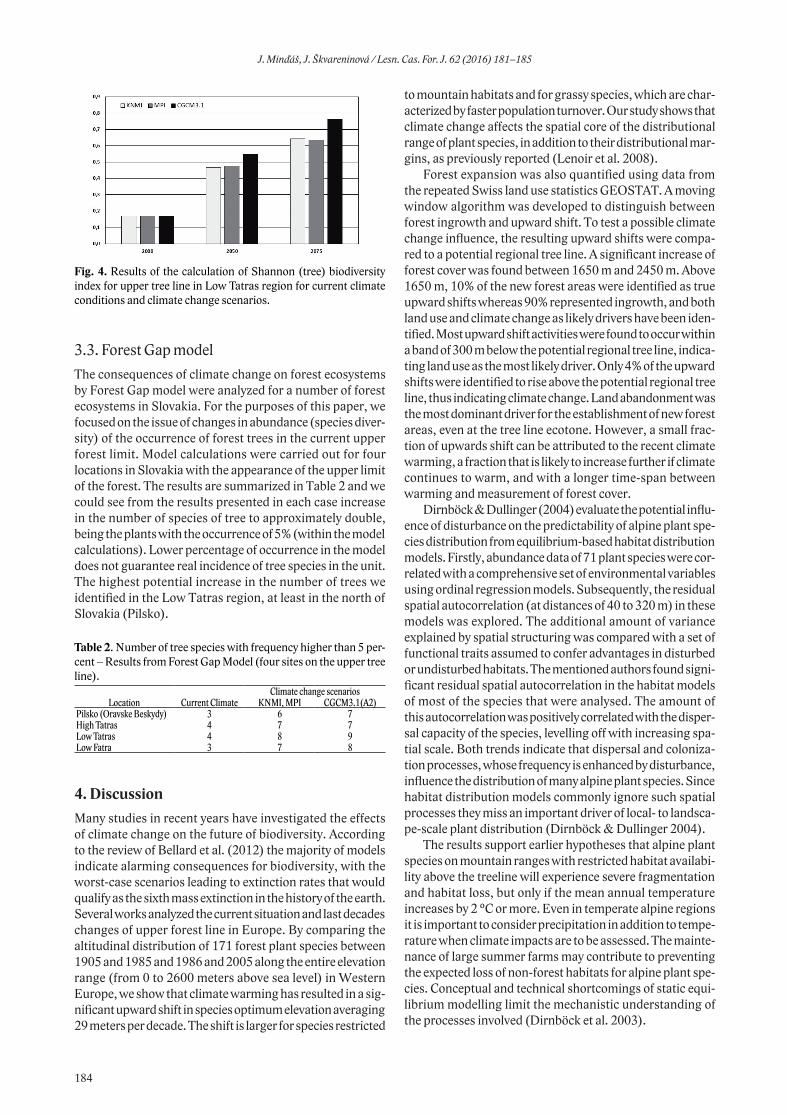
Fig. 4. Results of the calculation of Shannon (tree) biodiversity index for upper tree line in Low Tatras region for current climate conditions and climate change scenarios.
3.3. Forest Gap modelThe consequences of climate change on forest ecosystems by Forest Gap model were analyzed for a number of forest ecosystems in Slovakia. For the purposes of this paper, we focused on the issue of changes in abundance (species diver-sity) of the occurrence of forest trees in the current upper forest limit. Model calculations were carried out for four locations in Slovakia with the appearance of the upper limit of the forest. The results are summarized in Table 2 and we could see from the results presented in each case increase in the number of species of tree to approximately double, being the plants with the occurrence of 5% (within the model calculations). Lower percentage of occurrence in the model does not guarantee real incidence of tree species in the unit. The highest potential increase in the number of trees we identified in the Low Tatras region, at least in the north of Slovakia (Pilsko).
Table 2. Number of tree species with frequency higher than 5 per-cent – Results from Forest Gap Model (four sites on the upper tree line).
Climate change scenariosLocation Current Climate KNMI, MPI CGCM3.1(A2)
Pilsko (Oravske Beskydy) 3 6 7High Tatras 4 7 7Low Tatras 4 8 9Low Fatra 3 7 8
4. Discussion Many studies in recent years have investigated the effects of climate change on the future of biodiversity. According to the review of Bellard et al. (2012) the majority of models indicate alarming consequences for biodiversity, with the worst-case scenarios leading to extinction rates that would qualify as the sixth mass extinction in the history of the earth. Several works analyzed the current situation and last decades changes of upper forest line in Europe. By comparing the altitudinal distribution of 171 forest plant species between 1905 and 1985 and 1986 and 2005 along the entire elevation range (from 0 to 2600 meters above sea level) in Western Europe, we show that climate warming has resulted in a sig-nificant upward shift in species optimum elevation averaging 29 meters per decade. The shift is larger for species restricted
to mountain habitats and for grassy species, which are char-acterized by faster population turnover. Our study shows that climate change affects the spatial core of the distributional range of plant species, in addition to their distributional mar-gins, as previously reported (Lenoir et al. 2008).
Forest expansion was also quantified using data from the repeated Swiss land use statistics GEOSTAT. A moving window algorithm was developed to distinguish between forest ingrowth and upward shift. To test a possible climate change influence, the resulting upward shifts were compa-red to a potential regional tree line. A significant increase of forest cover was found between 1650 m and 2450 m. Above 1650 m, 10% of the new forest areas were identified as true upward shifts whereas 90% represented ingrowth, and both land use and climate change as likely drivers have been iden-tified. Most upward shift activities were found to occur within a band of 300 m below the potential regional tree line, indica-ting land use as the most likely driver. Only 4% of the upward shifts were identified to rise above the potential regional tree line, thus indicating climate change. Land abandonment was the most dominant driver for the establishment of new forest areas, even at the tree line ecotone. However, a small frac-tion of upwards shift can be attributed to the recent climate warming, a fraction that is likely to increase further if climate continues to warm, and with a longer time-span between warming and measurement of forest cover.
Dirnböck & Dullinger (2004) evaluate the potential influ-ence of disturbance on the predictability of alpine plant spe-cies distribution from equilibrium-based habitat distribution models. Firstly, abundance data of 71 plant species were cor-related with a comprehensive set of environmental variables using ordinal regression models. Subsequently, the residual spatial autocorrelation (at distances of 40 to 320 m) in these models was explored. The additional amount of variance explained by spatial structuring was compared with a set of functional traits assumed to confer advantages in disturbed or undisturbed habitats. The mentioned authors found signi-ficant residual spatial autocorrelation in the habitat models of most of the species that were analysed. The amount of this autocorrelation was positively correlated with the disper-sal capacity of the species, levelling off with increasing spa-tial scale. Both trends indicate that dispersal and coloniza-tion processes, whose frequency is enhanced by disturbance, influence the distribution of many alpine plant species. Since habitat distribution models commonly ignore such spatial processes they miss an important driver of local- to landsca-pe-scale plant distribution (Dirnböck & Dullinger 2004).
The results support earlier hypotheses that alpine plant species on mountain ranges with restricted habitat availabi-lity above the treeline will experience severe fragmentation and habitat loss, but only if the mean annual temperature increases by 2 °C or more. Even in temperate alpine regions it is important to consider precipitation in addition to tempe-rature when climate impacts are to be assessed. The mainte-nance of large summer farms may contribute to preventing the expected loss of non-forest habitats for alpine plant spe-cies. Conceptual and technical shortcomings of static equi-librium modelling limit the mechanistic understanding of the processes involved (Dirnböck et al. 2003).
184
J. Minďáš, J. Škvareninová / Lesn. Cas. For. J. 62 (2016) 181–185

5. ConclusionThe results indicate significant potential for positive changes of ecosystems in the forest line. Our findings clearly indi-cate significant changes in the current upper limit of the forest, where in the next few decades we can expect further alterations in species composition of these ecosystems. The changes can be expected on tree, shrub and herbaceous species diversities. Important factors that can enhance or dampen growth trends of species diversity, are not only anthropogenic factors, in particular the management of these ecosystems, but also natural factors especially distur-bances (e.g. wind, snow, insects).
Biodiversity of forest ecosystems is still open scientific problem, especially in terms of the complexity of the asses-sment. Most of the work on that topic is mainly focused on diversity of woody components, but this certainly is not suf-ficient for assessing biodiversity of forest ecosystems as a whole. The results suggest potential and vector direction of possible changes in diversity, particularly forest trees in the forest line impacts of climate change. However, we are aware that in the future we will have to resort to more com-plex model analysis on the basis of multifactorial models and assessments of biodiversity change (Acton 2013).
AcknowledgementThe author thanks to University of Central Europe in Skalica (Slo-vakia) for the support of internal grant related to climate change research. This work was also accomplished as a part of VEGA projects No.: 1/0463/14, 1/0589/15, of the Ministry of Education, Science, Research and Sport of the Slovak Republic and the Slovak Academy of Science; and the projects of the Slovak Research and Development Agency No.: APVV-0423-10, APVV-15-0425 and APVV-15-0497. The authors thank the agencies for the support.
ReferencesActon, Q., A. ed., 2013: Issues in Global Environment – Biodiver-
sity Resources, and Conservation, 2013 Edition. Published by ScholarlyEditions, Atlanta, Georgia.
Bellard, C., Bertelsmeier, C., Leadley, P., Thuiller, W., Courchamp, F., 2012: Impacts of climate change on the future of biodiver-sity. Ecology Letters, 15:365–377.
Dalea, V. H., Joyceb, L. A., McNultyc, S., Neilsond, R. P., 2000: The interplay between climate change, forests, and disturbances. Science of The Total Environment, 262:201–204.
Dirnböck, T., Dullinger, S., 2004: Habitat distribution models, spa-tial autocorrelation, functional traits and dispersal capacity of alpine plant species. Journal of Vegetation Science, 15:77–84.
Dirnböck, T., Dullinger, S., Grabherr, G. A., 2003: A regional impact assessment of climate and land-use change on alpine vegetation. Journal of Biogeography, 30:401–417.
Gehrig, J. et al., 2007: Tree line shifts in the Swiss Alps: Climate change or land abandonment? Journal of Vegetation Science, 18:571–582.
Holdridge, L. R., 1967: Life zone ecology. Tropical Science Center. San Jose, Costa Rica.
Honnay, O., Verheyen, K., Butaye, J., Bossuyt, B., Hermy, M., 2002: Possible effects of habitat fragmentation and climate change on the range of forest plant species. Ecology Letters, 5:525–530.
Lapin, M., Melo, M., 2004: Methods of climate change scenarios projection in Slovakia and selected results. Journal of Hydrol-ogy and Hydromechanics, 52:224–238.
Lenoir, J., Gégout, J. C., Marquet, P. A., de Ruffray, P., Brisse, H., 2008: Significant Upward Shift in Plant Species Optimum Elevation During the 20th Century. Science, 320:1768–1771.
McMahon, S. M., Harrison, S. P., Armbruster, W. S., Bartlein, P. J., Beale, C. M., Edwards, M. E. et al., 2011: Improving assessment and modelling of climate change impacts on global terrestrial biodiversity. Trends in Ecology&Evolution, 26:249–259.
Mezei, P., Grodzki, W., Blaženec, M., Škvarenina, J., Brandý-sová, V., Jakuš, R., 2014: Host and site factors affecting tree mortality caused by the spruce bark beetle (Ips typographus) in mountainous conditions. Forest Ecology and Management, 331:196–207.
Minďáš, J., 1998: Vertical climatic ranges of forest trees in Western Carpathian region. Acta Instituti Forestalis Zvolen, 9:29–41.
Minďáš, J. Pavlenda, P., Jankovič, J., Ištoňa, J., 2000: Influence of site factors on biodiversity of forest communities in the study area of Low Tatras Mts., Lesnícky časopis - Forestry Journal, 46:287–301.
Minďáš, J., Škvarenina, J., Sřrelcová, K., Priwitzer, T., 2000: Influ-ence of climatic changes on Norway spruce occurrence in the West Carpathians. Journal of Forest Science, 46:249–259.
Švajda, J., 2008: Climate change and timber line in the European mountains – current knowledge and perspectives. Oecologia Montana, 17:30–33.
185
J. Minďáš, J. Škvareninová / Lesn. Cas. For. J. 62 (2016) 181–185

Since 1st January, 2016, Slovakia holds the presidency in the FOREST EUROPE process (formerly known as Min-isterial Conference on the Protection of Forests in Europe), therefore, Slovakia also hosts the secretariat of the process – the Liaison Unit Bratislava (LUB) which was established within organisational structure of the National Forest Cen-tre in Zvolen. FOREST EUROPE is a unique forest policy process addressing and developing common decisions on issues of the highest political relevance. Having recently celebrated its 25th anniversary, the process has 47 signato-ries (46 European countries and the European Union), and a number of other observer countries and organizations also participate. Key outputs include Criteria and Indicators for Sustainable Forest Management, Pan European Approach to National Forest Programs and comprehensive report State of Europe´s Forests, among the others.
FOREST EUROPE Work ProgrammeThe new FOREST EUROPE Work Programme for the period 2016–2020 was prepared by the Liaison Unit Brati-slava in cooperation with the former Liaison United Madrid and under the oversight of the General Coordinating Com-mittee. The Work Programme reflects commitments made at the 7th Ministerial Conference and the Extraordinary Min-isterial Conference, held on 20–21 October 2016, in Madrid, Spain. In addition, some of the planned actions (broader the-matic areas) and activities (such as expert groups, analyses and workshops) also refer to the commitments adopted at previous FOREST EUROPE Ministerial Conferences. The policy goals for European Forests and the European 2020 Targets for Forests adopted at the 6th Ministerial Conference in Oslo (2011) need to be addressed through this Work Pro-gramme as well.
The main objective of the Work Programme is to continue to promote sustainable forest management (SFM) in signa-tory countries, reflecting latest developments, knowledge, and innovations on emerging issues, and to develop common strategies to this end.
The activities of the Work Programme will be carried out in cooperation with FOREST EUROPE signatories and observers, the Liaison Unit, and other relevant regional actors. Cooperation with regional bodies and processes within Europe and, where relevant, in a broader geographi-cal context (e.g. United Nations Economic Commission for Europe - UNECE, Food and Agricultural Organisation - FAO, United Nations Environmental Programme - UNEP, European Forest Institute - EFI, United Nations Forum on Forests - UNFF, Convention on Biological Diversity - CBD, United Nations Framework Convention on Climate Change - UNFCCC, United Nations Convention to Combat Desertification - UNCCD, and International Union of For-est Research Organizations - IUFRO) will be strengthened, and synergies in the implementation of the relevant Work Programmes will be sought, following dialogue with the entities listed, specifically with the UNECE/FAO Integrated
Programme of Work. Further efforts to reach out to other sectors will also be made.
The Work Programme is fully aligned with the latest relevant global initiatives, such as the 2030 Agenda and its Sustainable Development Goals (SDGs), the UNFF11 Reso-lution, and the Paris Agreement, and, where relevant, will seek to contribute to their implementation.
The FOREST EUROPE Work Programme for the period 2016–2020 comprises following actions and activities: – Further development and updating of policies and tools
for sustainable forest management. This overarching action will contribute to better coordination of policy tools on forests and forest management at global, regional, sub regional and national levels, e.g. the 2030 Agenda including its SDGs, the Aichi Biodiversity Targets, Glo-bal objectives on Forests, regional C&I process and their subsets for the assessment of SFM, and Global Forest Resource Assessments (FRAs), and to communication between them and other sectors. The Expert Group will consider implementation of the updated set of SFM indi-cators, inter alia, monitor and analyse how C&I are devel-oped and how they could be implemented. Apart from that, possible uses of the pan-European C&I subsets and reporting on national and pan-European achievements on Goals and 2020 Targets for European Forests. The output of the analysis should include detailed explanation and clarification of the particular subsets, inter alia, for assessing and communicating the achievements of SFM and addressing other policy areas.
– Forest monitoring and reporting. Monitoring and report-ing on forests and SFM, including the preparation and production of the State of Europe’s Forests Report (SoEF), belong to regular FOREST EUROPE activities. Collaborative data collection for the next edition of SoEF 2020 should be done in close cooperation with FAO Glo-bal Forest Resources Assessments and Joint UNECE/FAO Forestry and Timber Section. Within this action, also the pilot studies on new indicators will be carried out, in terms of data availability, reliability and feasibility for three newly defined indicators (2.5 Forest land degrada-tion, 4.7 Forest fragmentation, 4.10 Common forest bird species). Pan-European forest monitoring and reporting should also facilitate the evaluation of achievements on Goals and 2020 Targets for European Forests.
– Enhancing the role of sustainable forest management in a green economy. FOREST EUROPE with the assist-ance of Expert Group and in collaboration with partners (signatory countries and relevant international institu-tions) will identify and specify new skills required for forest workers, forest managers and forest owners in the context of green economy as well as other require-ments for green jobs in the forest sector. Subsequently, achievements of the Expert Group will be discussed at
FOREST EUROPE Work Programme: Pan-European Follow-Up of the Madrid Ministerial Conferences
RepoRts http://www.nlcsk.sk/fj/
Lesn. Cas. For. J. 62 (2016) 186–194
a workshop. Outcomes of the workshop including rec-ommendations and best practice examples will lead to preparation of guidelines on the promotion of green jobs in the forest sector. Another workshop will be organized to promote long term competitiveness of the whole forest sector and its related value chain, highlighting the role of wood and other forest products and goods from sustain-able sources, including innovative materials contributing to transition to a green economy.
– Incorporating the value of forest ecosystem services in a green economy. FOREST EUROPE Expert Group will carry out an analysis of different approaches, method-ologies and best practice examples on valuation of and payments for forest ecosystem services (FES) particu-larly in the signatory countries. Subsequently, recom-mendations for policy makers with the aim to facilitate implementation of valuation of and payments for FES will be developed. Outcomes of the analysis will serve as a base for establishment of a web-based portal in order to promote exchange of information and experience on valuation of FES and PES schemes existing in the pan-European region.
– Protection of forests in a changing environment, includ-ing their adaptation to climate change. Within this action, an Expert Group will conduct a questionnaire survey to explore the current state of implementation of adaptation measures to climate change at national levels. Based on the survey, a publication “Integration of adap-tation measures into SFM in Europe” will be worked out, comprising knowledge base and work done in the region, identifying the best practices and possible recommenda-tions for the integration of adaptation measures into SFM in the region. Two workshops shall be organized within this action to share expertise, experience and prepare rec-ommendation for policy makers on protection of forests in changing environments combating desertification, land degradation and drought, highlighting the role of forestry and agroforestry to this end.
– Enhancing the social dimension of sustainable forest management in the context of the benefits of forests to human health and well-being. A group of experts will review international data on social aspects of SFM with special attention to impacts and benefits of forest environment and forest products on human health and well-being. A workshop will be convened to share knowl-edge, experience and best practice examples relating to impact of forests on human health (mental and physical), well-being and personal development. Outcomes of the review together with recommendations from the work-shop will result in publication focused on promotion of entrepreneurship related to forests and businesses based on processing of non-wood products (ecotourism, sport, outdoor learning and therapy programmes). Apart from that, awareness raising and promotion of the topic within and outside forest sector (health sector, tourism, sport, education, etc.) will be crucial for successful implementa-tion of the action.
– Review of the FoREst EuRoPE process. The objective of this activity will be to further develop the FOREST EUROPE process with a view to adapting it to current and future challenges, and to enhance its contribution to the promotion of SFM in Europe. The subject of the Review will be the FOREST EUROPE process, its struc-ture, procedures and work modalities, in order to make it more effective and inclusive.
– Discussion on the follow-up to the Madrid Extraordinary Ministerial Conference. Building upon the efforts made in previous years, FOREST EUROPE will explore pos-sible ways to find common ground for a Legally Binding Agreement on Forests in Europe.
– Communication and outreach. The communication activities should further enhance the positive perception of forest and the forest sector’s multiple contributions to global and societal needs, as well as the achievements of its overall objectives. Some new communication activi-ties such as “Whiteboard” short animation about FOR-EST EUROPE, Interactive “story maps” with success-fully implemented FOREST EUROPE commitments will be launched. A new FOREST EUROPE webpage will have new, modern and all-devices responsive design, easy orientation or event management system. Moreover, the process will be promoted at the core events (i.e. Interna-tional Day of Forests, European Forest Week, Sessions of FAO Committee on Forestry - COFO, Sessions of the UNECE Committee on Forests and Forest Industry - COFFI, UNFF meetings etc.).
First FOREST EUROPE meetings organized during the Slovak chairmanship
FOREST EUROPE Expert Level MeetingOn 11–12 May 2016, Bratislava hosted the first Expert Level Meeting (ELM) since the Slovak Republic took over the chairmanship of the FOREST EUROPE process. Nearly 70 delegates representing 29 signatory countries, the European Union and 14 observer organisations attended the meeting. ELM represents the decision-making body of the FOREST EUROPE process in the period between Ministerial Confer-ences. The recent ELM was prepared by the new Liaison Unit Bratislava under the oversight of the General Coordinating Committee, which currently consists of the Slovak Republic, Spain, Germany, Turkey and Sweden. Ms. Gabriela Matečná, Minister of Agriculture and Rural Development of the Slovak Republic, opened the meeting and expressed in her introduc-tory speech the importance of the task and the responsibility that Slovakia bears for the FOREST EUROPE process. A key objective of the meeting was the discussion and adoption of the new FOREST EUROPE Work Programme and its pan-European actions and activities in follow up to the Madrid Ministerial Conferences. Besides the Work Programme, the ELM also discussed next steps in the Review of the FOREST EUROPE process.
187
Reports / Lesn. Cas. For. J. 62 (2016) 186–194

First meeting of the Working Group on the Future Direction of FOREST EUROPEAt the Madrid Ministerial Conference held in October 2015, the FOREST EUROPE signatories and observers had decided on a review of the process, especially its structures, procedures and work modalities with a view to adapting to current and future challenges. The review was launched by adopting the Terms of Reference with Roadmap, and by appointing two co-chair countries, France and Ukraine, to lead the Working Group on the Future Direction of FOREST EUROPE at the Expert Level Meeting in May 2016.
The first meeting of the Working Group took place on 12–13 October 2016, in Bratislava. Participants from 21 sig-natory countries and the European Union as well as 7 inter-national observer organizations attended the event, which indicates a keen interest in the momentum generated by the review. The format of the meeting was a discussion forum to
Fig. 1. Expert Level Meeting was opened by Ms. Gabriela Matečná, the minister of Agriculture and Rural Development of the Slovak Republic.
Fig. 2. Delegates of 29 signatory countries and 14 observer or-ganisation discussed at ELM the new FOREST EUROPE Work Programme for the up-coming period 2016–2020.
Fig. 3. Mr. Peter Kicko, Director General of the Forestry and Wood Processing Section of the Ministry of Agriculture and Rural Development officially opened the first meeting of the Working Group on the Future Direction of FOREST ERUOPE.
Fig. 4. Meeting of the Working Group was led by two co-chairs Ms. Claire Morlot (France) and Ms. Liubov Poliakova (Ukraine) with technical and administrative support by the Liaison Unit Bratislava.
enable brainstorming about issues that require attention and will need to be addressed. There was an ample discussion on the multiple factors that influence efficiency, effectiveness, transparency and inclusiveness of the process. Outcomes of the discussion provide a key input to the comprehensive, web-based questionnaire survey of opinions of all signatories and observers to be conducted in the beginning of 2017.
According to the roadmap discussed at the meeting, the second meeting of the Working Group to evaluate survey results and produce a draft report will take place by June 2017. The final report with recommendations will then be presented to the Expert Level Meeting in autumn 2017.
Lucia AmbrušováĽudmila Marušáková
National Forest Centre - FOREST EUROPE Liaison Unit Bratislava, T. G. Masaryka 2175/22, SK – 960 92 Zvolen,
Slovak Republic, e-mail: [email protected]
188
Reports / Lesn. Cas. For. J. 62 (2016) 186–194

Soils belong to the most complex and heterogeneous com-ponents of ecosystems. They exhibit a great abundance and diversity of soil organisms, e.g. up to 106 species of bacteria were identified per gram of soil. There is currently much interest in the relationship between soil microbial diversity and ecosystem functioning. The main question is whether diverse microbial community is better adapted to promote ecosystem functioning in comparison to species poor micro-bial communities. This is also one of the reasons why in May 2014 the COST Action FP1305 “Linking belowground biodiversity and ecosystem function in European forests (Biolink)” started. Biolink is aimed to create a forum where current understanding of functional belowground biodiver-sity at different scales and trophic levels in European forests can guide development of prescriptions for sustainable for-ests and tree crop management.
The 5th meeting of Biolink carried out during 24 – 26 Octo-ber 2016 in Průhonice near Prague. The meeting attended over 90 participants from 26 countries of Europa, Near East and Africa. The introduction of the meeting was carried out on Monday, 24 October 2016, late afternoon by Martin Lukáč from the University of Reading (UK), the COST Action Chair, and Pavel Cudlin from the Czech Academy of Sciences in Prague (CZ) as the main local organizer, who shortly presented the aim and program of the meeting and opened a poster session where especially young researchers could present their work and discuss it with others.
The plenary lectures in next two days were organized in five sessions and twenty oral communications. On Tuesday, 12 researchers including three invited speakers presented their results during three sessions. Miroslav Vosátka, the director of the Institute of Botany by the Czech Academy of Sciences, informed shortly about the history and focus of the Institute. As he stated, the Institute of Botany is located in the Průhonice Castle since 1962. It performs research on vegetation at the level of organism, population, communities of plants and ecosystems, and in the whole scope of disci-plines such as taxonomy, biosystematics and phytogeogra-phy of higher and lower plants including selected groups of fungi, plant ecology, mycorrhizal symbioses etc. Currently,
the institute is especially concerned on biodiversity and evolutionary trends among plants, ecology of invasive spe-cies, responses of plants and vegetation to environmental changes and the mechanisms that enable species to coexist in ecosystems.
Matty Berg (NL), the first invited speaker, pointed dur-ing his presentation “Reaction of communities and ecosys-tems to environmental change: a trait approach” that the pre-diction of species distribution across time and space is very difficult and we need more information to understand the link between stress – community response to stress – community effect on processes – ecosystem function. On the example of snails and isopods he demonstrated a trait approach, the linkage between response and effect traits and a need for quality trait databases. The presentation of Christoph Rosinger (AT) dealt with ectomycorrhiza (ECM), especially with the significance of rare ECM species for biodiversity. As he stated, 20–25 thousands of ECM species were globally identified until now. The study in 72 stands of beech, spruce and pine forests showed that while 67% of ECM species were found solely on one site, only 4% of species were found on more than five sites. The most important driver of ECM occurrence seems to be the host taxon; there is only a few rare multi-host species. Elena Vanguelova (UK) discussed the effect of tree species on soil microbial community in young as well as mature stands. The results showed that in young stands soil movement during site preparation and planting might have a major effect on soil microbial community dur-ing first five years of stand development. In mature stands, the effect of trees was identified, but it differed depending on soil type and climate. Paolo Nannipieri (IT), the second invited speaker, pointed that by knowing microbial diversity it may be possible to manipulate soil and the capacity of soil to resist to stress may depend on microbial diversity. While there is a redundancy for C and N-mineralisation (different species have the same role), some soil processes, e.g. nitri-fication depend only on some microbial species. He pointed also on the role of omics in analysing microbial community. Johannes Rousk (SE) investigated how warming (+1.1 °C) and litter addition treatments in the subarctic influence the
Linking belowground biodiversity and ecosystem function in European forests – the 5th meeting of the COST Action FP1305 in Průhonice
Fig. 1. A group of the participants at the COST meeting (photo by Peter Železnik).
189
Reports / Lesn. Cas. For. J. 62 (2016) 186–194

susceptibility of soil organic matter (SOM) mineralization to priming. He showed that labile C appeared to initiate cata-bolic responses of the microbial community that shifted the SOM mining to N-rich components, an effect that increased with higher fungal dominance. Petr Baldrian (CZ) pointed that tree harvest changes the functioning of forest soils as 31% decrease in root dry mass was found six months after harvest. While in died roots the fungal biomass as well as activity increased, in rhizosphere the decrease of fungal bio-mass and activity (except Mn-peroxidase) was observed. At the same time, changes in the composition of fungal commu-nity were observed. Tereza Mašínová (CZ) presented results of a soil yeast communities study in the topsoil of beech, oak and spruce stands. The results showed that yeast represents a significant proportion of fungal community in forest soils. They are dominant in mineral soil unlike of litter; on the other hand, in soil they are less diverse than in litter. While the effect of dominant trees on yeast was more pronounced in the litter, the effect of soil chemical properties was distinct in the mineral horizons. Generally, vegetation had lower effect on yeast than other fungi. Flavia Pinzari (IT), the third invited speaker, highlighted that metals and microelements in plant and microbial uptake receive less attention than carbon or nitrogen. Metals mobilise K release, contrasting results are about Ca, Mg and Mn mobility. Fungi accumulate more min-erals than foliage; significant differences were observed in the accumulation of metals also between oak and beech. Ina C. Meier (DE) in her presentation dealt with the type of mycorrhization on root functions of temperate forests. She pointed on the differences between ectomycorrhiza (ECM) and arbuscular mycorrhiza (AM) and showed that increased root exudation in ECM tree species especially under drought stress lead to the increase in the decomposition of less bio-available C sources. Also greater variability in ECM than AM communities was found. According to the presentation of Taina Pennanen (FI), spruce clonal trial demonstrated that ECM diversity correlates with the host tree growth. In the last presentation on Tuesday, Evsey Kosman (IL) explained how to understand and express the characteristics such as dispersion (amount of dispersion, evenness of dispersion), species richness etc. used in the description of the diversity and variability in communities and populations.
Next day, on Wednesday 26th October 2016, the presen-tations continued in two sessions. Marie Spohn (IT), invited speaker from Italy, analysed the phosphorus cycling in Fagus sylvatica forests. It was shown that while there are seasonal differences in the P uptake by beech with distinct increase in June, the P uptake by microorganisms and ECM was on the same level during the whole period of observation. Phos-phatase activity in the rhizosphere depends on P availability and is stimulated by root exudates. The results also reflect the direct competition between microbe and plant uptakes. Katarzyna Hrynkiewicz (PL) evaluated the total metabolic activity as well as siderophore producing bacterial strains in forest stands with birch and alder located in areas contami-nated with heavy metals and their potential in phytoremedia-tion. Iftekhar U. Ahmed (ET) introduced the participants into the Ethiopian Highland where the effect of changes in land use on soil microbial community were evaluated. Soil microbial biomass C and N, as well as enzyme activities were
determined in soil samples taken from the natural forest, plantation forest and grazing land. The results showed that the natural forest exhibited the highest microbial biomass as well as activity, the lowest microbial biomass was found in grazing land. The effect of tree species was most pronounced in the plantation forest. Edda Sigurdis Oddsdottir from Ice-land pointed out that while several hundred years ago 25% of Iceland was covered by forest, the situation in present is quite different and forest is present only on 2% of the Iceland area. Last decades there is a trend of afforestation, ca 1/3 of forest stands are formed by birch, the rest by introduced trees. The earthquake in 2008 caused a shift in the fault line and as the Iceland is known by hot springs, this shift caused also heat increment in a new area under a forest. The changes enabled to study the effect of heat increment on forest stands and also on rhizosphere and ECM. It was found that the heat incre-ment leads to the decline of root tips. Increased temperature did not affect ECM growth and fungal composition, however, ECM on root tips declined.
The last invited speaker Brian Pickles (UK) highlighted the importance of mycorrhiza and pointed that mycorrhiza occurs on 93% of angiosperms and 82% of vascular plants. It is able to respond to environmental changes more rapidly than its host. In past climate changes, changes in glaciation caused plant migration in North America and the ques-tion is the changes are reflected also in ECM. The study in British Columbia showed that inside the host distribution similar fungal communities occur but with low richness; outside the host distribution lower colonisation with local fungi, but with higher richness was observed. Irena Maček from Slovenia pointed on a rare phenomenon of “terrestrial mofettes” which are natural sites with constant geogenic CO2 exhalations and consequent soil hypoxia. They can be used as a model ecosystem for the study of ecosystem responses to potential CO2 increase. They used mofettes to determine whether a long-term directional pressure could change AM fungal community structure and drive the selection of par-ticular AM fungal phylotypes. Numerical dominance of two AM fungal phylotypes in hypoxic soils was found. The pres-entations of Mathias Mayer (AT) and Martina Vašútová (CZ) were focused on soil microorganisms at the windthrow plots. Mathias Mayer presented the results from the Austrian Alps where they studied microbial biomass, enzyme activities and soil organic matter decomposition in gaps with and without tree recruitment. Generally, increased soil temperature and moisture was observed in gaps; however, tree recruitment in gaps kept temperature and soil moisture at stand levels. The CO2 release did not change in gaps as the increase in microbial respiration due to higher temperature was bal-anced by a decline in root respiration as a consequence of tree death. The formation of gaps after windthrow led to an increase in litter and soil organic matter decomposition. The presence of tree recruitment retarded this process, what indi-cates that sufficient pre-disturbance tree recruitments could potentially increase ecosystem resilience after forest distur-bance. Martina Vašútová analysed the management effect on ECM species community ten years after the windthrow. The research was carried out at four plots with different man-agement established after the windthrow in 2004 in the Tatra National Park (Slovakia) when a large part of spruce forests
190
Reports / Lesn. Cas. For. J. 62 (2016) 186–194
was strongly damaged. She also compared two approaches in the ECM estimation which offered a bit different results. The plenary lectures finished by the presentation of Tobias Guldberg Froslev (DK) regarding the “BIOWIDE” project on biodiversity.
Each day after the plenary lectures, the participants con-tinued scientific work in four working groups (WG), focusing specific topics: WG1 link diversity to function, WG2 look at the structure of belowground food webs and WG3 assess the importance of belowground diversity in intensively managed forest ecosystems. WG4 utilise the information gathered by other working groups to evaluate novel modelling concepts to include biodiversity and functional diversity indices.
The participants had also an opportunity to visit Průhonice Park as the meeting took place in its immediate vicinity. Dur-ing the tour, Mr. M. Vosátka and J. Burda informed about its history and current status. As it was mentioned, Průhonice Park was founded in 1885 by Count Arnošt Emanuel Silva-
Tarouca. He introduced tree species of domestic origin uniquely combined with imported foreign species. The com-bination of groups of different trees with meadows, ponds and streams offers unique park composition, an original landscape architecture of worldwide importance. This was the reason why it became a UNESCO world Heritage Site and Czech National Historic Landmark. The park is also of high dendrological value because of a collection of about 1,600 species of local and exotic plants and of 8.000 rhodo-dendrons with 100 taxa and cultivars.
The three day program provided an opportunity to bring experts in biodiversity, tree ecology, modellers etc. together and exchange knowledge. The next meeting will be on 26–29 June 2017 at the University of Tartu in Estonia.
Erika GömöryováTechnical University in Zvolen, Forestry Faculty,
T. G. Masaryka 24, SK – 960 53 Zvolen, Slovak Republic, e-mail: [email protected]
191
Reports / Lesn. Cas. For. J. 62 (2016) 186–194

Aktuálne problémy v zakladaní a pestovaní lesa 2016 – 4. ročník medzinárodnej konferencie
Dňa 19. – 20. októbra 2016 sa v priestoroch Spoločenskej dvorany Kúpeľného hotela Palace, Kúpeľov Sliač, a. s., konal 4. ročník medzinárodnej konferencie „Aktuálne problémy v zakladaní a pestovaní lesa“, ktorú organizovalo Národné lesnícke centrum - Lesnícky výskumný ústav Zvolen (NLC - LVÚ Zvolen) v spolupráci s Ministerstvom pôdohospodárstva a rozvoja vidieka SR a Slovenskou les-níckou spoločnosťou. Podujatie, ktoré sa už každoročne stalo tradičným, je príležitosťou na prezentáciu najnovších informácií a poznatkov výskumu z oblasti zakladania, pestovania a produkcie lesa širokému okruhu vlastníkov a užívateľov lesa a zároveň aj platformou pre odbornú dis-kusiu výskumných pracovníkov s lesníckou praxou. Konfer-encie sa zúčastnilo 92 platiacich účastníkov z lesníckej praxe, výskumu a akademickej sféry.
Na úvod sa prítomným prihovoril riaditeľ odboru štátnej správy lesného hospodárstva MPRV SR Ing. Pavol László, ktorý vyzdvihol význam podujatia zameraného na pestovanie lesa pre produkciu kvalitnej drevnej suroviny a zabezpečovanie všetkých spoločnosťou požadovaných mimoprodukčných funkcií našich lesov. Úspešný priebeh podujatiu zaželal vo svojom príhovore aj riaditeľ NLC - LVÚ Zvolen Dr. Ing. Tomáš Bucha.
S hlavným referátom „Ekologické a ekonomické zmeny verzus problémy pestovania lesov na Slovensku“ vystúpil prof. Ing. Milan Saniga, DrSc. vedúci katedry pestovania lesa na Lesnickej fakulte Technickej univerzity vo Zvo-lene. Analyzoval vplyv jednotlivých škodlivých činiteľov (vietor, sucho, deficit atmosférických zrážok, podkôrny hmyz, poškodenie zverou) na lesné ekosystémy. Na zák-lade súčasného stavu lesných porastov a očakávaných scenárov ich vývoja v budúcnosti sformuloval pestovné opatrenia zamerané na zmiernenie vplyvov klimatickej zmeny. Zdôraznil nevyhnutnosť prihliadať na uvedené pre-
191
Reports / Lesn. Cas. For. J. 62 (2016) 186–194
javy pri výchove a obnove porastov. V pestovnom režime navrhuje viac akcentovať štrukturalizáciu porastov formou silných úrovňových prebierok s následným vytváraním viacvrstvových a mozaikových porastov. Zároveň odporúča uplatňovať pestovné systémy založené na princípe prírode blízkeho obhospodarovania lesa.
Doc. Ing. Ivan Repáč, PhD. z katedry pestovania lesa LF TU vo Zvolene predniesol „Príspevok k poznaniu prežívania a odrastania voľnokorenného a krytokorenného sadbového materiálu vybraných drevín na kalamitných plochách“. Uviedol poznatky z 5-tich výskumných výsadbových plôch v rôznych orografických celkoch SR. Vo väčšine kombinácií (plocha – drevina – termín výsadby) neboli zistené výraznejšie rozdiely v prežívaní a raste voľnokorenného a krytokoren-ného materiálu. V niekoľkých prípadoch lepší výsledok väčšinou dosiahol krytokorenný materiál. Najlepšie sa však
Obr. 1. K účastníkom konferencie sa prihovoril aj riaditeľ LVÚ - Zvolen Dr. Ing. Tomáš Bucha
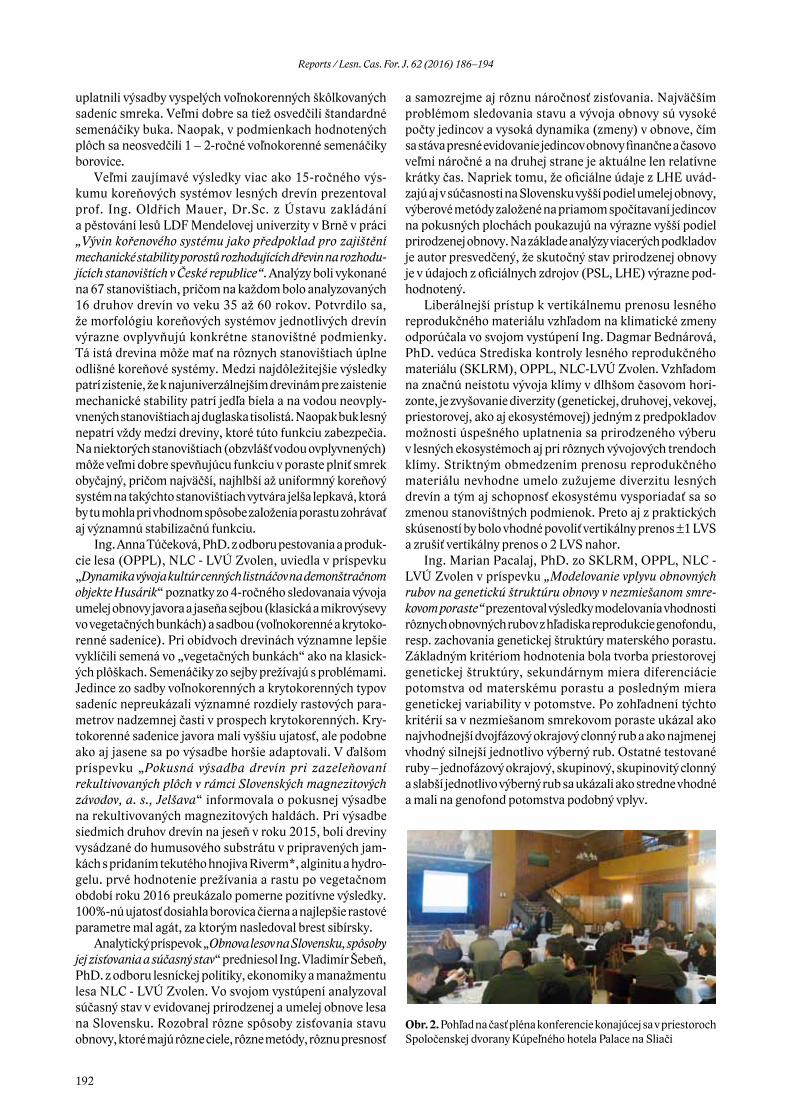
192
Reports / Lesn. Cas. For. J. 62 (2016) 186–194
uplatnili výsadby vyspelých voľnokorenných škôlkovaných sadeníc smreka. Veľmi dobre sa tiež osvedčili štandardné semenáčiky buka. Naopak, v podmienkach hodnotených plôch sa neosvedčili 1 – 2-ročné voľnokorenné semenáčiky borovice.
Veľmi zaujímavé výsledky viac ako 15-ročného výs-kumu koreňových systémov lesných drevín prezentoval prof. Ing. Oldřich Mauer, Dr.Sc. z Ústavu zakládání a pěstování lesů LDF Mendelovej univerzity v Brně v práci „Vývin kořenového systému jako předpoklad pro zajištění mechanické stability porostů rozhodujících dřevin na rozhodu-jících stanovištích v České republice“. Analýzy boli vykonané na 67 stanovištiach, pričom na každom bolo analyzovaných 16 druhov drevín vo veku 35 až 60 rokov. Potvrdilo sa, že morfológiu koreňových systémov jednotlivých drevín výrazne ovplyvňujú konkrétne stanovištné podmienky. Tá istá drevina môže mať na rôznych stanovištiach úplne odlišné koreňové systémy. Medzi najdôležitejšie výsledky patrí zistenie, že k najuniverzálnejším drevinám pre zaistenie mechanické stability patrí jedľa biela a na vodou neovply-vnených stanovištiach aj duglaska tisolistá. Naopak buk lesný nepatrí vždy medzi dreviny, ktoré túto funkciu zabezpečia. Na niektorých stanovištiach (obzvlášť vodou ovplyvnených) môže veľmi dobre spevňujúcu funkciu v poraste plniť smrek obyčajný, pričom najväčší, najhlbší až uniformný koreňový systém na takýchto stanovištiach vytvára jelša lepkavá, ktorá by tu mohla pri vhodnom spôsobe založenia porastu zohrávať aj významnú stabilizačnú funkciu.
Ing. Anna Túčeková, PhD. z odboru pestovania a produk-cie lesa (OPPL), NLC - LVÚ Zvolen, uviedla v príspevku „Dynamika vývoja kultúr cenných listnáčov na demonštračnom objekte Husárik“ poznatky zo 4-ročného sledovanaia vývoja umelej obnovy javora a jaseňa sejbou (klasická a mikrovýsevy vo vegetačných bunkách) a sadbou (voľnokorenné a krytoko-renné sadenice). Pri obidvoch drevinách významne lepšie vyklíčili semená vo „vegetačných bunkách“ ako na klasick-ých plôškach. Semenáčiky zo sejby prežívajú s problémami. Jedince zo sadby voľnokorenných a krytokorenných typov sadeníc nepreukázali významné rozdiely rastových para-metrov nadzemnej časti v prospech krytokorenných. Kry-tokorenné sadenice javora mali vyššiu ujatosť, ale podobne ako aj jasene sa po výsadbe horšie adaptovali. V ďalšom príspevku „Pokusná výsadba drevín pri zazeleňovaní rekultivovaných plôch v rámci Slovenských magnezitových závodov, a. s., Jelšava“ informovala o pokusnej výsadbena rekultivovaných magnezitových haldách. Pri výsadbe siedmich druhov drevín na jeseň v roku 2015, boli dreviny vysádzané do humusového substrátu v pripravených jam-kách s pridaním tekutého hnojiva Riverm*, alginitu a hydro-gelu. prvé hodnotenie prežívania a rastu po vegetačnom období roku 2016 preukázalo pomerne pozitívne výsledky. 100%-nú ujatosť dosiahla borovica čierna a najlepšie rastové parametre mal agát, za ktorým nasledoval brest sibírsky.
Analytický príspevok „Obnova lesov na Slovensku, spôsoby jej zisťovania a súčasný stav“ predniesol Ing. Vladimír Šebeň, PhD. z odboru lesníckej politiky, ekonomiky a manažmentu lesa NLC - LVÚ Zvolen. Vo svojom vystúpení analyzoval súčasný stav v evidovanej prirodzenej a umelej obnove lesa na Slovensku. Rozobral rôzne spôsoby zisťovania stavu obnovy, ktoré majú rôzne ciele, rôzne metódy, rôznu presnosť
a samozrejme aj rôznu náročnosť zisťovania. Najväčším problémom sledovania stavu a vývoja obnovy sú vysoké počty jedincov a vysoká dynamika (zmeny) v obnove, čím sa stáva presné evidovanie jedincov obnovy finančne a časovo veľmi náročné a na druhej strane je aktuálne len relatívne krátky čas. Napriek tomu, že oficiálne údaje z LHE uvád-zajú aj v súčasnosti na Slovensku vyšší podiel umelej obnovy, výberové metódy založené na priamom spočítavaní jedincov na pokusných plochách poukazujú na výrazne vyšší podiel prirodzenej obnovy. Na základe analýzy viacerých podkladov je autor presvedčený, že skutočný stav prirodzenej obnovy je v údajoch z oficiálnych zdrojov (PSL, LHE) výrazne pod-hodnotený.
Liberálnejší prístup k vertikálnemu prenosu lesného reprodukčného materiálu vzhľadom na klimatické zmeny odporúčala vo svojom vystúpení Ing. Dagmar Bednárová, PhD. vedúca Strediska kontroly lesného reprodukčného materiálu (SKLRM), OPPL, NLC-LVÚ Zvolen. Vzhľadom na značnú neistotu vývoja klímy v dlhšom časovom hori-zonte, je zvyšovanie diverzity (genetickej, druhovej, vekovej, priestorovej, ako aj ekosystémovej) jedným z predpokladov možnosti úspešného uplatnenia sa prirodzeného výberu v lesných ekosystémoch aj pri rôznych vývojových trendoch klímy. Striktným obmedzením prenosu reprodukčného materiálu nevhodne umelo zužujeme diverzitu lesných drevín a tým aj schopnosť ekosystému vysporiadať sa so zmenou stanovištných podmienok. Preto aj z praktických skúseností by bolo vhodné povoliť vertikálny prenos ±1 LVS a zrušiť vertikálny prenos o 2 LVS nahor.
Ing. Marian Pacalaj, PhD. zo SKLRM, OPPL, NLC - LVÚ Zvolen v príspevku „Modelovanie vplyvu obnovných rubov na genetickú štruktúru obnovy v nezmiešanom smre-kovom poraste“ prezentoval výsledky modelovania vhodnosti rôznych obnovných rubov z hľadiska reprodukcie genofondu, resp. zachovania genetickej štruktúry materského porastu. Základným kritériom hodnotenia bola tvorba priestorovej genetickej štruktúry, sekundárnym miera diferenciácie potomstva od materskému porastu a posledným miera genetickej variability v potomstve. Po zohľadnení týchto kritérií sa v nezmiešanom smrekovom poraste ukázal ako najvhodnejší dvojfázový okrajový clonný rub a ako najmenej vhodný silnejší jednotlivo výberný rub. Ostatné testované ruby – jednofázový okrajový, skupinový, skupinovitý clonný a slabší jednotlivo výberný rub sa ukázali ako stredne vhodné a mali na genofond potomstva podobný vplyv.
Obr. 2. Pohľad na časť pléna konferencie konajúcej sa v priestoroch Spoločenskej dvorany Kúpeľného hotela Palace na Sliači

193
Reports / Lesn. Cas. For. J. 62 (2016) 186–194
Doterajší vývoj dvoch introdukovaných drevín, duglasky tisolistej a jedle obrovskej na plochách, založených formou priemyselných plantáží, zhodnotil v príspevku „Predbežné výsledky rastu a pestovania introdukovaných drevín na prie-myselných plantážach OZ Levice“ doc. Ing. Rudolf Petráš, CSc. z odboru pestovania a produkcie lesa, NLC - LVÚ Zvolen. Duglaska má v súčasnosti vek 39 rokov a jedľa 32 rokov. Pre objektivizáciu rastovej úrovne sa ich hektárové a stredné porastové veličiny porovnali s hodnotami podľa ras-tových tabuliek. Výsledky poukázali na veľmi vysokú bonitu porastov oboch drevín v týchto podmienkach. Na základe súčasného stavu porastov sa navrhli spôsoby ich ďalšieho obhospodarovania.
Ing. Peter Kaštier, PhD. z odboru ochrany lesa a manažmentu zveri NLC - LVÚ Zvolen poukázal v príspevku „Početnosť raticovej zveri a škody ňou spôsobované v lesoch na Slovensku“ na neustále rastúci trend škôd, ktorý súvisí predovšetkým so zvyšujúcou sa početnosťou raticovej zveri. V súčasnosti dosahuje početnosť a výška úlovku raticovej zveri na Slovensku historické maximá. Obzvlášť extrémne a nekontrolovane vzrastá početnosť danielej a muflonej zveri. Nárast početnosti súvisí najmä s nesprávnym poľovníckym obhospodarovaním zveri, neplnením plánov jej lovu, nadmerným prikrmovaním jadrovým krmivom a zmenami v pestovaní poľnohospodárskych plodín. K najpoužívanejším a najrozšírenejším metódam ochrany lesa pred poškodzovaním zverou patria dnes aj z ekonom-ických dôvodov repelenty.
V príspevku „Potenciál a riziká pestovania klonov pau-lovnie na Slovensku“, ktorý prezentoval Ing. Jaroslav Jankovič, CSc. z odboru pestovania a produkcie lesa, NLC - LVÚ Zvolen, boli sumarizované poznatky o tejto dnes „módnej“ drevine. Okrem základných informácií o drevinách rodu Pau-lownia, a o šľachtení vysoko produkčných hybridných klonov odzneli poznatky o produkčnom potenciáli klonov paulovnie na základe informácií z literatúry a návštevy plantáží v Srb-sku. Uvedené boli aj riziká pestovania klonov paulovnie v podmienkach Slovenska a informácie o možnostiach ich pestovania z pohľadu všeobecne záväzných právnych pred-pisov. V závere boli uvedené návrhy ako ďalej postupovať pri riešení problematiky testovania klonov paulovnie v pod-mienkach Slovenska.
Aktuálny stav v oblasti pestovania topoľov uviedol v pos-lednej prezentácii „Pestovanie a využitie topoľov na Sloven-sku“ Ing. Martin Bartko, PhD. vedúci Výskumnej stanice Juh v Gabčíkove, NLC - LVÚ Zvolen. Redukovaná plocha topoľov v lesných porastoch je asi 16,5 tis. hektárov. Šľachtené topole z toho zaujímajú 9,3 tisíc ha. Odhadovaná plocha šľachtených topoľov vysadených mimo lesa vo vetrolamoch, zelených pásoch a v brehových porastoch je asi 3 tis. ha. Najväčšie a najproduktívnejšie lokality pre ich intenzívne pestovanie sú pozdĺž Dunaja a jeho prítokov na juhozápadnom Slovensku. Vo výsadbách šľachtených topoľov na Slovensku dominujú 3 klony: Najväčší podiel (35 %) má taliansky klon I-214 vyšľachtený pred 80 rokmi a maďarský klon Pannonia. Pre produkciu lesného reprodukčného materiálu kategórie „tes-tovaný” je uznaných 9 klonov a pre kategóriu „kvalifikovaný“ 4 klony. Klonový archív topoľov je umiestnený na Výskumnej stanici Juh v Gabčíkove. Čo sa týka zdrojov reprodukčného
materiálu topoľových klonov, najrozsiahlejšia prevádzková matečnica topoľových klonov sa nachádza v Škôlkarskom stredisku Trstice Lesov SR, š. p. Obsahuje kompletnú sadu klonov zahrnutých do Národného registra zdro-jov lesného reprodukčného materiálu. Po istom období stagnácie sa v posledných rokoch podarilo oživiť aktivity v oblasti selekcie a testovania topoľov (do veľkej miery vďaka záujmu o ich využitie v energetických porastoch s krátkou produkčnou dobou).
Kompletný zborník referátov v elektronickej podobe možno nájsť na webovej adrese NLC: http://www.nlcsk.sk/nlc_sk/publikacie_spravy/zborniky/rok-2016.aspx.
V rámci konferencie sa uskutočnila exkurzia na ploche s výsadbou rôznych druhov jedlí u súkromného pestovateľa v lokalite Halča - Šingľová a v Lesníckom arboréte Kysihýbel.
Na základe bohatej diskusie počas konferencie boli sfor-mulované a prijaté nasledovné závery:
– Účastníci konferencie konštatujú pretrvávanie zhor-šovania zdravotného stavu lesných porastov na Sloven-sku, čím je uplatňovanie prírode bližších pestovných systémov významne limitované. Frekvencia výskytu kalamitných javov vyplývajúcich z globálnych klimatick-ých zmien (vietor, sucho, častejší výskyt extrémnych kli-matických javov), masívne poškodzovanie lesných poras-tov biotickými škodcami a hlavne zverou, ako aj nedo-statok zdrojov financovania na pestovnú činnosť začína veľmi výrazne znižovať ich stabilitu.
– Cieľavedomé a desaťročiami overené odborné postupy lesníkov a obhospodarovateľov lesa pri likvidácii násled-kov kalamít sú znemožňované, resp. často bagatelizované rôznymi záujmovými skupinami, ktorých názory sa dnes medializujú a akceptujú viacej ako odporúčania odborní-kov. Následkom toho je práca lesníkov často nepriaznivo vnímaná zo strany neobjektívne informovanej verejnosti.
– Na základe analýzy súčasného stavu v zakladaní a pes-tovaní lesa, v kontexte so strategickým cieľom 1 „Zabez-pečenie dodávok dreva v meniacich sa prírodných a spo-ločenských podmienkach aktívnym trvalo udržateľným obhospodarovaním lesov“ vládou schváleného Akčného plánu Národného programu využitia potenciálu dreva (APNPVPD) navrhujeme: – Vyčleniť zdroje financovania na realizáciu priorit-
ných opatrení v lesoch na ich adaptáciu na klimatickú zmenu (kapitola 8.5.2 Stratégie adaptácie Slovenskej republiky na nepriaznivé dôsledky zmeny klímy).
– Prioritne riešiť problematiku škôd zverou – prijať a urýchlene realizovať také legislatívne opatrenia, ktoré budú viesť k zníženiu stavov raticovej zveri na Slovensku.
– Vytvoriť finančný nástroj na podporu vykonávania predovšetkým ochranných, ale aj obranných opat-rení proti škodám spôsobeným kalamitnými hmy-zími škodcami a zverou (ide zároveň o opatrenie 1.5.2 v rámci APNPVPD).
– Vytvoriť finančné zdroje na podporu stabilizácie les-ných porastov postihnutých prírodnými kalamitami (obdoba v minulosti zrušeného Štátneho fondu zve-ľaďovania lesa).

194
Reports / Lesn. Cas. For. J. 62 (2016) 186–194
– Uchádzať sa o projektové zdroje financovania výskumu na rozšírenie existujúcich a získanie nových poznatkov o introdukovaných drevinách na Sloven-sku v podmienkach klimatickej zmeny, s perspektí-vou ich využitia na udržanie produkčného potenciálu našich hospodárskych lesov.
– Skúsenosti z lesníckej praxe potvrdzujú, že súčasný systém zabezpečovania pestovných prác dodáva-teľsky prostredníctvom verejného obstarávania sa neosvedčil a podľa doterajších skúseností ide na úkor kvality a fyziologickej stability založených lesných porastov. V záujme zachovania kvality pestovných
prác účastníci konferencie odporúčajú lesníckym subjektom v širšej miere zvážiť možnosť vytvárania robotníckych pracovných pozícií pre tieto činnosti.
Pozitívne ohlasy účastníkov konferencie na jej odborný program i exkurziu sú pre nás veľkým ocenením a povzbu-dením pre organizovanie ďalších ročníkov tohto podujatia určeného pre širokú verejnosť lesníckej vedy, pedagogiky a najmä praxe.
Jaroslav JankovičNárodné lesnícke centrum - Lesnícky výskumný ústav Zvolen,
T. G. Masaryka 2175/22, SK – 960 92 Zvolen, Slovenská republika, e-mail: [email protected]
Dňa 16. marca 2016 sme si pripomen-uli významné životné jubileum 75 rokov prof. Ing. Pavla Hrubíka, DrSc. Narodil sa v Sennom okres Veľký Krtíš. Po absolvovaní Strednej lesníckej technickej školy v Banskej Štiavnici (1955–1959) pokračoval v štúdiu na Vysokej škole lesníckej a drevárskej
vo Zvolene (1959–1964). Z odborných predmetov ho zau-jali predovšetkým entomológia, dendrológia a ochrana lesov a toto zameranie mu ostalo ako celoživotná záľuba spojená s prácou. Jeho prvým pracoviskom (od 1. júla 1964) sa stal Lesný závod Nitra, polesie Horné Lefantovce, kde pôsobil ako technik polesia. Tam sa stretol prvýkrát s vedeckými pracovníkmi z Arboréta Mlyňany SAV (pri výskume gaštana jedlého), a problematika výskumu ho natoľko zaujala, že po roku praxe (od 1. septembra 1965) prešiel na nové pracovisko Arborétum Mlyňany SAV, kde pokračoval v štúdiu svojich obľúbených predmetov v pracovnej skupine ochrany drevín. V Arboréte Mlyňany - Ústav dendrobiológie SAV, pracoval do roku 1993 a po delimitácii pracoviska pokračoval v Ústave ekológie lesa SAV, od 1. 1. 1994 Pobočka biológie drevín v Nitre. Po roku pôsobenia v Ústave ekológie SAV Zvolen, odchádza (od 1. 9. 1995) na Slovenskú poľnohospodársku univerzitu na Fakultu záhradníctva a krajinného inžinierstva, kde pracoval do roku 2009 (31. 8. 2009) a potom dva roky v práci pokračoval v Botanickej záhrade Slovenskej poľnohospodárskej univerzity v Nitre, ako zodpovedný riešiteľ projektu KEGA: „Budovanie zbierok kultúrnych rastlín okrasného charakteru s využitím pre edukačné účely v Botanickej záhrade Slovenskej poľnohospodárskej univer-zity v Nitre“.
Jeho pracovná problematika spočívala zo začiatku (od 1. 9. 1965) v inventarizácii a sledovaní biotických škodcov v Arboréte Mlyňany a neskôr sa zamerala na štúdium bio-lógie a ekológie hmyzích škodcov vo vzťahu k introdukova-ným drevinám. V roku 1967 ho prijali na externú ašpiran-túru v študijnom odbore 41-03-9 „Poľnohospodárska a les-nícka fytopatológia a ochrana rastlín“. Kandidátsku dizer-tačnú prácu na tému „Húsenice niektorých Lepidopter ako potenciálni škodcovia introdukovaných drevín“ ukončil v máji 1972, súhlas k obhajobe získal až v septembri roku 1983. Jeho pracovné zameranie sa v osemdesiatych rokoch rozšírilo o aktuálnu problematiku živočíšnych škodcov dre-vín mestskej zelene v rôznych ekologických podmienkach Slovenska. Výsledkami práce prispel k prehĺbeniu poznat-kov komplexného štúdia introdukovaných i domácich dre-vín mestskej zelene, so zameraním na kvalitatívnu a kvan-titatívnu štruktúru a biologicko-ekologickú analýzu. Počas pôsobenia v Arboréte Mlyňany SAV sa zúčastnil a viedol dve dendrologické expedície do Kórey (KĽDR, 1983, 1985). V rokoch 1990–1993 bol zástupcom riaditeľa a predsedom vedeckej rady (1990–1992).
V roku 1995 (1. 9. 1995 ), po 30 rokoch na pracoviskách SAV, odchádza pracovať na novovznikajúcu Fakultu záhrad-níctva a krajinného inžinierstva Slovenskej poľnohospodár-
Prof. Ing. Pavel Hrubík, DrSc. – 75-ročný
skej univerzity v Nitre, kde pokračoval vo výskume a peda-gogickej činnosti v problematike dendrológie a ochrany dre-vín. Svoje vynikajúce znalosti dendrológie využil pri výučbe predmetu Sadovnícka dendrológia ihličnaté, vždyzelené a listnaté dreviny a nového predmetu ochrana okrasných drevín Vo februári roku 1996 sa habilitoval za docenta pre vedný odbor „Záhradníctvo“. V roku 1997 úspešne obhájil doktorskú dizertačnú prácu na tému „Škodlivá entomofauna cudzokrajných drevín na Slovensku“ a získal vedeckú hod-nosť „DrSc.“– doktor poľnohospodársko-lesníckych vied, vedný odbor 41-97-9 „Ochrana rastlín“, SAV Bratislava; následne s priznaním vedeckého kvalifikačného stupňa I.– vedúci vedecký pracovník. V roku 1999 bol prezidentom SR menovaný za univerzitného profesora, vedný odbor 41-42-9 „Záhradníctvo.“
Počas svojej dlhoročnej praxe významne prispel k rozší-reniu poznatkov o entomofaune domácich a cudzokrajných drevín vo verejnej zeleni a vo významných dendrologických objektoch Slovenska. Opísal výskyt viacej druhov hmyzích škodcov, ktoré sa na Slovensku zaznamenali prvý raz na introdukovaných drevinách (vrátane ďalších živočíšnych druhov, najmä novointrodukovanej čínskej dendroflóry). Počas pracovného pôsobenia v Arboréte Mlyňany - Ústave dendrobiológie SAV a následne v delimitovanom pracovisku Ústave ekológie lesa SAV vo Zvolene, Pobočka biológie dre-vín v Nitre, jubilant intenzívne spolupracoval so spolupra-covníkmi z Lesníckeho výskumného ústavu Zvolen, z oddele-nia ochrany lesov (teraz Národné lesnícke centrum - Lesnícky výskumný ústav Zvolen) a s kolegami z Katedry ochrany lesov a poľovníctva, Lesníckej fakulty Technickej univerzity vo Zvolene. Bol členom Vedeckej rady a členom Redakčnej rady časopisu v Ústave ekológie lesa SAV vo Zvolene.
Jeho práce v oblasti entomológie, kde publikoval množ-stvo poznatkov o nových, introdukovaných škodcoch výrazne ovplyvnili aj bádanie v oblasti ochrany lesa. Viacero nebezpeč-ných a lesnícky významných druhov, ktoré popísal v oblasti okrasného záhradníctva sa neskôr objavili aj v našich lesoch. Spomeňme aspoň druhy Cameraria ohridella, Obolodiplosis robiniae alebo Leptoglossus occidentalis, ktorým sa venoval vo svojich prácach. A tak napriek tomu, že väčšina entomo-logických prác prof. Ing. Pavla Hrubíka, DrSc. sa venovala škodcom drevín v mestskej zeleni, stali sa tieto práce stud-nicou poznania aj pre oblasť ochrany lesa.
Svoje bohaté vedecké poznatky publikoval v monografi-ách(12), v pôvodných vedeckých publikáciách doma (173) a v zahraničí (25). Prednášal na domácich i zahraničných konferenciách. Publikoval aj v odborných časopisoch (133). Celkove uverejnil 372 prác. Bohatá publikačná činnosť mala značný citačný ohlas: citácie SCI (31), citácie mimo SCI (451), citácie v karentovaných časopisoch (54), citácie v nekarentovaných časopisoch (428), iné zahraničné ohlasy na vytvorené dielo (2). Ako pedagóg na Fakulte záhradníctva a krajinného inžinierstva Slovenskej poľnohospodárskej uni-verzity v Nitre, bol školiteľom bakalárskych prác (12 ZAKA, 24 BPKU), diplomových prác (68) a doktorandských dizer-
ChroniCle http://www.nlcsk.sk/fj/
Lesn. Cas. For. J. 62 (2016) 195–196
tačných prác (10, z toho 5-KI a 2/ZAKA). Bol garantom štu-dijného odboru Záhradná a krajinná architektúra, spoluga-rant študijného odboru Krajinná a záhradná architektúra, študijného programu Biotechnika parkových a krajinných úprav a gestorom predmetov Listnaté dreviny v sadovníckej tvorbe, Ihličnaté a vždyzelené dreviny v sadovníckej tvorbe, Hodnotenie biotických prvkov, Dreviny v záhradno-archi-tektonickej tvorbe a Ochrana okrasných rastlín. Všetky uve-dené predmety zabezpečil odbornou literatúrou vydaním skrípt. Svoje odborné skúsenosti využil ako člen vedeckej rady (Fakulta krajinárstva a záhradného inžinierstva Slo-venskej poľnohospodárskej univerzity v Nitre, Ústav ekoló-gie lesa SAV vo Zvolene) ako člen poradného zboru Chráne-nej krajinnej oblasti Ponitrie, člen redakčnej rady časopisu Folia oecologica, medzinárodného časopisu Plant Protection Science pri Československej akadémii zemědělskej v Prahe, člen akreditačnej komisie SAV, člen komisie pre obhajoby doktorských dizertačných prác pre vedný odbor Záhrad-níctvo, Ochrana rastlín, člen spoločnej komisie pre vedný odbor Záhradná a krajinná architektúra Fakultu záhradníc-tva a krajinného inžinierstva Slovenskej poľnohospodárskej univerzity v Nitre v Nitre, Záhradníckej fakulte Mendelovej zemědělskej a lesníckej univerzity v Brne so sídlom v Lednici na Morave. Bol riešiteľom, spoluriešiteľom a vedúcim gran-tových projektov VEGA, KEGA, zúčastnil sa riešenia medzi-národného programu COST: Multidisciplinárny výskum gaštana jedlého v Európe a COST projektu: Mestské lesy (záverečné správy výskumu 18; projekty 8; zahraničné 2). Na Fakulte záhradníctva a krajinného inžinierstva Sloven-skej poľnohospodárskej univerzity v Nitre pôsobil v rokoch 1995–2009 aj ako vedúci katedry; predseda Akademického senátu fakulty; prodekan a štatutárny zástupca dekana.
Po odchode do dôchodku v roku 2009 sa venoval výskumu kultúrneho rozšírenia ginka dvojlaločného (Ginkgo biloba L.) na Slovensku (2010–2011; 2014–2015), pričom so svo-jou dcérou (doc. Ing. Katarína Ražná, PhD.), rozšírili apli-káciu genetických metód a markérov, pri determinácii bio-logických vlastností stromov, pomocou DNA. So spolupra-covníkmi vydal z riešenej problematiky vedeckú monogra-fiu (2014). Súčasťou dlhodobého výskumu jubilanta, bolo i hodnotenie klimatických podmienok a základných mete-orologických prvkov v Arboréte Mlyňany SAV, čo uverejnil vo viacerých príspevkoch. Posledne pri príležitosti jeho život-ného jubilea (2011) uverejnil svoju personálnu bibliografiu a knihu Kvalitatívna inventarizácia, klasifikácia a hodnote-
nie zdravotného stavu drevín pre účely záhradno-architekto-nickej a krajinárskej tvorby (v spolupráci s ďalšími autormi).
Profesor Pavel Hrubík svojou húževnatosťou, vytrva-losťou a vysokou odbornosťou prispel k rozšíreniu poznat-kov vo viacerých vedných odboroch (entomológia, dendro-lógia, ochrana drevín). Nemenej významná je jeho dlho-ročná pedagogická činnosť v rokoch 1995–2009, kde odo-vzdal svoje vedomosti získané vo výskumnej činnosti na pra-coviskách SAV v Arboréte Mlyňany - Ústave dendrobioló-gie SAV a v Ústave ekológie lesa SAV Zvolen, Pobočka bio-lógie drevín Nitra. Spolupráca s týmito pracoviskami pretr-váva doteraz. Bol členom riešiteľských kolektívov vedeckých grantových projektov VEGA a APVV, KEGA.
Za vykonanú prácu dostal celý rad vyznamenaní. Tak napríklad za mimoriadnu odborno-popularizačnú činnosť, mu Predsedníctvo SAV v roku 1985 udelilo „Cenu SAV za popularizáciu vedy“. V roku 1998 získal Zlatú Jánskeho plaketu, za viacnásobné darcovstvo krvi. Za aktívnu čin-nosť pri rozvoji Slovenskej poľnohospodárskej univerzity v Nitre dostal Pamätnú medaila rektora uvedenej univer-zity (2001), Pamätnú bronzovú medailu Fakulty záhrad-níctva a krajinného inžinierstva Slovenskej poľnohospo-dárskej univerzity v Nitre (2001), pri príležitosti 60. výročia jeho narodenia, Pamätnú plaketu Lesníckeho výskumného ústavu vo Zvolene, k životnému jubileu – 60 rokov, za spolu-prácu s Lesníckym výskumným ústavom Zvolen pri riešení vedecko-technických projektov (2001), Striebornú medailu Fakulty záhradníctva a krajinného inžinierstva Slovenskej poľnohospodárskej univerzity v Nitre, za pomoc pri rozvoji fakulty (2002). Menovaný je čestným členom Slovenskej spoločnosti pre poľnohospodárske, lesnícke, potravinárske a veterinárske vedy pri SAV (2002). Uvedená Spoločnosť mu v roku 2009 udelila Medailu Juraja Fándlyho, za významné vedecké výsledky v týchto vedách a za rozvoj vedeckej spo-ločnosti. V posledných rokoch pri príležitosti jeho 70. ako aj 75. narodenín dostal celý rad ďalší vyznamenaní a ocenení, ktoré ešte viac zvýraznili zásluhy jeho tvorivej činnosti.
Do ďalších rokov života, jubilantovi všetci prajeme veľa zdravia, naplnenie všetkých životných predsavzatí, ešte veľa nových inšpirácií pre ochranu a tvorbu životného prostredia.
Jozef KonôpkaNárodné lesnícke centrum - Lesnícky výskumný ústav Zvolen,
T. G. Masaryka 2175/22, SK – 960 92 Zvolen, Slovenská republika, e-mail: [email protected]
196
Chronicle / Lesn. Cas. For. J. 62 (2016) 195–196