FJ Benjamin 101021pr Benjamin_101021pr.pdfcollaboration with renowned partners like LVMH. An...
32
All rights reserved. Standard Chartered Bank 2010 IMPORTANT DISCLOSURES CAN BE FOUND IN THE DISCLOSURES APPENDIX. http://research.standardchartered.com Singapore | Emerging Companies – Consumer EQUITY RESEARCH 21 October 2010 FJ Benjamin Holdings Limited OUTPERFORM (initiating coverage) PRICE as at 20 October 2010 SGD0.43 Price target SGD0.55 Time to shop Bloomberg code Reuters code FJB SP FJBN.SI Market cap 12 month range SGD244.6m (US$188.1m) SGD0.25 - 0.46 EPS est. change n.a. We initiate coverage with an OUTPERFORM rating and a price target of S$0.55/sh, providing potential upside of 27%. FJ Benjamin Holdings (FJB) is South-east Asia’s leading fashion and lifestyle group with fifty years of retail, distribution and brand-building. We see FJB as a direct proxy for the fast-recovering economies in Asia, underpinned by its prime retail network and growing brand portfolio. Earnings upside stems from brand extension of RAOUL into new lucrative markets like China, in our view. Year end: June 2010 2011E 2012E 2013E Sales (SGDm) 289 332 394 471 EBIT (SGDm) 9 15 20 27 EBITDA (SGDm) 17 24 31 38 Pretax profit (SGDm) 9 16 21 27 Earnings (SGDm) adjusted 8 12 17 21 Diluted EPS (SGDcents) adjuste 1.39 2.19 2.92 3.78 Diluted EPS growth (%) adj. nm 57.6 33.6 29.3 DPS (SGDcents) 2.00 1.53 2.04 2.64 DPS growth (%) 300.0 -23.5 33.6 29.3 EBITDA margin (%) 5.9 7.4 7.8 8.1 EBIT margin (%) 3.3 4.6 5.2 5.6 Net margin (%) 2.9 3.8 4.2 4.6 Div payout (%) 137.7 70.0 70.0 70.0 Book value/share (SGD) 24.1 24.8 25.7 26.8 Net gearing (%) -5.4 -5.8 -5.3 -7.4 ROE (%) 6.1 8.9 11.6 14.4 ROACE (%) 6.1 8.9 11.6 14.4 FCF (SGDm) 21.7 9.5 11.1 18.6 EV/Sales (x) 0.8 0.7 0.6 0.5 EV/EBITDA (x) 13.9 9.7 7.7 6.1 PBR (x) 1.8 1.7 1.7 1.6 PER (x) 29.6 19.7 14.7 11.4 Dividend yield (%) 2.4 5.2 4.5 4.9 Source: Company, Standard Chartered Research estimates Share price performance 0.25 0.30 0.35 0.40 0.45 0.50 Oct‐09 Jan‐10 Apr‐10 Jul‐10 Oct‐10 FJ Benjamin Holdings Limited STRAITS TIMES INDEX (rebased) Share price (%) -1 mth -3 mth -12 mth Ordinary shares -4 25 19 Relative to Index -7 16 2 Relative to Sector - - - Major shareholder Free float 55% Average turnover (US$) 1,061,793 Benjamin family (26%) 50-years of fashion retail, distribution and brand building. With a rich heritage dating back to 1959, FJB has grown from a single brand store to an industry leader in brand building and retailing for international lifestyle brands across Asia. Today FJB has offices in 8 cities, represents over 20 iconic brands, and operates 172 retail stores. Premium retail network and diversified brand portfolio. In our view, FJB’s strength lies in its prime retail network in Asia and diversified brand portfolio. Its four new boutiques at the MBS are well-positioned to capture rising tourist spending in Singapore, while its brand management expertise on over 20 brands could lead to more collaboration with renowned partners like LVMH. An earnings recovery story. We expect earnings to recover from losses and surpass pre-crisis levels in the next 2 years, growing at a 3-year CAGR of 38%. Growth will be fuelled by 1) influx of tourists into Singapore, 2) strong consumer discretionary spending in Asia as we approach the festive season, 3) store expansion and 4) strengthening brand portfolio. With a stronger balance sheet, we believe FJB is in a stronger position than before to take advantage of the improving economies in the region. RAOUL – the tipping point. With RAOUL, FJB has transformed from a retailer to a brand-owner. Efforts to internationalise the brand have been successful, which is evident in the tripling of orders at the Europe fashion week recently. The management believes that the RAOUL brand could potentially break even in the next 2 years after 8 years of brand building, tipping off a sharp lift in earnings. More importantly, we see this proprietary brand growing to a $300-400m business in the next 5-10 years, with the potential to grow the stock to $1.45/share. Risks: A sharp global economic downturn and forex. Source: Company, Bloomberg Pauline Lee [email protected] +65 6307 1512
Transcript of FJ Benjamin 101021pr Benjamin_101021pr.pdfcollaboration with renowned partners like LVMH. An...

All rights reserved. Standard Chartered Bank 2010
IMPORTANT DISCLOSURES CAN BE FOUND IN THE DISCLOSURES APPENDIX. http://research.standardchartered.com
Singapore | Emerging Companies – Consumer EQUITY RESEARCH
21 October 2010
FJ Benjamin Holdings Limited
OUTPERFORM (initiating coverage) PRICE as at 20 October 2010
SGD0.43Price target
SGD0.55
Time to shop
Bloomberg code Reuters codeFJB SP FJBN.SI
Market cap 12 month rangeSGD244.6m (US$188.1m) SGD0.25 - 0.46
EPS est. change n.a.
We initiate coverage with an OUTPERFORM rating and a price target of S$0.55/sh, providing potential upside of 27%.
FJ Benjamin Holdings (FJB) is South-east Asia’s leading fashion and lifestyle group with fifty years of retail, distribution and brand-building.
We see FJB as a direct proxy for the fast-recovering economies in Asia, underpinned by its prime retail network and growing brand portfolio. Earnings upside stems from brand extension of RAOUL into new lucrative markets like China, in our view.
Year end: June 2010 2011E 2012E 2013ESales (SGDm) 289 332 394 471EBIT (SGDm) 9 15 20 27EBITDA (SGDm) 17 24 31 38Pretax profit (SGDm) 9 16 21 27Earnings (SGDm) adjusted 8 12 17 21Diluted EPS (SGDcents) adjuste 1.39 2.19 2.92 3.78Diluted EPS growth (%) adj. nm 57.6 33.6 29.3DPS (SGDcents) 2.00 1.53 2.04 2.64DPS growth (%) 300.0 -23.5 33.6 29.3EBITDA margin (%) 5.9 7.4 7.8 8.1EBIT margin (%) 3.3 4.6 5.2 5.6Net margin (%) 2.9 3.8 4.2 4.6Div payout (%) 137.7 70.0 70.0 70.0Book value/share (SGD) 24.1 24.8 25.7 26.8Net gearing (%) -5.4 -5.8 -5.3 -7.4ROE (%) 6.1 8.9 11.6 14.4ROACE (%) 6.1 8.9 11.6 14.4FCF (SGDm) 21.7 9.5 11.1 18.6EV/Sales (x) 0.8 0.7 0.6 0.5EV/EBITDA (x) 13.9 9.7 7.7 6.1PBR (x) 1.8 1.7 1.7 1.6PER (x) 29.6 19.7 14.7 11.4Dividend yield (%) 2.4 5.2 4.5 4.9
Source: Company, Standard Chartered Research estimates Share price performance
0.25
0.30
0.35
0.40
0.45
0.50
Oct‐09 Jan‐10 Apr‐10 Jul‐10 Oct‐10
FJ Benjamin Holdings Limited
STRAITS TIMES INDEX (rebased)
Share price (%) -1 mth -3 mth -12 mthOrdinary shares -4 25 19Relative to Index -7 16 2Relative to Sector - - -Major shareholderFree float 55%Average turnover (US$) 1,061,793
Benjamin family (26%)
50-years of fashion retail, distribution and brand building. With a rich heritage dating back to 1959, FJB has grown from a single brand store to an industry leader in brand building and retailing for international lifestyle brands across Asia. Today FJB has offices in 8 cities, represents over 20 iconic brands, and operates 172 retail stores.
Premium retail network and diversified brand portfolio. In our view, FJB’s strength lies in its prime retail network in Asia and diversified brand portfolio. Its four new boutiques at the MBS are well-positioned to capture rising tourist spending in Singapore, while its brand management expertise on over 20 brands could lead to more collaboration with renowned partners like LVMH.
An earnings recovery story. We expect earnings to recover from losses and surpass pre-crisis levels in the next 2 years, growing at a 3-year CAGR of 38%. Growth will be fuelled by 1) influx of tourists into Singapore, 2) strong consumer discretionary spending in Asia as we approach the festive season, 3) store expansion and 4) strengthening brand portfolio. With a stronger balance sheet, we believe FJB is in a stronger position than before to take advantage of the improving economies in the region.
RAOUL – the tipping point. With RAOUL, FJB has transformed from a retailer to a brand-owner. Efforts to internationalise the brand have been successful, which is evident in the tripling of orders at the Europe fashion week recently. The management believes that the RAOUL brand could potentially break even in the next 2 years after 8 years of brand building, tipping off a sharp lift in earnings. More importantly, we see this proprietary brand growing to a $300-400m business in the next 5-10 years, with the potential to grow the stock to $1.45/share.
Risks: A sharp global economic downturn and forex.
Source: Company, Bloomberg
Pauline Lee [email protected] +65 6307 1512

Equity Research – FJ Benjamin Holdings Limited | 21 October 2010
2
Contents
Investment merits 3
Valuation and recommendation 4
Company overview 6
Positive industry trends 10
RAOUL is on the verge of taking off 12
Growing cache of international brands 14
Prime retail network 16
Strong earnings recovery set to continue 17
Improving balance sheet 19
Key risks 21
Corporate information 22
Appendix 25
Disclosures appendix 29
Equity Research – FJ Benjamin Holdings Limited | 21 October 2010
3
Investment merits We initiate coverage on FJB with an OUTPERFORM rating and a price target of $0.55 based on a target PEG of 0.6x, a 40% discount to the Hong Kong and China retailers. Our price target reflects a 38% 3-year earnings CAGR over 2010-13E and equates to 25x FY11E PER. Our conservative earnings growth forecast would drive the valuation down to 11x in the next 3 years (by FY13E). This is cross-referenced with our DCF-derived fair value of $0.80.
In the next 12 months, we expect the stock to make a strong earnings recovery in tandem with the improving economies in the region. We see earnings upside potential from the following investment merits:
Good proxy for rising consumerism in Asia. We believe FJB is in a sweet spot to benefit from 1) strong retail sales in Asia, which is expected to grow in double digits over the next 12 months, 2) a doubling of tourist spending in Singapore by 2015, and 3) fast-rising consumer discretionary spending from women in China. With 4 boutiques at the MBS and 13 new store additions planned in Indonesia next year, FJB is poised to benefit from the rising consumer discretionary spending in Asia. In addition, its fast growing brand portfolio which saw a good mix of brands added within the last 8 months (including Goyard, Givenchy, Dewitt and Catherine Deane) should contribute positively to its organic growth in the medium term.
Moving from strength to strength. In contrast to the previous up cycle in 2007, when FJB was heavily geared (net gearing ~20%), the group has since built a much stronger balance sheet with strong free cash flows and net cash of S$7m. With its balance sheet strength, enlarged retail network and expanded brand portfolio, FJB is in a stronger position than before to expand and take advantage of a turn around in the economies in the region, in our view. We believe FJB looks on track to surpass its pre-crisis earnings of S$14.5m in FY08 within the next 2 years, and more than double them in the next 3 years.
Attractive dividend payout. Dividend payout has been generous at between 70-80%. With the ability to generate healthy free cashflows, the group pays a dividend of 0.5 cts/share even when making losses amid the global financial crisis. Notably, the group had a bumper dividend payout of 16.5 cts/share, 4-fold its earnings in FY07, in tandem with the divestment of investment properties. With an improving balance sheet strength, we are confident that the group can sustain its attractive dividends, which translate to a yield of at least 4.5% pa in the next 3 years.
In the next 5 to 10 years, we believe the stock could grow to S$1.45/share, through its fast-growing in-house RAOUL brand.
RAOUL is the wildcard. In our view, the establishment of its in-house RAOUL brand is a positive structural change that presents great earnings potential. With the RAOUL brand on track to breakeven in the next 2 years after successful brand building over the last 8 years, earnings could leap sharply to S$3m by FY13 (from losses of S$4-5m a year). In our view, RAOUL can potentially out-grow the group’s existing business in the next 5-10 years, turning FJB to a $1.45 stock, 3x more than its current share price.
Key risks include a sharper-than-expected economic slowdown globally and currency exchange risk. The performance of the retail sector depends on the region’s economic growth which hinges on a sustainable economic recovery in the US and Europe. The group’s earnings are sensitive to a basket of currencies including USD, CHF, EUR, SGD, THB and HK$. Foreign exchange differences could lead to huge swings in its quarterly earnings.
Equity Research – FJ Benjamin Holdings Limited | 21 October 2010
4
Valuation and recommendation Our price target of $0.55 is derived based on a target PEG ratio of 0.6x, a 40% discount to the Hong Kong and China retailers. At this juncture, we believe the PEG discount to its Hong Kong and China peers is warranted given its smaller market capitalisation, liquidity and exposure to China markets. As we anticipate the company showing a 38% EPS CAGR over a three-year period, we expect the stock’s valuation to compress to 11x in three years time (by FY13E).
We believe FJB is best compared to Trinity (891 HK, O/P, HK$). Trinity is a leading high-to-luxury end menswear retailer primarily serving greater China with over 350 points of sale. Similarly to FJB, Trinity manages international brands and has established its own in-house brand. Trinity manages 6 international brands in addition to its self-owned Kent & Curwen brand. While both companies generate similar revenue, Trinity’s margins are higher. We believe our target PEG of 0.6x reflects an appropriate 30% discount to Trinity due to FJB’s lower margins and store count.
In addition, we believe the stock deserves to trade at higher PER multiples than its previous peak (20x PER in 2007) as earnings momentum should be stronger going forward given 1) the structural change of Singapore into a tourism hub and 2) rising profitability of its proprietary RAOUL brand. We expect earnings to grow at a CAGR of 38% in the next 3 years, faster than the firm’s earnings CAGR of 14% in the last 8 years. Moreover, its balance sheet is much stronger now with net cash of S$7m, compared to a net gearing of 20% two years ago.
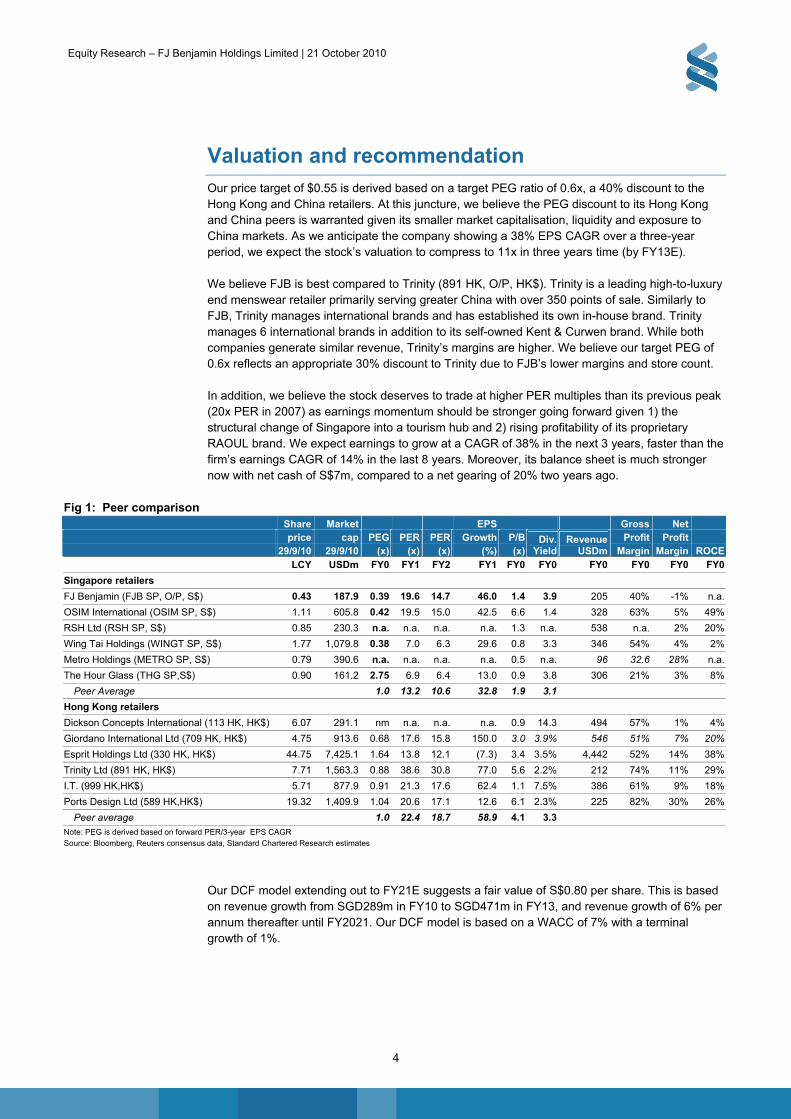
Fig 1: Peer comparison
Share Market EPS Gross Net price cap PEG PER PER Growth P/B Profit Profit 29/9/10 29/9/10 (x) (x) (x) (%) (x)
Div. Yield
Revenue USDm Margin Margin ROCE
LCY USDm FY0 FY1 FY2 FY1 FY0 FY0 FY0 FY0 FY0 FY0
Singapore retailers
FJ Benjamin (FJB SP, O/P, S$) 0.43 187.9 0.39 19.6 14.7 46.0 1.4 3.9 205 40% -1% n.a.
OSIM International (OSIM SP, S$) 1.11 605.8 0.42 19.5 15.0 42.5 6.6 1.4 328 63% 5% 49%
RSH Ltd (RSH SP, S$) 0.85 230.3 n.a. n.a. n.a. n.a. 1.3 n.a. 538 n.a. 2% 20%
Wing Tai Holdings (WINGT SP, S$) 1.77 1,079.8 0.38 7.0 6.3 29.6 0.8 3.3 346 54% 4% 2%
Metro Holdings (METRO SP, S$) 0.79 390.6 n.a. n.a. n.a. n.a. 0.5 n.a. 96 32.6 28% n.a.
The Hour Glass (THG SP,S$) 0.90 161.2 2.75 6.9 6.4 13.0 0.9 3.8 306 21% 3% 8%
Peer Average 1.0 13.2 10.6 32.8 1.9 3.1
Hong Kong retailers
Dickson Concepts International (113 HK, HK$) 6.07 291.1 nm n.a. n.a. n.a. 0.9 14.3 494 57% 1% 4%
Giordano International Ltd (709 HK, HK$) 4.75 913.6 0.68 17.6 15.8 150.0 3.0 3.9% 546 51% 7% 20%
Esprit Holdings Ltd (330 HK, HK$) 44.75 7,425.1 1.64 13.8 12.1 (7.3) 3.4 3.5% 4,442 52% 14% 38%
Trinity Ltd (891 HK, HK$) 7.71 1,563.3 0.88 38.6 30.8 77.0 5.6 2.2% 212 74% 11% 29%
I.T. (999 HK,HK$) 5.71 877.9 0.91 21.3 17.6 62.4 1.1 7.5% 386 61% 9% 18%
Ports Design Ltd (589 HK,HK$) 19.32 1,409.9 1.04 20.6 17.1 12.6 6.1 2.3% 225 82% 30% 26%
Peer average 1.0 22.4 18.7 58.9 4.1 3.3 Note: PEG is derived based on forward PER/3-year EPS CAGR
Source: Bloomberg, Reuters consensus data, Standard Chartered Research estimates
Our DCF model extending out to FY21E suggests a fair value of S$0.80 per share. This is based on revenue growth from SGD289m in FY10 to SGD471m in FY13, and revenue growth of 6% per annum thereafter until FY2021. Our DCF model is based on a WACC of 7% with a terminal growth of 1%.
Equity Research – FJ Benjamin Holdings Limited | 21 October 2010
5
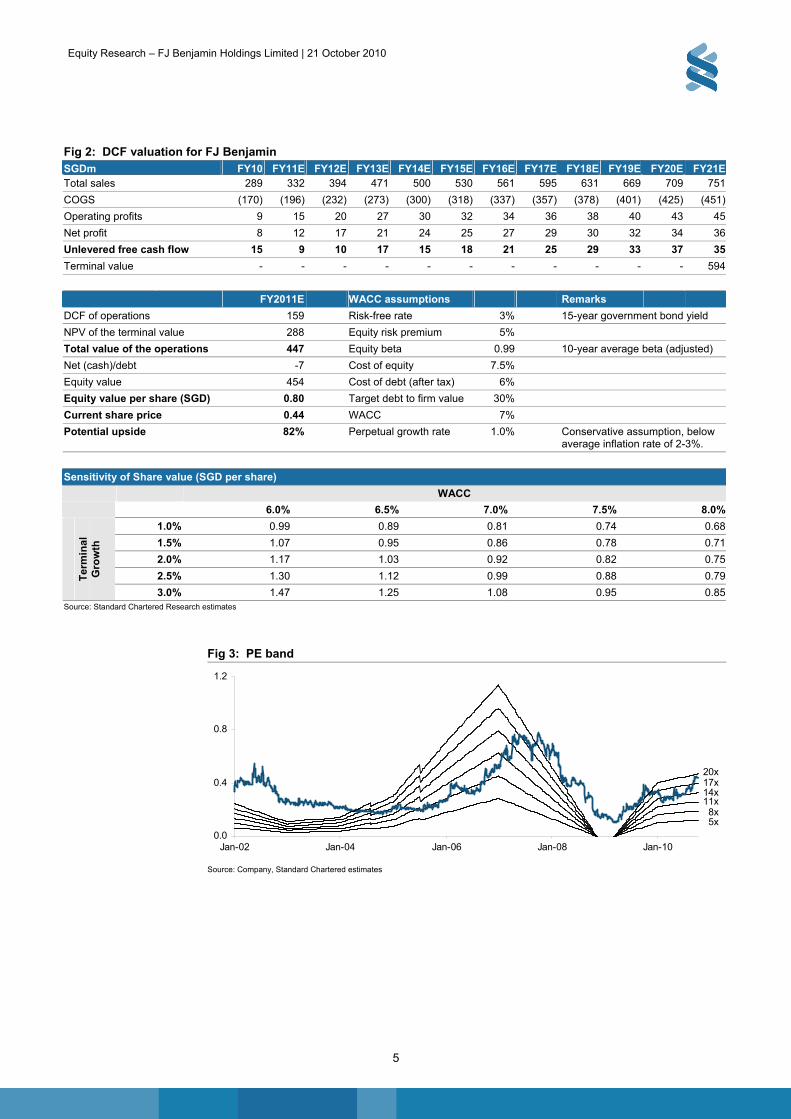
Fig 2: DCF valuation for FJ Benjamin SGDm FY10 FY11E FY12E FY13E FY14E FY15E FY16E FY17E FY18E FY19E FY20E FY21ETotal sales 289 332 394 471 500 530 561 595 631 669 709 751
COGS (170) (196) (232) (273) (300) (318) (337) (357) (378) (401) (425) (451)
Operating profits 9 15 20 27 30 32 34 36 38 40 43 45
Net profit 8 12 17 21 24 25 27 29 30 32 34 36
Unlevered free cash flow 15 9 10 17 15 18 21 25 29 33 37 35
Terminal value - - - - - - - - - - - 594
FY2011E WACC assumptions Remarks
DCF of operations 159 Risk-free rate 3% 15-year government bond yield
NPV of the terminal value 288 Equity risk premium 5%
Total value of the operations 447 Equity beta 0.99 10-year average beta (adjusted)
Net (cash)/debt -7 Cost of equity 7.5%
Equity value 454 Cost of debt (after tax) 6%
Equity value per share (SGD) 0.80 Target debt to firm value 30%
Current share price 0.44 WACC 7%
Potential upside 82% Perpetual growth rate 1.0% Conservative assumption, below average inflation rate of 2-3%.
Sensitivity of Share value (SGD per share)
WACC
6.0% 6.5% 7.0% 7.5% 8.0%
1.0% 0.99 0.89 0.81 0.74 0.68
1.5% 1.07 0.95 0.86 0.78 0.71
2.0% 1.17 1.03 0.92 0.82 0.75
2.5% 1.30 1.12 0.99 0.88 0.79Ter
min
al
Gro
wth
3.0% 1.47 1.25 1.08 0.95 0.85Source: Standard Chartered Research estimates
Fig 3: PE band
0.0
0.4
0.8
1.2
Jan-02 Jan-04 Jan-06 Jan-08 Jan-10
11x14x17x20x
5x8x
Source: Company, Standard Chartered estimates
Equity Research – FJ Benjamin Holdings Limited | 21 October 2010
6
Company overview With a rich heritage dating back to 1959, SGX-listed FJ Benjamin Holdings Ltd (FJB) is an industry leader in brand building and in developing retail and distribution networks for international luxury and lifestyle brands across Asia. Headquartered in Singapore and listed on the Singapore Exchange in November 1996, FJB has offices in 8 cities, represents over 20 iconic brands, operates over 170 retail stores/shop-in-shops, employs over 2,000 employees and has 4 core business segments: 1) Luxury and lifestyle retailing and distribution, 2) Timepiece distribution, 3) Creative & licensing, and 4) Investing in lifestyle concepts.
History
The company was initially incorporated in 1959 by its founder and incumbent chairman Frank Benjamin. FJB was the first to open a single brand store (Lanvin) in Singapore in 1975. Since then, the company has entered into franchise agreements with various luxury and lifestyle brands to distribute their products in Asia.
The business
FJB has subdivided its operations into four core business segments, namely;
Luxury and Lifestyle Retailing and Distribution This segment operates exclusive retail outlets for renowned brands across Southeast Asia
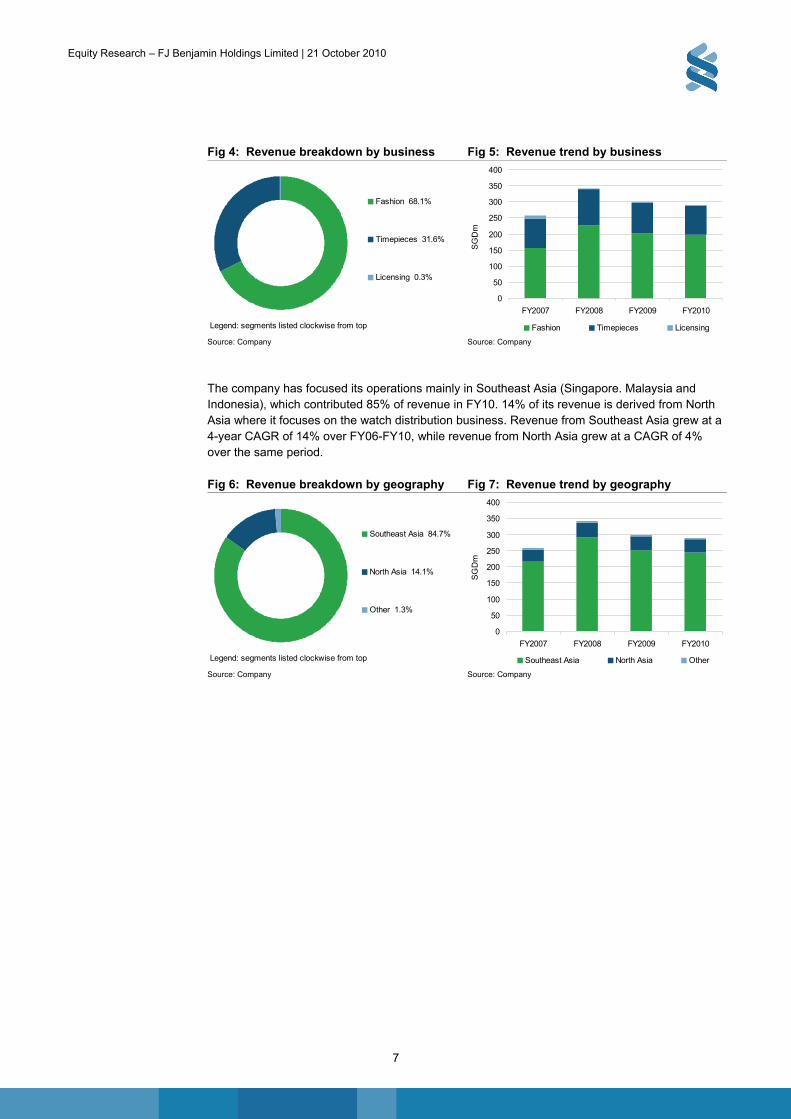
and Australia. FJB’s main operations involve obtaining licences from renowned franchise brands and retailing their fashion wear through its distribution network that largely comprises stand-alone boutiques. Its success with GUESS (19 years of partnership) has enabled the group to expand is brand portfolio to over 8 fashion brands today. Revenue from its fashion retail business grew at a 4-year CAGR of 18% over FY06 – FY10.
Timepiece Distribution The second revenue driver is timepiece distribution. The group exclusively distributes
timepiece brands such as Bell & Ross, Chronotech, DeWitt, Girard-Perregaux, GC, GUESS, Marc Ecko, Nautica and Victorinox Swiss Army throughout points-of-sale (comprising watch retailers) across Asia. The bulk of the group’s timepiece distribution business is derived from North Asia. It recently set up the first Bell & Ross boutique in Singapore. Unlike its retail business, the watch distribution business is more scalable and does not require stand-alone stores. Revenue from its timepiece distribution business grew at a 4-year CAGR of 4% over FY06 – FY10.
Creative and Licensing FJB’s creative and licensing division has, among other things, its conceptualized and
developed house label RAOUL and also creates original design, and manufactures merchandise.
Investing in Lifestyle Concepts This business invests in the entertainment segment to create additional value for shareholders.
Current holdings include a substantial minority stake in St. James Holdings Limited, which operates one of the largest entertainment venues in Singapore, the St. James Power Station.
FJ Benjamin is South-east Asia’s leading fashion and lifestyle group with 50 years of retail expertise
Revenue derived mainly from luxury and lifestyle retailing in Southeast Asia
Equity Research – FJ Benjamin Holdings Limited | 21 October 2010
7
Fig 4: Revenue breakdown by business Fig 5: Revenue trend by business
Fashion 68.1%
Timepieces 31.6%
Licensing 0.3%
Legend: segments listed clockwise from top
0
50
100
150
200
250
300
350
400
FY2007 FY2008 FY2009 FY2010
SG
Dm
Fashion Timepieces Licensing
Source: Company Source: Company
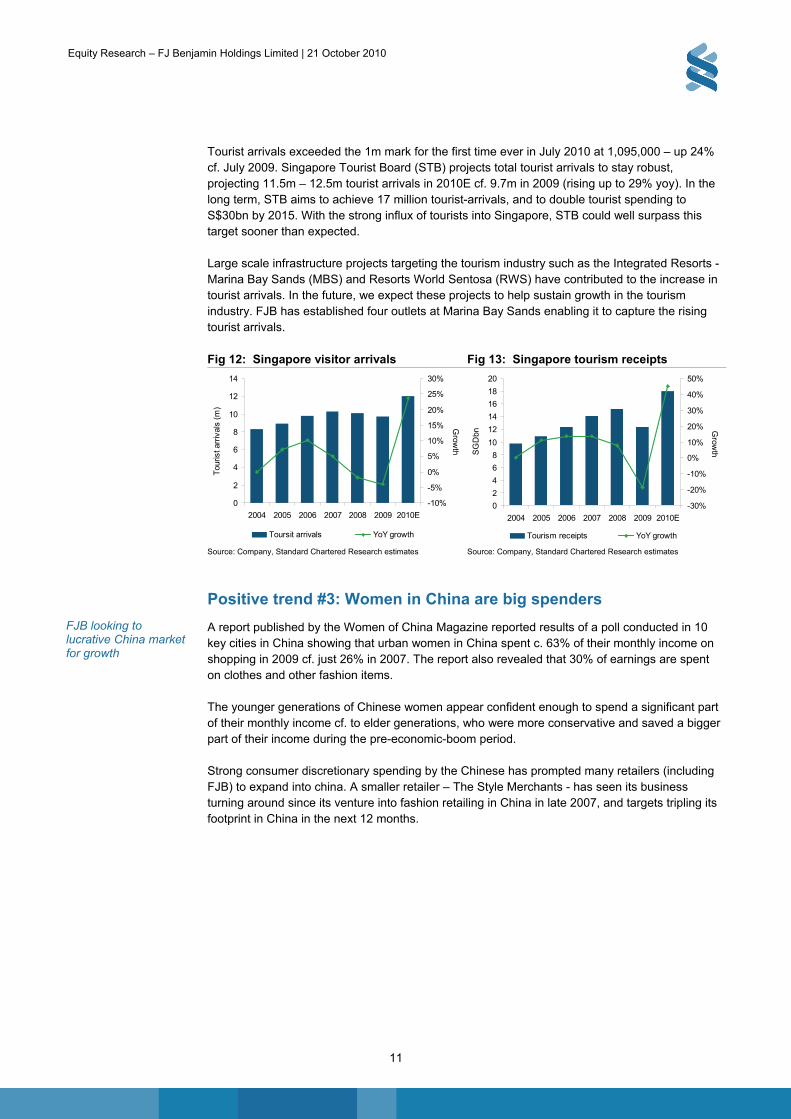
The company has focused its operations mainly in Southeast Asia (Singapore. Malaysia and Indonesia), which contributed 85% of revenue in FY10. 14% of its revenue is derived from North Asia where it focuses on the watch distribution business. Revenue from Southeast Asia grew at a 4-year CAGR of 14% over FY06-FY10, while revenue from North Asia grew at a CAGR of 4% over the same period.
Fig 6: Revenue breakdown by geography Fig 7: Revenue trend by geography
Southeast Asia 84.7%
North Asia 14.1%
Other 1.3%
Legend: segments listed clockwise from top
0
50
100
150
200
250
300
350
400
FY2007 FY2008 FY2009 FY2010
SG
Dm
Southeast Asia North Asia Other
Source: Company Source: Company

Equity Research – FJ Benjamin Holdings Limited | 21 October 2010
8
Porter’s five forces
Fig 8: Luxury and lifestyle fashion retailing (Asia): Porter’s five competitive forces model Healthy relationships with original
brand owners are essential since this industry places special demands on the supply chain which requires flexible and speedy responses, and to sustain the continuation of the franchise agreements.
Fashion trends changing from season to season and with more marketing channels (online, catalogue sales, retail stores, etc), sourcing constantly and in a reliable manner is crucial in order to satisfy the customers and generate store profits.
Threat from new players entering the industry is limited in the short term due to lack of infrastructure (distribution network, location of stores) and the difficulty in establishing franchise agreements.
Nevertheless, independent retailers with domestic brands may enter the industry with minimum impact to existing players.
Suppliers Potential entrants
Bargaining power of suppliers
HIGH
Threat of new entrants
MEDIUM Industry competitors
Rivalry among existing firms
HIGH
Substitutes Buyers
Threat of substitute products
HIGH
Bargaining power of buyers
HIGH
Counterfeit goods pose stiff competition in terms of substitutes to genuine brands.
Growth in technology and wide demand fuels the counterfeit industry which is a direct substitute for original brands.
The retail fashion industry is highly competitive, with many players competing for market share.
Upgrading stores and opening of stores in popular locations is important to maintain market position. Target customers are price inelastic
and perceive brand consumption as a social symbol.
Failure to maintain the perceived level of brand identity will result in customer turnover.
Due to increases in disposable income levels, customers may switch to retailers who offer more up market premium brands.
Source: Standard Chartered Research based on Porter 1980 p.4.

Equity Research – FJ Benjamin Holdings Limited | 21 October 2010
9
SWOT
Fig 9: SWOT analysis – FJ Benjamin
Strengths
Wide retail network helps maintain competitiveness. Operating 172 stores across Singapore, Malaysia, Indonesia, Thailand, and Australia in prime locations mainly in Asia enables FJB to cater to its premium customers and tourists.
Well diversified luxury and lifestyle brand portfolio. The brand portfolio comprising more than 20 global reputable-luxury and lifestyle brands enables FJB to capture and retain customers with its wide array of brands to choose from.
Multi-lingual retail staff improves customer service. FJB invests heavily in training their retail staff in terms of increasing service quality and language proficiency (Mandarin, Arabic, and Russian) to serve tourists who visit the stores from various regions.
Strong balance sheet and positive cash flow allow FJB to fund its capex plans. FJB had SGD7.4m of net cash at the end of FY2010 thanks to cost-cutting measures and inventory control. This could be utilised to fund the FY2011 capex of SGD6.9m while maintaining 0% gearing as in FY2010.
Weaknesses
Predominant focus on SE Asia. Cautious expansion into lucrative markets like China.
Earnings are highly cyclical and tend to peak in the late stages of a cyclical upturn. There is thus risk of over expansion during good times.
Fluctuating foreign exchange rates. FJB, operating in many countries, is constantly exposed to exchange rate risk which can adversely affect the bottom line (Foreign exchange loss SGD3.7m, 2009).
Opportunities
RAOUL, FJB’s proprietary brand was one of the brands topping the high fashion category in a recent Mystery Shopping Survey. Such an achievement demonstrates the degree of brand acceptance by customers and its potential for future growth into new markets.
New international brands to accelerate earnings potential. French luxury brand, Goyard, Swiss premium timepiece brand, Dewitt, and Givenchy, the 2nd franchise from LVMH, are new entrants to FJB’s existing brand portfolio. These should contribute to revenue growth as well as to enhancing the corporate image and market sustainability.
Increased flow in tourists arrivals in Asia. In July 2010, Hong Kong recorded a 31.9% y-o-y increase and Singapore welcomed more than a million tourists. FJB is well positioned to benefit from such trends.
Recovery in the region should impact positively on growth. Post global economic downturn, the Asian region signals positive recovery, which could be leveraged by FJB in expanding into new markets.
Threats
Competition. The majority of FJB’s competitors operate with large store numbers (Esprit -1,128, Dickson Concepts - more than 1,000, WINGT - more than 180, Metro - 879,000 square feet).
Macroeconomic instability threatens growth. Economic shocks pose an explicit threat to FJB’s growth as it caters to the premium fashion retailing market. In 2009, FJB experienced an interruption to its growth due to consumers curtailing their spending.
Brand piracy threatens top line. Rapidly spreading technological advances spur the mass production of counterfeit products, which pose a threat to FJB’s top line and margins.
Threat of losing franchises. FJB is exposed to the risk of losing its franchise agreements if the brand owners opt for independent retailing.
Source: Company data

Equity Research – FJ Benjamin Holdings Limited | 21 October 2010
10
Positive industry trends
Positive trend #1: Good proxy for growth in Asia
With more than 90% of its retail presence in Asia, FJB stands to benefit from increased retail spending as a result of improved consumer confidence in Asia.
As per the latest data gathered in the inaugural MasterCard Worldwide Index of Consumer Spending Capability (MWICSC) in 1H2010, retail sales are expected to grow in double digits over the next 12 month period for China, Hong Kong, Indonesia, and Malaysia.
In our opinion, we are still at the early stage of a cyclical upturn in consumer discretionary spending as economies in Asia move from strength to strength. In Singapore, the government has raised its 2010 GDP forecast to a new high of 13-15%, from 7-9%, after the strong 1H led by higher exports and retail spending. The Asian Development Bank (ADB) raised its forecasts for Asian Economic growth this year to 8.2%, from 7.2% previously, driven by exceptional robustness and resilience for China and India. South Asia’s growth forecast has been lifted to 7.8%, from 7.4%, mainly due to stronger domestic demand conditions and improving consumer and business confidence. While the ADB expects economic growth in Asia to moderate slightly to 7.3% in 2011, we believe the economies of FJB’s key markets such as Singapore, Indonesia, Malaysia, Hong Kong and China will stay robust, underpinned by rising domestic consumption and new tourist attractions such as the Integrated Resorts in Singapore.
Fig 10: Key economic data
Country (FJB’s top 5 markets)
Actual retail spending YoY (%)(as of July 2010)
GDP YoY (%) 2010E
Population(millions, as at 2009)
Singapore (-1.2) 13-15% 5
Malaysia n.a. 6.8 26
Indonesia n.a. 6.0 240.3
Hong Kong 18.9 5.9 7.1
China 17.9 10.0 1,323.6Source: Bloomberg, IMF
Fig 11: Retail sales to stay buoyant underpinned by strong GDP in key markets
Hong Kong
-20
-10
0
10
20
30
40
50
Dec
-04
Dec
-05
Dec
-06
Dec
-07
Dec
-08
Dec
-09
QoQ
gro
wth
%
Wearing apparel QoQ GDP QoQ
Singapore
-20
-15
-10
-5
0
5
10
15
20
25
Mar
-05
Mar
-06
Mar
-07
Mar
-08
Mar
-09
Mar
-10
QoQ
gro
wth
%
Wearing apparel QoQ GDP QoQ
Source: Company, Standard Chartered Research
Positive trend #2: Upsurge in tourist arrivals into Singapore
The group’s biggest market, Singapore is set to become one of the fastest growing economies in the world this year, buoyed by record tourism arrivals. The opening of the two Integrated Resorts – Resorts World Sentosa and Marina Bay Sands have boosted the tourism and retail scene in Singapore, and we believe the impact is likely to be significant and long lasting.
FJB is well positioned to benefit from improving consumer discretionary spending in Asia.
FJB is the only pure fashion retailer listed on the SGX, and should benefit from the tourism upsurge in Singapore
Equity Research – FJ Benjamin Holdings Limited | 21 October 2010
11
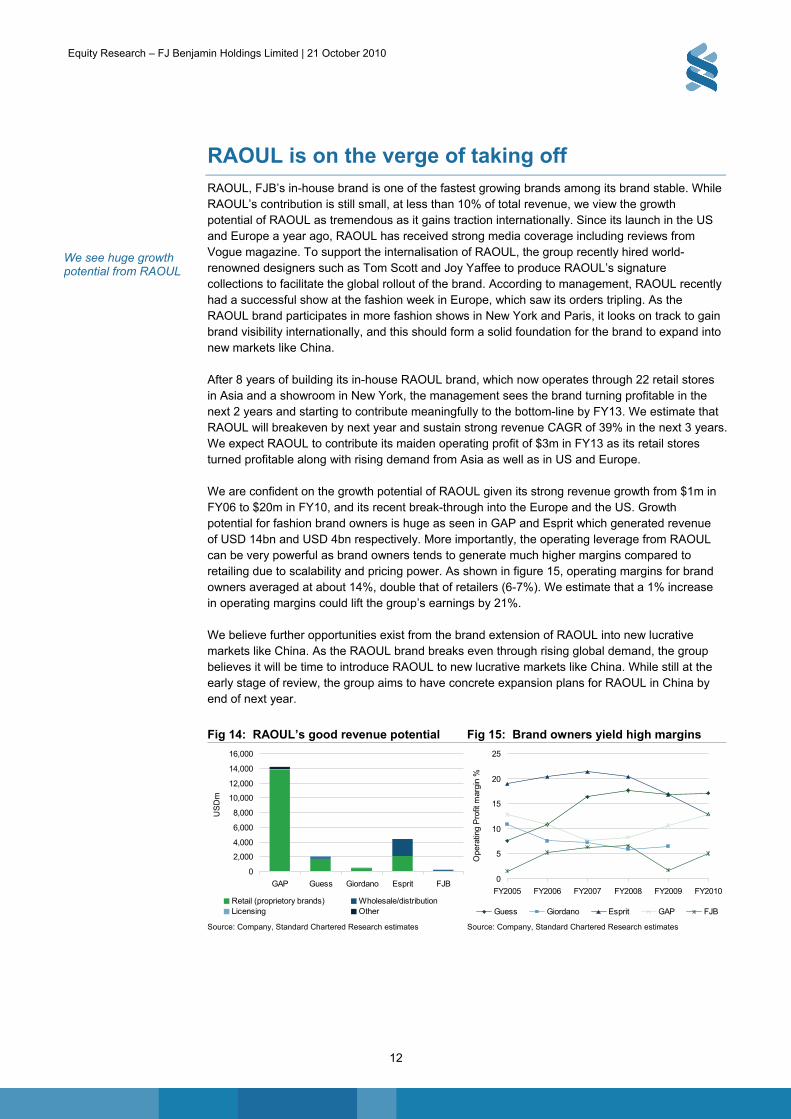
Tourist arrivals exceeded the 1m mark for the first time ever in July 2010 at 1,095,000 – up 24% cf. July 2009. Singapore Tourist Board (STB) projects total tourist arrivals to stay robust, projecting 11.5m – 12.5m tourist arrivals in 2010E cf. 9.7m in 2009 (rising up to 29% yoy). In the long term, STB aims to achieve 17 million tourist-arrivals, and to double tourist spending to S$30bn by 2015. With the strong influx of tourists into Singapore, STB could well surpass this target sooner than expected.
Large scale infrastructure projects targeting the tourism industry such as the Integrated Resorts - Marina Bay Sands (MBS) and Resorts World Sentosa (RWS) have contributed to the increase in tourist arrivals. In the future, we expect these projects to help sustain growth in the tourism industry. FJB has established four outlets at Marina Bay Sands enabling it to capture the rising tourist arrivals.
Fig 12: Singapore visitor arrivals Fig 13: Singapore tourism receipts
0
2
4
6
8
10
12
14
2004 2005 2006 2007 2008 2009 2010E
Tou
rist a
rriv
als
(m)
-10%
-5%
0%
5%
10%
15%
20%
25%
30%
Grow
th
Toursit arrivals YoY growth
0
2
4
6
8
10
12
14
16
18
20
2004 2005 2006 2007 2008 2009 2010E
SG
Dbn
-30%
-20%
-10%
0%
10%
20%
30%
40%
50%
Grow
th
Tourism receipts YoY growth
Source: Company, Standard Chartered Research estimates Source: Company, Standard Chartered Research estimates
Positive trend #3: Women in China are big spenders
A report published by the Women of China Magazine reported results of a poll conducted in 10 key cities in China showing that urban women in China spent c. 63% of their monthly income on shopping in 2009 cf. just 26% in 2007. The report also revealed that 30% of earnings are spent on clothes and other fashion items.
The younger generations of Chinese women appear confident enough to spend a significant part of their monthly income cf. to elder generations, who were more conservative and saved a bigger part of their income during the pre-economic-boom period.
Strong consumer discretionary spending by the Chinese has prompted many retailers (including FJB) to expand into china. A smaller retailer – The Style Merchants - has seen its business turning around since its venture into fashion retailing in China in late 2007, and targets tripling its footprint in China in the next 12 months.
FJB looking to lucrative China market for growth
Equity Research – FJ Benjamin Holdings Limited | 21 October 2010
12
RAOUL is on the verge of taking off RAOUL, FJB’s in-house brand is one of the fastest growing brands among its brand stable. While RAOUL’s contribution is still small, at less than 10% of total revenue, we view the growth potential of RAOUL as tremendous as it gains traction internationally. Since its launch in the US and Europe a year ago, RAOUL has received strong media coverage including reviews from Vogue magazine. To support the internalisation of RAOUL, the group recently hired world-renowned designers such as Tom Scott and Joy Yaffee to produce RAOUL’s signature collections to facilitate the global rollout of the brand. According to management, RAOUL recently had a successful show at the fashion week in Europe, which saw its orders tripling. As the RAOUL brand participates in more fashion shows in New York and Paris, it looks on track to gain brand visibility internationally, and this should form a solid foundation for the brand to expand into new markets like China.
After 8 years of building its in-house RAOUL brand, which now operates through 22 retail stores in Asia and a showroom in New York, the management sees the brand turning profitable in the next 2 years and starting to contribute meaningfully to the bottom-line by FY13. We estimate that RAOUL will breakeven by next year and sustain strong revenue CAGR of 39% in the next 3 years. We expect RAOUL to contribute its maiden operating profit of $3m in FY13 as its retail stores turned profitable along with rising demand from Asia as well as in US and Europe.
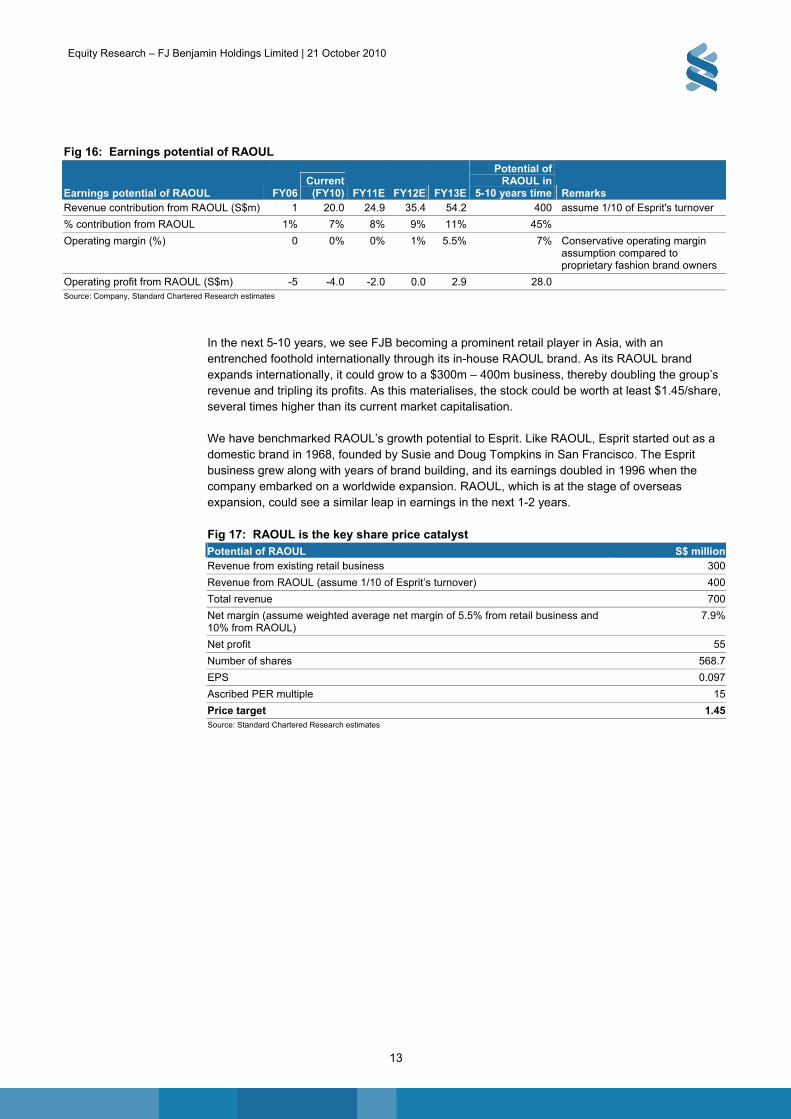
We are confident on the growth potential of RAOUL given its strong revenue growth from $1m in FY06 to $20m in FY10, and its recent break-through into the Europe and the US. Growth potential for fashion brand owners is huge as seen in GAP and Esprit which generated revenue of USD 14bn and USD 4bn respectively. More importantly, the operating leverage from RAOUL can be very powerful as brand owners tends to generate much higher margins compared to retailing due to scalability and pricing power. As shown in figure 15, operating margins for brand owners averaged at about 14%, double that of retailers (6-7%). We estimate that a 1% increase in operating margins could lift the group’s earnings by 21%.
We believe further opportunities exist from the brand extension of RAOUL into new lucrative markets like China. As the RAOUL brand breaks even through rising global demand, the group believes it will be time to introduce RAOUL to new lucrative markets like China. While still at the early stage of review, the group aims to have concrete expansion plans for RAOUL in China by end of next year.
Fig 14: RAOUL’s good revenue potential Fig 15: Brand owners yield high margins
0
2,000
4,000
6,000
8,000
10,000
12,000
14,000
16,000
GAP Guess Giordano Esprit FJB
US
Dm
Retail (proprietory brands) Wholesale/distributionLicensing Other
0
5
10
15
20
25
FY2005 FY2006 FY2007 FY2008 FY2009 FY2010
Ope
ratin
g P
rofit
mar
gin
%
Guess Giordano Esprit GAP FJB
Source: Company, Standard Chartered Research estimates Source: Company, Standard Chartered Research estimates
We see huge growth potential from RAOUL
Equity Research – FJ Benjamin Holdings Limited | 21 October 2010
13
Fig 16: Earnings potential of RAOUL
Earnings potential of RAOUL FY06 Current
(FY10) FY11E FY12E FY13E
Potential of RAOUL in
5-10 years time Remarks Revenue contribution from RAOUL (S$m) 1 20.0 24.9 35.4 54.2 400 assume 1/10 of Esprit's turnover
% contribution from RAOUL 1% 7% 8% 9% 11% 45%
Operating margin (%) 0 0% 0% 1% 5.5% 7% Conservative operating margin assumption compared to proprietary fashion brand owners
Operating profit from RAOUL (S$m) -5 -4.0 -2.0 0.0 2.9 28.0 Source: Company, Standard Chartered Research estimates
In the next 5-10 years, we see FJB becoming a prominent retail player in Asia, with an entrenched foothold internationally through its in-house RAOUL brand. As its RAOUL brand expands internationally, it could grow to a $300m – 400m business, thereby doubling the group’s revenue and tripling its profits. As this materialises, the stock could be worth at least $1.45/share, several times higher than its current market capitalisation.
We have benchmarked RAOUL’s growth potential to Esprit. Like RAOUL, Esprit started out as a domestic brand in 1968, founded by Susie and Doug Tompkins in San Francisco. The Esprit business grew along with years of brand building, and its earnings doubled in 1996 when the company embarked on a worldwide expansion. RAOUL, which is at the stage of overseas expansion, could see a similar leap in earnings in the next 1-2 years.
Fig 17: RAOUL is the key share price catalyst Potential of RAOUL S$ millionRevenue from existing retail business 300
Revenue from RAOUL (assume 1/10 of Esprit’s turnover) 400
Total revenue 700
Net margin (assume weighted average net margin of 5.5% from retail business and 10% from RAOUL)
7.9%
Net profit 55
Number of shares 568.7
EPS 0.097
Ascribed PER multiple 15
Price target 1.45Source: Standard Chartered Research estimates
Equity Research – FJ Benjamin Holdings Limited | 21 October 2010
14
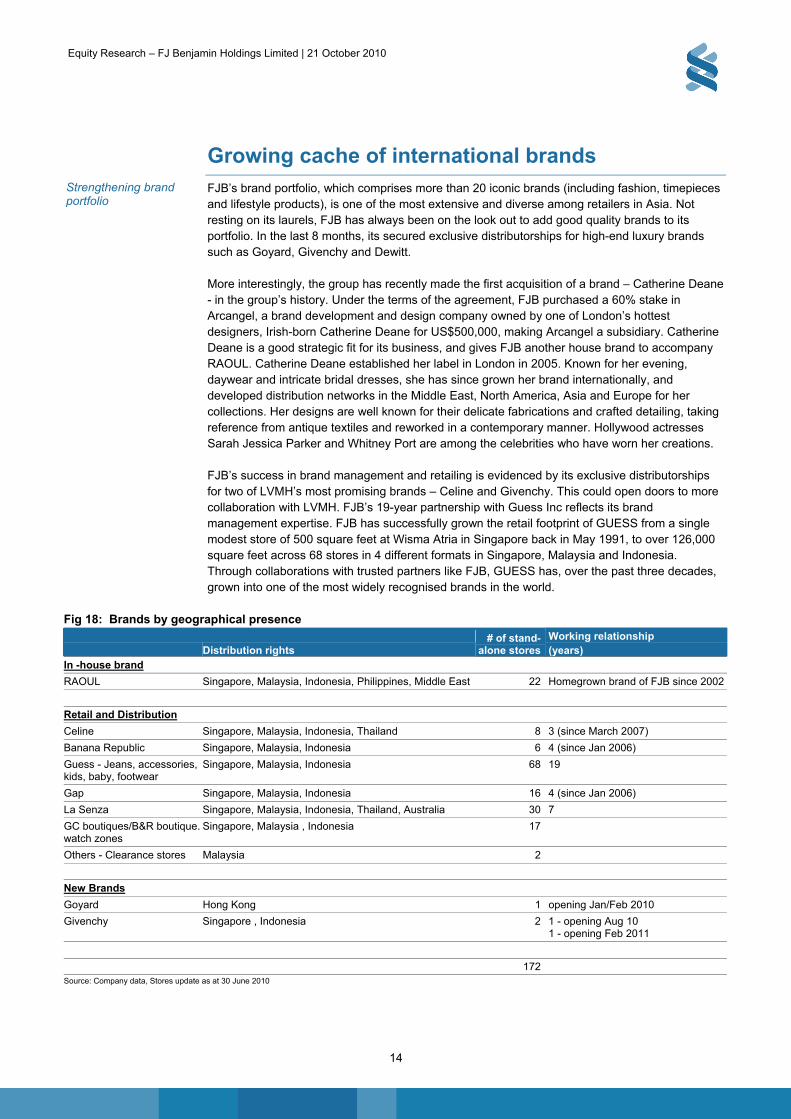
Growing cache of international brands FJB’s brand portfolio, which comprises more than 20 iconic brands (including fashion, timepieces and lifestyle products), is one of the most extensive and diverse among retailers in Asia. Not resting on its laurels, FJB has always been on the look out to add good quality brands to its portfolio. In the last 8 months, its secured exclusive distributorships for high-end luxury brands such as Goyard, Givenchy and Dewitt.
More interestingly, the group has recently made the first acquisition of a brand – Catherine Deane - in the group’s history. Under the terms of the agreement, FJB purchased a 60% stake in Arcangel, a brand development and design company owned by one of London’s hottest designers, Irish-born Catherine Deane for US$500,000, making Arcangel a subsidiary. Catherine Deane is a good strategic fit for its business, and gives FJB another house brand to accompany RAOUL. Catherine Deane established her label in London in 2005. Known for her evening, daywear and intricate bridal dresses, she has since grown her brand internationally, and developed distribution networks in the Middle East, North America, Asia and Europe for her collections. Her designs are well known for their delicate fabrications and crafted detailing, taking reference from antique textiles and reworked in a contemporary manner. Hollywood actresses Sarah Jessica Parker and Whitney Port are among the celebrities who have worn her creations.
FJB’s success in brand management and retailing is evidenced by its exclusive distributorships for two of LVMH’s most promising brands – Celine and Givenchy. This could open doors to more collaboration with LVMH. FJB’s 19-year partnership with Guess Inc reflects its brand management expertise. FJB has successfully grown the retail footprint of GUESS from a single modest store of 500 square feet at Wisma Atria in Singapore back in May 1991, to over 126,000 square feet across 68 stores in 4 different formats in Singapore, Malaysia and Indonesia. Through collaborations with trusted partners like FJB, GUESS has, over the past three decades, grown into one of the most widely recognised brands in the world.
Fig 18: Brands by geographical presence
Distribution rights # of stand-
alone storesWorking relationship (years)
In -house brand
RAOUL Singapore, Malaysia, Indonesia, Philippines, Middle East 22 Homegrown brand of FJB since 2002
Retail and Distribution
Celine Singapore, Malaysia, Indonesia, Thailand 8 3 (since March 2007)
Banana Republic Singapore, Malaysia, Indonesia 6 4 (since Jan 2006)
Guess - Jeans, accessories, kids, baby, footwear
Singapore, Malaysia, Indonesia 68 19
Gap Singapore, Malaysia, Indonesia 16 4 (since Jan 2006)
La Senza Singapore, Malaysia, Indonesia, Thailand, Australia 30 7
GC boutiques/B&R boutique. watch zones
Singapore, Malaysia , Indonesia 17
Others - Clearance stores Malaysia 2
New Brands
Goyard Hong Kong 1 opening Jan/Feb 2010
Givenchy Singapore , Indonesia 2 1 - opening Aug 10 1 - opening Feb 2011
172 Source: Company data, Stores update as at 30 June 2010
Strengthening brand portfolio

Equity Research – FJ Benjamin Holdings Limited | 21 October 2010
15
Fig 19: Timepieces Geographical Coverage Luxury (high range) Girad-Perregaux Singapore, Malaysia, Hong Kong, Indonesia, China, Taiwan, Thailand
Jean Richard Singapore, Malaysia, Hong Kong, Indonesia, China, Taiwan, Thailand
Bell & Ross Singapore, Malaysia, Hong Kong, Indonesia, Taiwan, Thailand
Life-style (low-mid range)
Guess? Collection Singapore, Malaysia, Hong Kong, Indonesia, Taiwan, Korea Duty Free
Nike Timing Singapore, Malaysia, Hong Kong, Indonesia, Taiwan
Victorinox Swiss Army Singapore, Malaysia, Indonesia
Nautica Singapore, Malaysia, Hong Kong, Indonesia, Taiwan
Marc Ecko Singapore, Malaysia, Hong Kong, Indonesia, Taiwan
New Brands
DeWitt SE and North Asia
Chronotec SE Asia Source: Company data

Equity Research – FJ Benjamin Holdings Limited | 21 October 2010
16
Prime retail network FJB has established a prime retail network across Asia in the last 50 years, comprising 172 retail stores and shop-in-shops that are strategically located in prime shopping malls. It has offices in Singapore, Kuala Lumpur, Jakarta, Bangkok, Hong Kong, Taiwan and Sydney.
With three new boutiques opened at the Marina Bay Sands and one more to come next year (namely Guess, Banana Republic, La Senza and RAOUL), we believe the group is well positioned to benefit from rising tourist arrivals into Singapore. For new brands such as Goyard, the group has successfully secured a strategic location at the Peninsula Hotel in Hong Kong on attractive rental terms. Next year, the group’s focus will be on its fast-growing Indonesia market as FJB plans to add 13 new stores in new key malls in Indonesia. We expect CAPEX to be S$6.9m for FY2011.
Fig 20: Total square footage Fig 21: Number of stores
389
378
348
368
320
330
340
350
360
370
380
390
400
2008 2009 2010 2011E
Sq Ft '000
1 1 1 0 0
33 37 30 37 37
51
7668 63 63
44
6162 64
77
0
20
40
60
80
100
120
140
160
180
200
FY2007 FY2008 FY2009 FY2010 FY2011E
Australia
Hong Kong
Indonesia
Malaysia
Singapore
Taiwan
Source: Company Source: Company
Prime retail network to sustain steady earnings momentum
Equity Research – FJ Benjamin Holdings Limited | 21 October 2010
17
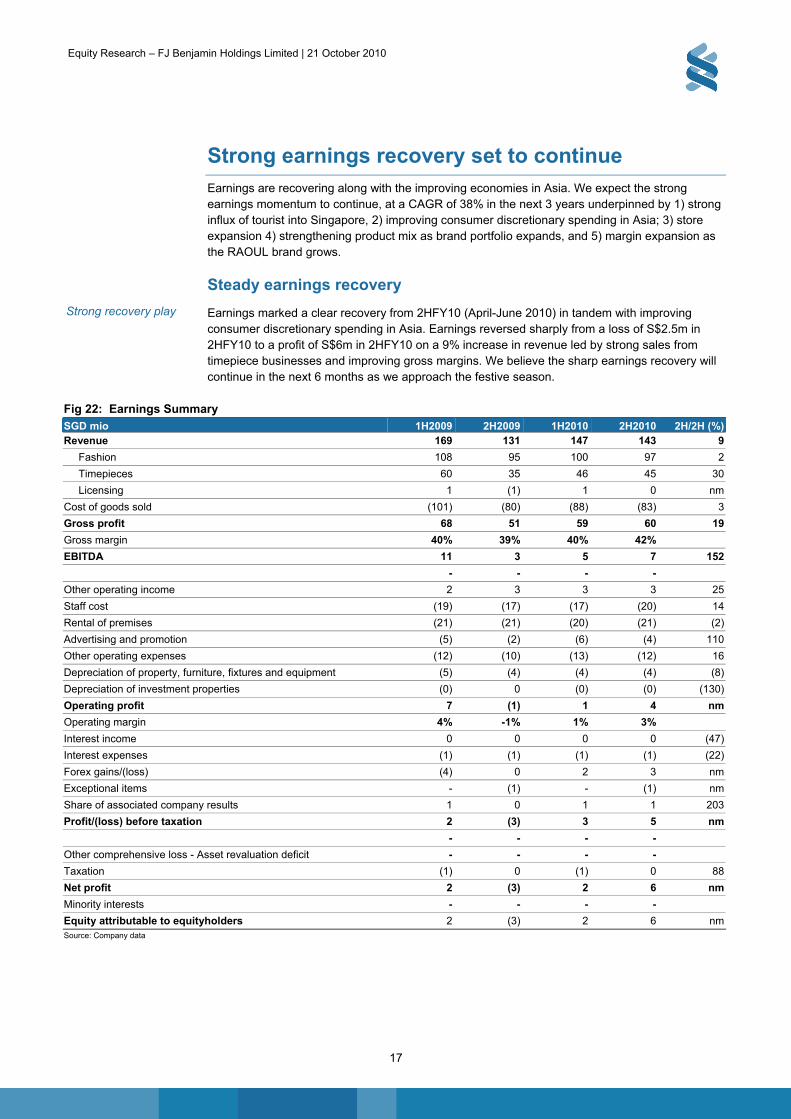
Strong earnings recovery set to continue Earnings are recovering along with the improving economies in Asia. We expect the strong earnings momentum to continue, at a CAGR of 38% in the next 3 years underpinned by 1) strong influx of tourist into Singapore, 2) improving consumer discretionary spending in Asia; 3) store expansion 4) strengthening product mix as brand portfolio expands, and 5) margin expansion as the RAOUL brand grows.
Steady earnings recovery
Earnings marked a clear recovery from 2HFY10 (April-June 2010) in tandem with improving consumer discretionary spending in Asia. Earnings reversed sharply from a loss of S$2.5m in 2HFY10 to a profit of S$6m in 2HFY10 on a 9% increase in revenue led by strong sales from timepiece businesses and improving gross margins. We believe the sharp earnings recovery will continue in the next 6 months as we approach the festive season.
Fig 22: Earnings Summary SGD mio 1H2009 2H2009 1H2010 2H2010 2H/2H (%)Revenue 169 131 147 143 9
Fashion 108 95 100 97 2
Timepieces 60 35 46 45 30
Licensing 1 (1) 1 0 nm
Cost of goods sold (101) (80) (88) (83) 3
Gross profit 68 51 59 60 19
Gross margin 40% 39% 40% 42%
EBITDA 11 3 5 7 152
- - - -
Other operating income 2 3 3 3 25
Staff cost (19) (17) (17) (20) 14
Rental of premises (21) (21) (20) (21) (2)
Advertising and promotion (5) (2) (6) (4) 110
Other operating expenses (12) (10) (13) (12) 16
Depreciation of property, furniture, fixtures and equipment (5) (4) (4) (4) (8)
Depreciation of investment properties (0) 0 (0) (0) (130)
Operating profit 7 (1) 1 4 nm
Operating margin 4% -1% 1% 3%
Interest income 0 0 0 0 (47)
Interest expenses (1) (1) (1) (1) (22)
Forex gains/(loss) (4) 0 2 3 nm
Exceptional items - (1) - (1) nm
Share of associated company results 1 0 1 1 203
Profit/(loss) before taxation 2 (3) 3 5 nm
- - - -
Other comprehensive loss - Asset revaluation deficit - - - -
Taxation (1) 0 (1) 0 88
Net profit 2 (3) 2 6 nm
Minority interests - - - -
Equity attributable to equityholders 2 (3) 2 6 nmSource: Company data
Strong recovery play
Equity Research – FJ Benjamin Holdings Limited | 21 October 2010
18
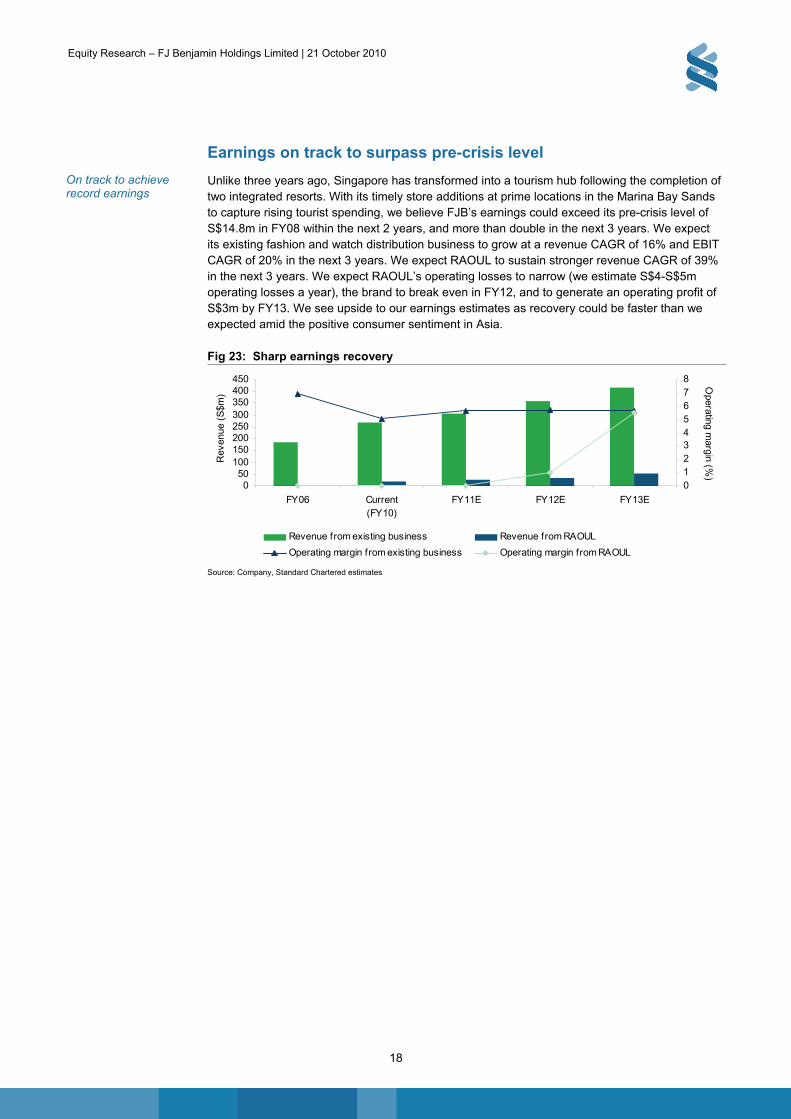
Earnings on track to surpass pre-crisis level
Unlike three years ago, Singapore has transformed into a tourism hub following the completion of two integrated resorts. With its timely store additions at prime locations in the Marina Bay Sands to capture rising tourist spending, we believe FJB’s earnings could exceed its pre-crisis level of S$14.8m in FY08 within the next 2 years, and more than double in the next 3 years. We expect its existing fashion and watch distribution business to grow at a revenue CAGR of 16% and EBIT CAGR of 20% in the next 3 years. We expect RAOUL to sustain stronger revenue CAGR of 39% in the next 3 years. We expect RAOUL’s operating losses to narrow (we estimate S$4-S$5m operating losses a year), the brand to break even in FY12, and to generate an operating profit of S$3m by FY13. We see upside to our earnings estimates as recovery could be faster than we expected amid the positive consumer sentiment in Asia.
Fig 23: Sharp earnings recovery
050
100150200250300350400450
FY06 Current(FY10)
FY11E FY12E FY13E
Rev
enue
(S
$m)
012345678 O
perating margin (%
)
Revenue from existing business Revenue from RAOUL
Operating margin from existing business Operating margin from RAOUL
Source: Company, Standard Chartered estimates
On track to achieve record earnings

Equity Research – FJ Benjamin Holdings Limited | 21 October 2010
19
Improving balance sheet
Strengthening cash position and steady dividends
While earnings went into losses in FY09 during the global financial crisis, the group’s ability to strengthen its balance sheet and pay dividends reflects shrewd management capability and good commitment to shareholders, in our view. Cost discipline and inventory control led the group to generate a record high free cashflow of S$19m during the crisis period. The group continues to reward shareholders amid the crisis, offering a dividend of 0.5 ct/share despite the dip in earnings.
With fifty years of retail, distribution and branding building experience, FJB has weathered several crises unscathed, and emerged from each crisis as a stronger player. As its balance sheet has strengthened from a high net gearing of 20% in FYE June 2009 to a net cash position currently, we are confident that the group is poised to drive its earnings above pre-crisis levels as early as next year, and sustain its attractive dividends of at least 4%.
Fig 24: Strengthening cash position Fig 25: Steady dividends
-40-30-20-10
010203040506070
FY
05
FY
06
FY
07
FY
08
FY
09
FY
10
FY
11E
FY
12E
FY
13E
S$m
Net cash Free cash flow
16.5
0.52.02.4
2.0 1.5
2.02.8
1.1
0
2
4
6
8
10
12
14
16
18
FY
05
FY
06
FY
07
FY
08
FY
09
FY
10
FY
11E
FY
12E
FY
13E
S c
ents
0
50
100
150
200
250
300
350
400
450
500
Dividend payout (%
)
Source: Company, Standard Chartered Research estimates Source: Company, Standard Chartered Research estimates
Working capital
The group’s working capital is funded mainly by trade payables and bank borrowings. Trade payables arise mainly from its timepiece distribution business, which accounts for about 30% of its revenue. Credit terms with its watch principals range between 60-100 days. Long-standing principals like Gerald Perregaux tend to grant longer credit terms. FJB’s cash conversion cycle has been well maintained within 30-70 days in the last 4 years.
Fig 26: Working capital cycle
FY07 FY08 FY09 FY10 FY11E FY12E FY13ETrade payable days 90 85 89 92 90 90 92
Acct receivable days 30 26 45 42 45 45 42
Inventory days 106 98 112 109 100 100 100
cash conversion cycle 47 39 67 58 55 55 50Source: Company, Standard Chartered Research estimates
We expect St. James to turn profitable this year
The group holds an approximately 22.36% stake in St. James Holdings Limited, acquired 2 years ago at an investment cost of about S$2m. St James is a leading player in Singapore’s night entertainment industry and renowned as a forerunner in producing innovative live music concepts. We expect this associate of FJB to turn profitable in FY11 given its proximity to the integrated resort, Resorts World Sentosa.

Equity Research – FJ Benjamin Holdings Limited | 21 October 2010
20
Disposal of investment properties
Notably, the group has disposed of two properties – a commercial property at Henderson in Singapore and two office units at North Point Hong Kong for $10.4m. These disposals resulted in an exceptional net gain of $48,000 in FY10. There is only one non-core property left on its balance sheet - a Hong Kong property (approximately 17,000 sq ft) worth S$20m (8% of total assets), of which 59% is owner occupied for the group’s day to day operations.

Equity Research – FJ Benjamin Holdings Limited | 21 October 2010
21
Key risks
Economic downturn
The performance of the regional retail sector depends on the region’s economic growth. We have based our forecasts for FJB on Singapore’s continued GDP growth, barring anaemic economic gains and reduced disposable incomes weighing on consumer confidence. Amid the winding road to a global economic recovery, European debt woes and economic slowdown in the US could still dampen the global macro-economic outlook and consumer sentiment.
Currency exchange risk
The group has transactional currency exposures arising from sales or purchases that are denominated in a currency other than the respectively functional currencies of group entities. The group seeks to maintain a natural hedge through the matching of liabilities against assets in the same currency or against the entity’s functional currency. Where appropriate, the group engages in foreign currency forward contracts to reduce exposure from currency fluctuations.
The following table demonstrates the sensitivity to a reasonably possible change in the major foreign currencies that the group is exposed to, with all other variables held constant, of the group’s profit before tax in FY09. The weakening of the below currencies with the same percentage point changes result in an opposite change to the profit before tax with the same quantum. The strengthening of the below currencies with the same percentage point changes result in an opposite change to the profit before tax with the same quantum.
Fig 27: Foreign exchange impact to PBT 2009 Changes Profit before tax (S$m)
USD 7% -2.2
CHF 1% -0.8
EURO 5% -0.1
SGD 7% -2.7
Thb 5% 0.3
HK$ 7% 0.3Source: Company, Bloomberg
Management has managed its forex exposure well in the last 8 years except for FY09. The foreign exchange differences relate partly to the timing difference between the booking of inventories in foreign currencies and the payment for such purchases and partly due to revaluation of inter-company loans at year end.
Fig 28: Foreign exchange (forex) FY03 FY04 FY05 FY06 FY07 FY08 FY09 FY10 1HFY10 1HFY10
Foreign exchange gain/(loss) 1.2 1.6 1.0 0.63 5.0 0.3 -3.7 4.4 1.8 2.6
Operating profit before forex 0.217 0.332 2.6 12.5 16.6 16.9 5.5 5.1 1.4 3.7
Operating profit including forex 1.4 1.9 3.6 13.1 21.6 17.2 1.9 9.5 3.2 6.3Source: Company, Bloomberg

Equity Research – FJ Benjamin Holdings Limited | 21 October 2010
22
Corporate information
Corporate structure
Joint ventures of the group include, FJB Concepts (Australia), with the principal business of managing, and FJB (Australia) Partnership, which imports, distributes, and retails consumer fashion wear and accessories.
Associates of FJB Group include a 48% stake in FJD which is an investment holding company in Singapore, and a 22% stake in St James Holding Limited, an investment holding company in Singapore with investments in the entertainments business.
All other subsidiaries are 100% owned by FJB.
Fig 29: Corporate Structure
22%
100%
48%
100%
100%
100%
100%
100%
79%
100%
100%
100%
100%
100%
100%
100%
51%
51%
F J Benjamin (Singapore)
F J Benjamin Lifestyles
FJ Benjamin Concepts
(Aust)
St. James
F J Benjamin Lifestyles
FJD
FJ Benjamin (Aust)
Partnership
F J Benjamin Concepts
F.J.B. Investments
F J Benjamin Luxury
Timepieces
F J Benjamin (Malaysia)
F J Benjamin Concepts (Thailand)
PT Meteor Prima Sejati
Group of Companies
F J Benjamin (H.K.)
Ferro Designs
F J Benjamin (Taiwan)
F J Benjamin (Australia)
F J Benjamin Fashions (U.S.)
FJ Benjamin Holdings Ltd
Key Associated Company
Key Subsidiary
Joint Venture Source: Company data

Equity Research – FJ Benjamin Holdings Limited | 21 October 2010
23
Shareholding structure
The largest shareholder is the Benjamin Family and Peter Lim, which hold respective stakes of 26% and 17.6% in the company.
Fig 30: Shareholding structure
Benjamin Family 26.0%
Peter Lim 17.6%
Raffles Investment limited 11.0%
Aberdeen Asset Management 8.0%
Other 37.5%
Legend: segments listed clockw ise from top
Source: Company
Board
FJB’s board consists of four executive directors, one non-executive Deputy Chairman, and four Independent Directors.
Executive Directors Frank Benjamin – Founder, Executive Chairman
Eli Manasseh (Nash) Benjamin – Chief Executive Officer, sits on the boards of National Museum – Singapore, and St. James Holdings Ltd.
Douglas Jackie Benjamin – Executive Director, CEO of FJB Singapore
Karen Chong Mee Keng - Executive Director, Group CFO
Non-Executive Directors Keith Tay Ah Kee – Non-Executive Deputy Chairman, former managing partner of KPMG from
1984-93, Chairman of Coleman Capital Ltd and Aviva Ltd.
Independent Directors Joseph Grimberg – Former Judicial Commissioner of the Supreme Court of Singapore; Sits on
the boards of Jurong Cement Ltd, and is the Chairman of Hotel Properties Ltd.
Reggie Thein – Former senior partner of PwC; Sits on the boards of Ascendas Pte Ltd, GuocoLeisure Limited, Grand Banks Yachts Limited, Guocoland Ltd, Haw Par Corporation Limited, Keppel Telecommunications & Transportation Ltd, MFS Technology Ltd, MobileOne Ltd and United Overseas Bank Limited.
Wong Ai Fong – Director of Communications, Asia Pacific, Nokia Pte Ltd.
Chew Kwee San - Executive Director of the Tecity Group
Equity Research – FJ Benjamin Holdings Limited | 21 October 2010
24
Management Besides the four executive directors with key roles in the group, other key management includes:
Samuel Benjamin – Group Director, Timepiece Division; SVP, FJB Fashion (US)
Quah Kim Tiong – Director Wholesale, FJB Singapore
Angie Chong – CEO, FJB Malaysia
Goretta Yeoh – Finance Director, FJB Malaysia
Tony Fung – CEO, FJB Hong Kong and FJB Taiwan
Lydia Chau – Finance Director, Hong Kong and Taiwan
Equity Research – FJ Benjamin Holdings Limited | 21 October 2010
25
Appendix
Brands
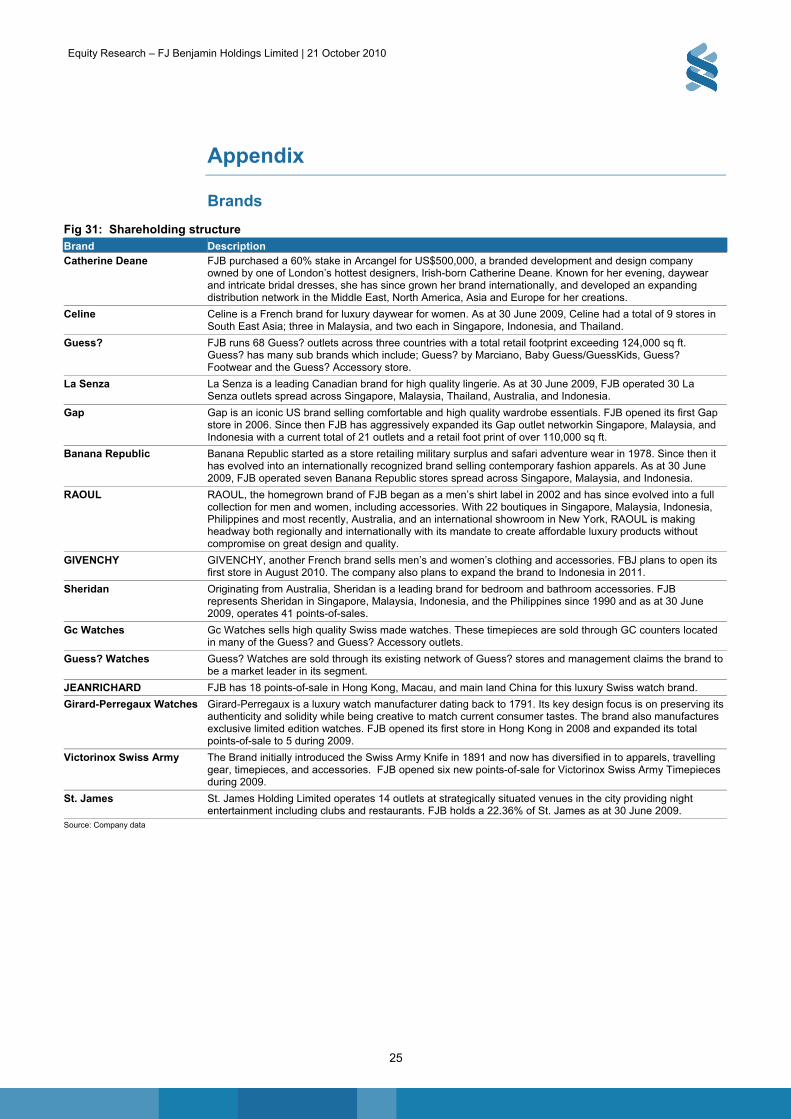
Fig 31: Shareholding structure
Brand Description Catherine Deane FJB purchased a 60% stake in Arcangel for US$500,000, a branded development and design company
owned by one of London’s hottest designers, Irish-born Catherine Deane. Known for her evening, daywear and intricate bridal dresses, she has since grown her brand internationally, and developed an expanding distribution network in the Middle East, North America, Asia and Europe for her creations.
Celine Celine is a French brand for luxury daywear for women. As at 30 June 2009, Celine had a total of 9 stores in South East Asia; three in Malaysia, and two each in Singapore, Indonesia, and Thailand.
Guess? FJB runs 68 Guess? outlets across three countries with a total retail footprint exceeding 124,000 sq ft. Guess? has many sub brands which include; Guess? by Marciano, Baby Guess/GuessKids, Guess? Footwear and the Guess? Accessory store.
La Senza La Senza is a leading Canadian brand for high quality lingerie. As at 30 June 2009, FJB operated 30 La Senza outlets spread across Singapore, Malaysia, Thailand, Australia, and Indonesia.
Gap Gap is an iconic US brand selling comfortable and high quality wardrobe essentials. FJB opened its first Gap store in 2006. Since then FJB has aggressively expanded its Gap outlet networkin Singapore, Malaysia, and Indonesia with a current total of 21 outlets and a retail foot print of over 110,000 sq ft.
Banana Republic Banana Republic started as a store retailing military surplus and safari adventure wear in 1978. Since then it has evolved into an internationally recognized brand selling contemporary fashion apparels. As at 30 June 2009, FJB operated seven Banana Republic stores spread across Singapore, Malaysia, and Indonesia.
RAOUL RAOUL, the homegrown brand of FJB began as a men’s shirt label in 2002 and has since evolved into a full collection for men and women, including accessories. With 22 boutiques in Singapore, Malaysia, Indonesia, Philippines and most recently, Australia, and an international showroom in New York, RAOUL is making headway both regionally and internationally with its mandate to create affordable luxury products without compromise on great design and quality.
GIVENCHY GIVENCHY, another French brand sells men’s and women’s clothing and accessories. FBJ plans to open its first store in August 2010. The company also plans to expand the brand to Indonesia in 2011.
Sheridan Originating from Australia, Sheridan is a leading brand for bedroom and bathroom accessories. FJB represents Sheridan in Singapore, Malaysia, Indonesia, and the Philippines since 1990 and as at 30 June 2009, operates 41 points-of-sales.
Gc Watches Gc Watches sells high quality Swiss made watches. These timepieces are sold through GC counters located in many of the Guess? and Guess? Accessory outlets.
Guess? Watches Guess? Watches are sold through its existing network of Guess? stores and management claims the brand to be a market leader in its segment.
JEANRICHARD FJB has 18 points-of-sale in Hong Kong, Macau, and main land China for this luxury Swiss watch brand.
Girard-Perregaux Watches Girard-Perregaux is a luxury watch manufacturer dating back to 1791. Its key design focus is on preserving its authenticity and solidity while being creative to match current consumer tastes. The brand also manufactures exclusive limited edition watches. FJB opened its first store in Hong Kong in 2008 and expanded its total points-of-sale to 5 during 2009.
Victorinox Swiss Army The Brand initially introduced the Swiss Army Knife in 1891 and now has diversified in to apparels, travelling gear, timepieces, and accessories. FJB opened six new points-of-sale for Victorinox Swiss Army Timepieces during 2009.
St. James St. James Holding Limited operates 14 outlets at strategically situated venues in the city providing night entertainment including clubs and restaurants. FJB holds a 22.36% of St. James as at 30 June 2009.
Source: Company data
Equity Research – FJ Benjamin Holdings Limited | 21 October 2010
26
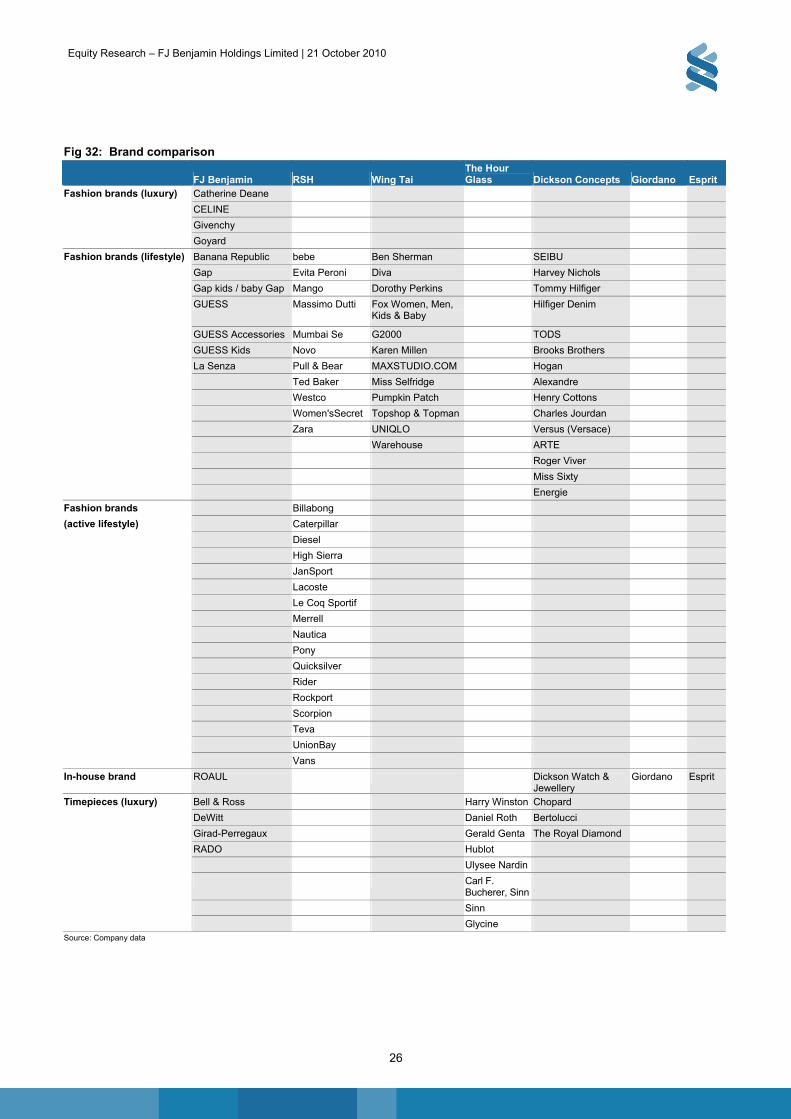
Fig 32: Brand comparison
FJ Benjamin RSH Wing Tai The Hour Glass Dickson Concepts Giordano Esprit
Fashion brands (luxury) Catherine Deane
CELINE
Givenchy
Goyard
Fashion brands (lifestyle) Banana Republic bebe Ben Sherman SEIBU
Gap Evita Peroni Diva Harvey Nichols
Gap kids / baby Gap Mango Dorothy Perkins Tommy Hilfiger
GUESS Massimo Dutti Fox Women, Men, Kids & Baby
Hilfiger Denim
GUESS Accessories Mumbai Se G2000 TODS
GUESS Kids Novo Karen Millen Brooks Brothers
La Senza Pull & Bear MAXSTUDIO.COM Hogan
Ted Baker Miss Selfridge Alexandre
Westco Pumpkin Patch Henry Cottons
Women'sSecret Topshop & Topman Charles Jourdan
Zara UNIQLO Versus (Versace)
Warehouse ARTE
Roger Viver
Miss Sixty
Energie
Fashion brands Billabong
(active lifestyle) Caterpillar
Diesel
High Sierra
JanSport
Lacoste
Le Coq Sportif
Merrell
Nautica
Pony
Quicksilver
Rider
Rockport
Scorpion
Teva
UnionBay
Vans
In-house brand ROAUL Dickson Watch & Jewellery
Giordano Esprit
Timepieces (luxury) Bell & Ross Harry Winston Chopard
DeWitt Daniel Roth Bertolucci
Girad-Perregaux Gerald Genta The Royal Diamond
RADO Hublot
Ulysee Nardin
Carl F. Bucherer, Sinn
Sinn
Glycine Source: Company data
Equity Research – FJ Benjamin Holdings Limited | 21 October 2010
27
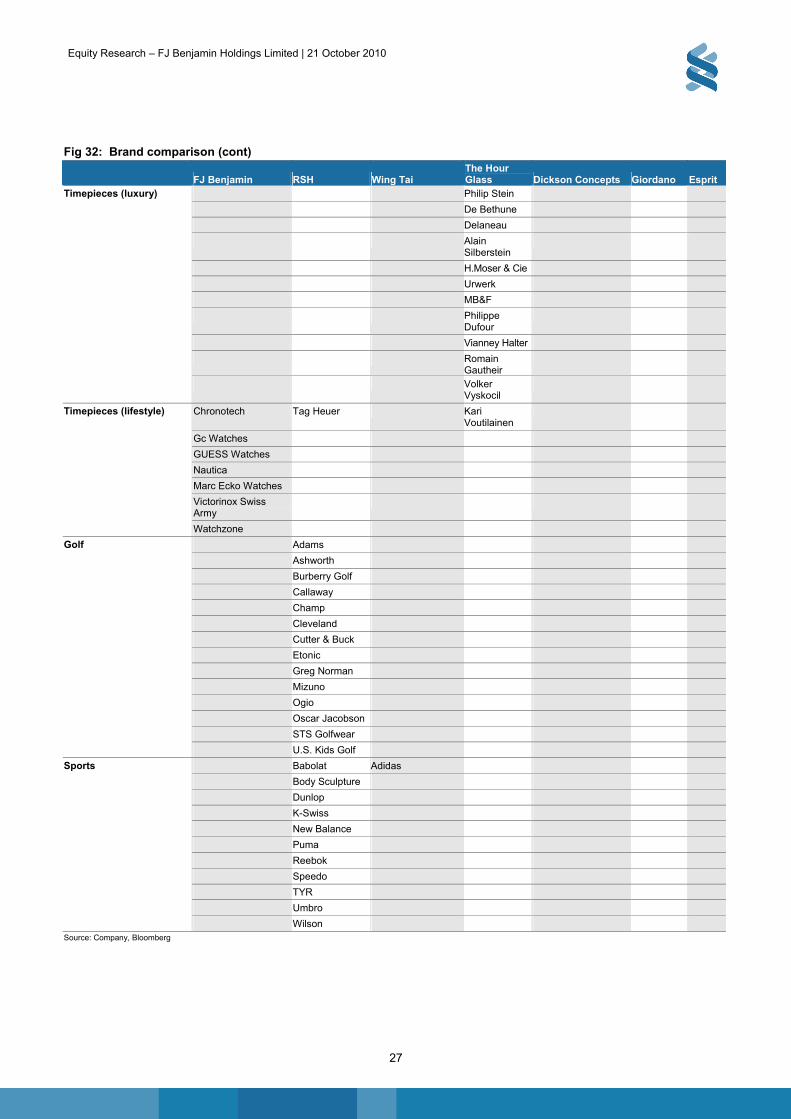
Fig 32: Brand comparison (cont)
FJ Benjamin RSH Wing Tai The Hour Glass Dickson Concepts Giordano Esprit
Timepieces (luxury) Philip Stein
De Bethune
Delaneau
Alain Silberstein
H.Moser & Cie
Urwerk
MB&F
Philippe Dufour
Vianney Halter
Romain Gautheir
Volker Vyskocil
Timepieces (lifestyle) Chronotech Tag Heuer Kari Voutilainen
Gc Watches
GUESS Watches
Nautica
Marc Ecko Watches
Victorinox Swiss Army
Watchzone
Golf Adams
Ashworth
Burberry Golf
Callaway
Champ
Cleveland
Cutter & Buck
Etonic
Greg Norman
Mizuno
Ogio
Oscar Jacobson
STS Golfwear
U.S. Kids Golf
Sports Babolat Adidas
Body Sculpture
Dunlop
K-Swiss
New Balance
Puma
Reebok
Speedo
TYR
Umbro
Wilson Source: Company, Bloomberg
Equity Research – FJ Benjamin Holdings Limited | 21 October 2010
28
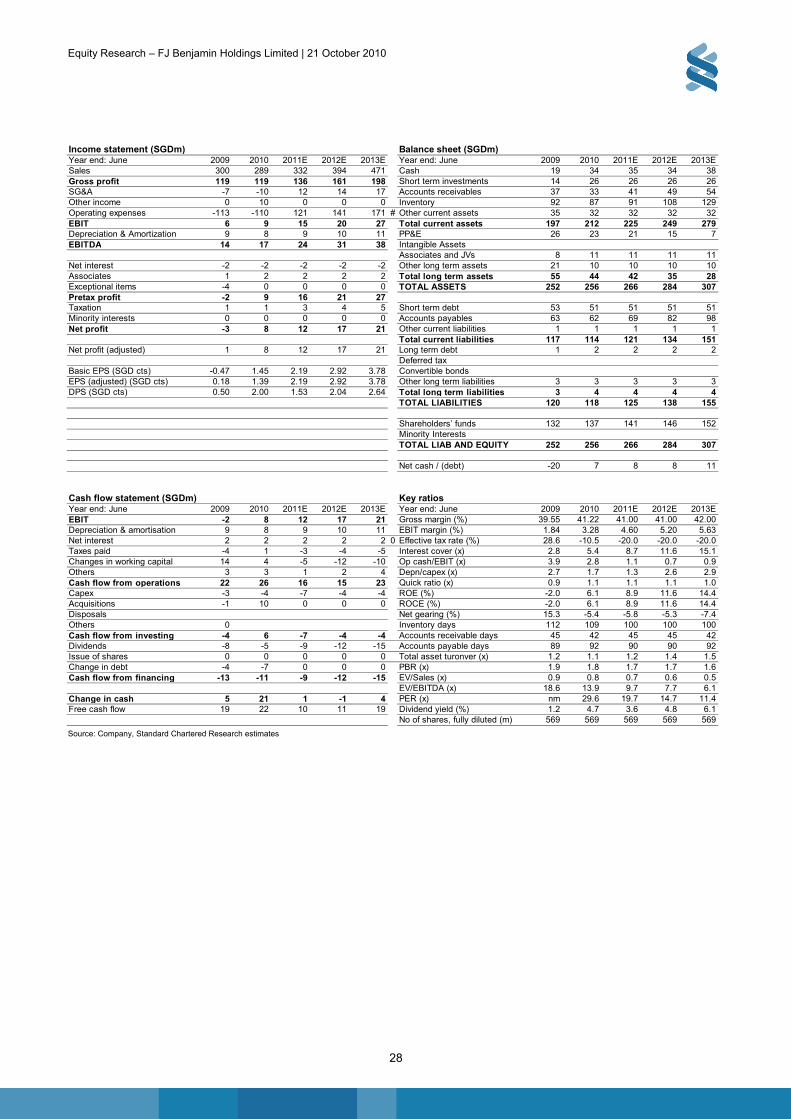
Income statement (SGDm) Balance sheet (SGDm)Year end: June 2009 2010 2011E 2012E 2013E Year end: June 2009 2010 2011E 2012E 2013ESales 300 289 332 394 471 Cash 19 34 35 34 38Gross profit 119 119 136 161 198 Short term investments 14 26 26 26 26SG&A -7 -10 12 14 17 Accounts receivables 37 33 41 49 54Other income 0 10 0 0 0 Inventory 92 87 91 108 129Operating expenses -113 -110 121 141 171 # Other current assets 35 32 32 32 32EBIT 6 9 15 20 27 Total current assets 197 212 225 249 279Depreciation & Amortization 9 8 9 10 11 PP&E 26 23 21 15 7EBITDA 14 17 24 31 38 Intangible Assets
Associates and JVs 8 11 11 11 11Net interest -2 -2 -2 -2 -2 Other long term assets 21 10 10 10 10Associates 1 2 2 2 2 Total long term assets 55 44 42 35 28Exceptional items -4 0 0 0 0 TOTAL ASSETS 252 256 266 284 307Pretax profit -2 9 16 21 27Taxation 1 1 3 4 5 Short term debt 53 51 51 51 51Minority interests 0 0 0 0 0 Accounts payables 63 62 69 82 98Net profit -3 8 12 17 21 Other current liabilities 1 1 1 1 1
Total current liabilities 117 114 121 134 151Net profit (adjusted) 1 8 12 17 21 Long term debt 1 2 2 2 2
Deferred taxBasic EPS (SGD cts) -0.47 1.45 2.19 2.92 3.78 Convertible bondsEPS (adjusted) (SGD cts) 0.18 1.39 2.19 2.92 3.78 Other long term liabilities 3 3 3 3 3DPS (SGD cts) 0.50 2.00 1.53 2.04 2.64 Total long term liabilities 3 4 4 4 4
TOTAL LIABILITIES 120 118 125 138 155
Shareholders’ funds 132 137 141 146 152Minority InterestsTOTAL LIAB AND EQUITY 252 256 266 284 307
Net cash / (debt) -20 7 8 8 11
Cash flow statement (SGDm) Key ratios Year end: June 2009 2010 2011E 2012E 2013E Year end: June 2009 2010 2011E 2012E 2013EEBIT -2 8 12 17 21 Gross margin (%) 39.55 41.22 41.00 41.00 42.00Depreciation & amortisation 9 8 9 10 11 EBIT margin (%) 1.84 3.28 4.60 5.20 5.63Net interest 2 2 2 2 2 0 Effective tax rate (%) 28.6 -10.5 -20.0 -20.0 -20.0Taxes paid -4 1 -3 -4 -5 Interest cover (x) 2.8 5.4 8.7 11.6 15.1Changes in working capital 14 4 -5 -12 -10 Op cash/EBIT (x) 3.9 2.8 1.1 0.7 0.9Others 3 3 1 2 4 Depn/capex (x) 2.7 1.7 1.3 2.6 2.9Cash flow from operations 22 26 16 15 23 Quick ratio (x) 0.9 1.1 1.1 1.1 1.0Capex -3 -4 -7 -4 -4 ROE (%) -2.0 6.1 8.9 11.6 14.4Acquisitions -1 10 0 0 0 ROCE (%) -2.0 6.1 8.9 11.6 14.4Disposals Net gearing (%) 15.3 -5.4 -5.8 -5.3 -7.4Others 0 Inventory days 112 109 100 100 100Cash flow from investing -4 6 -7 -4 -4 Accounts receivable days 45 42 45 45 42Dividends -8 -5 -9 -12 -15 Accounts payable days 89 92 90 90 92Issue of shares 0 0 0 0 0 Total asset turonver (x) 1.2 1.1 1.2 1.4 1.5Change in debt -4 -7 0 0 0 PBR (x) 1.9 1.8 1.7 1.7 1.6Cash flow from financing -13 -11 -9 -12 -15 EV/Sales (x) 0.9 0.8 0.7 0.6 0.5
EV/EBITDA (x) 18.6 13.9 9.7 7.7 6.1Change in cash 5 21 1 -1 4 PER (x) nm 29.6 19.7 14.7 11.4Free cash flow 19 22 10 11 19 Dividend yield (%) 1.2 4.7 3.6 4.8 6.1
No of shares, fully diluted (m) 569 569 569 569 569
Source: Company, Standard Chartered Research estimates

Equity Research – FJ Benjamin Holdings Limited | 21 October 2010
29
Disclosures appendix
Global disclaimer
The information and opinions in this report were prepared by Standard Chartered Bank (Hong Kong) Limited, Standard Chartered Bank Singapore Branch, Standard Chartered - STCI Capital Markets Limited and/or one or more of its affiliates (together with its group of companies,”SCB”) and the research analyst(s) named in this report. SCB makes no representation or warranty of any kind, express, implied or statutory regarding this document or any information contained or referred to in the document. DISCLOSURES INCLUDING THOSE REQUIRED BY THE UNITED STATES The research analysts responsible for the content of this research report certify that
The view expressed and attributed to the research analyst or Analysts in the research report accurately reflect their personalopinion(s) about the subject securities and issuers and/or other subject matter as appropriate; andNo part of his or her compensation and other benefits was, is or will be directly related to the specific recommendations orviews contained in this research report. On a general basis, the efficacy of recommendations is a factor in the performanceappraisals of analysts.Our ratings are under constant review.
Additional information with respect to any securities referred to herein will be available upon request. THIS RESEARCH HAS NOT BEEN PRODUCED IN THE UNITED STATES. Disclosures Appendix Where “disclosure date” appears below, this means the day prior to the report date. All share prices quoted are the closing price for the business day prior to the date of the report, unless otherwise stated. Company Osim International
As at the disclosure date, the following applies:
Osim International - current rating is: OUTPERFORM
0.4
0.6
0.8
1.0
1.2
1.4
1.6
Sep 09 Oct 09 Nov 09 Dec 09 Jan 10 Feb 10 Mar 10 Apr 10 May 10 Jun 10 Jul 10 Aug 10 Sep 10 Oct 10
03/09/10 OP : SGD1.45
20/10/10 OP : SGD1.48
Source: FactSet prices / SCB ratings and price targets Company FJ Benjamin Holdings Limited
As at the disclosure date, the following applies:
FJ Benjamin Holdings Limited - current rating is:
0.25
0.30
0.35
0.40
0.45
0.50
Sep 09 Oct 09 Nov 09 Dec 09 Jan 10 Feb 10 Mar 10 Apr 10 May 10 Jun 10 Jul 10 Aug 10 Sep 10 Oct 10
Source: FactSet prices / SCB ratings and price targets

Equity Research – FJ Benjamin Holdings Limited | 21 October 2010
30
Company Wing Tai Properties
As at the disclosure date, the following applies:
SCB and/or its affiliates have received compensation for the provision of investment banking or financial advisory serviceswithin the past one year
Wing Tai Properties - current rating is: OUTPERFORM
2.0
2.2
2.4
2.6
2.8
3.0
3.2
3.4
Sep 09 Oct 09 Nov 09 Dec 09 Jan 10 Feb 10 Mar 10 Apr 10 May 10 Jun 10 Jul 10 Aug 10 Sep 10 Oct 10
19/05/10 OP : HKD2.97
11/06/10 OP : HKD3.24
Source: FactSet prices / SCB ratings and price targets Company Trinity
As at the disclosure date, the following applies:
SCB has managed or co managed a public offering for this company with the past 12 months, for which it received fees.
Trinity - current rating is: OUTPERFORM
12
34
56
78
9
Oct 09 Nov 09 Dec 09 Jan 10 Feb 10 Mar 10 Apr 10 May 10 Jun 10 Jul 10 Aug 10 Sep 10 Oct 10
26/02/10 OP : HKD5.00
01/04/10 OP : HKD5.40
26/08/10 OP : HKD7.30
Source: FactSet prices / SCB ratings and price targets Company Ports Design
As at the disclosure date, the following applies:
Ports Design - current rating is: OUTPERFORM
161718192021222324252627
Sep 09 Oct 09 Nov 09 Dec 09 Jan 10 Feb 10 Mar 10 Apr 10 May 10 Jun 10 Jul 10 Aug 10 Sep 10 Oct 10
26/02/10 OP : HKD23.10
31/03/10 OP : HKD22.90
27/08/10 OP : HKD23.30
Source: FactSet prices / SCB ratings and price targets

Equity Research – FJ Benjamin Holdings Limited | 21 October 2010
31
Company Esprit Holdings As at the disclosure date, the following applies: SCB and/or its affiliates have received compensation for the provision of investment banking or financial advisory services within the past one year Recommendation Distribution and Investment Banking Relationships
% of covered companies currently assigned
this rating
% of companies assigned this rating with which SCB
has provided investment banking services over the
past 12 months
OUTPERFORM 58.0% 12.0%
IN-LINE 27.8% 7.4%
UNDERPERFORM 14.3% 5.7%
Research Recommendation Terminology Definitions
OUTPERFORM (OP) The total return on the security is expected to outperform the relevant market index by 5% or more over the next 12 months
IN-LINE (IL) The total return on the security is not expected to outperform or underperform the relevant market index by 5% or more over the next 12 months
UNDERPERFORM (UP) The total return on the security is expected to underperform the relevant market index by 5% or more over the next 12 months
SCB uses an investment horizon of 12 months for its price targets.
Equity Research – FJ Benjamin Holdings Limited | 21 October 2010
32
Country-Specific Disclosures If you are receiving this document in any of the countries listed below, please note the following: United Kingdom and European Economic Area: Standard Chartered Bank is authorised and regulated by the Financial Services Authority. This communication is not directed at Retail Clients in the European Economic Area as defined by Directive 2004/39/EC. Nothing in this document constitutes a personal recommendation or investment advice as defined by Directive 2004/39/EC. Australia: The Australian Financial Services Licence for Standard Chartered Bank is Licence No: 246833 with the following Australian Registered Business Number (ARBN: 097571778). Australian investors should note that this document was prepared for wholesale investors only (as defined by Australian Corporations legislation). Hong Kong: This document is being distributed in Hong Kong by, and is attributable to, Standard Chartered Bank (Hong Kong) Limited which is regulated by the Hong Kong Monetary Authority. India: This document is being distributed in India by Standard Chartered - STCI Capital Markets Limited which is a SEBI registered broker and a member of the Bombay Stock Exchange Limited and The National Stock Exchange of India Limited. Singapore: This document is being distributed in Singapore by Standard Chartered Bank Singapore Branch only to accredited investors, expert investors or institutional investors, as defined in the Securities and Futures Act, Chapter 289 of Singapore. Recipients in Singapore should contact Standard Chartered Bank Singapore Branch in relation to any matters arising from, or in connection with, this document. United States: Except for any documents relating to foreign exchange, FX or global FX, Rates or Commodities, distribution of this document in the United States or to US persons is intended to be solely to major institutional investors as defined in Rule 15a-6(a)(2) under the US Securities Act of 1934. All US persons that receive this document by their acceptance thereof represent and agree that they are a major institutional investor and understand the risks involved in executing transactions in securities. Any US recipient of this document wanting additional information or to effect any transaction in any security or financial instrument mentioned herein, must do so by contacting a registered representative of Standard Chartered Securities (North America) Inc., 1 Madison Avenue, New York, N.Y. 10010, US, tel + 1 212 667 0700. WE DO NOT OFFER OR SELL SECURITIES TO U.S. PERSONS UNLESS EITHER (A) THOSE SECURITIES ARE REGISTERED FOR SALE WITH THE U.S. SECURITIES AND EXCHANGE COMMISSION AND WITH ALL APPROPRIATE U.S. STATE AUTHORITIES; OR (B) THE SECURITIES OR THE SPECIFIC TRANSACTION QUALIFY FOR AN EXEMPTION UNDER THE U.S. FEDERAL AND STATE SECURITIES LAWS NOR DO WE OFFER OR SELL SECURITIES TO U.S. PERSONS UNLESS (i) WE, OUR AFFILIATED COMPANY AND THE APPROPRIATE PERSONNEL ARE PROPERLY REGISTERED OR LICENSED TO CONDUCT BUSINESS; OR (ii) WE, OUR AFFILIATED COMPANY AND THE APPROPRIATE PERSONNEL QUALIFY FOR EXEMPTIONS UNDER APPLICABLE U.S. FEDERAL AND STATE LAWS. GENERAL DISCLAIMER The information on this document is provided for information purposes only. It does not constitute any offer, recommendation or solicitation to any person to enter into any transaction or adopt any hedging, trading or investment strategy, nor does it constitute any prediction of likely future movements in rates or prices or any representation that any such future movements will not exceed those shown in any illustration. The stated price of the securities mentioned herein is as of the date indicated and is not any representation that any transaction can be effected at this price. While all reasonable care has been taken in preparing this document, no responsibility or liability is accepted for errors of fact or for any opinion expressed herein. The contents of this document may not be suitable for all investors as it has not been prepared with regard to the specific investment objectives or financial situation of any particular person. Any investments discussed may not be suitable for all investors. Users of this document should seek professional advice regarding the appropriateness of investing in any securities, financial instruments or investment strategies referred to in this document and should understand that statements regarding future prospects may not be realised. Opinions, forecasts, assumptions, estimates, derived valuations and target price(s) contained in this document are as of the date indicated and are subject to change at any time without prior notice. The value and income of any of the securities or financial instruments mentioned in this document can fall as well as rise and an investor may get back less than invested. Future returns are not guaranteed, and a loss of original capital may be incurred. Foreign-currency denominated securities and financial instruments are subject to fluctuation in exchange rates that could have a positive or adverse effect on the value, price or income of such securities and financial instruments. Past performance is not indicative of comparable future results and no representation or warranty is made regarding future performance. While we endeavour to update on a reasonable basis the information and opinions contained herein, there may be regulatory, compliance or other reasons that prevent us from doing so. Accordingly, information may be available to us which is not reflected in this material, and we may have acted upon or used the information prior to or immediately following its publication. SCB is not a legal or tax adviser, and is not purporting to provide you with legal or tax advice. If you have any queries as to the legal or tax implications of any investment you should seek independent legal and/or tax advice. SCB, and/or a connected company, may have a position in any of the securities, instruments or currencies mentioned in this document. SCB has in place policies and procedures and physical information walls between its Research Department and differing public and private business functions to help ensure confidential information, including ‘inside’ information is not publicly disclosed unless in line with its policies and procedures and the rules of its regulators. Data, opinions and other information appearing herein may have been obtained from public sources. SCB makes no representation or warranty as to the accuracy or completeness of such information obtained from public sources. You are advised to make your own independent judgment (with the advice of your professional advisers as necessary) with respect to any matter contained herein and not rely on this document as the basis for making any trading, hedging or investment decision. SCB and/or any member of the SCB group of companies or its respective officers, directors, employee benefit programmes or employees, including persons involved in the preparation or issuance of this document may at any time, to the extent permitted by applicable law and/or regulation, be long or short any securities or financial instruments referred to in this document and on the website or have a material interest in any such securities or related investment, or may be the only market maker in relation to such investments, or provide, or have provided advice, investment banking or other services, to issuers of such investments. Within the last three years, SCB may also have acted as manager or co-manager for a public offering of securities of issuers referred to herein. SCB may have received or may expect to receive remuneration for investment banking services from companies mentioned herein. SCB accepts no liability and will not be liable for any loss or damage arising directly or indirectly (including special, incidental, consequential, punitive or exemplary damages) from your use of this document, howsoever arising, and including any loss, damage or expense arising from, but not limited to, any defect, error, imperfection, fault, mistake or inaccuracy with this document, its contents or associated services, or due to any unavailability of the document or any part thereof or any contents or associated services. This material is for the use of intended recipients only and the contents may not be reproduced, redistributed, or copied in whole or in part for any purpose without SCB’s prior express consent. In any jurisdiction in which distribution to private/retail customers would require registration or licensing of the distributor which the distributor does not currently have, this document is intended solely for distribution to professional and institutional investors. Copyright: Standard Chartered Bank 2010. Copyright in all materials, text, articles and information contained herein is the property of, and may only be reproduced with permission of an authorised signatory of, Standard Chartered Bank. Copyright in materials created by third parties and the rights under copyright of such parties are hereby acknowledged. Copyright in all other materials not belonging to third parties and copyright in these materials as a compilation vests and shall remain at all times copyright of Standard Chartered Bank and should not be reproduced or used except for business purposes on behalf of Standard Chartered Bank or save with the express prior written consent of an authorised signatory of Standard Chartered Bank. All rights reserved. © Standard Chartered Bank 2010.