International Fixed Income Topic IB: Fixed Income Basics - Risk.

BNP ParibasBEST IN CLASS RETURNS IN EUROPE AND STRONG CAPITAL GENERATION
Fixed Income PresentationNovember 2016

Fixed Income Presentation – November 2016 2
Disclaimer
The figures included in this presentation are unaudited. On 29 March 2016, BNP Paribas issued a restatement of its quarterly resultsfor 2015 reflecting, in particular (i) an increase in the capital allocated to each business line to 11% of risk-weighted assets, comparedto 9% previously, (ii) the charge of subordination costs of Additional Tier 1 and Tier 2 debt issued by the Group to the divisions andbusiness lines, a review of the way it charges and remunerates liquidity between the Corporate Centre and the business lines and theadaptation of the allocation practices for revenues and operating expenses of Treasury activities within CIB, (iii) the allocation to thedivisions and business lines of the contribution to the Single Resolution Fund, the reduction of the French systemic tax and newcontributions to the deposit guarantee funds of BNL and Luxembourg Retail Banking which had been temporarily booked in theoperating expenses of the Corporate Centre and (iv) some limited internal transfers of business activities and results. The 2015quarterly result series have been restated reflecting these effects as if they had occurred on 1st January 2015. This presentation isbased on the restated 2015 quarterly series.
This presentation includes forward-looking statements based on current beliefs and expectations about future events. Forward-lookingstatements include financial projections and estimates and their underlying assumptions, statements regarding plans, objectives andexpectations with respect to future events, operations, products and services, and statements regarding future performance andsynergies. Forward-looking statements are not guarantees of future performance and are subject to inherent risks, uncertainties andassumptions about BNP Paribas and its subsidiaries and investments, developments of BNP Paribas and its subsidiaries, bankingindustry trends, future capital expenditures and acquisitions, changes in economic conditions globally or in BNP Paribas’ principal localmarkets, the competitive market and regulatory factors. Those events are uncertain; their outcome may differ from current expectationswhich may in turn significantly affect expected results. Actual results may differ materially from those projected or implied in theseforward looking statements. Any forward-looking statement contained in this presentation speaks as of the date of this presentation.BNP Paribas undertakes no obligation to publicly revise or update any forward-looking statements in light of new information or futureevents. It should be recalled in this regard that the Supervisory Review and Evaluation Process is carried out each year by theEuropean Central Bank, which can modify each year its capital adequacy ratio requirements for BNP Paribas.
The information contained in this presentation as it relates to parties other than BNP Paribas or derived from external sources has notbeen independently verified and no representation or warranty expressed or implied is made as to, and no reliance should be placedon the fairness, accuracy, completeness or correctness of, the information or opinions contained herein. None of BNP Paribas or itsrepresentatives shall have any liability whatsoever in negligence or otherwise for any loss however arising from any use of thispresentation or its contents or otherwise arising in connection with this presentation or any other information or material discussed.
The sum of values contained in the tables and analyses may differ slightly from the total reported due to rounding.

Fixed Income Presentation – November 2016 3
Focus on Medium and Long Term Funding
Strong Solvency and Capital Generation Capacity
Appendix
3Q16 Results Highlights

Fixed Income Presentation – November 2016 4
The Strength of a Diversified and Integrated Business Model…
A business model diversified by country and business No country, business or industry concentration Presence primarily in developed countries (>85% of
revenues) No business unit >16% of allocated equity Business units and regions evolving according to different
cycles
An integrated business model fuelled by cross-selling
Strong resilience in changing environments
* Total gross commitments, on and off balance sheet, unweighted
Gross commitments* by region:€1,399bn as at 31.12.2015
25%
16% 14% 14%10% 8% 7% 6%
France NorthAmerica
Belgium&
Luxembourg
OtherEuropeancountries
Italy AsiaPacific
Restof the world
UnitedKingdom
“World’s best bank 2016”“Fine-tuned BNP Paribas excels at the business of banking ““A large bank actually delivering on its promises to stakeholders……all while proving the benefits of a diversified business model”
Corporate Banking: 16%
Other DM: 5%
Global Markets:14%
FRB: 12%
BNL bc: 9%
Personal Finance: 6% BancWest: 9%
BRB: 6%
Europe-Mediterranean: 8%Insurance: 11%
WAM: 3%
Securities Services: 1%
Allocated equity by business as at 31.12.2015

Fixed Income Presentation – November 2016 5
…Resulting in Strong Resilience in Stress Tests
2016 European Stress Tests Impact of Adverse scenario on CET1 ratio - peer group*
-199 -208 -236-311 -320 -330 -330 -340 -340
-405
SAN BBVA BNPP HSBC CA Group UCI DB Average 51banks
SG Barclays
* Based on the fully loaded ratio as at 31.12.2015
In bp
Adverse scenario impact for BNPP was ~100bp lower than the average of the 51 European banks tested

Fixed Income Presentation – November 2016 6
Fully loaded Basel 3 CET1 ratio*: 11.4% as at 30.09.16 (+30 bp vs. 30.06.16) of which 3Q16 results after taking into account a 45% dividend
pay-out ratio: ~+20 bp Effect of the initial public offering of 17.4% of
First Hawaiian Bank: ~+5 bp Risk-weighted assets stable excluding the foreign exchange effect Reminder: overall negligible foreign exchange effect on the ratio
Fully loaded Basel 3 leverage**: 4.0% as at 30.09.16 Calculated on total Tier 1 Capital
Liquidity Coverage Ratio: 127% as at 30.09.16
Immediately available liquidity reserve: €326bn***(€291bn as at 30.06.16) Equivalent to over one year of room to manœuvre in terms of
wholesale funding
Financial Structure
Solid capital generationContinued increase of the Basel 3 CET1 ratio
10.7% 10.9% 11.0% 11.1% 11.4%
30.09.15 31.12.15 31.03.16 30.06.16 30.09.16
Fully loaded Basel 3 CET1 ratio*
3.8% 4.0% 4.0% 4.0% 4.0%
30.09.15 31.12.15 31.03.16 30.06.16 30.09.16
Fully loaded Basel 3 leverageratio**
* CRD4 “2019 fully loaded”; ** CRD4 “2019 fully loaded”, calculated according to the delegated act of the EC dated 10.10.2014 and calculated on total Tier 1 Capital and using value date for securities transactions; *** Liquid market assets or eligible to central banks(counterbalancing capacity) taking into account prudential standards, notably US standards, minus intra-day payment system needs

Fixed Income Presentation – November 2016 7
4.5%
11.6% 12.0%
4.5%
1.25% 1.25%1.25%
2.5%1.00%
2.0%
2016 Supervisory Review and Evaluation Process (SREP) CET1 Ratio
New CET1 ratio requirement following the SREP performed by the ECB*: 8.0% in 2017 (phased-in) Of which a G-SIB buffer of 1.0% and
a Conservation buffer of 1.25% Of which a Pillar 2 requirement (P2R) of 1.25% Excluding a Pillar 2 guidance (P2G), non public Phased-in CET1 ratio of 11.6% as at 30.09.16, well above the
regulatory requirement
Anticipated level of a fully loaded Basel 3 CET1 ratio requirement of 10.25% in 2019 (excluding P2G) Given the gradual phasing-in of the Conservation buffer to 2.5%
and the assumption of a 2.0% G-SIB buffer** Will constitute the CET1 requirement taken into account*** for
the restrictions applicable to distributions (Maximum Distributable Amount – MDA)
Target maintained of a fully loaded CET1 ratio of 12.0%
CET1 Ratio
Conservation buffer
BNPP’s 2016-2019 trajectory
Requirementsas at
01.01.2017
12.0%
Minimum requirement
of CET1 Ratio*(phased-in)
11.6%
BNPPAs at 30.09.16
(phased-in)
8.0%
BNPP01.01.2019
(fully loadedtarget)
Requirementsas at
01.01.2019
10.25%
Minimum requirement
of CET1 Ratio**(fully loaded)
* Subject to the confirmation of the pre-notification received from ECB; ** Assuming P2R remains constant between 2017 and 2019; *** As of 2019 (8% in 2017)
Pillar 1
GSIB buffer
CET1 ratio already well above 2019 requirement
P2RCET1 total

Fixed Income Presentation – November 2016 8
New Total Capital ratio requirement following the SREPperformed by the ECB*: 11.5% in 2017 (phased-in) Of which a CET1 ratio requirement of 8% And a Tier 1 capital requirement of 9.5% Phased-in Total Capital ratio of 14.4% as at 30.09.16,
well above the regulatory requirement
Anticipated level of a fully loaded Total Capital ratio requirement of 13.75% in 2019 Given the gradual phasing-in of the Conservation buffer to 2.5%
and the assumption of a 2.0% G-SIB buffer** Will constitute the Total Capital requirement taken into account***
for the restrictions applicable to distributions (MDA)
Target maintained of a Total capital ratio above 15% Tier 1 and Total Capital ratios requirements are on
a cumulative basis Tier 1 and Total Capital ratios requirements now
include the P2R but do not include the P2G
Target of ~1.5% of AT1 and ~2.0% of Tier 2 Overall Capital instruments target > 3%
Total Capital ratio already above 2019 requirement
8.0%
11.6% 12.0%10.25%
1.5%
1.1%~1.5%
1.5%2.0%
1.7%~2.0%
2.0%
2016 Supervisory Review and Evaluation Process (SREP)Total Capital Ratio
Total Capital Ratio
Tier 2Tier 1CET 1
BNPP’s 2016-2019 trajectory
Requirementsas at
01.01.2017
>15.0%
Minimum requirement
of Total Capital*(phased-in)
14.4%
BNPP30.09.16
(phased-in)
11.5%
BNPP01.01.2019
(fullyloaded)
Requirementsas at
01.01.2019
13.75%
Minimum requirement
of Total Capital**(fully loaded)
* Subject to the confirmation of the pre-notification received from ECB; ** Assuming P2R remains constant between 2017 and 2019; *** As of 2019 (11.50% in 2017)

Fixed Income Presentation – November 2016 9
4.5%6.0%
8.0%
4.375%
0.625%
0.625%
0.625%
0.5%
0.5%
0.5%
Buffers as at 30.09.2016 to MDA** restrictions
Applicable only until year end 2016 Pillar 2 limited to the CET1 ratio
Pillar 2 not applicable to Tier 1 and Total Capital ratio requirements*
2016 CET1 requirement: 10.0%
2016 Tier 1 requirement: 7.125%
2016 Total Capital requirement: 9.125%
Buffer as at 30.09.16 to Maximum Distributable Amount (MDA**) restrictions: the lowest level amongst the 3 calculated amounts CET1: 1.6% or €9.9bn*** Tier1: 5.6% or €35.3bn*** Total Capital: 5.2% or €33.1bn***
Buffers to Maximum Distributable Amount Restrictionsas at 30.09.2016 based on 2015 SREP
CET1
2016 Capital requirement
TIER 1
10.0%
TOTAL CAPITAL
7.125%
9.125%
G-SIB bufferConservation buffer
Pillar 2Pillar 1
* Confirmed by the ECB as part of the 2015 SREP; ** As defined in Art. 141 of CRD4; *** Calculated based on €630bn of risk-weighted assets (phased-in)
11.6% 12.7% 14.4%BNP Paribas phased-in ratios as at 30.09.2016
1.6%€9.9bn
5.6%€35.3bn
5.2%€33.1bn
MDA buffer as at 30.09.16 of €9.9bn based on 2015 SREP(applicable only until year end 2016)

Fixed Income Presentation – November 2016 10
From 2016 SREP*, Pillar 2 composed of: Pillar 2 Requirement (P2R) Pillar 2 Guidance (P2G) which is not MDA
(Maximum Distributable Amount) relevant
P2R applicable to CET1, Tier 1 and Total Capital ratios
2017 CET1 requirement: 8.0% 2017 Tier 1 requirement: 9.5% 2017 Total Capital requirement: 11.5%
Pro forma buffers as at 30.09.16 to MDA** restrictions based on 2016 SREP*: the lowest level amongst the 3 calculated amounts CET1: 3.6% or €22.5bn*** Tier1: 3.2% or €20.3bn*** Total Capital: 2.9% or €18.1bn***
4.5%6.0%
8.0%1.25%
1.25%
1.25%
1.25%
1.25%
1.25%
1.0%
1.0%
1.0%
8.0%
Pro Forma Buffers to MDA Restrictions as at 30.09.2016 based on 2016 SREP*
CET1
Capital requirement as at 01.01.2017 based on 2016 SREP*
TIER 1 TOTAL CAPITAL
9.5%
11.5%G-SIB bufferConservation buffer
P2RPillar 1
* 2016 SREP subject to the confirmation of the pre-notification received from ECB; ** As defined in Art. 141 of CRD4, subject to revision; *** Calculated based on €630bn of risk-weighted assets (phased-in)
11.6% 12.7% 14.4%3.6%
€22.5bn3.2%
€20.3bn2.9%
€18.1bnPro forma buffers as at 30.09.2016 to MDA** restrictions
Pro forma MDA buffer as at 30.09.16 of €18.1bn*
BNP Paribas phased-in ratios as at 30.09.2016

Fixed Income Presentation – November 2016 11
Focus on Medium and Long Term Funding
Strong Solvency and Capital Generation Capacity
Appendix
3Q16 Results Highlights

Fixed Income Presentation – November 2016 12
Wholesale Medium/Long-Term Funding
* As at 17 October 2016; ** Including the Tier 2 prefunding of €750m issued in November 2015; *** Debt qualified prudentially as Tier 1 booked as subordinated debt or as equity
2016 MLT funding programme of €25bn
Additional Tier 1: €1.3bn issued* Reminder: success of the AT1 issuance in USD on 23 March,
325 investors across Europe, Americas and Asia,$1.5bn, perpetual Non Call 5, coupon of 7.625%
Tier 2: €4.5bn issued* Mid-swap +198 bp on average, average maturity of ~10 years**
Senior debt: €16.0bn issued* Average maturity of 6.1 years, mid-swap +54 bp on average Of which €6.0bn of senior unsecured debt eligible to the 2.5% MREL as at 01.01.2019 Of which €500m issued in Covered Bond at 7 years, mid-swap -10 bp
by BNP Paribas Fortis in October 2016
Issuance programme proceeding welldespite volatile markets in the first half of the year
Wholesale MLT funding structure breakdown: €136bn as at 30.09.16(excluding TLTRO)
Tier One***: 8Other subordinated
debt: 18
Senior secured: 24
Senior unsecured: 86
€bn

Fixed Income Presentation – November 2016 13
Medium/Long Term Funding Outstanding
Overall MLT funding stable over the period
70 7285 94 97 97 94 92 85 85 86
50 4340 31 30 29 29 25
25 24 24
1814
11 13 14 14 1516
15 17 18
1511
8 8 8 8 99
10 9 8
Dec-11 Dec-12 Dec-13 Dec-14 Mar-15 Jun-15 Sep 15 Dec-15 Mar-16 Jun-16 Sep-16
Unsecured Senior Debt Secured Senior Debt Subordinated Debt Tier One Hybrid
136
Wholesale MLT funding outstanding* (€bn)
139 145 145152
141151 148 147
136
* Source: ALM funding
136

Fixed Income Presentation – November 2016 14
Focus on Capital Instruments
Target of ~1.5% of AT1 and ~2.0% of Tier 2 by 01.01.2019* Overall Capital instruments target: > 3% AT1 level as at 30.09.16: 1.1% Tier 2 level as at 30.09.16: 1.7%
Additional Tier 1: €1.3bn issued as at 17.10.2016 USD1.5bn transaction in March, perpetual NC5, 7.625% coupon Given the current stock, €6bn of instruments will still be outstanding as at 01.01.2019, of
which €3bn grandfathered
Tier 2: €4.5bn*** issued under the 2016 programme as at 17.10.2016 Given the current stock, €12bn of instruments will still be outstanding as at 01.01.2019
* Depending on market conditions; ** Assuming callable institutional instruments are called at the first call date, taking into account prudential amortisation of instruments, and excluding, in particular, prudential deductions not related to instruments; *** Including the Tier 2 prefunding of €750m issued in November 2015
Evolution of current Tier 1 & Tier 2 instruments outstanding (grandfathered and eligible)**
Capital instruments issuance in line with targets
in €bn 30.09.2016 01.01.2017 01.01.2018 01.01.2019AT1 8 8 7 6
T2 13 13 12 12

Fixed Income Presentation – November 2016 15
Focus on Medium and Long Term Funding
Strong Solvency and Capital Generation Capacity
Appendix
3Q16 Results Highlights

Fixed Income Presentation – November 2016 16
3Q16 Key Messages
Good revenue growth of the operating divisions Revenues of the operating divisions:+4.8% vs. 3Q15
Continued decrease in the cost of risk -13.4% vs. 3Q15 (43 bp*)
Good results and solid capital generation
Continued increase in the CET1 ratio*** 11.4% (+30 bp vs. 30.06.16)
Rise in net income Group share Net income Group share: €1,886m (+15.0% vs. 3Q15 excluding exceptional items**)
* Cost of risk/Customer loans at the beginning of the period (in annualised bp); ** Exceptional items after tax Group share: -€306m in 3Q16 and -€80m in 3Q15; *** As at 30 September 2016, CRD4 (“fully loaded” ratio)
Strong rise of the gross operating income of the operating divisions
GOI of the operating divisions:+8.8% vs. 3Q15

Fixed Income Presentation – November 2016 17
Revenues €10,589m €10,345m +2.4% +4.8%
Operating expenses -€7,217m -€6,957m +3.7% +2.7%
Gross Operating income €3,372m €3,388m -0.5% +8.8%
Cost of risk -€764m -€882m -13.4% -11.3%
Operating income €2,608m €2,506m +4.1% +15.5%
Non operating items €172m €163m +5.5% +8.7%
Pre-tax income €2,780m €2,669m +4.2% +15.2%
Net income attributable to equity holders €1,886m €1,826m +3.3%
Net income attributable to equity holdersexcluding exceptional items* €2,192m €1,906m +15.0%
Consolidated Group - 3Q16
3Q15 3Q16 vs. 3Q15
3Q16 vs. 3Q15
Operating Divisions
Good overall performance
3Q16
* Exceptional items after tax Group share: -€306m in 3Q16 and -€80m in 3Q15

Fixed Income Presentation – November 2016 18
Revenues of the Operating Divisions - 3Q163Q16
€m
Domestic Markets*
International Financial Services CIB
3,920 3,923 3,799 3,946 2,567 2,905
+13.2%+0.1% +3.9%
3Q15
Good growth of the operating divisions in the low interest rate environment: effect of the integrated and diversified business model
3Q16 vs. 3Q15
Stability of the revenues of Domestic Markets despite a low interest rate environment Rise in the revenues of IFS Strong growth in the revenues of CIB
+4.8%
Operating Divisions
* Including 100% of Private Banking in France (excluding PEL/CEL effects), Italy, Belgium and Luxembourg

Fixed Income Presentation – November 2016 19
Operating Expenses of the Operating Divisions - 3Q16
* Including 100% of Private Banking in France (excluding PEL/CEL effects), Italy, Belgium and Luxembourg
Increase due to business growth and rise in regulatory costs
€m2,526 2,567 2,242 2,319 1,955 2,022
+3.5%+1.6% +3.4%
Impact of the new regulations and the strengthening of compliance Effects of business growth in some activities Effects of the Simple & Efficient savings plan offsetting the natural costs’ drift (inflation, etc.)
3Q163Q153Q16 vs. 3Q15
Domestic Markets*
International Financial Services CIB
+2.7%
Operating Divisions

Fixed Income Presentation – November 2016 20
58 59 57 54 43 45 43
2012 2013 2014 2015 1Q16 2Q16 3Q16
Cost of risk/Customer loans at the beginning of the period (in annualised bp)
Group Cost of Risk - 3Q16
Significant decrease in the cost of risk this quarter Good control of risk at loan origination and effect of the low interest rate
environment Positive impact in particular in Personal Finance Continued decrease of the cost of risk in Italy
Decline in the cost of risk
Group Cost of Risk

Fixed Income Presentation – November 2016 21
Revenues €32,755m €32,489m +0.8% -0.6%
Operating expenses €21,934m €21,848m +0.4% +0.9%
Gross Operating income €10,821m €10,641m +1.7% -3.5%
Cost of risk €2,312m €2,829m -18.3% -16.9%
Operating income €8,509m €7,812m +8.9% +1.1%
Non operating items €434m €1,094m -60.3% -22.3%
Pre-tax income €8,943m €8,906m +0.4% -0.4%
Net income attributable to equity holders €6,260m €6,029m +3.8%
Net income attributable to equity holdersexcluding exceptional items* €5,989m €5,751m +4.1%
ROE (ROTE) excluding exceptional items**: 9.8% (11.7%)
Consolidated Group - 9M16
9M15 9M16 vs. 9M15
9M16 vs. 9M15
Operating Divisions
* Exceptional items after tax Group share: +€272m in 9M16 and +€278m in 9M15; ** ROE: return on equity; ROTE: return on tangible equity; contribution to the Single Resolution Fund and systemic taxes non annualised
9M16

Fixed Income Presentation – November 2016 22
9M16 - Strong Profitability
6,260
4,606
3,484 3,249 2,797
2,335
488
6,026
2,348 1,909
-83 BNPP SAN SG CASA BBVA Intesa DB HSBC UBS BARC CS
9M16 Net Income*
Strong profit generation capacity & best in class ROE and ROTE
Non Eurozone banksEurozone banks
*Attributable to equity holders, as disclosed by banks; **Average quarterly exchange rates; *** Excluding one-off items (positive in 9M16: +€272m after tax), contribution to the Single Resolution Fund and systemic taxes not annualised
€m**
ROE excluding exceptional items***: 9.8% ROTE excluding exceptional items***: 11.7%

Fixed Income Presentation – November 2016 23
Several levers contributing to Return on Equity improvement… Simple & Efficient: ramping up of recurrent
cost savings Progressive loan volumes pick up in the
context of a better European economy Success of the regional plans BNL balance sheet de-risking
… despite headwinds Low interest rates environment New taxes and regulations Higher capital requirements
2016 ROE target of the plan confirmed(reminder: 10% ROE calculated on 10% CET1 ratio)
Delivering on 2016 ROE Target
Steady increase of the ROE and ROTE over 2014-2016 together with higher CET1 ratio
ROE / ROTE (excluding exceptionals)
ROE* based on 10% CET1 ratio2016 Target
≥ 10%
* Excluding exceptionals. For 9M16, with contribution to the Single Resolution Fund and systemic taxes not annualised
10.7%9.6%9.2%7.8%
7.7%
9.0% 9.2%9.8%
9.3%
10.8% 11.1%11.7%
2013 2014 2015 9M16
Return on Equity*
Return on Tangible Equity*
11.4%
10.3%
CET1 B3(fully loaded)

Fixed Income Presentation – November 2016 24
Appendix
Fixed Income Presentation – November 2016 25
New mobile workstation
tablet-based
Wi-Fi for customers
Video-conference
support
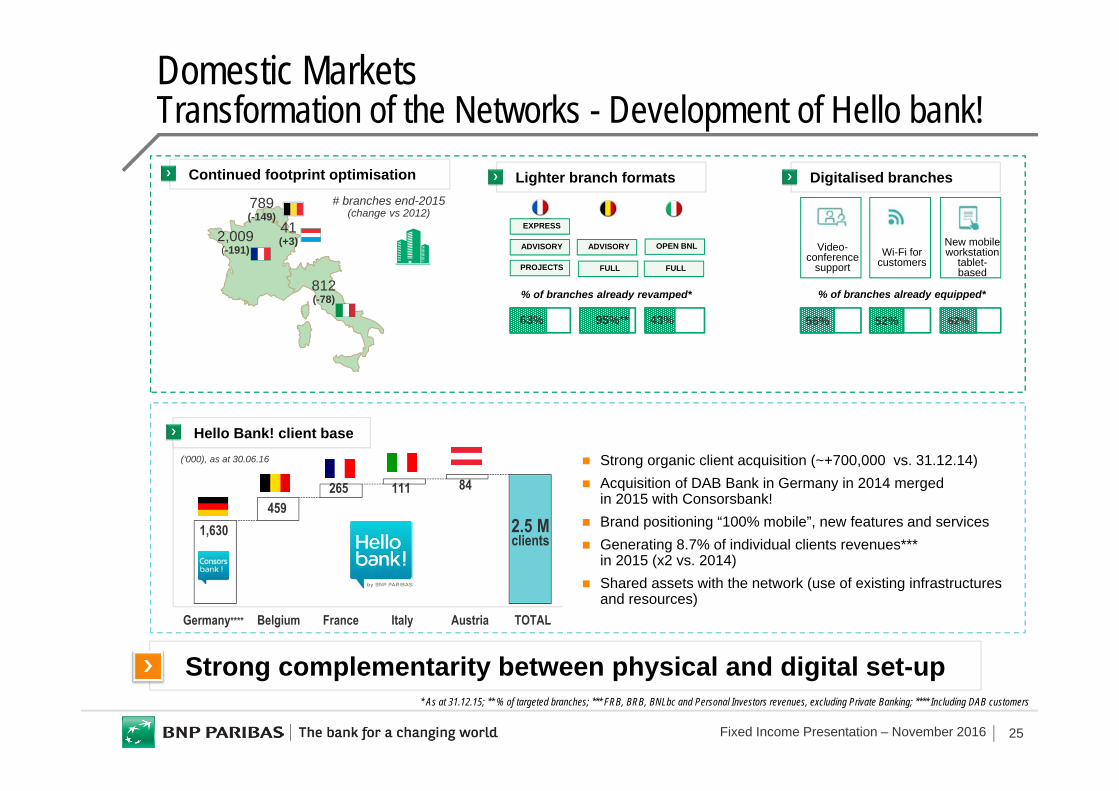
Domestic MarketsTransformation of the Networks - Development of Hello bank!
Strong complementarity between physical and digital set-up
2,009(-191)
812(-78)
789(-149)
# branches end-2015 (change vs 2012)
* As at 31.12.15; ** % of targeted branches; *** FRB, BRB, BNLbc and Personal Investors revenues, excluding Private Banking; **** Including DAB customers
41(+3)
% of branches already revamped*
EXPRESS
ADVISORY
PROJECTS
ADVISORY
FULL
OPEN BNL
FULL
63% 95%** 43%
Continued footprint optimisation Lighter branch formats
56% 52% 62%
Digitalised branches
% of branches already equipped*
Hello Bank! client base
TOTALGermany**** Belgium France Italy Austria
Strong organic client acquisition (~+700,000 vs. 31.12.14) Acquisition of DAB Bank in Germany in 2014 merged
in 2015 with Consorsbank! Brand positioning “100% mobile”, new features and services Generating 8.7% of individual clients revenues***
in 2015 (x2 vs. 2014) Shared assets with the network (use of existing infrastructures
and resources)
(‘000), as at 30.06.16
1,630459
265 111 84
2.5 M clients

Fixed Income Presentation – November 2016 26
Domestic Markets - Medium-term Ambitions More Digitalisation, More Customisation
Effortless & value-added client experience, tailored to client needs end-to-end
Efficiency improvement: process optimisation Further development of cross-selling within the Group
Optimize commercial proactivity and reactivity
Improve pricing and risk scoring management
Digitalisation of the whole product offering subscriptions Boost digital communication and marketing Specific client acquisition offers with ambitious targets
New aggregation service offers (e.g. Arval Active Link, Wa!)
Innovation and FinTechs partnerships
Differentiated models with choice offered to customers More digital and adapted interactions Common platforms for product offering, remote expertise…
Already launched
50%
20202015
12%
Targeted digital sales
I NEED CASH NOWI WANT TO BUY
MY HOME /
I WANT TO BUY MY TV
I WANT TO BECOME
A CORPORATE
CUSTOMER
AssistedSelf Face to Face Offsite
Face to Face Offsite
Face to Face
Remote
Face to Face
Remote
UsageUsage
Data managementData management
Data analysisData analysis
Create digitalised service models
Reinvent customer journeys
Enhance customer knowledge
Boost digital acquisition &
sales
Develop comprehensive service offers
Loyaltyprogrammes
Bank cards
Discount coupons
Discount coupons
Bank cards Gift cards…
An app combiningpayment, loyaltyprogrammes and discount coupons

Fixed Income Presentation – November 2016 27
Corporate and Institutional Banking 2016-2019 Transformation Plan
Specific strategic growth initiatives
Further develop strategic clients Invest in processing businesses:
i.e. Securities Services and Transaction Banking
Specific investmentsin Americas and APAC
+€21bn RWAs
+€~0.5bn in pre-tax income3
Grow
1. Gross savings based on 2015 total CIB costs base including €50m savings linked to Focus initiatives; 2. Incl. ~€90m of residual S&E savings; 3. Before effects of the 29 March 2016 restatement; 4. Booked in Corporate Centre
Free-up capital and balance sheet to fuel targeted growth
Reduce unproductive RWAs through portfolios’ optimisation
Selective rightsizing of businesses, countries and client portfolios
Reinvest to capture market growth and increase market share
RWA gross reduction: -€20bnRWA reinvestment: +€10bn
+€~0.2bn in pre-tax income3
Focus
Optimize CIB operating model
Industrialise the set up Improve operating efficiency Deliver enough savings
to support growth, while structurally reducing C/I ratio
No RWA impact12% total cost savings1,2
+€0.95bn in pre-tax income3
ImproveThree Levers Across All Regions & Business Lines
Contribution to RONE improvement coming essentially from Improve and Focus
Reminder: €800m one-off costs to achieve transformation4

Fixed Income Presentation – November 2016 28
Corporate and Institutional Banking Implementation of the Transformation Plan
Improve cost efficiency: >€1bn savings vs. 2015 Implementation of the plan in all regions in
accordance with local regulations Industrialisation of platforms: 55 projects
launched to align IT systems in Global Markets
Focus: improve capital productivity Sale or securitisation of ~€6bn of RWA
as at 30 June 2016 (target €20bn by 2019) Repositioning of cash equity business in Asia
Grow less capital-intensive businesses Cash management: on-boarding of 215 business groups* in the context of the RBS referral
agreement Shift from voice to electronic: good development of Centric, the Transaction Banking & Global
Markets’ online and mobile portal, >9,000 clients*, 22 applications and 35 countries Securities Services: launch of a platform for unlisted & private stocks using blockchain technology
by end 2016
Evolution of CIB cost base
2019Target
Regulatory costs and inflation
Improve2015
In €bn, excl. variable compensation
GrowFocus
* As at 15 October 2016
0.5
0.5
-0.95
-0.05

Fixed Income Presentation – November 2016 29
Bank BGZPoland
ROE Accretive Bolt-on Acquisitions in 2014 and 2015
• Creation of the 7th largest bank in Poland with ~4% market share
• Broadening Group’s digital banking offer
Levers for additional profit generation going forward
Bolting onto existing
businesses
BNPP Polska
50% of LaSerEurope - France
• Merger completed on 1.09.2015• Targeting 1% market share growth
per year in France in 2016-2018Cetelem
DAB BankGermany
• ~1.6 million clients• #1 online broker*** and Top 5 digital
bank in Germany
Consorsbank!
GE Fleet ServicesEurope
• +164,000 vehicles• Arval now #1 in Europe with
strengthened positions in all countries, ~950,000 vehicles
Arval
Additional synergiesexpected by 2017*
* Excluding restructuring costs ; ** Cumulated ; *** In terms of retail trades and securities accounts
€m
2014
2015
Year of acquisition
Fixed Income Presentation – November 2016 30
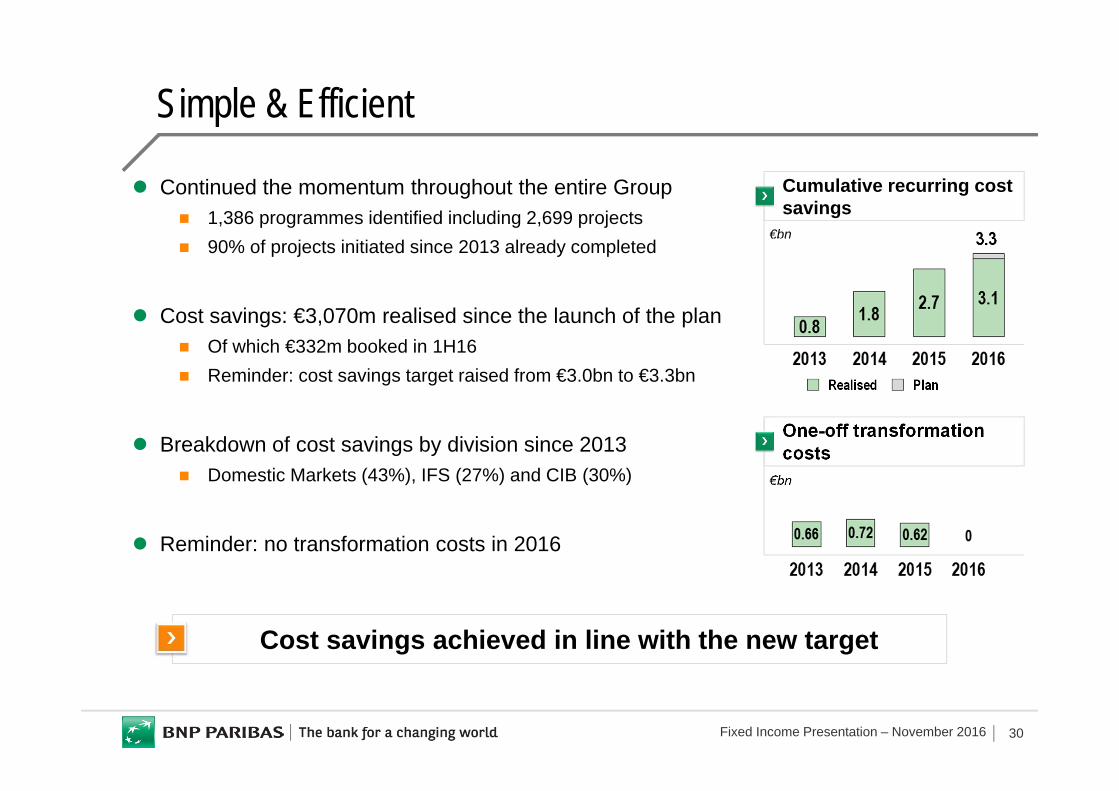
Simple & Efficient
Continued the momentum throughout the entire Group 1,386 programmes identified including 2,699 projects 90% of projects initiated since 2013 already completed
Cost savings: €3,070m realised since the launch of the plan Of which €332m booked in 1H16 Reminder: cost savings target raised from €3.0bn to €3.3bn
Breakdown of cost savings by division since 2013 Domestic Markets (43%), IFS (27%) and CIB (30%)
Reminder: no transformation costs in 2016
Cost savings achieved in line with the new target
Cumulative recurring costsavings
€bn
One-off transformation costs
€bn
PlanRealised
3.3
Fixed Income Presentation – November 2016 31
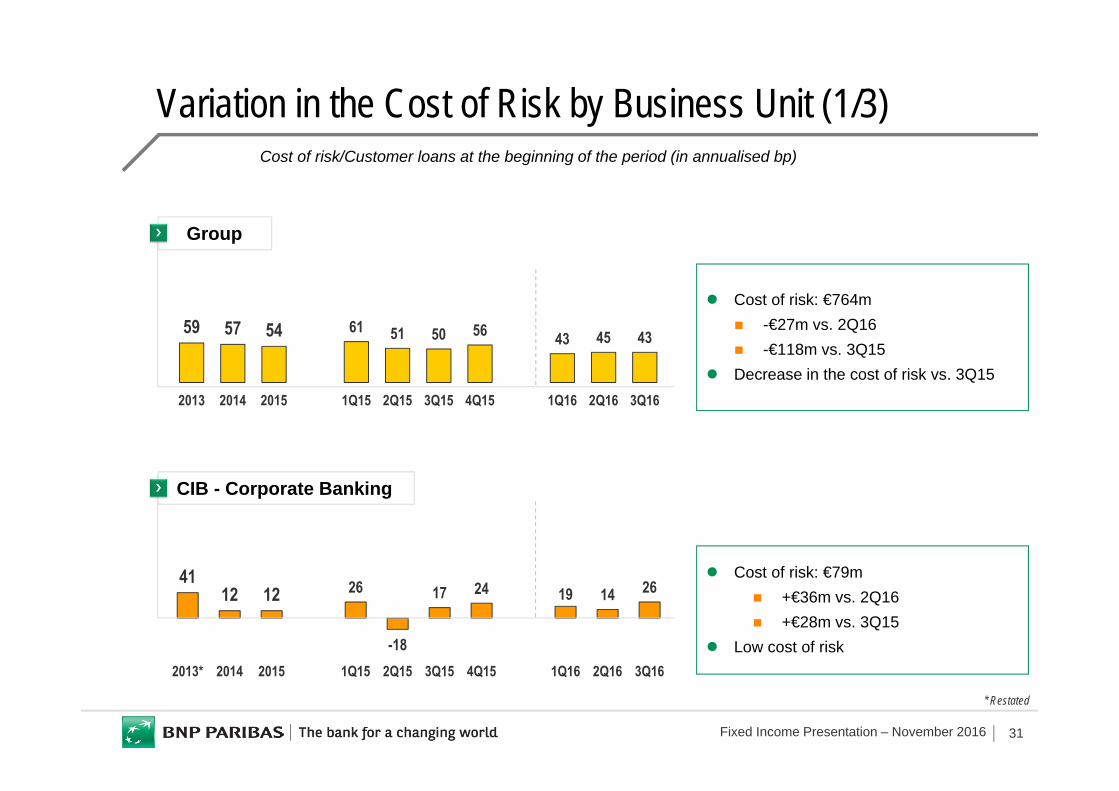
59 57 54 61 51 50 56 43 45 43
2013 2014 2015 1Q15 2Q15 3Q15 4Q15 1Q16 2Q16 3Q16
Group
Cost of risk: €764m -€27m vs. 2Q16 -€118m vs. 3Q15
Decrease in the cost of risk vs. 3Q15
Variation in the Cost of Risk by Business Unit (1/3)
* Restated
4112 12 26
-18
17 24 19 14 26
2013* 2014 2015 1Q15 2Q15 3Q15 4Q15 1Q16 2Q16 3Q16
CIB - Corporate Banking
Cost of risk: €79m +€36m vs. 2Q16 +€28m vs. 3Q15
Low cost of risk
Cost of risk/Customer loans at the beginning of the period (in annualised bp)

Fixed Income Presentation – November 2016 32
16 15 9 15 1
-1
22 9 20 8
2013 2014 2015 1Q15 2Q15 3Q15 4Q15 1Q16 2Q16 3Q16
23 28 24 24 24 22 25 21 20 20
2013 2014 2015 1Q15 2Q15 3Q15 4Q15 1Q16 2Q16 3Q16
Variation in the Cost of Risk by Business Unit (2/3)
FRB Cost of risk: €72m -€1m vs. 2Q16 -€7m vs. 3Q15
Cost of risk still low
BNL bc Cost of risk: €215m -€28m vs. 2Q16 -€94m vs. 3Q15
Continued decrease in the cost of risk
150 179 161 166 166 159 155 142 126 110
2013 2014 2015 1Q15 2Q15 3Q15 4Q15 1Q16 2Q16 3Q16
BRB Cost of risk: €19m
-€30m vs. 2Q16 +€21m vs. 3Q15
Very low cost of risk Reminder: provisions offset by
write-backs in 3Q15
Cost of risk/Customer loans at the beginning of the period (in annualised bp)

Fixed Income Presentation – November 2016 33
Variation in the Cost of Risk by Business Unit (3/3)
243 214 206 205 204 200 216149 164 154
2013 2014 2015 1Q15 2Q15 3Q15 4Q15 1Q16 2Q16 3Q16
Cost of risk: €240m -€8m vs. 2Q16 -€47m vs. 3Q15
Sharp decline in the cost of risk vs. 3Q15 Effect of the low interest rates and the
growing positioning on products with a better risk profile (car loans notably)
Personal Finance
95 119 120 159109 113 101 100 89
129
2013 2014 2015 1Q15 2Q15 3Q15 4Q15 1Q16 2Q16 3Q16
Europe-Mediterranean
Cost of risk: €127m +€41m vs. 2Q16 +€16m vs. 3Q15
Increase in the cost of risk in Turkey
13 12 9 15 11 14
-3
16 16 9
2013 2014 2015 1Q15 2Q15 3Q15 4Q15 1Q16 2Q16 3Q16
BancWest Cost of risk: €14m
-€9m vs. 2Q16 -€5m vs. 3Q15
Cost of risk still very low
Cost of risk/Customer loans at the beginning of the period (in annualised bp)

Fixed Income Presentation – November 2016 34
1
6
Evolution of the CET1 Ratio
Steady organic growth of CET1 ratio across the cycle
* Basel 2 from December 2007 to December 2011, Basel 2.5 as at December 2012, then fully loaded Basel 3 for the years after; ** Q/Q-1 CET1 ratio evolution restated of capital increases and acquisitions; average number of quarters of negative CET1 ratio evolution for 10 European peers; *** Including the buy-back of the Fortis shares held by the minority shareholders (~-50bp); **** +100bp excluding costs related to the comprehensive settlement with the U.S. authorities
-30bp+260bp
+120bp+90bp
+210bp+40bp*** +0bp****
+60bp
Annual evolution of the CET1 ratio*
12.07 12.08 12.09 12.10 12.11 12.12 12.13 12.14 12.15
Number of quarters of negative CET1 ratio evolution (2009-2Q16, European peers)**
BNPP European peersOver 30 quarters

Fixed Income Presentation – November 2016 35
Long-Term RatingsAs of 9 November 2016
Any rating action may occur at any time
Standard & Poor’s
Fitch
Moody’s
DBRS
A
A+
A1
AA (low)
Stable outlook
Stable outlook
Stable outlook
Stable outlook
Senior unsecured
Expected rating for the new
senior non preferred
A-
A+
Baa2
[A+]
Ratingfor
Additional Tier 1
BBB-
BBB-
Ba1
NC

Fixed Income Presentation – November 2016 36
S&P – Rating Benchmark
* Holding company as main issuer of senior debt. Bank entities are rated as follows: Wells Fargo Bank NA: AA- (negative), JP Morgan Chase Bank NA: A+ (stable), Citibank NA: A (CreditWatch positive), Bank of America NA: A (CreditWatch positive), Morgan Stanley Bank: A (CreditWatch positive); Data Source: Bloomberg
AA- HSBC Bank plc (negative) Royal Bank of Canada (negative)
A+ Rabobank (stable) UBS (stable)
Any rating action may occur at any time
ABNP Paribas (stable) Crédit Suisse (stable)
Crédit Agricole (stable) Société Générale (stable)
Wells Fargo & Co* (negative) Lloyds Bank plc (negative)
A- Santander (stable) JP Morgan Chase & Co* (stable)
Barclays Bank plc (negative)
RBS plc (stable) Commerzbank (stable)
BBVA (stable) Citigroup* (stable)
Bank of America Corp.* (stable) Morgan Stanley Holding* (stable)
Goldman Sachs Group* (stable) Deutsche Bank (negative)
BBB+
BBB- Unicredit (stable) Intesa San Paolo (stable)
As of 9 November 2016

Fixed Income Presentation – November 2016 37
RBS plc (positive) Santander (stable)
Morgan Stanley Holding* (stable) Goldman Sachs Group* (stable)
JPMorgan Chase & Co* (stable)
Commerzbank (stable) Citigroup* (stable)
Bank of America Corp.* (stable) BBVA (stable)
Intesa San Paolo (stable) Unicredit (stable)
BNP Paribas (stable) Lloyds Bank plc (stable)UBS (stable) Crédit Agricole (stable)
Moody’s – Rating Benchmark
* Holding company as main issuer of senior debt. Bank entities are rated as follows:Wells Fargo Bank NA: Aa2 (Stable), JP Morgan Chase Bank NA: Aa3 (stable), Citibank NA: A1 (stable), Bank of America NA: A1 (stable), Morgan Stanley Bank: A1 (stable); Data Source: Bloomberg
Any rating action may occur at any time
Crédit Suisse (stable) Barclays Bank plc (negative)
Wells Fargo & Co* (stable) Société Générale (stable)
Royal Bank of Canada (negative)
Aa2Aa3
A1
Rabobank (stable) HSBC Bank plc (negative)
A2
A3
Baa1
Baa2 Deutsche Bank (stable)
As of 9 November 2016

Fixed Income Presentation – November 2016 38
Fitch – Rating Benchmark
* Holding company as main issuer of senior debt. Bank entities are rated as follows: Wells Fargo Bank NA: AA (negative), JP Morgan Chase Bank NA: AA- (stable), Citibank NA: A+ (stable), Bank of America NA: A+ (stable), Morgan Stanley Bank: A (stable); Data Source: Bloomberg
Any rating action may occur at any time
Royal Bank of Canada (negative)
HSBC Bank plc (stable) Wells Fargo & Co* (negative)
Rabobank (stable)
BNP Paribas (stable) JPMorgan Chase & Co* (stable)
Lloyds Bank plc (stable) UBS (stable)
Crédit Agricole (positive) Crédit Suisse (stable)Barclays Bank plc (stable) Citigroup* (stable)Morgan Stanley Holding* (stable) Goldman Sachs Group (stable)Société Générale (stable) Bank of America Corp.* (stable)
AA
AA-
A+
A
Santander (stable) BBVA (stable)
Deutsche Bank (creditWatch negative)A-
Intesa San Paolo (negative) RBS plc (stable)
Commerzbank (stable) Unicredit (negative)BBB+
As of 9 November 2016