Fixed Income Options in Today’s Economy by John Milne, CEO JKMilne Asset Management
25
Fixed Income Options in Today’s Economy by John Milne, CEO JKMilne Asset Management
-
Upload
leo-huffman -
Category
Documents
-
view
32 -
download
1
description
Fixed Income Options in Today’s Economy by John Milne, CEO JKMilne Asset Management. What Are The Fixed Income Options? More than ever:. Process: Active or Passive Style: Sector Rotator or Duration Manager - PowerPoint PPT Presentation
Transcript of Fixed Income Options in Today’s Economy by John Milne, CEO JKMilne Asset Management

Fixed Income Options in Today’s
Economy
by John Milne, CEO
JKMilne Asset Management

What Are The Fixed Income Options?More than ever:
• Process: Active or Passive• Style: Sector Rotator or Duration Manager• Decision Basis: Macro Economy drives Top-Down
decisions? Or are decisions driven from the Bottom-Up by Micro Economic factors such as credit selection, issue structure and/or, optionality?
• There are increasingly more clearly defined style differences in Fixed Income that became evident in 2008.

What Are The Fixed Income Options?More than ever: continued
• There are more “sub asset” classes such as Investment Grade, High Yield, Non-US, Distressed…and more.
• Who do you want managing your money? Big Box, Boutique, Mutual Fund, ETF?
• Is the money managers ownership structure important? Independent?
• Critical Decisions…the “vehicle” used to acquire the above characteristics.

Why Are The Vehicles Important?
Manager risk has become as great as investment risk.
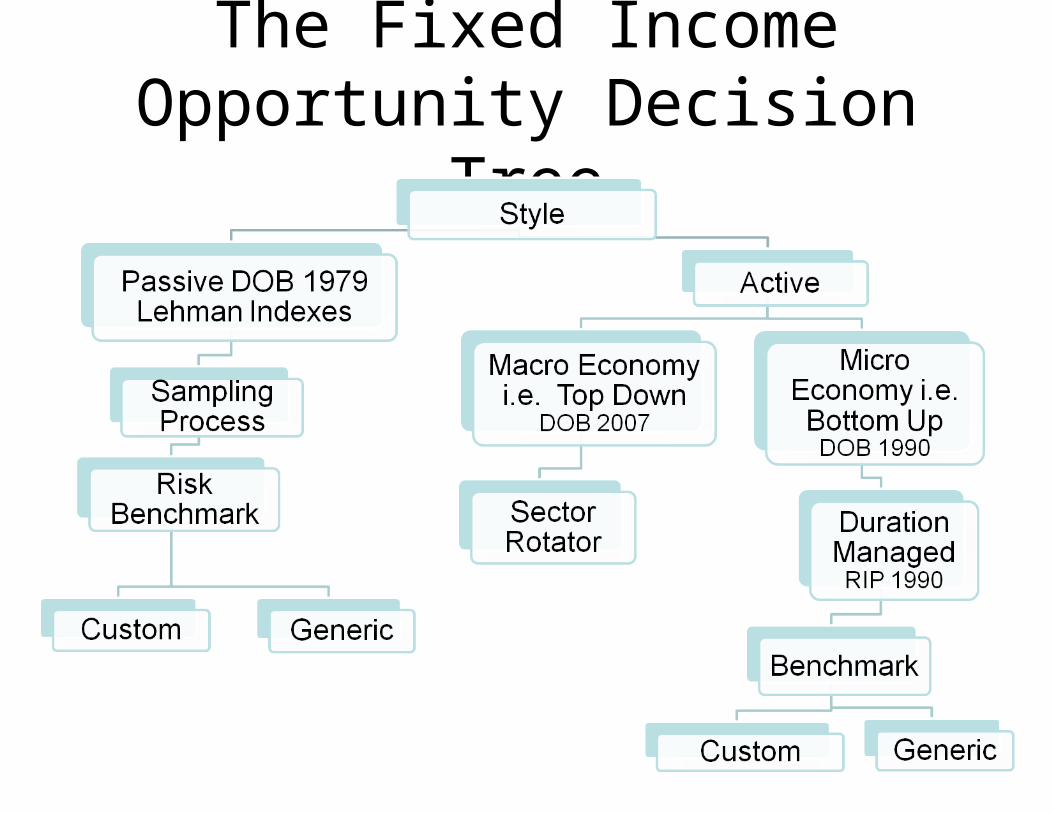
The Fixed Income Opportunity Decision Tree

There Are Long and Significant Secular Opportunities in Fixed Income
Investment Period Investor Risk Benchmark
Hallmark (What Happened?)
1946-1958 None “Low Interest Rates” largely a corporate bond market, no long bond exists
1960 None “Nothing” 1960 the Tsy 10yr was 4.67%; 1969 7.15%
1970 None “Asleep at the Wheel” 1970 10yr Tsy Yields 7.4%; 1979, 9.34%; 1980, 12.67%
1980 Lehman Aggregate
“The Mortgage Market Layup” As investors became risk managers they buy the market
components in the indexes
1990 Aggregate + “The Anything but Government Bonds Homerun” As the mantra is “buy corporates and
Drexel will make me alpha.” Drexel closes Valentines Day 1989
2000-2010 Barclays Aggregate
No leadership. Corporates hit all time wide spread October 2002, 2008 mortgages are
volatile
Source of yield data “Analytical Record of Yields & Yield Spreads” Saloman Brothers

What is a common active bond market index?
•Primarily U.S. investment-grade markets
•Liquid and does not include cash
Barclays Capital Aggregate Index
Source: Barclays CapitalAs of July 31, 2010

Barclays Aggregate Index Quality Exposure
Source: Barclays CapitalAs of July 31, 2010

Barclays Corporate Bond Quality Exposure
Source: Barclays CapitalAs of July 31, 2010

It’s Not Your Grandfathers Bond Market
• Corporates are increasingly correlated to the equity market
• The Total AAA Corporate Issuers are:
–ADP
–Microsoft
–Johnson & Johnson
• The result is a market heavily reliant on credit decisions


Source: Bloomberg
Historical Interest Rates 10yr Tsy Note

Treasury Yield Curve
Source: Barclays CapitalAs of August 31, 2010

Source: Bloomberg
Yield Spread between the 2yr and 10yr Tsy Notes

Market Returns
Source: Barclays Capital As of August 31, 2010
Total Return 1 Yr8/31/2010
Total Return 10 Yrs8/31/10 (annualized)
Aggregate 9.18 6.47
Intermediate Agg 8.25 6.21
Intermediate Gov/Credit
8.18 6.09
Intermediate Credit 11.35 6.70
Securitized 6.97 6.41
High Yield 21.52 7.54
S&P 500 Total Return
4.91 -0.01

US Aggregate Year to Date Excess Returns
Source: Barclays Capital As of August 31, 2010

What’s New?Liability Driven Investment (LDI)

Government Debt as a % of GDP

Selected Countries: Public Debt-to-GDP Ratio(In percent)
Sources: United Kingdom: Goodhart (1999) and IMF, World Economic Outlook database. United States: Historical Statistics of
the United States, Millennial Edition Online; Office of Management and Budget; and U.S. Census Bureau. Japan: Bank of
Japan, Hundred-Year Statistics of the Japanese Economy; and Toyo Keizai Shinposa, Estimates of Long-Term Economic
Statistics of Japan Since 1868. Data for Japan refer to the central government.


The Reality of Fixed Income Options “Let’s get real”
• Interest rates are near or at record lows depending on if we look at short term or long term rates.
• US GDP has been losing “velocity” for 50 years now.
• The US is in a second jobless recovery.
• 245 million Americans over the age of 16 with 80 million not working (for any reason).
Source: US DOL, JKMAM

What Are the Market Options?
• Hey, rates stayed this low for 12 years between 1946 and 1958. It does happen.
• Whoa, rates can go lower with low inflation or continued dis-inflation.
• No one in this room lived with deflation and its consequences so we take the scenario off the table for investment purposes.
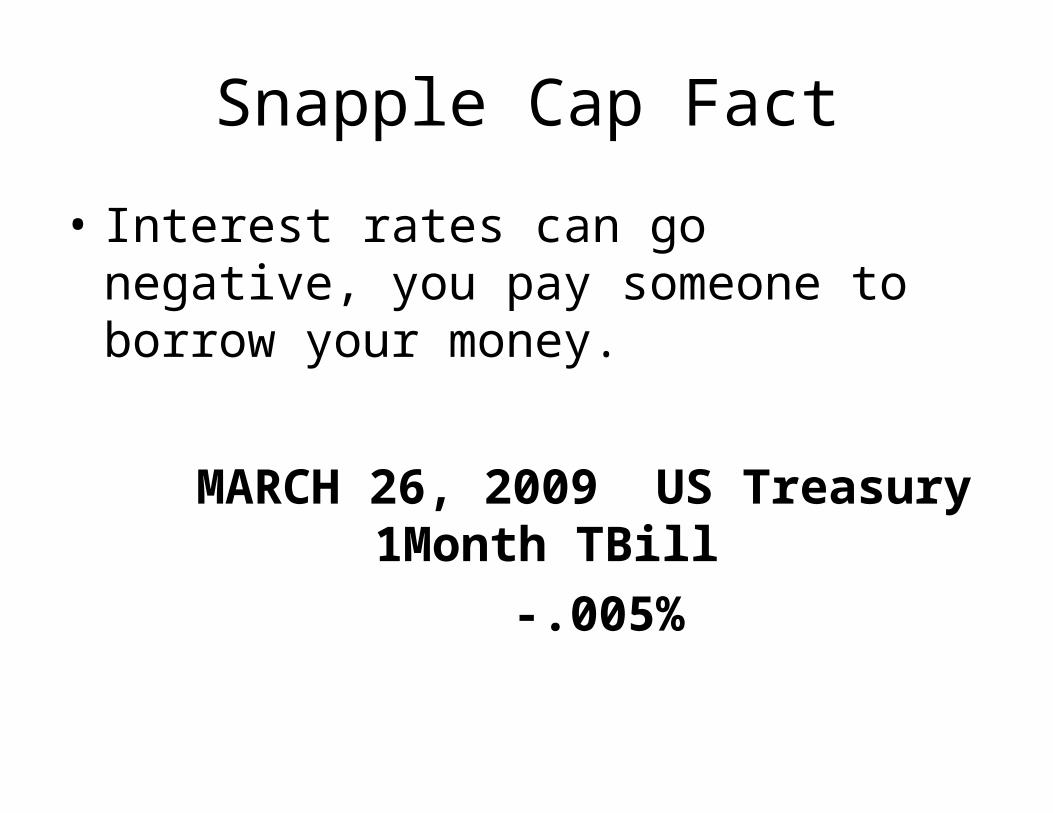
Snapple Cap Fact
• Interest rates can go negative, you pay someone to borrow your money.
MARCH 26, 2009 US Treasury 1Month TBill
-.005%
Fixed Income Options in Today’s Economy
• Investors have more options to DIVERSIFY style, process, and culture of their fixed income MANAGERS.
• A very unique period that does not have any leadership creates the opportunity to insert OPPORTUNISTIC strategies. That is, hire a manager on the pretense that they will be terminated upon success.

TAKE AWAY
• There is a need to find the optimal combination of NIMBLENESS and HIGH CONVICTION in the same investment process.
• That is to say, the “off the chart” low yields and high volatility need to be managed well or you will risk significant losses in bonds and fracture the manager.