Five years of European carbon research: i MCHMFR EQNL ...
23
CARBOOCEAN C A R B O E U R O P E IP What we have learned What we still don’t know and What we must do to combat climate change Five years of European carbon research:
Transcript of Five years of European carbon research: i MCHMFR EQNL ...

CARBOOCEAN
C
ARBO
E
UROP
E
IP
What we have learnedWhat we still don’t know and
What we must do to combat climate change
Five years of European carbon research:

What we have learned, What we still don’t know, and What we must do to combat climate change
CARBOOCEAN
C
ARBO
E
UROP
E
IP
What we have learnedWhat we still don’t know and
What we must do to combat climate change
Five years of European carbon research:
Integrated assessment of the European and North Atlantic carbon balance.
Annette Freibauer
CarboEurope
Christoph Heinze
CarboOceanCoordinator
Andrea Volbers
CarboOcean
Ernst-Detlef Schulze
Carbo EuropeCoordinator

What we have learned, What we still don’t know, and What we must do to combat climate change
5
What we have learned, What we still don’t know, and What we must do to combat climate change
What we have learned 7
Achievements, surprises & worries from global carbon research
What we must do 19Climate change is caused by mankind? Excellent news: since we are the origin of the problem, we are also master of the solution!
CarboSchools in action 30Partnerships between climate researchers and secondary school teachers
Contents
Climate change, like no other environmental challenge in this century, will require a complete transformation of our energy and industrial systems, the way we transport our-selves, build our dwellings and also the way we produce, buy and re-use goods and services.
incentives for industry and society to transform.

What we have learned, What we still don’t know, and What we must do to combat climate change
7
What we have learnedAchievements, surprises & worries from global carbon research
The capacity of vegetation to take-up carbon is affected by climate change. The oceans seem to absorb less and less carbon. The accumulationof CO2 in the air is growing exponentially, although the natural carbon sinks still absorb more than half of our current emissions. In two words: no surprise - as we continue to emit more and more CO2, planet Earth is more and more perturbed!
Measuring tree growth with automated dentrometers (Alterra)
Key research questions about the global carbon cycle
increase more and more.

What we have learned, What we still don’t know, and What we must do to combat climate change
9
the European continent, which normally absorbs carbon
To learn more, you can find in www.carboschools.org:
Integrated assessment of the European and North Atlantic carbon balance
Sources policy:
during the vegetation growth season, became a source of CO2 to the atmosphere in July and August 2003,
ral CO2 sequestration by the European biosphere. This teaches us that the land carbon sink is vulnerableand reacts strongly to climate extremes.
in the atmosphere. The rise in atmospheric
2
source.
Key results
We have discovered that nitrogen pollution fertil-izes European forests.
2
peatlands converted into
of CO2
drained peatlands emit 25% of the total atmospheric CO2 absorbed by the European forests
2
1) A more detailed presentation of the aims & methods of CarboEurope is given pp. 26-30 of the 1st CarboSchools booklet.
An overview of CarboEurope results
The aim of CarboEurope
how carbon is exchanged
why carbon is ex-changed this way
how the carbon cycle will evolve in the longer term under the
continue to rise.
Surprise: the European terrestrial sink can become a source
European-wide anomaly of Net Primary Production (i.e. photo-synthesis) during 2003 (Ciais et al., 2005). Black dots indicate measurement sites.
Wet Nitrogen deposition in Europe. Magnani, pers. comm.

What we have learned, What we still don’t know, and What we must do to combat climate change
11
tions.
we still don’t really know how this sink is distributed across the various regions of the continent
Future challenges
carbon ob-servation network
even when the growing season at temperate latitudes is extended by global warm-ing, the terrestrial ecosystem does not absorb more atmospheric CO2.
a new method to trace emissions from fossil fuel burning in the atmo-sphere.
atmospheric measurements.
a new methodology for inves-tigating the key missing component in the Euro-pean carbon budget: the regional scale
the way
2how land can be
managed in order to take up CO2 more effectively.
2 even
2
recommendations for good practices in land-use -
agement & the protection of carbon sinks.
how warmer autumns
the capacity of vegetation to absorb CO2.
even more. This is because photosynthesis in autumn
Forest tree species map (Hengeveld et al., in prep., Alterra): we now have much more insight into where different types of forest are located and how they grow. This is important information for designing the optimal carbon management plan because each location will require different
smart forest landscape whereas for central Europe, with large stocking of biomass, the production of biomass for bioenergy may be optimal and at the same time it reduces the storm risk. In the north, the continuous
the conservation of peatlands may be the optimal strategy).
More uncertainties in the European carbon balance...
concentration in
but this higher level of uncertainty is in itself an important result

What we have learned, What we still don’t know, and What we must do to combat climate change
13
An overview of CarboOcean results is the counterpart of CarboEurope for the
oceans:exchan-
ged
it is transported
in the future.
and varies in time and what effects all this extra CO2invading the oceans will have
Key resultsand allow us to
deliver precise estimates of carbon uptake in dif-ferent regions of the North Atlantic and its va-riation over time
0.25 PgC +/- 10%
to produce temporally resolved maps of the land-atmosphere carbon exchange across Europe
allowlocal communities to evaluate their own progress towards achieving carbon neutrality
we urgently need more accurate knowledge on how to manage land as a carbon sink and how to moni
by our emissions.
towhat extent and for how long can Europe rely on its terrestrial carbon sinks?
we have built a community with free circulation of ideas and data.
4) A more detailed presentation of the aims & methods of CarboOcean is given pp. 31-36 of the 1st CarboSchools booklet.
6) 1 PgC means 1 peta-gram of carbon, which is the equivalent of one giga-ton (one billion of tons). 0.25 PgC +/- 10% therefore means 250 million tons of carbon plus or minus 25 million tons.
2) Flux maps are already available at http://inversions.lsce.ipsl.fr
commitments of Europe should be increased by 5, 10 or 20 % to counter reductions in ecosystems C sinks by 2020 and 2050 for various emission scenarios. A major product will be maps showing the risks of not attaining targets in emission reduction as a result of a weakening of the European C sink.
Cruise track of CarboOcean VOS lines in the northern Atlantic Ocean (Benjamin Pfeil, CarboOcean data centre, BCCR).
What we have learned, What we still don’t know, and What we must do to combat climate change
15
we are not yet able to predict the scope of the con-sequences, which might threaten the Earth’s eco-logical balance as severely as climate warming is doing
to
Validating the methodology to reach this estimate is a key achievement
need more years of observations to see whether the
In the Southern Ocean, we see that the ocean sink has been weakening since at least 1980
from the the continuous acceleration of
climate change and CO2 emissions will gradually reduce the sink strength, resulting in a temporary
but huge increase of CO2 in the atmosphere. This
.
We are progressing in our capacity to see where the CO2 emitted by humans goes once it enters the ocean. from human activities per
was before the onset of the human emissions and so
the largest quan-tities accumulated in the high latitude northern Atlantic
We have learned a lot about how the terrestrial and marine carbon cycles interact through the coastal ocean
In the North Sea, we are now able to observe and account for the carbon input, via rivers
found out that -
carbon into the Atlantic Ocean’s interior.
Big unknowns about carbon in the ocean
concentrations
on many parameters but often without being able to explain what we observe, nor able to predict the consequences
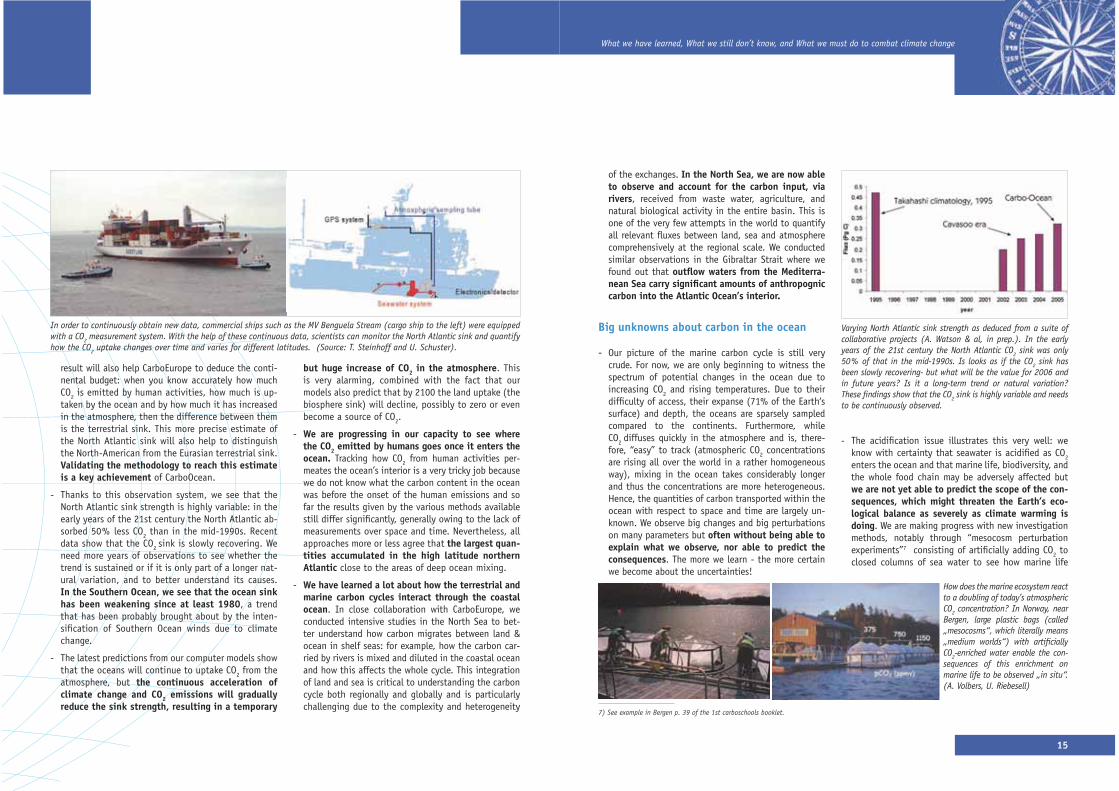
In order to continuously obtain new data, commercial ships such as the MV Benguela Stream (cargo ship to the left) were equipped with a CO2 measurement system. With the help of these continuous data, scientists can monitor the North Atlantic sink and quantify how the CO2 uptake changes over time and varies for different latitudes. (Source: T. Steinhoff and U. Schuster).
Varying North Atlantic sink strength as deduced from a suite of collaborative projects (A. Watson & al, in prep.). In the early years of the 21st century the North Atlantic CO2 sink was only 50% of that in the mid-1990s. Is looks as if the CO2 sink has been slowly recovering- but what will be the value for 2006 and in future years? Is it a long-term trend or natural variation?
2 sink is highly variable and needs to be continuously observed.
How does the marine ecosystem react to a doubling of today’s atmospheric CO2 concentration? In Norway, near Bergen, large plastic bags (called „mesocosms“, which literally means
CO2-enriched water enable the con-sequences of this enrichment on marine life to be observed „in situ“. (A. Volbers, U. Riebesell)
7) See example in Bergen p. 39 of the 1st carboschools booklet.

What we have learned, What we still don’t know, and What we must do to combat climate change
17
.
Future challenges
in the atmosphere.
concentration and
invasion into the Earth system
We need to vastly increase the number of observations in key regions of the world’s oceans in order to validate and improve the accuracy of our models
The global pictureBad news…the world’s emissions are current-ly accelerating faster than the worst scenar-ios predicted and the natural capacity of the carbon cycle to absorb our emissions seems to be decreasing.
Carbon emissions from fossil fuels
The growth rate of fossil fuel emissions is accelerating – in the period 1990-1999 it was increasing at a rate of 0.9% per year, whereas in the period 2000-2007 the rate of increase was 3.5%. This represents a multiplication by almost four in the last decade, exceeding the highest forecasted growth rate for the period 2000-2010 in the emissions scenarios of the Intergovermental Panel on Climate Change (IPCC)9. The biggest increase in emissions has taken place in developing countries, largely in China and India, while in developed countries it has been growing slowly.
All graphs in this section are ex-tracted from: Global Carbon Project (2008) Carbon budget and trends 2007, [www.globalcarbonproject.org, 26 September 2008]
Trajectory of global fossil fuel emissions
Current emissions (black) are tracking above the most intense fossil fuel scenario established by the IPCC SRES (2000), A1FI- A1 Fossil Fuel intensive, and are moving away from the stabili-zation scenarios of 450 ppm10 and 650 ppm.
Carbon emissions from tropical deforestation
Here the mean atmospheric CO concentration is simulated by (black line) BCM-C model as compared to the range (grey shading) from other C4MIP (Friedlingstein et al., 2006) models, based on the IPCC SRES A2 emissions scenario in which fossil fuel usage more or less continues to grow unabated (source: Tjiputra et al., in prep.)There is a strong agreement across 11 models from the C4MIP experiment, now backed up by these new CarboOcean results, that natural carbon sinks in both oceans and on land will be weakened by the effects of climate change. This weakening, combined with the rise in emissions, explains this highly alar-ming curve. This does not mean that atmospheric CO concentra-tions (governed by CO emissions minus land and ocean uptake) will certainly rise in an exponential way over the 21st century, however, the prevention of such a rise, and the stabilisation of climate, will certainly require strong intervention policies from all the world’s governments.
9) IPCC scenarios correspond to various future predictions of CO2 emissions globally depending on various hypotheses of economic & industrial development, and population growth.10) ppm : parts per million, unit used to measure small concentrations (1 ppm = 0,0001%)8) epoca-project.eu

What we have learned, What we still don’t know, and What we must do to combat climate change
19
Atmospheric concentration
The annual mean growth rate of atmospheric CO2 was 2.2 ppm per year in 2007 (up from 1.8 ppm in 2006), and above the 2.0 ppm average for the period 2000-2007. The average annual mean growth rate for the previous 20 years was about 1.5 ppm per year. This increase brought the atmospheric CO2 concentration to 383 ppm in 2007, 37% above the concentration at the start of the industrial revolution (about 280 ppm in 1750).
Human perturbation of the global carbon budget 1850-2006
This graph shows how the CO2 emitted by mankind (higher part, distributed between fossil fuel burning and deforestation) pro-gressively diffuses in the whole system (lower part, distributed between atmosphere, ocean & vegetation). Atmospheric CO2 ac-cumulation is directly measured, the ocean sink is modelled, and the land sink is the residual from closing the balance (it is not directly measured).
The decline of the natural sinks
Natural land and ocean CO2 sinks have removed 54% (or 4.8 PgC 11 per year) of all CO2 emitted from human activities during the period 2000-2007. The size of the natural sinks has grown in proportion to increasing atmospheric CO2. However, the ef-fectiveness of these sinks in removing CO2 has decreased by 5% over the last 50 years and will continue to do so in the future. That is, 50 years ago, for every ton of CO2 emitted to the atmos-phere, the natural sinks removed 600 kg while today they are removing only 550 kg, and this amount is falling. Part of the
of the Southern Ocean sink over the last 20 years. Nevertheless it is impressive that natural CO2 sinks were able to absorb about half of the anthropogenic emissions in 1960, when emissions were 2 PgC/yr, and similarly 50 years later when emissions are now 10 PgC/yr.
All of these changes characterise a carbon cycle that is generating a stronger climate impact and sooner than expected.
What we must doClimate change is caused by mankind? Excellent news: since we are the origin of the problem, we are also master of the solution!
Learning about climate change can be de-pressing for children, especially for teenagers who are shaping their vision of their place in society, public engagement, and in the future. A worrisome sequence of events can be: ask-ing „what can we do“, then feeling power-less, getting back to normal life, and doing nothing.By overseeing the broad question of how we can solve the climate crisis, this chapter tries to suggest pathways for teachers to avoid this sequence of events and empower young people to take positive action and engage
understanding.
Large-scale action is needed globally and has not yet occurred
.
.
into the atmosphere.
emission reductions.
sions.
However, as scientists we need to make sure that the questions are well formulated, well documented, and well understood in the full context of their implications and that the various responses
11) 1 Petagram of carbon is 1 billion tons of carbon.
try to better understand global change ».13) As particularly well documented, in the Stern review on the economics of climate change (2006)14) The possibility of positive effects in some places, e.g. increased agricultural productivity in Siberia or Alaska, is of no comparison with the scope of the nega-tive effects globally.15) In contrary to e.g. the ozone layer problem, where a single family of industrial gases (CFCs) could easily be replaced by a less harmful existing technology.

What we have learned, What we still don’t know, and What we must do to combat climate change
21
zero-emissions world
a reduction of the world’s greenhouse gas emissions to half of their 1990 levels by 205018
only 3 tons of CO2-equivalent
2.1 tons per capita
humanity has not yet started to reduce its emissions. emissions are still growing exponentially see
previous commitments
.
must be divided by a factor of at least 5 to 10 in order to reduce world emissions to 50% of their 1990 level.
16) i.e 2 degrees more than pre-industrial values, which means about 1 more than today’s global temperature.
2
the levels already reached are unprecedented in the human history, making it impossible to know from the past what concentration means for sure what conse-quence; second, because given the delay & inertia between reaching a certain level of concentrations, and the consecutive rise of temperatures, we might in fact already have passed some critical thresholds.18) in order to reach a stabilisation of 550 ppm of CO2-equivalent concentration. But more recent model studies show that this 550 ppm target will be too high and that even with 450 ppm, there would only result in a 50% likelihood of limiting global warming to 2°C.19) Ultimate objective of the United Nations Framework Convention on Climate Change - UNFCCC20) The Kyoto protocol states that “developed countries have to reduce their emissions of GHG between 2008 and 2012 by at least 5% compared to 1990 levels”21) However in the EU-25, greenhouse gas emissions fell by 4.8 % between 1990 and 2004. But during the same period, energy-related emissions fell consider-ably less (- 1.6 %) and since 2000, emissions from energy supply and use have been rising. The reduction in energy-related greenhouse gas emissions since 1990 was achieved largely in the energy supply, services and industry sectors, but was to a large extent offset by growth in transport emissions. The increase observed since 2000 is mainly due to growing electricity production from thermal power plants, particularly those using coal. (source European Environmental Agency)
22) CO2-equivalent includes CO2 plus all the other greenhouse gases emitted by man (eg. methane and nitrous oxide) related to their radiative effect (i.e. the amount of additional warming they cause. For example, 1 ton of methane = 21 tons of CO2-equivalent)

What we have learned, What we still don’t know, and What we must do to combat climate change
23
The big solutions
fect.
2
In the same way as doctors attend their patients with
CO2 storage
2
CO2 sequestration comes from the idea that man can
It’s not a sin to use energy!
use of non-renewable sources of energy
Global ‘chance’?
2
reduction potential. Cutting down a forest to plant crops for biofuel releases more CO2 in the long-term than would have been released if the forest had been left standing and an amount of fossil fuel, equivalent to that from the crops, had been used instead.24) However, if we decided to bring back forest at large scale in the areas previously covered by forest the terrestrial sink would undoubtedly be enhanced. A dif-ferent story is whether we want to do that and what would be the impact on food production, livelihoods and economies.

What we have learned, What we still don’t know, and What we must do to combat climate change
25
Acting in daily life
difference.
at home:
heater
them
Could we be mistaken?
CO2 offset: guilt-relief for high polluting lifestyles?
emissions.
mentioned above.
credits.
Banner of the www.climatechange.eu.com campaign website of the EU

What we have learned, What we still don’t know, and What we must do to combat climate change
27
The role of schools
its
Educational actions concerning climate change should aim to progress from „awareness“ to “understand-
by leading by example and by demonstrating sus-tainability:
actas agents of change as active members of society.
:
Why so few people are changing their lifestyle?
importance in comparison to other issues in our
Would you like to involve your school in sustainable education?
26) as derived from the “local Agenda 21”, a methodology for implementing sustainable development in local communities, inspired by the “Agenda 21” action plan initiated at the Rio conference in 1992.27) www.eco-schools.org28) www.greenschoolsireland.org

What we have learned, What we still don’t know, and What we must do to combat climate change
29
Scientists’ responsibility
François Rabelais, 1532(“Science without conscience is but ruin of the soul“)
The low emission policy of the Bjerknes Center for Cli-mate Research (BCCR) in Bergen, Norway
reducing our own emissions and others object that it‘s not a topic to be discussed within the community as the search for solutions should strictly remain the responsibility of governments and the broader society.
and biking campaign can follow their own as well as their colleagues bike routes on the internet. After a certain number of trips, they obtain a gift (source: J. Johannessen)
The Global Carbon Project (GCP) has set a goal to become carbon neutral in all its core activities by the end of 2008
investment.

What we have learned, What we still don’t know, and What we must do to combat climate change
31
Discover how teachers and scientists join forces in CarboSchools30 and bridge the gap between research and education! To illustrate the variety of projects initiated in several European countries since 2005, this chap-ter presents six inspiring examples all dem-
teacher-scientist partnerships. Students con-duct experiments on the impact of greenhouse gases, learn about climate research and the reduction of emissions, and inform their wid-er community about climate change. We hope that they will become fascinated and empow-ered by the search for solutions to the biggest uncontrolled perturbation to the Earth-system in human history. We hope to make learning about science more engaging and challenging for young people as future workers, consum-ers, citizens, or even scientists!
Benevento, Italy
IPSAA “Vetrone” & IIS “Alberti”: Sustainable conservation agriculture as a tool to mitigate the greenhouse effect
By Danilo Marandola, agronomist at CNR-IBIMET (Institute of Biometeorology) and regional CarboSchools coordinator; IPSAA “Vetrone” (Vocational School for Agriculture and Environment): Antonio Cristofaro, director, and Aniello Russo, Nicola Fusco, teachers; IIS “Alberti” (Technical School for Chemistry and Envi-ronment): Giovanni Antonio Paolucci, director, and Massimo Cap-pelluzzo, Aurelio Stefanelli, teachers. (pictures by the authors)
Number of pupils involved in the project:
Main subjects involved:
Duration:
Agriculture and CO2: why a CarboSchools project in a school for agriculture?
emissions which are
Conservation agriculture: the sod seeding system.
emissions.
to change from CO2 “sources” to CO2 “sinks”
The project: “Conservative sustainable agriculture as a tool to mitigate greenhouse effect”.
periments with the aim to increase their interest for the
CarboSchools in actionPartnerships between climate researchers and secondary school teachers
Some educational observations:
it in their own farm. This demonstrates that students
30) CarboSchools is currently funded until 2010 by the Science in Society programme of the EU, with a target of getting about 100 schools directly involved in

What we have learned, What we still don’t know, and What we must do to combat climate change
33
Bergen, Norway Bergen Katedralskole: The sea outside our doorby Bente Færøvik (Biology teacher); Eva Falck (regional Carbo-Schools coordinator); Solveig Kringstad (technician); Ingunn Skjelvan (researcher); Andrea Volbers (CarboOcean projectmanager) (pictures by the authors)
R/V Hans Brattstrøm. Students wearing safety suits.
of the students made a poster that was presented at
Plankton net in operation.
Watersampling.
What we have learned, What we still don’t know, and What we must do to combat climate change
35
Kiel, Germany Gymnasium Wellingdorf: Students, Teachers and Researchers Study the Oceanby Sabine Temming, Biology, German and Drama teacher (pictures by the author)
Concept:
attempts to convey the fascina
issues in direct contact with researchers. The students
Implementation:
Grade 5 – 8: Student Science Clubs:
Grade 10 – 13:
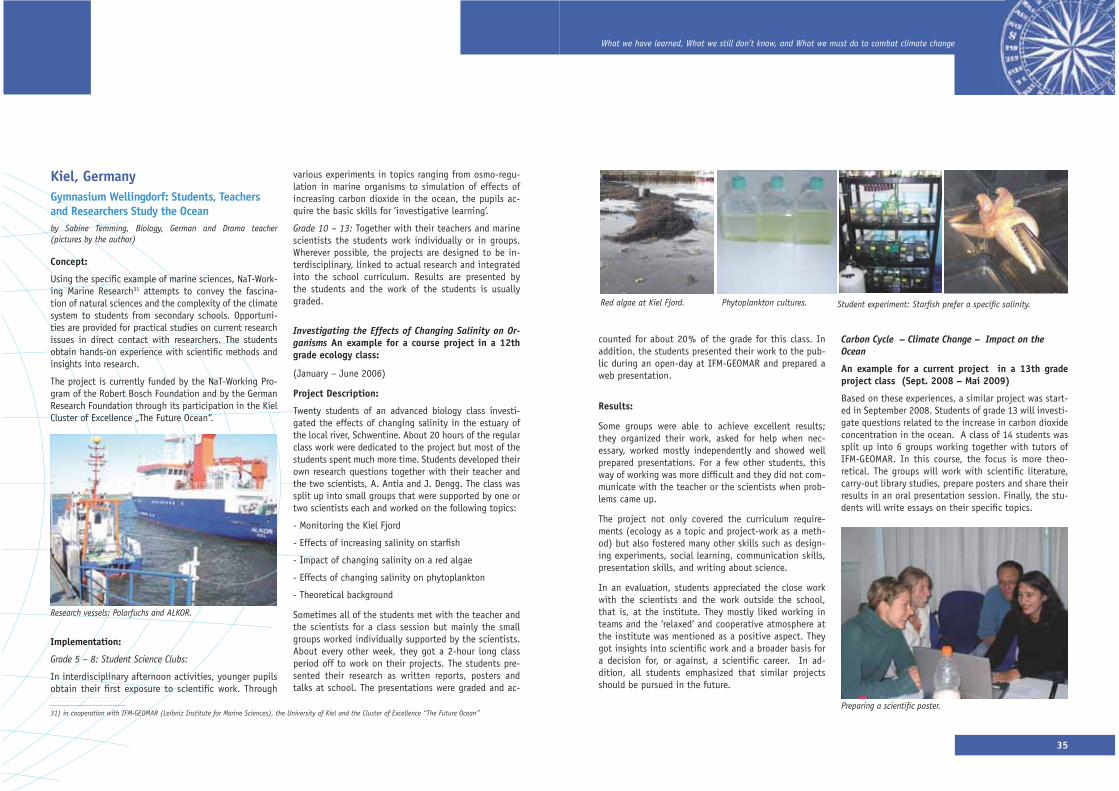
Investigating the Effects of Changing Salinity on Or-ganisms An example for a course project in a 12th grade ecology class:
Project Description:
web presentation.
Results:
municate with the teacher or the scientists when prob
the institute was mentioned as a positive aspect. They
Carbon Cycle – Climate Change – Impact on the Ocean
An example for a current project in a 13th grade
Red algae at Kiel Fjord. Phytoplankton cultures.
Research vessels: Polarfuchs and ALKOR.
31) in cooperation with IFM-GEOMAR (Leibniz Institute for Marine Sciences), the University of Kiel and the Cluster of Excellence “The Future Ocean”

What we have learned, What we still don’t know, and What we must do to combat climate change
37
Lampedusa, Italy Istituto Onnicomprensivo “Luigi Pirandello”: Atmosphere, climate, and sustainable developmentBy Alcide Giorgio di Sarra, scientist at ENEA/ACS32 and Maria Angela Marramaldo, headmaster (pictures by F. Monteleone, G. Giovanetti, and S. Piacentino)
32) Ente per le Nuove tecnologie, l’Energia e l’Ambiente (National Agency for New Technologies, Energy and the Environment), Department for the Environment, Global Change and Sustainable Development
presentation of the activities to the other students of
vance of the discussed themes. The introductory seminar
its success.
Trajectory followed by the balloon launched on March 21, 2007 by Group C,
which attained the maximum distance from Lampedusa (292 km).
CO2 and wind direction (orange) measurements at Lampedusa on March 21, 2007. The CO2 was measured downtown Lampe-dusa (pink) and at the ENEA Station, which is far from the town (blue). The wind originating sector is indicated in yellow.
-diosondes. The sonde from Group A reached the top altitude (33.7 km), the one from Group B the lowest temperature (-65.3°C), and the one from Group C encountered the strongest wind (67 m/s) and reached the largest distance from Lampedusa (292 km).
What we have learned, What we still don’t know, and What we must do to combat climate change
39
contact with them.
achievements.
English and Spanish
sions.
Project Outputs
sor measurements and interpretation.
Comments on educational aspects
Libourne, FranceLycée Max Linderby Mauricette Mesguich, biology teacher and Stephanie Hayes, CarboSchools coordinator in Aquitaine (pictures by the authors)
Multi-disciplinary activities
MPI (physical measurements and computing)
We studied the mechanics of some sensors from a physi
measured by the sensors.
in the
thetic activity by the trees.
ECJS (civic, law and social education) and economics
SVT (biology and geology)
33) Institut national de la recherche agronomique, French national agriculture research center.
We studied the di-ameter growth of trees with a potenti-
the principle of how the sensor works, and then, the trees’ annual growth. We also studied the life growth of trees by looking at ring width and dendrochronol-ogy in order to deduct the climatic, environmental and seasonal conditions that affected the trees’ growth.
The pupils visit the experimental site “Le Bray” to learn about the plant species of the for-est, the sensors on the site, and to interact with a re-searcher. The pupils produced a slide show report of their
visit to show what they had learnt and their understanding of how researchers study the interaction between the atmosphere and forest vegetation.
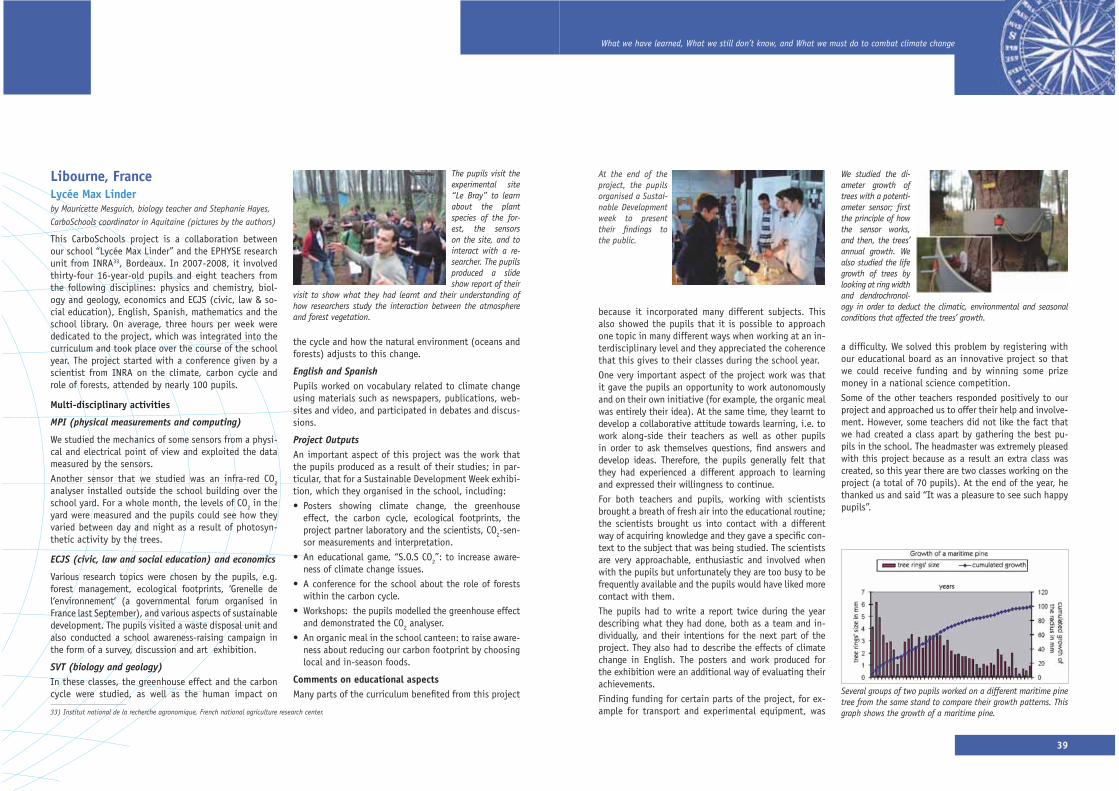
Several groups of two pupils worked on a different maritime pine tree from the same stand to compare their growth patterns. This graph shows the growth of a maritime pine.
At the end of the project, the pupils organised a Sustai-nable Development week to present
the public.

What we have learned, What we still don’t know, and What we must do to combat climate change
41
discover and better understand research and its meth
Motala, Sweden Platengymnasiet: is the forest a source or a sink of carbon dioxide?By Rune Davidsson and Lennart Wallstedt, science teachers (pictures by the authors)
piration from the roots and the effects of temperature.
Pupils and teachers from Platengymnasiet in the School forest, 5km north of Motala. Measuring the diameters of the trees.Measuring the soil respiration.Collecting data from our wetherstation.

„...Thus human beings are now carrying out a large scale geophysical experiment of a kind that could not have happened in the past nor be reproduced in the future. Within a few centuries we are returning to the atmosphere and oceans the concentrated organic carbon stored in sedimentary rocks over hundreds of millions of years.“
Roger Revelle & Hans E. Seuess. 1957
------
„This would be a better world for children if the parents had to eat the spinach“
Groucho Marx in Animal Crackers, 1930
Second CarboSchools Educational Booklet
English version November 2008 © CarboEurope & CarboOcean. This publication is free of rights for any non-commercial use.
Text (chapters 1 & 2): Philippe Saugier with contributions and reviewing from Pep Canadell, Liese Coulter, Marc Delmotte, Annette Freibauer, Anna Maria Font, John Gash, Christoph Heinze, Chris Jones, Gert-Jan Nabuurs, Jim Orr, Ulf Riebesell, Sibel Telli and Andrea Volbers
Text (chapter 3): Rune Davidsson, Bente Færøvik, Eva Falck, Stephanie Hayes, Solveig Kringstad, Danilo Marandola, Maria Angela Marramaldo, Mauricette Mesguich, Alcide Giorgio di Sarra, Ingunn Skjelvan, Sabine Temming, Andrea Volbers, Lennart Wallstedt
Best thanks to Philippe Ciais, Han Dolman, Annette Freibauer, Martin Heimann, Christoph Heinze, Inge-borg Levin, Ulf Riebesell, Helmuth Thomas, Riccardo Valentini, Douglas Wallace, Andrew Watson - and many others - for their help and patient explanations
Coordination: Philippe Saugier ([email protected])
Editing: Rona Thompson
Lay-out: Silvana Schott
Special acknowledgements to DG Joint Research Centre of the European Commission for the initial creation of the CarboSchools booklets design.
The picture illustrations in chapter 1 and 2 are courtesy of CarboEurope and CarboOcean.Back cover picture by Fabio Giovanetti.
www.carboschools.org
www.carboeurope.org
www.carboocean.org

teachers and scientists who want
manity.
We are at the bottom of the mountain in terms of our
need new cohorts of passionate researchers to address
Last check before balloon launch: in a few minutes
Pirandello” will sample the atmosphere over the island of Lampedusa
European distribution of the annual fossil fuel CO2
emissions, brighter colours indicate higher emission rates (IER, University of Stuttgart)
105
104
1000
100
10
<1
g C
m-2
a-1