Five years monitoring activity on radioactive cesium in ... · Total amount of Fukshima-derived...
19
Five years monitoring activity on radioactive cesium in seawater after the Fukushima Dai-ichi Nuclear Power Plant Accident H. Kaeriyama 1* , D. Ambe 1 , Y. Shigenobu 1 , S. Miki 1 , T. Morita 1 , H. Sugisaki 1 , M. Shimizu 2 , & T. Watanabe 2 1: National Research Institute of Fisheries Science, FRA 2: Japan Fisheries Research and Education Agency *E-mail: [email protected]
Transcript of Five years monitoring activity on radioactive cesium in ... · Total amount of Fukshima-derived...

Five years monitoring activity on radioactive cesium in seawater after the Fukushima Dai-ichi
Nuclear Power Plant Accident
H. Kaeriyama1*, D. Ambe1, Y. Shigenobu1, S. Miki1, T. Morita1, H. Sugisaki1, M. Shimizu2, & T. Watanabe2
1: National Research Institute of Fisheries Science, FRA2: Japan Fisheries Research and Education Agency*E-mail: [email protected]

References updated from last WS @Qingdao (PICES2015)Kaeriyama, H. et al. (2016): Sci. Rep., 6, 22010Kaeriyama, H. (in press): Fish. Oceanogr., Tsunami special issue published in Jan 2017Kakehi, S. et al. (2016): J. Environ. Radioact., 153, 1–9
Main topics are as follows;eastward dispersion in surface seawatersouthward intrusion with mode waterstemporal changes in 137Cs in coastal seawater
Introduction
After the Fukushima Dai-ichi nuclear power plant accident, many studies had been reported the oceanic dispersion patterns of radioactive Cs derived from this accident.
Here, we summarize the dispersion pattern of Fukushima-derived radiocesium in the North Pacific and temporal change in the concentration of 137Cs in seawater near the Fukushima site, based on the observational data obtained during five years.

Subarctic Gyre�
Oyash
io�
Kuroshio�
Subtropical Gyre�
California�
Alaska�
STMW�
CMW�
Oyashio�
Kuroshio�
Kuroshio Extension�Tsushima
Current�FNPP�
Sanriku�
Okhotsk Sea�
North Pacific�
Japan Sea�
Bering Sea�
Sendai Bay�
North Equatorial�
FNPP�
(a)�
(b)�
major sea surface and subsurface seawater movements associated with FNPP studies
Kaeriyama (in press)
Oceanic background

140˚E 160˚E 180˚
10˚N
20˚N
30˚N
40˚N
50˚N
60˚N140˚E 160˚E 180˚
10˚N
20˚N
30˚N
40˚N
50˚N
60˚N140˚E 160˚E 180˚
10˚N
20˚N
30˚N
40˚N
50˚N
60˚N
140˚E 160˚E 180˚
10˚N
20˚N
30˚N
40˚N
50˚N
60˚N140˚E 160˚E 180˚
10˚N
20˚N
30˚N
40˚N
50˚N
60˚N140˚E 160˚E 180˚
10˚N
20˚N
30˚N
40˚N
50˚N
60˚N
137Cs in surface seawater (Bq/m3)100 101 102 103
2011 2012 2013
2014 2015 2016
Monitoring activity on seawater by FRA
ca. 4,000 samples were analyzed

Subarctic Gyre�
Oyash
io�
Kuroshio�
Subtropical Gyre�
California�
Alaska�
STMW�
CMW�
North Pacific�Bering Sea�
North Equatorial�
FNPP�
(a)�
Eastward dispersion in surface seawater

(a) Mar–Jun 2011
(b) Jul–Dec 2011
(c) Jan–Jun 2012
(d) Jul–Dec 2012
137Cs (Bq/m3)
100 101 102 103
Kaeriyama (in press)
atmospheric deposition
140˚E–160˚E
140˚E–180˚
145˚E–180˚
155˚E–160˚W
Eastward dispersion in surface seawater
Data were cited from Aoyama et al. (2013a); Aoyama et al. (2013b); Aoyama et al. (2015b); Buesseler et al. (2012); Charette et al. (2013); Inoue et al. (2012a); Inoue et al. (2012b); Inoue et al. (2012c); Kaeriyama et al. (2013); Kaeriyama et al. (2014); Kaeriyama et al. (2015); Kaeriyama (2015); Kaeriyama (this study); Kamenik et al. (2013); Kim et al. (2012); Kumamoto et al. (2013); Kumamoto et al. (2014); Kumamoto et al. (2015a); Kumamoto et al. (2015b); Ramzaev et al. (2014); Smith et al. (2014).

Subarctic Gyre�
Oyash
io�
Kuroshio�
Subtropical Gyre�
California�
Alaska�
STMW�
CMW�
North Pacific�Bering Sea�
North Equatorial�
FNPP�
(a)�
Southward intrusion with mode water

Kaeriyama et al. (2016)
Southward intrusion with mode water
Subtropical mode water: 25.0–25.6 σθ Central mode water: 26.0–26.6 σθ

Kaeriyama et al. (2016)
Source Direct releaseAtmosphericdeposition onocean surface
Reference
Fukushima accident 2.8 - 4.2 12 - 15 Aoyama et al (submitted)12 - 42 Bailly du Bois et al. (2012)11 - 16 Charette et al (2013)
2.3 Dietze and Kriest (2012)2.9 - 4.3 Tsumune et al (2013)
4 5 Kawamura et al (2011)4.1 -4.5 5.7 - 5.9 Estounel et al. (2012)
3.5 7.6 Kobayashi et al. (2012)Global fallout Buesseler (2014)*
Close-in fallout Buesseler (2014)*������������� �������
7628
Kaeriyama (in press)
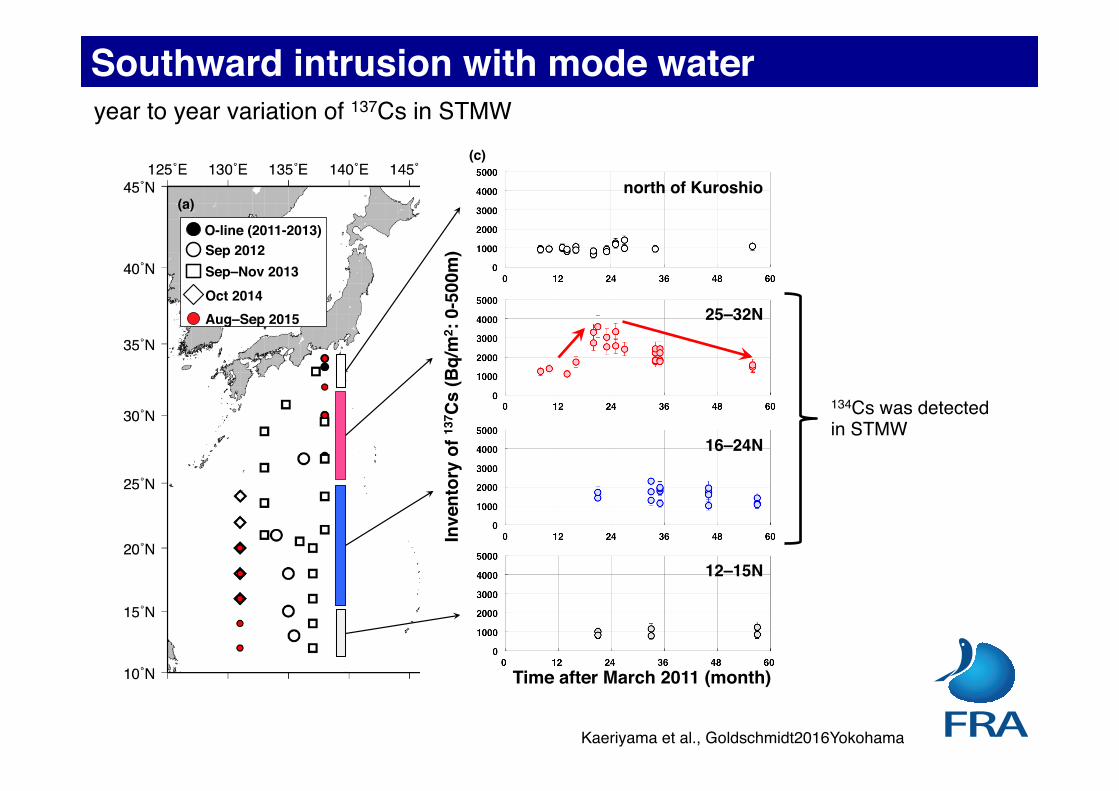
Total amount of Fukshima-derived 137Cs: 15–20 PBq137Cs in STMW in Oct–Nov 2012: 4.2 PBq
Southward intrusion with mode waterSource term estimation of Fukushima-derived radiocesium (134Cs or 137Cs)
Inve
ntor
y of
137 C
s (B
q/m
2 : 0-
500m
)�
Time after March 2011 (month)�
north of Kuroshio�
25–32N�
16–24N�
12–15N�
(a)�
(c)�
O-line (2011-2013)�Sep 2012�Sep–Nov 2013�Oct 2014�Aug–Sep 2015�
Kaeriyama et al., Goldschmidt2016Yokohama
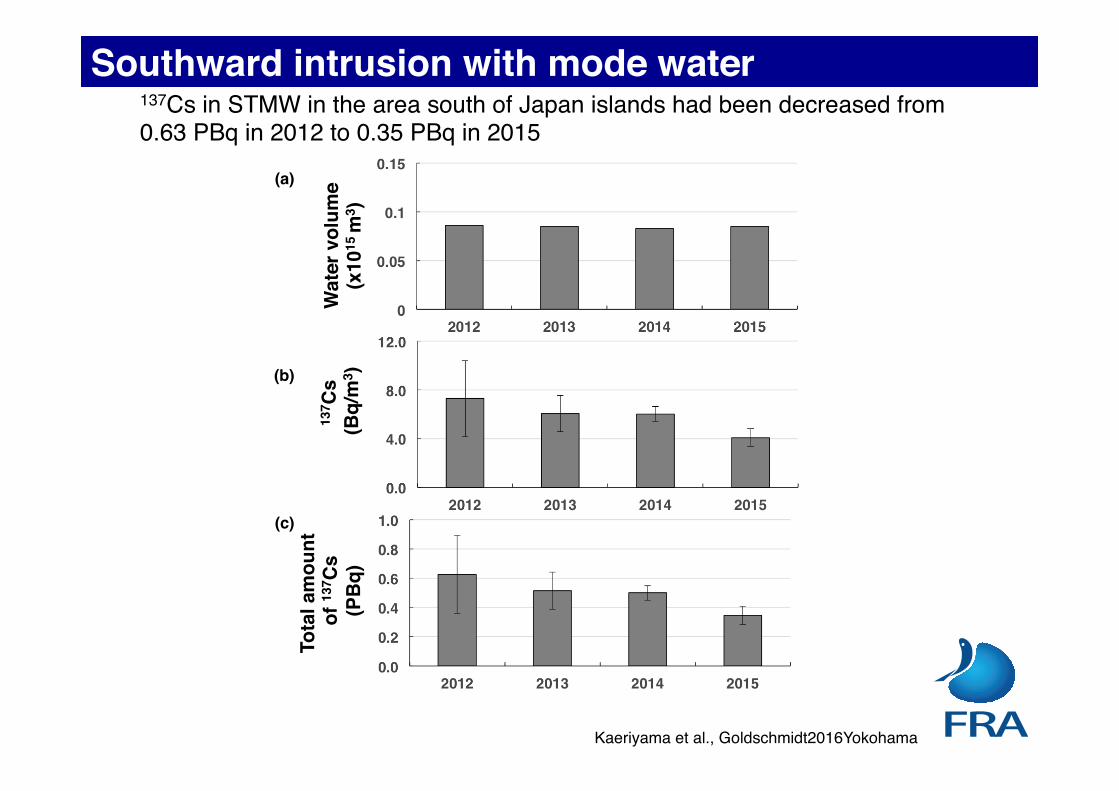
year to year variation of 137Cs in STMW
Southward intrusion with mode water
134Cs was detected in STMW
137 C
s (B
q/m
3 )�W
ater
vol
ume
(x10
15 m
3 )�
Tota
l am
ount
of 1
37C
s (P
Bq)�
(a)�
(b)�
(c)�
Kaeriyama et al., Goldschmidt2016Yokohama
137Cs in STMW in the area south of Japan islands had been decreased from 0.63 PBq in 2012 to 0.35 PBq in 2015
Southward intrusion with mode water

Acknowledgments We thank crew and staff of the research vesselsfor their help during onboard sample collection. This work was par-tially supported by a Grant-in-Aid for Scientific Research on Inno-vative Areas from the Ministry of Education, Culture, Sports, Scienceand Technology of Japan (KAKENHI), Interdisciplinary Study onEnvironmental Transfer of Radionuclides from the Fukushima Dai-ichi NPP Accident (#24110004).
Open Access This article is distributed under the terms of theCreative Commons Attribution 4.0 International License (http://creativecommons.org/licenses/by/4.0/), which permits unrestricted use,distribution, and reproduction in any medium, provided you giveappropriate credit to the original author(s) and the source, provide alink to the Creative Commons license, and indicate if changes weremade.
References
1. Prime Minister of Japan and His Cabinet, Report of JapaneseGovernment to the IAEA Ministerial Conference on NuclearSafety—The Accident at TEPCO’s Fukushima Nuclear PowerStations (2016). http://www.kantei.go.jp/foreign/kan/topics/201106/iaea_houkokusho_e.html. Accessed 14 June 2016
2. Yoshida N, Kanda J (2012) Tracking the Fukushima radionu-clides. Science 336:1115–1116
3. Saito K, Tanihata I, Fujiwara M, Saito T, Shimoura S, Otsuka T,Onda Y, Hoshi M, Ikeuchi Y, Takahashi F, Kinouchi N, SaegusaJ, Seki A, Takemiya H, Shibata T (2015) Detailed depositiondensity maps constructed by large-scale soil sampling for
gamma-ray emitting radioactive nuclides from the FukushimaDai-ichi nuclear power plant accident. J Environ Radioact129:308–319
4. Morino Y, Ohara T, Watanabe M, Hayashi S, Nishizawa M(2013) Episode analysis of deposition of radiocesium from theFukushima Daiichi nuclear power plant accident. Environ SciTechnol 47:2314–2322
5. Chino M, Nakayama H, Nagai H, Terada H, Katata G, YamazawaH (2011) Preliminary estimation of release amounts of 131I and137Cs accidentally discharged from the Fukushima Daiichinuclear power plant into the atmosphere. J Nucl Sci Technol48:1129–1134
6. Estournel C, Bosc E, Bocquet M, Ulses C, Marsaleix P, WiniarekV, Osvath I, Nguyen C, Duhaut T, Lyard F, Michaud H, Auclair F(2012) Assessment of the amount of cesium-137 released into thePacific Ocean after the Fukushima accident and analysis of itsdispersion in Japanese coastal waters. J Geophys Res. doi:10.1029/2012JC007933
7. Hirao S, Yamazawa H, Nagae T (2013) Estimation of release rateof iodine-131 and cesium-137 from the Fukushima Daiichinuclear power plant. J Nucl Sci Technol 50:139–147
8. Kawamura H, Kobayashi T, Furuno A, In T, Ishikawa Y,Nakayama T, Shima S, Awaji T (2011) Preliminary numericalexperiments on oceanic dispersion of 131I and 137Cs dischargedinto the ocean because of the Fukushima Daiichi nuclear powerplant disaster. J Nucl Sci Technol 48:1349–1356
9. Nagai H, Katata G, Terada H, Chino M (2014) The Fukushimareactor accident generated a large data set of global particularlyin a comprehensive nuclear-test-ban treaty (CTBT) context. In:Takahashi S (ed) Radiation monitoring and dose estimation of theFukushima nuclear accident. Springer, Tokyo
10. Saunier O, Mathieu A, Didier D, Tombette M, Quelo D, WiniarekV, Bocquet M (2013) An inverse modeling method to assess thesource term of the Fukushima nuclear power plant accident usinggamma dose rate observations. Atmos Chem Phys13:11403–11421
11. Stohl A, Seibert P, Wotawa G, Arnold D, Burkhart JF, EckhardtS, Tapia C, Vargas A, Yasunari TJ (2012) Xenon-133 and cae-sium-137 releases into the atmosphere from the Fukushima Dai-ichi nuclear power plant: determination of the source term,atmospheric dispersion, and deposition. Atmos Chem Phys12:2313–2343
12. Winiarek V, Bocquet M, Duhanyan N, Roustan Y, Saunier O,Mathieu A (2014) Estimation of the caesium-137 source termfrom the Fukushima Daiichi nuclear power plant using a con-sistent joint assimilation of air concentration and depositionobservations. Atmos Environ 82:268–279
13. Aoyama M, Uematsu M, Tsumune D, Hamajima Y (2013) Sur-face pathway of radioactive plume of TEPCO Fukushima NPP1released 134Cs and 137Cs. Biogeosciences 10:3067–3078
14. Aoyama M, Kajino M, Tanaka TY, Sekiyama TT, Tsumune D,Tsubono T, Hamajima Y, Inomata Y, Gamo T (2016) 134Cs and137Cs in the North Pacific Ocean derived from the March 2011TEPCO Fukushima Dai-ichi nuclear power plant accident, Japan.Part two: estimation of 134Cs and 137Cs inventories in the NorthPacific Ocean. J Oceanogr 72:67–76
15. Kobayashi T, Nagai H, Chino M, Kawamura H (2013) Sourceterm estimation of atmospheric release due to the Fukushima Dai-ichi nuclear power plant accident by atmospheric and oceanicdispersion simulations. J Nucl Sci Technol 50:255–264
16. Katata G, Chino M, Kobayashi T, Terada H, Ota M, Nagai H,Kajino M, Draxler R, Hort MC, Malo A, Torii T, Sanada Y(2015) Detailed source term estimation of the atmospheric releasefor the Fukushima Daiichi Nuclear Power Station accident bycoupling simulations of an atmospheric dispersion model with an
Fig. 6 A schematic view of spreading of the Fukushima-derivedradiocesium in the North Pacific Ocean by 2014. Thick arrowsindicate pathways in surface mixed layer in the transition zone andsubarctic area. A thick broken arrow is a speculated direction insubsurface layer of the central mode water (CMW, 26.0–26.6 rh).Thin arrows show spreading directions in subsurface layer of thesubtropical mode water (STMW, 25.0–25.6 rh). An open areaindicates approximate distribution of STMW derived from vorticity[44]. Shaded areas of ‘‘C’’ and ‘‘S’’ are formation areas of CMW andSTMW, respectively [45]. Small arrows in the STMW area indicateobserved southern/western edges of Fukushima-derived radiocesiumspreading in the density layer of STMW [29, 30, 32, 41]. Dotted linesshow surface water currents. The map in this figure were drawn usingOcean Data View software [43]
J Radioanal Nucl Chem
123
Kumamoto et al. (2016): J. Radioanal. Nucl. Chem. The updated schematic view of FNPP-derived radio active cesium in mode waters
Southward intrusion with mode water

Oyashio�
Kuroshio�
Kuroshio Extension�Tsushima
Current�FNPP�
Sanriku�
Okhotsk Sea�
North Pacific�
Japan Sea�
Sendai Bay�
(b)�
Hasaki�
Sendai Bay�
Onahama�
Iwasawa�
T1�
T12�T18�
FNPP�
off F
ukus
him
a�
(a)�
coastal area off the FNPP

Hasaki�
Sendai Bay�
Onahama�
Iwasawa�
T1�
T12�T18�
FNPP�13
7 Cs
(Bq/
m3 )�
Days from 1st Jan 2011�
off F
ukus
him
a�
Background level(< 2.0 Bq/m3)�
(a)� (b)�
107�
106�
105�
104�
103�
102�
101�
100�
108�
Kaeriyama (in press)
coastal area off the FNPP
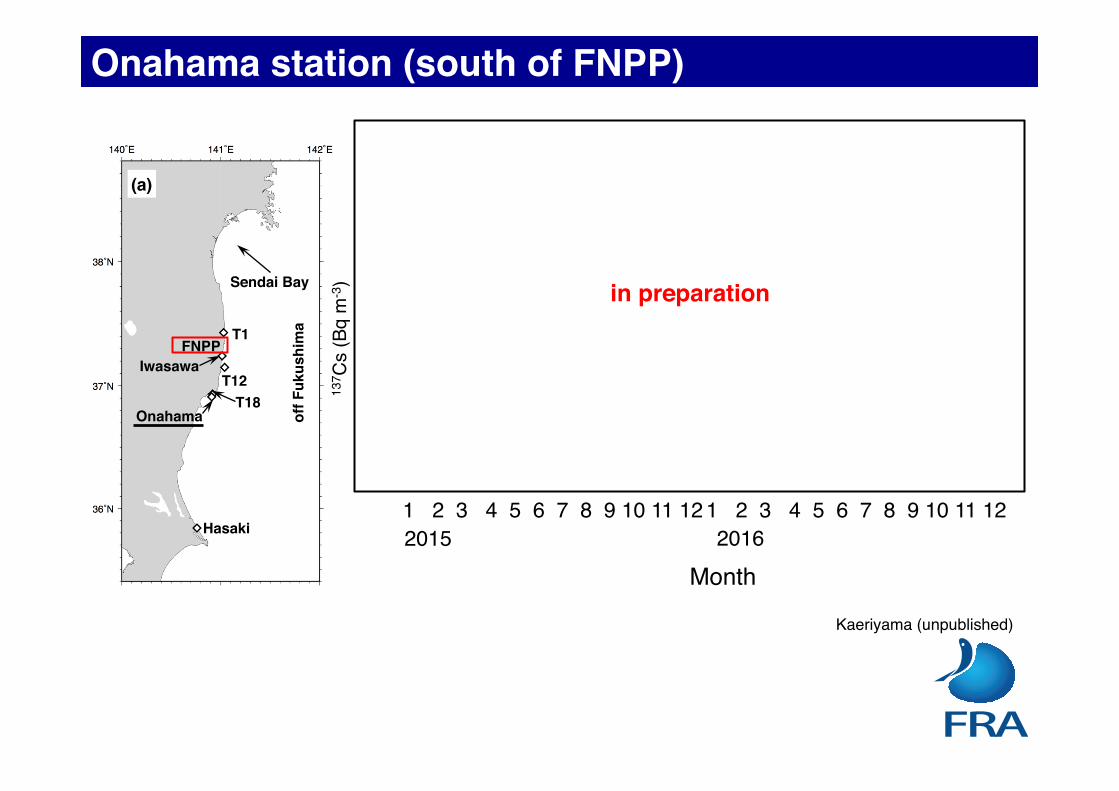
in preparation
Kaeriyama (unpublished)
Hasaki�
Sendai Bay�
Onahama�
Iwasawa�
T1�
T12�T18�
FNPP�
off F
ukus
him
a�
(a)�
2015 2016
Onahama station (south of FNPP)
137 C
s (B
q m
-3)
1 2 3 4 5 6 7 8 9 10 11 12 1 2 3 4 5 6 7 8 9 10 11 12
Month

updated from Kaeriyama et al. (2015)
Hasaki�
Sendai Bay�
Onahama�
Iwasawa�
T1�
T12�T18�
FNPP�
off F
ukus
him
a�(a)�
Days from 2011/3/11
137 C
s (B
q/m
3 )
Sendai Bay (north of FNPP)
調査 ー 年
度 度
タ ン 調査 放射性セ 行 水平
行
!!
調査
調査 ンター
水 !
調査
度
調査
度平
平
明
16
137 C
s (B
q/m
3 )

Possible continuous source of radioactive Cs from land through river
2014). It is thought therefore, that the peak in 137Cs concentrationsoff the Abukuma River Estuary reported by Hirao et al. (2014) re-flects deposition and accumulation of radioactive cesium that wastransported to the estuary zone by the river.
To evaluate the influence of any substance on the environment,including radioactive materials, its dynamics must be thoroughlyunderstood. However, even though various studies have beenconducted since the tsunami disaster, including examinations ofwater quality and radioactivity, the dynamics of radioactive sub-stances in the Abukuma River Estuary remain poorly understood(e.g., Kakehi et al., 2012; Kaeriyama et al., 2015; Kakehi et al., 2015).Dilution by seawater is a conservative process that changes theconcentrations of the substances discharged from the river. How-ever, in estuaries, where there is a sudden increase in salinity,substances may also be influenced by non-conservative processessuch as flocculation, adsorption, release, and desorption (e.g.,Sholkovitz, 1976, 1978; Edmond et al., 1985; Burban et al., 1989).Takata et al. (2015) demonstrated experimentally that 137Cs wasdesorbed from riverine particles when they were mixed withseawater. Mixing diagrams, which plot target substances andsalinity, can be used to determine whether the dominant process isconservative or non-conservative (Liss, 1976; Kemp and Boynton,1984). In the present study, we used a mixing diagram obtainedfrom hydrographic observations in the Abukama River Estuary toexamine both types of processes for radioactive cesium dynamics.
2. Materials and methods
2.1. Hydrographic observations
Hydrographic observations were conducted on 22 August 2013and 5 July 2014 in the Abukuma Estuary (Table 1). In 2013, samplingstations were established in the river at intervals of approximately0.8 km and in the sea at intervals of between 1.5 and 4 km (Fig. 2a).Samples were mainly collected in the vicinity of the river mouth in2014 (Fig. 2b and c). Temperature and salinity in the water columnwere measured with a water quality sensor (AAQ!1186; JFEAdvantech, Hyogo, Japan). Water samples for salinity and radioac-tive cesium analysis were collected at depth of 1 m at all stationswith a 6 LVan Dornwater sampler. At station 10, samples were alsocollected at depths of 20 m (half the water depth) and 38 m (2 mabove the bottom). In 2014, three water samples were collected at a
depth of 1 m at station R6 in the river and station C5 in the sea forsuspended substance (SS) analysis. Bottom sediment samples werecollected at all stations in 2013 with an Ekman-Birge sedimentsampler (Rigo-sha) that had a sampling area of 0.04 m2.
Current measurement data were collected onboard a fishingboat equipped with an Acoustic Doppler Current Profiler (ADCP;Workhorse Sentinel 600 kHz; Teledyne RD Instruments) on 22August 2013. The boat traversed repeatedly between stations SE4and SE9 from sunrise to sunset. The boat speed was reduced to<1 m s!1 at sampling stations, and the vertical current distributionwas measured in depth increments of 1 m from 2 m below thesurface to 2 m above the bottom for 2e10 min. Current measure-ments were not recorded between stations when the boat wastraveling at full speed. Current datawere recorded by ADCP eight ornine times in a 12-h period.
2.2. Analytical methods
Salinity was measured with a salinometer (AUTOSAL 8400B;Guildline Instruments). The salinity values from the AAQ werecalibrated with those obtained by the salinometer. Beforemeasuring the SS concentrations, samples of river water andseawater (0.8 and 11.5 L, respectively) were filtered through pre-weighed 47 mm Whatman GF/F glass fiber filters. After filtration,the filters were rapidly rinsed with MiliQ® water to eliminate salt.The filters were dried for a few days in a desiccator with silica gel atroom temperature. The SS concentrations were determined as thedifference between the weight of the filter before and after filtra-tion. The average and standard deviations of the SS concentrationswere calculated from the three samples collected at each station.
We measured dissolved and particulate radioactive cesiumconcentrations per liter of water (mBq L!1) as follows. We collected
Fig. 1. Locations of the Abukuma River and the observation area (rectangle) shown inFig. 2. The closed square, closed circle, and open circle indicate the Fukushima Dai-ichiNuclear Power Plant (FDNPP), the tide gauge station of Sendai Port, and the meteo-rological station (AMeDAS) of Fukushima city, respectively.
Table 1Summary of sampling station and date.
Station Latitude Longitude Date (year/month/day)
RE1 38" 5.7540 140" 52.2870 2013/8/22RE2 38" 5.7970 140" 52.8360 2013/8/22RE3 38" 5.6900 140" 53.2690 2013/8/22RE4 38" 5.2070 140" 53.9610 2013/8/22RE5 38" 4.8670 140" 54.3150 2013/8/22RE6 38" 4.3530 140" 54.6290 2013/8/22RE7 38" 3.8060 140" 54.4720 2013/8/22RE8 38" 3.3420 140" 54.3480 2013/8/22RE9 38" 3.1120 140" 54.6740 2013/8/22RE10 38" 3.0040 140" 54.9420 2013/8/22SE1 38" 2.8660 140" 55.9220 2013/8/22SE2 38" 2.8630 140" 56.8200 2013/8/22SE3 38" 2.8660 140" 57.8210 2013/8/22SE4 38" 2.8710 140" 58.8120 2013/8/22SE5 38" 2.8660 141" 0.8150 2013/8/22SE6 38" 2.8720 141" 2.8090 2013/8/22SE7 38" 2.8720 141" 4.8070 2013/8/22SE8 38" 2.8700 141" 6.8050 2013/8/22SE9 38" 2.8570 141" 9.8190 2013/8/22SE10 38" 2.8700 141" 12.8200 2013/8/22C5 38" 1.8300 141" 4.9800 2014/6/28R1 38" 3.2900 140" 54.2700 2014/7/5R2 38" 3.1370 140" 54.7080 2014/7/5R3 38" 3.0570 140" 54.9730 2014/7/5R4 38" 3.0420 140" 54.9010 2014/7/5R5 38" 3.0390 140" 54.8970 2014/7/5R6 38" 5.7850 140" 52.6180 2014/7/5RE6 38" 4.3460 140" 54.6240 2014/7/5RE8 38" 3.3020 140" 54.2750 2014/7/5S1 38" 2.8760 140" 55.8060 2014/7/5S2 38" 2.8900 140" 55.8880 2014/7/5S3 38" 3.0310 140" 55.7110 2014/7/5S4 38" 3.1070 140" 55.7860 2014/7/5
S. Kakehi et al. / Journal of Environmental Radioactivity 153 (2016) 1e92
2014 were significantly different from those in 2013 (P < 0.01).Average SS concentrations and standard deviations in the river andsea were 35.33 ± 1.36 mg L!1 and 0.47 ± 0.04 mg L!1, respectively.We collected samples for SS, but not radioactive cesium analysis, atstation R6. Therefore, we used the average particulate 137Cs con-centrations for salinities <0.1 and estimated that the concentrationof 137Cs per mg of dried SS in the river was 3.07 ± 1.63 mBq mg!1.Because the particulate 137Cs concentration at station C5, the seasampling station for SS, was lower than the detection limit of0.98 mBq L!1, the 137Cs concentration per mg of dried SS in the seawas estimated to be < 2.1 mBq mg!1.
3.2. Radioactive cesium concentrations in sediment
The 137Cs concentration in bottom sediment was highest(2960 Bq kg!1) at station RE6 (Fig. 7, Table 3); this station was at abend in the river, and the bottom sediment was mainly mud. The137Cs concentrationwas also relatively high (456 Bq kg!1) at stationRE8, where the sediment was also mainly mud. The 137Cs concen-trations were relatively low (40e125 Bq kg!1) in sandy sedimentsat other river stations. The 137Cs concentrations in the marinesediments within 8 km from the river mouth were relatively high(217e2440 Bq kg!1). The second-highest concentration(2440 Bq kg!1) in all sediment samples in this study was detectedat station SE1, the station in the sea that was closest to the rivermouth. The 137Cs concentrations in sea sediments obtained fromoffshore regions more than 8 km from the river mouth(6e14 Bq kg!1) were the lowest in the study area.
The 137Cs distribution coefficients (Kd; IAEA, 2004) for 2013were estimated from the observed dissolved and sediment 137Csconcentrations. The Kd values ranged from 2.5 " 103 to 2.2 " 105 in
the river. The Kd value in the sea was highest at station SE1(3.1 " 105); values gradually decreased in an offshore direction andthe value was lowest (0.9 " 103) at station SE10.
Fig. 4. Distributions of 137Cs concentrations in water obtained in (a) 2013 and (b) 2014along the estuary. The black and red symbols indicate dissolved and particulate forms,respectively. The circles, cross and square represent the same features as in Fig. 3.When the concentrations of the samples were less than the detection limit, we usedthe detection limit for the concentration of the sample.
Fig. 5. Mixing diagrams of (a) dissolved and (b) particulate 137Cs obtained in 2013(black) and 2014 (red), respectively. The circles, cross, and square represent the samefeatures as in Fig. 3.
Fig. 6. Mixing diagram of the abundance ratio of dissolved 137Cs obtained in 2013(black) and 2014 (red). Open circles indicate samples obtained from at surface. Thecircles, cross, and square represent the same features as in Fig. 3.
S. Kakehi et al. / Journal of Environmental Radioactivity 153 (2016) 1e9 5
Kakehi et al. (2016)
Future perspective (river input)
desorption from particle
dilution curve
Salinity
Dis
solv
ed 13
7 Cs
(Bq/
m3 )
Results of 2014 observation
Dis
solv
ed 13
7 Cs
(Bq/
m3 )
Salinity
dilution curve
20132014

Conclusion
Oceanic dispersion of Fukushima-derived radiocesium had been well documented during five years from the accident
key features1. eastward dispersion in surface water north area of Kuroshio Extension2. subsurface intrusion with mode waters
Future perspective: the destination of Fukushima-derived radiocesium in mode waters
Coastal area off FukushimaThe concentration of 137Cs are still higher than those before accident has been declining, but continuous monitoring should be done
Future perspective: Small but continuous input of Fukushima-derived radiocesium through river should be continuously studied, such as how many, dissolved and/or particulate, bioavailable particulate, and so on.

ReferencesKaeriyama, H., et al. (2013) Direct observation of 134Cs and 137Cs in surface seawater in the western and
central North Pacific after the Fukushima Dai-ichi nuclear power plant accident. Biogeosciences, 10, 4287–4295.
Kaeriyama, H., et al. (2014) Southwest intrusion of 134Cs and 137Cs derived from the Fukushima Dai-ichi nuclear power plant accident in the western North Pacific. Environ. Sci. Technol., 48, 3120–3127.
Kaeriyama, H., et al. (2015) 134Cs and 137Cs in seawater around Japan after the Fukushima Daiichi Nuclear Power Plant accident. Umi no Kenkyu, 23, 127–146 (in Japanese with English abstract).
Kaeriyama, H., et al. (2015) Fukushima-derived 134Cs and 137Cs in zooplankton and seawater samples collected off the Joban–Sanriku coast, in Sendai Bay, and the Oyashio region. Fish. Sci., 81, 139–153.
Kaeriyama, H. (2015) 2. 134Cs and 137Cs in the seawater around Japan and in the North Pacific. In: Nakata, K. and Sugisaki, H. (eds) Impacts of the Fukushima Nuclear Accident on Fish and Fishing grounds. Springer Japan, Tokyo, pp. 11–32.
Kakehi, S., et al. (2016) Radioactive cesium dynamics derived from hydrographic observations in the Abukuma River Estuary, Japan. J. Environ. Radioact., 153, 1–9.
Kaeriyama, H., et al. (2016) Intrusion of Fukushima-derived radiocaesium into subsurface water duet to formation of mode waters in the North Pacific. Sci. Rep., 6, 22010.
Kaeriyama, H. (in press) Oceanic dispersion of Fukushima-derived radioactive cesium: a review. Fish. Oceanogr.
Thank you for your attention