Five repositories, one dataset
50
Five Repositories, One Dataset USING EXPLORATORY DATA ANALYSIS TECHNIQUES TO TRACK PATTERNS OF USE
-
Upload
mark-custer -
Category
Education
-
view
321 -
download
0
Transcript of Five repositories, one dataset
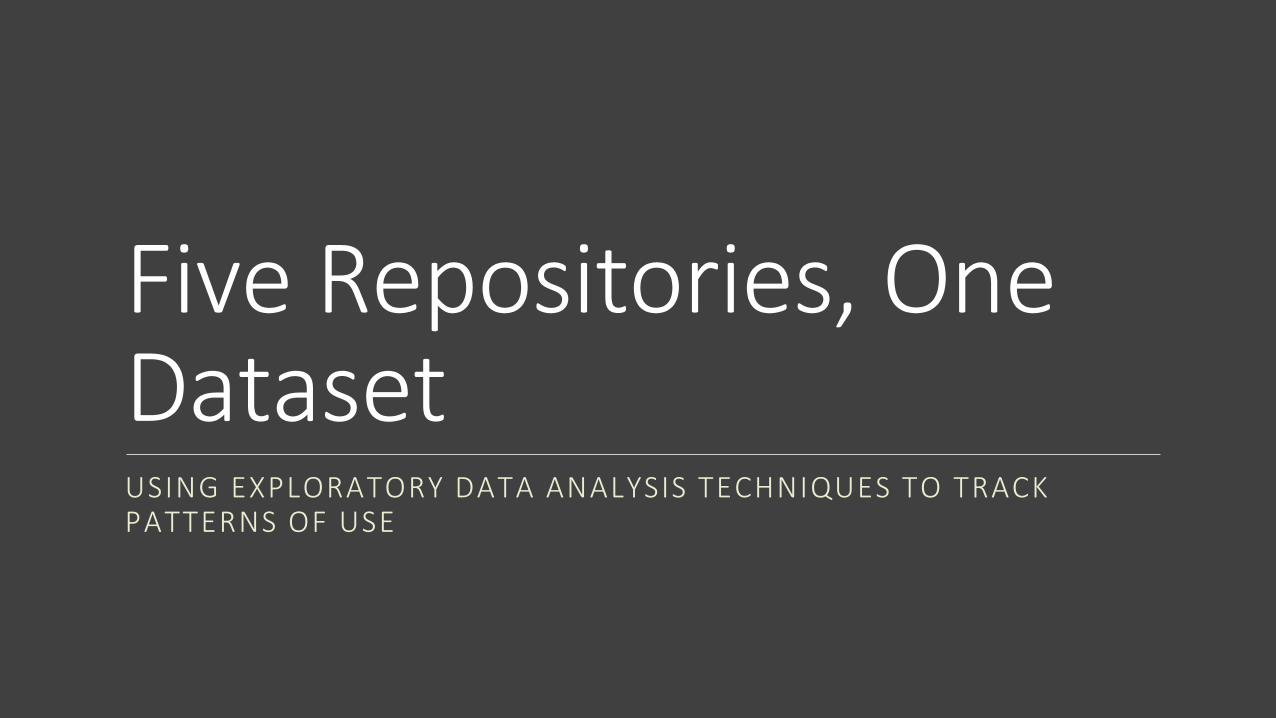
Five Repositories, One DatasetUSING EXPLORATORY DATA ANALYSIS TECHNIQUES TO TRACK PATTERNS OF USE

Mark CusterNoah HuffmanJennie Levine KniesKyle RimkusSara Snyder
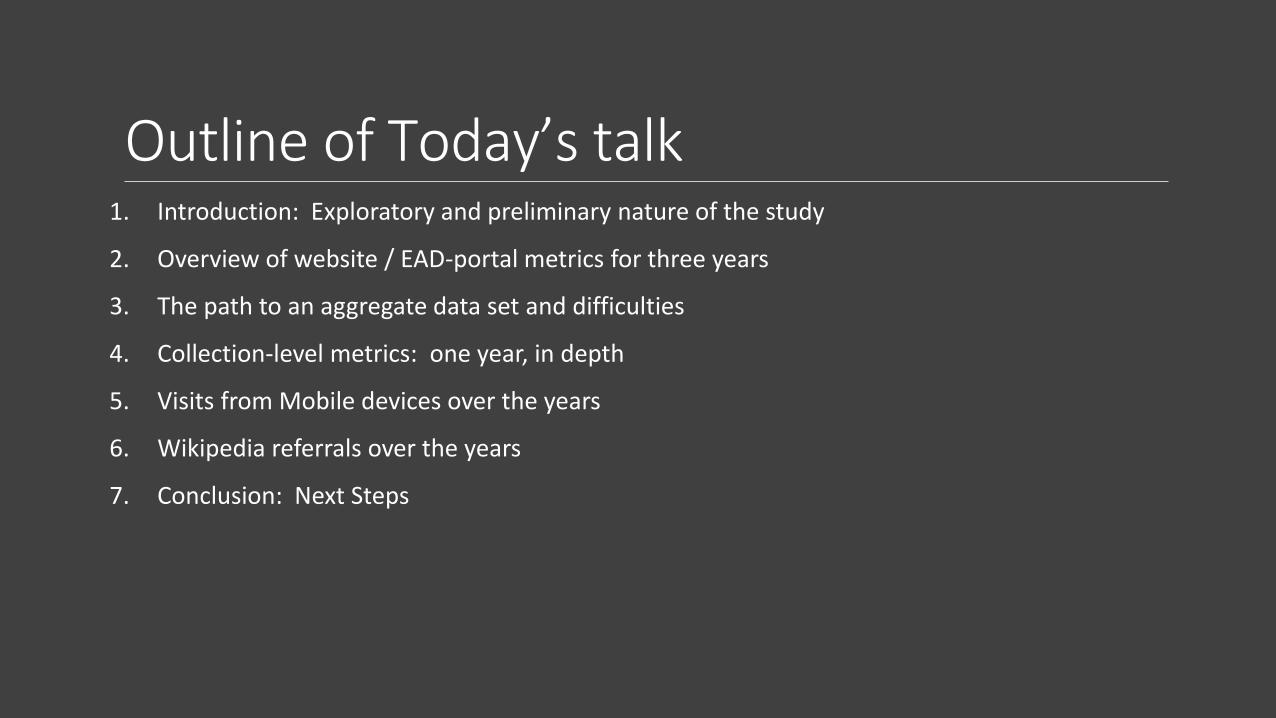
Outline of Today’s talk1. Introduction: Exploratory and preliminary nature of the study
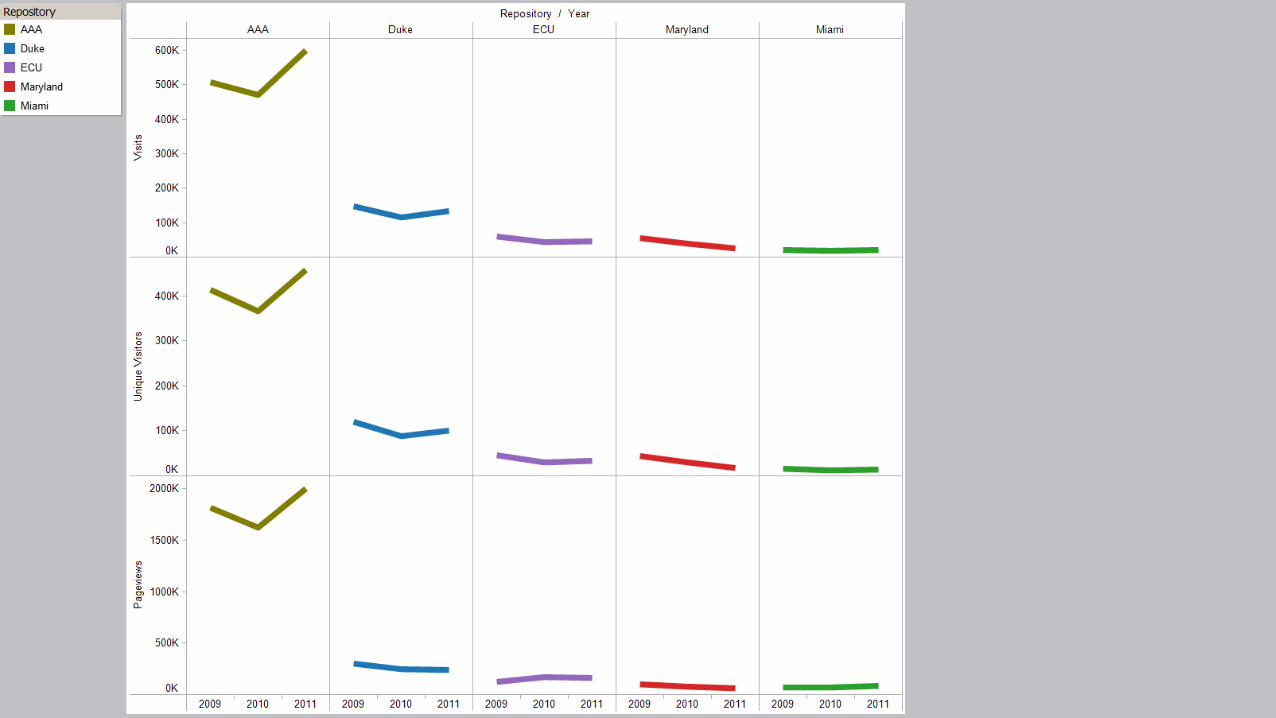
2. Overview of website / EAD-portal metrics for three years
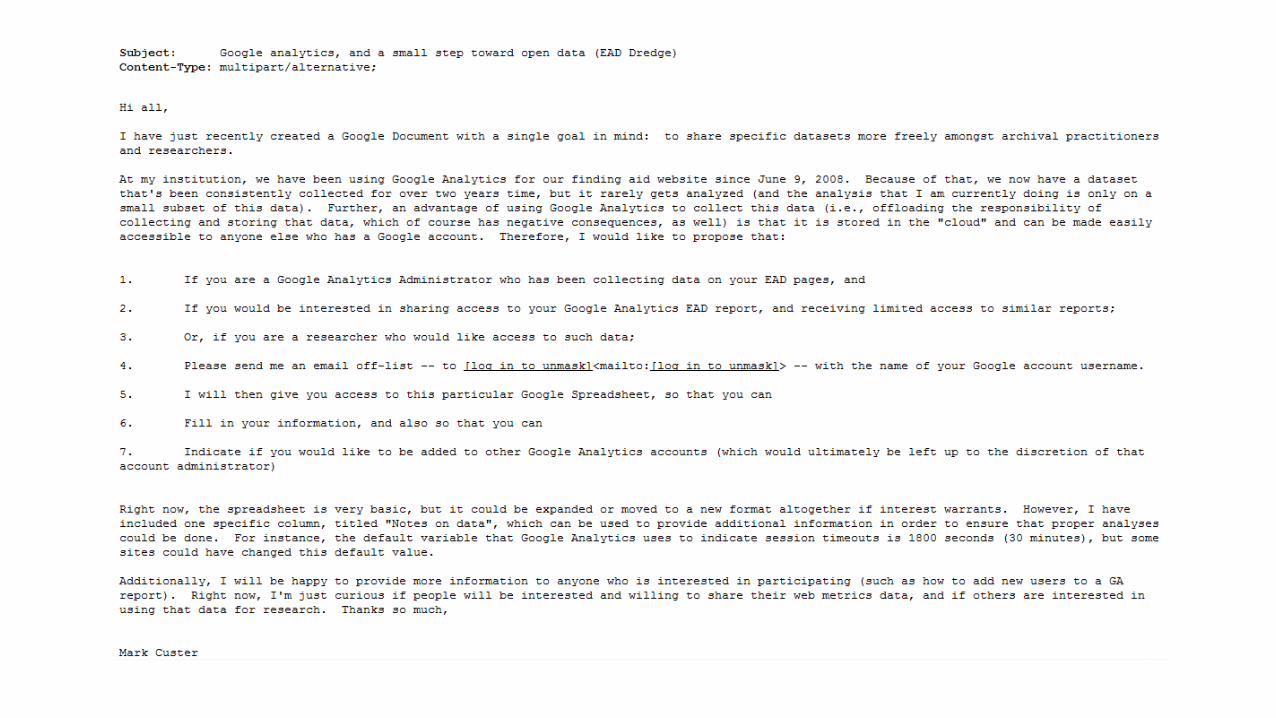
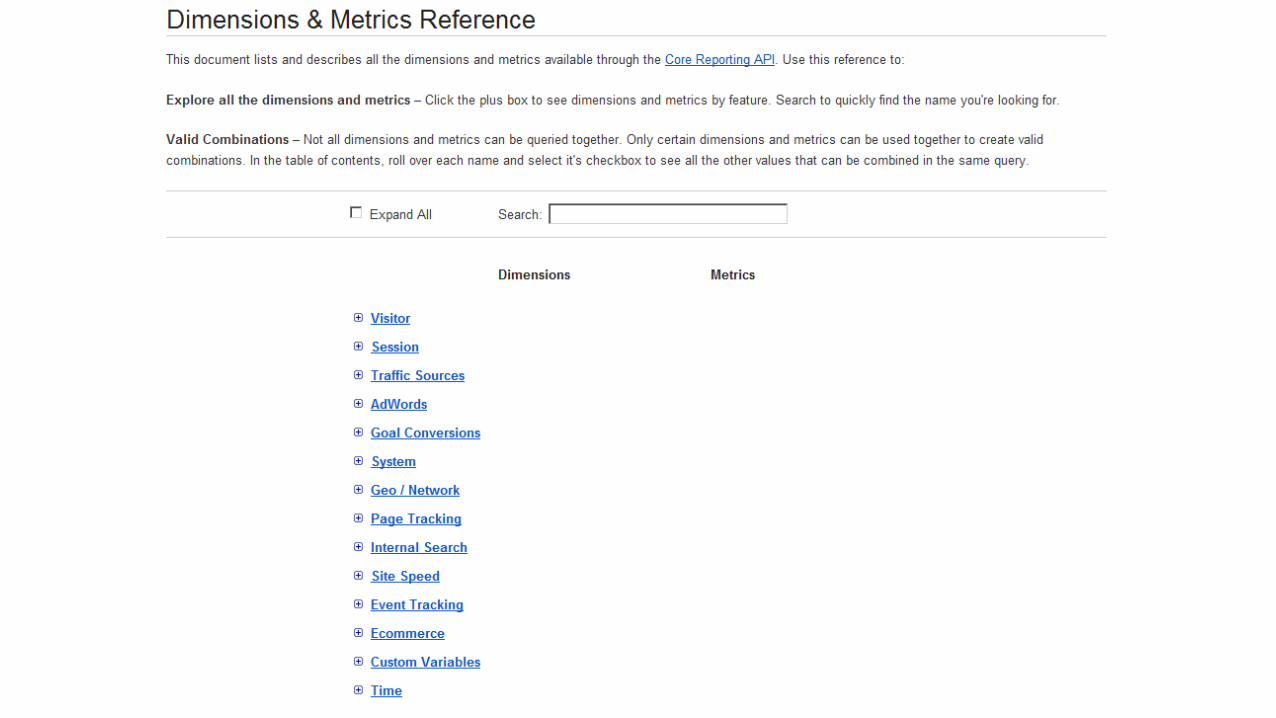
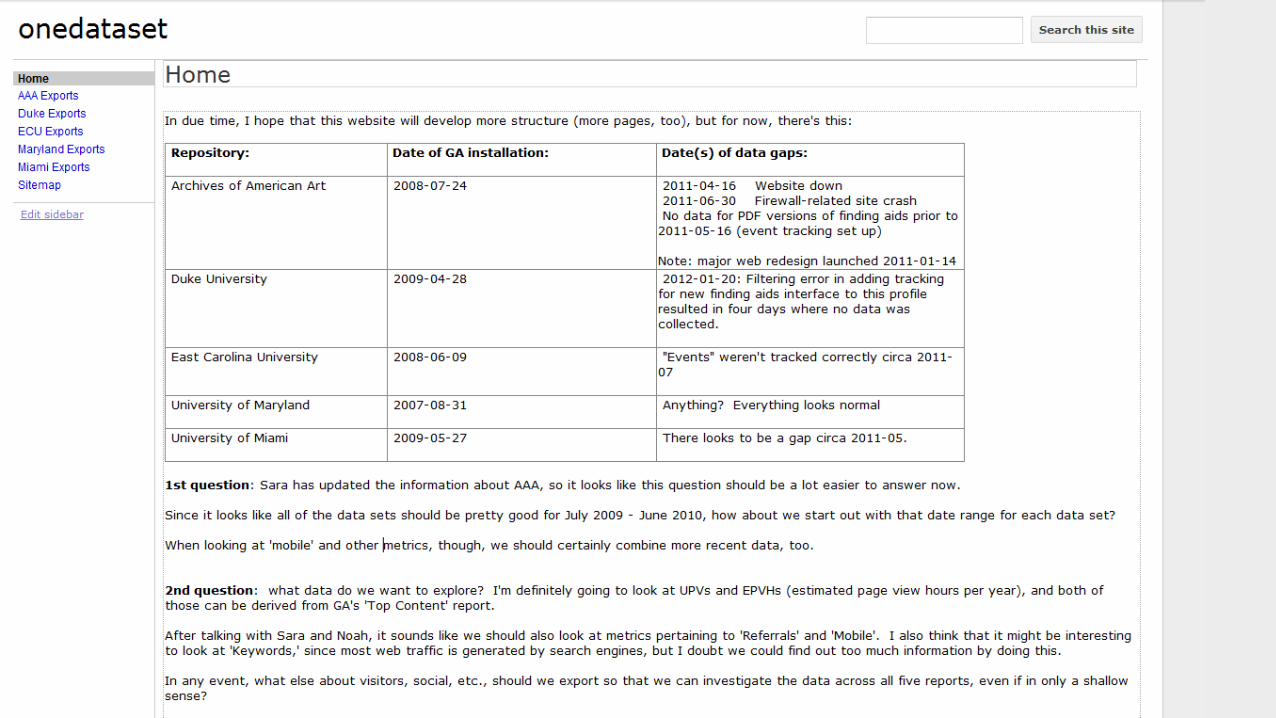
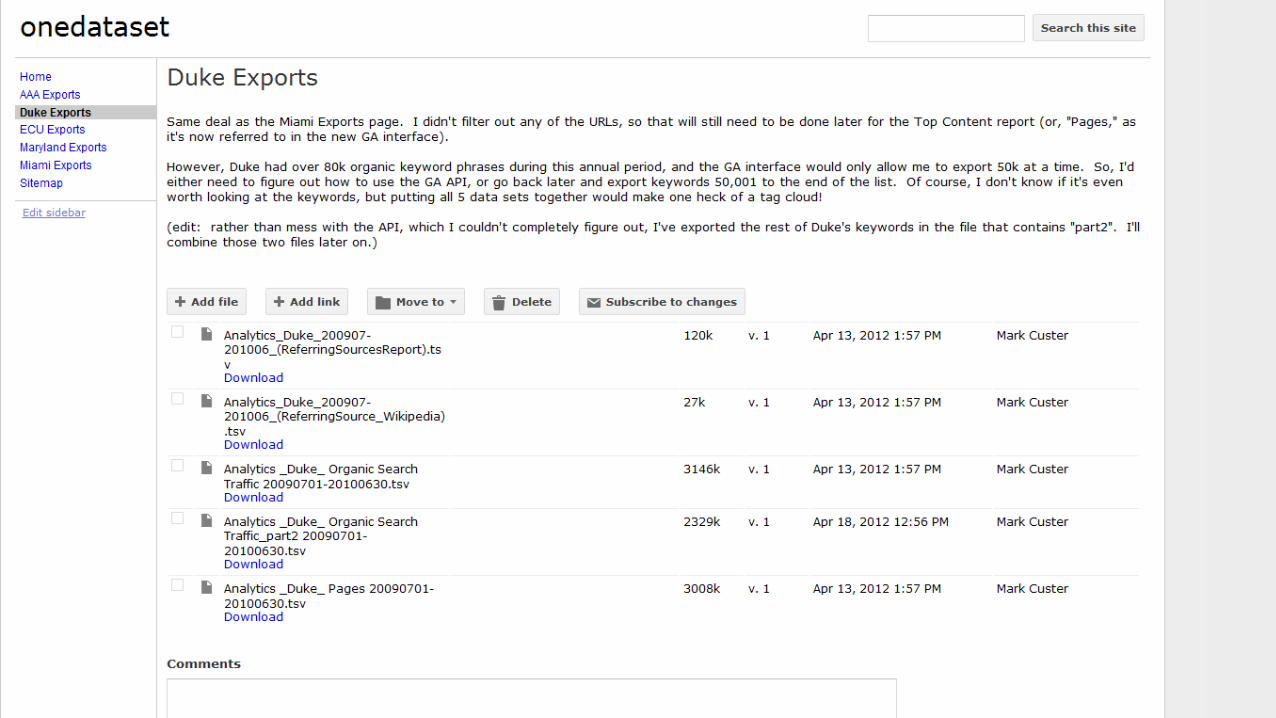
3. The path to an aggregate data set and difficulties
4. Collection-level metrics: one year, in depth
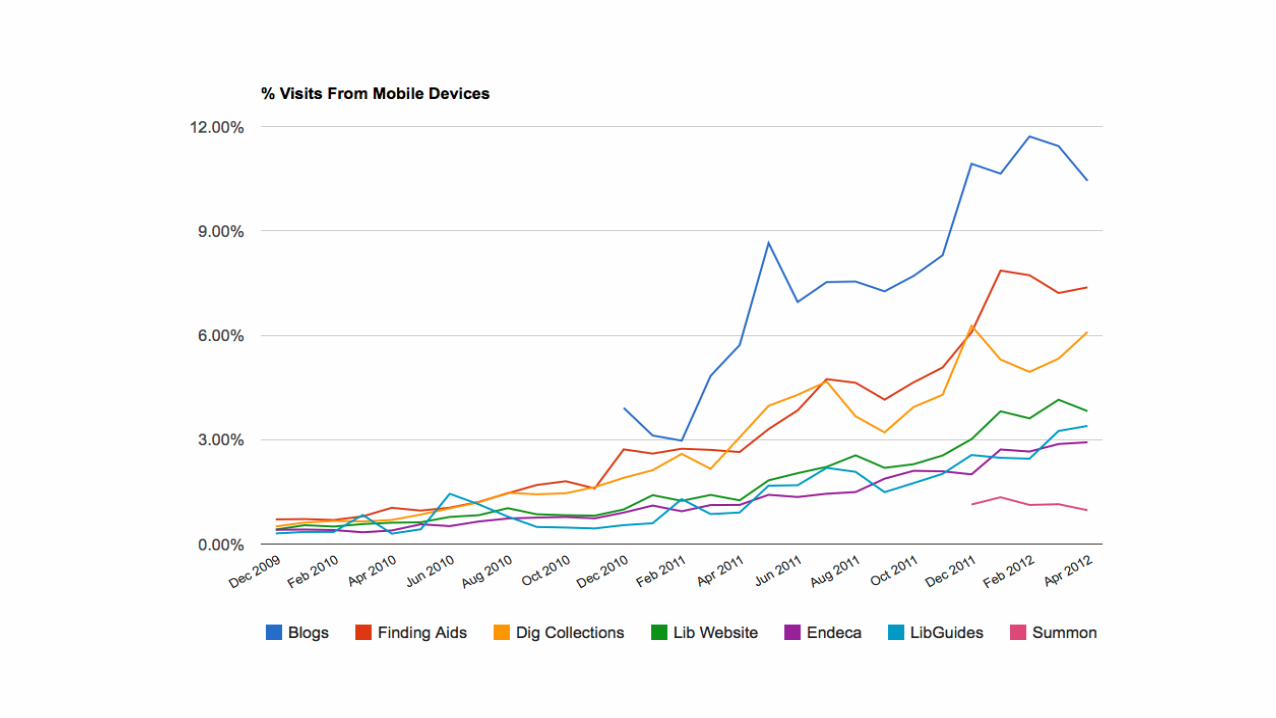
5. Visits from Mobile devices over the years
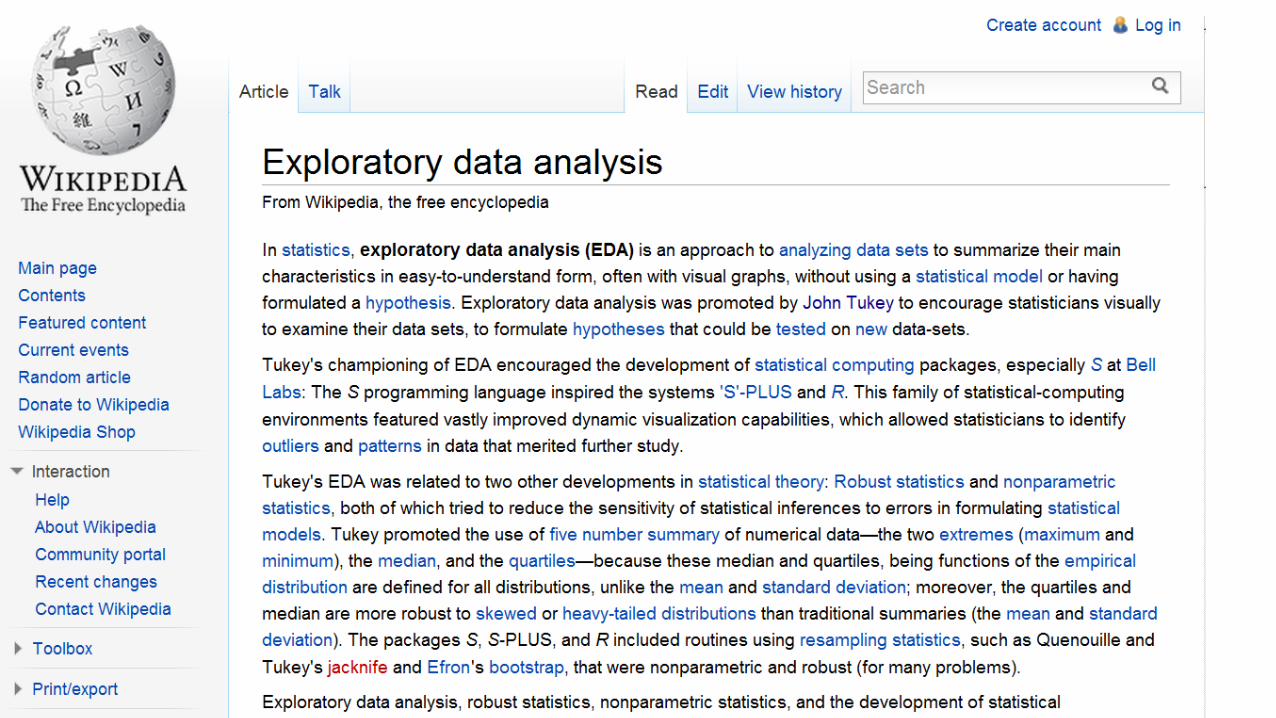
6. Wikipedia referrals over the years
7. Conclusion: Next Steps

1: Introduction

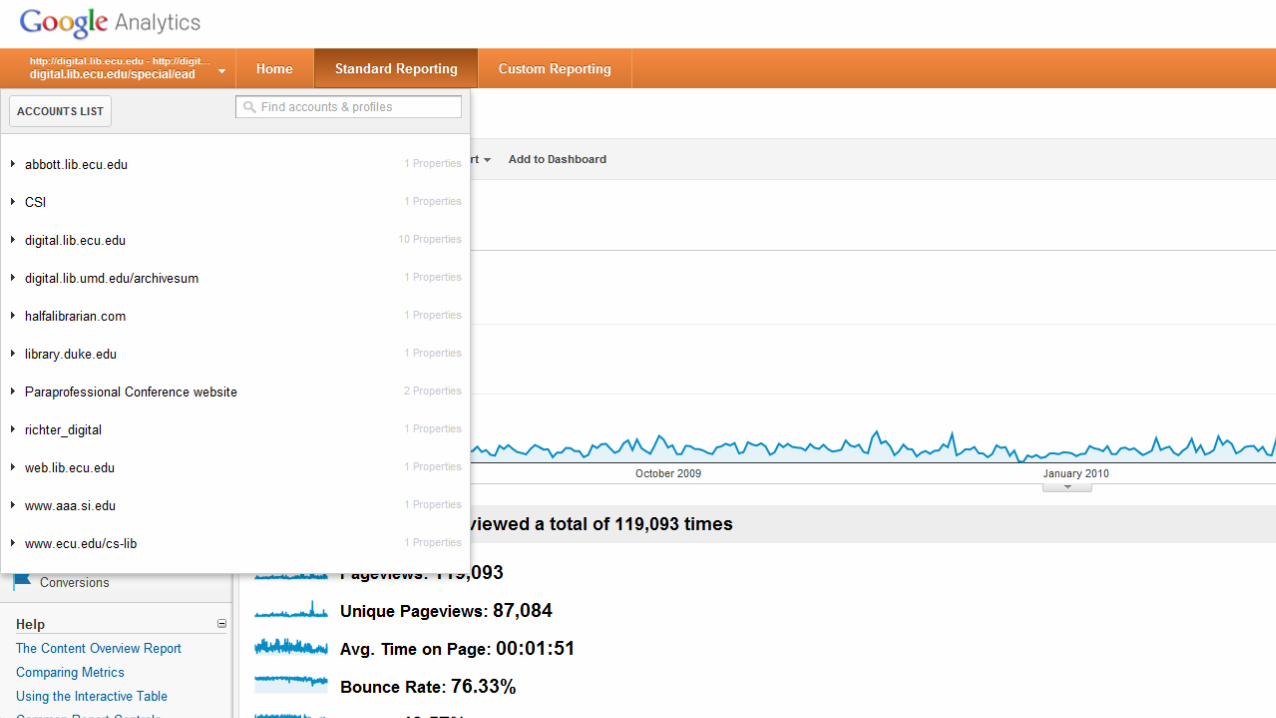
2: Website Metrics, FY 2009 - FY 2011


3: The Path and its Difficulties

/collections/findingaids/downgall.htm%20and%20http:/www.aaa.si.edu/collectionsonline/downgall/overview.htm
/collections/oralhistories%20/tranSCRIPTs/levine02.htm
/search?q=cache:zqG_DxtU1AIJ:proust.library.miami.edu/findingaids/?p=collections/controlcard&id=480+orestes+miami&cd=13&hl=en&ct=clnk&gl=us
/translate_c?hl=ar&sl=en&u=http://proust.library.miami.edu/findingaids/%3Fp=collections/controlcard&id=247&prev=/search%3Fq=batista%2Bcollection&hl=ar&client=firefox-a&channel=s&rls=org.mozilla:ar:official&sa=N&rurl=translate.google.com.eg&usg=ALkJrhiuq78PNcimpnEph3V5gEnNNUZuNw
/search?q=cache:wkJ778Y-NEgJ:test.lib.umd.edu/archivesum/actions.DisplayEADDoc.do%3Fsource%3DMdU.ead.histms.0008.xml%26style%3Dead+historical+Davis+family+Texas&cd=6&hl=en&ct=clnk&gl=us
/digitalcollections/rbmscl/inv/results?q=testimonial+advertising&fq=duke.collection%3Ainv&start=0&rows=20&f=keyword&t=testimonial+advertising&btnG.x=0&btnG.y=0
/url_result?ctw_=sT,eCR-EJ,bT,hT,uaHR0cDovL3d3dy5saWIudW1kLmVkdS9hcmNoaXZlc3VtL2h0bWwvTWRVLmVhZC5saXRtcy4wMDA3Lmh0bWw=,qlang=ja|for=0|sp=-5|fs=100%|fb=0|fi=0|fc=FF0000|db=T|eid=CR-EJ,
/archivesum/actions.DisplayEADDoc.do?source=/MdU.ead.scpa.0078.test.xml&style=ead
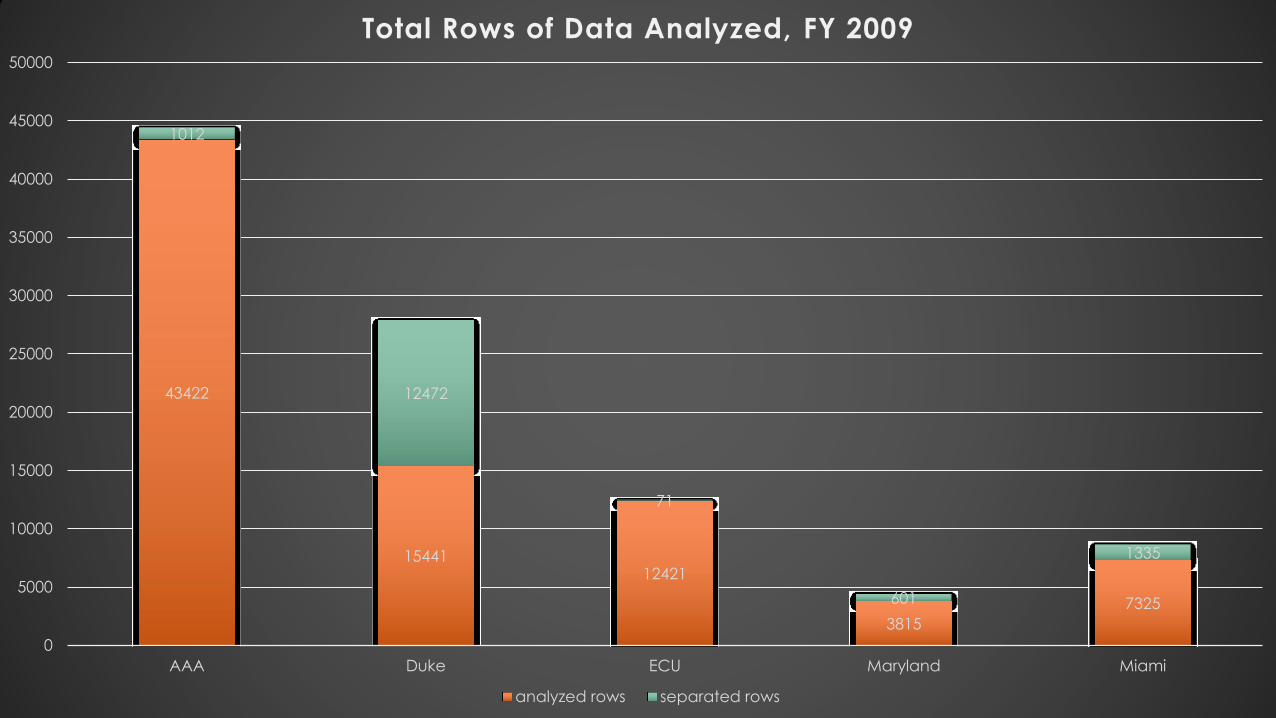
43422
1544112421
3815
7325
1012
12472
71
601
1335
0
5000
10000
15000
20000
25000
30000
35000
40000
45000
50000
AAA Duke ECU Maryland Miami
Total Rows of Data Analyzed, FY 2009
analyzed rows separated rows
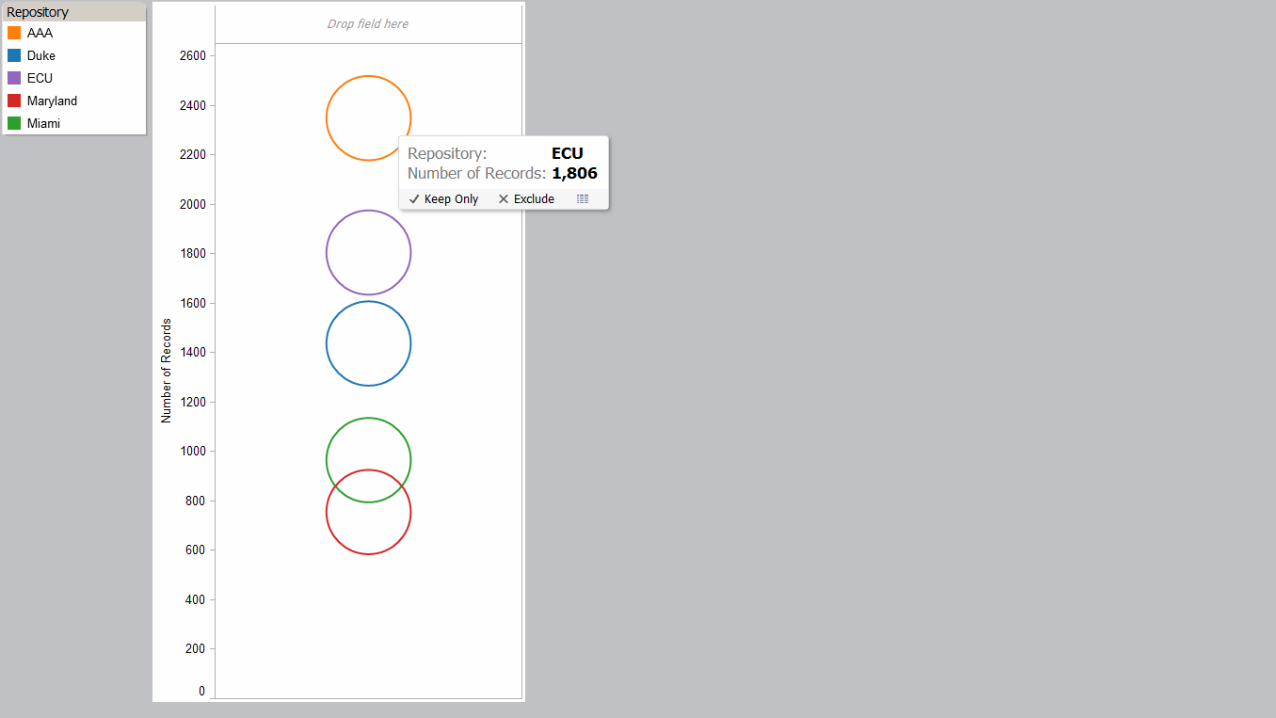
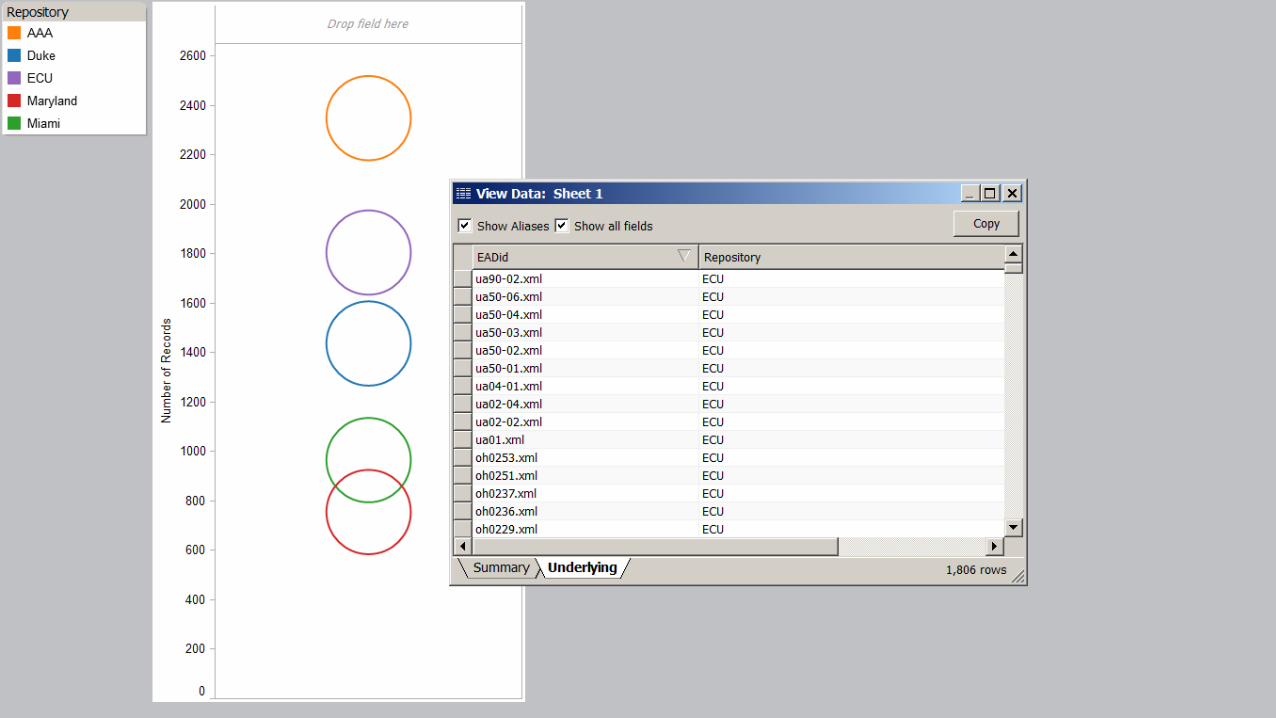
4: Collection-level Data
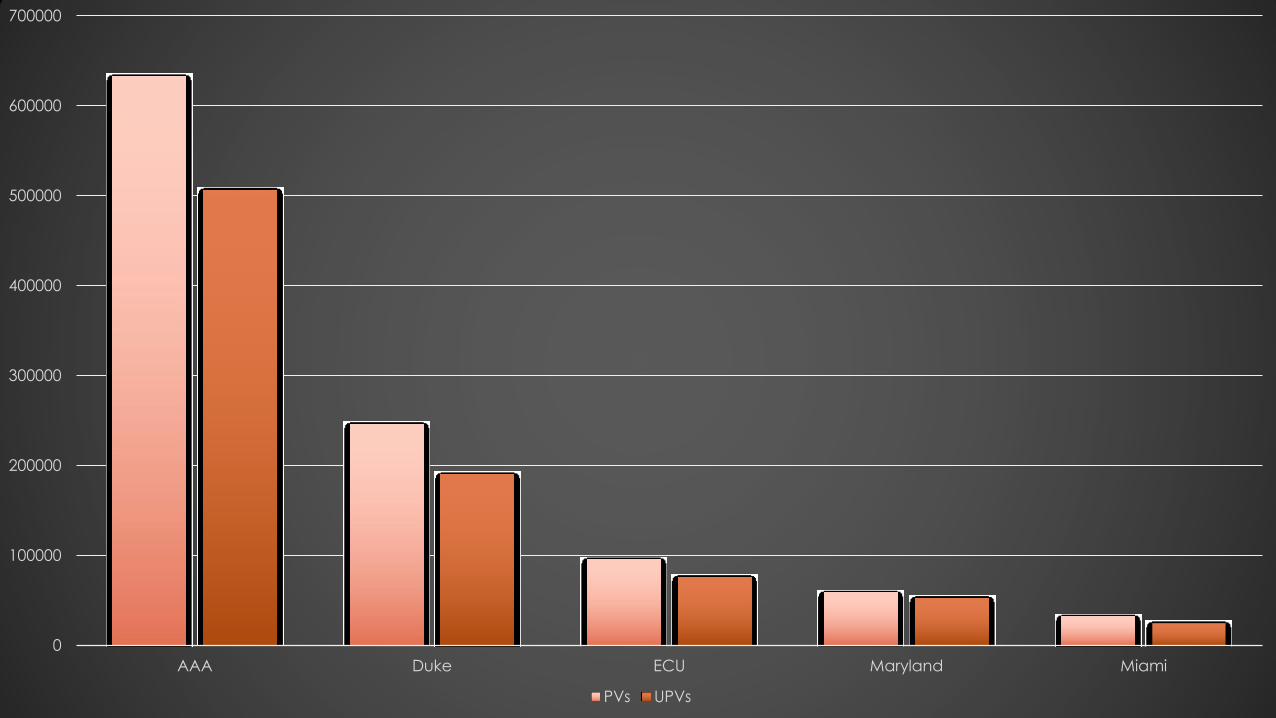
0
100000
200000
300000
400000
500000
600000
700000
AAA Duke ECU Maryland Miami
PVs UPVs

0
100000
200000
300000
400000
500000
600000
700000
AAA Duke ECU Maryland Miami
PVs UPVs
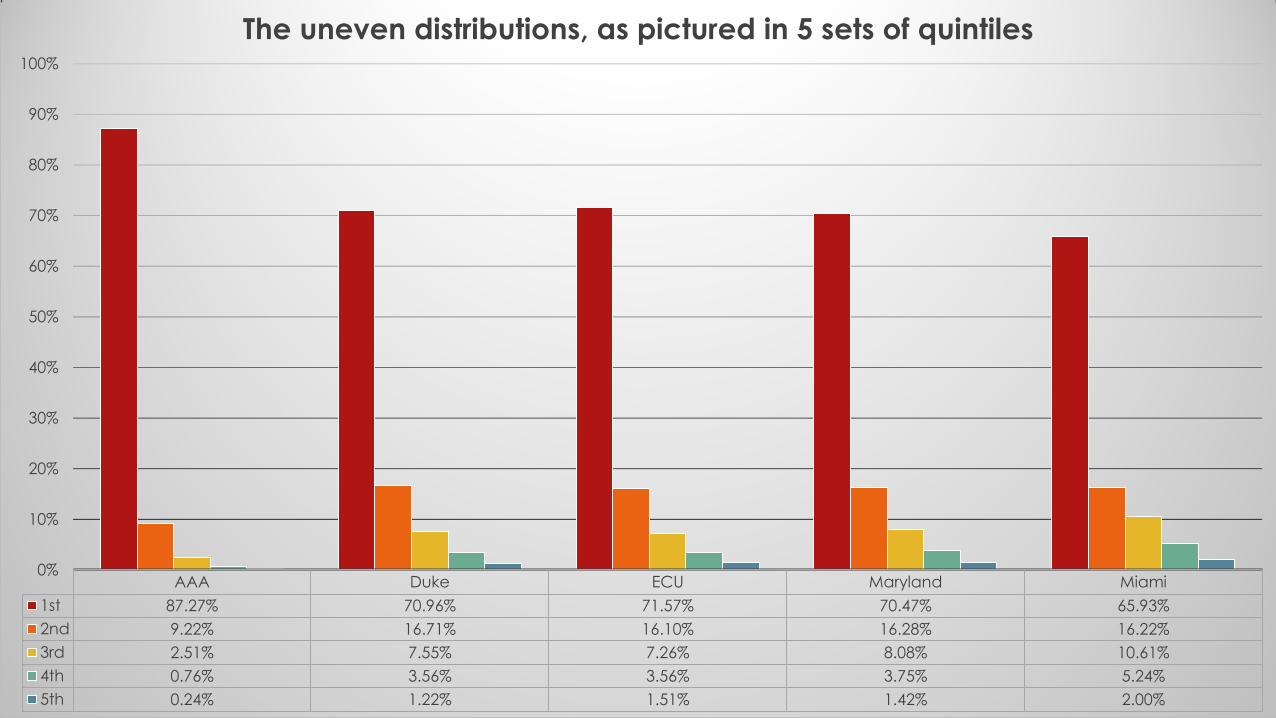
AAA Duke ECU Maryland Miami
1st 87.27% 70.96% 71.57% 70.47% 65.93%
2nd 9.22% 16.71% 16.10% 16.28% 16.22%
3rd 2.51% 7.55% 7.26% 8.08% 10.61%
4th 0.76% 3.56% 3.56% 3.75% 5.24%
5th 0.24% 1.22% 1.51% 1.42% 2.00%
0%
10%
20%
30%
40%
50%
60%
70%
80%
90%
100%
The uneven distributions, as pictured in 5 sets of quintiles
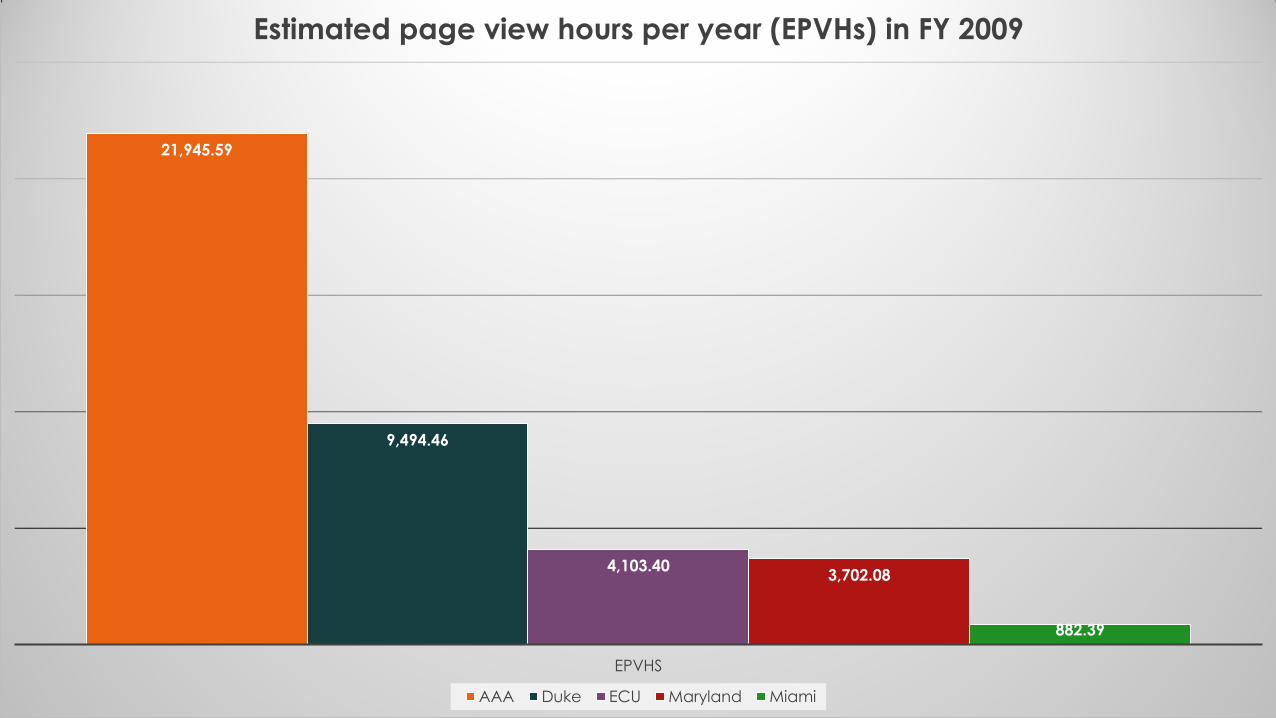
21,945.59
9,494.46
4,103.403,702.08
882.39
EPVHS
Estimated page view hours per year (EPVHs) in FY 2009
AAA Duke ECU Maryland Miami

0
5000
10000
15000
20000
25000
30000
35000
40000
0 200 400 600 800 1000 1200
AAA: EPVHs vs UPVs
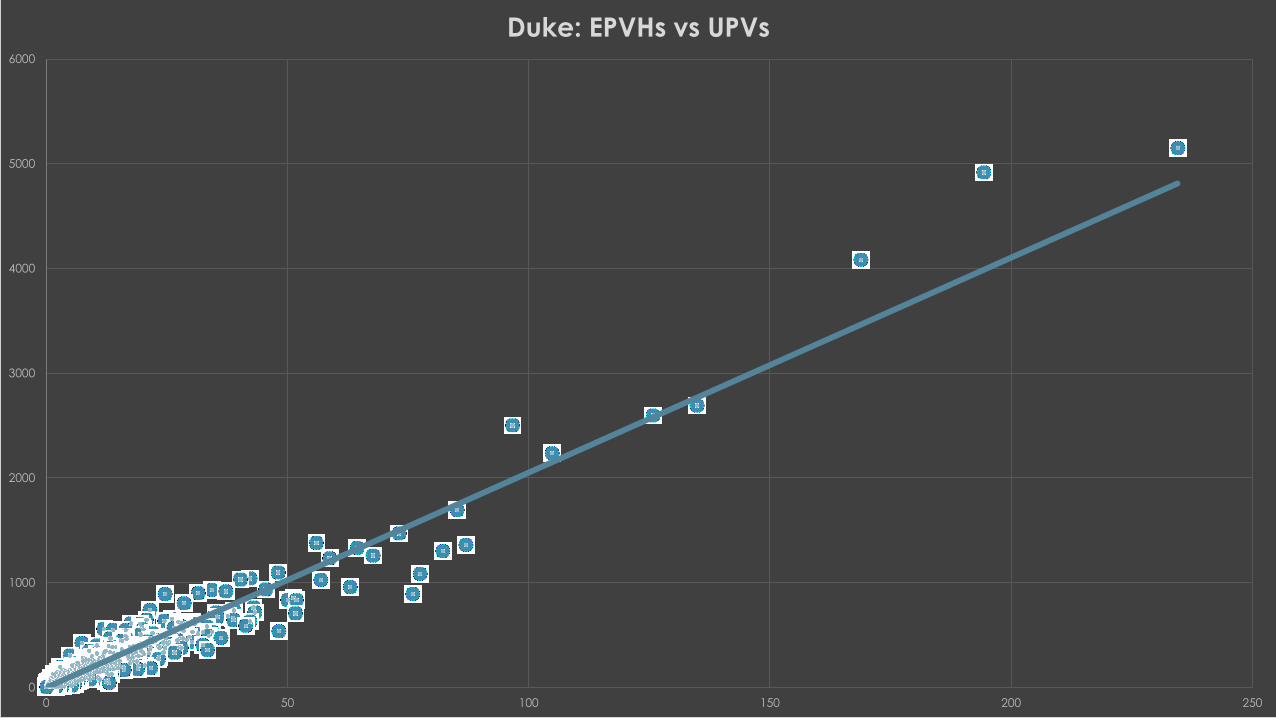
0
1000
2000
3000
4000
5000
6000
0 50 100 150 200 250
Duke: EPVHs vs UPVs

0
200
400
600
800
1000
1200
1400
1600
1800
2000
0 20 40 60 80 100 120
ECU: EPVHs vs UPVs

0
500
1000
1500
2000
2500
3000
0 50 100 150 200 250
Maryland: EPVHs vs UPVs

0
100
200
300
400
500
600
700
800
0 5 10 15 20 25 30 35 40
Miami: EPVHs vs UPVs

0
5000
10000
15000
20000
25000
30000
35000
40000
0 200 400 600 800 1000 1200
All: EPHVs vs. UPVs

AAA Duke ECU Maryland Miami
1st 87.27% 70.96% 71.57% 70.47% 65.93%
2nd 9.22% 16.71% 16.10% 16.28% 16.22%
3rd 2.51% 7.55% 7.26% 8.08% 10.61%
4th 0.76% 3.56% 3.56% 3.75% 5.24%
5th 0.24% 1.22% 1.51% 1.42% 2.00%
0%
10%
20%
30%
40%
50%
60%
70%
80%
90%
100%
The uneven distributions, as pictured in 5 sets of quintiles

83.33%
10.50%
3.94%1.66%
0.57%0%
10%
20%
30%
40%
50%
60%
70%
80%
90%
100%
1ST 2ND 3RD 4TH 5TH

5: Mobile

iPad
37%
iPhone
25%
Android
22%
Other
16%
CHART TITLE
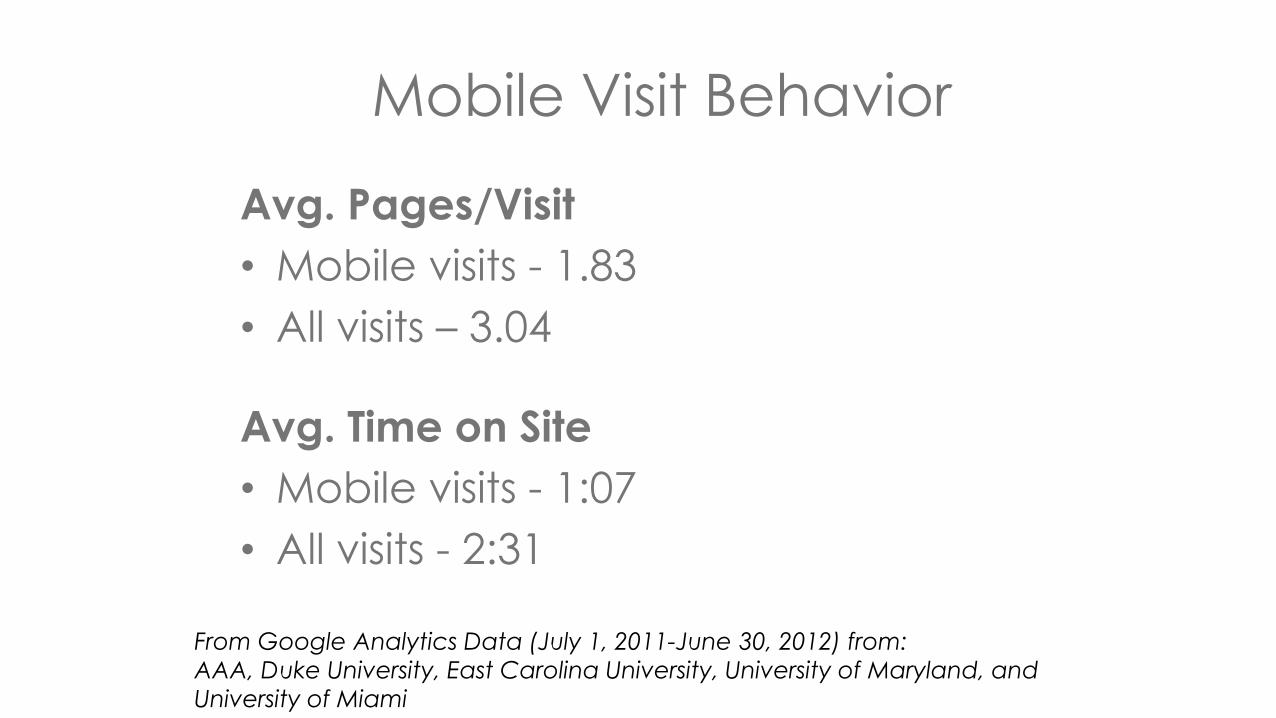
Mobile Visit Behavior
Avg. Pages/Visit
• Mobile visits - 1.83
• All visits – 3.04
Avg. Time on Site
• Mobile visits - 1:07
• All visits - 2:31
From Google Analytics Data (July 1, 2011-June 30, 2012) from:
AAA, Duke University, East Carolina University, University of Maryland, and
University of Miami

Traffic Sources:Mobile Visits vs. All Visits
Mobile Visits All Visits
From Google Analytics Data (July 1, 2011-June 30, 2012) from:AAA, Duke University, East Carolina University, University of Maryland, and University of Miami
Search Traffic72%
Referral Traffic15%
Direct Traffic13%
Search Traffic59%
Referral Traffic29%
Direct Traffic12%
Mobile Visits – Top Referrers
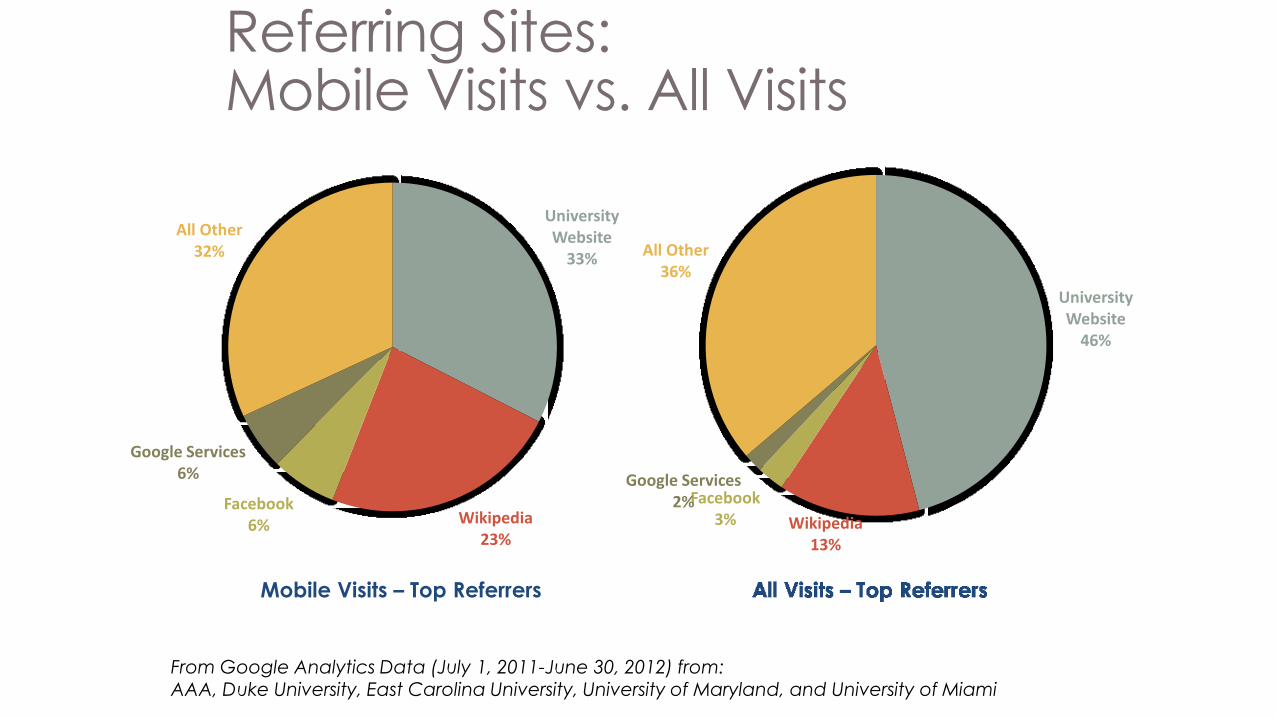
Referring Sites:Mobile Visits vs. All Visits
From Google Analytics Data (July 1, 2011-June 30, 2012) from:AAA, Duke University, East Carolina University, University of Maryland, and University of Miami
University Website
33%
Wikipedia23%
Facebook6%
Google Services6%
All Other32%
University Website
46%
Wikipedia13%
Facebook3%
Google Services2%
All Other36%

6: Wikipedia
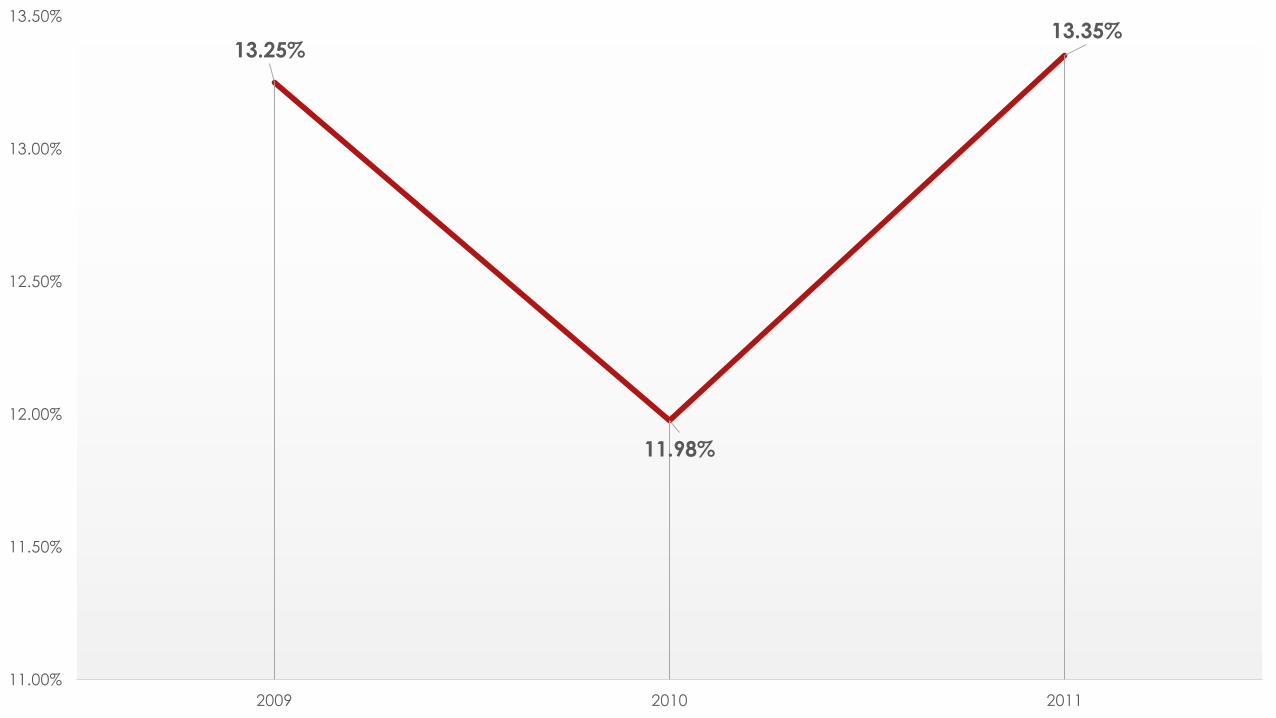
13.25%
11.98%
13.35%
11.00%
11.50%
12.00%
12.50%
13.00%
13.50%
2009 2010 2011

27.63%
16.27%
5.44%
13.50%
3.41%
23.05%
14.87%
5.51%
9.51%
6.94%
28.28%
14.23%
5.64%
11.22%
7.40%
AAA DUKE ECU MARYLAND MIAMI

37,018
38,483
41,031
35,000
36,000
37,000
38,000
39,000
40,000
41,000
42,000
2009 2010 2011
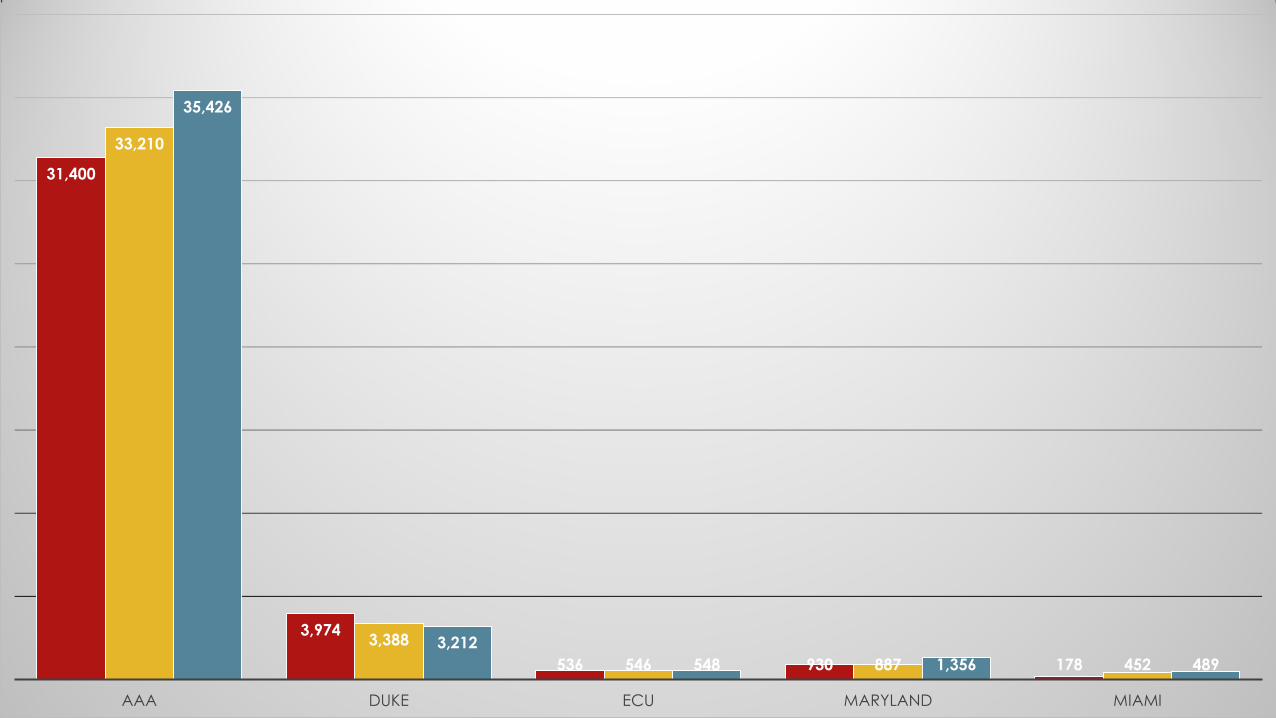
31,400
3,974
536 930 178
33,210
3,388
546 887 452
35,426
3,212
548 1,356 489
AAA DUKE ECU MARYLAND MIAMI

8: Conclusion Next StepsHow best to define a collection-level page? Should we?
Which metrics are most useful for archivists, researchers, etc.?
Beyond the collection, how can we analyze these data sets by subject / topic?
How best to share this data?
How else can it be analyzed?
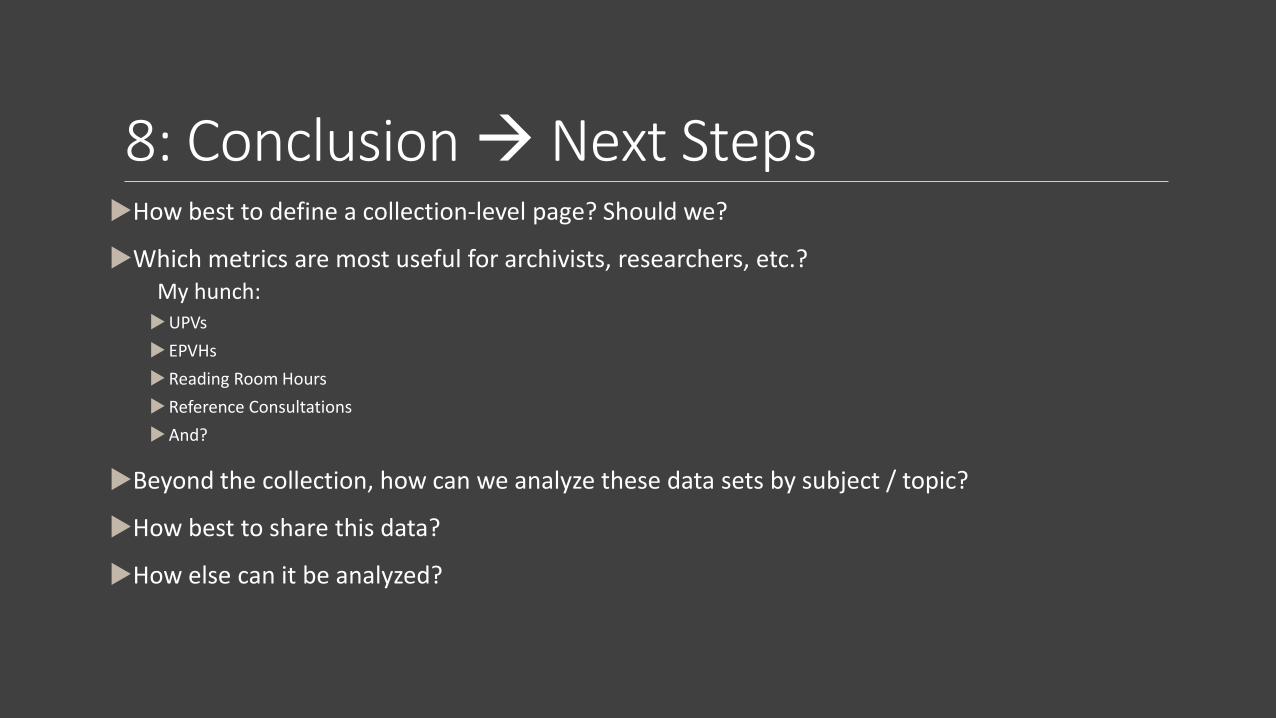
8: Conclusion Next StepsHow best to define a collection-level page? Should we?
Which metrics are most useful for archivists, researchers, etc.?My hunch:UPVs
EPVHs
Reading Room Hours
Reference Consultations
And?
Beyond the collection, how can we analyze these data sets by subject / topic?
How best to share this data?
How else can it be analyzed?

Mark CusterNoah HuffmanJennie Levine KniesKyle RimkusSara Snyder
Questions?