Fitting Lines to Data with Outliers and Errors in the Variables Nahum KiryatiFreddy Bruckstein TAU...
23
Fitting Lines to Data with Outliers and Errors in the Variables Nahum Kiryati Freddy Bruckstein TAU Technion © Copyrighted material. All rights reserved.
-
date post
21-Dec-2015 -
Category
Documents
-
view
221 -
download
0
Transcript of Fitting Lines to Data with Outliers and Errors in the Variables Nahum KiryatiFreddy Bruckstein TAU...
Fitting Lines to Data with Outliers and Errors in the Variables
Nahum Kiryati Freddy Bruckstein
TAU Technion
© Copyrighted material. All rights reserved.
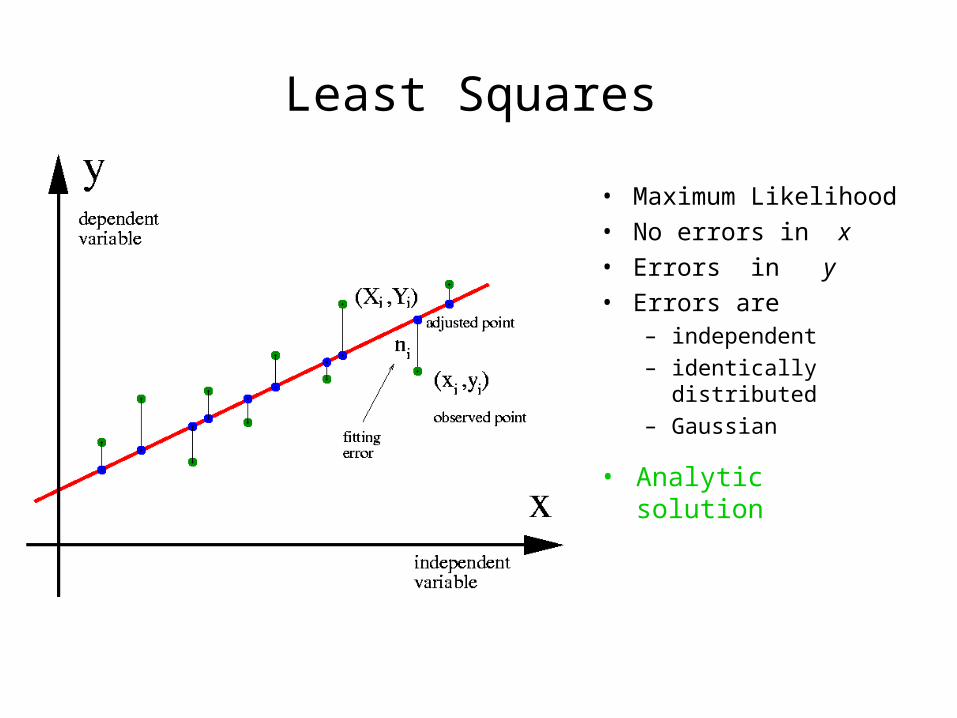
Least Squares
• Maximum Likelihood• No errors in x• Errors in y• Errors are
– independent
– identically distributed
– Gaussian
• Analytic solution

From Maximum-Likelihood to Least-Squares (reminder)
),(|)},({ Probmaxarg),(
bmyx iibm
2
2
),( 2
)( expmaxarg
i
ii
ibm
bmxy
i i
ii
bm
bmxy2
2
),( 2
)(minarg
i
iibm
bmxy 2
),()(minarg
Maximum Likelihood:
Independent Gaussian errors:
log is a monotonic function:
Identically distributed errors:
... Least Squares

“Errors in the Variables”(errors in both x and y )
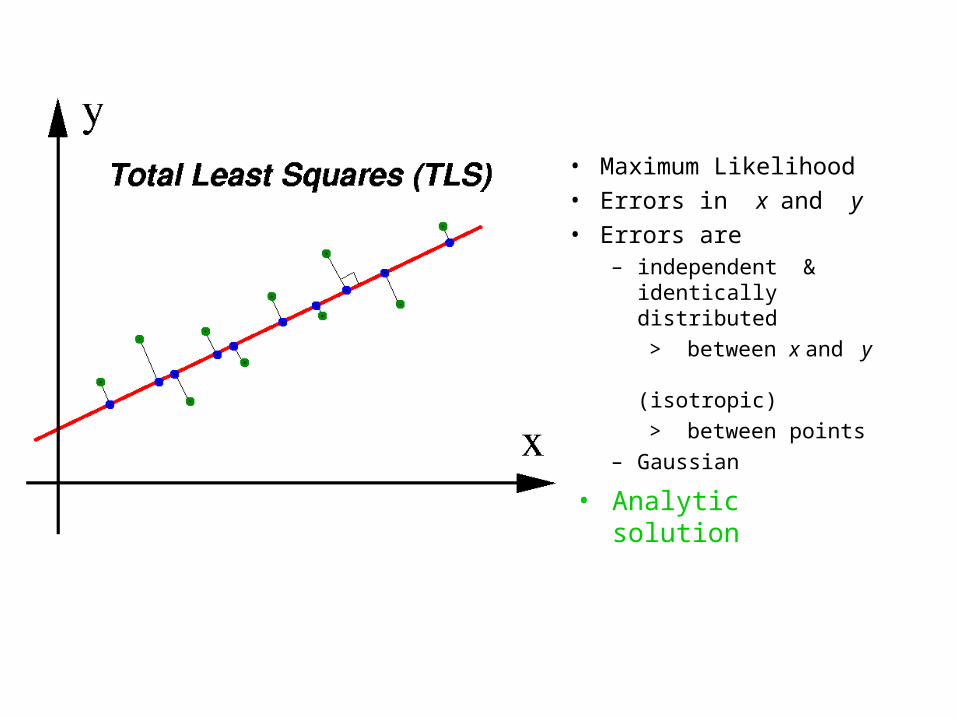
• Maximum Likelihood• Errors in x and y• Errors are
– independent & identically distributed
> between x and y (isotropic)
> between points– Gaussian
• Analytic solution

Heteroscedastic Errors
• Errors are independent
- between points
- between x and y
• Errors are not identically distributed
- between points
- between x and y
• No analytic solution
Possible reason: A different measurement device is used for each point.

Heteroscedastic & Correlated Errors
• Errors are independent between points
• Errors are correlated between x and y
• Errors are not identically distributed
• No analytic solution
Correlation can appear if the measurement instruments for x and y are both sensitive to a common environmental factor.

OutliersEven a single outlier can pull the line arbitrarily away from its “true” position
MATLAB “robustdemo”

Robust Approaches
• Least Median of Squares
• Robust M-estimation
• Reweighted Least-Squares
• etc...

Robust line fitting methods are far from ideal:
global optimization / local minima / computational complexity
Failure of Reweighted Least Squares (Matlab’s robustdemo)
(and forget about heteroscedasticity and correlation).

Detecting Lines in Edge Images
Unique characteristics:
• Many data points (~10,000)
Algorithm must be fast!
• Majority of outliers
Robustness is everything!
• Small location errors
Fitting the “good” points
is not a big issue.

Hough Transform
sincos ii yx

Lines Tangent to a Circle
It is easy to assign a cost (in parameter space) to lines with isotropic fitting errors!

Total Least Squares via Parameter Space

M-Estimation
• A classical approach to robust regression
• Limits the influence of outliers
• Leads to a nasty global optimization problem
• Usually: local optimization from “a good initial guess”
• Look for a good initial guess…
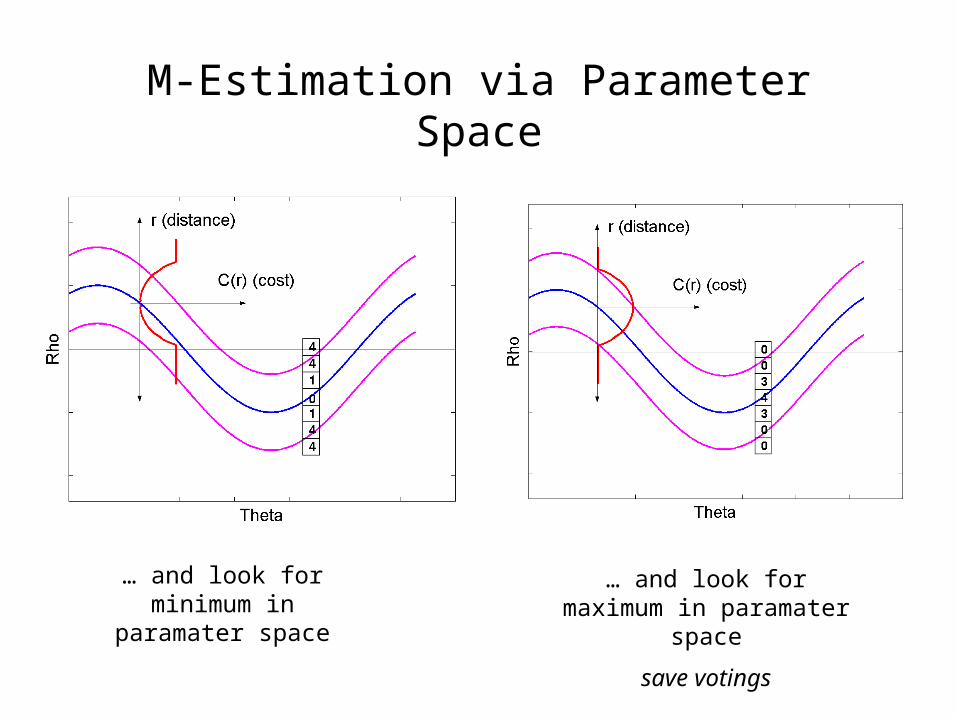
M-Estimation via Parameter Space
… and look for minimum in paramater space
… and look for maximum in paramater space
save votings

M-Estimation via Parameter Space: Examples

Formally, once we have shown that
2
22
),(2 sincos
sincos s.t.
)()( min
,
ii
ii
iiiiii
yx
YX
yYxXYX
ir
any (nasty) line fitting problem with isotropic cost can be (nicely) solved in parameter space:
sincosminarg)],([minarg),(),(
iiii
yxiii CrC
e.g., TLS & robust TLS, via selection of Ci (.) :
(Distance between data point i and a given line)
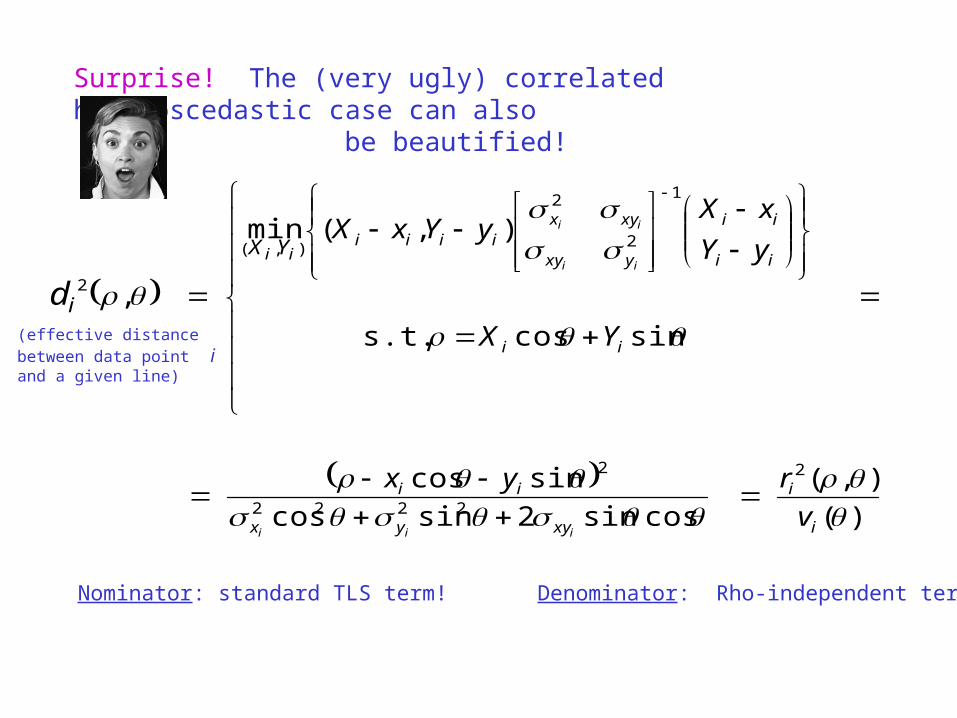
Surprise! The (very ugly) correlated heteroscedastic case can also be beautified!
sincos s.t.
),(min
,
1
2
2
),(
2
ii
ii
ii
yxy
xyxiiii
ii
YX
yY
xXyYxX
ii
ii
YX
id
)(
),(
cossin2sincos
sincos
2
2222
2
i
i
xyyx
ii
v
ryx
iii
Nominator: standard TLS term! Denominator: Rho-independent term!
(effective distancebetween data point iand a given line)

Correlated, heteroscedastic, robust... and fast!

Robust, Heteroscedastic, Correlated Line Fitting
Robust TLS (isotropic)
Robust, heteroscedastic(uncorrelated)
Robust, heteroscedastic,correlated
•Ellipses/circles represent saturation (truncation) levels.
•The same algorithm/program was used for all examples.

Robust, Heteroscedastic, Correlated Line Fitting
•Ellipses/circles represent saturation (truncation) levels.
•The same algorithm/program was used for all examples.

ReferencesN. Kiryati and A.M. Brucktein, “Heteroscedastic Hough Transform (HtHT): An Efficient Method for Robust line Fitting in the `Errors in the Variables’ Problem, Computer Vision and Image Understanding, Vol. 78, pp. 69-83, 2000.
N. Kiryati and A.M. Bruckstein, “What’s in a Set of Points?”, IEEE Trans. Pattern Analysis Macine Intelligence, Vol. 14, pp. 496-500, 1992.
N. Kiryati and A.M. Bruckstein, “On Navigating between Friends and Foes”, IEEE Trans. Pattern Analysis Macine Intelligence, Vol. 13, pp. 602-606, 1991.