SR EN 12350-5-2002 Part 5 Testing fresh concrete Flow Table Test.pdf
FITNESS TESTING PKG. REPORT AND SPARQ PROTOCOL
BC SOCCER FITNESS TEST PACKAGE
INTRODUCTION Over the past 6 years, BC Soccer Provincial Team Programs and the CSA National Training Centre Program West have been
using the SPARQ Self-testing protocol. This year BC Soccer will be integrating the protocol to our EA Sports BCSPL as the
official fitness testing protocol for the league.
The BC Soccer Development Department requests that all EA Sports BCSPL Franchises follow the recognized protocol and
conduct 3 tests throughout the season as per the following testing schedule:
TEST 1 – February
TEST 2 – May
TEST 3 – September
Following each testing phase, scores will be submitted into the BC Soccer Science Depart for review. This will enable us to
monitor the player’s physical abilities and provide us with additional information on the physical preparation taking place at
each franchise.
TEST OUTLINE SPARQ, which stands for Speed, Power, Agility, Reaction and Quickness, was first introduced to our association at the 2007
BC Soccer Coaching Conference by Paul Winsper (SPARQ Trainer / Strength and Conditioning Coach for Toronto FC) and
Eric Hakeman (SPARQ Staff Representative).
There are five tests conducted in the protocol:
Height / Weight
Vertical Jump Test
20-meter sprint
Arrowhead Agility Test
Yo-Yo Intermittent Recovery Test.
“Thanks to the introduction of SPARQ Self-Test protocol; we now have an opportunity to collect valuable data, increase our
ability evaluate, record and monitor player progress, and provide players and coaches with quality information on how to
better train to improve physical condition of our players.”
“We are very excited to see what the results will bring and look forward to working with SPARQ to make this happen.”
-Markus Reinkens (Manager of Soccer Science Department, BC Soccer)
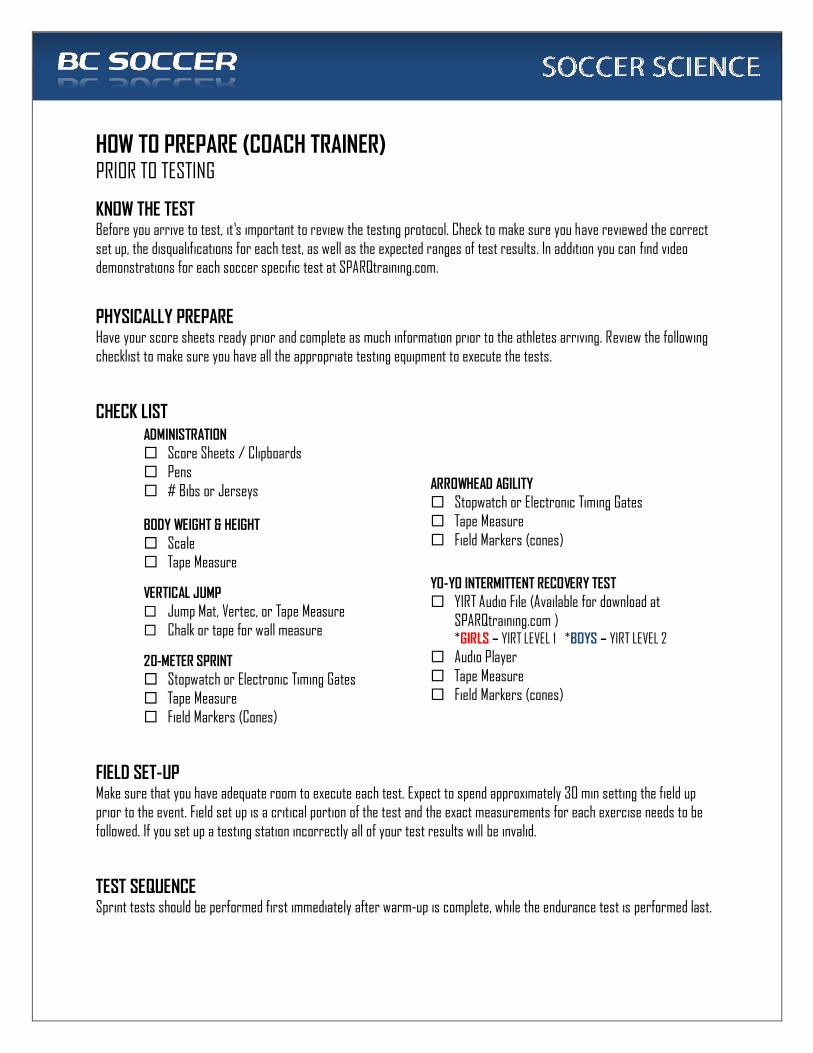
HOW TO PREPARE (COACH TRAINER) PRIOR TO TESTING
KNOW THE TEST Before you arrive to test, it’s important to review the testing protocol. Check to make sure you have reviewed the correct
set up, the disqualifications for each test, as well as the expected ranges of test results. In addition you can find video
demonstrations for each soccer specific test at SPARQtraining.com.
PHYSICALLY PREPARE Have your score sheets ready prior and complete as much information prior to the athletes arriving. Review the following
checklist to make sure you have all the appropriate testing equipment to execute the tests.
CHECK LIST
ADMINISTRATION
Score Sheets / Clipboards
Pens
# Bibs or Jerseys
BODY WEIGHT & HEIGHT
Scale
Tape Measure
VERTICAL JUMP
Jump Mat, Vertec, or Tape Measure
Chalk or tape for wall measure
20-METER SPRINT
Stopwatch or Electronic Timing Gates
Tape Measure Field Markers (Cones)
ARROWHEAD AGILITY
Stopwatch or Electronic Timing Gates Tape Measure
Field Markers (cones)
YO-YO INTERMITTENT RECOVERY TEST
YIRT Audio File (Available for download at SPARQtraining.com ) *GIRLS – YIRT LEVEL 1 *BOYS – YIRT LEVEL 2
Audio Player
Tape Measure
Field Markers (cones)
FIELD SET-UP Make sure that you have adequate room to execute each test. Expect to spend approximately 30 min setting the field up
prior to the event. Field set up is a critical portion of the test and the exact measurements for each exercise needs to be
followed. If you set up a testing station incorrectly all of your test results will be invalid.
TEST SEQUENCE Sprint tests should be performed first immediately after warm-up is complete, while the endurance test is performed last.
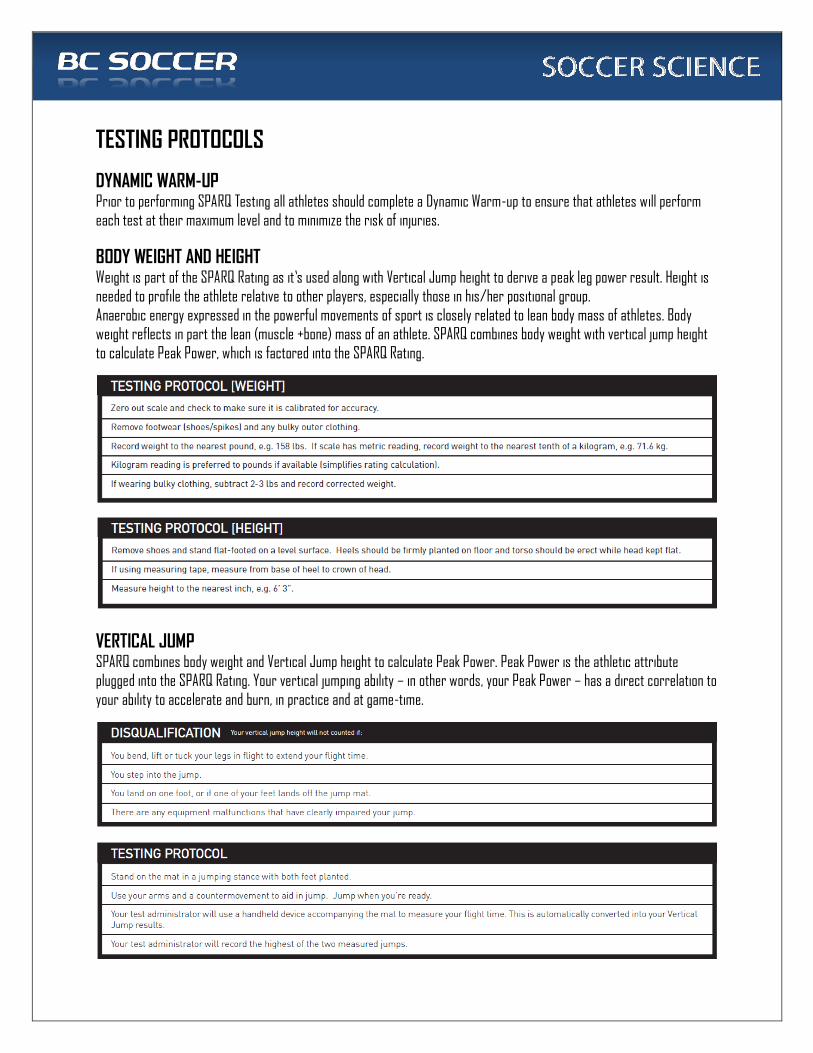
TESTING PROTOCOLS
DYNAMIC WARM-UP Prior to performing SPARQ Testing all athletes should complete a Dynamic Warm-up to ensure that athletes will perform
each test at their maximum level and to minimize the risk of injuries.
BODY WEIGHT AND HEIGHT Weight is part of the SPARQ Rating as it’s used along with Vertical Jump height to derive a peak leg power result. Height is needed to profile the athlete relative to other players, especially those in his/her positional group.
Anaerobic energy expressed in the powerful movements of sport is closely related to lean body mass of athletes. Body
weight reflects in part the lean (muscle +bone) mass of an athlete. SPARQ combines body weight with vertical jump height
to calculate Peak Power, which is factored into the SPARQ Rating.
VERTICAL JUMP SPARQ combines body weight and Vertical Jump height to calculate Peak Power. Peak Power is the athletic attribute
plugged into the SPARQ Rating. Your vertical jumping ability – in other words, your Peak Power – has a direct correlation to
your ability to accelerate and burn, in practice and at game-time.
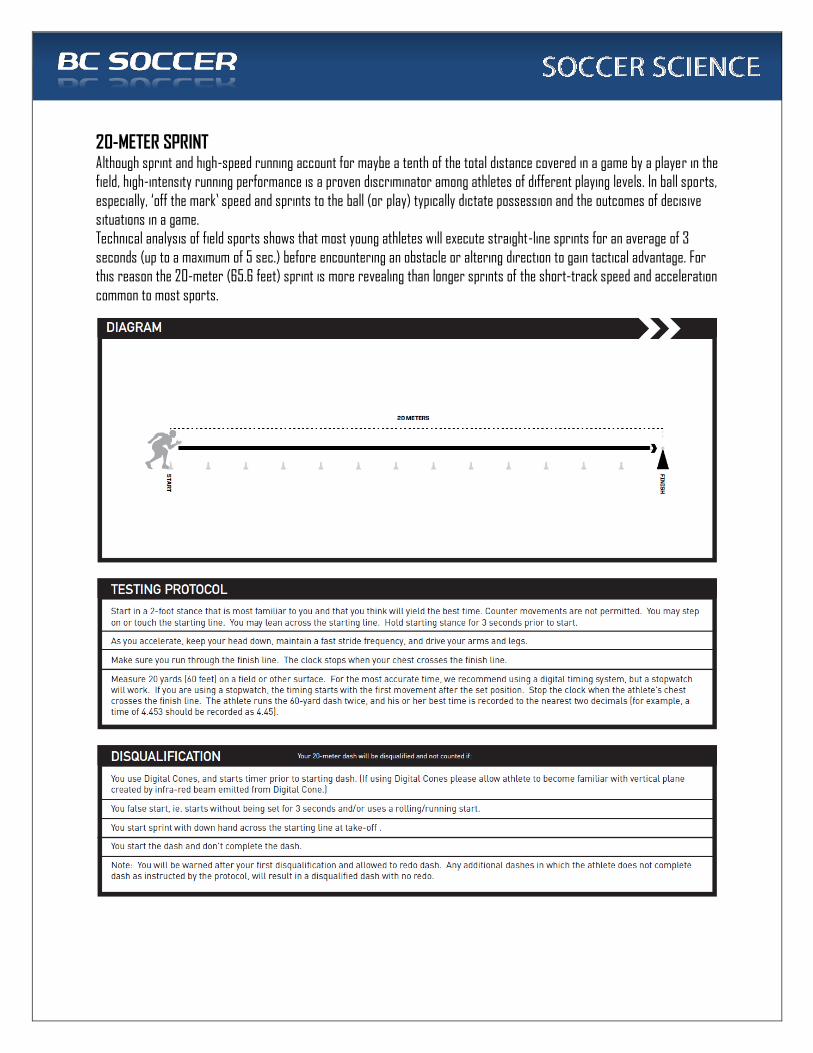
20-METER SPRINT Although sprint and high-speed running account for maybe a tenth of the total distance covered in a game by a player in the
field, high-intensity running performance is a proven discriminator among athletes of different playing levels. In ball sports,
especially, ‘off the mark’ speed and sprints to the ball (or play) typically dictate possession and the outcomes of decisive situations in a game.
Technical analysis of field sports shows that most young athletes will execute straight-line sprints for an average of 3
seconds (up to a maximum of 5 sec.) before encountering an obstacle or altering direction to gain tactical advantage. For
this reason the 20-meter (65.6 feet) sprint is more revealing than longer sprints of the short-track speed and acceleration
common to most sports.

ARROWHEAD AGILITY The game demands frequent momentary changes of direction and speed. Athletes with superior agility are able to make the
most of their physical attributes (and overcome some limitations) and quickly coordinate movements to gain advantage in
match situations. Studies have shown that agility is one of the most powerful discriminators and a potential predictor of
talent among otherwise equal players.
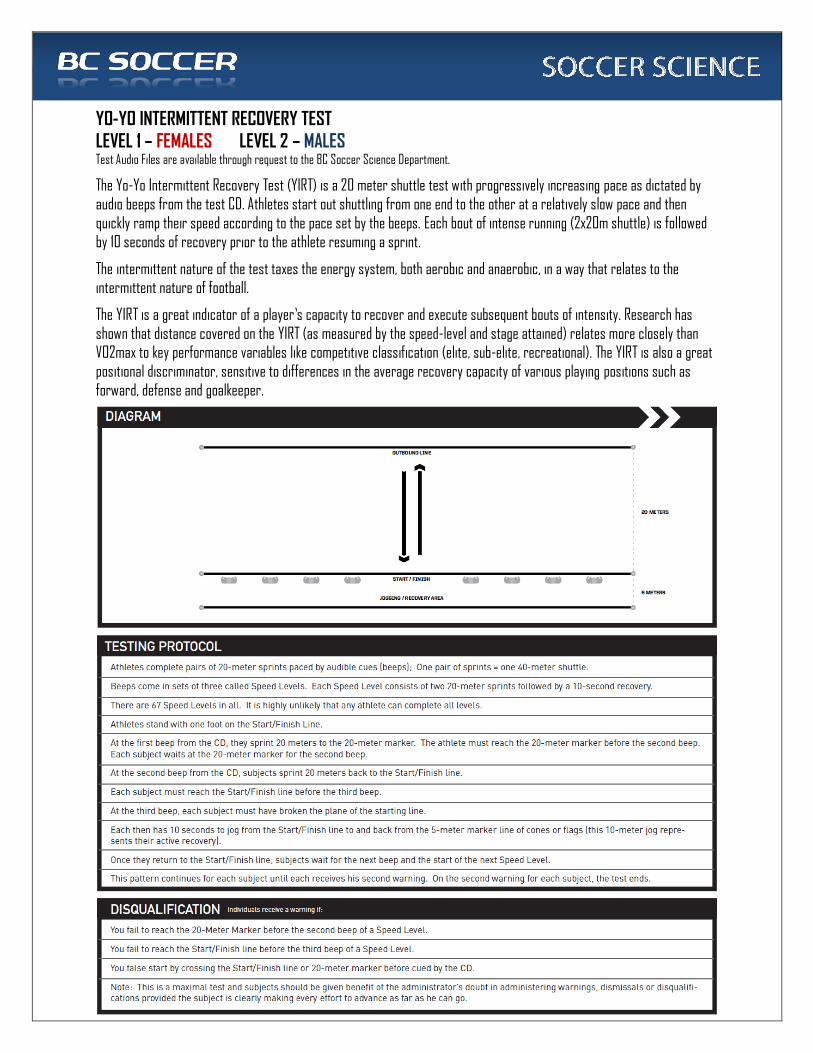
YO-YO INTERMITTENT RECOVERY TEST
LEVEL 1 – FEMALES LEVEL 2 – MALES Test Audio Files are available through request to the BC Soccer Science Department.
The Yo-Yo Intermittent Recovery Test (YIRT) is a 20 meter shuttle test with progressively increasing pace as dictated by
audio beeps from the test CD. Athletes start out shuttling from one end to the other at a relatively slow pace and then
quickly ramp their speed according to the pace set by the beeps. Each bout of intense running (2x20m shuttle) is followed
by 10 seconds of recovery prior to the athlete resuming a sprint.
The intermittent nature of the test taxes the energy system, both aerobic and anaerobic, in a way that relates to the
intermittent nature of football.
The YIRT is a great indicator of a player’s capacity to recover and execute subsequent bouts of intensity. Research has
shown that distance covered on the YIRT (as measured by the speed-level and stage attained) relates more closely than
VO2max to key performance variables like competitive classification (elite, sub-elite, recreational). The YIRT is also a great
positional discriminator, sensitive to differences in the average recovery capacity of various playing positions such as
forward, defense and goalkeeper.
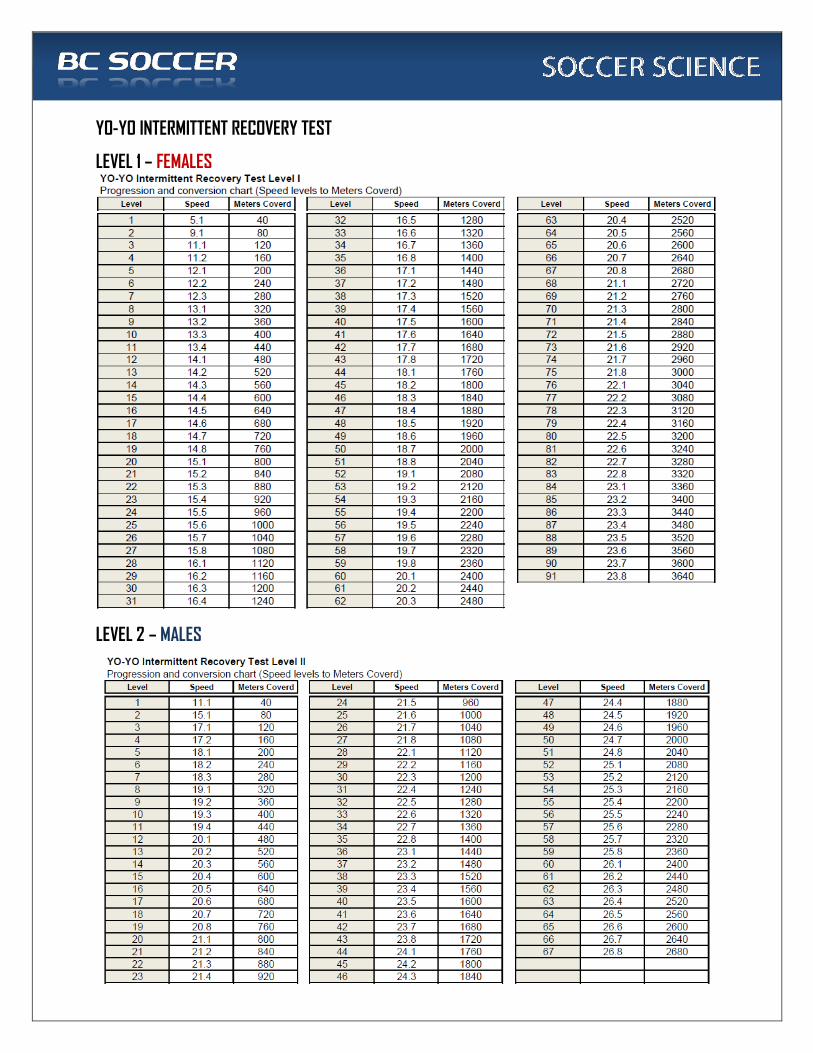
YO-YO INTERMITTENT RECOVERY TEST
LEVEL 1 – FEMALES
LEVEL 2 – MALES
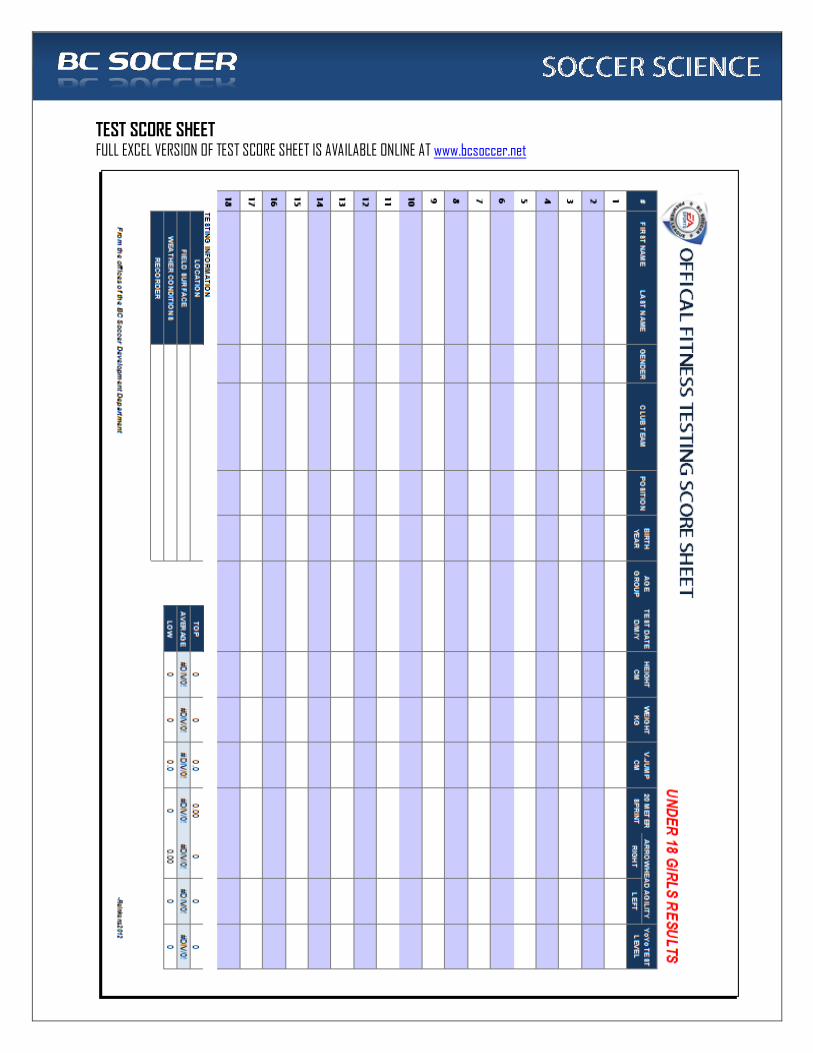
TEST SCORE SHEET FULL EXCEL VERSION OF TEST SCORE SHEET IS AVAILABLE ONLINE AT www.bcsoccer.net
36.9 MALE
GK
55.6 MALE
D 44.3 MALE
M
53.7 MALE
F
43.7 FEMALE
GK
55.1 FEMALE
D
58.6 FEMALE
M
61.0 FEMALE
F
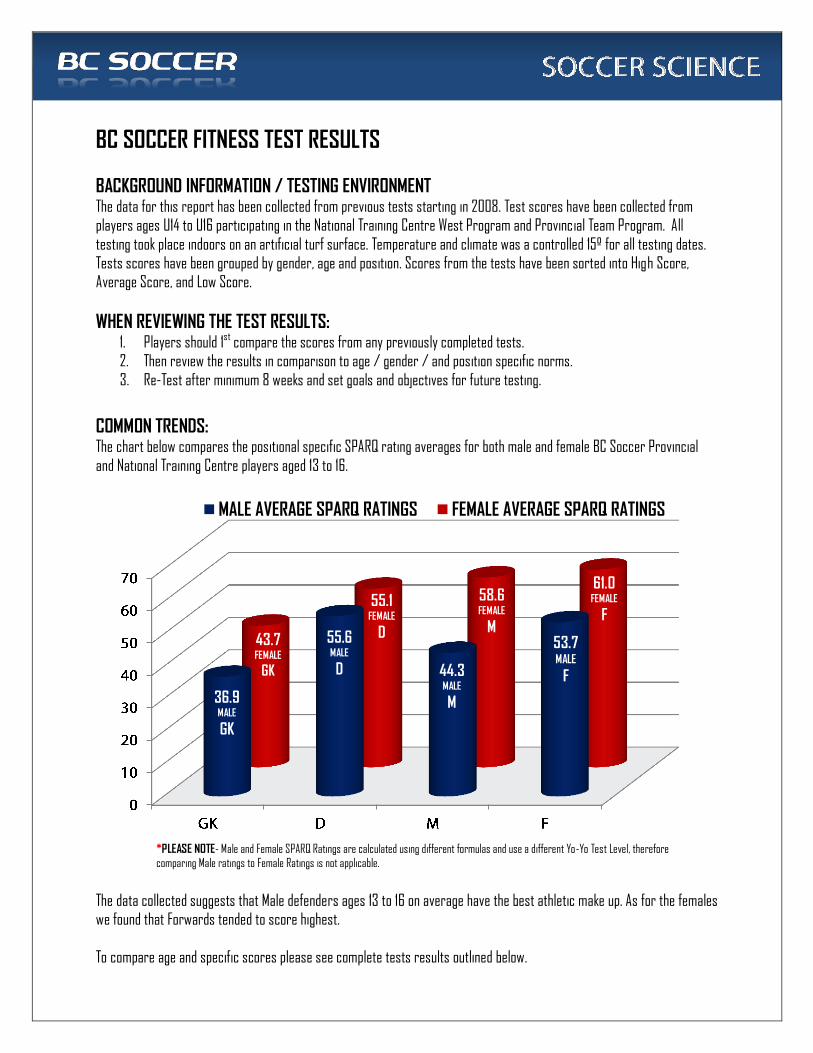
MALE AVERAGE SPARQ RATINGS FEMALE AVERAGE SPARQ RATINGS
*PLEASE NOTE- Male and Female SPARQ Ratings are calculated using different formulas and use a different Yo-Yo Test Level, therefore
comparing Male ratings to Female Ratings is not applicable.
BC SOCCER FITNESS TEST RESULTS
BACKGROUND INFORMATION / TESTING ENVIRONMENT The data for this report has been collected from previous tests starting in 2008. Test scores have been collected from players ages U14 to U16 participating in the National Training Centre West Program and Provincial Team Program. All
testing took place indoors on an artificial turf surface. Temperature and climate was a controlled 15º for all testing dates. Tests scores have been grouped by gender, age and position. Scores from the tests have been sorted into High Score,
Average Score, and Low Score.
WHEN REVIEWING THE TEST RESULTS: 1. Players should 1st compare the scores from any previously completed tests. 2. Then review the results in comparison to age / gender / and position specific norms.
3. Re-Test after minimum 8 weeks and set goals and objectives for future testing.
COMMON TRENDS: The chart below compares the positional specific SPARQ rating averages for both male and female BC Soccer Provincial
and National Training Centre players aged 13 to 16.
The data collected suggests that Male defenders ages 13 to 16 on average have the best athletic make up. As for the females we found that Forwards tended to score highest.
To compare age and specific scores please see complete tests results outlined below.
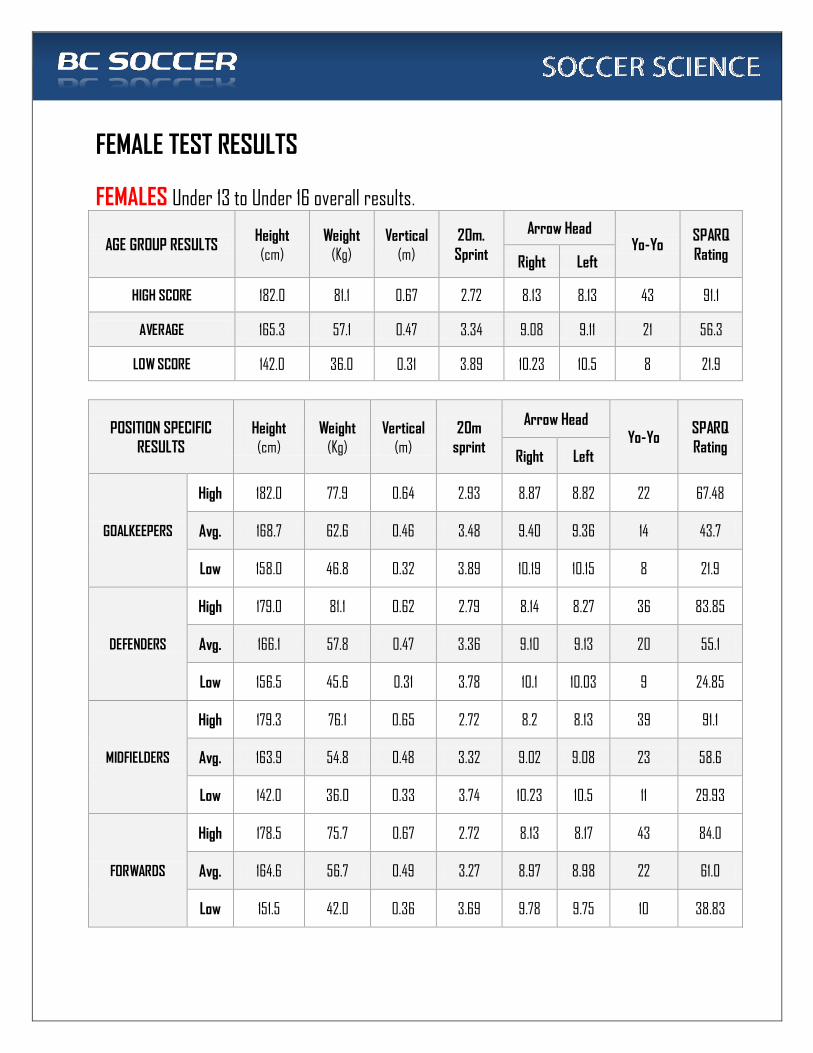
FEMALE TEST RESULTS
FEMALES Under 13 to Under 16 overall results.
AGE GROUP RESULTS Height
(cm)
Weight
(Kg)
Vertical
(m)
20m.
Sprint
Arrow Head Yo-Yo
SPARQ
RatingRight Left
HIGH SCORE 182.0 81.1 0.67 2.72 8.13 8.13 43 91.1
AVERAGE 165.3 57.1 0.47 3.34 9.08 9.11 21 56.3
LOW SCORE 142.0 36.0 0.31 3.89 10.23 10.5 8 21.9
POSITION SPECIFIC
RESULTS
Height
(cm)
Weight
(Kg)
Vertical
(m)
20m
sprint
Arrow Head Yo-Yo
SPARQ
Rating Right Left
GOALKEEPERS
High 182.0 77.9 0.64 2.93 8.87 8.82 22 67.48
Avg. 168.7 62.6 0.46 3.48 9.40 9.36 14 43.7
Low 158.0 46.8 0.32 3.89 10.19 10.15 8 21.9
DEFENDERS
High 179.0 81.1 0.62 2.79 8.14 8.27 36 83.85
Avg. 166.1 57.8 0.47 3.36 9.10 9.13 20 55.1
Low 156.5 45.6 0.31 3.78 10.1 10.03 9 24.85
MIDFIELDERS
High 179.3 76.1 0.65 2.72 8.2 8.13 39 91.1
Avg. 163.9 54.8 0.48 3.32 9.02 9.08 23 58.6
Low 142.0 36.0 0.33 3.74 10.23 10.5 11 29.93
FORWARDS
High 178.5 75.7 0.67 2.72 8.13 8.17 43 84.0
Avg. 164.6 56.7 0.49 3.27 8.97 8.98 22 61.0
Low 151.5 42.0 0.36 3.69 9.78 9.75 10 38.83
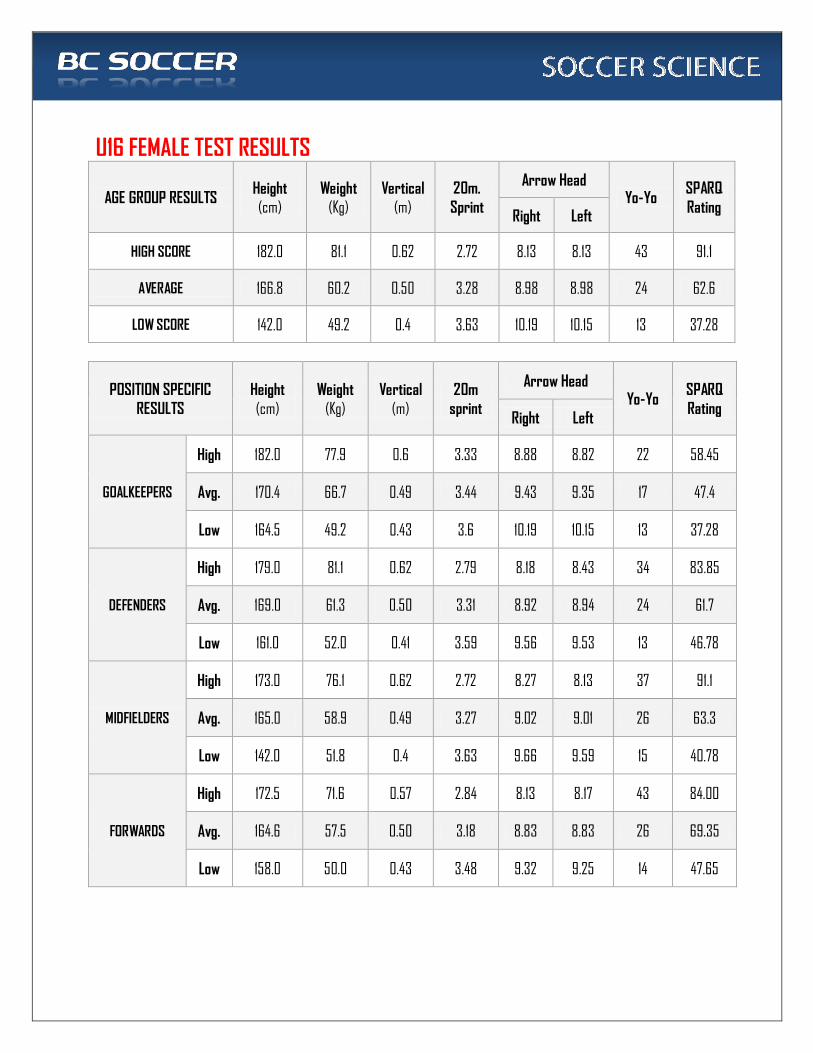
U16 FEMALE TEST RESULTS
AGE GROUP RESULTS Height (cm)
Weight (Kg)
Vertical (m)
20m.
Sprint
Arrow Head Yo-Yo
SPARQ
RatingRight Left
HIGH SCORE 182.0 81.1 0.62 2.72 8.13 8.13 43 91.1
AVERAGE 166.8 60.2 0.50 3.28 8.98 8.98 24 62.6
LOW SCORE 142.0 49.2 0.4 3.63 10.19 10.15 13 37.28
POSITION SPECIFIC
RESULTS
Height
(cm)
Weight
(Kg)
Vertical
(m)
20m
sprint
Arrow Head Yo-Yo
SPARQ
Rating Right Left
GOALKEEPERS
High 182.0 77.9 0.6 3.33 8.88 8.82 22 58.45
Avg. 170.4 66.7 0.49 3.44 9.43 9.35 17 47.4
Low 164.5 49.2 0.43 3.6 10.19 10.15 13 37.28
DEFENDERS
High 179.0 81.1 0.62 2.79 8.18 8.43 34 83.85
Avg. 169.0 61.3 0.50 3.31 8.92 8.94 24 61.7
Low 161.0 52.0 0.41 3.59 9.56 9.53 13 46.78
MIDFIELDERS
High 173.0 76.1 0.62 2.72 8.27 8.13 37 91.1
Avg. 165.0 58.9 0.49 3.27 9.02 9.01 26 63.3
Low 142.0 51.8 0.4 3.63 9.66 9.59 15 40.78
FORWARDS
High 172.5 71.6 0.57 2.84 8.13 8.17 43 84.00
Avg. 164.6 57.5 0.50 3.18 8.83 8.83 26 69.35
Low 158.0 50.0 0.43 3.48 9.32 9.25 14 47.65
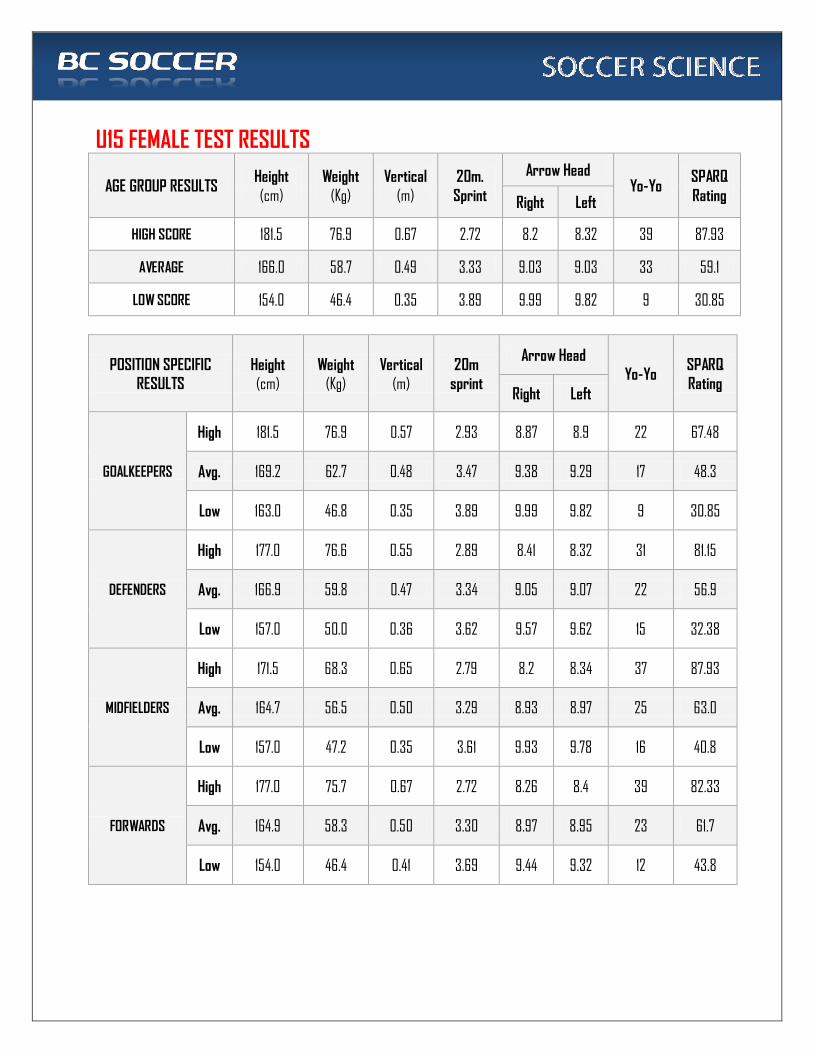
U15 FEMALE TEST RESULTS
AGE GROUP RESULTS Height
(cm)
Weight
(Kg)
Vertical
(m)
20m.
Sprint
Arrow Head Yo-Yo
SPARQ
RatingRight Left
HIGH SCORE 181.5 76.9 0.67 2.72 8.2 8.32 39 87.93
AVERAGE 166.0 58.7 0.49 3.33 9.03 9.03 33 59.1
LOW SCORE 154.0 46.4 0.35 3.89 9.99 9.82 9 30.85
POSITION SPECIFIC
RESULTS
Height
(cm)
Weight
(Kg)
Vertical
(m)
20m
sprint
Arrow Head
Yo-Yo SPARQ
Rating Right Left
GOALKEEPERS
High 181.5 76.9 0.57 2.93 8.87 8.9 22 67.48
Avg. 169.2 62.7 0.48 3.47 9.38 9.29 17 48.3
Low 163.0 46.8 0.35 3.89 9.99 9.82 9 30.85
DEFENDERS
High 177.0 76.6 0.55 2.89 8.41 8.32 31 81.15
Avg. 166.9 59.8 0.47 3.34 9.05 9.07 22 56.9
Low 157.0 50.0 0.36 3.62 9.57 9.62 15 32.38
MIDFIELDERS
High 171.5 68.3 0.65 2.79 8.2 8.34 37 87.93
Avg. 164.7 56.5 0.50 3.29 8.93 8.97 25 63.0
Low 157.0 47.2 0.35 3.61 9.93 9.78 16 40.8
FORWARDS
High 177.0 75.7 0.67 2.72 8.26 8.4 39 82.33
Avg. 164.9 58.3 0.50 3.30 8.97 8.95 23 61.7
Low 154.0 46.4 0.41 3.69 9.44 9.32 12 43.8
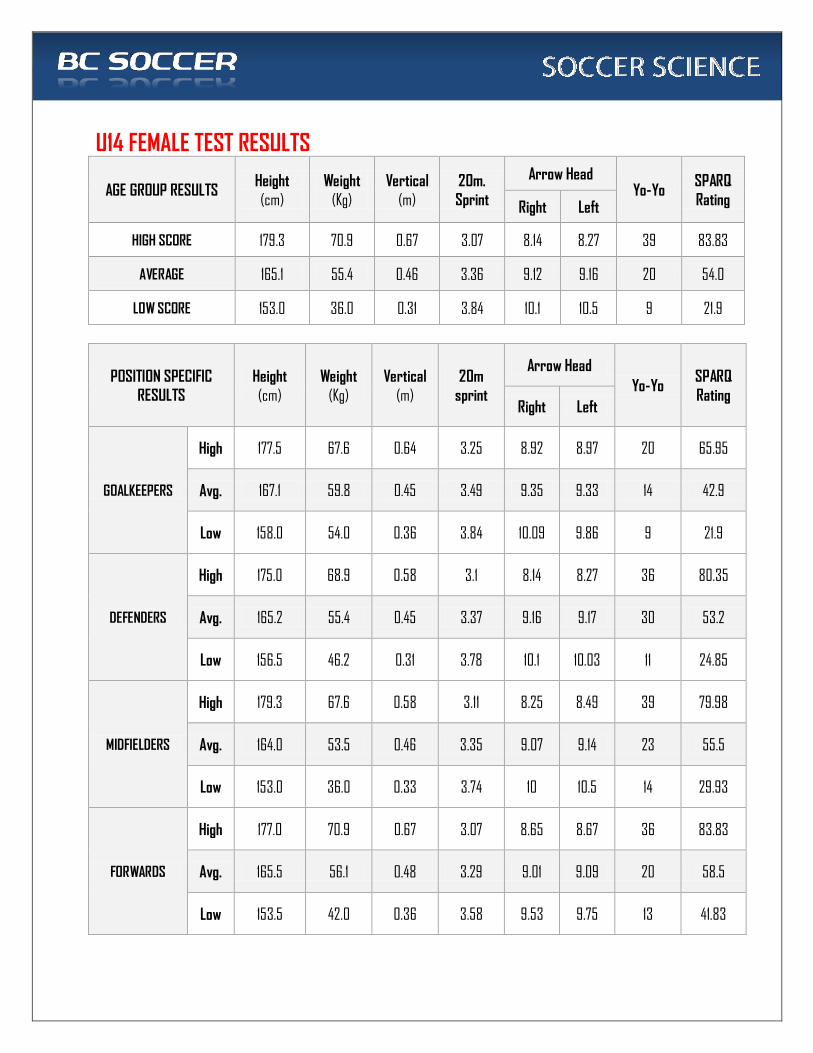
U14 FEMALE TEST RESULTS
AGE GROUP RESULTS Height
(cm)
Weight
(Kg)
Vertical
(m)
20m.
Sprint
Arrow Head Yo-Yo
SPARQ
RatingRight Left
HIGH SCORE 179.3 70.9 0.67 3.07 8.14 8.27 39 83.83
AVERAGE 165.1 55.4 0.46 3.36 9.12 9.16 20 54.0
LOW SCORE 153.0 36.0 0.31 3.84 10.1 10.5 9 21.9
POSITION SPECIFIC
RESULTS
Height
(cm)
Weight
(Kg)
Vertical
(m)
20m
sprint
Arrow Head
Yo-Yo SPARQ
Rating Right Left
GOALKEEPERS
High 177.5 67.6 0.64 3.25 8.92 8.97 20 65.95
Avg. 167.1 59.8 0.45 3.49 9.35 9.33 14 42.9
Low 158.0 54.0 0.36 3.84 10.09 9.86 9 21.9
DEFENDERS
High 175.0 68.9 0.58 3.1 8.14 8.27 36 80.35
Avg. 165.2 55.4 0.45 3.37 9.16 9.17 30 53.2
Low 156.5 46.2 0.31 3.78 10.1 10.03 11 24.85
MIDFIELDERS
High 179.3 67.6 0.58 3.11 8.25 8.49 39 79.98
Avg. 164.0 53.5 0.46 3.35 9.07 9.14 23 55.5
Low 153.0 36.0 0.33 3.74 10 10.5 14 29.93
FORWARDS
High 177.0 70.9 0.67 3.07 8.65 8.67 36 83.83
Avg. 165.5 56.1 0.48 3.29 9.01 9.09 20 58.5
Low 153.5 42.0 0.36 3.58 9.53 9.75 13 41.83
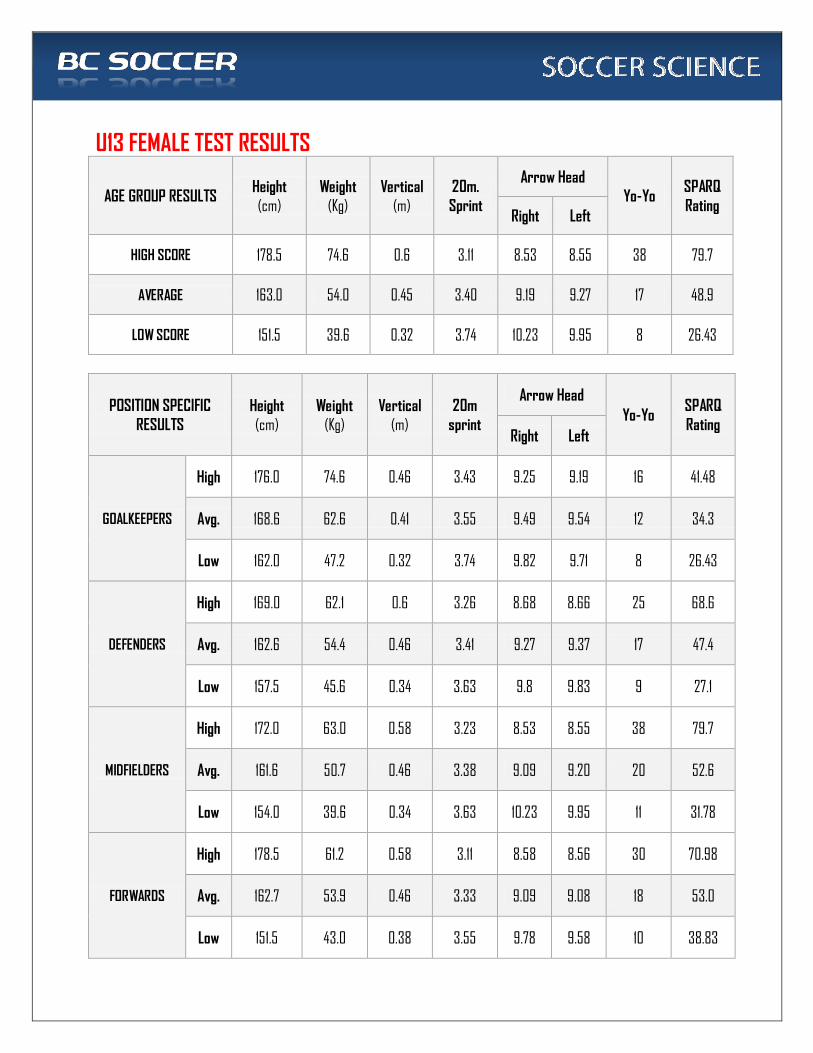
U13 FEMALE TEST RESULTS
AGE GROUP RESULTS Height
(cm)
Weight
(Kg)
Vertical
(m)
20m.
Sprint
Arrow Head
Yo-Yo SPARQ
RatingRight Left
HIGH SCORE 178.5 74.6 0.6 3.11 8.53 8.55 38 79.7
AVERAGE 163.0 54.0 0.45 3.40 9.19 9.27 17 48.9
LOW SCORE 151.5 39.6 0.32 3.74 10.23 9.95 8 26.43
POSITION SPECIFIC
RESULTS
Height
(cm)
Weight
(Kg)
Vertical
(m)
20m
sprint
Arrow Head
Yo-Yo SPARQ
Rating Right Left
GOALKEEPERS
High 176.0 74.6 0.46 3.43 9.25 9.19 16 41.48
Avg. 168.6 62.6 0.41 3.55 9.49 9.54 12 34.3
Low 162.0 47.2 0.32 3.74 9.82 9.71 8 26.43
DEFENDERS
High 169.0 62.1 0.6 3.26 8.68 8.66 25 68.6
Avg. 162.6 54.4 0.46 3.41 9.27 9.37 17 47.4
Low 157.5 45.6 0.34 3.63 9.8 9.83 9 27.1
MIDFIELDERS
High 172.0 63.0 0.58 3.23 8.53 8.55 38 79.7
Avg. 161.6 50.7 0.46 3.38 9.09 9.20 20 52.6
Low 154.0 39.6 0.34 3.63 10.23 9.95 11 31.78
FORWARDS
High 178.5 61.2 0.58 3.11 8.58 8.56 30 70.98
Avg. 162.7 53.9 0.46 3.33 9.09 9.08 18 53.0
Low 151.5 43.0 0.38 3.55 9.78 9.58 10 38.83
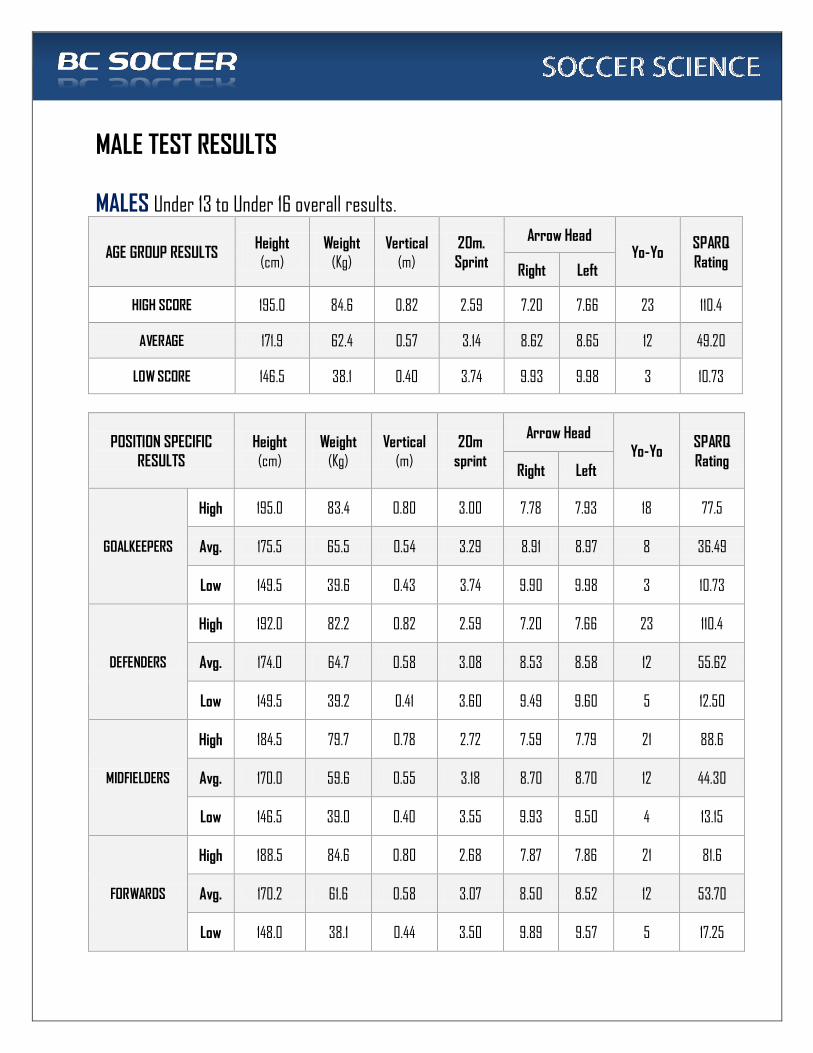
MALE TEST RESULTS
MALES Under 13 to Under 16 overall results.
AGE GROUP RESULTS Height
(cm)
Weight
(Kg)
Vertical
(m)
20m.
Sprint
Arrow Head Yo-Yo
SPARQ
RatingRight Left
HIGH SCORE 195.0 84.6 0.82 2.59 7.20 7.66 23 110.4
AVERAGE 171.9 62.4 0.57 3.14 8.62 8.65 12 49.20
LOW SCORE 146.5 38.1 0.40 3.74 9.93 9.98 3 10.73
POSITION SPECIFIC
RESULTS
Height
(cm)
Weight
(Kg)
Vertical
(m)
20m
sprint
Arrow Head Yo-Yo
SPARQ
Rating Right Left
GOALKEEPERS
High 195.0 83.4 0.80 3.00 7.78 7.93 18 77.5
Avg. 175.5 65.5 0.54 3.29 8.91 8.97 8 36.49
Low 149.5 39.6 0.43 3.74 9.90 9.98 3 10.73
DEFENDERS
High 192.0 82.2 0.82 2.59 7.20 7.66 23 110.4
Avg. 174.0 64.7 0.58 3.08 8.53 8.58 12 55.62
Low 149.5 39.2 0.41 3.60 9.49 9.60 5 12.50
MIDFIELDERS
High 184.5 79.7 0.78 2.72 7.59 7.79 21 88.6
Avg. 170.0 59.6 0.55 3.18 8.70 8.70 12 44.30
Low 146.5 39.0 0.40 3.55 9.93 9.50 4 13.15
FORWARDS
High 188.5 84.6 0.80 2.68 7.87 7.86 21 81.6
Avg. 170.2 61.6 0.58 3.07 8.50 8.52 12 53.70
Low 148.0 38.1 0.44 3.50 9.89 9.57 5 17.25
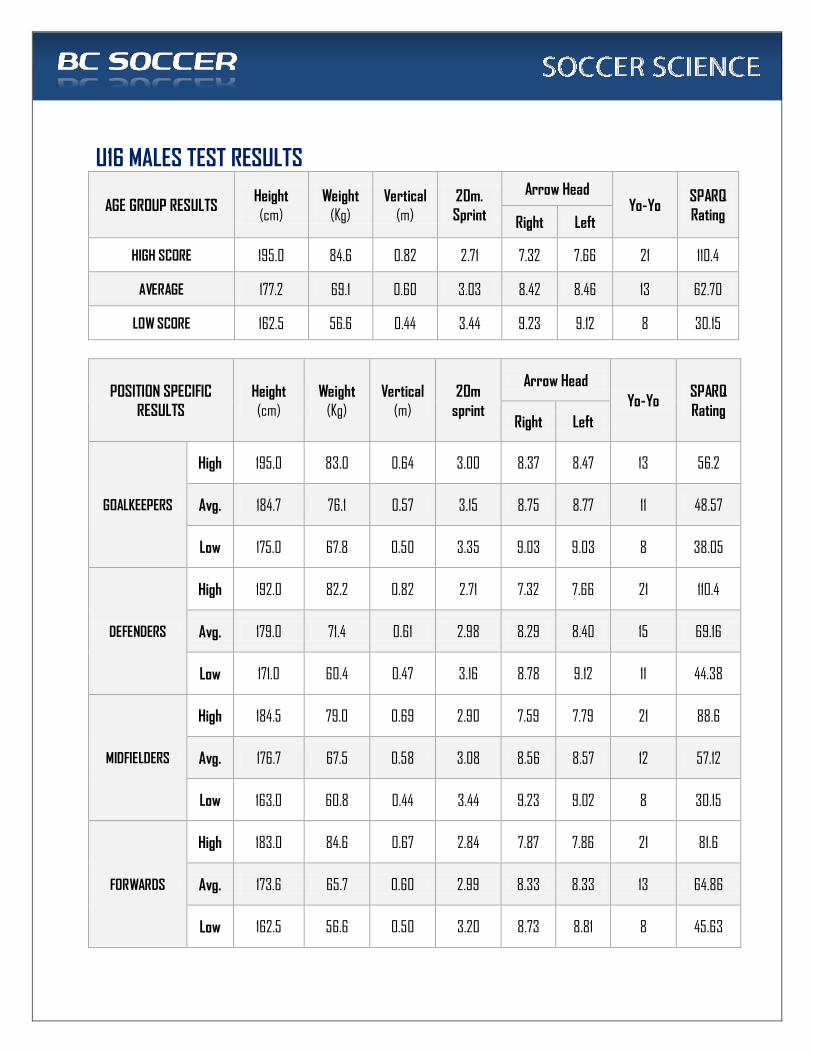
U16 MALES TEST RESULTS
AGE GROUP RESULTS Height
(cm)
Weight
(Kg)
Vertical
(m)
20m.
Sprint
Arrow Head Yo-Yo
SPARQ
RatingRight Left
HIGH SCORE 195.0 84.6 0.82 2.71 7.32 7.66 21 110.4
AVERAGE 177.2 69.1 0.60 3.03 8.42 8.46 13 62.70
LOW SCORE 162.5 56.6 0.44 3.44 9.23 9.12 8 30.15
POSITION SPECIFIC
RESULTS
Height
(cm)
Weight
(Kg)
Vertical
(m)
20m
sprint
Arrow Head
Yo-Yo SPARQ
Rating Right Left
GOALKEEPERS
High 195.0 83.0 0.64 3.00 8.37 8.47 13 56.2
Avg. 184.7 76.1 0.57 3.15 8.75 8.77 11 48.57
Low 175.0 67.8 0.50 3.35 9.03 9.03 8 38.05
DEFENDERS
High 192.0 82.2 0.82 2.71 7.32 7.66 21 110.4
Avg. 179.0 71.4 0.61 2.98 8.29 8.40 15 69.16
Low 171.0 60.4 0.47 3.16 8.78 9.12 11 44.38
MIDFIELDERS
High 184.5 79.0 0.69 2.90 7.59 7.79 21 88.6
Avg. 176.7 67.5 0.58 3.08 8.56 8.57 12 57.12
Low 163.0 60.8 0.44 3.44 9.23 9.02 8 30.15
FORWARDS
High 183.0 84.6 0.67 2.84 7.87 7.86 21 81.6
Avg. 173.6 65.7 0.60 2.99 8.33 8.33 13 64.86
Low 162.5 56.6 0.50 3.20 8.73 8.81 8 45.63

U15 MALES TEST RESULTS
AGE GROUP RESULTS Height
(cm)
Weight
(Kg)
Vertical
(m)
20m.
Sprint
Arrow Head
Yo-Yo SPARQ
RatingRight Left
HIGH SCORE 190.0 83.4 0.80 2.59 7.20 7.71 23 101.0
AVERAGE 175.9 67.3 0.59 3.07 8.51 8.52 12 57.26
LOW SCORE 154.5 44.8 0.40 3.65 9.72 9.32 7 27.50
POSITION SPECIFIC
RESULTS
Height
(cm)
Weight
(Kg)
Vertical
(m)
20m
sprint
Arrow Head
Yo-Yo SPARQ
Rating Right Left
GOALKEEPERS
High 190.0 83.4 0.80 3.02 7.78 7.93 18 77.5
Avg. 180.6 70.5 0.58 3.21 8.62 8.68 11 47.46
Low 174.0 58.6 0.46 3.65 9.15 9.16 7 27.50
DEFENDERS
High 189.5 79.3 0.80 2.59 7.20 7.71 23 101.0
Avg. 177.0 68.9 0.61 2.98 8.39 8.43 14 66.38
Low 164.0 56.8 0.43 3.26 8.98 9.03 8 34.50
MIDFIELDERS
High 183.5 79.7 0.78 2.72 7.69 7.98 21 79.4
Avg. 174.8 64.6 0.56 3.12 8.61 8.59 12 50.94
Low 164.0 50.8 0.40 3.46 9.72 9.22 7 28.88
FORWARDS
High 183.5 79.7 0.78 2.72 7.69 7.98 21 79.4
Avg. 174.8 64.6 0.56 3.12 8.61 8.59 12 50.94
Low 164.0 50.8 0.40 3.46 9.72 9.22 7 28.88
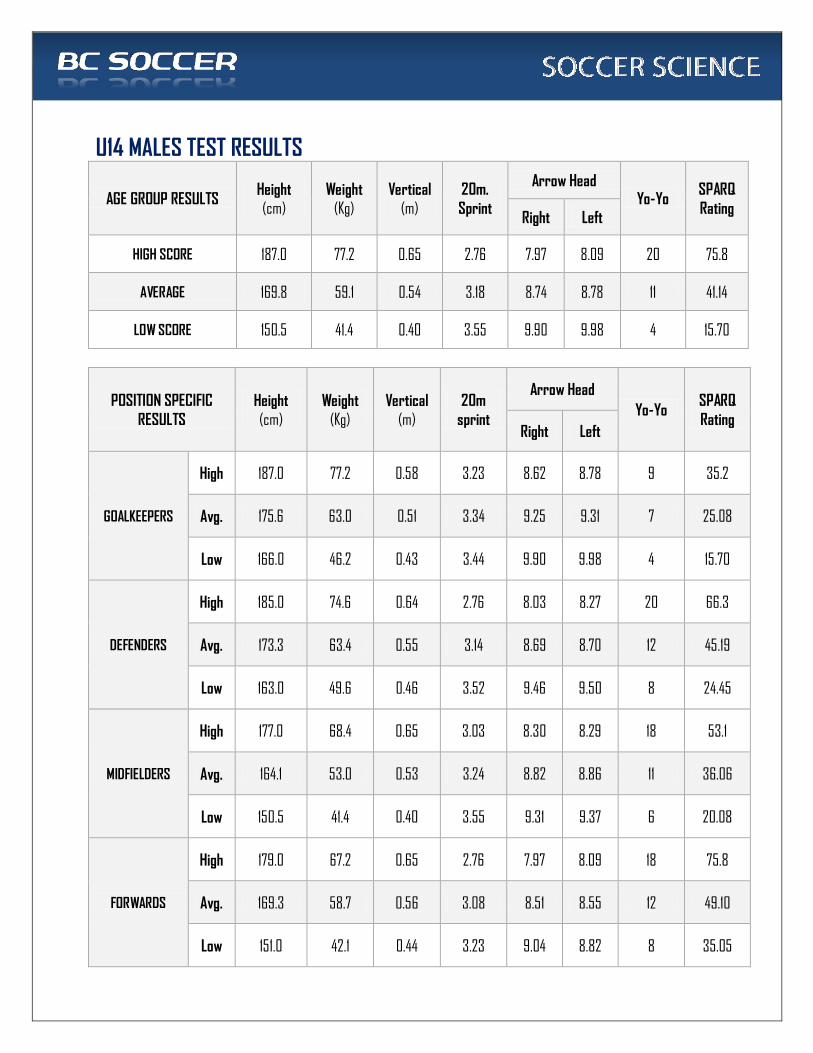
U14 MALES TEST RESULTS
AGE GROUP RESULTS Height (cm)
Weight (Kg)
Vertical (m)
20m.
Sprint
Arrow Head Yo-Yo
SPARQ
RatingRight Left
HIGH SCORE 187.0 77.2 0.65 2.76 7.97 8.09 20 75.8
AVERAGE 169.8 59.1 0.54 3.18 8.74 8.78 11 41.14
LOW SCORE 150.5 41.4 0.40 3.55 9.90 9.98 4 15.70
POSITION SPECIFIC
RESULTS
Height
(cm)
Weight
(Kg)
Vertical
(m)
20m
sprint
Arrow Head
Yo-Yo SPARQ
Rating Right Left
GOALKEEPERS
High 187.0 77.2 0.58 3.23 8.62 8.78 9 35.2
Avg. 175.6 63.0 0.51 3.34 9.25 9.31 7 25.08
Low 166.0 46.2 0.43 3.44 9.90 9.98 4 15.70
DEFENDERS
High 185.0 74.6 0.64 2.76 8.03 8.27 20 66.3
Avg. 173.3 63.4 0.55 3.14 8.69 8.70 12 45.19
Low 163.0 49.6 0.46 3.52 9.46 9.50 8 24.45
MIDFIELDERS
High 177.0 68.4 0.65 3.03 8.30 8.29 18 53.1
Avg. 164.1 53.0 0.53 3.24 8.82 8.86 11 36.06
Low 150.5 41.4 0.40 3.55 9.31 9.37 6 20.08
FORWARDS
High 179.0 67.2 0.65 2.76 7.97 8.09 18 75.8
Avg. 169.3 58.7 0.56 3.08 8.51 8.55 12 49.10
Low 151.0 42.1 0.44 3.23 9.04 8.82 8 35.05
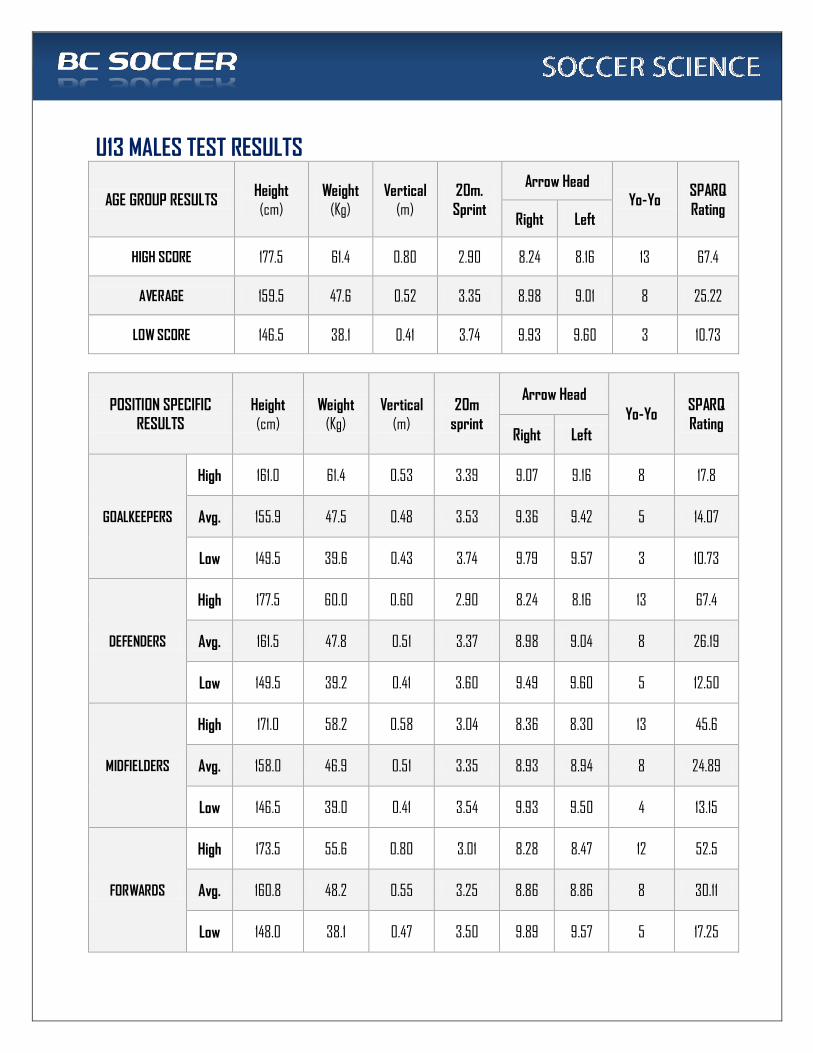
U13 MALES TEST RESULTS
AGE GROUP RESULTS Height
(cm)
Weight
(Kg)
Vertical
(m)
20m.
Sprint
Arrow Head Yo-Yo
SPARQ
RatingRight Left
HIGH SCORE 177.5 61.4 0.80 2.90 8.24 8.16 13 67.4
AVERAGE 159.5 47.6 0.52 3.35 8.98 9.01 8 25.22
LOW SCORE 146.5 38.1 0.41 3.74 9.93 9.60 3 10.73
POSITION SPECIFIC
RESULTS
Height
(cm)
Weight
(Kg)
Vertical
(m)
20m
sprint
Arrow Head
Yo-Yo SPARQ
Rating Right Left
GOALKEEPERS
High 161.0 61.4 0.53 3.39 9.07 9.16 8 17.8
Avg. 155.9 47.5 0.48 3.53 9.36 9.42 5 14.07
Low 149.5 39.6 0.43 3.74 9.79 9.57 3 10.73
DEFENDERS
High 177.5 60.0 0.60 2.90 8.24 8.16 13 67.4
Avg. 161.5 47.8 0.51 3.37 8.98 9.04 8 26.19
Low 149.5 39.2 0.41 3.60 9.49 9.60 5 12.50
MIDFIELDERS
High 171.0 58.2 0.58 3.04 8.36 8.30 13 45.6
Avg. 158.0 46.9 0.51 3.35 8.93 8.94 8 24.89
Low 146.5 39.0 0.41 3.54 9.93 9.50 4 13.15
FORWARDS
High 173.5 55.6 0.80 3.01 8.28 8.47 12 52.5
Avg. 160.8 48.2 0.55 3.25 8.86 8.86 8 30.11
Low 148.0 38.1 0.47 3.50 9.89 9.57 5 17.25