Fitch Ratings, Inc. Exhibit 2. Procedures and Methodologies for Determining Credit Ratings ·...
97
Fitch Ratings, Inc. 2016 Annual Certification to Form NRSRO Exhibit 2. Procedures and Methodologies for Determining Credit Ratings Fitch’s procedures and methodologies for assigning ratings are consistent with the Fitch Ratings Code of Conduct, and documented in detail in a combination of the agency’s published criteria and methodologies and its internal policies and procedures. A general summary of these procedures and methodologies can be found in several Special Reports and Criteria Reports attached. “The Rating Process”, dated March 30, 2015, i) addresses Fitch’s general approach to initiating and monitoring ratings including interactions with management of rated obligors, structuring and voting process of committees, informing rated obligors of the ratings and monitoring, reviewing and updating the ratings; ii) describes policies by which Fitch determines to initiate a rating on a new or complex transaction; and iii) and addresses the process for developing and evaluating criteria as well as how and when we apply material changes in criteria including, where relevant, changes to models. Please note that we see models as part of our criteria. Thus, where a model forms a key part of our rating process, the model and its applications are described within the relevant criteria report. Issues regarding how we take into account the ratings of other NRSROs can be found in “Global Rating Criteria for CLOs and Corporate CDOs,” published November 12, 2015, and “Global Surveillance Criteria for Structured Finance CDOs,” published July 13, 2015. Finally, a complete list of Fitch’s criteria reports and exposure drafts published in 2015 is attached.
Transcript of Fitch Ratings, Inc. Exhibit 2. Procedures and Methodologies for Determining Credit Ratings ·...

Fitch Ratings, Inc.
2016 Annual Certification to Form NRSRO
Exhibit 2. Procedures and Methodologies for Determining Credit Ratings
Fitch’s procedures and methodologies for assigning ratings are consistent with the Fitch Ratings Code of Conduct, and documented in detail in a combination of the agency’s published criteria and methodologies and its internal policies and procedures. A general summary of these procedures and methodologies can be found in several Special Reports and Criteria Reports attached. “The Rating Process”, dated March 30, 2015, i) addresses Fitch’s general approach to initiating and monitoring ratings including interactions with management of rated obligors, structuring and voting process of committees, informing rated obligors of the ratings and monitoring, reviewing and updating the ratings; ii) describes policies by which Fitch determines to initiate a rating on a new or complex transaction; and iii) and addresses the process for developing and evaluating criteria as well as how and when we apply material changes in criteria including, where relevant, changes to models. Please note that we see models as part of our criteria. Thus, where a model forms a key part of our rating process, the model and its applications are described within the relevant criteria report. Issues regarding how we take into account the ratings of other NRSROs can be found in “Global Rating Criteria for CLOs and Corporate CDOs,” published November 12, 2015, and “Global Surveillance Criteria for Structured Finance CDOs,” published July 13, 2015. Finally, a complete list of Fitch’s criteria reports and exposure drafts published in 2015 is attached.

Credit PolicyCross-Sector / Global
The Ratings ProcessThe Ratings Process under Fitch CriteriaSpecial Report
Fitch Ratings provides forward-looking credit opinions, as indicated by its ratings, that reflect its expectations of credit behavior over a range of scenarios. To achieve its objectives, Fitch follows standardized procedures, as described in this report, to ensure a globally consistent approach in the conduct of its rating processes. Additional information related to structured finance is included in Appendix I. For purposes of this report, an “issuer” denotes an issuer, rated entity or transaction.
Start of the Ratings Process: The rating process begins when an arranger, issuer, sponsor, or underwriter contacts a member of Fitch’s Business Relationship Management (BRM) group with a request to engage Fitch. Fitch may alternatively choose to initiate rating coverage on an unsolicited basis where sufficient public information is available to broaden industry coverage or provide insight to subscribers or the public debt market.
Assignment of the Analytical TeamManager’s Role: The manager leading the relevant product group will assign a primary and secondary analyst to lead the analysis, formulate a rating recommendation and, outside of the Structured Finance and select U.S. Public Finance groups, continue surveillance of the rating.
Structured Finance Ratings: For structured finance, once an initial rating is assigned, surveillance is typically transferred to a dedicated surveillance analyst, although for someassets, day-to-day surveillance activities may remain with the primary analyst.
U.S. Public Finance Ratings: For U.S. public finance, the primary analyst is responsible for leading the analysis and formulating a rating recommendation, but surveillance responsibilities vary by sector.
Analyst Role: Fitch analysts conduct their analyses in a manner consistent with published criteria applicable to the particular entity, transaction type, asset class, region or sector. Analysts and committee members are required to consider relevant qualitative and quantitative factors as defined in applicable criteria and methodologies.
Analysts may rotate coverage responsibility over time as deemed appropriate by analytical group managers and in accordance with applicable laws and regulations.
This report replaces the report of the same title dated Dec. 2, 2011.
Related ResearchFitch Ratings Code of Conduct(August 2014)Global Securities Trading and Conflicts of Interest Policy (March 2015)
AnalystsLondonTrevor Pitman+44 020 [email protected]
ChicagoJames Moss+1 312 [email protected]
Business Relationship ManagementNew York+1 212 908-0500
London+44 207 417-4222
www.fitchratings.com March 30, 2015

Credit Policy
Information Used to Determine a RatingThe rating process incorporates information provided directly by the rated issuer, arranger, sponsor or other third party. This may include background data, forecasts, risk reports or factual feedback on proposed analytical research and other communications. In most cases, issuer management participates in the ratings process via in-person management and treasury meetings, on-site visits, teleconferences and other correspondence. In addition analysts consider macroeconomic conditions, market events and any other factors deemed relevant, such as information from an issuer’s peers or provided by other analytical groups within Fitch.
The analytical team conducting the analysis will determine if sufficient information is available to recommend a view on creditworthiness of the issuer. Collectively, the rating committee will also consider whether there is sufficient information to support a rating. If Fitch believes that the information available, both public and private, is insufficient to form a rating opinion, no credit rating will be assigned or maintained. If sufficient information ceases to become available, Fitch will withdraw the rating.
Fitch relies on information it receives from sources believed to be credible. Fitch conducts a reasonable investigation of data accuracy and obtain(s) reasonable verification of that information from independent sources. Issuers (or arrangers/sponsors) may choose not to share certain information with external parties, including rating agencies, at any time. While Fitch expects that each participating issuer in the rating process, or its agents, will supply promptly all information relevant for evaluating both the ratings of the issuer and all relevant securities, Fitch neither has, nor would it seek, the right to compel the disclosure of information by any issuer or any agents of the issuer.
Pre-Committee ProcessIf necessary, a transaction screening committee (TSC) may be held to determine whether a fullrating process should proceed. A TSC is not itself a rating committee but is rather a cross-disciplinary committee that provides an additional layer of review to consider certain rating proposals for new security, transaction or issuer types early in the rating process. Such proposals may have unique or complex features or characteristics that require a broader, interdisciplinary review to assess how certain credit risks should be considered. The primary purpose of the TSC is to determine the feasibility of assigning an international scale rating to a new security. Committees are selected from a designated pool of senior members of Fitch’sanalytical groups and Credit Policy group.
The Committee ProcessRatings are assigned and reviewed through a committee process. Once information has been collected and the issuer analyzed in accordance with Fitch’s criteria and methodologies, the primary analyst makes a rating recommendation and documents his/her analysis and rationale in a committee package. Committees consider the information and rating recommendation presented in the committee package and discuss the primary analyst’s recommendation.
Voting members are chosen based on relevant experience, with seniority and experience thresholds incorporated into Fitch’s committee quorum requirements. The minimum committee size for international credit rating decisions is generally five analysts, although committees often include more members. Committees include:
A chair who moderates the committee and ensures that it is conducted in accordance with Fitch’s policies and procedures.
The Ratings Process 2March 30, 2015
Credit Policy
At least one independent member from outside the immediate asset class, subsector or geographic area of the entity under review, since peer analysis (on a transaction or entity basis) is a central element of the rating committee’s discussion.
In limited circumstances in Structured Finance, committees may have reduced quorum requirements for example, for affirmations based on a standard screening tool, for confirmations in response to non-material transaction changes, to assign ratings to tap issuances where there have been no credit-related changes to the issuer or to downgrade an existing rating of ‘CC’ or below to ‘D’.
The rating committee considers the relevant quantitative and qualitative issues, as defined in Fitch’s established criteria and methodologies, to arrive at the rating that most appropriately reflects both current conditions and prospective performance. If the committee agrees on a rating and also agrees that the information supporting that rating decision is sufficient and robust, a rating is assigned.
Committee decisions are reached by consensus, and neither individual committee member votes nor individual views expressed are recorded with the exception of a rating appeal. In the event that the chairperson determines that further analysis or information is required before the committee can move to a vote, the committee will be suspended to allow this material to be gathered.
Analysts maintain a dialogue with the participating issuer during and following the rating process to resolve any outstanding issues and to request additional information, where applicable, in continuing with monitoring activity.
In limited circumstances, ratings that have been determined by a rating committee may subsequently be applied to new debt issues without holding an additional rating committee provided that: i) the rating determined by the previous committee is applicable to the specific class of debt concerned; and ii) there have been no material changes to the credit profile of the issuer since the previous rating committee. In all such cases, Fitch identifies the date of the relevant rating committee in the new debt issue rating announcement. In addition, assuming publication is within four weeks of the committee that assigned the rating and there have been no subsequent credit events, rating committees are not required to convert i) a new unpublished rating to a public rating and ii) an expected rating to a final rating.
Issuer Notification and Rating DisseminationOnce the committee concludes, the outcome is communicated to the issuer or, where applicable, its arranger/sponsor. The issuer notification requirement is subject to certain exceptions where necessary and appropriate i) to address time-sensitive, event driven rating actions for example, in response to the public announcement of an issuer debt default. In such cases, issuer notification is given as soon as practical after publication of the rating, ii) to address bulk rating action reviews in U.S. structured finance, iii) to address cases where Fitch does not have an appropriate contact (e.g. certain non-participating issuers), and iv) to address rating actions taken on existing dependent ratings for example, rating actions taken on bank letter-of-credit enhanced debt following a bank rating action.
In communicating the rating to the issuer (or arranger/sponsor), the primary analyst explains the key ratings drivers and sensitivities to these drivers to facilitate the issuer’s understanding of the principal grounds on which the rating is based, as well as the sensitivity and potential volatility of the rating. Typically, analysts use a draft rating action commentary (or a draft presale report in structured finance), which includes the committee’s ratings decisions, to
The Ratings Process 3March 30, 2015

Credit Policy
convey this information. The primary analyst provides the issuer (or arranger/sponsor) with the opportunity to review Fitch’s rating action commentary (or presale report) prior to publication to allow the issuer (or arranger/sponsor) to check for factual accuracy and the presence of non-public information.
Fitch evaluates any feedback or comments from issuers but nevertheless retains full editorial control over its commentaries. Fitch typically aims to publish rating actions on existing public ratings by the end of the next business day following the conclusion of the committee, unless the rating is subject to appeal or subject to other constraints, such as credit rating agency regulations governing the timing of rating announcements for example those relating to sovereign and international public finance rating actions in the European Union (EU) or issuer notification requirements. Fitch also aims to publish new public ratings shortly after the rating committee and subject to the same considerations as outlined above. However, the exact timing of new rating announcements can also be affected by other factors. For example, if the rating relates to a new debt issue, Fitch’s internal procedures require that it delay its rating announcement until knowledge of the debt issue is in the public domain.
When the primary analyst is based in an EU-registered entity, a branch of an EU-registered entity or Fitch Southern Africa, notification of any rating action is given in writing to the issuer (or arranger/sponsor) at least one full working day before publication of the credit rating or Rating Outlook. In other jurisdictions, notification is provided in writing at least 12 hours before publication of the rating decision. If the issuer provides feedback within the notification period that it has no outstanding comments, the rating may be published before waiting for the specific notification period to elapse.
The primary analyst records the issuer’s response status in Fitch’s publishing application before a rating action commentary is released. However, if the issuer provides verbal feedback, the primary analyst will contact the issuer representative in writing to confirm the nature of his/her feedback and that the rating will be published.
All rating actions for new or existing publicly rated issuers are published on Fitch’s website and, as appropriate, are simultaneously released to major newswire services. These rating action commentaries provide a rationale for the rating decision based on the key ratings drivers and sensitivities and identify the criteria applied in the rating process. Any exceptions to Fitch’s published criteria that occurred in determining the rating are clearly disclosed and explained in the commentary.
The timing of publication reflects the important balance between allowing sufficient time for the issuer to review the rating rationale for factual accuracy and the presence of confidential information and requirements of the users of ratings for timely and objective opinions. In addition to Fitch’s published rating action commentaries, a research report may be published about issuers individually or by industry and made available to subscribers on Fitch’s website.
Differences of OpinionAn issuer may request an appeal, referred to as an external appeal, of a rating decision;however, there is no specific right to an appeal. Appeals will only be granted when an issuer provides new or additional information in a timely manner that Fitch believes is relevant to the rating.
Where an appeal review is deemed appropriate, a new committee is convened to reconsider the rating decision in light of the new information. This committee is composed of the chair of the original committee, senior-level analysts who did not attend the previous committee and
The Ratings Process 4March 30, 2015

Credit Policy
certain members of the original committee to reconsider the rating analysis. Fitch endeavors to complete the appeal review of new ratings as quickly as possible and preferably within two business days. In cases where the review of an existing rating is not finalized during the two-day time frame, the rating may be placed on Rating Watch.
In the event that an external appeal committee results in a rating decision that is different from the original committee decision that was appealed, this fact will be disclosed in the rating action commentary. Specifically, the commentary will note that the original rating outcome was subject to appeal and that, following the appeal, the rating outcome is different from the original decision. However, the original rating committee decision will not be included in the published commentary.
Surveillance of RatingsFitch’s ratings are typically monitored on an ongoing basis and the review process is a continuous one. Monitored ratings are subject to regular scheduled reviews by a rating committee, typically annually, although the review frequency may vary if deemed appropriate by Fitch or where required by applicable local law. Point-in-time ratings are not monitored on an ongoing basis. Such ratings are rarely published, but where they are, they are clearly disclosed as “point-in-time” in the accompanying rating action commentary.
If a business, financial, economic, operational or other development can reasonably be expected to result in a rating action, analysts will convene a committee promptly to review the rating instead of waiting for the next scheduled review. For example, operational or fiscal deterioration, an acquisition, a divestiture or the announcement of a major share repurchase may trigger an immediate rating review.
Fitch’s surveillance process incorporates the use of market indicators where available, such as bond and CDS pricing information, and a broader array of financial information, systemic risk and operational risk analyses. Fitch continues to develop tools appropriate to the surveillance task.
Peer analysis is another surveillance method that is used primarily to assess the relative performance of comparable corporate entities and financial institutions over time. Peer groups are created based on similar fundamentals and rating levels, among other factors. Results of Fitch’s peer analysis are included in research such as Ratings Navigator, a peer comparison tool used by the Corporate and Financial Institutions groups, which provides a graphical representation of key rating drivers against peer expectations for a given rating category.
Scenarios for structured finance are generally based on quantitative metrics. In addition, ratings performance will be monitored with surveillance techniques to evaluate the impact of stress scenarios on multiple transactions. Such tools will typically track data from surveillance reports provided by the trustee and compare the information against original and stressed expectations to “flag” transactions where performance has diverged from established parameters.
Base and Stress CasesRatings reflect Fitch’s forward looking views of future performance based on historical performance through various economic cycles. Fitch typically analyses credit characteristics under several scenarios to determine the likelihood that current ratings expectations will be met and, if not, the extent of the change. Scenarios include a base case that reflects Fitch’s current outlook and stress cases. Stress cases include the probability of deteriorating credit metrics,
The Ratings Process 5March 30, 2015

Credit Policy
the degree of flexibility in adjusting to a stress scenario and the impact a stress case would have on ratings. Stress cases are based on historical events that are outside normal business cycles. Event risk is not considered in most ratings, and as a result, ratings may change due to a merger, acquisition, sudden weather changes or political events that alter expected financial performance in the near term.
Timing of the ProcessThe time required to assign a new rating varies and will partly depend on the time required by the issuer (or arranger/sponsor) to respond to information requests from Fitch if information is not publicly available, as well as the time it takes the issuer to review Fitch’s draft research for factual errors and the presence of non-public information.
Depending on the sector and type of credit analysis involved, Fitch typically assumes a time frame of four to eight weeks to provide a full corporate, financial institution, sovereign or structured finance rating.
Rating WithdrawalsFitch’s ratings remain its property at all times. As such, Fitch has full discretion to determine if and when to withdraw a rating. Fitch can choose to withdraw a rating at any time and for any reason. Rating withdrawals are generally determined by convening a rating committee in accordance with Fitch’s established procedures
It is Fitch’s policy in such cases to publish a rating action commentary that includes the current rating(s) and states that the rating(s) has been withdrawn, that Fitch will no longer provide rating(s) or analytical coverage of the issuer and the rationale for the withdrawal. However, withdrawal announcements are not issued for ratings that relate to obligations that have matured, been redeemed, paid in full or to issuers that have ceased to exist.
Product RangeIn addition to published international and national scale ratings, Fitch offers a number of additional services within the core rating business.
Fitch prepares a limited number of private ratings (i.e. unpublished ratings) for entities, if a rating is requested. These ratings are typically provided directly to the rated entity. Private ratings undergo the same analysis, committee process and surveillance as published ratings, unless otherwise disclosed as “point-in-time” in nature (see the Surveillance of Ratings section,page 5).
Fitch also provides a rating assessment service (RAS) to rated entities under certain circumstances. A RAS indicates what rating level that an issuer and its obligations would likely receive given a set of hypothetical assumptions provided by the assessed entity. This assessment is conducted under the same procedural standards as other ratings and is performed by the analytical group responsible for that entity. Rating feedback is provided to the assessed entity or its agent or the entity’s majority owner or its agent, in writing, including a detailed list of assumptions and limitations applied in the assessment. Ratings from RAS are not made public as they are based on hypothetical, rather than actual, scenarios. However, in accordance with EU regulatory requirements, Fitch discloses cases where it has provided such a service and the primary analyst is based in an EU-registered entity or a branch of an EU-registered entity.
The Ratings Process 6March 30, 2015

Credit Policy
Finally, Fitch provides credit opinions on entities and transactions where one or more characteristics of a full rating are omitted or meet a different standard. This form of opinion may be based on more limited information and is subject to an abbreviated committee process. Credit opinions are delineated by either an asterisk (e.g. ‘BBB+*’) or a suffix (cat) indicating that the opinion is conditional and not comparable in all regards to published ratings at that level. In most cases, credit opinions are provided on a confidential basis. Credit opinions are not formal ratings and should not be employed by rating users without consideration of any limitations that they may have or any conditions attached to their use.
Unsolicited RatingsFitch believes that investors benefit from increased rating coverage by Fitch, whether such ratings are solicited by issuers or investors or are unsolicited.
The criteria, committee procedures and minimum information standards are no different for unsolicited and solicited ratings. Therefore, ratings assigned to issuers with similar credit characteristics are comparable; solicitation status has no effect on the level of the ratings assigned.
Quality Standards for RatingsTo ensure the quality of its product, common processes apply in assigning ratings to entities globally within all Fitch offices, irrespective of size or location. Methodologies for each of its businesses are generally constructed on a global basis. Sector criteria are developed to allow for specific qualitative or quantitative thresholds that may vary between jurisdictions.
All published criteria reports are reviewed and approved prior to use by a Criteria Review Committee (CRC) at least annually and proposals to amend criteria between annual reviews are required to be approved by a CRC. The CRC is an independent forum that evaluates the sufficiency, transparency and rigor of criteria for international credit ratings.
Fitch’s Chief Risk Officer, who is independent from the analytical groups, is responsible for risk management for Fitch Group. Fitch’s Credit Policy group (CPG) and Global Compliance group report to the Chief Risk Officer. Together these groups ensure that Fitch’s credit ratings criteria, policies and procedures are consistently executed, that ratings are comparable across the firm and that the firm complies with applicable laws and regulations.
CPG is a global, centralized function with a cross-sector mandate to identify sustained shifts in risk profiles, review the performance of Fitch’s ratings and respond to complaints relating to the rating process. The group includes the Chief Credit Officer, Group Credit Officers, Regional Credit Officers, a Chief Criteria Officer, a Director for Model Management and a Credit Market Research team. The Chief Credit Officer, Chief Criteria Officer and Director of Model Management each report to the Chief Risk Officer for Fitch Group.
The Global Compliance group identifies and provides advice on compliance risks facing Fitch, creates a control environment to ensure compliance with laws, regulations, guidelines and specifications relevant to Fitch’s business and monitors employee activity to ensure effectiveness of controls, including those to mitigate conflicts of interest.
Within Fitch’s Global Compliance group, the Compliance Audit group (CAG) conducts a compliance audit program designed to continually assess Fitch’s compliance with the Code of Conduct and other established policies, procedures and controls with respect to Fitch’s credit ratings and related activities.
The Ratings Process 7March 30, 2015

Credit Policy
Criteria Reports DefinedCriteria reports describe Fitch’s analytical methodology used to assign ratings. The application of consistent criteria facilitates the comparability of Fitch’s ratings across regions and sectors.
Fitch’s forward-looking ratings approach evaluates credit risks that could impact the future credit quality of a borrower or debt instrument. Criteria reports identify the credit factors considered in the rating process, prioritize those credit factors into key ratings drivers and describe the strengths and limitations of Fitch’s analysis.
Scope of Criteria ReportsEach criteria report specifies the scope and sector to which the criteria apply, including a definition of the entity or securities to which the criteria apply. For example, if the scope of the report is specific to a geographic region, a report title that clearly reflects that point is used.
Explaining Rating FactorsCriteria identify and prioritize quantitative and qualitative credit factors relevant to each rating sectors and describe their relative importance by identifying key rating drivers. Fitch updates criteria where new and significant factors emerge or previous drivers are no longer relevant.
The relative importance of the rating factors identified is explained in each published rating action commentary.
AssumptionsCriteria reports define what critical factors are used to establish the assumptions on which a rating is based. Where multiple sensitivity analyses or forecasts are employed in the rating analysis, the criteria will describe in broad terms how these multiple analyses interact in the rating decision.
Where a rating is exposed to a limited number of key variables, such as the performance of a static pool of assets, the criteria will describe how sensitivity analyses would be applied to these variables. When an expected case and stress case analysis are appropriate for a sector, both cases would be described in the report.
LimitationsCriteria reports describe limitations in the criteria used to assign a rating, unless the limitations are already included in the Ratings Definitions section on Fitch’s website at www.fitchratings.com.
Fitch provides clear public guidance on the following whenever criteria, models and key rating assumptions are first published and/or materially changed:
The assumptions, parameters, limits and uncertainties surrounding models and criteria.Stress scenarios undertaken in the new or changed criteria, models and key rating assumptions.
Establishing Criteria and MethodologiesRating criteria reports describe the methodology used in assigning ratings. Criteria are developed to be rigorous and systematic to maintain the high quality of Fitch’s ratings and their comparability across sectors. Criteria describe the key credit factors in a way that would allow
The Ratings Process 8March 30, 2015

Credit Policy
a financial market professional to review the criteria, look at published rating reports and commentary and understand how Fitch reached a given rating.
Models are tools that are often used to supplement qualitative ratings analysis. In many cases, quantitative models are developed to generate projections of the credit performance of issuers or issues under various scenarios, as defined by rating criteria. The rating of an issuer may not involve a model or may involve a single or multiple models. The importance of a model in generating rating opinions ranges from substantial to minor. Ratings are determined by committees and discussion. Rating criteria provide information on how model projections are used in the overall rating process.
Surveillance CriteriaWhen surveillance analysis differs from new issue rating criteria, Fitch will publish surveillance criteria either as a stand-alone report or as an extension of an existing report. New surveillance criteria describe how Fitch would evaluate a criteria change for existing ratings that are maintained using surveillance criteria. Such criteria are subject to the same procedures as all other criteria.
Criteria ExceptionsRating committees make the final decision on ratings and application of criteria. In some cases, a deviation may be appropriate when analysts evaluating issuers or issues identify a new risk characteristic. If deviations become frequent, criteria may be modified.
Methodology ErrorsFitch has established procedures to address instances where a methodology or model error is suspected. Procedures delineate the range of potential and actual errors and describe the escalation, review, remediation and notification requirements for each.
The procedures describe the process for reviewing the affected methodology and/or model,including error correction, model revalidation and subsequent committee review. Further, the procedures describe how the methodology’s and related model’s use can continue or whether their use should be temporarily or permanently suspended.
Depending on the nature and magnitude of the error, affected ratings may be placed on Rating Watch until the issues are resolved. If the methodology error has extensive rating implications and cannot be resolved promptly, additional steps may be taken, including rating moratoriums and/or the withdrawal of existing ratings.
Applying Criteria Changes Any approved criteria, model or key rating assumption changes are applied to both the new and the existing portfolio of outstanding ratings. Rating Outlooks or Rating Watches are considered the means of indicating that a review is under way following a change to applicable criteria. A review of the affected ratings will be completed within six months from the effective date of the criteria.
The Ratings Process 9March 30, 2015

Credit Policy
Communicating Criteria
Exposure DraftsExposure drafts for proposed criteria and any proposed changes to criteria, models or key rating assumptions that could cause material rating changes are published on Fitch’s website with an invitation to third parties to submit comments for at least one month. The publication of these new or materially changed criteria, models or key rating assumptions includes a detailedexplanation of the reasons for and the implications of the proposed material changes.
After Fitch has assessed the responses, it will publish the results of the consultation and the content of the responses unless the respondent has requested confidentiality about the contents of its response. The criteria arising from the consultation and an explanation will be published, including the date from which the revised criteria apply. Fitch will only publish the results of non-confidential submissions provided in writing; it will not publish oral submissions.
Criteria ChangesCredit rating criteria are publicly disclosed in full on Fitch’s website at www.fitchratings.com. Publication of criteria will be accompanied by a press release describing the changes made,including any impact of the criteria change on outstanding ratings. Minor changes to criteria that reflect characteristics of a particular transaction are communicated in the rating action commentary for the respective transaction or rated entity. Criteria changes are effective immediately upon publication unless an alternative effective date is stated.
Fees Fitch has a dedicated BRM group that is responsible for managing the commercial aspects of issuer relationships. Fitch’s policy is that all discussions with issuers and intermediaries concerning rating fees and commercial matters be handled exclusively by its BRM team. In addition, references to any commercial aspect of Fitch’s relationship with issuers are similarly not permitted during any analytical discussion.
The Ratings Process 10March 30, 2015

Credit Policy
Appendix I Supplemental Information for Structured FinanceThis appendix describes processes unique to structured finance and supplements information previously provided.
Information Used to Determine a RatingFitch obtains preliminary pool information and transaction term sheets either by accessing a password protected website as set forth by SEC Rule 17g-5 for U.S. transactions or directly from the arranger, issuer or sponsor.
As part of the transaction analysis, Fitch typically receives originator-specific historical performance data relevant to the securitized asset pool for the longer of the following: five years; or a period covering all phases of at least one economic cycle. If sufficient originator-specific information is not available, significant marketwide historical performance data covering at least the same time frame may often provide proxy information. This would be the case, in particular, for asset classes where the originator information may provide a limited contribution to the expected asset performance.
For some asset classes, such as U.S. CMBS, Fitch performs and relies on its own review for verifying certain underlying collateral information. The results of the review of the underlying pool, as well as the outcome of reasonable investigation into the information used in the analysis, are assessed and presented to the rating committee.
Information provided to Fitch includes not only data on the underlying assets for the initial rating, but also information used to:
Assess the veracity of asset-level data.Assess the quality and viability of parties to the transaction.Assess the financial and legal structure of the transaction.Assess if the legal opinions are consistent with and supportive of Fitch’s rating opinion.Assess the reasonableness of underlying performance assumptions.Assess the reasonableness and adequacy of the data received to maintain the ratings.
Asset Analysis Fitch incorporates the results from the information review of the asset pool into the credit analysis and loss determination, including a review of the pool’s credit characteristics, risk factors, model output and performance history and trends of similar collateral.
The next step is usually an analysis of the financial structure of the transaction. This includes the payment priority and credit enhancement structure proposed by the arranger based on the feedback it received from Fitch. For certain asset classes, the financial structure is provided early in the process and analyzed by Fitch as part of the asset-level analysis, while, with other asset classes the financial structure is analyzed as a separate step and presented in subsequent committees.
Specific issues such as those relating to the operational risk or transaction counterparties may also be addressed during the asset-level analysis or at a later point in the review, depending on the availability of information. Because of the impact on the credit profile of the transaction, these risk factors are brought to committee before an “expects to rate” decision is reached.
The Ratings Process 11March 30, 2015

Credit Policy
Analyzing the Financial Structure Fitch analyzes the payment priority waterfall and credit enhancement structure provided by the arranger. For some asset classes, Fitch may use cash flow models, such as INTEX or internal models, to determine the adequacy of the credit enhancement structure using the default, recovery and/or loss expectations decided on by the asset analysis committee described above. Where applicable, prepayment, interest rate, default timing and stress scenario assumptions,as described in published asset-specific and global criteria, are also applied as inputs into the models.
In addition, Fitch conducts sensitivity analyses using defined stresses to key rating assumptions that would reduce the relevant rating by a significant degree. For example, sensitivities analyzed for a security could include scenarios that would cause the ratings to be reduced by one full category, to non-investment grade or to ‘CCCsf’. The results of the cash flow and sensitivity analyses are presented to the rating committee.
Assessing Operational Risk: Originator and Servicer ReviewsFitch conducts periodic originator and servicer reviews to provide a qualitative indication of the risk in structured finance transactions attributable to an originator level of risk management and disclosure and the quality of the servicer’s operations.
Fitch’s originator reviews include periodic management meetings and disclosure of Fitch’s opinion in presale and new issue reports. Each Fitch analytical group globally, in conjunction with relevant internal sector/asset specialists, has developed detailed methodology for conducting originator reviews for each major asset class. The originator methodology is published either as part of the respective ratings criteria reports for each market and asset class or as separate criteria. In addition, a separate methodology, emphasizing different risk factors, may be developed for subsectors within a given asset class.
Fitch’s servicer reviews and ratings provide an indication of servicers’ capabilities and include an evaluation and analysis of a number of key factors, including corporate stability, financial condition, management and staff experience, technological capabilities, policies and procedures, controls and historical servicing performance. Fitch assesses the information gathered throughout the review process and incorporates the agency’s transaction surveillance data, as applicable, when performing its analysis. Based on its analysis and review of these key drivers, Fitch will derive an opinion and may assign a servicer rating, which is separate and distinct from a credit rating and reflects the servicer’s operational strengths and weaknesses
The Ratings Process 12March 30, 2015

Credit Policy
ALL FITCH CREDIT RATINGS ARE SUBJECT TO CERTAIN LIMITATIONS AND DISCLAIMERS. PLEASEREAD THESE LIMITATIONS AND DISCLAIMERS BY FOLLOWING THIS LINKHTTPS://FITCHRATINGS.COM/UNDERSTANDINGCREDITRATINGS IN ADDITION, RATING DEFINITIONSAND THE TERMS OF USE OF SUCH RATINGS ARE AVAILABLE ON THE AGENCY'S PUBLIC WEB SITE ATWWW.FITCHRATINGS.COM. PUBLISHED RATINGS, CRITERIA, AND METHODOLOGIES ARE AVAILABLEFROM THIS SITE AT ALL TIMES. FITCH'S CODE OF CONDUCT, CONFIDENTIALITY, CONFLICTS OFINTEREST, AFFILIATE FIREWALL, COMPLIANCE, AND OTHER RELEVANT POLICIES AND PROCEDURESARE ALSO AVAILABLE FROM THE CODE OF CONDUCT SECTION OF THIS SITE. FITCH MAY HAVEPROVIDED ANOTHER PERMISSIBLE SERVICE TO THE RATED ENTITY OR ITS RELATED THIRD PARTIESDETAILS OF THIS SERVICE FOR RATINGS FOR WHICH THE LEAD ANALYST IS BASED IN AN EU-REGISTERED ENTITY CAN BE FOUND ON THE ENTITY SUMMARY PAGE FOR THIS ISSUER ON THEFITCH WEBSITE.Copyright © 2015 by Fitch Ratings, Inc., Fitch Ratings Ltd. and its subsidiaries. 33 Whitehall Street, NY, NY 10004.Telephone:1-800-753-4824, (212) 908-0500. Fax: (212) 480-4435. Reproduction or retransmission in whole or in part is prohibited exceptby permission. All rights reserved. In issuing and maintaining its ratings, Fitch relies on factual information it receives from issuers and underwriters and from other sources Fitch believes to be credible. Fitch conducts a reasonable investigation of thefactual information relied upon by it in accordance with its ratings methodology, and obtains reasonable verification of thatinformation from independent sources, to the extent such sources are available for a given security or in a given jurisdiction.The manner of Fitch’s factual investigation and the scope of the third-party verification it obtains will vary depending on thenature of the rated security and its issuer, the requirements and practices in the jurisdiction in which the rated security is offeredand sold and/or the issuer is located, the availability and nature of relevant public information, access to the management of theissuer and its advisers, the availability of pre-existing third-party verifications such as audit reports, agreed-upon proceduresletters, appraisals, actuarial reports, engineering reports, legal opinions and other reports provided by third parties, the availability of independent and competent third-party verification sources with respect to the particular security or in theparticular jurisdiction of the issuer, and a variety of other factors. Users of Fitch’s ratings should understand that neither anenhanced factual investigation nor any third-party verification can ensure that all of the information Fitch relies on in connectionwith a rating will be accurate and complete. Ultimately, the issuer and its advisers are responsible for the accuracy of theinformation they provide to Fitch and to the market in offering documents and other reports. In issuing its ratings Fitch must relyon the work of experts, including independent auditors with respect to financial statements and attorneys with respect to legaland tax matters. Further, ratings are inherently forward-looking and embody assumptions and predictions about future eventsthat by their nature cannot be verified as facts. As a result, despite any verification of current facts, ratings can be affected byfuture events or conditions that were not anticipated at the time a rating was issued or affirmed. The information in this report is provided “as is” without any representation or warranty of any kind. A Fitch rating is an opinionas to the creditworthiness of a security. This opinion is based on established criteria and methodologies that Fitch iscontinuously evaluating and updating. Therefore, ratings are the collective work product of Fitch and no individual, or group ofindividuals, is solely responsible for a rating. The rating does not address the risk of loss due to risks other than credit risk,unless such risk is specifically mentioned. Fitch is not engaged in the offer or sale of any security. All Fitch reports have shared authorship. Individuals identified in a Fitch report were involved in, but are not solely responsible for, the opinions stated therein.The individuals are named for contact purposes only. A report providing a Fitch rating is neither a prospectus nor a substitute forthe information assembled, verified and presented to investors by the issuer and its agents in connection with the sale of thesecurities. Ratings may be changed or withdrawn at anytime for any reason in the sole discretion of Fitch. Fitch does notprovide investment advice of any sort. Ratings are not a recommendation to buy, sell, or hold any security. Ratings do not comment on the adequacy of market price, the suitability of any security for a particular investor, or the tax-exempt nature ortaxability of payments made in respect to any security. Fitch receives fees from issuers, insurers, guarantors, other obligors,and underwriters for rating securities. Such fees generally vary from US$1,000 to US$750,000 (or the applicable currency equivalent) per issue. In certain cases, Fitch will rate all or a number of issues issued by a particular issuer, or insured orguaranteed by a particular insurer or guarantor, for a single annual fee. Such fees are expected to vary from US$10,000 toUS$1,500,000 (or the applicable currency equivalent). The assignment, publication, or dissemination of a rating by Fitch shallnot constitute a consent by Fitch to use its name as an expert in connection with any registration statement filed under the United States securities laws, the Financial Services and Markets Act of 2000 of the United Kingdom, or the securities laws ofany particular jurisdiction. Due to the relative efficiency of electronic publishing and distribution, Fitch research may be available to electronic subscribers up to three days earlier than to print subscribers.
The Ratings Process 13March 30, 2015

Structured Finance
www.fitchratings.com 12 November 2015
CDOs / Global
Global Rating Criteria for CLOs and Corporate CDOs Sector-Specific Criteria
Scope This criteria report details Fitch Ratings’ methodology for analysing portfolios of corporate credit for rating collateralised loan and other debt obligations (CDOs). It outlines the qualitative and quantitative factors considered in Fitch’s analysis of portfolios of corporate credit. These criteria are also applicable to the rating of combination notes where the underlying tranches are CLOs or corporate CDOs.
Legal and counterparty risks in corporate CDO transactions are outside the scope of this report and are addressed in the reports entitled: Counterparty Criteria for Structured Finance and Covered Bonds Transactions and Global Structured Finance Rating Criteria (see Related Criteria).
This criteria report is also the framework for rating project finance (PF) CDOs. Fitch PCM is the primary tool for analysing the credit risk of PF credit portfolios. The default probability assumptions and recovery rates are based on asset-specific credit opinions and recovery ratings provided by Fitch’s Global Infrastructure group. Portfolio default rates are based on bespoke correlation assumptions.
Key Rating Drivers Asset Quality: Asset quality is a primary driver of the default probability of the underlying corporate assets. Asset quality is based on corporate Issuer Default Rating (IDR) and term.
Asset Security: Asset security is determined by the seniority of the corporate obligation and the jurisdiction of the issuer. Asset security is a primary driver of recovery rate assumptions. Average recovery rates, based on historical market data, may be applied in the absence of explicit asset Recovery Ratings (RRs) or recovery estimates provided by Fitch’s leveraged finance group.
Portfolio Composition: Portfolio performance in terms of portfolio default rates depends on the level of diversity by industry, obligor and geographic concentrations, which determines the expected volatility in portfolio default rates. The key volatility parameter for credit portfolio performance is correlation.
Adverse Selection and Portfolio Management: Ongoing portfolio management and trading may result in an evolving portfolio credit profile, extension risk, and other portfolio changes not represented by the closing portfolio. The investment guidelines and permitted management terms are analysed to evaluate the potential risk factors of a managed portfolio.
Portfolio Performance; Surveillance: The extent and magnitude of changes to portfolio quality and composition are primary drivers of rating movement. The final rating actions are based on the described methodology as well as committee discretion to reflect performance where the methodology alone may imply rating action. Methodology-implied rating actions will not be applied by a committee where a permanent change in performance is not expected or where such a change would be expected to be reversed to avoid undue rating volatility.
Cash Flow Analysis: CDO structural features and hedging strategies, as well as the timing of defaults and timing of recoveries, are important considerations in cash flow modelling and have a meaningful impact on CDO performance.
Inside This Report Scope 1 Key Rating Drivers 1 Quantitative Models and Data 2 Portfolio Asset Quality 3 Asset Security 10 Obligor Concentrations 13 Adverse Selection 15 Portfolio Management 16 Cash Flow Modelling 19 Limitations 25 Sensitivity Analysis 25 Portfolio Performance and Surveillance 26 Appendix 1: Asset and CDO Target Default Rates 28 Appendix 2: The Portfolio Credit Model 29 Appendix 3: Correlation Calibration 32 Industry Concentration and the Corporate Correlation Model 34 Appendix 4: Fitch CDS Implied Ratings 41 Appendix 5: Standard Recovery Rate Assumptions 42 Appendix 6: Fitch IDR Equivalency Map 45 Appendix 7: Calculation of Fitch WARF and Fitch WARR 46 Appendix 8: Default Timings for 3.5 Year to 12.0 Year WAL 48 Appendix 9: Allocation of Defaults to Reinvestments 49 Appendix 10: Currency Stress Assumptions 50
Amendment This report, originally published on 30 July, 2015, has been amended to correct an error regarding asset repayment assumptions on page 18. All other content is as of the original publication date.
Analysts London Matthias Neugebauer +44 20 3530 1099 [email protected] New York Kevin Kendra +1 212 908 0760 [email protected] Derek Miller +1 312 368 2076 [email protected] Sydney Ben McCarthy +61 2 8256 0301 [email protected]

Structured Finance
Global Rating Criteria for Corporate CDOs November 2015
2
Quantitative Models and Data Fitch’s primary tool in assessing the primary rating factors of corporate CDOs is the Fitch PCM. The model is available for download on the Fitch website at www.fitchratings.com. The model is updated from time to time, and a release log is maintained on the site to indicate the updated features and assumptions. A description of the source data used to derive the assumptions is detailed in each respective section of this report.
Figure 1
The PCM is used for analysing the joint default behaviour within credit portfolios. The model is based on the Gaussian copula function, which is based on the multivariate normal distribution. An important benefit of the Gaussian copula is its analytical tractability. The dependence structure is fully described by the pair-wise linear correlation assumption. For example, zero correlation in the Gaussian copula means all default events are independent.
The two main functions of the model are: (1) map generic issuer and asset attributes to corresponding default probability and recovery rate assumptions; and (2) generate portfolio default rate and loss rates for each rating scenario as multiples of the base default rate and loss rate.
The key output of the model is the distribution of possible portfolio default rates or loss rates. The base-case default rate is given by the distribution mean, which is equal to average default probability weighted by asset notional.
The portfolio performance is uncertain and can deviate significantly from expectations. The volatility of possible portfolio default rates depends on the portfolio composition. Diversified portfolios in terms of number of obligors, industry or region would be expected to show lower volatility and hence default rates that are closer to the expected case. In contrast, more concentrated portfolios would be expected to exhibit more volatile default rates.
Overview of the Portfolio Credit Model Process
Source: Fitch
Default Probability
Recovery Rate
Asset Correlation
Asset Par Value
Monte CarloSimulation
User Input Assumptions Portfolio Credit Model
Rating
Term
Asset Type
Industry/Sector
Country
Related Criteria Counterparty Criteria for Structured Finance and Covered Bonds (May 2014) Counterparty Criteria for Structured Finance and Covered Bonds: Derivative Addendum (May 2014) Criteria for Interest Rate Stresses in Structured Finance Transactions and Covered Bonds (December 2014) Criteria for Rating Caps and Limitations in Global Structured Finance Transactions (May 2014) Global Structured Finance Rating Criteria (July 2015) Criteria for Sovereign Risk in Developed Markets for Structured Finance and Covered Bonds (Feb 2015) Recovery Ratings and Notching Criteria for Non-Financial Corporate Issuers (June 2014) Global Rating Criteria for Single- and Multi-Name Credit-Linked Notes (March 2015) Asset Manager Rating Criteria (May 2014)

Structured Finance
Global Rating Criteria for Corporate CDOs November 2015
3
The Gaussian copula only has one volatility parameter, which is correlation. Higher correlation corresponds to more volatile portfolio default rates, which is reflected in a model distribution with fatter tails. In other words, portfolio default rates that are significantly higher than the expected default rate are more likely.
Figure 2
The portfolio default rate (Rating Default Rate – RDR) and loss rate (Rating Loss Rate – RLR) assumptions for each rating level are determined as percentiles of the default and loss distribution. The percentile levels are based on CDO target default rates as explained below.
Portfolio Asset Quality Asset Default Probabilities Fitch uses “rating” and “term” as the primary determinants of an asset’s expected default probability. There is a substantial history of data related to the default experience of a wide spectrum of corporate entities, rated over the past three decades. Importantly, Fitch utilises the corporate default rates made available by all three major rating agencies. This data set is thought to be the most robust and objective, as it reflects the broadest set of default statistics available, and minimises the risk of any variances in ratings approach or industry coverage.
Figure 3
Importantly, the period examined was marked by the emergence of the modern debt markets, including the growth of a true high-yield debt class. The period also includes a number of moderate and severe economic downturns, with accompanying surges in corporate bankruptcies and defaults across a range of industries.
Figure 20 in Appendix 1 shows the expected default probabilities assumed for different ratings and terms. The assumptions are based on historically observed average default rates as far back as the early 1980s. The assumptions closely reflect to the actual observed default rates.
0.00.10.20.30.40.50.60.70.80.9
0 2 4 6 8 10 12 14 16 18 20 22 24 26 28 30 32 34 36 38 40 42 44 46 48 50 52 54 56 58 60 62 64 66 68 70 72 74 76 78 80 82 84 86 88 90 92 94 96 98 100
Default Distribution – Probability Mass Function(Probability (%))
Source: Fitch(Defaulted notional (%))
-3
0
3
6
9
12
15
18
1985
1986
1987
1988
1989
1990
1991
1992
1993
1994
1995
1996
1997
1998
1999
2000
2001
2002
2003
2004
2005
2006
2007
2008
2009
2010
2011
2012
2013
2014
(%)Default rate GDP growth
US High Yield Par Default Rates & GDP Growth
Source: Fitch

Structured Finance
Global Rating Criteria for Corporate CDOs November 2015
4
The rating is based on the Fitch Issuer Default Rating or credit opinions provided by Fitch’s corporate ratings group. In the absence of a Fitch rating or credit opinion, the agency may use public ratings from either Moody’s or S&P. For a detailed description of the rating derivation please see Appendix 6.
Defaults and Soft Credit Events for Synthetic Exposures The three credit events that Fitch most frequently sees are bankruptcy, failure to pay (FTP) and restructuring.
Bankruptcy and FTP are considered hard credit events by Fitch, since they are largely incorporated in the agency’s corporate credit default studies and ratings transition matrices. Likewise, the agency’s corporate default probability assumes some, but not all, types of restructuring; for example, distressed debt exchanges are included. Some forms of restructuring, as well as some forms of obligation acceleration and repudiation moratorium (together, soft credit events), do not correspond directly to Fitch’s corporate default definition and are not captured in the agency’s historical default matrices.
For reference entities for which the credit-default swap (CDS) includes soft credit events, Fitch will increase the default probability by a factor of 5%.
CDO Target Default Probabilities Fitch’s CDO ratings correspond to a Value at Risk (VaR) measure, which looks primarily at the probability of exceeding the available credit enhancement. The exceedance probability is usually expressed by the level of confidence, which is determined as one minus the exceedance probability. For credit risk management and the Basel approach, the level of confidence is usually chosen to be 99.99% (1bp probability of exceeding the VaR). However, a single confidence level is not sufficient to differentiate between different rating categories. Therefore, the risk tolerance for each rating level and term is determined by CDO target default rates. Figure 4 shows the one- and 10-year CDO target default rates used in the model.
Figure 4 One-Year and 10-Year CDO Target Default Probabilities
CDO target DP
(%) 1 year Confidence level
(%) 1 year CDO target DP
(%) 10 years Confidence level
(%) 10 years AAAsf 0.01 99.99 0.03 99.97 AAsf 0.01 99.99 0.26 99.74 Asf 0.07 99.93 1.60 98.40 BBBsf 0.19 99.81 4.50 95.50 BBsf 1.16 98.84 17.43 82.57 Bsf 5.36 94.64 32.18 67.82 Source: Fitch
For example, the corresponding CDO rating for a 99.99% confidence level over one year would be ‘AAsf’. In contrast, for a ‘BBsf’ rating over one year, the target CDO default rate is much higher, yielding a lower confidence level of 98.84%.

Structured Finance
Global Rating Criteria for Corporate CDOs November 2015
5
Figure 5
Figure 5 illustrates the VaR measure graphically. The curve, which is derived from the portfolio loss distribution, shows the probability of exceeding a certain level of portfolio losses. This allows one to determine the VaR directly from the respective risk tolerance levels or CDO default rates.
For credit risk management, the risk horizon is usually one year. CDOs have a much longer risk horizon, of between three and 10 years. Generally, the risk tolerance expressed in the CDO target default rates increases for longer risk horizons. Since the assets in CDO portfolios may have different maturity dates or even amortisation schedules, the risk tolerance is determined by the weighted average life of the CDO portfolio.
Fitch’s approach applies target default probabilities equal to the input default probabilities for all rating categories below the ‘AAsf’ category. The approach applies target default probabilities lower than the input default probabilities for the rating categories ‘AAAsf’ and ‘AAsf’. As stated in the prior section, Fitch looks to long-term empirical statistics for its input default probabilities. The sample size of the data cohorts for the ‘AAA’ and ‘AA’ categories contained fewer observations relative to the other observed cohorts. Fitch believes it is therefore prudent to reduce the target default probability, or raise the threshold, when determining the level of support necessary to achieve these highest of ratings. The effect of the adjustment is to increase the Credit Enhancement in order for securities to achieve ‘AAAsf’ and ‘AAsf’ ratings.
Correlation Framework – Benchmarking to Historical Peak Default Rates The correlation assumption in PCM is the parameter that determines the volatility of possible portfolio default rates and the resulting multiple of RDRs relative to the base case. Given the choice of model and having specified the input default probability assumptions as well as the CDO target default rates, correlation is the only remaining parameter.
Fitch has calibrated a correlation framework to match the model-implied volatility of portfolio default rates to the historically observed default rate volatility.
For example, Figure 6 shows the default rate for 10-year cohort portfolios with an initial credit quality of ‘BBB’. The chart highlights the volatility observed in the empirical default rate around the longer-term average. The highest observed default rate or peak default rate was 9.3%, compared to an average default rate of 4.5%.
0
20
40
60
80
100
0 4 8 12 16 20 24 28 32 36 40 44 48 52 56 60 64 68 72 76 80 84 88 92 96 100
(Probability (%))
Default Distribution - Exceedance Probability
Source: Fitch
Expected loss
'BBB'4.5%
'A'1.6%
'AA'0.26%
'AAA'0.03%
(Defaulted notional (%))
Figure 6
0
2
4
6
8
10
1981
1982
1983
1984
1985
1986
1987
1988
1989
1990
1991
1992
1993
1994
1995
1996
1997
1998
1999
2000
2001
2002
2003
2004
2005
10-year default rate Average
10-Year Rolling Cohort ‘BBB’ Default Rate
(%)
Source: Fitch

Structured Finance
Global Rating Criteria for Corporate CDOs November 2015
6
Based on the empirical data, Fitch calibrated the correlation framework to achieve an appropriate coverage of the rating default rates produced by the model over the observed peak default rate for a portfolio that resembled the cohort portfolio. More details of the calibration methodology are provided in Appendix 3.
Fitch views it as important that the model output can be tied to a fundamental view of credit risk. A primary credit view held is that CDO notes carrying an investment-grade rating should perform robustly, even in periods of peak corporate default rates.
Furthermore, Fitch believes that CDO notes rated in the ‘Asf’ category and above should perform well in a stress with similar severity as the recession that generated the peak default rates, with little vulnerability to default. In other words, the calibration was designed so that the protection afforded CDO notes rated in the ‘Asf’ category and above was at or above historical peak default rates.
Figure 7
This concept of backtesting and benchmarking the model output against “multiples” of historical default data is an important concept in understanding the rationale for how correlation was set, and has the effect of embedding some explicit and easy-to-understand deterministic overlays onto the simulation-derived results.
Figure 8 Portfolio Default Rate and Model Output Coverage BBB (RDR) Peak 9.3% BB (RDR) Peak 29.7% B (RDR) Peak 49.5%
(%) Diverse Peak
portfolio
30% single
industry Diverse Peak
portfolio
30% single
industry Diverse Peak
portfolio
30% single
industry AAAsf 15.3 17.7 20.7 39.0 42.0 44.0 58.0 60.7 62.0 AAsf 12.7 14.3 16.0 34.3 37.0 38.7 53.3 55.7 56.7 Asf 10.3 11.3 12.0 30.0 31.7 33.0 48.0 50.0 51.0 BBBsf 8.7 9.3 9.7 27.0 28.0 29.0 44.3 46.0 47.0 BBsf 6.3 6.7 6.7 22.3 22.7 23.0 38.7 39.3 40.0 Bsf 5.3 5.3 5.3 19.3 19.7 19.7 35.3 35.7 35.7 Exp 4.5 4.5 4.5 17.5 17.5 17.5 32.2 32.2 32.2 Source: Fitch
Industry and Regional Diversity In addition to the fundamental credit views relating to the observed default-rate volatility, Fitch further believes that credit portfolios that are less diversified with higher concentrations in terms of industry and region compared to the cohort portfolio underlying the base calibration could exhibit higher volatility of default rates relative to the base case.
Therefore, the correlation framework was extended to differentiate correlation levels between industries and within a single industry as well as between regions and within regions.
0
3
6
9
12
15
1 3 5 7 9 11 13 15 17 19 21 23 25 27 29 31 33 35 37 39 41 43 45 47 49 50
0% Correlation 10% Correlation 30% Correlation
Effect of Portfolio Correlation
(%)
Source: Fitch(%)
The correlation assumption in PCM is the parameter that determines the volatility of possible portfolio default rates and the resulting multiple of RDRs relative to the base case.
Fitch has calibrated a correlation framework to match the model implied volatility of portfolio default rates to the historically observed default rate volatility.

Structured Finance
Global Rating Criteria for Corporate CDOs November 2015
7
Unfortunately, the historical data available was not detailed enough to compute cohort default rates for portfolios with different industry and regional composition. The correlation levels were calibrated to match Fitch’s credit views with regards to the relative increase in the rating default rate between calibration portfolios with higher levels of industry and regional concentration compared to the cohort portfolio (see Appendix 3).
The final correlation framework seeks to differentiate CDO portfolio concentrations that may impact performance. It does this through a combination of four correlation adjustments. There is a base level of correlation that is applied to all assets. The second layer is a sector correlation that is applied to assets from the same sector. The third layer is an industry correlation that is applied to assets from the same industry. Finally, the fourth correlation adjustment is applied to the largest obligors in the portfolio to stress for obligor concentrations.
The framework groups industries into six sectors, each containing one to 11 industries. The example in Figure 8 refers to a US portfolio. The base level of correlation is set to 2%, with a 2% correlation (total correlation of 4%) between assets in the same sector. If assets are also in the same industry class within a sector, the correlation is assumed to be even higher, set at 24%.
Quantifying credit for geographical diversity is problematic since the deepest empirical data set on defaults is available for the US. That said, as the world’s largest economy, it can be argued that there is a significant level of regional diversification within the US.
In order to vary correlation assumptions to reflect geographic diversity or concentration, Fitch began with the following guiding principles.
Advanced-economy countries smaller than the US would not benefit from the same level of regional diversification. Therefore, the base correlation between companies in countries other than the US should be higher than the 2% US assumption.
The global economy results in relatively limited benefit within a region. For example, a portfolio diversified within western Europe should not yield materially different portfolio default rates than a US portfolio.
Different industries benefit from geographic diversification to varying degrees.
With these guiding principles, the correlation framework is applied, with a base level of correlation for companies located in different regions, with add-ons for commonality of country, sector and industry.
Figure 9 Correlation Framework Industry add-on (%) Base levela Sector add-on High Medium Low Same country 4 (2 if US) +2 +20 +20 +20 Same region, different countries 2 +2 +20 +15 +10 Different regions 1 +2 +20 +15 +10 Banking and finance assets As above +14 8% For a full list of countries and industries in the portfolio credit model please see figures 28 and 29 a Includes global base of 1% plus regional uplift of 1% and country uplift of 2% (except US where country uplift is 0%) Source: Fitch
Sovereign-Related Risk Transactions may have partial exposures to countries whose Country Ceiling is below the highest rating of the notes and/or where Fitch applies a cap to its structured finance (SF) ratings, pursuant to the Criteria for Sovereign Risk in Developed Markets for Structured Finance and Covered Bonds (Developed Market Criteria) or the Criteria for Rating Securitizations in Emerging Markets (Emerging Market Criteria).

Structured Finance
Global Rating Criteria for Corporate CDOs November 2015
8
Currently, this is the case for the Fitch-rated high-yield CLOs that have exposure to peripheral eurozone countries (Spain, Italy, Portugal and Greece), which ranges between 5% and 20% and which follows the Developed Market Criteria. For these transactions, the agency will increase correlation levels and reduce recovery rates to reflect expected higher asset performance volatility, especially at rating levels abve the cap.
The updated correlation and recovery assumptions are calibrated to match the expected loss at the country rating cap level to the ‘AAAsf’ level. The currently applicable recovery rate assumptions are shown in Appendix 5. Figure 10 shows the calibration of the correlation assumptions and the implied RDR for the respective countries compared to the standard assumptions for the peak calibration portfolio, as described in Appendix 3.
For Spain and Italy, for example, the current country cap is ‘AA+sf’. The correlation was increased from 4% to 6% and as result the RDR at the ‘AAsf’ rating level increased to 54%, which matches the ‘AAAsf’ RDR under the standard correlation assumptions. Figure 10 Model RDR for 1991 Peak Portfolio – Single Country (Non-US) – see Appendix 3 Country level correlation (%) 4 6 10 27 Country SF rating capa AAAsf AAsf category Asf category Bsf category (%) Base Spain/Italy Portugal Greece AAA 53.7 59.0 67.3 90.3 AA 49.3 54.0 62.0 84.7 A 44.3 48.3 54.7 75.7 BBB 39.7 42.7 48.0 65.7 BB 32.0 33.7 36.3 45.7 B 27.3 28.3 29.3 33.7 Mean 21.6 21.6 21.6 21.6 a As of the publication date of these criteria Source: Fitch
Furthermore, the Country Ceiling for these countries is currently below the highest rating Fitch can assign to the senior notes in high-yield CLOs. Therefore, in line with the Developed Market Criteria, the agency assumes a possible exit of these countries from the euro in rating scenarios above the Country Ceiling. This would cause at the very least significant performance volatility for underlying borrowers, currency transfer and convertibility (T&C) issues and FX risk for any proceeds from outstanding loans.
Fitch believes that the borrowers would likely default in such a scenario and as a result the T&C and FX risk following a euro exit would primarily apply to any recovery proceeds. Fitch applies a haircut to the recovery proceeds of 50% to assets from these countries at rating levels above the relevant Country Ceiling in order to address the possible FX risk that could result from the depreciation of a new currency following redenomination of loans.
For example, for a typical second-generation European CLO with a 10% investment limit in countries with a Country Ceiling below ‘AAA’ or sovereign rating below ‘A−’, the usual projected default rate for the ‘AAAsf’ scenarios is approximately 60%. This would be assumed to include a 10% exposure to Spain and Italy, which are currently the only countries with a Country Ceiling below ‘AAA’ with significant volumes of outstanding leveraged loans. The remaining 50% of defaults would be spread across other countries, which is consistent with Fitch’s typical ‘AAAsf’ default expectations for portfolios not exposed to countries with a Country Ceiling below the target rating. The total default rate assumption would remain unchanged in this instance.
The expected recovery rate at a ‘AAAsf’ rating for the 10% exposure bucket would be reduced by 50% assuming a depreciation of the new currency against the euro. As a result, the aggregate recovery assumption for a ‘AAAsf’ rating scenario for a typical second-generation CLO would decline to 32% from approximately 35%.

Structured Finance
Global Rating Criteria for Corporate CDOs November 2015
9
It should be noted that the haircut for redenomination risk is not included in the PCM model analysis and has to be applied separately to the model results.
The approach currently only applies to ‘AAAsf’ rating scenarios, but this might change if Country Ceilings were further downgraded or managers start to include sizeable exposures in CLOs from countries with a Country Ceiling lower than ‘AAA’. Additional stresses contemplated in the Developed Markets Criteria are generally not applied during the rating process for typical US CLOs. US CLOs are generally precluded from investing in companies domiciled in peripheral eurozone countries. Therefore, an additional stress for Fitch’s initial rating analysis is generally not applicable. Additionally, US CLOs generally have constraints limiting investment to US dollar-denominated loans within US CLOs, and as a result only have exposure solely to the US leveraged loan market. In the US leveraged loan market, most multi-jurisdictional companies that could be characterised as being non-US in a CLO have substantial US-based operations with US dollar-denominated cash flows and assets available for the loan repayment. Therefore, T&C risk would not be considered a risk factor in these instances.
Emerging Markets The correlation framework was further developed to incorporate assets from emerging-market countries and reflect the following additional credit views.
Corporate credit portfolios in EM countries are likely to have more volatile portfolio default rates, indicating a higher level of correlation than similarly rated portfolios in advanced economies, regardless of region and country. Therefore, the criteria apply a 10% uplift to the correlation of any two EM assets.
Regional diversity is particularly important for portfolio performance within EMs, and as a result EM assets from the same region are subject to an additional 10% correlation uplift. Fitch has created four broad EM regions to implement this: EM Americas, EM Asia, EM Europe and Central Asia, and EM Africa and Middle East.
Country diversity within the same region is of lesser benefit than regional diversity, and assets from the same country are subject to an additional 5% correlation uplift.
The same credit views with regard to industry concentration apply to EM and advanced economies.
Fitch believes that a small amount of EM exposure in a well-diversified portfolio of debt from advanced economies should add geographical diversity and reduce volatility. However, it is the agency’s view that large EM exposures increase the risk to the portfolio, especially in high rating scenarios, and this outweighs any diversity benefits.
By way of illustration, the correlation between Russian assets in different sectors is 26%. This is made up from the sum of 1% global base correlation, 10% EM base correlation, 10% EM region correlation and 5% EM country correlation. In comparison, the correlation between US companies would be 2% (1% global base and 1% for being in the same region).
Figure 11 EM Geographical Correlation Framework Location
(%) Global base
level EM base
add-on EM region
add-on EM country
add-on Total EM
add-on Same EM country +1 +10 +10 +5 +26 Same EM region and different EM countries
+1 +10 +10 +0 +21
Different EM regions +1 +10 +0 +0 +11 Note: Fitch would also apply sector and industry correlation uplifts of 2% and 20%, respectively, as per the advanced economy table above Source: Fitch

Structured Finance
Global Rating Criteria for Corporate CDOs November 2015
10
If the Russian assets are also in the same industry, they will attract a further uplift up to 22%, which would give a total correlation for such a portfolio of 48%. For EM assets from different geographical regions and sectors – for example, a Russian utilities company and an Indonesian finance company – the correlation will be 11%, ie 1% global base plus 10% EM base.
Transactions with a material share of assets in EMs are unlikely to support ‘AAAsf’ ratings, especially if many of the assets are from low-rated sovereigns. Such structures, as well as regional or single country EM transactions, fall outside the scope of this criteria report and therefore this global correlation framework will not apply. Instead, Fitch will support its analysis with its emerging markets rating approach (Criteria for Rating Securitizations in Emerging Markets) and tailor its analysis to reflect the risks within the local economics that underpin the particular portfolio. This will include a dedicated correlation framework, which may deviate materially from the one laid down in this report.
A similar approach will be used for transactions where ratings are only assigned on a national scale, where the correlation framework will also be amended to reflect the particularities of the relevant jurisdiction.
Asset Security Many corporate balance sheets, particularly for less creditworthy companies, were increasingly leveraged with loan-heavy capital structures in 2007 and 2008. Observations from the recent high yield default period in 2009 highlighted the pro-cyclical nature of defaults and recoveries, with lower recoveries occurring during periods of higher defaults. Fitch incorporates pro cyclicality by applying lower recovery for higher rating scenarios.
Corporate Recovery Ratings Although fundamental characteristics — such as seniority level, security, jurisdiction, issuer and industry idiosyncratic characteristics — are the main drivers of recoveries, asset-specific RRs 1
issued by Fitch’s corporate ratings group, are Fitch’s best metric for determining recovery expectations for CDO assets. RRs reflect a fundamentally-derived, forward-looking view of a company’s unique capital structure, enterprise value and recovery prospects on a particular debt instrument.
Fitch’s RRs scale provides market participants with additional recovery information for all issuing entities whose liabilities are rated ‘B+’ and below. RRs range from ‘RR1’, which indicates an outstanding level of recovery, to ‘RR6’, which reflects a poor recovery. Published RRs are established using a bespoke analysis which compares either distressed enterprise values, balance liquidation or traded asset values against a given security’s position in the capital structure. Fitch’s RRs largely represent ultimate recoveries following the work-out process. The analysis focuses on stressed cash flow scenarios and Fitch’s through-the-cycle expectation of enterprise valuations.
In addition to recovery ratings, Fitch’s corporate ratings group may also conduct a bespoke analysis and assign specific recovery estimates that may be used in Fitch’s analysis of a CDO. More information on Fitch Recovery Ratings and recovery estimates is available in the report entitled Recovery Ratings and Notching Criteria for Non-Financial Corporate Issuers (see Related Criteria).
1 Recovery Ratings and Notching Criteria for Non-Financial Corporate Issuers

Structured Finance
Global Rating Criteria for Corporate CDOs November 2015
11
Figure 12 Recovery Ratings Rating Description Range (%)a ‘RR1’ Outstanding 91-100 ‘RR2’ Superior 71-90 ‘RR3’ Good 51-70 ‘RR4’ Average 31-50 ‘RR5’ Below average 11-30 ‘RR6’ Poor 0-10 a The recovery percentage corresponds to a ‘Bsf’ stress. For higher stresses please see Appendix 5 Source: Fitch
Seniority In the absence of asset-specific recovery ratings or recovery estimates, Fitch generally looks to the seniority and security of the actual debt instrument as its primary indicator for the recovery prospects in its analysis of a CDO portfolio. Fitch will assign a recovery rate category corresponding to its view on the asset’s recovery prospects, if asset-specific recovery rate assumptions from Fitch’s corporate credit analysts are not available. There are three categories that describe the relative recovery prospects; categorisation will primarily be based on the seniority of the actual debt instrument, with senior secured loans generally corresponding to “strong recovery prospects” and senior unsecured bonds corresponding to “moderate recovery prospects”. Other debt instruments will commonly be categorised as having “weak recovery prospects”. However, where actual recovery experience is less than might be expected for the level of seniority, a lower categorisation may be used in specific cases. For example, for Japan the recovery rate for senior unsecured debt has been below ‘moderate’ recovery rates; as a result, Fitch would apply a ‘weak’ recovery rate for senior unsecured debt in Japan.
Furthermore, seniority and security do not fully explain Fitch’s recovery expectations for any given asset. The distribution of current US corporate RRs in the distribution of US corporate RRs by seniority shows wide variance in the recovery expectations; this may be due to issuer-, industry- or market-related factors. Issuer-specific factors include financing decisions on optimal capital structures by management. Other factors may impact the recovery prospects for particular companies operating in specific industries. From time-to-time, there may be macro-factors that impact the types of debt instruments available to issuers. In 2009 and into 2010, there were limited financing options, resulting in many companies issuing senior secured bonds to refinance existing loan facilities. The future recovery prospects for these new bonds will likely vary, based on the security and covenant protections associated with the new debt instrument.
Therefore, the portfolio composition and associated recovery prospects of the underlying assets are reviewed by the relevant corporate credit analyst as part of the CDO rating process, if warranted. The corporate credit analyst will make adjustments to the recovery category classification to reflect Fitch’s forward-looking view on the recovery prospects for each asset in the portfolio, if necessary.
Jurisdictional Considerations Another important determinant of recovery prospects is jurisdiction. Fitch examined creditor friendliness and insolvency regimes across countries to determine RR expectations for non-US corporate obligors. This research determined the grouping of countries, based on comparable levels of expected recoveries. Obligors from Group A countries (see Corporate Recovery Rate Assumptions table and Appendix 5) are mostly expected to exhibit recovery prospects consistent with those of US obligors, while Group B, C and D obligors are expected to exhibit decreasing levels of recovery. For more information on this research, see Country-Specific Treatment of Recovery Ratings.

Structured Finance
Global Rating Criteria for Corporate CDOs November 2015
12
Figure 13 Corporate Recovery Rate Assumptionsa Recovery prospects (%) United States Group A Group B Group C Group D Strong recovery 80 75 55 45 35 Moderate recovery 45 45 40 30 25 Weak recovery 20 20 5 5 5 a The recovery percentage corresponds to a ‘Bsf’ stress. For higher stresses please see Appendix 5 Source: Fitch
A full list of Fitch’s base recovery assumptions and the tiering applied at different CDO rating stresses can be found in Appendix 5.
Finally, Fitch may use additional information, like the notching differential between the instrument rating and Issuer Default Rating (IDR), to better inform its decision on the appropriate recovery assumption for any given asset.
Recovery Rates for Synthetic Exposures Recovery rates for synthetic exposures would typically follow the assumptions described in the Seniority section above, subject to adjustments as described below and depending on the specified settlement process. Upon the occurrence of a credit event, CDS utilise one of the following methods of settlement to value the defaulted reference asset and quantify the amount of credit loss passed from the protection buyer to the protection seller: cash settlement;
ISDA auction; or
physical settlement.
Cash Settlement, ISDA Auction Under cash settlement, any asset that has experienced a credit event is removed from the reference portfolio and the final price for that asset is determined via a dealer poll mechanism. Alternatively, the price may be determined via a market-wide auction process. Once the final price is determined, the total amount of the loss will be applied to first reduce credit enhancement and eventually to reduce the outstanding principal amount of the rated notes.
When cash settlement is applicable, Fitch will typically reduce its recovery rate assumptions by 10%. This is because market participants are likely to bid below the expected final recovery to reflect the risks and time between the cash settlement date and the final recovery.
Physical Settlement If a credit event occurs in a transaction structured using physical settlement, the synthetic exposure is swapped for the physical asset upon a credit event. If the transaction can then hold the physical asset and take it through the workout process in the same way as a true-sale transaction would do, Fitch does not apply any adjustments to the recovery assumption.
Physical settlement can introduce market value risk to the transaction, which would be analysed using the relevant criteria. This is because upon a default, the SPV, as protection seller, would be called upon to fund the full notional of the CDS while receiving the defaulted cash asset. To meet the payment, the structure may liquidate charged assets, which could introduce market value risk.
Covenant-Lite Loans A loan may be considered covenant-lite (cov-lite) if the loan facility lacks a financial maintenance covenant in its documents. A cov-lite loan typically contains debt incurrence covenants only. Incurrence covenants included in cov-lite loan documents may include restrictions on issuing further debt, or taking action that dilutes the collateral package supporting the secured loan. Maintenance covenants that are excluded from cov-lite loan

Structured Finance
Global Rating Criteria for Corporate CDOs November 2015
13
documents typically require maintenance of an EBITDA measure or other financial ratio. A failure of these metrics in a fully covenanted loan agreement which includes maintenance covenants would typically result in the borrower making concessions to their lenders, in the form of higher coupon or fees, to waive the covenant violation.
To date, there is little evidence that the presence of maintenance covenants in loan documents preserves enterprise value in the event of insolvency. The limited data supporting default and recovery rates experienced from cov-lite loans have been included alongside senior secured loans, which include maintenance covenants in Fitch’s recovery studies that support its general recovery rates for “strong” recovery-prospect assets. The data does not support a consistently lower recovery rate for cov-lite loans. As a result, currently Fitch does not make any additional adjustment to its recovery assumptions for cov-lite loans, since the recovery data set is included in its criteria.
The current prevalence of cov-lite loans in primary the US market is symptomatic of a general loosening of credit standards from the lending institutions, similar to tightening of spreads or increased leverage. Ultimately, the recovery on senior secured loans is a function of the amount of senior debt outstanding relative to the issuer enterprise value at the time of default. Fitch notes that cov-lite loans still maintain incurrence covenants which limit the amount of extra debt that can be taken on and which could dilute recoveries.
Fitch will continue to monitor the default and recovery experience of cov-lite loans versus fully covenanted loans with maintenance covenants. In the event that substantiated data is obtained that indicates cov-lite recoveries are significantly diverging from those on covenanted loans, Fitch may apply an adjustment to its baseline recovery assumptions in its analysis of cov-lite loans.
Pro-Cyclical Nature of Defaults and Recoveries Fitch’s default and recovery studies show that the relationship of recoveries by seniority generally holds true over time. However, the average recovery for a given seniority has been very variable over time. Market-wide systemic factors play a role in the well-established inverse relationship between default rates and recovery rates, whereby low recovery rates are associated with high default rates..
Fitch stresses the recovery rate assumptions in higher rating stresses to account for the pro-cyclical nature of defaults and recoveries. Recovery observations from the most recent peak default period were more in line with the modelling assumptions used at high rating stresses.
As stated earlier in this report, Fitch believes that CDO notes rated in the ‘Asf’ category and above should still be expected to perform in periods of peak default rates. For this reason, the recovery assumptions for ‘BBBsf’/‘Asf’ stresses are set to match observed recoveries from peak default periods.
Obligor Concentrations Portfolios with a small number of assets, or those where individual assets balances represent a disproportionate exposure within the portfolio, carry the risk that portfolio performance may be adversely impacted by a few assets that may under-perform expectations based on ratings and debt characteristics. Fitch’s methodology applies additional stresses to certain inputs to mitigate the risk to CDO portfolio performance posed by outsized assets.
For example individual assets may recover less upon default than expected, based on historical average recovery rates for individual debt classes. Individual assets experiencing low recoveries will cause them to erode a disproportionate amount of support available to rated noteholders. To take this into account, Fitch applies 0.75 times to the assumed recovery rate of the five largest risk contributors. This stress is applied within the model framework, and has an impact on the portfolio loss distribution.

Structured Finance
Global Rating Criteria for Corporate CDOs November 2015
14
While the risk with respect to recovery rates is relatively apparent, the obligor coverage produced by the methodology is a function of the correlation assumptions and much less straight forward. Similar industry and geographic diversity portfolios with a larger number of obligors are expected to be subject to lower volatility in terms of default rates. The PCM model framework is already sensitive to obligor concentrations in that the rating default-rate increases because portfolios contain fewer assets.
Figure 14 Minimum Obligor Coverage: 10 Years and 2% Correlation CDO liability ratingª BBsf BBBsf Asf AAsf AAAsf Asset ratingª AAA 1 AA 1 1 A 1 2 BBB 1 1 2 BB 1 2 2 4 B 1 2 3 4 7 ª Valid for the whole category Source: Fitch
Furthermore, the CDO target default probabilities are the same as or lower than the input default probabilities (see CDO Target Default Probabilities in Figure 4 above). This ensures that the RDR for each liability rating level covers at least the largest obligor with a lower rating and a term equal to or longer than the weighted average life (WAL) of the portfolio. This approach creates what can be thought of as a floor in the assumed default rate, such that CDO investors are protected in the event that the larger assets default. This is particularly important where the portfolio credit quality is relatively high, and individual assets can represent a large proportion of the support available to a particular class of rated notes.
The methodology would also cover at a minimum number of the largest obligors as shown in Figure 14. For example, for a ‘AAAsf’ rating the RDR would cover at a minimum the two largest BBB rated assets.
The joint coverage of a number of the largest obligors is a function of the correlation assumption.
In order to address the idiosyncratic risk with respect to the default behaviour of the largest obligors, Fitch applies a correlation stress of 50% to the five largest risk contributors in terms of contribution to portfolio expected loss.
The largest risk contributors are determined based on size of exposure, default probability implied by the rating and recovery rate. It is important to take into account the default probability and recovery rate when determining the assets to which the stress is applied, as applying the stress to large exposure only would not reflect their risk contribution to the portfolio, as the largest assets may have high ratings and/or high recovery rates. Therefore their risk contribution to the portfolio could be small despite the exposure size.
Applying the 50% correlation stress increases the minimum obligor coverage. For a ‘AAAsf’ rating the RDR would now cover at least the five largest risk contributors rated BBB or below.

Structured Finance
Global Rating Criteria for Corporate CDOs November 2015
15
Figure 15 Minimum Obligor Coverage: 10 Years and 2%+50% Correlation CDO liability ratingª BBsf BBBsf Asf AAsf AAAsf Asset ratinga AAA 1 AA 1 2 A 2 3 BBB 1 3 5 BB 2 5 6 7 B 1 5 6 8 10 ª Valid for the whole category Source: Fitch
Adverse Selection Adverse portfolio selection presents a risk to the CDO that may result in negative rating action. If assets, which have a larger than average propensity to be downgraded, are included in a portfolio the result may be an unacceptable level of downgrade activity. There is evidence that pre crisis assets may have been included in synthetic CDO portfolios on the basis of their high spread relative to their peer group. In many instances, the asset’s high spread was indicative of an increased risk of downgrade. Concentrations of such adversely selected assets frequently led to the early and, at times, material downgrades of the CDO’s ratings. Synthetic CDOs disappeared as a rated instrument following the 2007/2008 period.
Conversely, adverse selection was less significant for leveraged loan CLOs. These transactions are typically actively managed and have restrictions on the purchase of discounted assets, as well as caps on the proportion of ‘CCC’ rated assets. Furthermore, the average credit quality of these portfolios is in the ‘B’ category. For new leveraged loan CLO transactions, to address the risk of early CDO downgrade due to excessive underlying portfolio migration, Fitch incorporates the use of a Rating Watch and Outlook in conjunction with the Fitch CDS Implied Ratings (Fitch CDS-IRs) into the methodology.2 The Fitch CDS-IR will be used to supplement the asset rating information in determining the default probability input in certain instances. For all assets subject to Negative Rating Watch, the lower of the Fitch CDS-IR or the credit rating minus one notch will be applied.
For assets subject to a Negative Outlook, the lower of the Fitch CDS-IR or the credit rating will be applied. In the event of new synthetic CDO transactions, Fitch may apply a greater degree of notching, depending upon the circumstances and purpose of the transactions concerned.
If no Fitch CDS-IR is available — which is generally the case for assets in leveraged loan CLOs — and the asset is subject to a Negative Rating Watch indication, the credit rating will be reduced by an assumed one notch for the purpose of determining the appropriate input default probability. New synthetic CDO transactions may however be subject to a greater degree of notching, as described above.
The approach calls for the use of a Fitch IDR where available. Where a particular issuer or asset is not rated by Fitch, the lower of the rating assigned by either S&P or Moody’s will be applied. The method used to derive the asset rating is described in the Fitch IDR Equivalency Map in Appendix 6. Should the rating be subject to a Negative Watch status, it will be reduced by one notch before the comparison is made. The approach still calls for use of the Fitch CDS-IR for assets subject to Negative Watch or Negative Outlook status. So if the rating applied was subject to a Negative Watch or a Negative Outlook (before adjustment), it will be compared to the Fitch CDS-IR (where available), and the lower of the two will be applied.
2 Fitch CDS Implied Ratings are a subscription product provided by Fitch Solutions

Structured Finance
Global Rating Criteria for Corporate CDOs November 2015
16
Fitch believes that Fitch CDS-IR can act as an effective screening tool to provide a cushion to protect investors in rated CDO notes against downgrades caused by adverse portfolio selection. The Negative Rating Watch has proven to be a good indicator of rating momentum. But the magnitude of ultimate downgrade has varied considerably. For assets subject to Negative Rating Watch or Outlook, the Fitch CDS-IRs are being used to supplement a rule-based notching, to identify the systematic inclusion of assets that are at risk of being subject to an above-average downgrade.
An Outlook Negative status is less indicative of rating momentum in the short term. As a result, Fitch does not apply rule-based notching for ratings on Outlook Negative, but applies a notching only to the extent indicated by the Fitch CDS IR. In addition to using the Fitch CDS-IR in the systematic fashion described, committees will also be provided with a comparison of the Fitch CDS-IR and the credit rating for all assets, regardless of Watch or Outlook status. If there is indication that the portfolio has been subject to significant adverse selection, additional adjustments may apply. Any additional adjustments will be described in the rating rationale.
If no Fitch CDS IR is available, the agency will assess the risk of adverse selection in the initial portfolio, as well as over the life of the transaction for managed structures. Fitch will take into account qualitative and quantitative factors that could indicate adverse selection, such as the manager’s track record. An over-proportionate share of ratings on Outlook Negative in the initial or indicative portfolio relative to the entire population of similar ratings may also indicate adverse selection.
If Fitch believes the portfolio to be adversely selected, and in the absence of Fitch CDS IR, the agency will increase the default probability assumptions for the portfolio by using PD multipliers or additional notching.
Fitch will continue to monitor the proportions of Outlook Negatives during surveillance to assess adverse selection on an ongoing basis.
Portfolio Management Transactions may be static or managed. Fitch considers that there may be additional risk in managed transactions, given that the portfolio may deteriorate not only by natural credit migration but also by substitution of assets during the revolving period. Available CE may be affected by realised gains or losses that result from trades, as well as from defaults and amortisation. When analysing transactions that include portfolio covenants and eligibility criteria in their documentation, Fitch will consider all covenants and all aspects of the management guidelines, including asset eligibility criteria and the manager’s ability to:
substitute assets freely or subject to defined covenants;
substitute impaired credits freely or not;
withdraw or monetise “surplus” CE; and
obtain quotes or trade with dealers other than the arranging bank.
Actively managed portfolios are initially rated based on a hypothetical Fitch stressed portfolio that is created based on the terms and conditions in the indenture or offering circular. Fitch maintains its ratings on actively managed portfolios by monitoring the performance and credit profile of the actual portfolio relative to the initial stressed portfolio analysis. In instances where there is limited or no portfolio management, Fitch assigns and maintains ratings based on the analysis of the static portfolio of identified assets.
Fitch Stressed Portfolio In its analysis of managed portfolios, Fitch assumes stressed-case portfolios with the aim of testing the robustness of the transaction structure against its covenants and portfolio guidelines.

Structured Finance
Global Rating Criteria for Corporate CDOs November 2015
17
Typically, Fitch starts with the initial “indicative” portfolio provided by the arranger and then maximises certain concentration limitations. The indicative portfolio provides a good indication of the portfolio the manager is likely to purchase, at least for US CLO with a broader universe of leveraged loans. In the case of most European CLOs, Fitch uses a standardised stress portfolio that is customised to the specific portfolio limits for each transaction. European CLOs tend to have a high overlap in terms of issuers and loans, due to the limited universe of eligible assets. As a result, managers have significantly less choice in the portfolio selection for European CLOs compared to US CLOs.
The following are the most common adjustments applied to the indicative portfolio for typical CLOs; the same principals are also reflected in the standard stress portfolio in the case of European CLOs. However, this list is not inclusive, as some CLOs may allow for limited exposure to certain asset types or other risk factors that Fitch may choose to stress in its analysis.
Obligor Size A typical CLO will cap the size of the obligors, with an allowance that a specified number may be a larger percent. Fitch assumes that managed portfolios are generally managed towards permitted concentration limitations that can lead to increased portfolio concentration. This may lead to more volatile portfolio performance, resulting in higher default expectations under high investment-grade rating stresses.
With regard to obligor size, the stress portfolio is constructed to include obligors that match the maximum limits. For instance, the indenture may specify each obligor to be 2.0% of the portfolio, with the exception that up to five obligors may each be up to 2.5%. In this instance, the Fitch Stressed Portfolio assumes these exceptions are maximised, with the top five obligors concentrated to represent 12.5% of the portfolio.
Portfolio Credit Quality Fitch stresses the credit quality of the portfolio by maximising the allowable exposure to assets rated ‘CCC’ or worse, as permitted by the concentration limits. If the transaction structure also includes a collateral quality test based on the Fitch weighted average rating factor (WARF), then the credit quality of the stressed portfolio is matched to the covenanted test level. This stressed assumption increases the portfolio default probability assumptions in PCM.
Asset Security A typical CLO allows for some portion of the portfolio to be invested in assets that are not senior secured loans, which could be second-lien loans or other instruments that historically experienced low recoveries. Fitch’s stressed portfolio analysis assumes the maximum allowance for non-first lien collateral, thereby giving no benefit for recoveries for this portion of the portfolio in high investment-grade rating stresses (see Figure 38; note: assets that are not senior secured loans are assumed to have weak recovery prospects). We also assume the remainder of the portfolio has similar seniority and recovery prospects to the indicative portfolio provided and utilise recovery ratings or recovery estimates where available. If the transaction structure also includes a collateral quality test based on the Fitch weighted average recovery rating (WARR), then the recovery assumption of the stressed portfolio is matched to the covenanted test level. The WARR is typically set below the weighted average recovery of the portfolio, giving managers the flexibility to buy assets with weaker recovery prospects. Where a WARR is included, the agency will consider both a barbelled portfolio including the maximum allowance of non-first-lien collateral, as well as a more homogenous portfolio distributed around the WARR.
Industry Concentration CLOs typically have limitations on exposure to any one industry, with exceptions for a certain number of industries to exceed this limit. For instance, the indenture may specify each industry is limited to 10% of the portfolio, except three industries may be 12% and one may be 15%.

Structured Finance
Global Rating Criteria for Corporate CDOs November 2015
18
The stressed portfolio is typically created maximising the permitted exposure to the three largest permitted industries. This stressed assumption increases portfolio concentration, which could cause more volatility in portfolio performance, leading to higher default rate assumptions at higher rating levels.
Risk Horizon Managed CLOs have a defined reinvestment period that often extends the WAL of the CLO notes beyond the WAL of the initial “indicative” portfolio. The manager can usually reinvest between payment dates and continue to reinvest on a ‘maintain or improve’ basis, even if portfolio profile tests are not meet. In Fitch’s stressed portfolio analysis, the WAL of the assets is extended to match the WAL permitted by the terms of the CLO, in order to appropriately address the additional default risk inherent with a longer risk horizon. This stressed assumption increases the portfolio default probability assumptions in PCM.
Cash Flow Stresses Certain covenants and portfolio guidelines may allow for exposures that Fitch may stress in its cash flow analysis. For instance, if the transaction allows for some portion of the portfolio to be invested in fixed rate assets, Fitch will analyse the impact of this allowance being maximised in a rising interest rate environment, where the fixed rate assets could be a negative drag on interest proceeds available to the notes. Additionally, Fitch analyses the potential risk of cash flow timing mismatches associated with allowances for assets that pay less frequently than quarterly; it does so by maximising the potential for these types of exposures. Fitch stresses the actual weighted average spread (WAS) and weighted average coupon (WAC) to the minimum level specified by the collateral quality tests. These stressed assumptions limit the amount of credit applied for excess spread and influence the break-even default rate analysis (see Cash Flow Modelling below).
Asset Repayment Assumptions In modelling CLO note amortisation Fitch generates an assumed principal payment schedule. Fitch uses the actual maturity profile of the identified portfolio assets as a proxy for the expected portfolio repayment profile as the CLO enters the note amortisation period. In its modelling, the WAL of the assets is extended to match the WAL permitted by the terms of the CLO. For European CLOs, Fitch uses a standardised amortisation profile (Figure 16) together with a standardised stress portfolio. European CLOs tend to have a high overlap in terms of issuers and loans, due to the limited universe of eligible assets. As a result, managers have significantly less choice in terms of portfolio selection for European CLOs compared to US CLOs.
Figure 16
Fitch will also consider the expected ability of the manager to create a portfolio at the limit of its covenants. The absolute limit of some covenants may not be achievable in reality. An example would be the absence of a covenanted country concentration limit in a European CLO, where historically no portfolio had more than 35% exposure per country. In such cases, Fitch will
0.0
0.2
0.4
0.6
0.8
1.0
0 3 6 9 12 15 18 21 24 27 30 33 36 39 42 45 48 51 54 57 60 63 66 69 72 75 78 81 84 87 90 93 96 99 102
105
108
111
114
117
120
123
126
129
132
135
138
(Percentage of par)
Amortisation Profile CLO 1.0Deal 1 Deal 2 Deal 3 Deal 4 Deal 5 Fitch amortization schedule
Source: Fitch(Months)

Structured Finance
Global Rating Criteria for Corporate CDOs November 2015
19
create a stressed-case portfolio that may have less than 100% single country concentration, despite the lack of a country limit. The stressed-case portfolio will be agreed in Fitch’s committee process.
Portfolio Trading Limitations Limitations on portfolio trading are expected in managed CLO structures. Typically, these triggers are based on collateral quality tests established at the onset of the transaction. If the performance of the actual portfolio significantly deteriorates, such that certain collateral quality tests fail, then the trading activity is expected to either maintain or improve the pre-trade test levels.
Structures that refer to Fitch portfolio metrics normally include a Fitch WARF Test and a Fitch WARR Test. These two tests, along with the Minimum Weighted Average Spread (WAS) Test, form the basis for dynamic portfolio management, via a Fitch Test Matrix. The calculations for a Fitch WARF and Fitch WARR are included in Appendix 7.
These tests are standard for Fitch-rated European CLOs and US Middle Market CLOs, as the analysis primarily relies on private credit opinions provided by Fitch’s corporate group. These tests may not be present in US broadly syndicated CLOs, where other collateral quality tests are present. In these instances, Fitch will consider the collateral quality tests included in the transaction documentation when building a stressed portfolio.
Operational Risk Considerations Operational risk considerations for a managed portfolio apply equally to substitution agents, portfolio advisors, liquidation agents and other parties that perform “manager” functions. Parties performing manager functions are reviewed by Fitch and are either explicitly rated or deemed acceptable by Fitch. Fitch will not rate transactions managed by parties that do not satisfy this review process, unless there are other mitigants, such as a back-up manager. The operational risk assessment is an on-site review and covers the company, controls, investments, operations and technology, as described in Fitch’s Asset Manager Rating Criteria (see Related Criteria). Fitch expects to update its assessment on any changes to the organisation as necessary, which may be completed on a conference call, and expects to conduct an on-site meeting every two years.
Additionally, organisations may undergo multiple operational reviews if they maintain multiple business lines that issue corporate CDOs, like US broadly syndicated CLOs, US middle-market CLOs and European CLOs, as each business line may have different operations, technology, etc. In the event a manager is being replaced in a transaction, Fitch expects to be notified of the proposed change and expects the successor manager to be reviewed; Fitch may decide to withdraw the ratings if the new parties do not satisfy this review process.
Cash Flow Modelling To determine the rating of a given tranche of notes, Fitch analyses a series of stress scenarios to determine whether the payment of interest and principal according to the terms and conditions of such notes is fulfilled across all scenarios. In its rating reports, Fitch discusses the indications given by the cash flow model runs in the scenarios summarised in Figure 16, and the related rating considerations. While the cash flow model analysis is an important consideration in determining the final rating, ratings are ultimately assigned by a Fitch rating committee that also considers other quantitative and qualitative factors.
Break-even default rates (BDRs) are an output of Fitch’s cash flow model that show the maximum portfolio default rates a class of notes can withstand in stress scenarios without experiencing a loss. BDRs for a class are then compared to PCM rating default rates (hurdle rates) at the corresponding rating stress. The committee considers the BDR compared to the hurdle rate as the key quantitative factor for assigning a rating.

Structured Finance
Global Rating Criteria for Corporate CDOs November 2015
20
Figure 16 shows the standard scenarios Fitch runs for a corporate CLO in the absence of FX risk.
Figure 17 Summary of Standard Scenarios Default distribution Interest rate trend Front-loaded Rising Stable Decreasing Middle-loaded Rising Stable Decreasing Back-loaded Rising Stable Decreasing Source: Fitch
Fitch’s approach to cash flow modelling is based around determining whether a class of notes pays according to its terms, under a series of defined interest rate and default timing stress scenarios for a given rating level. If a particular class of notes has received payment in full in a given stress scenario, it is deemed to have passed that stress scenario.
Based on the outputs of PCM and the defined stress scenarios, Fitch’s cash flow analysis determines whether the CDO liabilities receive principal and interest in accordance with the terms of the transaction documents. Fitch uses a proprietary Excel-based cash flow model, customised for rating-relevant structural features for each transaction, based on information and transaction documents provided to Fitch by the issuer, originator, or third-party agents on their behalf. Fitch’s cash flow model is not publicly available.
Each transaction’s customised cash flow model accounts for the CDO’s capital structure and unique structural features, including but not limited to:
the interest and principal priority of payments, including provisions for various fees and expenses;
coverage tests (eg OC tests, IC tests, reinvestment OC tests);
any interest rate or currency swaps or hedges; and
other relevant structural features.
Timing of Defaults Fitch utilises different default timing scenarios to assess the ability of the structure to withstand various clusters of defaults. Fitch’s default timing scenarios apply peak defaults over a two-year period, which is consistent with research on historical default patterns. Fitch will test the structure for front-loaded, middle-loaded, and back-loaded peak default scenarios. The total amount of defaults will always be the same for each default timing stress.
The timing of the default peak is adjusted according to the portfolio’s weighted average life (WAL – see Appendix 8 for default timings for portfolios with a WAL from 3.5 years to 12 years). As an example, the default timings used for a portfolio with a WAL between 7.5 and 8.5 years would be as follows:

Structured Finance
Global Rating Criteria for Corporate CDOs November 2015
21
Figure 18 Default Timing for a WAL Between 7.5 and 8.5 Years (% Share of RDR) Year Front Mid Back 1 33 - - 2 22 9 9 3 9 9 9 4 9 22 9 5 9 33 10 6 9 9 10 7 9 9 20 8 - 9 33
RDR Rating default rate Source: Fitch
For portfolios where the default patterns described in this report are not applicable — because the portfolio has a very short tenor or has an accelerated amortisation profile after the revolving period — Fitch may adjust the applied default patterns to account for the specifics of the analysed portfolio. Likewise, for portfolios with assets of notably long tenor exceeding 12 years (such as trust-preferred securities), multiple default peaks or extended default cycles are applied to address the characteristics of the assets and the possibility the portfolio will experience multiple credit cycles.
Interest Rate Stresses Fitch analyses rising, falling, and flat interest rate scenarios in its cash flow analysis. Rising and falling scenarios are in accordance with Fitch’s Criteria for Interest Rate Stresses in Structured Finance Transactions and Covered Bonds, available on Fitch’s Web site at www.fitchratings.com.
Timing of Recoveries Recoveries are assumed to be received following a lag period after default. Recoveries may come from either work-out or sale of the defaulted asset. For cash flow scenarios, Fitch assumes that recoveries are produced as a part of a work-out, in line with the manner in which its relevant corporate teams assign recovery assumptions. Managers may sell positions post default. Historically, ultimate recovery rates tended to be higher compared to post default trading prices. The agency considers it more stressful to assume lags, in order to maximise negative carry, particularly given positions may be illiquid and price determination difficult.
The timing of recoveries assumes no interest proceeds from defaulted assets over the time of the work-out period. This results in negative carry, as the liabilities have to be paid, while defaulted assets are assumed to generate no cash flow between default and recovery.
For US corporate loans and corporate bonds, the recovery lag is assumed to be 12 months. The recovery lag for European bonds and loans is 18 months for ‘Asf’ rating levels and higher, acknowledging less favourable workout regimes across European jurisdictions. For ‘BBBsf’ and below, the recovery lag in European jurisdictions is 12 months.
Additional Default Risk in Revolving Transactions Managed transactions may also have the ability to reinvest recovery proceeds from defaulted assets, or from interest proceeds diverted via failure of an interest diversion test or other similar reinvestment OC test. These new assets are subject to default risk that is not reflected in the expected default rates derived by PCM. Instead, Fitch takes into account this additional default risk in its cash flow modelling approach.
Fitch assumes that proceeds reinvested during the reinvestment period are used to purchase assets with the same risk profile as the outstanding performing portfolio at the time of the

Structured Finance
Global Rating Criteria for Corporate CDOs November 2015
22
reinvestment. This is achieved by modelling the reinvestment as an increase in the current portfolio size. To capture the default risk on these newly acquired assets, the periodic default rate applied on the outstanding performing portfolio is also applied to these assets, given that they share the same credit characteristics. An example of the methodology is provided in Appendix 9.
Available Cash Investments Fitch assumes cash balances held in a transaction’s interest and principal collection accounts between payment dates will earn a spread of minus 50bp to the relevant reference index (eg EURIBOR/LIBOR), floored at zero.
Fitch will adjust these assumptions if the contractual rates are less favourable to the issuer than the above assumption.
Senior Fees and Asset Spreads For corporate CDOs, the cash flow modelling is based on contractual management fees, which reflect market rates. Fitch may stress the senior fees on a case-by-case basis, if the contractual rates are deemed to be below the market rate.
Asset spreads are based on the actual spread for static transactions and the covenanted minimum spread level for replenishing transactions.
Call Options Historically, most CLO notes are repaid through the exercise of the call option, which typically is controlled by the CLO equity investors. Fitch’s analysis assumes that the call option is not exercised and the CLO notes are repaid through asset repayments. Fitch’s ratings are therefore de-linked from the creditworthiness of the call option holder. Fitch expects CLO indentures to specify that principal and accrued interest on all notes is paid in full as a condition to exercise the call option.
Long-Dated Assets CLO structures that allow managers to invest in loans with maturity dates after the legal maturity of the bonds may expose the notes to the market value of those assets. The manager would have to sell the assets on the maturity date of the notes. Fitch expects limitations to be in place to restrict the ability of the manager to invest in such long-dated assets. If the CLO structure allows for assets with a tenor immediately prior to the final note payment or beyond, then Fitch will assume the assets default and the CLO notes only receive the assumed asset recovery value at the maturity of the notes. Transactions that permit greater than 5% long-dated assets would be exposed to significant market value risk and would require additional stresses.
Additionally, some CLOs allow for the limited reinvestment of unscheduled principal proceeds after the reinvestment period. In this case, Fitch expects the CLO structure to contain sufficient provisions to limit the amount of the investment portfolio that may be outstanding as the transaction reaches maturity. Typically, this is accomplished by reducing the WAL test value down to zero by the end of the note amortisation period.
Overcollateralisation (OC) and Interest Coverage (IC) Tests Fitch evaluates the prescribed calculations of a transaction’s coverage (OC and IC) tests to determine whether such tests will effectively divert cash proceeds to the senior notes upon negative rating migration in the portfolio. The OC tests for most high yield CLO transactions, for example, include multiple haircuts when calculating the par amount of collateral available to support the rated notes.
If Fitch believes such tests are calculated in a manner that renders them relatively ineffective, additional sensitivity scenarios or adjustments to Fitch’s base case scenario may be warranted.
Structured Finance
Global Rating Criteria for Corporate CDOs November 2015
23
Adjustments for inefficient OC measurements may include not modelling the OC tests during the reinvestment period, thereby not giving credit for excess spread while the asset manager can purchase additional assets. Any such adjustments or sensitivity analysis will be described in Fitch’s rating action commentary.
CLO structures normally provide that assets rated in the ‘CCC’ rating category or lower, where above a certain threshold (typically 7.5%), are carried at an adjusted value. This may mean that OC tests become effective earlier than if they were to rely on defaulted assets alone. In lower rating stresses (categories ‘Bsf’ and ‘BBsf’) Fitch would expect obligors that ultimately default to be rated ‘CCC’, causing OC tests to fail earlier.
In particular, Fitch assumes the proportion of ‘CCC’ assets in the portfolio to be a multiple of the projected default rate for the 12-month period ahead. Fitch assumes an average 12-month default rate for ‘CCC’ rated borrowers of 25%, which is consistent with empirical observations. This assumption implies a multiple of ‘CCC’ obligations to defaulted obligations of four times. For the ‘BBsf’ category scenarios, Fitch applies a multiple of 2.5x, and for the ‘Bsf’ category scenarios the applied multiple is 3.5x. These multiples are set below the historical 4x average to account for the potential for higher-rated obligors “jumping” to default but without migrating to ‘CCC’ first. In both scenarios, the proportion of ‘CCC’ assets of the performing portfolio is capped at 50%.
The adjusted value for excess ‘CCC’ obligations in CLOs is typically their market value. Fitch does not model the market value explicitly but assumes that in lower rating stresses the recovery assumption is a good indicator for the market value.
For example, assuming an RDR of 30%, the front-loaded default timing for a weighted average life of between 7.5 and 8.5 years allocates 9% of the RDR to year three. This corresponds to an assumed 2.7% of the initial target par amount of the portfolio (30% * 9%) expected to default during year three. For a ‘Bsf’ scenario, Fitch assumes 9.4% (3.5x ‘Bsf’ multiple * 2.7%) of the portfolio to be rated ‘CCC’ or worse during the second year of the transaction life and for a ‘BBsf’ scenario 6.75% (2.5x ‘BBsf’ multiple * 2.7%).
Defaulted assets are typically included at the lower of the market value or a predetermined recovery rate, defined in the transaction documents. Fitch believes these haircuts can serve as early indicators of deteriorating collateral performance and are important for preserving a minimum ratio of underlying collateral value available to the senior notes. Multi-Currency Structures Most European CLOs use perfect asset swaps to hedge FX risk for non-euro-denominated assets. More recently, the agency has assigned ratings to structures that allowed a limited exposure to GBP or USD assets that is not hedged with derivatives, but rather by issuing non-euro tranches in the same currency. The maximum currency bucket has been 10% to date, against 5% of liabilities, leaving a 5% of reinvestment target par mismatch between assets and liabilities.
Market risk in the form of FX exposure should not be the primary rating driver in CLO structures. Therefore, the approach outlined below will be applicable where the size of the FX bucket is limited and/or the impact on the rating when compared to an all-EUR structure with similar characteristics is limited. The committee may decide on a rating cap where FX risk becomes a primary rating driver.
Such an asset/liability hedging strategy is not perfect and exposes the structure to residual currency risk. For example, defaults may reduce the assets and as a result, the FX liabilities have to be repaid by converting EUR proceeds at spot. Similarly, FX liabilities that rank pro rata with the corresponding EUR tranche are less effective than, for example, variable funding notes. Unless the issuer receives the correct proportion of FX proceeds and EUR proceeds, it will

Structured Finance
Global Rating Criteria for Corporate CDOs November 2015
24
have to convert one or the other at spot in order to maintain the pro rata split of the liability structure. If for example the GBP sub-portfolio has a significantly longer WAL than the EUR sub-portfolio, this could significantly reduce the effectiveness of the liability hedging, since the GBP tranches would be repaid from EUR proceeds prior to receiving the GBP proceeds, leaving the structure unhedged. To mitigate this risk, European CLOs include specific WAL tests for each sub-portfolio.
To test the effectiveness of an imperfect asset/liability hedging, Fitch will test the structure by modelling stressed FX rates for each currency under the standard interest rate and default timing scenarios. The stresses for GBP and USD to the EUR are outlined in Appendix 10.
In addition, if defaults were to occur unevenly across such a portfolio, the impact of FX rates and interest rates on unhedged risks can be magnified in the structure. Therefore, for CDOs with FX exposure, Fitch will also analyse the impact of defaults skewed toward each sub-pool within its cash flow modelling framework. The following default skew stresses would be used for a multicurrency transaction, or transactions with significant fixed/floating interest rate mismatches.
Figure 19 Default Skew Stresses for Foreign Exchange Mismatches Rating scenario Pool one Pool two AAA 62.5 37.5 AA 60.0 40.0 A 57.5 42.5 BBB 55.0 45.0 BB 52.5 47.5 B 50.0 50.0 Note: a 60%/40% default skew would imply that 60% of defaults would occur in Pool One if the pools were of equal weight. Please contact Fitch to obtain the default skew percentages for non-equally weighted portfolios Source Fitch
For very small FX exposures, which could include only a few assets, the committee may also consider a more significant skew proportion in assigning the rating.
Combination Notes Combination notes are notes where tranches from CLOs or Corporate CDOs are combined, in whole or in part, to form new securities. Combination notes may also include other securities, such as government bonds. The cash flow modelling methodology outlined in this report is applied to determine the impact of the various scenarios described above on the principal and interest cash flows described in the terms and conditions of the combination note. Typically, the combination noteholders are entitled to all distributions of principal and interest on the underlying components. Combination notes may take many forms and each proposal needs to be evaluated on its specific merits. Some of the factors used by Fitch when deciding if the combination note is rateable include:
availability of sufficient information to analyse each of the underlying components;
the terms and conditions of the combination notes match the anticipated payment profile of the included notes; and
the included notes generate sufficient cash flows to satisfy repayment of the combination notes under the specified rating stress scenarios.
If a potential principal shortfall exists in Fitch’s stressed cash flow analysis, associated with a specific rating level, then that rating level can be assigned to the combination notes only in the presence of some form of additional credit enhancement that mitigates the shortfall. Often times, this additional credit enhancement will be one or more principal-only (PO) securities that are included to provide principal cash flows toward the end of the transaction. This would potentially offset potential shortfalls that occur in a stress scenario. In these instances, the

Structured Finance
Global Rating Criteria for Corporate CDOs November 2015
25
combination notes’ ratings are determined through the application of the Two-Risk CLN Matrix in the Global Rating Criteria for Single- and Multi-Name Credit-Linked Notes (see Related Criteria), where the PO issuer and the combination notes are the risk-presenting entities.
Limitations This criteria report details Fitch’s methodology for analysing portfolios of corporate credit for rating CDOs. The report covers the credit analysis of diversified portfolios of bonds or loans. The criteria report does not cover any market value risk associated with these bonds or loans. In addition, this report is focused on the asset analysis only.
Fitch may apply overrides to these criteria for atypical portfolios. Features of these portfolios may include large industry or obligor concentrations as well as particularly long, short or clumped-together asset maturities. Any override of the methodology decided by committee will be disclosed in Fitch’s commentary about the transaction. Fitch may also decline to rate a transaction or apply ratings caps in line with its Criteria for Rating Caps in Global Structured Finance Transactions.
The methodology described in this criteria paper forms the cornerstone of the CDO rating methodology. However, Fitch recognises that the CDO market, and therefore its risk drivers, evolves over time, sometimes rapidly. Moreover, certain portfolios may contain risk characteristics not contemplated in the framework. Therefore, Fitch fully expects that this methodology will be supplemented by appropriate analytical judgment and deterministic overlays, where unique risks are identified and are deemed to fall outside the scope of this basic framework.
Sensitivity Analysis Fitch will run a range of sensitivity analyses on key input parameters to examine the rating stability of each transaction. The objective of this stress testing is not to eliminate rating migration through unrealistically conservative assumptions, but rather to test that a small change in input parameters does not result in a multi-category downgrade. The sensitivity analysis results will be published in the agency’s new issue report for each rated transaction. Fitch will review the impact on the rating for the following sensitivities.
Rating sensitivity to default probability: default probability multiplier of 125% and 150% applied to the default probability of each obligor.
Rating sensitivity to recovery rates: 0.75x and 0.5x multiplier applied to loan-level recovery rates.
Rating sensitivity to correlation: 2x base correlation for the country. For example, if the correlation between two assets from the same country is 4%, Fitch would test the sensitivity assuming an 8% correlation.
Combined stress: default probability multiplier of 125%, recovery rates 0.75x and 2x base correlation for the country.
A rating committee will review the stability of the proposed rating under such stresses and determine whether the results are commensurate with the rating being proposed for the structure.
Figures 18 and 19 show the sensitivity results for two example portfolios. The analysis is only based on the asset performance, excluding structural features and cash flow modelling.

Structured Finance
Global Rating Criteria for Corporate CDOs November 2015
26
Figure 20
Portfolio One: Leveraged Loan CLO Geographic location: UK (25%), Germany (20%), Others (55%).
65 borrowers.
Asset quality ‘B−’ (35%), ‘B+’ (30%), ‘B’ (25%), ‘CCC’ (10%).
100% senior secured loans .
Seven-year bullet loans.
Largest industry 20%.
Indicative Rating
Initial rating Base RLR
(%) 125% xPd 150% xPd 0.75xRR 0.5xRR 2x base correlation
1.25X PD; 0.75xRR; 2x base correlation
AAAsf 40.20 AA+sf AAsf AA+sf Asf AA+sf A+sf AAsf 31.70 A+sf BBB+sf BBB+sf BB+sf AA−sf BB+sf Asf 25.90 BBB+sf BB+sf BB+sf Bsf A−sf BB−sf BBBsf 21.50 BB+sf BB+sf BBsf CCCsf BBB−sf CCCsf BBsf 14.60 CCCsf BB−sf Bsf 13.10 B−sf Source: Fitch
Figure 21
Portfolio Two Geographic location: US.
150 equally weighted assets
‘BBB’ rated assets.
100% Senior unsecured loans.
Five-year bullet loans.
Diversified industry exposure.
Indicative Rating
Initial rating Base RLR
(%) 125% xPd 150% xPd 0.75xRR 0.5xRR 2x Base correlation
1.25X PD; 0.75xRR; 2x Base correlation
AAAsf 11.8 AA+sf AA−sf AA+sf AA+sf AA+sf AA−sf AAsf 9.5 A+sf Asf AA−sf AA−sf AA−sf A−sf Asf 7.0 BBB+sf BBBsf A−sf BBB+sf BBB+sf BBB−sf BBBsf 5.1 BB+sf BB+sf BBB−sf BB+sf BBB−sf BB+sf BBsf 2.9 B+sf B−sf B+sf Bsf BB−sf B−sf Bsf 2.2 B−sf CCCsf B−sf CCCsf Bsf CCCsf Source: Fitch
Portfolio Performance and Surveillance Fitch typically receives and reviews remittance reports on a monthly basis. Automated credit alert systems allow Fitch analysts to quickly detect changes in underlying portfolio performance and adjust review committee schedules accordingly. A number of these systems are available to the public on the CDO Surveillance section of www.fitchratings.com.
The actual frequency of rating reviews depends on the nature of the transaction. Outstanding ratings are reviewed at least annually. However, transactions may be taken to credit committee more frequently, as warranted by performance, to maintain timely ratings on all Fitch-rated CDOs.

Structured Finance
Global Rating Criteria for Corporate CDOs November 2015
27
The surveillance methodology is substantially similar to the approach for determining ratings for new issues, with the following modifications.
For managed portfolios: adverse selection, in Fitch’s opinion, as evidenced by the proportion of ratings on Negative Watch or Outlook, would attract an increased default probability, which may result in negative rating actions.
Recovery rate and default rate sensitivity testing may be applied to address the dynamic view of current market conditions relative to historical data.
Ratings are ultimately assigned by a rating committee that may take into account other considerations not described in this criteria report. In particular, if there is a methodology-implied rating action, the rating committee may apply its discretion in choosing to maintain the rating. This would typically be the case where there is not expected to be a permanent change in performance. As a result, there is an expectation that there could subsequently be a short-term reversal of any methodology-driven rating action taken, such that applying the action could result in unwarranted rating actions. Such discretion is typically exercised in situations where the methodology-implied action is less than one rating category in magnitude.

Structured Finance
Global Rating Criteria for Corporate CDOs November 2015
28
Appendix 1: Asset and CDO Target Default Rates Figure 22 Cumulative Asset Default Rates (%) Asset Fitch IDR 1 2 3 4 5 6 7 8 9 10 AAA 0.01 0.01 0.01 0.037 0.082 0.135 0.174 0.190 0.192 0.193 AA+ 0.01 0.01 0.02 0.060 0.118 0.186 0.247 0.293 0.328 0.350 AA 0.01 0.02 0.05 0.097 0.169 0.257 0.350 0.452 0.560 0.638 AA− 0.01 0.04 0.09 0.157 0.256 0.372 0.493 0.623 0.760 0.863 A+ 0.03 0.08 0.15 0.254 0.387 0.538 0.695 0.859 1.031 1.168 A 0.07 0.16 0.27 0.411 0.586 0.779 0.978 1.185 1.398 1.580 A− 0.10 0.23 0.40 0.611 0.869 1.154 1.442 1.727 2.009 2.246 BBB+ 0.14 0.33 0.59 0.907 1.289 1.711 2.126 2.517 2.887 3.192 BBB 0.19 0.49 0.87 1.348 1.913 2.536 3.134 3.669 4.149 4.536 BBB− 0.34 0.97 1.77 2.667 3.611 4.546 5.380 6.082 6.673 7.130 BB+ 0.75 2.07 3.63 5.261 6.869 8.365 9.649 10.698 11.550 12.193 BB 1.16 3.12 5.40 7.753 10.026 12.112 13.896 15.355 16.535 17.434 BB− 1.49 4.00 6.90 9.887 12.785 15.465 17.816 19.806 21.469 22.805 B+ 2.89 7.15 10.83 14.106 17.186 20.024 22.513 24.620 26.381 27.795 B 5.36 11.16 15.17 18.490 21.572 24.410 26.899 29.007 30.767 32.182 B− 8.35 18.74 24.31 27.663 30.585 33.265 35.616 37.607 39.269 40.605 CCC+ 25.228 37.337 43.817 47.727 51.130 54.252 56.990 59.308 61.245 62.800 CCC 25.228 37.337 43.817 47.727 51.130 54.252 56.990 59.308 61.245 62.800 CCC- 25.228 37.337 43.817 47.727 51.130 54.252 56.990 59.308 61.245 62.800 CC 50.500 56.500 62.500 68.500 74.500 80.500 86.500 92.500 98.500 100 C 75.00 81.50 87.50 93.50 100 100 100 100 100 100 D 100 100 100 100 100 100 100 100 100 100 The full 30-year table of default probability assumptions is available in the Portfolio Credit Model Source: Fitch
The table includes ‘CCC+’ and ‘CCC−’, although Fitch no longer assigns these to IDRs. However, these rating levels are still used by Fitch’s corporate analysts for instrument ratings. In the absence of an IDR, Fitch would derive the rating – for the purposes of CDO analysis – from the instrument ratings in the Fitch IDR equivalency map in Appendix 6.
The default probability assumptions used in the CDO analysis for ‘CCC+’ and ‘CCC−’ are the same as for ‘CCC’. As a result – and as part of the analysis by Fitch’s CDO analysts – an issuer rated ‘B−’ that is on Rating Watch Negative would be notched to ‘CCC+’ but would be assigned the same default probability assumptions as a ‘CCC’ rated issuer.
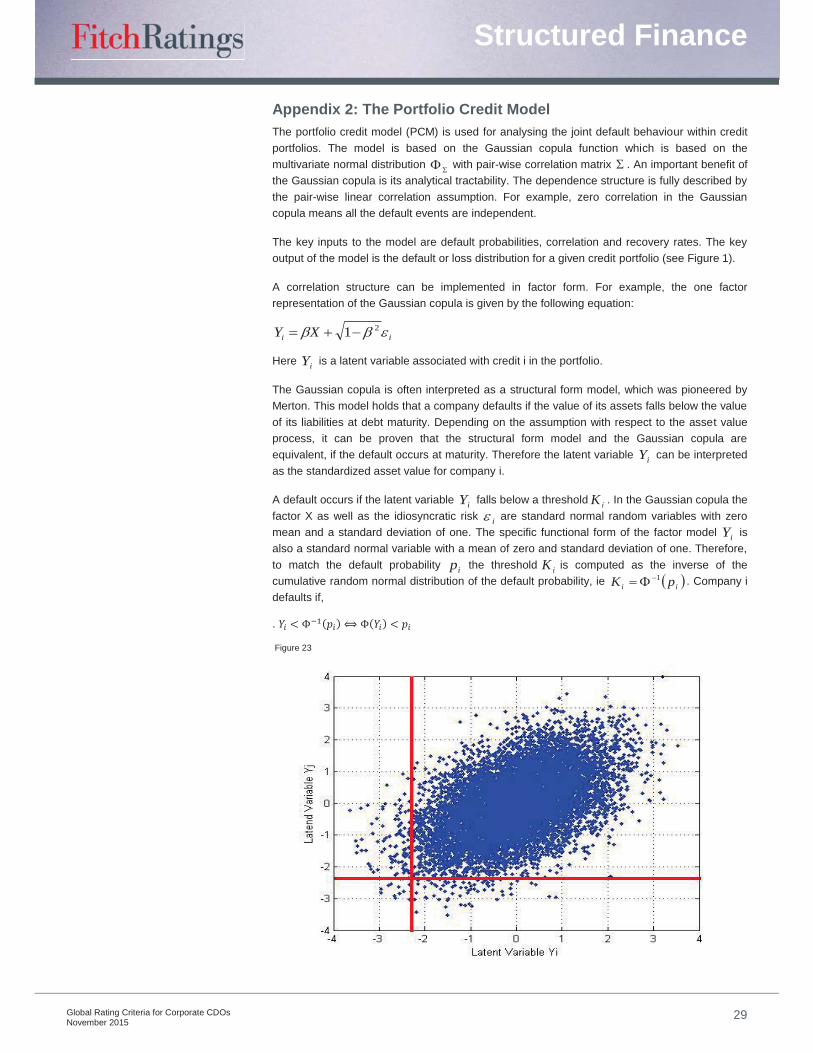
Structured Finance
Global Rating Criteria for Corporate CDOs November 2015
29
Appendix 2: The Portfolio Credit Model The portfolio credit model (PCM) is used for analysing the joint default behaviour within credit portfolios. The model is based on the Gaussian copula function which is based on the multivariate normal distribution with pair-wise correlation matrix . An important benefit of the Gaussian copula is its analytical tractability. The dependence structure is fully described by the pair-wise linear correlation assumption. For example, zero correlation in the Gaussian copula means all the default events are independent.
The key inputs to the model are default probabilities, correlation and recovery rates. The key output of the model is the default or loss distribution for a given credit portfolio (see Figure 1).
A correlation structure can be implemented in factor form. For example, the one factor representation of the Gaussian copula is given by the following equation:
ii XY 21
Here iY is a latent variable associated with credit i in the portfolio.
The Gaussian copula is often interpreted as a structural form model, which was pioneered by Merton. This model holds that a company defaults if the value of its assets falls below the value of its liabilities at debt maturity. Depending on the assumption with respect to the asset value process, it can be proven that the structural form model and the Gaussian copula are equivalent, if the default occurs at maturity. Therefore the latent variable iY can be interpreted as the standardized asset value for company i.
A default occurs if the latent variable iY falls below a threshold iK . In the Gaussian copula the factor X as well as the idiosyncratic risk i are standard normal random variables with zero mean and a standard deviation of one. The specific functional form of the factor model iY is also a standard normal variable with a mean of zero and standard deviation of one. Therefore, to match the default probability ip the threshold iK is computed as the inverse of the cumulative random normal distribution of the default probability, ie ii pK 1 . Company i defaults if,
.
Figure 23

Structured Finance
Global Rating Criteria for Corporate CDOs November 2015
30
Dependence is introduced by correlating the Y variables through the common factor X. The pair-wise correlation between iY and jY is given by 2 .
The one-factor model can be extended to a multi-factor model, which allows a more asset-specific correlation structure. The PCM incorporates a multi-factor correlation model which will be described in more detail in Appendix 3. For a portfolio of just two credits (bi-variate case) the Gaussian copula function can be illustrated graphically, as shown in Figure 22.
The scatter plot shows the joint distribution of the two latent variables (asset values) iY and jY . The red lines illustrate their respective default thresholds. The bottom left hand corner of the scatter plot shows the occurrences when both credits default.
So far this paper has focused on a model with a specified fixed maturity T. The model can also be used to infer the joint time to default for all the credits in the portfolio. Given a term-structure of default probabilities iF for a specific credit in the portfolio, the time to default i is given by
ii YF 1
In other words, rather than specifying just one threshold K to determine whether an asset defaults at time T, the latent variable Y is compared to a specific threshold for each point in time.
Figure 24
In the PCM, the default probability term structures are derived from historical default rates rather than implied by spread or price levels. Figure 23 shows the term structure of default probabilities for a ‘AA’ and a ‘B’ rated asset.
The portfolio loss distribution for a fixed time horizon T can be generated using the Monte Carlo Simulation as follows3.
3 Of course, the loss distribution of the one factor Gaussian copula can be derived much faster by
semi-analytic techniques such as recursion or fast Fourier transform methods. The model also has a close form large homogeneous portfolio approximation. Nevertheless, all of these can only be used in a single factor framework. For multi-factor extension, which the PCM is based on, Monte Carlo Simulation is the most efficient numerical scheme

Structured Finance
Global Rating Criteria for Corporate CDOs November 2015
31
Figure 25
1. Calculate the thresholds ii pK 1 for each credit. Here ip is the default probability
for name i that corresponds to the time horizon T.
2. Simulate a vector of independent standard normally distributed random variables i (one for each credit in the portfolio).
3. Simulate a scalar standard normally distributed random variable for the factor value X.
4. Compute ii XY 21 ; for equal pair-wise correlation between all credits.
5. The default time Ti , if the latent variable TKY ii .
6. Compute the portfolio loss as the sum up the loss given default of all credits (LGD) that defaulted prior to T. The PCM uses deterministic recovery rates.
7. Repeat steps 2 to 6 several thousand times. Compute the loss distribution as the histogram of portfolio losses over all simulation scenarios. The histogram is an approximation of the exact loss distribution and the numerical accuracy improves the larger the number of simulations.
CDO portfolios often include assets with different maturity dates or even amortising assets. The loss given default for a specific issuer in the CDO portfolio is derived from the outstanding notional of all assets in the portfolio at the time of default. Therefore, the simulation time horizon is effectively equal to the maturity of the longest asset in the portfolio.
0.0
0.2
0.4
0.6
0.8
1.0
05
101520253035
1 2 3 4 5 6 7 8 9 10
B credit (LHS) AA credit (RHS)
(PD for B rating (%))
Term Structure of Default Probabilities
Source: Fitch
(PD for AA rating (%))
(Term in years)

Structured Finance
Global Rating Criteria for Corporate CDOs November 2015
32
Appendix 3: Correlation Calibration Given the choice of model (Gaussian copula) and the corporate and CDO default rates, the only remaining parameter that would impact the default distribution produced by the model is the correlation.
Correlation has been a much discussed concept and a lot of research was devoted to estimate and model it. Nevertheless, it still is a relatively opaque concept and heavily model-dependent. For example, although in the Gaussian copula the dependency between defaults is fully expressed by the pair-wise correlation input, other copula function, such as the t – copula or Clayton copula, have other or additional parameters that determine the default dependency (joint probability of default).
Generally, Fitch’s credit view assumes that the RDR for higher rating levels of ‘Asf’ and above should cover the historical peak default rate.
In order to calibrate the correlation model, Fitch used large homogenous, randomly selected portfolios that resembled the cohort portfolios underlying the historical default studies. The objective was to find a single pair-wise correlation parameter, in line with the stated credit views.
Figure 24 shows the RDR at each rating category for portfolios with different underlying credit qualities and tenors. These were generated using the PCM with the following assumptions:
historical corporate default rates;
CDO default rates equal to historical corporate default rates;
Gaussian copula model; and
6.5% equal pair-wise correlation between all assets in the portfolio.
Figure 26 Model RDR for Equally Weighted Portfolio of 300 Assets with 6.5% Flat Pair-Wise Correlation, Historical Corporate and CDO Default Tables Asset rating: B Asset rating: BB Asset rating: BBB Asset rating: A RDR 5 year 10 year 5 year 10 year 5 year 10 year 5 year 10 year Model output (%) Peak 38.7 49.5 19.7 29.7 4.5 9.3 1.61 4.02 AAAsf 51.7 62.0 32.0 42.7 10.3 17.0 4.7 8.0 AAsf 49.3 58.0 30.0 38.7 9.3 14.7 4.0 6.7 Asf 45.0 54.3 26.3 35.0 7.7 12.7 3.3 5.3 BBBsf 40.3 49.3 22.7 30.7 6.0 10.0 2.3 4.3 BBsf 32.0 41.3 16.7 23.7 4.0 7.0 1.3 2.7 Bsf 27.3 36.3 13.3 20.0 2.7 5.3 1.0 2.0 Expected 21.6 32.2 10.1 17.5 1.9 4.5 0.6 1.6 Coverage of mean AAAsf 2.4 1.9 3.2 2.4 5.4 3.8 8.1 5.1 AAsf 2.3 1.8 3.0 2.2 4.9 3.2 6.9 4.2 Asf 2.1 1.7 2.6 2.0 4.0 2.8 5.7 3.4 BBBsf 1.9 1.5 2.2 1.8 3.1 2.2 4.0 2.7 BBsf 1.5 1.3 1.7 1.4 2.1 1.5 2.2 1.7 Bsf 1.3 1.1 1.3 1.1 1.4 1.2 1.7 1.3 Coverage of peak AAAsf 1.3 1.25 1.6 1.4 2.3 1.8 2.9 2.0 AAsf 1.3 1.17 1.5 1.3 2.1 1.6 2.5 1.7 Asf 1.16 1.1 1.34 1.18 1.7 1.4 2.05 1.32 BBBsf 1.042 1.0 1.153 1.032 1.336 1.074 1.429 1.070 BBsf 0.8 0.83 0.8 0.8 0.9 0.8 0.8 0.7 Bsf 0.7 0.73 0.7 0.7 0.6 0.6 0.6 0.5 Source: Fitch

Structured Finance
Global Rating Criteria for Corporate CDOs November 2015
33
The table shows historical peak default rate for each rating category and term. The peak default rates were based on the published data from three rating agencies.
The second and the third tables show the multiple of the model RDR over the respective mean and peak default rate at each rating level. For example, a portfolio of 300 equally-weighted ‘BBB’ assets with a 10-year term has a portfolio default rate (RDR) at ‘AAAsf’ of 17%. The historical ‘BBB’ 10 year mean and peak default rates are 4.5% and 9.3%, respectively. The resulting multiple coverage of the mean default rate is 3.8 times and of the peak default rate is 1.8 times.
These results highlight some interesting properties of the model. Firstly, the multiples increase for shorter tenors and higher credit quality, which is mainly a result of the historical term structure and peak default rates. The multiple coverage of the base default rate for sub-investment-grade ratings with the same correlation is less than three times because of the higher base case. Secondly, the coverage of the mean and peak default rates at the ‘BBBsf’ rating levels appear high relative to the ‘AAAsf’ coverage and the implied tiering between ‘AAAsf’ and ‘BBBsf’ CDO ratings is very linear.
Therefore the following adjustments were applied to the model.
1. Reduce correlation from 6.5% to 4%, in order to address the relatively high multiples at liability ratings of ‘BBB’ and below.
2. Lower the CDO default rates for ‘AAAsf’ and ‘AAsf’ (increases the level of confidence). This adjustment will compensate for the lower correlation assumption and maintain the RDR for 10 year ‘AAAsf’ and ‘AAsf’ rating levels. The two tables below show the empirical default rates and the target CDO default probability assumptions.
Figure 27 Historical Default Rates Adjusted Fitch composite (%) 1 2 3 4 5 6 7 8 9 10 AAA 0.01 0.01 0.01 0.04 0.08 0.14 0.17 0.19 0.19 0.19 AA+ 0.01 0.01 0.02 0.06 0.12 0.19 0.25 0.29 0.33 0.35 AA 0.01 0.02 0.05 0.10 0.17 0.26 0.35 0.45 0.56 0.64 AA− 0.01 0.04 0.09 0.16 0.26 0.37 0.49 0.62 0.76 0.86 Source: Fitch
Figure 28 Adjusted CDO Target Default Rates Adjusted Fitch composite ‘AAAsf’, ‘AAsf’ CDO default rates (%) 1 2 3 4 5 6 7 8 9 10 AAAsf 0.01 0.01 0.01 0.01 0.03 0.03 0.03 0.03 0.03 0.03 AA+sf 0.01 0.01 0.02 0.04 0.08 0.08 0.08 0.08 0.08 0.08 AAsf 0.01 0.02 0.04 0.08 0.14 0.14 0.14 0.18 0.22 0.26 AA−sf 0.01 0.03 0.08 0.14 0.23 0.33 0.44 0.56 0.68 0.78 Source: Fitch
3. Floor the CDO default rates at 1bp, which mainly affects the short maturities. This
adjustment was not part of the calibration but rather required to achieve convergence within the Monte Carlo Simulation. A level of confidence greater than 99.99% would require a very large number of simulations in order to achieve convergence.

Structured Finance
Global Rating Criteria for Corporate CDOs November 2015
34
Figure 29 Model RDR for Equally Weighted Portfolio of 300 Assets with 4% Flat Pair-Wise Correlation, Adjusted CDO Default Tables Asset rating: B Asset rating: BB Asset rating: BBB Asset rating: A RDR 5 year 10 year 5 year 10 year 5 year 10 year 5 year 10 year Model output (%) Peak 38.7 49.5 19.7 29.7 4.5 9.3 1.61 4.02 AAAsf 47.3 60.3 28.3 41.3 9.0 16.7 4.0 8.0 AAsf 43.7 55.3 25.7 36.3 7.7 13.7 3.3 6.3 Asf 40.0 49.7 22.7 31.3 6.3 10.7 2.7 4.7 BBBsf 36.0 45.7 19.7 27.7 5.3 9.0 2.0 3.7 BBsf 30.0 39.3 15.3 22.7 3.7 6.7 1.3 2.7 Bsf 26.3 35.3 13.0 19.7 2.7 5.3 1.0 2.0 Expected 21.6 32.2 10.1 17.5 1.9 4.5 0.6 1.6 Coverage of mean AAAsf 2.2 1.9 2.8 2.4 4.7 3.7 6.9 5.1 AAsf 2.0 1.7 2.5 2.1 4.0 3.0 5.8 4.0 Asf 1.9 1.5 2.2 1.8 3.3 2.4 4.6 3.0 BBBsf 1.7 1.4 2.0 1.6 2.8 2.0 3.5 2.3 BBsf 1.4 1.2 1.5 1.3 1.9 1.5 2.3 1.7 Bsf 1.2 1.1 1.3 1.1 1.4 1.2 1.7 1.3 Coverage of peak AAAsf 1.2 1.2 1.4 1.4 2.0 1.8 2.5 2.0 AAsf 1.1 1.1 1.3 1.2 1.7 1.5 2.1 1.6 Asf 1.03 1.0 1.15 1.05 1.4 1.1 1.66 1.16 BBBsf 0.931 0.9 0.999 0.931 1.189 0.968 1.248 0.915 BBsf 0.8 0.8 0.8 0.8 0.8 0.7 0.8 0.7 Bsf 0.7 0.7 0.7 0.7 0.6 0.6 0.6 0.5 Source: Fitch
While the adjustment to the CDO target default probabilities relative to historically observed default rates may appear arbitrary, Fitch believes that this adjustment is appropriate. This is because the historical rates for these rating levels are based on small cohort portfolios with very few defaults. As a result, the historical default rates at ‘AAA’ and ‘AA’ are strongly influenced by event risk in the cohort portfolios.4
Moreover, the adjustment to correlation and the CDO target default rates is equivalent to tiring the correlation assumptions by rating stress. In other words, for rating levels of ‘Asf’ and below, Fitch assumes an equivalent correlation of 4%, while for higher rating levels the effective equivalent correlation is higher, between 6% and 7%.
The results are shown in Figure 27. The RDRs for a ‘BB’ portfolio have increased as a result of raising the base default rates, covering the historical peak at the ‘Asf’ rating level. The ‘AAAsf’ and ‘AA+sf’ RDRs for the ‘BBB’ portfolio and ‘B’ portfolios did not change significantly, while the RDRs below ‘AA+sf’ are lower. This leads to a more significant distinction between ‘AAAsf’/‘AA+sf’ and the remaining rating levels. Also, the five-year RDRs are lower, leading to multiples over the base default rates which are more in line with Fitch’s credit view.
Industry Concentration and the Corporate Correlation Model This report has so far focused on randomly selected portfolios diversified across industries. However, a flat pair-wise correlation is not sufficient to distinguish between well diversified portfolios and those with concentrations in particular industries or countries. Fitch believes that industry concentration within credit portfolio could significantly increase the volatility of portfolio default rates.
4 The input default probabilities for ‘AAA’ and ‘AA’ are nevertheless based on the empirically
observed default rates, in order to incorporate possible event risk among the underlying corporates

Structured Finance
Global Rating Criteria for Corporate CDOs November 2015
35
In order to distinguish between diversified and concentrated portfolios the one factor model was extended to a multi factor model. All of the factors are independent standard normal random variables. The following equation illustrates the correlation model.
222222
___Re
1
iIndustryLocalIndustryGlobIndSectorGlobcountrygionGlobali FFFFFFY
The correlation assumptions are differentiated based on geography (region and country) and industry sector/industry. Industries are further separated depending on their exposure to global and local performance drivers. The correlation framework is additive and any additional commonality between two assets adds a correlation uplift to the pair-wise correlation level of these two assets. The uplifts are given as the square of the factor exposures, ie
22222 ;;;; .
Figure 30 PCM Industry Sectors and Industries; Main Countries and Regions Sectors and industry breakdown Correlation band Country Region Telecom media and technology Australia Australia & New Zealand Computer and electronics High New Zealand Australia & New Zealand Telecommunications Medium Hong Kong Developed Asia Broadcasting and media Medium Japan Developed Asia Cable Medium Singapore Developed Asia South Korea Developed Asia Industrials Taiwan Developed Asia Aerospace and defence High Austria Europe Central Automobiles Medium Belgium Europe Central Building and materials Low France Europe Central Chemicals Medium Germany Europe Central Industrial and manufacturing Medium Liechtenstein Europe Central Metals and mining High Luxembourg Europe Central Packaging and containers Medium Netherlands Europe Central Paper and forest products Medium Switzerland Europe Central Real estate Low Denmark Europe NorthTransportation and distribution Low Finland Europe NorthRetail leisure and consumer Iceland Europe NorthConsumer products Medium Norway Europe NorthEnvironmental services Medium Sweden Europe NorthFarming and agricultural services Medium Cyprus Europe South Food, beverage and tobacco Medium Gibraltar Europe South Retail food and drug Low Greece Europe South Gaming and leisure and entertainment Medium Italy Europe South Retail Low Malta Europe South Healthcare Medium Portugal Europe South Lodging and restaurants Low Spain Europe South Pharmaceuticals Medium Ireland Europe UK & Ireland Textiles and furniture Medium Jersey Europe UK & Ireland Energy United Kingdom Europe UK & Ireland Energy oil and gas High Canada North America Utilities power Low United States North America Banking and finance Banking and finance High Business services Business services Medium Source: Fitch

Structured Finance
Global Rating Criteria for Corporate CDOs November 2015
36
Figure 31 Other Countries and Regions in the Portfolio Credit Model Country Region Country Region Argentina America Albania Europe Bahamas America Bosnia and Herzegovina Europe Barbados America Bulgaria Europe Brazil America Croatia Europe Chile America Czech Republic Europe Colombia America Eastern Europe Others Europe Costa Rica America Estonia Europe Dominican Republic America Hungary Europe Ecuador America Kazakhstan Europe El Salvador America Latvia Europe Guatemala America Lithuania Europe Jamaica America Macedonia Europe Mexico America Moldova Europe Other Central America America Poland Europe Other South America America Romania Europe Panama America Russia Europe Peru America Serbia and Montenegro Europe Puerto Rico America Slovakia Europe Uruguay America Slovenia Europe Venezuela America Ukraine Europe Asia Others Asia Egypt Middle East and Africa China Asia Iran Middle East and Africa India Asia Israel Middle East and Africa Indonesia Asia Liberia Middle East and Africa Malaysia Asia Middle East and North Africa Others Middle East and Africa Marshall Islands Asia Morocco Middle East and Africa Mauritius Asia Other Sub Saharan Africa Middle East and Africa Pakistan Asia Qatar Middle East and Africa Philippines Asia Saudi Arabia Middle East and Africa Thailand Asia South Africa Middle East and Africa Vietnam Asia Tunisia Middle East and Africa Turkey Middle East and Africa Bermuda North America Cayman Islands North America Source: Fitch
For example, the pair-wise correlation between the latent variables of two assets from the same region but different countries and industries is given by 22 . Similarly, if two assets come from different regions but the same industry, their pair-wise correlation is equal to
22 . The uplift for local industries is only applied if two assets come from the same country and the same industry. The final correlation uplifts are detailed in Figure 9.
Figure 28 shows the country and industry mapping in the PCM. Every non-emerging market country is mapped to one of seven regions and one of five industry sectors. The five industry sectors are further broken down into 29 industry classes, which are differentiated between high, medium and low in terms of their exposure to global performance drivers. Two assets within an industry classified as ‘High’ receive the same uplift in correlation regardless of whether they are within the same country or not. The global industry effect is assumed to dominate the performance of these credits. A good example would be two oil companies that are heavily dependent on the spot price of oil.
Calibration of Industry and Industry Sector Correlation for a US Portfolio The calibration of the industry correlation model was again based on historical default rates as published in cohort studies. Since the majority share of the data is US-based, the calibration of the intra and inter industry correlation assumptions was done for a large randomly selected US portfolio, thereby replicating the cohort portfolios of historical default studies.
The base calibration in the previous section was focused on historical mean and peak default rates. For example, the objective was to cover the historical peak default rate at the ‘A’ rating level. Since the historical peak default rates included some industry concentration this had to be taken into account for calibrating the industry correlation model. While the largest industry

Structured Finance
Global Rating Criteria for Corporate CDOs November 2015
37
concentration was observed in 2001/2002 cohorts which had a large exposure to telecommunications, previous peak cohorts did not exhibit the same level of concentration. Therefore, Fitch used the less concentrated industry distribution of the 1991 peak cohort as shown in the chart below.
Figure 32
The calibration of the industry correlation model was intended to: (i) yield results for the 1991 peak portfolio that were the same or close to the RDR levels given by the base calibration in the previous section; and (ii) produce adequate increases in the RDR and the multiple coverage for industry and sector concentrations when compared to a diverse portfolio5. The calibration was based on three benchmark portfolios.
Portfolio One – 1991 Peak
300 equally weighted assets with the same term and rating.
Single country US portfolio.
Industry distribution as observed during the 1991 peak cohort.
Portfolio Two – Diverse:
300 equally weighted assets with the same term and rating.
Single country US portfolio.
Equal share in each of the 29 corporate industries.
Portfolio Three – 30% Industry Concentration
300 assets with the same term and rating.
Single country US portfolio.
30% in banking & finance; remainder diverse across other industries. 5 Since the historical default data is insufficient to obtain statistically significant differences by
industries, Fitch assumed that the performance of different industry classes would be similar in a stressed environment. Therefore, in the model, the intra industry correlation was assumed to be the same for each of the 29 industries and five industry sectors
Retail15%
Building &materials
13%
Transportation & distribution
10%
Utilities power9%
Computers & electronics
8%
Business services8%
Healthcare & pharmaceuticals
7%
Telecommunications5%
Banking & finance4%
Gaming, leisure & entertainment
3%
Textiles & furniture3%
ConsumerProducts
3%
Paper & forest products
2%
Broadcasting/ media/cable
2%Chemicals
2%
Food, beverage & tobacco
2%
Retail food & drugs1%Metals & mining
1%
Real estate1%
Industry Distribution for 1991 Historical Peak
Source: Fitch

Structured Finance
Global Rating Criteria for Corporate CDOs November 2015
38
Figure 33 Model RDR for 1991 Peak Portfolio Asset rating: B Asset rating: BB Asset rating: BBB Asset rating: A RDR 5 year 10 year 5 year 10 year 5 year 10 year 5 year 10 year Model output (%) Peak 38.7 49.5 19.7 29.7 4.5 9.3 1.61 4.02 AAAsf 48.0 60.7 29.3 42.0 10.0 17.7 4.7 9.0 AAsf 44.3 55.7 26.3 36.7 8.3 14.3 4.0 6.7 Asf 40.3 50.0 23.0 31.7 7.0 11.0 3.0 5.0 BBBsf 36.3 46.0 20.0 28.0 5.7 9.3 2.3 4.0 BBsf 30.0 39.3 15.3 22.7 3.7 6.7 1.3 2.7 Bsf 26.3 35.7 13.0 19.7 2.7 5.3 1.0 2.0 Expected 21.6 32.2 10.1 17.5 1.9 4.5 0.6 1.6 Coverage of mean AAAsf 2.2 1.9 2.9 2.4 5.2 3.9 8.1 5.7 AAsf 2.1 1.7 2.6 2.1 4.4 3.2 6.9 4.2 Asf 1.9 1.6 2.3 1.8 3.7 2.4 5.2 3.2 BBBsf 1.7 1.4 2.0 1.6 3.0 2.1 4.0 2.5 BBsf 1.4 1.2 1.5 1.3 1.9 1.5 2.3 1.7 Bsf 1.2 1.1 1.3 1.1 1.4 1.2 1.7 1.3 Coverage of peak AAAsf 1.2 1.2 1.5 1.4 2.2 1.9 2.9 2.2 AAsf 1.1 1.1 1.3 1.2 1.9 1.5 2.5 1.7 Asf 1.0 1.0 1.2 1.1 1.6 1.2 1.9 1.2 BBBsf 0.9 0.9 1.0 0.9 1.3 1.0 1.5 1.0 BBsf 0.8 0.8 0.8 0.8 0.8 0.7 0.8 0.7 Bsf 0.7 0.7 0.7 0.7 0.6 0.6 0.6 0.5 Equally weighted portfolio of 300 US assets with correlation assumptions: base 2%; industry sector uplift 2% and industry uplift of 20% Source: Fitch
Figure 34 Model RDR for Diverse Portfolio Asset rating: B Asset rating: BB Asset rating: BBB Asset rating: A RDR 5 year 10 year 5 year 10 year 5 year 10 year 5 year 10 year Model output (%) Peak 38.7 49.5 19.7 29.7 4.5 9.3 1.61 4.02 AAAsf 45.0 58.0 26.7 39.0 8.7 15.3 4.0 7.7 AAsf 41.7 53.3 24.0 34.3 7.3 12.7 3.3 6.0 Asf 38.0 48.0 21.3 30.0 6.0 10.3 2.7 4.7 BBBsf 34.7 44.3 19.0 27.0 5.0 8.7 2.0 3.7 BBsf 29.3 38.7 15.0 22.3 3.7 6.3 1.3 2.3 Bsf 26.0 35.3 12.7 19.3 2.7 5.3 1.0 2.0 Expected 21.6 32.2 10.1 17.5 1.9 4.5 0.6 1.6 Equally weighted portfolio of 300 US assets with correlation assumptions: base 2%; industry sector uplift 2% and industry uplift of 20%Source: Fitch
Figures 30, 31 and 32 show the results for each of the benchmark portfolios with a base level correlation of 2%, an industry sector uplift of 2% and an industry uplift of 20%. For example, two assets in the same industry would have a pair-wise correlation of 24%, while two assets from different industries but within the same industry sector would have a pair-wise correlation of 4%. As a result of the higher intra industry correlation and the sector correlation uplift, the base level correlation for the US was reduced to 2% from the 4% in the examples above, in order to maintain the results from the previous section for portfolio one. The chosen correlation levels replicate closely the results shown in Figure 28.
The same correlation assumptions were also applied to the second calibration portfolio which was fully diverse and included an equal share in each of the 29 corporate industries.

Structured Finance
Global Rating Criteria for Corporate CDOs November 2015
39
Figure 35 Model RDR for Industry Concentrated Portfolio (30% Industry Concentration) Asset rating: B Asset rating: BB Asset rating: BBB Asset rating: A RDR 5 year 10 year 5 year 10 year 5 year 10 year 5 year 10 year Model output (%) Peak 38.7 49.5 19.7 29.7 4.5 9.3 1.61 4.02 AAAsf 49.7 61.7 32.0 43.7 12.3 20.3 6.0 11.3 AAsf 46.0 56.7 28.7 38.7 10.0 16.0 4.7 8.0 Asf 41.7 51.0 24.7 33.0 7.7 12.0 3.3 5.3 BBBsf 37.7 47.0 21.3 29.0 5.7 9.7 2.3 4.0 BBsf 30.7 40.0 15.7 23.0 3.7 6.7 1.3 2.7 Bsf 26.7 35.7 13.0 19.7 2.7 5.3 1.0 2.0 Expected 21.6 32.2 10.1 17.5 1.9 4.5 0.6 1.6 Equally weighted portfolio of 300 US assets with correlation assumptions: base 2%; industry sector uplift 2% and industry uplift of 20% Source: Fitch
The RDRs for portfolios with sizable industry concentrations are significantly higher compared to a fully diversified portfolio.
Calibration for Regionally Diverse Portfolios The available default data outside the US is limited and does not prove whether a regionally diverse portfolio would perform differently to a portfolio of only US assets. However, it is Fitch’s credit view that diversification can be achieved across regions. Therefore, the base level correlation for assets from different regions is lowered to one percentage point, with an uplift of 1% for all non-emerging market regions. This recovers the 2% base level correlation for North America, while giving limited diversification benefit for assets from different regions. The results shown in Figures 30, 31 and 32 remain unchanged for an all US portfolio.
Furthermore, Fitch believes that portfolios concentrated in any single country outside the US could have more volatile default rates than a portfolio diversified across the US. Therefore the base level correlation in the model for any two non-US assets within the same country is increased by 2%. For example, the pair-wise correlation between two German assets from different industries would be 4%, which compares to the 2% between two similar US assets.
Since western Europe is split into four regions in the PCM (see Figure 29) the regional benefit, together with the country correlation uplift, balance each other out and ensure that a portfolio diversified across western European countries is treated similar to an all US portfolio of similar assets.
Finally, Fitch believes that for assets within the same industry, country diversity depends on the industry in question. Some industries, such as banking and finance or energy (oil in particular), are predominately affected by industry-specific factors. These industries have been classified as global and country diversity is of limited benefit. On the other hand, industries such as utilities are driven primarily by local factors and as a result, two assets within such an industry but from different countries would be expected to be far less correlated.
Fitch recognizes that the proposed correlation structure is only a model and like other models relies on assumptions. However, in the absence of sufficient data, the model is designed to differentiate between concentrated and diverse portfolios.
Fitch’s corporate correlation assumptions are shown in Figure 9 above.
Figures 33 and 34 provide the results for the large homogenous and randomly chosen benchmark non-US portfolios, using the full correlation structure.

Structured Finance
Global Rating Criteria for Corporate CDOs November 2015
40
Figure 33 shows the results for a single country portfolio, outside North America, which compares to Figure 30. The RDRs are higher for non US single country concentrations, reflecting Fitch’s credit view that such portfolios may be subject to more volatile portfolio default rates than a diversified US portfolio.
Figure 36 Model RDR for 1991 Peak Portfolio – Single Country (Non-US) Asset rating: B Asset rating: BB Asset rating: BBB Asset rating: A 5 year 10 year 5 year 10 year 5 year 10 year 5 year 10 year Model output (%) Peak 38.7 49.5 19.7 29.7 4.5 9.3 1.61 4.02 AAAsf 53.7 66.7 34.3 47.7 12.0 20.7 5.7 10.7 AAsf 49.3 60.3 30.3 41.3 10.0 16.3 4.7 8.0 Asf 44.3 53.7 26.0 34.7 8.0 12.7 3.3 5.7 BBBsf 39.7 49.0 22.3 30.3 6.3 10.0 2.7 4.3 BBsf 32.0 41.0 16.7 23.7 4.0 7.0 1.3 2.7 Bsf 27.3 36.0 13.3 20.0 2.7 5.3 1.0 2.0 Expected 21.6 32.2 10.1 17.5 1.9 4.5 0.6 1.6 Source: Fitch
Figure 34 shows the results for a portfolio with no industry concentrations, which is diversified across western European countries. Here the results are comparable to a diversified US portfolio, as shown in Figure 32.
Figure 37 Model RDR for 1991 Peak Portfolio – Diversified Across Five European Countries Asset rating: B Asset rating: BB Asset rating: BBB Asset rating: A 5 year 10 year 5 year 10 year 5 year 10 year 5 year 10 year Model output (%) Peak 38.7 49.5 19.7 29.7 4.5 9.3 1.61 4.02 AAAsf 46.3 59.3 28.3 40.7 9.7 17.0 4.7 8.7 AAsf 43.0 54.3 25.3 35.7 8.3 13.7 3.7 6.7 Asf 39.3 49.0 22.3 31.0 6.7 11.0 3.0 5.0 BBBsf 35.7 45.3 19.7 27.7 5.3 9.0 2.3 4.0 BBsf 29.7 39.0 15.3 22.3 3.7 6.7 1.3 2.7 Bsf 26.3 35.3 13.0 19.7 2.7 5.3 1.0 2.0 Expected 21.6 32.2 10.1 17.5 1.9 4.5 0.6 1.6 Source: Fitch

Structured Finance
Global Rating Criteria for Corporate CDOs November 2015
41
Appendix 4: Fitch CDS Implied Ratings The Fitch CDS-IRs model processes the collective marketplace view of a company’s credit condition based on its recent CDS pricing, region and industry. It then calculates and converts these into implied ratings, which it outputs as a forward-looking credit assessment expressed in the traditional rating grade format. The model covers over 2,500 reference entities in 84 countries globally.
The Fitch CDS-IR methodology follows a two-step approach: 1) smoothing, and 2) non-parametric mapping. The CDS market spreads in their raw state are noisy and individual spreads on any given day may be influenced by technical market factors. This volatility is especially evident in the pre-2003, Asian or less liquid obligors, but it is an issue to be considered across the entire universe. For more information on the methodology please refer to the agency’s Fitch CDS Implied Ratings (CDS-IR) Model report, published June 2007.
Differences between the credit rating and CDS-IR of an obligor would suggest that either 1) ratings include additional issues such as volatility, or 2) they have different opinions about the future performance of individual companies. It is clear from the Lead-Lag Analysis for CDS Implied Ratings and Credit Ratings table that agency rating adjustments are frequently anticipated by CDS implied ratings. For Europe at three months, in about 52% of mismatched ratings the implied rating leads agency rating changes and about 14% of agency rating changes lead the implied rating, which indicates that the Fitch CDS-IR model can add information to a forecast of agency rating change for many cases.
Figure 38 Lead-Lag Analysis for CDS Implied Ratings and Credit Ratings IR leads agency rating Agency leads IR Convergence Divergence
(%) Americas
& Oceania Europe Americas
& Oceania Europe Americas
& Oceania Europe Americas
& Oceania Europe 1 month 64.1 63.6 8.4 9.2 7.6 9.2 19.9 18.0 2 months 58.0 55.9 12.2 12.5 12.5 14.1 17.4 17.4 3 months 51.7 52.2 15.5 14.4 15.9 17.2 17.0 16.2 a Convergence is when the credit rating and IR move towards each other and divergence is when the credit rating and IR move in opposite directions Source: Fitch

Structured Finance
Global Rating Criteria for Corporate CDOs November 2015
42
Appendix 5: Standard Recovery Rate Assumptions The assumptions are applied per rating category (eg for the ‘A+sf’ rating level, the assumption shown in the column A is applied). In instances where Fitch provided asset-specific recovery rates and a specific recovery estimate, then the recovery rate assumption will be interpolated based on the assumptions for the recovery ratings, as shown in Figure 42.
Figure 39 Asset-Specific Recovery Rate Assumptions Recovery Rating (%) AAAsf AAsf Asf BBBsf BBsf Bsf RR1 (Outstanding: 91-100%) 60 70 75 85 95 95 RR2 (Superior: 71-90%) 45 55 60 70 80 85 RR3 (Good: 51-70%) 30 35 40 50 60 65 RR4 (Average: 31-50%) 10 15 20 25 40 45 RR5 (Below average: 11-30%) 0 5 10 15 20 25 RR6 (Poor: 0-10%) 0 0 0 0 5 5 Source: Fitch
Figure 40 Asset-Specific Recovery Rate Assumptions – Group D Recovery Rating (%) AAAsf AAsf Asf BBBsf BBsf Bsf RR1 (Outstanding: 91-100%) 5 10 30 50 70 90 RR2 (Superior: 71-90%) 5 10 20 35 50 70 RR3 (Good: 51-70%) 0 5 15 25 35 50 RR4 (Average: 31-50%) 0 0 5 10 20 30 RR5 (Below average: 11-30%) 0 0 0 0 5 10 RR6 (Poor: 0-10%) 0 0 0 0 0 0 Source: Fitch
Categorisation will primarily be based on the seniority of the actual debt instrument with senior secured loans generally corresponding to “strong recovery prospects” and senior unsecured bonds corresponding to “moderate recovery prospects”. Other debt instruments will commonly be categorised as having “weak recovery prospects”. However, where actual recovery experience is less than might be expected for the level of seniority, a lower categorisation may be used in specific cases.
The portfolio credit model also includes recovery assumptions for sovereign exposures, which may be used for, eg state-owned enterprises. The recovery assumptions are published in the criteria report Asset Analysis Criteria for Covered Bonds of European Public Entities, 16 February 2015.
Figure 41 Recovery Rate Assumptions Recovery prospects (%) AAAsf AAsf Asf BBBsf BBsf Bsf US Strong recovery 40 50 55 60 70 80 Moderate recovery 10 15 20 25 40 45 Weak recovery 0 0 5 10 15 20 Group A (excluding US) Strong recovery 40 50 55 60 70 75 Moderate recovery 10 15 20 25 40 45 Weak recovery 0 0 5 10 15 20 Group B Strong recovery 25 35 40 45 50 55 Moderate recovery 5 10 15 20 30 40 Weak recovery 0 0 0 0 5 5 Group C Strong recovery 15 20 25 30 40 45 Moderate recovery 0 5 10 15 25 30 Weak recovery 0 0 0 0 5 5 Group D Strong recovery 5 10 15 20 30 35 Moderate recovery 0 0 5 10 20 25 Weak recovery 0 0 0 0 5 5 Source: Fitch

Structured Finance
Global Rating Criteria for Corporate CDOs November 2015
43
Group A Countries Australia, Austria, Bahamas, Bermuda, Canada, Cayman Islands, Denmark, Finland, Germany, Gibraltar, Hong Kong, Iceland, Ireland, Japan, Jersey, Liechtenstein, Netherlands, New Zealand, Norway, Singapore, South Korea, Sweden, Switzerland, Taiwan, the UK, the US.
Group B Countries Belgium, France, Italy, Luxembourg, Portugal, Spain.
Group C Countries Bulgaria, Costa Rica, Chile, Croatia, Czech Republic, Estonia, Hungary, Israel, Latvia, Lithuania, Malaysia, Malta, Mauritius, Mexico, Poland, Slovakia, Slovenia, South Africa, Thailand, Tunisia, Uruguay.
Group D Countries Albania, Argentina, Asia Others, Barbados, Bosnia and Herzegovina, Brazil, China, Colombia, Cyprus, Dominican Republic, Eastern Europe Others, Ecuador, Egypt, El Salvador, Greece, Guatemala, India, Indonesia, Iran, Jamaica, Kazakhstan, Liberia, Macedonia, Marshall Islands, Middle East and North Africa Others, Moldova, Morocco, Other Central America, Other South America, Other Sub-Saharan Africa, Pakistan, Panama, Peru, Philippines, Puerto Rico, Qatar, Romania, Russia, Saudi Arabia, Serbia, Montenegro, Turkey, Ukraine, Venezuela, and Vietnam.
The groupings are based on Fitch’s Country-Specific Treatment of Recovery Ratings. The groupings of Greece and Cyprus deviate from the report. Both countries were move to group D given the current country ceilings for each of the two countries.
The following tables show the recovery rates for Spain, Portugal and Italy, adjusted in accordance with the principles stated in the section European Peripheral Countries. In all three cases, the recovery rate assumptions at the rating level of the country cap were equal to the ‘AAAsf’ recovery assumptions described above; the base case continues to be based on the country group. Note that recoveries may change as the country cap changes.
Figure 42 Asset-Specific Recovery Rate Assumptions – Spain/Italy Recovery Rating (%) AAAsf AAsf Asf BBBsf BBsf Bsf RR1 (Outstanding: 91-100%) 50 60 70 75 85 95 RR2 (Superior: 71-90%) 35 45 55 60 75 85 RR3 (Good: 51-70%) 25 30 35 40 55 65 RR4 (Average: 31-50%) 5 10 15 25 40 45 RR5 (Below average: 11-30%) 0 0 5 10 15 25 RR6 (Poor: 0-10%) 0 0 0 0 0 5 Source: Fitch
Figure 43 Asset-Specific Recovery Rate Assumptions – Portugal Recovery Rating (%) AAAsf AAsf Asf BBBsf BBsf Bsf RR1 (Outstanding: 91-100%) 45 50 60 70 80 90 RR2 (Superior: 71-90%) 30 35 45 55 60 70 RR3 (Good: 51-70%) 20 25 30 35 40 50 RR4 (Average: 31-50%) 0 5 10 15 25 30 RR5 (Below average: 11-30%) 0 0 0 0 5 10 RR6 (Poor: 0-10%) 0 0 0 0 0 0 Source: Fitch

Structured Finance
Global Rating Criteria for Corporate CDOs November 2015
44
Figure 44
Recovery Rate Assumptions – Spain/Portugal/Italy
Recovery prospects (%) AAAsf AAsf Asf BBBsf BBsf Bsf Spain/Italy Strong recovery 20 25 35 40 50 55 Moderate recovery 0 5 10 20 30 40 Weak recovery 0 0 0 0 5 5 Portugal Strong recovery 15 20 25 35 50 55 Moderate recovery 0 0 5 15 30 40 Weak recovery 0 0 0 0 5 5 Source: Fitch
Interpolation Example for Specific Recovery Estimates In instances where Fitch is provided with a specific recovery estimate by the corporate analyst, the recovery assumptions will be interpolated between the closest two recovery ratings, based on the ‘BBsf’ column, which corresponds to the mid-point recovery rate for each recovery rating band. The agency has defined interpolation rows in 5 percentage point increments (Figure 45). The interpolation is linear and based on the closest two rows. The last row in the table shows the resulting recovery rates for a recovery estimate of 67%.
Figure 45
Asset-Specific Recovery Rate Assumptions
Recovery rating (%) Interpolation
boundary AAAsf AAsf Asf BBBsf BBsf Bsf 100 60 70 80 90 100 100 RR1 (Outstanding: 91-100%) 95 60 70 75 85 95 95 90 55 65 70 80 90 90 85 50 60 65 75 85 90 RR2 (Superior: 71-90%) 80 45 55 60 70 80 85 75 40 50 55 65 75 80 70 35 45 50 60 70 75 65 35 40 45 55 65 70 RR3 (Good: 51-70%) 60 30 35 40 50 60 65 55 25 30 35 40 55 60 50 20 25 30 35 50 55 45 15 20 25 30 45 50 RR4 (Average: 31-50%) 40 10 15 20 25 40 45 35 5 10 15 20 35 40 30 0 5 10 15 30 35 25 0 5 10 15 25 30 RR5 (Below average: 11-30%) 20 0 5 10 15 20 25 15 0 0 5 10 15 20 10 0 0 0 5 10 15 RR6 (Poor: 0-10%) 5 0 0 0 0 5 5 0 0 0 0 0 0 0 Recovery estimate - 67 35 42 47 57 67 72 Source: Fitch

Structured Finance
Global Rating Criteria for Corporate CDOs November 2015
45
Appendix 6: Fitch IDR Equivalency Map For the purposes of analysing corporate CDOs, the Fitch IDR is one of the primary drivers of default probability for the underlying portfolio assets. In the absence of an IDR, Fitch will map to the equivalent IDR rating from the security rating of another instrument within the issuer’s capital structure. Ratings assigned to guaranteed instruments will only be taken into account to the extent the underlying guarantee relates to the issuer, rather than the specific debt instrument. For example, a guarantee by a parent to a subsidiary which leads to a higher rating for the debt issued by the subsidiary would be considered. On the other hand, a guarantee provided by a sovereign on the specific bond of a bank would be disregarded when deriving the IDR from the instrument rating.
In the event that Fitch does not provide any ratings for the issuer, public or private, Fitch will look to the public ratings provided by Moody’s or S&P. To determine the equivalent IDR rating from either Moody’s or S&P ratings, Fitch will apply the mapping illustrated below. If there are public ratings provided by both agencies, the lower of the two IDR equivalent ratings will be applied. Otherwise, the sole IDR equivalent rating from either Moody’s or S&P will be applied.
The IDR equivalent rating takes into account adjustments for assets that are on Rating Watch Negative or negative credit watch, as well as Negative Outlook as describer earlier in this report (see sections Adverse Selection and Default Probability Adjustments). These adjustments are made prior to mapping from the issue rating to the IDR equivalent rating.
If the rating cannot be determined using the IDR equivalency map illustrated below, Fitch may provide credit opinions (CO) on the issuer or attribute a rating of ‘CCC’ as deemed appropriate depending on the issuer and/or portfolio characteristics.
COs are determined by a panel of analysts; the panel usually includes fewer analysts than would be the case for a credit rating, and the presentation is less extensive. In assigning credit opinions Fitch may use its Corporate Credit Opinion Tool. The limitations of COs, compared to a rating, include: “point-in-time” coverage; limited availability of information; an abbreviated review process; and reduced robustness of outlooks and watch status. COs used for rating CLOs are updated at least annually, in line with the public ratings assigned to CLOs. COs typically will not involve discussions with borrower management. COs are forward looking and based upon Fitch-constructed financial forecasts. These limitations are consistent with the terms of their application within a pooled asset context.
Figure 46 Fitch IDR Equivalency Map from Corporate Ratings Rating type Rating agency(s) Issue rating Mapping rule Corporate family rating LT issuer rating Moody’s n.a. 0 Issuer credit rating S&P n.a. 0 Senior unsecured Fitch, Moody’s, S&P Any 0 Senior, senior secured or subordinated secured Fitch, S&P BBB− or above 0 Fitch, S&P BB+ or below -1 Moody’s Ba1 or above -1 Moody’s Ba2 or below -2 Moody’s Ca -1 Subordinated, junior subordinated or senior subordinated
Fitch, Moody’s, S&P B+, B1 or above 1
Fitch, Moody’s, S&P B, B2 or below 2 Source: Fitch

Structured Finance
Global Rating Criteria for Corporate CDOs November 2015
46
Figure 47 The Following Steps are Used to Calculate the Fitch IDR Equivalent Rating 1 Fitch IDR 2 If Fitch has not issued an IDR, but has an outstanding Long-Term Financial Strength Rating, then the IDR equivalent is one rating lower. 3 If Fitch has not issued an IDR, but has outstanding corporate issue ratings, then the IDR equivalent is calculated using the mapping in the table
above. 4 If Fitch does not rate the issuer or any associated issuance, then determine a Moody’s and S&P equivalent to Fitch’s IDR pursuant to steps 5 and
6. 5a A public Moody’s-issued Corporate Family Rating (CFR) is equivalent in definition terms to the Fitch IDR. If Moody's has not issued a CFR, but
has an outstanding LT Issuer Rating, then this is equivalent to the Fitch IDR. 5b If Moody’s has not issued a CFR, but has an outstanding Insurance Financial Strength Rating, then the Fitch IDR equivalent is one rating lower. 5c If Moody’s has not issued a CFR, but has outstanding corporate issue ratings, then the Fitch IDR equivalent is calculated using the mapping in the
table above. 6a A public S&P-issued Issuer Credit Rating (ICR) is equivalent in terms of definition to the Fitch IDR. 6b If S&P has not issued an ICR, but has an outstanding Insurance Financial Strength Rating, then the Fitch IDR equivalent is one rating lower. 6c If S&P has not issued an ICR, but has outstanding corporate issue ratings, then the Fitch IDR equivalent is calculated using the mapping in the
table above. 7 If both Moody’s and S&P provide a public rating on the issuer or an issue, the lower of the two Fitch IDR equivalent ratings will be used in PCM.
Otherwise the sole public Fitch IDR equivalent rating from Moody’s or S&P will be applied. Source: Fitch

Structured Finance
Global Rating Criteria for Corporate CDOs November 2015
47
Appendix 7: Calculation of Fitch WARF and Fitch WARR The Fitch WARF is a numerical value that describes the weighted average credit quality of the portfolio. Each asset is assigned a numerical value with respect to the credit quality of that particular issuer. Fitch’s rating factor scale ranges from 0 to 100 and equates to the 10-year asset default rate used in Fitch’s Portfolio Credit Model (PCM).
The first step in calculating the Fitch WARF is to determine the Fitch IDR Equivalency Rating for each collateral obligation in the portfolio, in accordance with the process described in Appendix 6. We then multiply the notional balance of the asset by the Rating Factor associated with the appropriate Fitch IDR Equivalency Rating from Figure 44 and sum these products. Finally, we divide the sum by the total notional balance of the portfolio.
The Fitch WARR is a numerical value that describes the weighted average recovery rate of the portfolio. Each asset is assigned a numerical value which reflects the recovery prospects of that particular security in a base scenario. The rate to be used is either the recovery estimate provided by the corporate team, or the ‘B’ rating stress assumption for the recovery categories in Figure 48. If a recovery rating is provided instead of a recovery estimate, the midpoint of the corresponding rating band should be used.
The first step in calculating the Fitch WARR is to determine the Fitch Recovery Classification or Recovery Estimate for each collateral obligation in the portfolio. We then multiply the notional balance of the asset by the Recovery Factor associated and sum these products. Finally, we divide the sum by the total notional balance of the portfolio.
Figure 48 Fitch WARF and WARR Scales Fitch IDR Equivalency Rating Rating Factor AAA 0.19 AA+ 0.35 AA 0.64 AA- 0.86 A+ 1.17 A 1.58 A- 2.25 BBB+ 3.19 BBB 4.54 BBB- 7.13 BB+ 12.19 BB 17.43 BB- 22.80 B+ 27.80 B 32.18 B- 40.60 CCC+ 62.80 CCC 62.80 CCC- 62.80 CC 100.00 C 100.00 D 100.00 Fitch Recovery Classification Recovery Factor RR1 95.00 RR2/Strong 80.00 RR3 60.00 Moderate 45.00 RR4 40.00 RR5/Weak 20.00 RR6 5.00 Source: Fitch

Structured Finance
Global Rating Criteria for Corporate CDOs November 2015
48
Appendix 8: Default Timings for 3.5 Year to 12.0 Year WAL Figure 49 Share of RDR (%)
Year
>3.5 Year 4.5
Year WAL
>4.5 Year 5.5
Year WAL
>5.5 Year 6.5
Year WAL
>6.5 Year 7.5
Year WAL
>7.5 Year 8.5
Year WAL
>8.5 Year 9.5
Year WAL
> 9.5 Year 12
Year WAL
Front-loaded default timing
1 50 50 35 35 33 33 30 2 25 25 25 25 22 22 20 3 12.5 12.5 10 10 9 9 8.3 4 12.5 12.5 10 10 9 9 8.3 5 10 10 9 9 8.3 6 10 10 9 9 8.3 7 9 9 8.3 8 8.3 9 10 Mid-loaded default timing 1 17.5 10 10 5 2 25 15 10 10 9 3 40 25 25 10 9 9 8.3 4 17.5 35 35 25 22 9 8.3 5 15 10 35 33 22 8.3 6 10 10 9 33 20 7 5 9 9 30 8 9 9 8.3 9 9 8.3 10 8.3 Back-loaded default timing 1 12.5 10 10 5 2 12.5 10 10 10 9 3 25 10 10 10 9 9 8.3 4 50 25 15 10 9 9 8.3 5 45 20 10 10 9 8.3 6 35 20 10 10 8.3 7 35 20 10 8.3 8 33 20 8.3 9 33 20 10 30
Source: Fitch

Structured Finance
Global Rating Criteria for Corporate CDOs November 2015
49
Appendix 9: Allocation of Defaults to Reinvestments Figure 46 illustrates how defaults are allocated to reinvestments. The example consists of a portfolio with an eight-year bullet maturity and a 30% default rate, applied over a mid-loaded default timing scenario. For simplicity, Fitch assumes USD10 of recovery proceeds are received and reinvested in year four.
The periodic default rate relative to the outstanding, rather than initial, performing balance of the portfolio is used to derive defaults in the reinvestment portfolio. This ensures that the relative default rate applied to the remaining original portfolio from year four onward (when reinvestment occurs) is also applied to the reinvestment portfolio.
The relative default rate on the remaining portfolio from year four onwards is equal to the sum of the portions of the initial 30% default rate applied in years four to seven (9.9%, 2.7%, 2.7%, and 2.7% for a total of 18%) divided by the remaining portfolio balance in year four; this indicates a relative default rate on the remaining portfolio of 18/88 = 20.5%. This 20.5% default rate is then applied to the reinvestment portfolio over years four to seven, as displayed in row h in Figure 45.
Figure 50 Default Methodology Example Row Calculation a Total default rate (%) 30.0 b Year 1 2 3 4 5 6 7 8 c Default timing (% of initial
portfolio) 9.0 9.0 22.0 33.0 9.0 9.0 9.0
d Outstanding performing
portfolio (USD) 100.0 97.3 94.6 88.0 78.1 75.4 72.7 70.0
e (c)x(a) Periodic default rate (% of initial portfolio)
2.7 2.7 6.6 9.9 2.7 2.7 2.7 0.0
f (e)/(d) Periodic default rate (% of outstanding portfolio)
2.7 2.8 7.0 11.3 3.5 3.6 3.7 0.0
g Outstanding reinvestment
portfolio (USD) 10.0 8.9 8.6 8.3 8.0
h (g)x(f) Default amount using periodic default rate (USD)
1.1 0.3 0.3 0.3 0.0
Source: Fitch

Structured Finance
Global Rating Criteria for Corporate CDOs November 2015
50
Appendix 10: Currency Stress Assumptions For each relevant currency pair, Fitch conducted a historical analysis of the exchange rate movement, as well as forward-looking exchange rate expectations/forecasts. In its analysis, Fitch considered macroeconomic explanations for any significant movements in the exchange rate to place the time series in a historical context. As part of this analysis, Fitch determined the largest movement in any given rolling period, from a one-year period to a 10-year period, to identify periods of particular exchange rate stress. The largest move is taken to be the absolute of both the appreciation and depreciation moves in the specific currency.
The stresses for each currency are grouped into High Investment Grade (‘AAA’ – ‘AA’), Low Investment Grade (‘A’ – ‘BBB’) and Below Investment Grade (‘BB’ – ‘B’). This allows for a meaningful differentiation between stresses, while allowing for the uncertainty inherent in forecasting exchange rates. The Low Investment-Grade stress is set to cover the largest observed move. The High Investment-Grade stress covers the largest move with a cushion, while the Below Investment-Grade stress is set to be the same or below the largest observed move. Within these guidelines, Fitch also considered the timing of the stress and the perceived magnitude of the stress, in the context of the macroeconomic backdrop. The stresses are symmetric for appreciation and depreciation, based on the largest move, taken to be the absolute of either direction.
These stresses are applicable for transactions with a typical weighted average life of up to eight years. In addition, Fitch will typically limit the interest rate differential for FX structures. This applies to scenarios where one index is stressed up while the other is modelled down or flat. For example, in the case of GBP/EUR, Fitch would cap the difference between GBP Libor and Euribor at 6%. Finally, market risk in the form of FX exposure should not be the primary rating driver in CLO structures. Therefore, the approach outlined above will be applicable where the size of the FX bucket is limited and the impact on the rating when compared to an all-EUR structure with similar characteristics is limited. In the absence of any other mitigating factors, a rating cap would apply where the mismatch between assets and liabilities exceeds 10% at closing of the transaction.
Figure 51 USD/EUR Stress (%)
Year 1 Year 2 Year 3 Year 4 Year 5 Year 6 Year 7 Year 8 High IG depreciate 50.00 66.67 83.33 100.00 100.00 100.00 100.00 100.00 Low IG depreciate 50.00 60.00 70.00 80.00 80.00 80.00 80.00 80.00 BIG depreciate 50.00 50.00 50.00 50.00 50.00 50.00 50.00 50.00 High IG appreciate -50.00 -66.67 -83.33 -100.00 -100.00 -100.00 -100.00 -100.00 Low IG appreciate -50.00 -60.00 -70.00 -80.00 -80.00 -80.00 -80.00 -80.00 BIG appreciate -50.00 -50.00 -50.00 -50.00 -50.00 -50.00 -50.00 -50.00 High IG – AAA and AA, Low IG – A, BBB and BIG – Below investment grade The stressed spot rate is calculated as the initial spot rate times e^(applicable stress percentage) Source: Fitch
Figure 52 GBP/EUR Stress (%)
Year 1 Year 2 Year 3 Year 4 Year 5 Year 6 Year 7 Year 8 High IG depreciate 40.00 53.33 66.67 80.00 80.00 80.00 80.00 80.00 Low IG depreciate 40.00 46.67 53.33 60.00 60.00 60.00 60.00 60.00 BIG depreciate 40.00 40.00 40.00 40.00 40.00 40.00 40.00 40.00 High IG appreciate -40.00 -53.33 -66.67 -80.00 -80.00 -80.00 -80.00 -80.00 Low IG appreciate -40.00 -46.67 -53.33 -60.00 -60.00 -60.00 -60.00 -60.00 BIG appreciate -40.00 -40.00 -40.00 -40.00 -40.00 -40.00 -40.00 -40.00 High IG – AAA and AA, Low IG – A, BBB and BIG – Below investment grade The stressed spot rate is calculated as the initial spot rate times e^(applicable stress percentage) Source: Fitch

Structured Finance
Global Rating Criteria for Corporate CDOs November 2015
51
ALL FITCH CREDIT RATINGS ARE SUBJECT TO CERTAIN LIMITATIONS AND DISCLAIMERS. PLEASE READ THESE LIMITATIONS AND DISCLAIMERS BY FOLLOWING THIS LINK: HTTPS://FITCHRATINGS.COM/UNDERSTANDINGCREDITRATINGS. IN ADDITION, RATING DEFINITIONS AND THE TERMS OF USE OF SUCH RATINGS ARE AVAILABLE ON THE AGENCY'S PUBLIC WEB SITE AT WWW.FITCHRATINGS.COM. PUBLISHED RATINGS, CRITERIA, AND METHODOLOGIES ARE AVAILABLE FROM THIS SITE AT ALL TIMES. FITCH'S CODE OF CONDUCT, CONFIDENTIALITY, CONFLICTS OF INTEREST, AFFILIATE FIREWALL, COMPLIANCE, AND OTHER RELEVANT POLICIES AND PROCEDURES ARE ALSO AVAILABLE FROM THE CODE OF CONDUCT SECTION OF THIS SITE. FITCH MAY HAVE PROVIDED ANOTHER PERMISSIBLE SERVICE TO THE RATED ENTITY OR ITS RELATED THIRD PARTIES. DETAILS OF THIS SERVICE FOR RATINGS FOR WHICH THE LEAD ANALYST IS BASED IN AN EU-REGISTERED ENTITY CAN BE FOUND ON THE ENTITY SUMMARY PAGE FOR THIS ISSUER ON THE FITCH WEBSITE.
Copyright © 2015 by Fitch, Inc., Fitch Ratings Ltd. and its subsidiaries. 33 Whitehall Street, NY, NY 10004. Telephone: 1-800-753-4824, (212)908-0500. Fax: (212) 480-4435. Reproduction or retransmission in whole or in part is prohibited except by permission. All rights reserved. In issuing and maintaining its ratings, Fitch relies on factual information it receives from issuers and underwriters and from other sources Fitchbelieves to be credible. Fitch conducts a reasonable investigation of the factual information relied upon by it in accordance with its ratings methodology, and obtains reasonable verification of that information from independent sources, to the extent such sources are available for agiven security or in a given jurisdiction. The manner of Fitch’s factual investigation and the scope of the third-party verification it obtains will vary depending on the nature of the rated security and its issuer, the requirements and practices in the jurisdiction in which the rated security is offered and sold and/or the issuer is located, the availability and nature of relevant public information, access to the management of the issuerand its advisers, the availability of pre-existing third-party verifications such as audit reports, agreed-upon procedures letters, appraisals, actuarialreports, engineering reports, legal opinions and other reports provided by third parties, the availability of independent and competent third-partyverification sources with respect to the particular security or in the particular jurisdiction of the issuer, and a variety of other factors. Users of Fitch’s ratings should understand that neither an enhanced factual investigation nor any third-party verification can ensure that all of theinformation Fitch relies on in connection with a rating will be accurate and complete. Ultimately, the issuer and its advisers are responsible for theaccuracy of the information they provide to Fitch and to the market in offering documents and other reports. In issuing its ratings Fitch must rely on the work of experts, including independent auditors with respect to financial statements and attorneys with respect to legal and tax matters.Further, ratings are inherently forward-looking and embody assumptions and predictions about future events that by their nature cannot be verified as facts. As a result, despite any verification of current facts, ratings can be affected by future events or conditions that were notanticipated at the time a rating was issued or affirmed.
The information in this report is provided “as is” without any representation or warranty of any kind. A Fitch rating is an opinion as to thecreditworthiness of a security. This opinion is based on established criteria and methodologies that Fitch is continuously evaluating and updating. Therefore, ratings are the collective work product of Fitch and no individual, or group of individuals, is solely responsible for a rating. The rating does not address the risk of loss due to risks other than credit risk, unless such risk is specifically mentioned. Fitch is not engaged in the offer or sale of any security. All Fitch reports have shared authorship. Individuals identified in a Fitch report were involved in, but are not solelyresponsible for, the opinions stated therein. The individuals are named for contact purposes only. A report providing a Fitch rating is neither aprospectus nor a substitute for the information assembled, verified and presented to investors by the issuer and its agents in connection with thesale of the securities. Ratings may be changed or withdrawn at anytime for any reason in the sole discretion of Fitch. Fitch does not provideinvestment advice of any sort. Ratings are not a recommendation to buy, sell, or hold any security. Ratings do not comment on the adequacy of market price, the suitability of any security for a particular investor, or the tax-exempt nature or taxability of payments made in respect to any security. Fitch receives fees from issuers, insurers, guarantors, other obligors, and underwriters for rating securities. Such fees generally vary from US$1,000 to US$750,000 (or the applicable currency equivalent) per issue. In certain cases, Fitch will rate all or a number of issues issuedby a particular issuer, or insured or guaranteed by a particular insurer or guarantor, for a single annual fee. Such fees are expected to vary fromUS$10,000 to US$1,500,000 (or the applicable currency equivalent). The assignment, publication, or dissemination of a rating by Fitch shall notconstitute a consent by Fitch to use its name as an expert in connection with any registration statement filed under the United States securitieslaws, the Financial Services and Markets Act 2000 of the United Kingdom, or the securities laws of any particular jurisdiction. Due to the relative efficiency of electronic publishing and distribution, Fitch research may be available to electronic subscribers up to three days earlier than to printsubscribers.

www.fitchratings.com July 13, 2015
Structured FinanceCDOs / Global
Global Surveillance Criteria for Structured Finance CDOsSector-Specific Criteria
ScopeThis criteria report outlines the framework that Fitch Ratings uses to monitor and analyzeoutstanding structured finance collateralized debt obligations (SF CDOs) backed by portfolios of ABS, RMBS, CMBS, and CDO bonds. The methodology described in this report outlines the qualitative and quantitative factors considered in Fitch’s review analysis of SF CDOs. Thiscriteria report supersedes and replaces the report titled “Global Criteria for Structured Finance CDOs”, published in July 2014, and it is further supplemented by related Fitch criteria listed to the left. The rating analysis in this report is substantially the same as that in the previously published report, with the exception of an application of a rating cap to transactions with collateral concentrated in a single country, single sector, and single vintage group. In absence of mitigating factors, Fitch will limit the ratings to a maximum of ‘BBBsf’ in such transactions.
Key Rating DriversThe ratings of existing SF CDO transactions are based on various key rating drivers. These driversdetermine the appropriate rating actions and drive the implementation of certain rating caps.
Default Probability of Assets: An asset’s individual rating and term to maturity are the main parameters for its likelihood of default. Along with default correlation, these characteristics determine the magnitude of defaults in the portfolio over the life of a CDO.
Correlation Impact: High default correlation results in a higher portfolio default for a given confidence interval. Higher-rated notes must be able to withstand a wider range of defaults with a higher correlation. In Fitch’s SF Portfolio Credit Model (SF PCM), correlation is driven by sector and geographical concentration of the underlying assets.
Recovery on Defaulted Assets: In Fitch’s analytical framework, recovery rates for defaulted assets are primarily driven by an underlying asset’s tranche thickness and seniority within its respective capital structure.
Amortization Impact: Both the default rate and timing are sensitive to the amortization profile of the underlying portfolio. The impact is analyzed in the SF PCM model. Amortization also impacts the amount of excess spread in a transaction and availability of principal proceeds to cover any potential interest shortfalls.
CDO Structure and Cash Flow Analysis: CDO structural features and hedging strategies, as well as the timing of defaults and recoveries, have a meaningful impact on CDO performance. Fitch analyzes these factors under the framework described in the Cash Flow Analysis section,page 12.
Inside This ReportPage
Scope 1Key Rating Drivers 1Overview 2Limitations 2Quantitative Models and Assumptions 2Default Probabilities 2Default Correlation 3Recovery Rates 9Synthetically Referenced Assets 11Amortization of Underlying Assets 12Cash Flow Analysis 12Review of Distressed Transactions 14Rating Sensitivity Analysis 15Portfolio Performance 19Appendix 1: Probability of Default Inputs 22Appendix 2: Fitch Derived Ratings Surveillance 23
Appendix 3: Model Outputs for Hypothetical Portfolios 24
Appendix 4: Principal Recovery Estimates of Global SF Distressed Bonds 26
Appendix 5: Effective Recovery Ratings Example 27
Appendix 6: Decision Process for a Rating Review Scope 28
This report replaces the criteria report of the same name dated July 16, 2014.
Related CriteriaGlobal Structured Finance Rating Criteria (July 2015)Global Rating Criteria for Corporate CDOs (July 2014)Counterparty Criteria for Structured Finance and Covered Bonds (May 2014)Counterparty Criteria for Structured Finance and Covered Bonds: Derivative Addendum (May 2014)Criteria for Rating Caps and Limitations in Global Structured Finance Transactions (May 2014)Criteria for Interest Rate Stresses in Structured Finance Transactions and Covered Bonds (December 2014)
AnalystsChicagoAlina Pak, CFA+1 312 [email protected]
New YorkBarbara Burdzy+1 212 [email protected]
LondonBrendan Condon+44 203 [email protected]

Global Surveillance Criteria for Structured Finance CDOs 2July 13, 2015
Structured Finance
OverviewIn the absence of material changes, Fitch will typically conduct a performance review for each transaction at least once every 12 months. Rating reviews will include portfolio analysis generally using SF PCM and structural analysis, which may employ Fitch’s cash flow model. For some transactions with a majority of the portfolio rated at distressed rating levels, an alternative review process may be warranted, as described in the Review of Distressed Transactions section.
As part of Fitch’s performance review, the transaction is taken to a surveillance committee, where the results of the described methodology are evaluated in detail. However, the final ratings are ultimately assigned by a rating committee that may take into account other qualitative factors. Any material transaction-specific deviations from the assumptions outlined in this criteria report will be disclosed in the related rating action commentary.
LimitationsThis criteria report details Fitch’s criteria and approach to monitoring and analyzing outstanding SF CDOs with portfolios diversified across sectors, countries of origin and/or vintages. While Fitch may use this methodology for concentrated portfolios with a limited number of performing obligors, the results will be complemented and may be overridden by a look-through analysis of the individual assets.
Further, certain portfolios may contain risk characteristics not contemplated in this framework. Where unique risks are not fully addressed by this basic framework, Fitch will supplement this methodology with analytical judgment and deterministic overlays.
The unique risks and additional analysis will be described in transaction-specific rating action commentary.
This framework does not address market value risk that may arise from an early termination of a transaction or collateral liquidation.
Quantitative Models and AssumptionsFitch’s primary tool in assessing key rating factors of SF CDOs is its SF PCM. The model and its manual, including a description of the data inputs, are available on Fitch’s website at www.fitchratings.com. The model is updated from time to time, and a release log is maintained on the site to indicate the updated features and assumptions. A description of the data used to derive the assumptions of the Fitch SF PCM is described generally below and in more detail within the respective sections discussing the rating factors.
Fitch tracks the performance of corporate and SF assets through its annual default and rating transition studies, available on its website. Additionally, Fitch assigns recovery ratings to most distressed bonds. These data serve as a basis for developing and validating the default, correlation and recovery assumptions utilized by this criteria report and the SF PCM. Fitch reviews the data to determine the need to update the assumptions at least annually.
Default Probabilities
Base AssumptionsEmpirical corporate default statistics continue to be appropriate to use as input default probabilities for underlying SF assets. The Fitch international long-term credit rating scale is

Global Surveillance Criteria for Structured Finance CDOs 3July 13, 2015
Structured Financeused as a benchmark measure of probability of default and is intended to be equivalent across a broad range of market sectors.
Asset default probabilities used for the SF PCM are based on a three-decade-long default experience, an observation period longer than the one available for SF assets and covering several economic cycles. Corporate default observations also reflect the experience of a wide spectrum of corporate entities. The data analysis for developing asset default probabilities is detailed in “Global Rating Criteria for Corporate CDOs,” dated July 2014, available on Fitch’s website at www.fitchratings.com. This data set reflects the broadest set of default statistics available and minimizes the risk of any variances in ratings approach or industry coverage. Appendix 1 on page21 includes an abbreviated version of the full default statistics table, which is published in the SF PCM and available for download and installation at www.fitchratings.com.
Observed over a long-term and broad sample, default probabilities for a given rating and term should be similar. However, over shorter periods and/or smaller samples, default probabilities for a given rating and term may be different. In recent years, several SF asset types have experienced default rates above their long-term averages and also above default rates experienced by corporate ratings, as shown in the chart below.
Another factor contributing to these differing default rates is cyclicality, which may lead to peaks in default rates occurring at different times. This may lead to short-term variability but should not lead to significant changes in long-term average rates. However, the poor performance of individual SF sectors highlights the high risk of correlation in SF CDOs, which is further examined in the Default Correlation section below.
Additional ConsiderationsThe approach calls for the use of a Fitch rating where available. Where a particular asset is not rated by Fitch, the lowest of the ratings assigned by other rating agencies will be applied. Recent observations have shown that when SF securities experienced rating migration, it tended to be, in general, of a higher magnitude than that experienced by corporate securities. As such, if an asset carries a Negative Rating Watch, the credit rating will be reduced by an assumed three notches for the purpose of determining the appropriate input default probability (see Appendix 2 for the Fitch Derived Ratings chart).
In instances where a sector experiences ongoing volatility with ratings under review, alternative adjustments may apply. In addition, ratings on assets or sectors with a Negative Rating Outlook may be lowered based on discussions with the underlying-asset rating groups. Several

Global Surveillance Criteria for Structured Finance CDOs 4July 13, 2015
Structured Financescenarios with respect to the severity of potential negative migration of the underlying assets with a Negative Rating Outlook may be considered.
Similarly, Fitch may perform sensitivity testing with respect to other model inputs. For example, additional scenarios with an extended weighted average life (WAL) for some assets may be included in the analysis to reflect a heightened extension risk. Fitch will disclose such alternative adjustments in its rating action commentaries.
Default CorrelationAlthough the long-term average annual global SF default rates are expected to be commensurate with those of corporate debt, the SF sector shows greater variability around this annual average, particularly when looking within a single sector. This increased volatility and the clustering of defaults are indicative of the high level of correlation inherent in portfolios of SF assets; it is reflected in the calibration of the SF correlation framework.
Given the typically concentrated nature of SF CDO portfolios, Fitch uses the correlation input to express its credit view on a portfolio concentrated in the worst-performing SF sector, RMBS,and then estimates benefits for diversification across SF sectors and the countries of the assets’ origin.
The SF PCM output is defined in terms of the rating default rate (RDR). The RDR indicates the level of protection Fitch would expect to see against defaults in a portfolio. The RDR varies for rating stress and can be interpreted as the level of portfolio defaults that must be protected against to achieve a particular rating. Therefore, the ‘Asf’ RDR represents the level of defaults that a note is able to withstand to achieve an ‘Asf’ rating.
Fitch’s credit view is that CDO notes rated ‘Asf’ or above should be protected against historical peak levels of defaults. Therefore, the SF PCM should produce a ‘Asf’ RDR level at or above the potential peak.
In its base calibration, Fitch focused on 10-year portfolios of 100 ‘BBBsf’ rated assets, all assumed to be from a single SF sector. Fitch’s default studies track performance data by cohorts, defined as a static pool of bonds with ratings outstanding at the beginning of the year. For SF bonds, Fitch tracks the impairment rate, which includes a downgrade to a ‘CCsf’ and lower rating, and represents defaults and near defaults as defined in “Fitch Ratings Global Structured Finance 2014 Transition and Default Study - Amended,” dated April 2015, available on its website at www.fitchratings.com.
Through year-end 2014, the 2008 ‘BBBsf’ RMBS cohort experienced an 82.1% cumulative impairment rate over a seven-year period. The 2007 ‘BBBsf’ RMBS cohort experienced acomparable cumulative impairment rate of 82.1% over an eight-year period and 81.6% over a seven-year period (through year-end 2013). While high, these impairment rates have been slowing down over the recent years. For example, the cumulative rate for the 2008 RMBS ‘BBBsf’ cohort increased 2.2% in 2012, 1.4% in 2013 and only 0.6% in 2014. The 2007 RMBS ‘BBBsf’ cohort increased 1.3% in 2012, 0.3% in 2013, and 0.5% in 2014.
Similar moderation trends in impairment rates are noticed for the CDO sector, where the 2007 ‘BBBsf’ cohort, the worst performing cohort, registered a cumulative impairment rate of close to64.1% through year-end 2014, but the increase in impairment significantly slowed down, at 1.1% in 2012, 0.5% in 2013, and 0.6% in 2014. The worst ‘BBBsf’ CMBS cohorts, 2008 and 2009, had, respectively, 52.0% (seven-year period) and 50.7% (six-year period) cumulativedefault and near-default rates through the end of 2014. The growth rate in cumulative impairment slowed down in 2014, at 0.9% and 1.0% for 2008 and 2009 cohorts, respectively, lower than the 3.9% and 1.0% in 2013.

Global Surveillance Criteria for Structured Finance CDOs 5July 13, 2015
Structured FinanceFitch will continue to examine impairment rates across SF sectors to formulate its default assumptions for underlying assets in SF CDOs. However, even with a potential further increase in the cumulative default rate for the worst-performing SF sectors, Fitch is unlikely to increase the correlation above its current level.
The Fitch framework was established using 70% as the target SF PCM RDR at the ‘Asf’ rating level for a single country, single sector, and single vintage grouping portfolio of ‘BBBsf’ rated assets. This ‘Asf’ RDR level implies an 80% correlation of default between a pair of assets from the same-country, same-sector, and same vintage grouping.
While Fitch recognizes that the cumulative impairment rates for the worst-performing SF asset the 2007 and 2008 ‘BBBsf’ RMBS cohorts have increased beyond the 70% target, it has
also observed that the timing and severity of the deterioration was frontloaded, and has levelled off over a longer period, with the impairment rates showing a slowing pace of increase.
An upward revision of the target would result in a correlation approaching 100%, treating the portfolio as if it were one asset. This treatment would mask even minimal levels of idiosyncratic risk inherent in the portfolio. While it is appropriate to have high correlation to properly account for high volatility of portfolios concentrated in the same country, sector and vintage, some level of performance differentiation between the assets, even in such homogeneous portfolios, should remain. The proposed correlation target balances the high degree of the systemic risk present in a concentrated portfolio with protecting subordinate classes against some minimum level of idiosyncratic risk.
With this in mind, Fitch’s surveillance methodology will apply a rating cap for transactions where a predominant share of the collateral is represented by same sector/same vintage grouping assets from a single country.
In such transactions, Fitch will limit the rating of the notes to a maximum of ‘BBBsf’. The cap will not apply to senior notes that are covered in full or in large proportion of the outstanding balance with cash and eligible investments available in the principal collection account. Any deviation from the methodology described herein will be detailed in a public rating action commentary.
Fitch recognizes the benefit of diversification across countries and SF sectors by lowering correlation between a pair of assets from different countries and sector groups. At each potential level of diversification, Fitch sought to estimate the impact such diversification may have on influencing the peak portfolio default rate. This approach does not seek to predict future peak portfolio default rates, but, rather, it expresses a relative view of diversification benefit. Fitch’s correlation framework is summarized in the table above.
Correlation FrameworkSF Base Correlation Country Add-On Sector Grouping Add-On Sector Add-On
Vintage GroupingAdd-Ona
TotalCorrelation (%)
SF Asset + 20%
Same Country + 10%
Direct Residential Real Estate Exposure + 5% RMBS + 15% Same + 30% 80
Direct Commercial Real Estate Exposure + 5% CMBS and CREL + 15% Same + 30% 80Commercial REIT + 5% N.A. 40
No Direct Real Estate Exposure + 0%
Consumer ABS + 20% Same + 30% 80Commercial ABS + 20% Same + 30% 80Corporate CDOs + 50% N.A. 80SF CDOs + 60% N.A. 90
Different Country + 0% N.A.
RMBS, CMBS, CREL, Commercial REIT, Consumer ABS, Commercial ABS + 0%
N.A. 20
Corporate CDOs + 50% N.A. 70SF CDOs + 60% N.A. 80
aVintage grouping add-on is applied to two bonds from the same vintage grouping. Current vintage groupings are: vintage 1 (2010 and later), vintage 2 (2005 2009) and vintage 3 (2004 and prior). N.A. Not applicable.

Global Surveillance Criteria for Structured Finance CDOs 6July 13, 2015
Structured FinanceDiversification Benefit One: Sector DiversificationSector diversification recognizes that assets from different sectors show different default statistics due to different risk factors driving the probability of default. The approach divides SFassets into eight broad sectors, as shown in the table below.
SF CDOs that have classes from other SF CDOs as underlying assets exhibit increased ratings volatility and clustered default characteristics due to the high level of systemic risk. This is because each individual CDO has diversified its idiosyncratic risk by reducing the level of dependence on any one asset; hence, there is little idiosyncratic risk, but significant systemic or market risk, remaining. The high systemic risk implies that these portfolios are driven by the same small number of risk factors and exhibit similar default characteristics during periods of stress. As a result, the target ‘Asf’ RDR of SF CDOs with exposure to SF CDOs has been set higher than for other asset classes, at 87%. This reflects the increased probability of clustered default characteristics due to the high correlation of the assets to similar factors.
Fitch may apply manual adjustments in limited cases when it believes the general correlation framework does not represent the expected co-movement between some bonds, for example,when an SF CDO portfolio includes two tranches from two SME CDOs, one with predominantly German loan exposure and the other with French loan exposure. In this example, a high level of idiosyncratic risk remains between the two tranches. Fitch will manually map such tranches to commercial ABS (instead of corporate CDOs) to recognize their lower co-movement, resulting in 20%, rather than 70%, correlation between these tranches. Any such manual adjustments would be addressed in a transaction-specific rating action commentary.
Commercial real estate loans (CREL) are often included in the portfolios of CRE CDOs. The CREL exposure may range from senior debt (whole loans or A notes) to some form of subordinate debt (either B notes or mezzanine debt). Senior tranches of CMBS single-borrower transactions are treated as senior CREL debt. Nonsenior tranches of CMBS single-borrower transactions and so-called rake bonds are treated as subordinate CREL debt.
Diversification Benefit Two: Geographic DiversificationGeographic diversification is the most significant portfolio diversification benefit in the SF PCM. A portfolio diversified across countries reduces the correlation among the assets due to different economic risk factors driving the underlying assets. This is reflected in the correlation framework by not including country or sector add-ons. For example, two same-country RMBS assets would have 50% correlation, but two different-country RMBS assets would have only 20% correlation.
It is Fitch’s view that the diversification benefit of mixing assets from different countries is greater than the diversification benefit of mixing assets from different sectors. In other words,
Structured Finance Portfolio Credit Model (SF PCM) Categories1 Residential mortgages, including prime, Alt-A, and subprime assets2 CMBS3 Consumer ABS (e.g. credit card assets and auto loans assets).4 Commercial ABS (e.g. trade receivables and equipment leasing assets)5 Corporate CDOs6 SF CDOs (tranches from CDOs with exposure to structured finance assets)7 Real estate investment trusts (REITs)8 Commercial real estate loans (CREL)
Source: Fitch.

Global Surveillance Criteria for Structured Finance CDOs 7July 13, 2015
Structured Financeportfolios of assets from different countries, even if from the same sector, represent lower credit risk than portfolios from the same country of origin diversified across sectors.
Structured Finance and Real Estate Investment TrustsCommercial real estate investment trust (REIT) debt is often included with SF securities, particularly in CRE CDOs. The correlation structure recognizes that REITs, as a corporate industry with primary exposure to real estate markets, are more correlated to SF assets than other corporate industries. The structure also recognizes that some level of diversification benefit can be gained by adding REIT assets to a portfolio otherwise consisting solely of SF securities.
The base correlation between same-country REIT and SF assets is set at 30%. An additional 5% correlation (total 35%) is ascribed between CMBS or CREL and commercial REITs.
The correlation assumption between two commercial REITs is assumed to be 40%, recognizing that common exposure to real estate markets brings the potential for a higher level of systemic risk than is typical within a corporate industry (intra-industry corporate correlation assumptions typically range from 24% 26%). The correlation assumptions ascribed to REIT sectors not only recognize the potential for higher systemic risk, but also that REIT debt often appears in concentrated portfolios. The default correlation figures are set to penalize for the risk that a concentrated portfolio may exhibit default-rate variability beyond that observed in peak corporate portfolio default statistics.
For a portfolio of 100 ‘BBBsf’ rated, 10-year single-country CMBS assets, the ‘Asf’ rated RDR is 70%. In contrast, the portfolio of 50 single-country CMBS assets and 50 single-country commercial REITs will have a ‘Asf’ rated RDR at 45%. The decrease in ‘Asf’ RDR represents the diversification benefit of adding REIT assets to an otherwise CMBS portfolio. The tablebelow shows RDR coverage levels at the ‘Asf’ and ‘AAAsf’ rating levels for a sample of portfolios consisting of 100 ‘BBBsf’ rated assets with a term of 10 years (see Appendix 3 for additional data on the impact of portfolio diversification on correlation and SF PCM coverage levels).
Structured Finance and Banking/FinanceThe SF PCM assumes the correlation between the SF sector and the banking and finance sector is higher than that between the SF sector and other corporate sectors. Banks may have direct exposure to SF assets from purchasing them in the market or through indirect exposure,as the SF sector reflects a subset of the banks’ balance sheet. The SF PCM assumes a 15% correlation level between the banking and finance sector and the SF sector. Hence, a correlation of 15% will be applied to a European bank and U.S. RMBS transaction. The SF PCM applies a 1% correlation level between most other corporate and SF sectors.
Asf and AAAsf Rating Default Rate Levels for Selected Portfolios(%, Sample of Portfolios Consisting of 100 BBBsf Rated Assets with a Term of 10 Years)
Portfolio Geographical Composition Sector CompositionPortfolio
CorrelationAsf RDR
Coverage LevelAAAsf RDR
Coverage Levela
1
Single Country
Single Sector (RMBS, CMBS, Corporate CDOs,CREL or ABS)
80 70 100
2 Single Sector (SF CDOs) 90 87 1003 Equally Distributed Among Three SF Sectors 52 40 834 Mixed Country (Equally Distributed Among Three Countries) Single Sector (RMBS, CMBS, CREL or ABS) 49 36 745 Highly Diversified (Equally Distributed Among 10 Countries) Equally Distributed Among Three SF Sectors 24 24 49aFitch is unlikely to assign ratings in any category where the model rating default rate (RDR) output exceeds 90%.

Global Surveillance Criteria for Structured Finance CDOs 8July 13, 2015
Structured FinanceThe impact of this higher correlation between the banking and finance sector and the SF sector can be illustrated in the example of two sample portfolios, each consisting of 100 ‘BBBsf’ rated,10-year assets. Both portfolios include 30 single-sector, single-country SF assets. However,the first portfolio also includes 70 single-sector, single-country corporate assets (concentrated in an industry other than banking and finance). The resulting ‘Asf’ rated RDR is 30%. The second portfolio includes 70 single-sector, single-country banking and finance assets. The resulting ‘Asf’ RDR is 32%.
Obligor ConcentrationsPortfolios with a small number of assets, or those for which individual asset balances represent a disproportionate exposure within the portfolio, carry the risk that portfolio performance may be adversely impacted by a few assets that may underperform relative to statistics suggested by their ratings. The basic model framework is already sensitive to obligor concentrations in that, as portfolios contain fewer assets, all else being equal, the portfolio default rate increases. In the corporate PCM approach, Fitch applies additional stresses to correlation and recovery inputs for the five largest credit-risk exposures in the portfolio.
In the SF PCM approach, no additional stresses are applied to the correlation and recovery assumptions. This is because correlation levels for SF assets are generally much higher than those used in the corporate PCM, and recovery rates have been stressed using the capital structure recovery rate adjustment. However, where the portfolio contains nontypical asset concentrations, additional stresses and sensitivity may be applied to correlation and recovery assumptions.
For example, a portfolio may contain a very small number of assets and/or assets representing a disproportionate amount of the overall portfolio balance. In such cases, when reviewing the model output, a rating committee would also review the extent to which CDO noteholders are protected against the default of the largest assets. In some cases, the rating committee may override model output in favour of protecting against discrete defaults of a minimum number of the largest assets. The number would depend on the portfolio credit quality and the CDO note target rating.
Also, and particularly if the portfolio is of high credit quality and CDO noteholders are protected against the default of a small number of large assets, the rating committee may reduce recovery rate assumptions to protect noteholders against the risk that defaulting assets incur below-average recoveries.
Similar methodology (overlaying SF PCM results with analysis of a minimum number of discreet defaults) may be applied for rating liabilities with ratings lower than underlying asset ratings for portfolios with high correlation. For example, a portfolio with ‘BBBsf’ rated assets from the same country of origin, same sector, and same vintage grouping (resulting in 80% correlation for SF sectors other than SF CDOs and 90% for SF CDOs) would increasingly behave as a single asset, leading to low SF PCM RDRs at ‘BBsf’ and lower-rated levels. For these levels, SF PCM output may be complemented by the steps described above. Any alternative or sensitivity scenarios will be detailed in transaction-specific rating action commentary. Fitch may also apply a rating cap for transactions with a significant asset concentration, as described in detail in Fitch Research on “Criteria for Rating Caps and Limitations in Global Structured Finance Transactions,” dated May 2014, available on Fitch’s website at www.fitchratings.com.
Portfolio Default DistributionUsing input default probability and correlation assumptions described above, the SF PCM generates a portfolio default distribution. The SF PCM approach is consistent with the

Global Surveillance Criteria for Structured Finance CDOs 9July 13, 2015
Structured Financecorporate PCM approach, which sets target default probabilities for rating stresses in the ‘Asf’ and lower rating categories equal to input default probabilities for the same-level rating categories. For the rating categories ‘AAAsf’ and ‘AAsf’, target default probabilities are set at levels lower than the input default probabilities because the sample size of data cohorts for the ‘AAAsf’ and ‘AAsf’ rated categories contained fewer observations relative to other observed cohorts. Therefore, it is prudent to reduce the target default probability, or raise the threshold, when determining the level of support necessary to achieve high-investment-grade ratings. The effect of a lower default tolerance for ‘AAAsf’ and ‘AAsf’ ratings is an increase in the credit enhancement (CE) required to achieve these ratings.
Recovery Rates
Structured Finance RecoveriesAsset-specific recovery estimates (REs) issued by Fitch’s SF ratings groups are generally the best basis for determining recovery expectations for a defaulted SF bond. REs reflect a fundamentally derived, forward-looking view of a bond’s recovery prospects. The framework for REs is described in Fitch Research on “Structured Finance Recovery Estimates for Distressed Securities,” dated November 2011, available on Fitch’s website at www.fitchratings.com.
As described in that report, REs are rounded to the nearest 5%. In the SF PCM, REs are mapped into ranges as shown in the table below. Each SF asset with a Fitch RE will be assumed to recover principal at the mid-point of the range its RE falls into in the non-investment-grade rating stresses. These REs would be tiered for higher rating stresses. Grouping REs into six larger ranges, compared with 20 RE categories (each 5% wide), allows balancing a fair level of recovery differentiation with uncertainty inherent in REs, as well as avoiding unnecessary complexity in a tiering scale, which would be introduced with 20 RE ranges.
RE is a metric estimated at the base level of key assumptions rather than under stressed scenarios. For SF CDO investment-grade rating stresses, Fitch will tier down these base REs to account for its view that lower recoveries typically accompany higher defaults inherent in higher rating stresses (pro-cyclical nature of defaults and recoveries). The resulting recovery assumptions for all rating stresses are shown in the table above.
Absent an asset-specific RE, the most appropriate determinant for the recovery of the tranche is its position in the liability structure of its respective transaction (seniority) and thickness relative to the original size of the portfolio (tranche thickness). For pro rata tranches, where losses are attributed proportionally to each tranche, their notional can be aggregated for the purpose of calculating the tranche thickness used in the recovery calculation. A tranche may be classified as senior only if it is the most senior tranche in a structure or pro rata to the most senior tranche in a structure. A security will not be considered senior if there is an unfunded portion of the asset portfolio ranking senior to the security.
Recovery Assumptions for Assets with REsRating Stress (%)
Recovery Estimate Range AAAsf AAsf Asf BBBsf BBsf Bsf91% 100% 60 70 75 85 95 9571% 90% 45 55 60 70 80 8551% 70% 30 35 40 50 60 6531% 50% 10 15 20 25 40 4511% 30% 0 5 10 15 20 250% 10% 0 0 0 0 5 5

Global Surveillance Criteria for Structured Finance CDOs 10July 13, 2015
Structured FinanceFitch developed recovery assumptions based on the relationship found between these two factors and the assigned REs of Fitch-rated distressed SF bonds. The summary of the data is presented in Appendix 4 on page 25.
The data include distressed global SF bonds with the majority (more than 86%) of observations derived from the RMBS sector. For the senior category, the average RE, at 69%, is slightly above the current assumption of 65% for the non-investment-grade rating stresses at ‘Bsf’ and below, which are then tiered down to 50% at the ‘BBBsf’ stress and 30% at the ’AAAsf’ rating stress.
For the nonsenior categories, Fitch considers two groupings thin tranches with a tranche size between 0% and 6% and thick tranches with a tranche size larger than 6%. The average RE for the nonsenior thick tranches is 48%, slightly above the current assumption of 45% for the non-investment-grade rating stresses at ‘Bsf’ and below. For the nonsenior thin tranches, the average observed RE of 8.8% is just above the 5% Fitch assumes currently for the non-investment-grade stresses at ‘Bsf’ and below. These standard recovery assumptions are applied in the SF PCM when a senior tranche does not default in a given scenario. A zero recovery is assigned to a bond in the portfolio if its senior tranche defaults in a given scenario. See the Liability Structure and Recovery Rates section below for further explanation.
Analysts may also assign asset-specific recovery assumptions for assets in sectors experiencing ongoing volatility or ratings under review. Furthermore, for thin tranches, even a relatively small change in assumptions (e.g. in the base case loss of the underlying loan pool) could lead to significant volatility in REs. For such assets, Fitch may choose to use its generic recovery assumptions based on tranche thickness and seniority, as shown in the table above, instead of asset-specific REs.
Any alternative recovery assumptions or sensitivity scenarios will be detailed in transaction-specific rating action commentary, when the impact of applying such alternative assumptions is material.
Liability Structure and Recovery RatesThe repayment of interest and principal in SF assets is typically sequential, meaning the most senior tranches are paid first. Likewise, losses are typically allocated in a reverse-sequential order. Therefore, when a tranche defaults, it is highly likely that all tranches ranking junior to it will have experienced a complete loss.
The SF PCM takes the reverse-sequential loss feature of SF securities into account. In each scenario of a given simulation, the SF PCM calculates whether a tranche has defaulted and applies the appropriate recovery level using the assumptions from the Recovery Assumptions for Assets with REs table on the previous page and the Recovery Assumptions for Assets without Asset-Specific REs table above. The model also calculates whether a senior tranche would have defaulted in the particular scenario. If a senior-ranking security defaults, a 0% recovery is assigned to the tranche.
This liability structure feature is applied for all assets, even when only one tranche from an SFtransaction is included in the asset portfolio. This is done automatically by the model, as it
Recovery Assumptions for Assets without Asset-Specific REsRating Stress (%)
Seniority Tranche Size (%) AAAsf AAsf Asf BBBsf BBsf BsfSeniora — 30 35 40 50 60 65Nonsenior >6 10 15 20 25 40 45Nonsenior 0 6 0 0 0 0 5 5aSenior is defined as the most senior tranche in a structure or pro rata to the most senior tranche.

Global Surveillance Criteria for Structured Finance CDOs 11July 13, 2015
Structured Financecompares the rating of the tranche with the default threshold drawn in each scenario. For each scenario where the asset defaults, the recovery rate applied is determined by one of two possible cases:
The tranche defaults, and a senior-ranking security does not default, in which case, the relevant recovery rates shown in the tables on pages 9 and 10 are applied.The tranche defaults, and a senior ranking security also defaults, in which case a 0% recovery rate is applied.
Effective Recovery RateBecause of the feature described above, the effective recovery rate for an SF portfolio can differ from those presented in the tables on pages 9 and 10. The extent to which it will differ depends on two factors the credit quality of the portfolio assets and the rating stress scenario. Lower credit quality assets increase the probability of default. A higher probability of default also increases the likelihood that a senior security would default.
The rating stress also plays a role in determining the portfolio’s effective recovery rate. Higher rating stresses result in higher portfolio default rates. The higher portfolio default rate increases the number of assets for which the test of a senior asset defaulting will be performed. This effectively increases the number of instances in which a 0% recovery will be assumed and decreases the effective portfolio default rate. Appendix 5 on page 26 shows the effective recovery rate for portfolios of two different credit qualities (BBBsf and AAsf), each consisting of 100 single-sector, single-country assets.
Real Estate Investment Trust and Commercial Real Estate Loan Recovery RatesREIT debt is assigned standard corporate recovery rate assumptions, described in Fitch Research on “Global Rating Criteria for Corporate CDOs,” dated July 2014, available on Fitch’s website at www.fitchratings.com.
Senior CREL debt refers to the senior-most mortgage claim on a single property or a group of properties owned by a single borrower. Fitch used the most recent available recovery data fromits “U.S. CMBS Loss Study: 2014,” dated May 2015, available on its website, to form assumptions for senior CREL recovery. As shown in the report, the cumulative average recovery for loans that experienced a loss is 53.2%.
Accordingly, for senior CREL debt, Fitch will assume a recovery rate of 45%, tiered down for higher rating stresses in a similar manner as the 31% 50% RE range shown in the table onpage 9. Recovery rate expectations can vary depending on property type, quality, location and loan to value. As such, there may be instances where an asset-specific recovery rate is assumed in place of a standard recovery rate assumption.
Subordinate CREL debt on a property or group of properties is a junior mortgage claim or a mezzanine loan and is typically a thin slice relative to the overall debt secured on the property. Importantly, it is subordinate in terms of loss allocation. As such, the recovery rate assumptions for subordinate CREL are based on the size of the debt relative to the overall debt secured onthe property. The recovery rate assumptions applied to subordinate CREL are shown in the table on page 10. As with SF assets, in each scenario where a subordinate CREL asset defaults, the model tests whether a senior-ranking asset would also have defaulted, in which case, a 0% recovery rate is applied.

Global Surveillance Criteria for Structured Finance CDOs 12July 13, 2015
Structured FinanceSynthetically Referenced AssetsAssets referenced synthetically, via a credit default swap (CDS), may introduce additional risks. A CDS introduces an exposure to a CDS counterparty (protection buyer). The analysis of this risk is addressed in detail in “Counterparty Criteria for Structured Finance and Covered Bonds,”dated May 2014, available on Fitch’s website at www.fitchratings.com. Also, there is a risk that the cash flows of a CDS diverge from those of a corresponding physical asset. Fitch may adjust its standard probabilities of default where a CDS introduces an increase in default risk. Any such adjustments would be addressed in a transaction-specific rating action commentary. However, the current ratings of synthetic SF CDOs under surveillance are at distressed levels, and, thus, such adjustments would have little to no impact.
Assigning Recovery EstimatesAt present, Fitch does not assign REs to distressed tranches of SF CDOs. The general methodology for REs is described in “Structured Finance Recovery Estimates for Distressed Securities,” dated November 2011, available on Fitch’s website at www.fitchratings.com.
In a vast majority of SF CDOs, most subordinate classes are expected to remain cut off from any cash flows so that their REs would be close to 0%. For the most senior parts of the capital structure in many transactions, REs will be materially affected by levels of excess spread diverted to pay down senior classes due to the failing coverage tests. The level of excess spread is determined, in addition to the performance of the underlying assets, by terms of a transaction’s interest rate swaps (if present) and interest due on the senior classes of notes. These will vary greatly under different interest rate scenarios and default timing. Given this variability, Fitch is currently not assigning REs to the classes of notes issued by SF CDOs.
Amortization of the Underlying AssetsPortfolio default rate and timing are influenced by the amortization profile of the underlying assets. In general, a portfolio with a shorter average life will have a lower rate of default and more frontloaded default timing than a similar sector- and credit quality-composed portfolio with a longer average life. The SF PCM model allows the user to enter an amortization profile of each asset in the portfolio and produces differing default levels and timing. Typically, Fitch would form amortization assumptions representing base case, slow (extension) and fast prepayment scenarios. When conducting surveillance reviews, Fitch may consider only a base case scenario or a base case and an additional scenario believed to be more likely in the current environment. For example, if a sector is under stress and experiencing difficult refinancing conditions, a slow prepayment scenario may be considered, in addition to the base case.
These results are then analyzed in Fitch’s cash flow model, which accounts for amortization via principal cash flow timing. For example, the SF PCM default rate and timing based on the base case amortization are analyzed in the cash flow model in conjunction with the base case principal cash flow timing; the SF PCM model’s output for the slow amortization scenario is paired with the cash flow timing of that scenario, and so on.
While faster amortization benefits a transaction via a lower default rate, this is offset by the lower amount of excess spread available over the life of the transaction. The combined impact of these factors is evaluated in Fitch’s cash flow model.
Cash Flow AnalysisCurrently, Fitch employs a full-scope cash flow modeling analysis for a small number of SF CDOs, given that most ratings in the sector are distressed. The analytical scope is determined

Global Surveillance Criteria for Structured Finance CDOs 13July 13, 2015
Structured Financeas described by the decision tree presented in Appendix 6 on page 27. Generally, cash flow modeling will be performed when the transaction’s level of excess spread surpasses a rating relevance threshold and cannot be estimated without a cash flow model analysis within the context of the note’s expected remaining life.
For distressed transactions, in which the amount of expected losses from the distressed and defaulted assets in the portfolio (rated CCsf and lower) already exceeds the most senior class’ CE level, an alternative review process may be used, as further described in the Review of Distressed Transactions section. See Appendix 6 for the complete decision process included in determining the scope of a rating review.
Fitch’s modeling analysis is based on the actual portfolio characteristics as of that time. The purpose of Fitch’s cash flow analysis is to determine, based on the outputs of SF PCM and the defined stress scenarios, whether a given class in the SF CDO structure will receive principal and interest in accordance with terms of the transaction documents.
Fitch’s cash flow model reflects how the various stress scenarios affect principal and interest proceeds as they are received from the underlying collateral portfolio through the life of a transaction. The cash flow model then allocates those payments to the various classes of notes, based on the transaction structure as detailed in the underlying documents. If the cash flow model shows that a particular class of notes has received principal and interest payments according to the terms and conditions of the notes under the stress scenario for a particular rating, then it is deemed to have passed that particular stress scenario.
The agency uses a proprietary Excel-based cash flow model customized for each transaction based on the transaction documents provided to Fitch by the issuer, originator or third-party agents on their behalf. Fitch’s cash flow model is not publicly available.
Default Timing and Interest Rate Stress CombinationsFitch’s cash flow modeling analysis includes up to 12 stress scenarios, consisting of four default timing curves (further examined in the Timing of Defaults section below) and three interest rate scenarios designed to test the impact of the interest rate environment, as described in Fitch Research on “Criteria for Interest Rate Stresses in Structured Finance Transactions and Covered Bonds,” dated December 2014, available on Fitch’s website at www.fitchratings.com.
While the outcome of the cash flow modeling analysis is a key factor in determining the final rating for each note in the structure, there is no explicit weighting of the scenario results. Ultimately, it will be up to the rating committee to consider the relevance of each scenario in the context of the rating (for example, a note rated high investment grade may be expected to pass across all or most scenarios), time horizon and a degree of failure. Fitch’s rating committee may decide to put more weight on results in certain scenarios or accept a small numerical tolerance for a given scenario, depending on a transaction’s collateral or structural characteristics. In such instances, Fitch will provide in its rating action commentary adescription of any deviation, along with a rationale supporting the committee’s decision.
Timing of DefaultsAs mentioned above, Fitch will typically apply four different default timing scenarios, as described in the “Global Rating Criteria for Corporate CDOs,” dated July 2014, to assess the ability of the structure to withstand various clusters of defaults.

Global Surveillance Criteria for Structured Finance CDOs 14July 13, 2015
Structured FinanceRecent observations of cash flow patterns of the distressed SF bonds show that, in the majority of SF CDOs, defaults tend to be frontloaded. In addition, most of the outstanding SF CDO portfolios are expected to have a relatively short remaining WAL. Consequently, even in the backloaded default timing scenarios, distribution of defaults would become compressed.
Depending on transaction characteristics, Fitch may adjust the applied default patterns to account for the specifics of the analyzed portfolio (for example, in instances when a portfolio has a very short remaining life or an accelerated amortization profile).
Timing of RecoveriesFitch assumes a timing lag for defaulted asset recoveries in the cash flow model. In most SF CDOs, defaulted assets are not sold out of the portfolio. Principal recoveries are typically realized through periodic principal redemptions made through the remaining life of the defaulted bond. This timing is best replicated by assuming a recovery lag equal to each SF CDO’s portfolio WAL and, therefore, will vary for each transaction.
Treatment of Distressed and Defaulted SecuritiesIn a majority of Fitch-rated SF CDOs, defaulted assets generally remain in the portfolio, where principal recovery on a defaulted bond is realized over its remaining life as it is paid down. In instances where the manager does not show intent to remove defaulted assets from the portfolio, these assets are included in the SF PCM model and given standard default and recovery expectations. Specifically, the SF PCM defaults such assets in year one and assigns recoveries, as described in the Liability Structure and Recovery Rates section on page 10. If the defaulted assets are run through the SF PCM, then they are also included in the cash flow model with the rest of the portfolio. For transactions for which Fitch does not apply cash flow model analysis but performs SF PCM analysis, as explained in Appendix 6 on page 27,defaulted assets are also included in the portfolio run in the SF PCM model.
Available Cash InvestmentsFitch assumes cash balances held in a transaction’s interest and principal collection accounts between payment dates will earn a spread of minus 50 bps to the relevant reference index (e.g.EURIBOR/LIBOR), floored at zero.
Fitch will adjust these assumptions if the contractual rates are less favorable to the issuer than the above assumption.
Review of Distressed TransactionsSome of the analytical elements in Fitch’s rating framework described above may no longer be relevant for severely distressed SF portfolios. For example, many SF CDOs backed by subprime RMBS collateral have defaulted assets with realized and/or expected losses at a level that already exceeds the CE of the most senior class outstanding. Projecting future defaults on a relatively small balance of performing assets and analyzing the impact of structural features under different interest rate and default timing scenarios provide little additional analytical insight.
For example, even if a CDO is currently benefiting from excess spread, it may be clear that it will not make up for the expected principal losses. Additionally, failing coverage tests have led to waterfalls collapsing to a simple sequential priority of payment in many distressed transactions. For some transactions, a cash flow model analysis remains relevant for the top part of the capital structure but is unnecessary for the junior classes due to the level of the
Fitch will neither use the SF PCM to project losses from the portfolio nor conduct cash flow model analysis to analyze the impact of CDO structural features and cash flow timing when the most senior class of notes is expected to suffer a first dollar loss stemming from the distressed assets alone.

Global Surveillance Criteria for Structured Finance CDOs 15July 13, 2015
Structured Financedistressed and defaulted assets in the portfolio. In such a case, an analyst can use a cash flow model-based analysis for senior classes and determine the ratings of the junior notes based on the comparison of the expected losses from distressed and defaulted assets to the junior notes’ CE levels.
Appendix 6 on page 27 illustrates the decision process for when certain steps of a full-scope rating review (SF PCM and cash flow analysis) may be omitted. This decision is ultimately determined by a credit committee that evaluates the robustness of the analysis presented.
As shown in Appendix 6, when the expected loss from the distressed assets (those rated CCsf and lower), estimated based on asset-specific or standard recovery rate assumptions, already significantly exceeds the CE level of the most senior class of notes, Fitch will not perform SF PCM and cash flow model analysis. The loss is considered to significantly exceed the most senior class’ CE level when the gap between them clearly exceeds any potential cumulative benefit of interest proceeds diverted (or expected to be diverted) from subordinate notes to the most senior class due to the operation of the structural features of the CDO. In such transactions, Fitch will determine the appropriate ratings (which are unlikely to exceed CCsf) based on the relationship of the losses from distressed assets and each class’ CE level.
In addition, in certain instances the rating of a bond rated ‘CCsf’ or below may be withdrawn by Fitch if the agency believes analytical relevance no longer exists for maintaining such ratingand/or for commercial reasons. In those cases, Fitch will publish an advance notice of a contemplated withdrawal that would provide up to a 30 calendar day period during which investors can request continuance of coverage. At the end of that period, Fitch will evaluate investors’ feedback and make a final determination with respect to the withdrawal.
Rating Sensitivity AnalysisThis section examines the sensitivity of SF CDO ratings to a change in the following rating factors:
Default probability.
Portfolio composition and default correlation.
Amortization of collateral.
Default timing.
Two actual SF CDO transactions were selected, with the closing dates in 2003 and 2005. Their capital structures were modified to achieve ratings that would have been assigned at closing under the current framework. The modified capital structures result in higher CE than the actual levels at the time of closing.
The sensitivity to the above factors was analyzed by applying the actual changes in the portfolio (rating migration, changes in the portfolio composition, default timing and correlationand amortization) to the hypothetical capital structures. Given the magnitude and severity of recent rating volatility across the SF universe, this look-back analysis encompasses a severe credit deterioration scenario. CDO notes’ indicative ratings were assigned based on the comparison of their respective CEs to SF PCM rating loss rates (RLRs), which represent portfolio loss thresholds at all rating levels that a CDO note of that rating level must withstand. The indicative ratings shown are not necessarily the rating conclusions a credit committee would have agreed on had a full-scope analysis been performed at each period.
CDO 1 represents a static transaction that closed in 2003 and began to amortize immediately. Portfolio-sector composition at closing and over time is shown in the CDO 1 Sector Composition chart at the top of page 16, and asset quality is shown in the CDO 1 Asset Quality chart. Credit migration is shown in the CDO 1 Weighted Average Rating Factor and % Downgrades chart.

Global Surveillance Criteria for Structured Finance CDOs 16July 13, 2015
Structured Finance
Ratings of the investment-grade tranches remained stable and improved due to the rate of amortization offsetting the rising PCM RLRs that resulted from collateral deterioration.
Beginning in 2005, the class D and E tranches could have been upgraded while the portfolio’s credit quality remained stable; however, the benefit of additional enhancement was quickly negated for class E by the extent of deterioration beginning in fourth-quarter 2008. The portfolio has experienced slight improvements since then (see CDO 1 Asset Quality chart above).Typically, Fitch refrains from upgrading below-investment-grade tranches that still have a
RaRaRaRaaRaRaRaRaRaRRaaaRaRaRaRaaRaRaRaRaRaaaRR tingggs of the investment-grgg ade tranches remmmmmmmmmmmmmmmmemmmmmemmmmemmmmmmmmmmmmmmmmmmmainnned stable annnd imppproved due to thehe rrrrrrrrrrrrrrrrrrrrrrrataaaaaaaaaaaaaaa e of amaamammmaaa ortization offsetting the rising PCM RLRs thtthhthththtthhththhhhhtthhthhhhhththhttt aaat reeesulttedd frommm cccollatteraal deeteterirr oration.

Global Surveillance Criteria for Structured Finance CDOs 17July 13, 2015
Structured Finance
significant portion of outstanding notes senior to them. Beginning in 2012, class E notes could be upgraded while the portfolio’s credit quality has slightly deteriorated before improving in 2013.
CDO 2 represents a transaction that closed in 2005 with a four-year reinvestment period. As such, the capital structure did not begin to amortize until May 2009. The CDO 2 Sector Composition chart shows portfolio sector composition, and the CDO 2 Asset Quality and CDO 2 Weighted Average Rating Factor and % Downgrades charts present the portfolio’s quality,amortization and credit migration.
CDO 1 Capital Structure and Indicative RatingsCapital Structure ($ Mil.)
Tranche 2003 2004 2005 2006 2007 2008 2009 2010 2011 2012 2013 2014A 159.0 124.6 87.5 0.0 0.0 0.0 0.0 0.0 0.0 0.0 0.0 0.0B 43.5 43.5 43.5 27.2 0.0 0.0 0.0 0.0 0.0 0.0 0.0 0.0C 60.3 60.3 60.3 60.3 40.2 6.8 0.0 0.0 0.0 0.0 0.0 0.0D 42.8 39.5 36.5 33.6 31.8 30.9 23.7 5.6 0.0 0.0 0.0 0.0E 48.2 48.2 48.2 48.2 48.2 48.2 48.2 48.2 40.8 30.7 18.1 5.7PS 15.5 15.5 15.5 15.5 15.5 15.5 15.5 15.5 15.5 15.5 15.5 15.5Total 369.2 331.6 291.4 184.7 135.7 101.4 87.3 69.2 56.3 46.2 33.5 21.2
Indicative RatingsTranche 2003 2004 2005 2006 2007 2008 2009 2010 2011 2012 2013 2014A AAAsf AAAsf AAAsf PIF PIF PIF PIF PIF PIF PIF PIF PIFB AAsf AAsf AA+sf AAAsf PIF PIF PIF PIF PIF PIF PIF PIFC Asf Asf AA sf AA+sf AAAsf AAAsf PIF PIF PIF PIF PIF PIFD BBBsf BBBsf A sf AA sf AA+sf AAAsf AAAsf AAAsf PIF PIF PIF PIFE BBsf BBsf BB+sf BBBsf BBB+sf A sf CCC+sf CCC+sf CCC+sf B sf B+sf AAsfPS NR NR NR NR NR NR NR NR NR NR NR NR
Note: Numbers may not add due to rounding. NR Not rated. Source: Fitch.

Global Surveillance Criteria for Structured Finance CDOs 18July 13, 2015
Structured Finance
CE levels for the rated tranches have increased marginally relative to the substantial collateral deterioration that began in 2008. The CE level of the senior ‘AAAsf’ class was able to sustain its ‘AAAsf’ rating until receipt of the class’ full payment in 2011. Since then, class B, C and D notes have also been repaid, and in 2014 the class E notes became the senior-most class outstanding. Beginning in 2011, class E notes could be upgraded while the portfolio’s credit quality remained stable.

Global Surveillance Criteria for Structured Finance CDOs 19July 13, 2015
Structured FinanceRatings of other notes remained stable almost through the life of this transaction, except for ashort period in 2008, when, without any amortization, the classes became susceptible to downgrades, limited to one notch only, as the portfolio’s WARF began to shift. High-investment-grade-rated tranches (AAAsf or AAsf original ratings) could have remained investment grade.
Portfolio PerformanceFitch monitors performance of its outstanding credit ratings on an ongoing basis, based on observed performance to date and the expectation of future performance. The surveillance process uses a two-stage system, as outlined below.
Monitoring of Surveillance DataAt each transaction close, Fitch receives final executed documents governing a CDO transaction. Typically, Fitch receives monthly trustee reports reflecting portfolio composition, CDO note balances, compliance status with portfolio guidelines, coverage tests, asset amortization, trading activity and distribution reports. Ratings on the underlying assets in the portfolio are updated via daily data feeds capturing the most recent rating actions by Fitch and other rating agencies. If a CDO remains in a reinvestment period or a manager is actively trading assets in the portfolio as part of loss mitigation, Fitch may request additional information from the manager to understand the potential impact from future trading activity.
Rating Review TriggersFitch monitors several factors when determining the need for an SF CDO review:
Credit quality migration in the underlying portfolio since the transaction origination or prior rating review.Expected future collateral performance trends.A change in the portfolio composition due to reinvestment and amortization.
CDO 2 Capital Structure and Indicative RatingsCapital Structure ($ Mil.)Tranche 2005 2006 2007 2008 2009 2010 2011 2012 2013 2014A 76.6 76.6 76.6 74.8 66.5 8.3 0.0 0.0 0.0 0.0B 14.0 14.0 14.0 14.0 14.0 14.0 0.0 0.0 0.0 0.0C 61.6 61.6 61.6 61.6 61.6 61.6 0.0 0.0 0.0 0.0D 83.6 83.6 83.6 83.6 83.6 83.6 73.0 28.2 19.9 0.0E 65.1 65.1 65.1 65.1 65.1 65.1 65.1 65.1 65.1 17.1PS 199.1 199.1 199.1 199.1 199.1 199.1 199.1 199.1 199.1 199.1Total 500.0 500.0 500.0 498.2 489.8 431.7 337.2 292.4 284.1 216.2
Indicative RatingsTranche 2005 2006 2007 2008 2009 2010 2011 2012 2013 2014A AAAsf AAAsf AAAsf AAAsf AAAsf AAAsf PIF PIF PIF PIFB AAAsf AAAsf AAAsf AA+sf AAAsf AAAsf PIF PIF PIF PIFC AAsf AA+sf AA+sf AA sf A+sf AAsf PIF PIF PIF PIFD Asf A-sf A-sf BBB+sf BBBsf BB+sf AAAsf AAAsf AAAsf PIFE BBBsf BBB sf BBB sf BBB sf BB+sf Bsf BBsf BBsf BBsf A+sfPS NR NR NR NR NR NR NR NR NR NR
Note: Numbers may not add due to rounding. NR Not rated.
Source: Fitch.

Global Surveillance Criteria for Structured Finance CDOs 20July 13, 2015
Structured FinanceThe magnitude of CDO notes’ paydown since the prior review.A change, if any, in critical CDO counterparties or collateral manager, counterparty downgrade or default.A change in performance, such as interest shortfalls or deferrals, or coverage test failures.The trigger of an event of default (EOD), the controlling class’ vote to accelerate or liquidate a transaction.
Fitch analysts review automated daily surveillance reports that capture changes in a transaction’s performance due to portfolio credit migration, note amortization, principal proceeds accumulation and changes in the coverage tests. Additionally, Fitch reviews issuer notices to identify such events as counterparty changes (replacement, downgrade or default), manager replacements, an EOD, acceleration or liquidation to determine the extent to which the ratings of the affected CDO would be impacted.
Fitch does not employ quantitative screening to identify rating review triggers. Rather, Fitch evaluates the materiality of the factors listed above on a combined basis. A moderate deterioration in the portfolio credit quality can be offset by a paydown of the CDO notes leading to an increase in the CE of notes.

Global Surveillance Criteria for Structured Finance CDOs 21July 13, 2015
Structured Finance
Appendix 1: Probability of Default Inputs
Default Probabilities(%)
Months AAAsf AAsf Asf BBBsf BBsf Bsf CCCsf/NR CCsf Csf Dsf1 0.01 0.01 0.01 0.01 0.04 0.14 15.69 45.00 70.00 100.0012 0.01 0.01 0.07 0.19 1.16 5.36 25.23 50.50 75.50 100.0024 0.01 0.02 0.16 0.49 3.12 11.16 37.34 56.50 81.50 100.0036 0.01 0.05 0.27 0.87 5.40 15.17 43.82 62.50 87.50 100.0048 0.04 0.10 0.41 1.35 7.75 18.49 47.73 68.50 93.50 100.0060 0.08 0.17 0.59 1.91 10.03 21.57 51.13 74.50 99.50 100.0072 0.14 0.26 0.78 2.54 12.11 24.41 54.25 80.50 100.00 100.0084 0.17 0.35 0.98 3.13 13.90 26.90 56.99 86.50 100.00 100.0096 0.19 0.45 1.18 3.67 15.35 29.01 59.31 92.50 100.00 100.00108 0.19 0.56 1.40 4.15 16.54 30.77 61.24 98.50 100.00 100.00120 0.19 0.64 1.58 4.54 17.43 32.18 62.80 100.00 100.00 100.00

Global Surveillance Criteria for Structured Finance CDOs 22July 13, 2015
Structured Finance
Appendix 2: Fitch Derived Ratings SurveillanceFigure 16
For sectors whose ratings are currently under review, additional sensitivity adjustments may apply. For a CREL asset without a public rating, Fitch will assign a credit opinion in accordance with the CMBS criteria outlined in “Criteria for Analyzing Large Loans in U.S. Commercial Mortgage Transactions,” dated May 2015, available on Fitch’s website at www.fitchratings.com. An abbreviated review will be conducted if a CREL asset represents a relatively small proportion of the CDO collateral. An abbreviated review includes a determination of net cash flow based on a review of the current and historical property operating performance and current rent roll, as applicable; a review of the basic loan terms, as provided by the collateral manager;a determination of the current and stressed refinance debt service coverage ratio; and a determination of the current and stressed loan-to-value ratio. The ratings would be assigned based on parameters outlined in the CMBS criteria.
For other nonpublicly rated assets, Fitch will assume a ‘CCCsf’ rating unless a higher (or lower) rating is warranted in the analyst’s opinion, based on information in the public domain and/or collateral manager discussions.
The SF PCM treats SF bonds rated ‘CCsf’ and ‘Csf’ as ‘Dsf’, consistent with Fitch’s annual transition and default studies, which consider bonds at these rating levels impaired, or nearly defaulted.
Is the Asset Rated by Fitch?
Fitch DerivedRating Is
ThreeNotches Lower
Yes No
Is It on Rating Watch? Is there a Rating by Another NRSRO?
Use the Credit Rating
Yes No
Select the Lower of the Available Ratings After
Notchinga
Use a Fitch Credit
Assessment
Yes No
aIf a rating is on Rating Watch Negative by any NRSRO, Fitch adjusts the rating down by three notches before selecting the lower of the available ratings.

Global Surveillance Criteria for Structured Finance CDOs 23July 13, 2015
Structured Finance
Appendix 3: Model Output for Hypothetical PortfoliosThe table below shows model RDR output for concentrated portfolios across various credit qualities. Each portfolio consists of 100 10-year assets concentrated in a single sector.
The table below shows model (RLR) output for concentrated portfolios across various credit qualities. Each portfolio consists of 100 10-year assets concentrated in a single sector. The RLRs reflect recovery rate assumptions associated with the sample tranche sizes indicated.
The table below shows model RDR output for highly diverse portfolios across various credit qualities. Each portfolio consists of 100 10-year assets from three different countries and three sectors.
The table below shows model RLR output for highly diverse portfolios across various credit qualities. Each portfolio consists of 100 10-year assets from three different countries and three sectors. The RLRs reflect recovery rate assumptions associated with the sample tranche sizes indicated.
Rating Default Rate Single-Sector Portfolio(%)
AAAsf AAsf Asf BBBsf BBsf BsfSenior Nonsenior Nonsenior Nonsenior Nonsenior Nonsenior Nonsenior Nonsenior
Rating Stress >6 0 6 >6 0 6 0 6 0 6 0 6AAAsf 62.0 62.0 62.0 88.0 98.0 100.0 100.0 100.0AAsf 19.0 19.0 19.0 51.0 79.0 97.0 100.0 100.0Asf 2.0 2.0 2.0 10.0 31.0 70.0 99.0 100.0BBBsf 0.0 0.0 0.0 2.0 8.0 35.0 90.0 99.0BBsf 0.0 0.0 0.0 0.0 0.0 3.0 41.0 80.0Bsf 0.0 0.0 0.0 0.0 0.0 0.0 12.0 46.0
Rating Loss Rate Single-Sector Portfolio(%)
AAAsf AAsf Asf BBBsf BBsf BsfSenior Nonsenior Nonsenior Nonsenior Nonsenior Nonsenior Nonsenior Nonsenior
Rating Stress >6 0 6 >6 0 6 0 6 0 6 0 6AAAsf 43.4 52.7 62.0 84.4 98.0 100.0 100.0 100.0AAsf 12.4 15.2 19.0 44.4 79.0 97.0 100.0 100.0Asf 1.2 1.5 2.0 8.3 31.0 70.0 99.0 100.0BBBsf 0.0 0.0 0.0 1.4 8.0 35.0 90.0 99.0BBsf 0.0 0.0 0.0 0.0 0.0 2.9 39.3 78.2Bsf 0.0 0.0 0.0 0.0 0.0 0.0 11.4 44.2
Rating Default Rate Highly Diverse Portfolio(%)
AAAsf AAsf Asf BBBsf BBsf BsfSenior Nonsenior Nonsenior Nonsenior Nonsenior Nonsenior Nonsenior Nonsenior
Rating Stress >6 0 6 >6 0 6 0 6 0 6 0 6AAAsf 10.0 10.0 10.0 18.0 29.0 49.0 80.0 93.0AAsf 6.0 6.0 6.0 11.0 19.0 36.0 69.0 85.0Asf 3.0 3.0 3.0 6.0 11.0 24.0 55.0 75.0BBBsf 1.0 1.0 1.0 4.0 7.0 17.0 45.0 66.0BBsf 0.0 0.0 0.0 1.0 3.0 8.0 29.0 50.0Bsf 0.0 0.0 0.0 0.0 1.0 5.0 21.0 39.0

Global Surveillance Criteria for Structured Finance CDOs 24July 13, 2015
Structured Finance
Rating Loss Rate Highly Diverse Portfolio(%)
AAAsf AAsf Asf BBBsf BBsf BsfSenior Nonsenior Nonsenior Nonsenior Nonsenior Nonsenior Nonsenior Nonsenior
Rating Stress >6 0 6 >6 0 6 0 6 0 6 0 6AAAsf 7.0 9.0 10.0 17.2 29.0 49.0 80.0 93.0
AAsf 3.9 5.1 6.0 10.3 19.0 36.0 69.0 85.0Asf 1.8 2.4 3.0 5.4 11.0 24.0 55.0 75.0BBBsf 0.3 0.8 1.0 3.0 7.0 17.0 45.0 66.0BBsf 0.0 0.0 0.0 0.6 2.9 7.9 28.1 48.8Bsf 0.0 0.0 0.0 0.0 1.0 4.8 20.2 38.4

Global Surveillance Criteria for Structured Finance CDOs 25July 13, 2015
Structured FinanceAppendix 4: Principal Recovery Estimates of Global SF Distressed Bonds
Principal Recovery Estimates (As of Dec. 31, 2014)
Seniority Tranche Size (%) Number of Observations Average Principal RE (%)Senior 2,802 69.9Nonsenior >6 7,274 48.0Nonsenior 0 6 17,027 8.8Total Number of Observations 27,103
RE Recovery estimate.

Global Surveillance Criteria for Structured Finance CDOs 26July 13, 2015
Structured Finance
Appendix 5: Effective Recovery Ratings Example
10-Year BBBsf Portfolio Effective Recovery(%)
Rating StressSeniority Tranche Size (%) AAAsf AAsf Asf BBBsf BBsf BsfSenior 30.0 34.9 40.0 50.0 60.0 0.0Nonsenior >6 0.2 3.1 11.4 20.0 40.0 0.0Nonsenior 0 6 0.0 0.0 0.0 0.0 0.0 0.0
10-Year AAsf Portfolio Effective Recovery(%)
Rating StressSeniority Tranche Size (%) AAAsf AAsf Asf BBBsf BBsf BsfSenior 30.0 34.9 40.0 50.0 0.0 0.0Nonsenior >6 2.7 9.8 14.0 25.0 0.0 0.0Nonsenior 0 6 0.0 0.0 3.0 10.0 0.0 0.0

Global Surveillance Criteria for Structured Finance CDOs 27July 13, 2015
Structured Finance
Appendix 6: Decision Process for a Rating Review ScopeFigure 24
Decision Process for a Rating Review Scope
Yes
No
Start
Do Lossesa fromdistressed and defaulted
assetsb significantlyc
exceed the most seniorclass’ CE?
Run SF PCM
Is CDO expected topay principal balancesof notes sequentially?
Yes
Compare each class’ CE levelsto SF PCM’s RLRs
Compare each class’ CE levels to losses from defaulted assetsa. Default is probable or inevitable for the most senior class, which is expected to be
rated not higher than ‘CCsf’.
Endf
Run CFM
Yes
Yes
No
No
Compare each class’ break-evensto SF PCM’s RDRs
Endf
Can the range of “I for P” or “P for I” be estimated
without a CFMd?Is the estimate below a
rating relevance thresholde?
aUsing asset-specific or standard recovery rate assumptions for assets with a Fitch-derived rating of ‘CCsf’ and lower.
bAssets with a Fitch-derived rating of ‘CCsf’ and lower.
cSignificance is determined in the context of available interest for principal (if any), i.e. when the gap between expected losses from defaulted
assets and most senior class’ CE clearly exceeds even the high end of potential interest for principal.dBased on the trends from most recent payment reports combined with anticipated changes in a transaction’s interest rate swap schedule,
portfolio amortization and interest shortfalls from underlying assets.eFor interest for principal (I for P), rating relevance threshold is defined in relation to the level of incremental CE from I for P required to move a
rating up by at least one category. For example, with a bond with a ‘BBsf’ level CE, is the estimated cumulative future I for P commensurate with a difference between ‘BBsf’ and ‘BBBsf’ SF PCM RLRs? For principal and interest (P and I), rating relevance threshold is determined by the level of CE erosion from P for I required to move a rating down by at least one rating category. For example, for a bond with a ‘BBsf’ level CE, is the estimated cumulative future P for I commensurate with a difference between the bond’s CE and ‘BBsf’ level of SF PCM RLRs? When a CDO is expected to switch from P for I to I for P in the future, the net effect (if it can be estimated) is evaluated. In addition, the effect of I for P or P for I is evaluated in the context of the note’s expected remaining life.fThis chart does not include potential further qualitative adjustments recommended by a credit analyst and credit committee.

Global Surveillance Criteria for Structured Finance CDOs 28July 13, 2015
Structured Finance
ALL FITCH CREDIT RATINGS ARE SUBJECT TO CERTAIN LIMITATIONS AND DISCLAIMERS. PLEASEREAD THESE LIMITATIONS AND DISCLAIMERS BY FOLLOWING THIS LINKHTTPS://FITCHRATINGS.COM/UNDERSTANDINGCREDITRATINGS IN ADDITION, RATING DEFINITIONSAND THE TERMS OF USE OF SUCH RATINGS ARE AVAILABLE ON THE AGENCY'S PUBLIC WEB SITE ATWWW.FITCHRATINGS.COM. PUBLISHED RATINGS, CRITERIA, AND METHODOLOGIES ARE AVAILABLEFROM THIS SITE AT ALL TIMES. FITCH'S CODE OF CONDUCT, CONFIDENTIALITY, CONFLICTS OFINTEREST, AFFILIATE FIREWALL, COMPLIANCE, AND OTHER RELEVANT POLICIES AND PROCEDURESARE ALSO AVAILABLE FROM THE CODE OF CONDUCT SECTION OF THIS SITE. FITCH MAY HAVEPROVIDED ANOTHER PERMISSIBLE SERVICE TO THE RATED ENTITY OR ITS RELATED THIRD PARTIESDETAILS OF THIS SERVICE FOR RATINGS FOR WHICH THE LEAD ANALYST IS BASED IN AN EU-REGISTERED ENTITY CAN BE FOUND ON THE ENTITY SUMMARY PAGE FOR THIS ISSUER ON THEFITCH WEBSITE.Copyright © 2015 by Fitch Ratings, Inc., Fitch Ratings Ltd. and its subsidiaries. 33 Whitehall Street, NY, NY 10004.Telephone:1-800-753-4824, (212) 908-0500. Fax: (212) 480-4435. Reproduction or retransmission in whole or in part is prohibited exceptby permission. All rights reserved. In issuing and maintaining its ratings, Fitch relies on factual information it receives fromissuers and underwriters and from other sources Fitch believes to be credible. Fitch conducts a reasonable investigation of the factual information relied upon by it in accordance with its ratings methodology, and obtains reasonable verification of thatinformation from independent sources, to the extent such sources are available for a given security or in a given jurisdiction. The manner of Fitch’s factual investigation and the scope of the third-party verification it obtains will vary depending on thenature of the rated security and its issuer, the requirements and practices in the jurisdiction in which the rated security is offered and sold and/or the issuer is located, the availability and nature of relevant public information, access to the management of theissuer and its advisers, the availability of pre-existing third-party verifications such as audit reports, agreed-upon proceduresletters, appraisals, actuarial reports, engineering reports, legal opinions and other reports provided by third parties, theavailability of independent and competent third-party verification sources with respect to the particular security or in the particular jurisdiction of the issuer, and a variety of other factors. Users of Fitch’s ratings should understand that neither anenhanced factual investigation nor any third-party verification can ensure that all of the information Fitch relies on in connectionwith a rating will be accurate and complete. Ultimately, the issuer and its advisers are responsible for the accuracy of theinformation they provide to Fitch and to the market in offering documents and other reports. In issuing its ratings Fitch must rely on the work of experts, including independent auditors with respect to financial statements and attorneys with respect to legaland tax matters. Further, ratings are inherently forward-looking and embody assumptions and predictions about future events that by their nature cannot be verified as facts. As a result, despite any verification of current facts, ratings can be affected byfuture events or conditions that were not anticipated at the time a rating was issued or affirmed. The information in this report is provided “as is” without any representation or warranty of any kind. A Fitch rating is an opinionas to the creditworthiness of a security. This opinion is based on established criteria and methodologies that Fitch is continuously evaluating and updating. Therefore, ratings are the collective work product of Fitch and no individual, or group ofindividuals, is solely responsible for a rating. The rating does not address the risk of loss due to risks other than credit risk, unless such risk is specifically mentioned. Fitch is not engaged in the offer or sale of any security. All Fitch reports have sharedauthorship. Individuals identified in a Fitch report were involved in, but are not solely responsible for, the opinions stated therein. The individuals are named for contact purposes only. A report providing a Fitch rating is neither a prospectus nor a substitute forthe information assembled, verified and presented to investors by the issuer and its agents in connection with the sale of the securities. Ratings may be changed or withdrawn at anytime for any reason in the sole discretion of Fitch. Fitch does notprovide investment advice of any sort. Ratings are not a recommendation to buy, sell, or hold any security. Ratings do not comment on the adequacy of market price, the suitability of any security for a particular investor, or the tax-exempt nature ortaxability of payments made in respect to any security. Fitch receives fees from issuers, insurers, guarantors, other obligors, and underwriters for rating securities. Such fees generally vary from US$1,000 to US$750,000 (or the applicable currencyequivalent) per issue. In certain cases, Fitch will rate all or a number of issues issued by a particular issuer, or insured or guaranteed by a particular insurer or guarantor, for a single annual fee. Such fees are expected to vary from US$10,000 toUS$1,500,000 (or the applicable currency equivalent). The assignment, publication, or dissemination of a rating by Fitch shall not constitute a consent by Fitch to use its name as an expert in connection with any registration statement filed under the United States securities laws, the Financial Services and Markets Act of 2000 of the United Kingdom, or the securities laws of any particular jurisdiction. Due to the relative efficiency of electronic publishing and distribution, Fitch research may be availableto electronic subscribers up to three days earlier than to print subscribers.

Cri
teri
a T
ype
Cri
teri
a T
itle
Pu
blic
atio
n
Dat
eC
rite
ria
Rep
ort
Lin
kC
han
ges
Sec
tor
Spe
cific
Glo
bal R
atin
g C
riter
ia f
or D
eale
r F
loor
plan
AB
S
6-Ja
n-15
http
s://w
ww
.fitc
hrat
ings
.com
/cre
ditd
esk/
repo
rts/
repo
rt_f
ram
e.cf
m?r
pt_i
d=83
3468
http
s://w
ww
.fitc
hrat
ings
.com
/site
/fitc
h-ho
me/
pres
srel
ease
?id=
9638
55C
ross
Sec
tor
Rat
ing
U.S
. Pub
lic F
inan
ce S
hort
-Ter
m D
ebt
7-Ja
n-15
http
s://w
ww
.fitc
hrat
ings
.com
/cre
ditd
esk/
repo
rts/
repo
rt_f
ram
e.cf
m?r
pt_i
d=84
6969
http
s://w
ww
.fitc
hrat
ings
.com
/site
/fitc
h-ho
me/
pres
srel
ease
?id=
9643
55C
ross
Sec
tor
Glo
bal R
atin
g C
riter
ia f
or N
on-P
erfo
rmin
g Lo
an S
ecur
itisa
tions
22-J
an-1
5ht
tps:
//ww
w.f
itchr
atin
gs.c
om/c
redi
tdes
k/re
port
s/re
port
_fra
me.
cfm
?rpt
_id=
8488
08ht
tps:
//ww
w.f
itchr
atin
gs.c
om/s
ite/f
itch-
hom
e/pr
essr
elea
se?i
d=97
6255
Sec
tor
Spe
cific
Rat
ing
Crit
eria
for
RM
BS
in L
atin
Am
eric
a22
-Jan
-15
http
s://w
ww
.fitc
hrat
ings
.com
/cre
ditd
esk/
repo
rts/
repo
rt_f
ram
e.cf
m?r
pt_i
d=83
9629
http
s://w
ww
.fitc
hrat
ings
.com
/site
/fitc
h-ho
me/
pres
srel
ease
?id=
9758
95
Sec
tor
Spe
cific
Rat
ing
Gui
delin
es f
or V
aria
ble-
Rat
e D
eman
d O
blig
atio
ns a
nd C
omm
erci
al P
aper
Is
sued
with
Ext
erna
l Liq
uidi
ty S
uppo
rt22
-Jan
-15
http
s://w
ww
.fitc
hrat
ings
.com
/cre
ditd
esk/
repo
rts/
repo
rt_f
ram
e.cf
m?r
pt_i
d=85
6189
http
s://w
ww
.fitc
hrat
ings
.com
/site
/fitc
h-ho
me/
pres
srel
ease
?id=
9761
75
Sec
tor
Spe
cific
Cov
ered
Bon
ds R
atin
g C
riter
ia -
Pub
lic S
ecto
r Li
quid
ity a
nd R
efin
anci
ng S
tres
s A
dden
dum
29-J
an-1
5ht
tps:
//ww
w.f
itchr
atin
gs.c
om/c
redi
tdes
k/re
port
s/re
port
_fra
me.
cfm
?rpt
_id=
8604
09ht
tps:
//ww
w.f
itchr
atin
gs.c
om/s
ite/f
itch-
hom
e/pr
essr
elea
se?i
d=97
8809
Mas
ter
Man
agin
g an
d D
evel
opin
g C
riter
ia a
nd M
odel
s30
-Jan
-15
http
s://w
ww
.fitc
hrat
ings
.com
/cre
ditd
esk/
repo
rts/
repo
rt_f
ram
e.cf
m?r
pt_i
d=86
1468
http
s://w
ww
.fitc
hrat
ings
.com
/site
/fitc
h-ho
me/
pres
srel
ease
?id=
9789
84S
ecto
r S
peci
ficR
atin
g N
on-F
inan
cial
Cor
pora
tes
Abo
ve th
e C
ount
ry C
eilin
g2-
Feb
-15
http
s://w
ww
.fitc
hrat
ings
.com
/cre
ditd
esk/
repo
rts/
repo
rt_f
ram
e.cf
m?r
pt_i
d=85
9368
http
s://w
ww
.fitc
hrat
ings
.com
/site
/fitc
h-ho
me/
pres
srel
ease
?id=
9790
21S
ecto
r S
peci
ficA
sset
Ana
lysi
s C
riter
ia f
or C
over
ed B
onds
of
Eur
opea
n P
ublic
Ent
ities
16-F
eb-1
5ht
tps:
//ww
w.f
itchr
atin
gs.c
om/c
redi
tdes
k/re
port
s/re
port
_fra
me.
cfm
?rpt
_id=
8614
60ht
tps:
//ww
w.f
itchr
atin
gs.c
om/s
ite/f
itch-
hom
e/pr
essr
elea
se?i
d=97
9815
Sec
tor
Spe
cific
Cov
ered
Bon
ds R
atin
g C
riter
ia –
Mor
tgag
e Li
quid
ity a
nd R
efin
anci
ng S
tres
s A
dden
dum
16-F
eb-1
5ht
tps:
//ww
w.f
itchr
atin
gs.c
om/c
redi
tdes
k/re
port
s/re
port
_fra
me.
cfm
?rpt
_id=
8618
06ht
tps:
//ww
w.f
itchr
atin
gs.c
om/s
ite/f
itch-
hom
e/pr
essr
elea
se?i
d=97
9827
Sec
tor
Spe
cific
EM
EA
Crit
eria
Add
endu
m -
Nor
way
20-F
eb-1
5ht
tps:
//ww
w.f
itchr
atin
gs.c
om/c
redi
tdes
k/re
port
s/re
port
_fra
me.
cfm
?rpt
_id=
8617
11ht
tps:
//ww
w.f
itchr
atin
gs.c
om/s
ite/f
itch-
hom
e/pr
essr
elea
se?i
d=98
0143
Cro
ss S
ecto
rC
riter
ia f
or S
over
eign
Ris
k in
Dev
elop
ed M
arke
ts f
or S
truc
ture
d F
inan
ce a
nd
Cov
ered
Bon
ds20
-Feb
-15
http
s://w
ww
.fitc
hrat
ings
.com
/cre
ditd
esk/
repo
rts/
repo
rt_f
ram
e.cf
m?r
pt_i
d=86
2115
http
s://w
ww
.fitc
hrat
ings
.com
/site
/fitc
h-ho
me/
pres
srel
ease
?id=
9801
08M
aste
rU
.S. M
unic
ipal
Str
uctu
red
Fin
ance
Crit
eria
23-F
eb-1
5ht
tps:
//ww
w.f
itchr
atin
gs.c
om/c
redi
tdes
k/re
port
s/re
port
_fra
me.
cfm
?rpt
_id=
8622
22ht
tps:
//ww
w.f
itchr
atin
gs.c
om/s
ite/f
itch-
hom
e/pr
essr
elea
se?i
d=98
0218
Sec
tor
Spe
cific
Crit
eria
for
Rat
ing
U.S
. Mor
tgag
e R
EIT
s an
d S
imila
r F
inan
ce C
ompa
nies
24
-Feb
-15
http
s://w
ww
.fitc
hrat
ings
.com
/cre
ditd
esk/
repo
rts/
repo
rt_f
ram
e.cf
m?r
pt_i
d=86
1835
http
s://w
ww
.fitc
hrat
ings
.com
/site
/fitc
h-ho
me/
pres
srel
ease
?id=
9802
45S
ecto
r S
peci
ficS
tate
Hou
sing
Fin
ance
Age
ncie
s G
ener
al O
blig
atio
n R
atin
g C
riter
ia26
-Feb
-15
http
s://w
ww
.fitc
hrat
ings
.com
/cre
ditd
esk/
repo
rts/
repo
rt_f
ram
e.cf
m?r
pt_i
d=86
2355
http
s://w
ww
.fitc
hrat
ings
.com
/site
/fitc
h-ho
me/
pres
srel
ease
?id=
9804
32S
ecto
r S
peci
ficR
atin
g of
Pub
lic-S
ecto
r E
ntiti
es -
Out
side
the
Uni
ted
Sta
tes
26-F
eb-1
5ht
tps:
//ww
w.f
itchr
atin
gs.c
om/c
redi
tdes
k/re
port
s/re
port
_fra
me.
cfm
?rpt
_id=
8624
48ht
tps:
//ww
w.f
itchr
atin
gs.c
om/s
ite/f
itch-
hom
e/pr
essr
elea
se?i
d=98
0387
Sec
tor
Spe
cific
Rec
over
y R
atin
gs a
nd N
otch
ing
Crit
eria
for
Util
ities
5-M
ar-1
5ht
tps:
//ww
w.f
itchr
atin
gs.c
om/c
redi
tdes
k/re
port
s/re
port
_fra
me.
cfm
?rpt
_id=
8632
98ht
tps:
//ww
w.f
itchr
atin
gs.c
om/s
ite/f
itch-
hom
e/pr
essr
elea
se?i
d=98
0805
Sec
tor
Spe
cific
Crit
eria
for
Rat
ing
Gra
nula
r C
orpo
rate
Bal
ance
-She
et S
ecur
itisa
tions
(S
ME
CLO
s)6-
Mar
-15
http
s://w
ww
.fitc
hrat
ings
.com
/cre
ditd
esk/
repo
rts/
repo
rt_f
ram
e.cf
m?r
pt_i
d=86
3220
http
s://w
ww
.fitc
hrat
ings
.com
/site
/fitc
h-ho
me/
pres
srel
ease
?id=
9808
87S
ecto
r S
peci
ficG
loba
l Rat
ing
Crit
eria
for
Sin
gle-
and
Mul
ti-N
ame
Cre
dit-
Link
ed N
otes
9-
Mar
-15
http
s://w
ww
.fitc
hrat
ings
.com
/cre
ditd
esk/
repo
rts/
repo
rt_f
ram
e.cf
m?r
pt_i
d=86
3276
http
s://w
ww
.fitc
hrat
ings
.com
/site
/fitc
h-ho
me/
pres
srel
ease
?id=
9809
95S
ecto
r S
peci
ficR
atin
g C
riter
ia f
or P
ortu
gues
e an
d S
pani
sh U
tility
Cre
dit R
ight
s S
ecur
itisa
tions
17-M
ar-1
5ht
tps:
//ww
w.f
itchr
atin
gs.c
om/c
redi
tdes
k/re
port
s/re
port
_fra
me.
cfm
?rpt
_id=
8635
32ht
tps:
//ww
w.f
itchr
atin
gs.c
om/s
ite/f
itch-
hom
e/pr
essr
elea
se?i
d=98
1445
Mas
ter
Glo
bal B
ank
Rat
ing
Crit
eria
20
-Mar
-15
http
s://w
ww
.fitc
hrat
ings
.com
/cre
ditd
esk/
repo
rts/
repo
rt_f
ram
e.cf
m?r
pt_i
d=86
3501
http
s://w
ww
.fitc
hrat
ings
.com
/site
/fitc
h-ho
me/
pres
srel
ease
?id=
9816
30M
aste
rG
loba
l Non
-Ban
k F
inan
cial
Inst
itutio
ns R
atin
g C
riter
ia20
-Mar
-15
http
s://w
ww
.fitc
hrat
ings
.com
/cre
ditd
esk/
repo
rts/
repo
rt_f
ram
e.cf
m?r
pt_i
d=86
3584
http
s://w
ww
.fitc
hrat
ings
.com
/site
/fitc
h-ho
me/
pres
srel
ease
?id=
9816
30S
ecto
r S
peci
ficF
inan
cial
Mar
ket I
nfra
stru
ctur
e C
ompa
ny R
atin
g C
riter
ia20
-Mar
-15
http
s://w
ww
.fitc
hrat
ings
.com
/cre
ditd
esk/
repo
rts/
repo
rt_f
ram
e.cf
m?r
pt_i
d=86
3634
http
s://w
ww
.fitc
hrat
ings
.com
/site
/fitc
h-ho
me/
pres
srel
ease
?id=
9816
30S
ecto
r S
peci
ficC
riter
ia f
or A
naly
zing
Lar
ge L
oans
in U
.S. C
omm
erci
al M
ortg
age
Tra
nsac
tions
20-M
ar-1
5ht
tps:
//ww
w.f
itchr
atin
gs.c
om/c
redi
tdes
k/re
port
s/re
port
_fra
me.
cfm
?rpt
_id=
8628
18ht
tps:
//ww
w.f
itchr
atin
gs.c
om/s
ite/f
itch-
hom
e/pr
essr
elea
se?i
d=98
1685
Sec
tor
Spe
cific
Crit
eria
for
Rat
ing
CM
BS
in A
sia-
Pac
ific
25-M
ar-1
5ht
tps:
//ww
w.f
itchr
atin
gs.c
om/c
redi
tdes
k/re
port
s/re
port
_fra
me.
cfm
?rpt
_id=
8637
42ht
tps:
//ww
w.f
itchr
atin
gs.c
om/s
ite/f
itch-
hom
e/pr
essr
elea
se?i
d=98
1864
Sec
tor
Spe
cific
Crit
eria
for
Ana
lyzi
ng U
.S. W
irele
ss T
ower
Tra
nsac
tions
27-M
ar-1
5ht
tps:
//ww
w.f
itchr
atin
gs.c
om/c
redi
tdes
k/re
port
s/re
port
_fra
me.
cfm
?rpt
_id=
8632
23ht
tps:
//ww
w.f
itchr
atin
gs.c
om/s
ite/f
itch-
hom
e/pr
essr
elea
se?i
d=98
2040
Sec
tor
Spe
cific
U.S
. RM
BS
Qua
lifie
d an
d N
on-Q
ualif
ied
Mor
tgag
e C
riter
ia31
-Mar
-15
http
s://w
ww
.fitc
hrat
ings
.com
/cre
ditd
esk/
repo
rts/
repo
rt_f
ram
e.cf
m?r
pt_i
d=86
3837
http
s://w
ww
.fitc
hrat
ings
.com
/site
/fitc
h-ho
me/
pres
srel
ease
?id=
9822
09S
ecto
r S
peci
ficE
ME
A R
MB
S C
ash
Flo
w A
naly
sis
Crit
eria
31-M
ar-1
5ht
tps:
//ww
w.f
itchr
atin
gs.c
om/c
redi
tdes
k/re
port
s/re
port
_fra
me.
cfm
?rpt
_id=
8642
65ht
tps:
//ww
w.f
itchr
atin
gs.c
om/s
ite/f
itch-
hom
e/pr
essr
elea
se?i
d=98
2222
Sec
tor
Spe
cific
EM
EA
RM
BS
Mas
ter
Rat
ing
Crit
eria
31-M
ar-1
5ht
tps:
//ww
w.f
itchr
atin
gs.c
om/c
redi
tdes
k/re
port
s/re
port
_fra
me.
cfm
?rpt
_id=
8642
73ht
tps:
//ww
w.f
itchr
atin
gs.c
om/s
ite/f
itch-
hom
e/pr
essr
elea
se?i
d=98
2222
Sec
tor
Spe
cific
EM
EA
Res
iden
tial M
ortg
age
Loss
Crit
eria
31-M
ar-1
5ht
tps:
//ww
w.f
itchr
atin
gs.c
om/c
redi
tdes
k/re
port
s/re
port
_fra
me.
cfm
?rpt
_id=
8642
66ht
tps:
//ww
w.f
itchr
atin
gs.c
om/s
ite/f
itch-
hom
e/pr
essr
elea
se?i
d=98
2222
Sec
tor
Spe
cific
Crit
eria
Add
endu
m: S
witz
erla
nd -
Res
iden
tial M
ortg
age
Loss
and
Cas
h F
low
A
ssum
ptio
ns31
-Mar
-15
http
s://w
ww
.fitc
hrat
ings
.com
/cre
ditd
esk/
repo
rts/
repo
rt_f
ram
e.cf
m?r
pt_i
d=86
4271
http
s://w
ww
.fitc
hrat
ings
.com
/site
/fitc
h-ho
me/
pres
srel
ease
?id=
9822
22
Sec
tor
Spe
cific
Crit
eria
Add
endu
m: F
ranc
e -
Res
iden
tial M
ortg
age
Loss
and
Cas
h F
low
A
ssum
ptio
ns31
-Mar
-15
http
s://w
ww
.fitc
hrat
ings
.com
/cre
ditd
esk/
repo
rts/
repo
rt_f
ram
e.cf
m?r
pt_i
d=86
4205
http
s://w
ww
.fitc
hrat
ings
.com
/site
/fitc
h-ho
me/
pres
srel
ease
?id=
9822
22
Sec
tor
Spe
cific
Crit
eria
Add
endu
m: G
reec
e -
Res
iden
tial M
ortg
age
Loss
and
Cas
h F
low
A
ssum
ptio
ns31
-Mar
-15
http
s://w
ww
.fitc
hrat
ings
.com
/cre
ditd
esk/
repo
rts/
repo
rt_f
ram
e.cf
m?r
pt_i
d=86
4274
http
s://w
ww
.fitc
hrat
ings
.com
/site
/fitc
h-ho
me/
pres
srel
ease
?id=
9822
22
Sec
tor
Spe
cific
Crit
eria
Add
endu
m: G
erm
any
- R
esid
entia
l Mor
tgag
e Lo
ss a
nd C
ash
Flo
w
Ass
umpt
ions
31-M
ar-1
5ht
tps:
//ww
w.f
itchr
atin
gs.c
om/c
redi
tdes
k/re
port
s/re
port
_fra
me.
cfm
?rpt
_id=
8642
06ht
tps:
//ww
w.f
itchr
atin
gs.c
om/s
ite/f
itch-
hom
e/pr
essr
elea
se?i
d=98
2222
Sec
tor
Spe
cific
Crit
eria
Add
endu
m: B
elgi
um -
Res
iden
tial M
ortg
age
Loss
and
Cas
h F
low
A
ssum
ptio
ns
31-M
ar-1
5ht
tps:
//ww
w.f
itchr
atin
gs.c
om/c
redi
tdes
k/re
port
s/re
port
_fra
me.
cfm
?rpt
_id=
8642
03ht
tps:
//ww
w.f
itchr
atin
gs.c
om/s
ite/f
itch-
hom
e/pr
essr
elea
se?i
d=98
2222
Mas
ter
Glo
bal S
truc
ture
d F
inan
ce R
atin
g C
riter
ia31
-Mar
-15
http
s://w
ww
.fitc
hrat
ings
.com
/cre
ditd
esk/
repo
rts/
repo
rt_f
ram
e.cf
m?r
pt_i
d=86
4268
http
s://w
ww
.fitc
hrat
ings
.com
/site
/fitc
h-ho
me/
pres
srel
ease
?id=
9822
22S
ecto
r S
peci
ficU
.S. R
MB
S C
ash
Flo
w A
naly
sis
Crit
eria
6-A
pr-1
5ht
tps:
//ww
w.f
itchr
atin
gs.c
om/c
redi
tdes
k/re
port
s/re
port
_fra
me.
cfm
?rpt
_id=
8639
73ht
tps:
//ww
w.f
itchr
atin
gs.c
om/s
ite/f
itch-
hom
e/pr
essr
elea
se?i
d=98
2484
Sec
tor
Spe
cific
Rat
ing
Crit
eria
for
U.S
. Aut
o Lo
an A
BS
10-A
pr-1
5ht
tps:
//ww
w.f
itchr
atin
gs.c
om/c
redi
tdes
k/re
port
s/re
port
_fra
me.
cfm
?rpt
_id=
8639
79ht
tps:
//ww
w.f
itchr
atin
gs.c
om/s
ite/f
itch-
hom
e/pr
essr
elea
se?i
d=98
2744
Sec
tor
Spe
cific
Gui
delin
es f
or R
atin
g T
ende
r O
ptio
n B
onds
10-A
pr-1
5ht
tps:
//ww
w.f
itchr
atin
gs.c
om/c
redi
tdes
k/re
port
s/re
port
_fra
me.
cfm
?rpt
_id=
8640
40ht
tps:
//ww
w.f
itchr
atin
gs.c
om/s
ite/f
itch-
hom
e/pr
essr
elea
se?i
d=98
2777
Cro
ss S
ecto
rC
anad
ian
Res
iden
tial M
ortg
age
Loan
Los
s M
odel
Crit
eria
16
-Apr
-15
http
s://w
ww
.fitc
hrat
ings
.com
/cre
ditd
esk/
repo
rts/
repo
rt_f
ram
e.cf
m?r
pt_i
d=86
4357
http
s://w
ww
.fitc
hrat
ings
.com
/site
/fitc
h-ho
me/
pres
srel
ease
?id=
9830
93S
ecto
r S
peci
ficS
urve
illan
ce C
riter
ia f
or T
rust
Pre
ferr
ed C
DO
s21
-Apr
-15
http
s://w
ww
.fitc
hrat
ings
.com
/cre
ditd
esk/
repo
rts/
repo
rt_f
ram
e.cf
m?r
pt_i
d=86
4352
http
s://w
ww
.fitc
hrat
ings
.com
/site
/fitc
h-ho
me/
pres
srel
ease
?id=
9833
31S
ecto
r S
peci
ficC
riter
ia f
or R
atin
g U
.S. A
uto
Leas
e A
BS
24-A
pr-1
5ht
tps:
//ww
w.f
itchr
atin
gs.c
om/c
redi
tdes
k/re
port
s/re
port
_fra
me.
cfm
?rpt
_id=
8645
00ht
tps:
//ww
w.f
itchr
atin
gs.c
om/s
ite/f
itch-
hom
e/pr
essr
elea
se?i
d=98
3571
Mas
ter
Glo
bal N
on-B
ank
Fin
anci
al In
stitu
tions
Rat
ing
Crit
eria
28-A
pr-1
5ht
tps:
//ww
w.f
itchr
atin
gs.c
om/c
redi
tdes
k/re
port
s/re
port
_fra
me.
cfm
?rpt
_id=
8653
51
Am
endm
ent:
Pag
e 73
of
this
crit
eria
rep
ort h
as b
een
amen
ded
to c
orre
ct th
e nu
mbe
r of
no
tche
s is
sue
leve
l rat
ings
are
red
uced
at ‘
RR
6’ to
two
notc
hes
from
thre
e no
tche
s.
Thi
s w
as a
typo
grap
hica
l err
or a
nd th
e am
endm
ent i
s co
nsis
tent
with
the
reco
very
ra
ting
fram
ewor
k ou
tline
d on
pag
e 10
of
this
crit
eria
rep
ort,
as w
ell a
s F
itch’
s G
loba
l B
ank
Rat
ing
Crit
eria
dat
ed M
arch
20,
201
5. A
t the
tim
e of
this
am
endm
ent,
no n
on-
bank
, non
-pol
icy
finan
cial
inst
itutio
n en
tity’
s is
sue
leve
l rat
ings
with
an
RR
6 w
ere
notc
hed
mor
e th
an tw
o no
tche
s, a
nd a
s re
sult,
ther
e w
ere
no r
atin
g im
plic
atio
ns a
s a
resu
lt of
this
am
endm
ent.
Sec
tor
Spe
cific
Crit
eria
for
the
Ana
lysi
s of
Com
mer
cial
Rea
l Est
ate
Loan
s S
ecur
ing
Cov
ered
Bon
ds12
-May
-15
http
s://w
ww
.fitc
hrat
ings
.com
/cre
ditd
esk/
repo
rts/
repo
rt_f
ram
e.cf
m?r
pt_i
d=86
5757
http
s://w
ww
.fitc
hrat
ings
.com
/site
/fitc
h-ho
me/
pres
srel
ease
?id=
9844
88M
aste
rE
xpos
ure
Dra
ft: I
nsur
ance
Not
chin
g C
riter
ia (
Pro
pose
d M
etho
dolo
gy C
hang
es)
12-M
ay-1
5ht
tps:
//ww
w.f
itchr
atin
gs.c
om/c
redi
tdes
k/re
port
s/re
port
_fra
me.
cfm
?rpt
_id=
8655
76ht
tps:
//ww
w.f
itchr
atin
gs.c
om/s
ite/f
itch-
hom
e/pr
essr
elea
se?i
d=98
4543
Sec
tor
Spe
cific
Rat
ing
Crit
eria
for
Ons
hore
Win
d F
arm
Pro
ject
s14
-May
-15
http
s://w
ww
.fitc
hrat
ings
.com
/cre
ditd
esk/
repo
rts/
repo
rt_f
ram
e.cf
m?r
pt_i
d=86
5785
http
s://w
ww
.fitc
hrat
ings
.com
/site
/fitc
h-ho
me/
pres
srel
ease
?id=
9846
62S
ecto
r S
peci
ficIn
tern
atio
nal L
ocal
and
Reg
iona
l Gov
ernm
ents
Rat
ing
Crit
eria
18-M
ay-1
5ht
tps:
//ww
w.f
itchr
atin
gs.c
om/c
redi
tdes
k/re
port
s/re
port
_fra
me.
cfm
?rpt
_id=
8652
54ht
tps:
//ww
w.f
itchr
atin
gs.c
om/s
ite/f
itch-
hom
e/pr
essr
elea
se?i
d=98
4831
Sec
tor
Spe
cific
U.S
. Pub
lic P
ower
Rat
ing
Crit
eria
18-M
ay-1
5ht
tps:
//ww
w.f
itchr
atin
gs.c
om/c
redi
tdes
k/re
port
s/re
port
_fra
me.
cfm
?rpt
_id=
8640
07ht
tps:
//ww
w.f
itchr
atin
gs.c
om/s
ite/f
itch-
hom
e/pr
essr
elea
se?i
d=98
4840
Sec
tor
Spe
cific
Glo
bal R
atin
g C
riter
ia f
or A
ircra
ft O
pera
ting
Leas
e A
BS
19-M
ay-1
5ht
tps:
//ww
w.f
itchr
atin
gs.c
om/c
redi
tdes
k/re
port
s/re
port
_fra
me.
cfm
?rpt
_id=
8646
05ht
tps:
//ww
w.f
itchr
atin
gs.c
om/s
ite/f
itch-
hom
e/pr
essr
elea
se?i
d=98
4922

Cri
teri
a T
ype
Cri
teri
a T
itle
Pu
blic
atio
n
Dat
eC
rite
ria
Rep
ort
Lin
kC
han
ges
Cro
ss S
ecto
rE
xpos
ure
Dra
ft: R
atin
g P
ublic
Sec
tor
Cou
nter
part
y O
blig
atio
ns in
PP
P T
rans
actio
ns20
-May
-15
http
s://w
ww
.fitc
hrat
ings
.com
/cre
ditd
esk/
repo
rts/
repo
rt_f
ram
e.cf
m?r
pt_i
d=86
5588
http
s://w
ww
.fitc
hrat
ings
.com
/site
/fitc
h-ho
me/
pres
srel
ease
?id=
9850
10
Sec
tor
Spe
cific
Cov
ered
Bon
ds R
atin
g C
riter
ia –
Mor
tgag
e Li
quid
ity a
nd R
efin
anci
ng S
tres
s A
dden
dum
20-M
ay-1
5ht
tps:
//ww
w.f
itchr
atin
gs.c
om/c
redi
tdes
k/re
port
s/re
port
_fra
me.
cfm
?rpt
_id=
8662
80ht
tps:
//ww
w.f
itchr
atin
gs.c
om/s
ite/f
itch-
hom
e/pr
essr
elea
se?i
d=98
5022
Sec
tor
Spe
cific
Rat
ing
Gui
delin
es f
or L
ette
r of
Cre
dit-
Sup
port
ed B
onds
and
Com
mer
cial
Pap
er21
-May
-15
http
s://w
ww
.fitc
hrat
ings
.com
/cre
ditd
esk/
repo
rts/
repo
rt_f
ram
e.cf
m?r
pt_i
d=86
6152
http
s://w
ww
.fitc
hrat
ings
.com
/site
/fitc
h-ho
me/
pres
srel
ease
?id=
9851
13
Sec
tor
Spe
cific
Rat
ing
Crit
eria
for
Sol
ar P
ower
Pro
ject
s (U
tility
-Sca
le P
hoto
volta
ic, C
once
ntra
ting
Pho
tovo
ltaic
and
Con
cent
ratin
g S
olar
Pow
er)
28-M
ay-1
5ht
tps:
//ww
w.f
itchr
atin
gs.c
om/c
redi
tdes
k/re
port
s/re
port
_fra
me.
cfm
?rpt
_id=
8660
77ht
tps:
//ww
w.f
itchr
atin
gs.c
om/s
ite/f
itch-
hom
e/pr
essr
elea
se?i
d=98
5453
Sec
tor
Spe
cific
Crit
eria
for
Ana
lyzi
ng M
ultib
orro
wer
U.S
. and
Can
adia
n C
omm
erci
al M
ortg
age
Tra
nsac
tions
28-M
ay-1
5ht
tps:
//ww
w.f
itchr
atin
gs.c
om/c
redi
tdes
k/re
port
s/re
port
_fra
me.
cfm
?rpt
_id=
8654
99ht
tps:
//ww
w.f
itchr
atin
gs.c
om/s
ite/f
itch-
hom
e/pr
essr
elea
se?i
d=98
5459
Mas
ter
Sup
rana
tiona
ls R
atin
g C
riter
ia29
-May
-15
http
s://w
ww
.fitc
hrat
ings
.com
/cre
ditd
esk/
repo
rts/
repo
rt_f
ram
e.cf
m?r
pt_i
d=86
6568
http
s://w
ww
.fitc
hrat
ings
.com
/site
/fitc
h-ho
me/
pres
srel
ease
?id=
9855
38S
ecto
r S
peci
ficC
riter
ia A
dden
dum
: Bel
gium
- R
esid
entia
l Mor
tgag
e A
ssum
ptio
ns29
-May
-15
http
s://w
ww
.fitc
hrat
ings
.com
/cre
ditd
esk/
repo
rts/
repo
rt_f
ram
e.cf
m?r
pt_i
d=86
6260
http
s://w
ww
.fitc
hrat
ings
.com
/site
/fitc
h-ho
me/
pres
srel
ease
?id=
9855
41S
ecto
r S
peci
ficU
.S. R
MB
S S
urve
illan
ce a
nd R
e-R
EM
IC C
riter
ia1-
Jun-
15ht
tps:
//ww
w.f
itchr
atin
gs.c
om/c
redi
tdes
k/re
port
s/re
port
_fra
me.
cfm
?rpt
_id=
8662
59ht
tps:
//ww
w.f
itchr
atin
gs.c
om/s
ite/f
itch-
hom
e/pr
essr
elea
se?i
d=98
5678
Sec
tor
Spe
cific
Sta
te H
ousi
ng F
inan
ce A
genc
ies:
MB
S P
ass-
Thr
ough
Bon
d R
atin
g C
riter
ia2-
Jun-
15ht
tps:
//ww
w.f
itchr
atin
gs.c
om/c
redi
tdes
k/re
port
s/re
port
_fra
me.
cfm
?rpt
_id=
8663
55ht
tps:
//ww
w.f
itchr
atin
gs.c
om/s
ite/f
itch-
hom
e/pr
essr
elea
se?i
d=98
5733
Cro
ss S
ecto
rF
itch'
s M
ortg
age
Cov
ered
Bon
d R
efin
anci
ng S
tres
ses
- E
xcel
File
3-Ju
n-15
http
s://w
ww
.fitc
hrat
ings
.com
/cre
ditd
esk/
repo
rts/
repo
rt_f
ram
e.cf
m?r
pt_i
d=86
6608
http
s://w
ww
.fitc
hrat
ings
.com
/site
/fitc
h-ho
me/
pres
srel
ease
?id=
9857
79S
ecto
r S
peci
ficC
riter
ia f
or R
atin
g U
.S. T
imes
hare
Loa
n A
BS
3-Ju
n-15
http
s://w
ww
.fitc
hrat
ings
.com
/cre
ditd
esk/
repo
rts/
repo
rt_f
ram
e.cf
m?r
pt_i
d=86
6653
http
s://w
ww
.fitc
hrat
ings
.com
/site
/fitc
h-ho
me/
pres
srel
ease
?id=
9858
32S
ecto
r S
peci
ficU
.S. N
onpr
ofit
Inst
itutio
ns R
atin
g C
riter
ia5-
Jun-
15ht
tps:
//ww
w.f
itchr
atin
gs.c
om/c
redi
tdes
k/re
port
s/re
port
_fra
me.
cfm
?rpt
_id=
8666
68ht
tps:
//ww
w.f
itchr
atin
gs.c
om/s
ite/f
itch-
hom
e/pr
essr
elea
se?i
d=98
5981
Sec
tor
Spe
cific
Crit
eria
Add
endu
m: F
ranc
e -
Res
iden
tial M
ortg
age
Ass
umpt
ions
8-Ju
n-15
http
s://w
ww
.fitc
hrat
ings
.com
/cre
ditd
esk/
repo
rts/
repo
rt_f
ram
e.cf
m?r
pt_i
d=86
6798
http
s://w
ww
.fitc
hrat
ings
.com
/site
/fitc
h-ho
me/
pres
srel
ease
?id=
9860
35S
ecto
r S
peci
ficC
riter
ia A
dden
dum
: Ita
ly -
Res
iden
tial M
ortg
age
Ass
umpt
ions
9-Ju
n-15
http
s://w
ww
.fitc
hrat
ings
.com
/cre
ditd
esk/
repo
rts/
repo
rt_f
ram
e.cf
m?r
pt_i
d=86
6516
http
s://w
ww
.fitc
hrat
ings
.com
/site
/fitc
h-ho
me/
pres
srel
ease
?id=
9860
76S
ecto
r S
peci
ficC
riter
ia A
dden
dum
: Por
tuga
l - R
esid
entia
l Mor
tgag
e A
ssum
ptio
ns9-
Jun-
15ht
tps:
//ww
w.f
itchr
atin
gs.c
om/c
redi
tdes
k/re
port
s/re
port
_fra
me.
cfm
?rpt
_id=
8667
61ht
tps:
//ww
w.f
itchr
atin
gs.c
om/s
ite/f
itch-
hom
e/pr
essr
elea
se?i
d=98
6074
Sec
tor
Spe
cific
U.S
. Non
prof
it H
ospi
tals
and
Hea
lth S
yste
ms
Rat
ing
Crit
eria
9-
Jun-
15ht
tps:
//ww
w.f
itchr
atin
gs.c
om/c
redi
tdes
k/re
port
s/re
port
_fra
me.
cfm
?rpt
_id=
8668
07ht
tps:
//ww
w.f
itchr
atin
gs.c
om/s
ite/f
itch-
hom
e/pr
essr
elea
se?i
d=98
6109
Sec
tor
Spe
cific
Crit
eria
Add
endu
m: I
rela
nd -
Res
iden
tial M
ortg
age
Ass
umpt
ions
10-J
un-1
5ht
tps:
//ww
w.f
itchr
atin
gs.c
om/c
redi
tdes
k/re
port
s/re
port
_fra
me.
cfm
?rpt
_id=
8668
18ht
tps:
//ww
w.f
itchr
atin
gs.c
om/s
ite/f
itch-
hom
e/pr
essr
elea
se?i
d=98
6141
Sec
tor
Spe
cific
Crit
eria
Add
endu
m: N
ethe
rland
s -
Res
iden
tial M
ortg
age
Ass
umpt
ions
10-J
un-1
5ht
tps:
//ww
w.f
itchr
atin
gs.c
om/c
redi
tdes
k/re
port
s/re
port
_fra
me.
cfm
?rpt
_id=
8669
09ht
tps:
//ww
w.f
itchr
atin
gs.c
om/s
ite/f
itch-
hom
e/pr
essr
elea
se?i
d=98
6147
Sec
tor
Spe
cific
Crit
eria
Add
endu
m: S
pain
- R
esid
entia
l Mor
tgag
e A
ssum
ptio
ns10
-Jun
-15
http
s://w
ww
.fitc
hrat
ings
.com
/cre
ditd
esk/
repo
rts/
repo
rt_f
ram
e.cf
m?r
pt_i
d=86
6760
http
s://w
ww
.fitc
hrat
ings
.com
/site
/fitc
h-ho
me/
pres
srel
ease
?id=
9861
53S
ecto
r S
peci
ficC
riter
ia A
dden
dum
: Ger
man
y -
Res
iden
tial M
ortg
age
Ass
umpt
ions
11-J
un-1
5ht
tps:
//ww
w.f
itchr
atin
gs.c
om/c
redi
tdes
k/re
port
s/re
port
_fra
me.
cfm
?rpt
_id=
8668
54ht
tps:
//ww
w.f
itchr
atin
gs.c
om/s
ite/f
itch-
hom
e/pr
essr
elea
se?i
d=98
6202
Sec
tor
Spe
cific
Crit
eria
Add
endu
m: U
K -
Res
iden
tial M
ortg
age
Ass
umpt
ions
11-J
un-1
5ht
tps:
//ww
w.f
itchr
atin
gs.c
om/c
redi
tdes
k/re
port
s/re
port
_fra
me.
cfm
?rpt
_id=
8668
56ht
tps:
//ww
w.f
itchr
atin
gs.c
om/s
ite/f
itch-
hom
e/pr
essr
elea
se?i
d=98
6243
Cro
ss S
ecto
rD
istr
esse
d D
ebt E
xcha
nge
12-J
un-1
5ht
tps:
//ww
w.f
itchr
atin
gs.c
om/c
redi
tdes
k/re
port
s/re
port
_fra
me.
cfm
?rpt
_id=
8670
91ht
tps:
//ww
w.f
itchr
atin
gs.c
om/s
ite/f
itch-
hom
e/pr
essr
elea
se?i
d=98
6284
Sec
tor
Spe
cific
Rec
over
y R
atin
gs a
nd N
otch
ing
Crit
eria
for
Non
-Fin
anci
al C
orpo
rate
Issu
ers
12-J
un-1
5ht
tps:
//ww
w.f
itchr
atin
gs.c
om/c
redi
tdes
k/re
port
s/re
port
_fra
me.
cfm
?rpt
_id=
8672
75A
dded
a s
ectio
n on
wid
enin
g no
tchi
ng f
or u
naff
ecte
d is
sues
in a
Dis
tres
sed
Deb
t E
xcha
nge.
Sec
tor
Spe
cific
U.S
. RM
BS
Mas
ter
Rat
ing
Crit
eria
12-J
un-1
5ht
tps:
//ww
w.f
itchr
atin
gs.c
om/c
redi
tdes
k/re
port
s/re
port
_fra
me.
cfm
?rpt
_id=
8666
07ht
tps:
//ww
w.f
itchr
atin
gs.c
om/s
ite/f
itch-
hom
e/pr
essr
elea
se?i
d=98
6340
Sec
tor
Spe
cific
Exp
osur
e D
raft
: Rat
ing
Crit
eria
for
Ava
ilabi
lity-
Bas
ed P
roje
cts
17
-Jun
-15
http
s://
ww
w.f
itchr
atin
gs.c
om/c
redi
tdes
k/re
port
s/re
port
_fra
me.
cfm
?rpt
_id=
8662
41ht
tps:
//ww
w.f
itchr
atin
gs.c
om/s
ite/f
itch-
hom
e/pr
essr
elea
se?i
d=98
6557
Sec
tor
Spe
cific
Crit
eria
Add
endu
m: S
witz
erla
nd19
-Jun
-15
http
s://w
ww
.fitc
hrat
ings
.com
/cre
ditd
esk/
repo
rts/
repo
rt_f
ram
e.cf
m?r
pt_i
d=86
7440
http
s://w
ww
.fitc
hrat
ings
.com
/site
/fitc
h-ho
me/
pres
srel
ease
?id=
9866
81S
ecto
r S
peci
ficU
.S. T
obac
co S
ettle
men
t AB
S C
riter
ia E
xpos
ure
Dra
ft22
-Jun
-15
http
s://w
ww
.fitc
hrat
ings
.com
/cre
ditd
esk/
repo
rts/
repo
rt_f
ram
e.cf
m?r
pt_i
d=86
7456
http
s://w
ww
.fitc
hrat
ings
.com
/site
/fitc
h-ho
me/
pres
srel
ease
?id=
9867
73S
ecto
r S
peci
ficA
PA
C R
esid
entia
l Mor
tgag
e C
riter
ia23
-Jun
-15
http
s://w
ww
.fitc
hrat
ings
.com
/cre
ditd
esk/
repo
rts/
repo
rt_f
ram
e.cf
m?r
pt_i
d=86
7437
http
s://w
ww
.fitc
hrat
ings
.com
/site
/fitc
h-ho
me/
pres
srel
ease
?id=
9868
03S
ecto
r S
peci
ficG
loba
l Crit
eria
for
Len
ders
' Mor
tgag
e In
sura
nce
in R
MB
S23
-Jun
-15
http
s://w
ww
.fitc
hrat
ings
.com
/cre
ditd
esk/
repo
rts/
repo
rt_f
ram
e.cf
m?r
pt_i
d=86
5195
http
s://w
ww
.fitc
hrat
ings
.com
/site
/fitc
h-ho
me/
pres
srel
ease
?id=
9868
06S
ecto
r S
peci
ficR
atin
g C
riter
ia f
or T
herm
al P
ower
Pro
ject
s23
-Jun
-15
http
s://w
ww
.fitc
hrat
ings
.com
/cre
ditd
esk/
repo
rts/
repo
rt_f
ram
e.cf
m?r
pt_i
d=86
7314
http
s://w
ww
.fitc
hrat
ings
.com
/site
/fitc
h-ho
me/
pres
srel
ease
?id=
9868
18S
ecto
r S
peci
ficC
riter
ia A
dden
dum
: Gre
ece
26-J
un-1
5ht
tps:
//ww
w.f
itchr
atin
gs.c
om/c
redi
tdes
k/re
port
s/re
port
_fra
me.
cfm
?rpt
_id=
8672
93ht
tps:
//ww
w.f
itchr
atin
gs.c
om/s
ite/f
itch-
hom
e/pr
essr
elea
se?i
d=98
7068
Sec
tor
Spe
cific
Glo
bal C
redi
t Car
d A
BS
Rat
ing
Crit
eria
26-J
un-1
5ht
tps:
//ww
w.f
itchr
atin
gs.c
om/c
redi
tdes
k/re
port
s/re
port
_fra
me.
cfm
?rpt
_id=
8674
82ht
tps:
//ww
w.f
itchr
atin
gs.c
om/s
ite/f
itch-
hom
e/pr
essr
elea
se?i
d=98
7092
Sec
tor
Spe
cific
Sta
te H
ousi
ng F
inan
cing
Age
ncie
s: S
ingl
e F
amily
Hou
sing
Crit
eria
1-Ju
l-15
http
s://w
ww
.fitc
hrat
ings
.com
/cre
ditd
esk/
repo
rts/
repo
rt_f
ram
e.cf
m?r
pt_i
d=86
7779
http
s://w
ww
.fitc
hrat
ings
.com
/site
/fitc
h-ho
me/
pres
srel
ease
?id=
9872
64C
ross
Sec
tor
Fitc
h's
Mor
tgag
e C
over
ed B
ond
Ref
inan
cing
Str
esse
s -
Exc
el F
ile3-
Jul-1
5ht
tps:
//ww
w.f
itchr
atin
gs.c
om/c
redi
tdes
k/re
port
s/re
port
_fra
me.
cfm
?rpt
_id=
8679
30ht
tps:
//ww
w.f
itchr
atin
gs.c
om/s
ite/f
itch-
hom
e/pr
essr
elea
se?i
d=98
7413
Sec
tor
Spe
cific
Cov
ered
Bon
ds R
atin
g C
riter
ia –
Mor
tgag
e Li
quid
ity a
nd R
efin
anci
ng S
tres
s A
dden
dum
6-Ju
l-15
http
s://w
ww
.fitc
hrat
ings
.com
/cre
ditd
esk/
repo
rts/
repo
rt_f
ram
e.cf
m?r
pt_i
d=86
7987
http
s://w
ww
.fitc
hrat
ings
.com
/site
/fitc
h-ho
me/
pres
srel
ease
?id=
9874
49M
aste
rG
loba
l Str
uctu
red
Fin
ance
Rat
ing
Crit
eria
6-Ju
l-15
http
s://w
ww
.fitc
hrat
ings
.com
/cre
ditd
esk/
repo
rts/
repo
rt_f
ram
e.cf
m?r
pt_i
d=86
7952
http
s://w
ww
.fitc
hrat
ings
.com
/site
/fitc
h-ho
me/
pres
srel
ease
?id=
9874
71S
ecto
r S
peci
ficR
atin
g C
riter
ia f
or M
ulti-
Issu
er C
edul
as H
ipot
ecar
ias
6-Ju
l-15
http
s://w
ww
.fitc
hrat
ings
.com
/cre
ditd
esk/
repo
rts/
repo
rt_f
ram
e.cf
m?r
pt_i
d=86
7877
http
s://w
ww
.fitc
hrat
ings
.com
/site
/fitc
h-ho
me/
pres
srel
ease
?id=
9874
60S
ecto
r S
peci
ficG
loba
l Sur
veill
ance
Crit
eria
for
Str
uctu
red
Fin
ance
CD
Os
13-J
ul-1
5ht
tps:
//ww
w.f
itchr
atin
gs.c
om/c
redi
tdes
k/re
port
s/re
port
_fra
me.
cfm
?rpt
_id=
8678
00ht
tps:
//ww
w.f
itchr
atin
gs.c
om/s
ite/f
itch-
hom
e/pr
essr
elea
se?i
d=98
7845
Mas
ter
Insu
ranc
e R
atin
g M
etho
dolo
gy14
-Jul
-15
http
s://w
ww
.fitc
hrat
ings
.com
/cre
ditd
esk/
repo
rts/
repo
rt_f
ram
e.cf
m?r
pt_i
d=86
8367
http
s://w
ww
.fitc
hrat
ings
.com
/site
/fitc
h-ho
me/
pres
srel
ease
?id=
9878
72
Cro
ss S
ecto
rC
riter
ia f
or R
atin
g C
urre
ncy
Sw
ap O
blig
atio
ns o
f an
SP
V in
Str
uctu
red
Fin
ance
T
rans
actio
ns a
nd C
over
ed B
onds
22
-Jul
-15
http
s://w
ww
.fitc
hrat
ings
.com
/cre
ditd
esk/
repo
rts/
repo
rt_f
ram
e.cf
m?r
pt_i
d=86
8763
http
s://w
ww
.fitc
hrat
ings
.com
/site
/fitc
h-ho
me/
pres
srel
ease
?id=
9883
26M
aste
rC
over
ed B
onds
Rat
ing
Crit
eria
23-J
ul-1
5ht
tps:
//ww
w.f
itchr
atin
gs.c
om/c
redi
tdes
k/re
port
s/re
port
_fra
me.
cfm
?rpt
_id=
8686
58ht
tps:
//ww
w.f
itchr
atin
gs.c
om/s
ite/f
itch-
hom
e/pr
essr
elea
se?i
d=98
8379
Sec
tor
Spe
cific
Sta
te H
ousi
ng F
inan
ce A
genc
ies:
Mor
tgag
e In
sura
nce
or G
uara
ntee
Fun
d P
rogr
am
Crit
eria
23-J
ul-1
5ht
tps:
//ww
w.f
itchr
atin
gs.c
om/c
redi
tdes
k/re
port
s/re
port
_fra
me.
cfm
?rpt
_id=
8686
81ht
tps:
//ww
w.f
itchr
atin
gs.c
om/s
ite/f
itch-
hom
e/pr
essr
elea
se?i
d=98
8413
Cro
ss S
ecto
rR
atin
g P
ublic
-Sec
tor
Cou
nter
part
y O
blig
atio
ns in
PP
P T
rans
actio
ns23
-Jul
-15
http
s://w
ww
.fitc
hrat
ings
.com
/cre
ditd
esk/
repo
rts/
repo
rt_f
ram
e.cf
m?r
pt_i
d=86
8665
http
s://w
ww
.fitc
hrat
ings
.com
/site
/fitc
h-ho
me/
pres
srel
ease
?id=
9884
12S
ecto
r S
peci
ficIn
sura
nce-
Link
ed S
ecur
ities
Met
hodo
logy
23-J
ul-1
5ht
tps:
//ww
w.f
itchr
atin
gs.c
om/c
redi
tdes
k/re
port
s/re
port
_fra
me.
cfm
?rpt
_id=
8683
33ht
tps:
//ww
w.f
itchr
atin
gs.c
om/s
ite/f
itch-
hom
e/pr
essr
elea
se?i
d=98
8445
Sec
tor
Spe
cific
Rat
ing
Crit
eria
for
Com
mer
cial
Mor
tgag
e-B
acke
d S
ecur
ities
(C
MB
S)
and
Loan
s in
E
ME
A30
-Jul
-15
http
s://w
ww
.fitc
hrat
ings
.com
/cre
ditd
esk/
repo
rts/
repo
rt_f
ram
e.cf
m?r
pt_i
d=86
8521
http
s://w
ww
.fitc
hrat
ings
.com
/site
/fitc
h-ho
me/
pres
srel
ease
?id=
9887
36S
ecto
r S
peci
ficG
loba
l Rat
ing
Crit
eria
for
CLO
s an
d C
orpo
rate
CD
Os
30-J
ul-1
5ht
tps:
//ww
w.f
itchr
atin
gs.c
om/c
redi
tdes
k/re
port
s/re
port
_fra
me.
cfm
?rpt
_id=
8689
08ht
tps:
//ww
w.f
itchr
atin
gs.c
om/s
ite/f
itch-
hom
e/pr
essr
elea
se?i
d=98
8746
Sec
tor
Spe
cific
RM
BS
Lat
in A
mer
ica
Crit
eria
Add
endu
m —
Mex
ico
30-J
ul-1
5ht
tps:
//ww
w.f
itchr
atin
gs.c
om/c
redi
tdes
k/re
port
s/re
port
_fra
me.
cfm
?rpt
_id=
8688
86ht
tps:
//ww
w.f
itchr
atin
gs.c
om/s
ite/f
itch-
hom
e/pr
essr
elea
se?i
d=98
8794
Sec
tor
Spe
cific
Exp
osur
e D
raft
: Rat
ing
Clo
sed-
End
Fun
d D
ebt a
nd P
refe
rred
Sto
ck30
-Jul
-15
http
s://w
ww
.fitc
hrat
ings
.com
/cre
ditd
esk/
repo
rts/
repo
rt_f
ram
e.cf
m?r
pt_i
d=86
8875
http
s://w
ww
.fitc
hrat
ings
.com
/site
/fitc
h-ho
me/
pres
srel
ease
?id=
9888
13S
ecto
r S
peci
ficU
.S. P
rivat
e S
tude
nt L
oan
AB
S C
riter
ia31
-Jul
-15
http
s://w
ww
.fitc
hrat
ings
.com
/cre
ditd
esk/
repo
rts/
repo
rt_f
ram
e.cf
m?r
pt_i
d=86
8836
http
s://w
ww
.fitc
hrat
ings
.com
/site
/fitc
h-ho
me/
pres
srel
ease
?id=
9888
88S
ecto
r S
peci
ficU
.S. R
MB
S L
oan
Loss
Mod
el C
riter
ia3-
Aug
-15
http
s://w
ww
.fitc
hrat
ings
.com
/cre
ditd
esk/
repo
rts/
repo
rt_f
ram
e.cf
m?r
pt_i
d=86
8923
http
s://w
ww
.fitc
hrat
ings
.com
/site
/fitc
h-ho
me/
pres
srel
ease
?id=
9889
45S
ecto
r S
peci
ficN
ot-f
or-P
rofit
Con
tinui
ng C
are
Ret
irem
ent C
omm
uniti
es R
atin
g C
riter
ia
4-A
ug-1
5ht
tps:
//ww
w.f
itchr
atin
gs.c
om/c
redi
tdes
k/re
port
s/re
port
_fra
me.
cfm
?rpt
_id=
8688
24ht
tps:
//ww
w.f
itchr
atin
gs.c
om/s
ite/f
itch-
hom
e/pr
essr
elea
se?i
d=98
8988
Sec
tor
Spe
cific
Sol
id W
aste
Rev
enue
Bon
d R
atin
g C
riter
ia4-
Aug
-15
http
s://w
ww
.fitc
hrat
ings
.com
/cre
ditd
esk/
repo
rts/
repo
rt_f
ram
e.cf
m?r
pt_i
d=86
8817
http
s://w
ww
.fitc
hrat
ings
.com
/site
/fitc
h-ho
me/
pres
srel
ease
?id=
9890
14S
ecto
r S
peci
ficP
aren
t and
Sub
sidi
ary
Rat
ing
Link
age
10-A
ug-1
5ht
tps:
//ww
w.f
itchr
atin
gs.c
om/c
redi
tdes
k/re
port
s/re
port
_fra
me.
cfm
?rpt
_id=
8693
63ht
tps:
//ww
w.f
itchr
atin
gs.c
om/s
ite/f
itch-
hom
e/pr
essr
elea
se?i
d=98
9238
Sec
tor
Spe
cific
Fut
ure
Flo
w S
ecur
itiza
tion
Rat
ing
Crit
eria
12
-Aug
-15
http
s://w
ww
.fitc
hrat
ings
.com
/cre
ditd
esk/
repo
rts/
repo
rt_f
ram
e.cf
m?r
pt_i
d=86
8191
http
s://w
ww
.fitc
hrat
ings
.com
/site
/fitc
h-ho
me/
pres
srel
ease
?id=
9893
90S
ecto
r S
peci
ficS
hort
-Ter
m R
atin
gs C
riter
ia f
or N
on-F
inan
cial
Cor
pora
tes
13-A
ug-1
5ht
tps:
//ww
w.f
itchr
atin
gs.c
om/c
redi
tdes
k/re
port
s/re
port
_fra
me.
cfm
?rpt
_id=
8692
59ht
tps:
//ww
w.f
itchr
atin
gs.c
om/s
ite/f
itch-
hom
e/pr
essr
elea
se?i
d=98
9411
Mas
ter
Cor
pora
te R
atin
g M
etho
dolo
gy -
Incl
udin
g S
hort
-Ter
m R
atin
gs a
nd P
aren
t and
S
ubsi
diar
y Li
nkag
e17
-Aug
-15
http
s://w
ww
.fitc
hrat
ings
.com
/cre
ditd
esk/
repo
rts/
repo
rt_f
ram
e.cf
m?r
pt_i
d=86
9362
http
s://w
ww
.fitc
hrat
ings
.com
/site
/fitc
h-ho
me/
pres
srel
ease
?id=
9895
30

Cri
teri
a T
ype
Cri
teri
a T
itle
Pu
blic
atio
n
Dat
eC
rite
ria
Rep
ort
Lin
kC
han
ges
Cro
ss S
ecto
rR
atin
g S
ukuk
18-A
ug-1
5ht
tps:
//ww
w.f
itchr
atin
gs.c
om/c
redi
tdes
k/re
port
s/re
port
_fra
me.
cfm
?rpt
_id=
8697
92ht
tps:
//ww
w.f
itchr
atin
gs.c
om/s
ite/f
itch-
hom
e/pr
essr
elea
se?i
d=98
9586
Cro
ss S
ecto
rC
ount
ry C
eilin
gs20
-Aug
-15
http
s://w
ww
.fitc
hrat
ings
.com
/cre
ditd
esk/
repo
rts/
repo
rt_f
ram
e.cf
m?r
pt_i
d=86
9287
http
s://w
ww
.fitc
hrat
ings
.com
/site
/fitc
h-ho
me/
pres
srel
ease
?id=
9897
09
Sec
tor
Spe
cific
Crit
eria
Add
endu
m: G
erm
any
- R
esid
entia
l Mor
tgag
e A
ssum
ptio
ns20
-Aug
-15
http
s://w
ww
.fitc
hrat
ings
.com
/cre
ditd
esk/
repo
rts/
repo
rt_f
ram
e.cf
m?r
pt_i
d=87
0082
Am
endm
ent:
Thi
s re
port
, orig
inal
ly p
ublis
hed
on 1
1 Ju
ne 2
015,
has
bee
n am
ende
d to
co
rrec
t the
app
licat
ion
of F
orec
losu
re F
requ
ency
ass
umpt
ions
for
Loa
ns in
Arr
ears
as
desc
ribed
on
page
4. A
ll ot
her
cont
ent i
s as
of
the
orig
inal
pub
licat
ion
date
.
Sec
tor
Spe
cific
Crit
eria
Add
endu
m: S
witz
erla
nd20
-Aug
-15
http
s://w
ww
.fitc
hrat
ings
.com
/cre
ditd
esk/
repo
rts/
repo
rt_f
ram
e.cf
m?r
pt_i
d=87
0083
Am
endm
ent:
Thi
s re
port
, orig
inal
ly p
ublis
hed
on 1
9 Ju
ne 2
015,
has
bee
n am
ende
d to
co
rrec
t the
app
licat
ion
of F
orec
losu
re F
requ
ency
ass
umpt
ions
for
Loa
ns in
Arr
ears
as
desc
ribed
on
page
7. A
ll ot
her
cont
ent i
s as
of
the
orig
inal
pub
licat
ion
date
.
Sec
tor
Spe
cific
Crit
eria
Add
endu
m: S
pain
- R
esid
entia
l Mor
tgag
e A
ssum
ptio
ns24
-Aug
-15
http
s://w
ww
.fitc
hrat
ings
.com
/cre
ditd
esk/
repo
rts/
repo
rt_f
ram
e.cf
m?r
pt_i
d=86
9918
Am
endm
ent:
Thi
s re
port
, orig
inal
ly p
ublis
hed
10 J
une,
201
5, h
as b
een
amen
ded
to
corr
ect a
n er
ror
in F
igur
e 7.
All
othe
r co
nten
t is
as o
f th
e or
igin
al p
ublic
atio
n da
te.
Sec
tor
Spe
cific
Crit
eria
for
Ana
lyzi
ng L
arge
Loa
ns in
U.S
. Com
mer
cial
Mor
tgag
e T
rans
actio
ns27
-Aug
-15
http
s://w
ww
.fitc
hrat
ings
.com
/cre
ditd
esk/
repo
rts/
repo
rt_f
ram
e.cf
m?r
pt_i
d=87
0009
http
s://w
ww
.fitc
hrat
ings
.com
/site
/fitc
h-ho
me/
pres
srel
ease
?id=
9900
22S
ecto
r S
peci
ficR
atin
g C
riter
ia f
or U
K W
hole
Bus
ines
s S
ecur
itisa
tions
28-A
ug-1
5ht
tps:
//ww
w.f
itchr
atin
gs.c
om/c
redi
tdes
k/re
port
s/re
port
_fra
me.
cfm
?rpt
_id=
8702
26ht
tps:
//ww
w.f
itchr
atin
gs.c
om/s
ite/f
itch-
hom
e/pr
essr
elea
se?i
d=99
0058
Sec
tor
Spe
cific
Crit
eria
Add
endu
m: N
ethe
rland
s -
Res
iden
tial M
ortg
age
Ass
umpt
ions
28-A
ug-1
5ht
tps:
//ww
w.f
itchr
atin
gs.c
om/c
redi
tdes
k/re
port
s/re
port
_fra
me.
cfm
?rpt
_id=
8701
75ht
tps:
//ww
w.f
itchr
atin
gs.c
om/s
ite/f
itch-
hom
e/pr
essr
elea
se?i
d=99
0092
Sec
tor
Spe
cific
EM
EA
RM
BS
Rat
ing
Crit
eria
28-A
ug-1
5ht
tps:
//ww
w.f
itchr
atin
gs.c
om/c
redi
tdes
k/re
port
s/re
port
_fra
me.
cfm
?rpt
_id=
8702
55ht
tps:
//ww
w.f
itchr
atin
gs.c
om/s
ite/f
itch-
hom
e/pr
essr
elea
se?i
d=99
0092
Sec
tor
Spe
cific
U.S
. Wat
er a
nd S
ewer
Rev
enue
Bon
d R
atin
g C
riter
ia3-
Sep
-15
http
s://w
ww
.fitc
hrat
ings
.com
/cre
ditd
esk/
repo
rts/
repo
rt_f
ram
e.cf
m?r
pt_i
d=86
9223
http
s://w
ww
.fitc
hrat
ings
.com
/site
/fitc
h-ho
me/
pres
srel
ease
?id=
9903
56C
ross
Sec
tor
Fitc
h's
Mor
tgag
e C
over
ed B
ond
Ref
inan
cing
Str
esse
s -
Exc
el F
ile7-
Sep
-15
http
s://w
ww
.fitc
hrat
ings
.com
/cre
ditd
esk/
repo
rts/
repo
rt_f
ram
e.cf
m?r
pt_i
d=87
0773
http
s://w
ww
.fitc
hrat
ings
.com
/site
/fitc
h-ho
me/
pres
srel
ease
?id=
9904
46S
ecto
r S
peci
ficG
loba
l Rat
ing
Crit
eria
for
Ren
tal F
leet
AB
S8-
Sep
-15
http
s://w
ww
.fitc
hrat
ings
.com
/cre
ditd
esk/
repo
rts/
repo
rt_f
ram
e.cf
m?r
pt_i
d=87
0244
http
s://w
ww
.fitc
hrat
ings
.com
/site
/fitc
h-ho
me/
pres
srel
ease
?id=
9904
94M
aste
rE
xpos
ure
Dra
ft: U
.S. T
ax-S
uppo
rted
Rat
ing
Crit
eria
10
-Sep
-15
http
s://w
ww
.fitc
hrat
ings
.com
/cre
ditd
esk/
repo
rts/
repo
rt_f
ram
e.cf
m?r
pt_i
d=86
9942
http
s://w
ww
.fitc
hrat
ings
.com
/site
/fitc
h-ho
me/
pres
srel
ease
?id=
9905
97M
aste
rR
atin
g C
lose
d-E
nd F
und
Deb
t and
Pre
ferr
ed S
tock
16-S
ep-1
5ht
tps:
//ww
w.f
itchr
atin
gs.c
om/c
redi
tdes
k/re
port
s/re
port
_fra
me.
cfm
?rpt
_id=
8711
19ht
tps:
//ww
w.f
itchr
atin
gs.c
om/s
ite/f
itch-
hom
e/pr
essr
elea
se?i
d=99
0863
Mas
ter
Insu
ranc
e R
atin
g M
etho
dolo
gy16
-Sep
-15
http
s://w
ww
.fitc
hrat
ings
.com
/cre
ditd
esk/
repo
rts/
repo
rt_f
ram
e.cf
m?r
pt_i
d=87
1172
http
s://w
ww
.fitc
hrat
ings
.com
/site
/fitc
h-ho
me/
pres
srel
ease
?id=
9908
85S
ecto
r S
peci
ficM
ilita
ry H
ousi
ng R
atin
g C
riter
ia18
-Sep
-15
http
s://w
ww
.fitc
hrat
ings
.com
/cre
ditd
esk/
repo
rts/
repo
rt_f
ram
e.cf
m?r
pt_i
d=87
0678
http
s://w
ww
.fitc
hrat
ings
.com
/site
/fitc
h-ho
me/
pres
srel
ease
?id=
9910
10S
ecto
r S
peci
ficE
xpos
ure
Dra
ft -
Crit
eria
Add
endu
m: U
K -
Res
iden
tial M
ortg
age
Ass
umpt
ions
22-S
ep-1
5ht
tps:
//w
ww
.fitc
hrat
ings
.com
/cre
ditd
esk/
repo
rts/
repo
rt_f
ram
e.cf
m?r
pt_i
d=87
1376
http
s://w
ww
.fitc
hrat
ings
.com
/site
/fitc
h-ho
me/
pres
srel
ease
?id=
9911
46
Sec
tor
Spe
cific
Cov
ered
Bon
ds R
atin
g C
riter
ia –
Mor
tgag
e Li
quid
ity a
nd R
efin
anci
ng S
tres
s A
dden
dum
23-S
ep-1
5ht
tps:
//ww
w.f
itchr
atin
gs.c
om/c
redi
tdes
k/re
port
s/re
port
_fra
me.
cfm
?rpt
_id=
8713
31ht
tps:
//ww
w.f
itchr
atin
gs.c
om/s
ite/f
itch-
hom
e/pr
essr
elea
se?i
d=99
1182
Mas
ter
Rat
ing
Crit
eria
for
Infr
astr
uctu
re a
nd P
roje
ct F
inan
ce28
-Sep
-15
http
s://w
ww
.fitc
hrat
ings
.com
/cre
ditd
esk/
repo
rts/
repo
rt_f
ram
e.cf
m?r
pt_i
d=87
0967
http
s://w
ww
.fitc
hrat
ings
.com
/site
/fitc
h-ho
me/
pres
srel
ease
?id=
9914
14S
ecto
r S
peci
ficR
atin
g C
riter
ia f
or T
oll R
oads
, Brid
ges
and
Tun
nels
29-S
ep-1
5ht
tps:
//ww
w.f
itchr
atin
gs.c
om/c
redi
tdes
k/re
port
s/re
port
_fra
me.
cfm
?rpt
_id=
8701
70ht
tps:
//ww
w.f
itchr
atin
gs.c
om/s
ite/f
itch-
hom
e/pr
essr
elea
se?i
d=99
1491
Sec
tor
Spe
cific
U.S
. RM
BS
Mas
ter
Rat
ing
Crit
eria
1-O
ct-1
5ht
tps:
//ww
w.f
itchr
atin
gs.c
om/c
redi
tdes
k/re
port
s/re
port
_fra
me.
cfm
?rpt
_id=
8704
27ht
tps:
//ww
w.f
itchr
atin
gs.c
om/s
ite/f
itch-
hom
e/pr
essr
elea
se?i
d=99
1650
Sec
tor
Spe
cific
Glo
bal R
atin
g C
riter
ia f
or T
rade
Rec
eiva
bles
Sec
uriti
satio
ns5-
Oct
-15
http
s://w
ww
.fitc
hrat
ings
.com
/cre
ditd
esk/
repo
rts/
repo
rt_f
ram
e.cf
m?r
pt_i
d=87
1449
http
s://w
ww
.fitc
hrat
ings
.com
/site
/fitc
h-ho
me/
pres
srel
ease
?id=
9917
84S
ecto
r S
peci
ficU
.S. T
obac
co S
ettle
men
t AB
S C
riter
ia5-
Oct
-15
http
s://w
ww
.fitc
hrat
ings
.com
/cre
ditd
esk/
repo
rts/
repo
rt_f
ram
e.cf
m?r
pt_i
d=87
1847
http
s://w
ww
.fitc
hrat
ings
.com
/site
/fitc
h-ho
me/
pres
srel
ease
?id=
9918
31
Sec
tor
Spe
cific
Exp
osur
e D
raft
- C
riter
ia A
dden
dum
: UK
Res
iden
tial M
ortg
age
Ass
umpt
ions
-
Am
endm
ent
8-O
ct-1
5ht
tps:
//ww
w.f
itchr
atin
gs.c
om/c
redi
tdes
k/re
port
s/re
port
_fra
me.
cfm
?rpt
_id=
8722
88ht
tps:
//ww
w.f
itchr
atin
gs.c
om/s
ite/f
itch-
hom
e/pr
essr
elea
se?i
d=99
2009
Sec
tor
Spe
cific
Rat
ing
Airc
raft
Enh
ance
d E
quip
men
t Tru
st C
ertif
icat
es13
-Oct
-15
http
s://w
ww
.fitc
hrat
ings
.com
/cre
ditd
esk/
repo
rts/
repo
rt_f
ram
e.cf
m?r
pt_i
d=87
1079
http
s://w
ww
.fitc
hrat
ings
.com
/site
/fitc
h-ho
me/
pres
srel
ease
?id=
9921
93S
ecto
r S
peci
ficR
atin
g C
riter
ia f
or A
vaila
bilit
y-B
ased
Pro
ject
s14
-Oct
-15
http
s://
ww
w.f
itchr
atin
gs.c
om/c
redi
tdes
k/re
port
s/re
port
_fra
me.
cfm
?rpt
_id=
8710
36ht
tps:
//ww
w.f
itchr
atin
gs.c
om/s
ite/f
itch-
hom
e/pr
essr
elea
se?i
d=99
2267
Sec
tor
Spe
cific
Rat
ing
Crit
eria
for
U.S
. Aut
o Lo
an A
BS
15-O
ct-1
5ht
tps:
//ww
w.f
itchr
atin
gs.c
om/c
redi
tdes
k/re
port
s/re
port
_fra
me.
cfm
?rpt
_id=
8720
46ht
tps:
//ww
w.f
itchr
atin
gs.c
om/s
ite/f
itch-
hom
e/pr
essr
elea
se?i
d=99
2385
Sec
tor
Spe
cific
Crit
eria
for
Rat
ing
U.S
. Aut
o Le
ase
AB
S19
-Oct
-15
http
s://w
ww
.fitc
hrat
ings
.com
/cre
ditd
esk/
repo
rts/
repo
rt_f
ram
e.cf
m?r
pt_i
d=87
2539
http
s://w
ww
.fitc
hrat
ings
.com
/site
/fitc
h-ho
me/
pres
srel
ease
?id=
9925
60S
ecto
r S
peci
ficR
atin
g C
riter
ia f
or P
orts
20-O
ct-1
5ht
tps:
//ww
w.f
itchr
atin
gs.c
om/c
redi
tdes
k/re
port
s/re
port
_fra
me.
cfm
?rpt
_id=
8727
25ht
tps:
//ww
w.f
itchr
atin
gs.c
om/s
ite/f
itch-
hom
e/pr
essr
elea
se?i
d=99
2586
Sec
tor
Spe
cific
Sta
te R
evol
ving
Fun
d an
d Le
vera
ged
Mun
icip
al L
oan
Poo
l Crit
eria
29-O
ct-1
5ht
tps:
//ww
w.f
itchr
atin
gs.c
om/c
redi
tdes
k/re
port
s/re
port
_fra
me.
cfm
?rpt
_id=
8723
07ht
tps:
//ww
w.f
itchr
atin
gs.c
om/s
ite/f
itch-
hom
e/pr
essr
elea
se?i
d=99
3134
Sec
tor
Spe
cific
Cha
rter
Sch
ool R
atin
g C
riter
ia5-
Nov
-15
http
s://w
ww
.fitc
hrat
ings
.com
/cre
ditd
esk/
repo
rts/
repo
rt_f
ram
e.cf
m?r
pt_i
d=87
2774
http
s://w
ww
.fitc
hrat
ings
.com
/site
/fitc
h-ho
me/
pres
srel
ease
?id=
9934
85C
ross
Sec
tor
Crit
eria
for
Eva
luat
ing
Thi
rd-P
arty
Par
tial C
redi
t Gua
rant
ees
10-N
ov-1
5ht
tps:
//ww
w.f
itchr
atin
gs.c
om/c
redi
tdes
k/re
port
s/re
port
_fra
me.
cfm
?rpt
_id=
8722
91ht
tps:
//ww
w.f
itchr
atin
gs.c
om/s
ite/f
itch-
hom
e/pr
essr
elea
se?i
d=99
3731
Sec
tor
Spe
cific
Glo
bal R
atin
g C
riter
ia f
or C
LOs
and
Cor
pora
te C
DO
s12
-Nov
-15
http
s://w
ww
.fitc
hrat
ings
.com
/cre
ditd
esk/
repo
rts/
repo
rt_f
ram
e.cf
m?r
pt_i
d=87
3664
Am
endm
ent:
Thi
s re
port
, orig
inal
ly p
ublis
hed
on 3
0 Ju
ly, 2
015,
has
bee
n am
ende
d to
co
rrec
t an
erro
r re
gard
ing
asse
t rep
aym
ent a
ssum
ptio
ns o
n pa
ge 1
8. A
ll ot
her
cont
ent
is a
s of
the
orig
inal
pub
licat
ion
date
.
Sec
tor
Spe
cific
U.S
. and
Can
adia
n F
ixed
-Rat
e M
ultib
orro
wer
CM
BS
Sur
veill
ance
and
U.S
. Re-
RE
MIC
Crit
eria
13-N
ov-1
5ht
tps:
//ww
w.f
itchr
atin
gs.c
om/c
redi
tdes
k/re
port
s/re
port
_fra
me.
cfm
?rpt
_id=
8733
95ht
tps:
//ww
w.f
itchr
atin
gs.c
om/s
ite/f
itch-
hom
e/pr
essr
elea
se?i
d=99
4032
Sec
tor
Spe
cific
Exp
osur
e D
raft
: Tre
atm
ent o
f R
esid
ual F
orei
gn E
xcha
nge
Exp
osur
es in
Cov
ered
B
onds
17-N
ov-1
5ht
tps:
//ww
w.f
itchr
atin
gs.c
om/c
redi
tdes
k/re
port
s/re
port
_fra
me.
cfm
?rpt
_id=
8723
12ht
tps:
//ww
w.f
itchr
atin
gs.c
om/s
ite/f
itch-
hom
e/pr
essr
elea
se?i
d=99
4223
Sec
tor
Spe
cific
Sur
veill
ance
Crit
eria
for
U.S
. CR
EL
CD
Os
17-N
ov-1
5ht
tps:
//ww
w.f
itchr
atin
gs.c
om/c
redi
tdes
k/re
port
s/re
port
_fra
me.
cfm
?rpt
_id=
8732
75ht
tps:
//ww
w.f
itchr
atin
gs.c
om/s
ite/f
itch-
hom
e/pr
essr
elea
se?i
d=99
4237
Cro
ss S
ecto
rR
atin
g U
.S. P
ublic
Fin
ance
Sho
rt-T
erm
Deb
t17
-Nov
-15
http
s://w
ww
.fitc
hrat
ings
.com
/cre
ditd
esk/
repo
rts/
repo
rt_f
ram
e.cf
m?r
pt_i
d=87
3508
http
s://w
ww
.fitc
hrat
ings
.com
/site
/fitc
h-ho
me/
pres
srel
ease
?id=
9942
59
Sec
tor
Spe
cific
Exp
osur
e D
raft
: Rat
ing
U.S
. Fed
eral
Fam
ily E
duca
tion
Loan
Pro
gram
Stu
dent
Loa
n A
BS
Crit
eria
18-N
ov-1
5ht
tps:
//ww
w.f
itchr
atin
gs.c
om/c
redi
tdes
k/re
port
s/re
port
_fra
me.
cfm
?rpt
_id=
8727
55ht
tps:
//ww
w.f
itchr
atin
gs.c
om/s
ite/f
itch-
hom
e/pr
essr
elea
se?i
d=99
4310
Sec
tor
Spe
cific
Crit
eria
for
Ana
lyzi
ng U
.S. W
irele
ss T
ower
Tra
nsac
tions
19-N
ov-1
5ht
tps:
//ww
w.f
itchr
atin
gs.c
om/c
redi
tdes
k/re
port
s/re
port
_fra
me.
cfm
?rpt
_id=
8739
61ht
tps:
//ww
w.f
itchr
atin
gs.c
om/s
ite/f
itch-
hom
e/pr
essr
elea
se?i
d=99
4442
Cro
ss S
ecto
rF
itch'
s M
ortg
age
Cov
ered
Bon
d R
efin
anci
ng S
tres
ses
- E
xcel
File
23-N
ov-1
5ht
tps:
//ww
w.f
itchr
atin
gs.c
om/c
redi
tdes
k/re
port
s/re
port
_fra
me.
cfm
?rpt
_id=
8741
01ht
tps:
//ww
w.f
itchr
atin
gs.c
om/s
ite/f
itch-
hom
e/pr
essr
elea
se?i
d=99
5154
Sec
tor
Spe
cific
Rat
ing
Crit
eria
for
Com
mer
cial
Mor
tgag
e-B
acke
d S
ecur
ities
(C
MB
S)
and
Loan
s in
E
ME
A26
-Nov
-15
http
s://w
ww
.fitc
hrat
ings
.com
/cre
ditd
esk/
repo
rts/
repo
rt_f
ram
e.cf
m?r
pt_i
d=87
4245
Am
endm
ent:
Thi
s re
port
, orig
inal
ly p
ublis
hed
on 3
0 Ju
ly 2
015,
is b
eing
rep
ublis
hed
to
corr
ect p
rese
ntat
ion
erro
rs in
the
guid
ance
ass
umpt
ion
rang
es o
n pa
ges
44 a
nd 4
5. A
ll ot
her
cont
ent i
s as
of
the
orig
inal
pub
licat
ion
date
.S
ecto
r S
peci
ficLe
vera
ging
Fed
eral
Tra
nspo
rtat
ion
Gra
nts
(Rat
ing
Cri
teria
for
GA
RV
EE
Bon
ds)
1-D
ec-1
5ht
tps:
//ww
w.f
itchr
atin
gs.c
om/c
redi
tdes
k/re
port
s/re
port
_fra
me.
cfm
?rpt
_id=
8740
11ht
tps:
//ww
w.f
itchr
atin
gs.c
om/s
ite/f
itch-
hom
e/pr
essr
elea
se?i
d=99
5670
Sec
tor
Spe
cific
Crit
eria
for
Ana
lyzi
ng M
ultib
orro
wer
U.S
. and
Can
adia
n C
omm
erci
al M
ortg
age
Tra
nsac
tions
1-D
ec-1
5ht
tps:
//ww
w.f
itchr
atin
gs.c
om/c
redi
tdes
k/re
port
s/re
port
_fra
me.
cfm
?rpt
_id=
8747
95ht
tps:
//ww
w.f
itchr
atin
gs.c
om/s
ite/f
itch-
hom
e/pr
essr
elea
se?i
d=99
5726
Sec
tor
Spe
cific
Crit
eria
for
Rat
ing
Pre
paid
Ene
rgy
Tra
nsac
tions
2-D
ec-1
5ht
tps:
//ww
w.f
itchr
atin
gs.c
om/c
redi
tdes
k/re
port
s/re
port
_fra
me.
cfm
?rpt
_id=
8743
66ht
tps:
//ww
w.f
itchr
atin
gs.c
om/s
ite/f
itch-
hom
e/pr
essr
elea
se?i
d=99
5807
Sec
tor
Spe
cific
Rec
over
y R
atin
gs a
nd N
otch
ing
Crit
eria
for
Equ
ity R
EIT
s3-
Dec
-15
http
s://w
ww
.fitc
hrat
ings
.com
/cre
ditd
esk/
repo
rts/
repo
rt_f
ram
e.cf
m?r
pt_i
d=87
4214
http
s://w
ww
.fitc
hrat
ings
.com
/site
/fitc
h-ho
me/
pres
srel
ease
?id=
9958
61S
ecto
r S
peci
ficG
loba
l Con
sum
er A
BS
Rat
ing
Crit
eria
3-D
ec-1
5ht
tps:
//ww
w.f
itchr
atin
gs.c
om/c
redi
tdes
k/re
port
s/re
port
_fra
me.
cfm
?rpt
_id=
8741
05ht
tps:
//ww
w.f
itchr
atin
gs.c
om/s
ite/f
itch-
hom
e/pr
essr
elea
se?i
d=99
5894
Sec
tor
Spe
cific
Glo
bal C
onsu
mer
AB
S R
atin
g C
riter
ia -
EM
EA
Res
idua
l Val
ue A
dden
dum
3-D
ec-1
5ht
tps:
//ww
w.f
itchr
atin
gs.c
om/c
redi
tdes
k/re
port
s/re
port
_fra
me.
cfm
?rpt
_id=
8741
28ht
tps:
//ww
w.f
itchr
atin
gs.c
om/s
ite/f
itch-
hom
e/pr
essr
elea
se?i
d=99
5894
Sec
tor
Spe
cific
Crit
eria
for
Rat
ing
U.S
. Equ
ipm
ent L
ease
and
Loa
n A
BS
3-D
ec-1
5ht
tps:
//ww
w.f
itchr
atin
gs.c
om/c
redi
tdes
k/re
port
s/re
port
_fra
me.
cfm
?rpt
_id=
8741
38ht
tps:
//ww
w.f
itchr
atin
gs.c
om/s
ite/f
itch-
hom
e/pr
essr
elea
se?i
d=99
5933
Sec
tor
Spe
cific
Not
-for
-Pro
fit H
ospi
tals
Rat
ing
Crit
eria
4-D
ec-1
5ht
tps:
//ww
w.f
itchr
atin
gs.c
om/c
redi
tdes
k/re
port
s/re
port
_fra
me.
cfm
?rpt
_id=
8741
20ht
tps:
//ww
w.f
itchr
atin
gs.c
om/s
ite/f
itch-
hom
e/pr
essr
elea
se?i
d=99
5986

Cri
teri
a T
ype
Cri
teri
a T
itle
Pu
blic
atio
n
Dat
eC
rite
ria
Rep
ort
Lin
kC
han
ges
Sec
tor
Spe
cific
Exp
osur
e D
raft
: Rat
ing
U.S
. Fed
eral
Fam
ily E
duca
tion
Loan
Pro
gram
Stu
dent
Loa
n A
BS
Crit
eria
4-D
ec-1
5ht
tps:
//ww
w.f
itchr
atin
gs.c
om/c
redi
tdes
k/re
port
s/re
port
_fra
me.
cfm
?rpt
_id=
8749
71ht
tps:
//ww
w.f
itchr
atin
gs.c
om/s
ite/f
itch-
hom
e/pr
essr
elea
se?i
d=99
6025
Sec
tor
Spe
cific
Rec
over
y R
atin
gs a
nd N
otch
ing
Crit
eria
for
Non
-Fin
anci
al C
orpo
rate
Issu
ers
7-D
ec-1
5ht
tps:
//ww
w.f
itchr
atin
gs.c
om/c
redi
tdes
k/re
port
s/re
port
_fra
me.
cfm
?rpt
_id=
8735
04ht
tps:
//ww
w.f
itchr
atin
gs.c
om/s
ite/f
itch-
hom
e/pr
essr
elea
se?i
d=99
6091
Cro
ss S
ecto
rE
valu
atin
g C
orpo
rate
Gov
erna
nce
7-D
ec-1
5ht
tps:
//ww
w.f
itchr
atin
gs.c
om/c
redi
tdes
k/re
port
s/re
port
_fra
me.
cfm
?rpt
_id=
8747
84ht
tps:
//ww
w.f
itchr
atin
gs.c
om/s
ite/f
itch-
hom
e/pr
essr
elea
se?i
d=99
6109
Mas
ter
Glo
bal M
oney
Mar
ket F
und
Rat
ing
Crit
eria
10-D
ec-1
5ht
tps:
//ww
w.f
itchr
atin
gs.c
om/c
redi
tdes
k/re
port
s/re
port
_fra
me.
cfm
?rpt
_id=
8745
65ht
tps:
//ww
w.f
itchr
atin
gs.c
om/s
ite/f
itch-
hom
e/pr
essr
elea
se?i
d=99
6440
Sec
tor
Spe
cific
Crit
eria
for
the
Ana
lysi
s of
Com
mer
cial
Rea
l Est
ate
Loan
s S
ecur
ing
Cov
ered
Bon
ds10
-Dec
-15
http
s://w
ww
.fitc
hrat
ings
.com
/cre
ditd
esk/
repo
rts/
repo
rt_f
ram
e.cf
m?r
pt_i
d=87
4686
http
s://w
ww
.fitc
hrat
ings
.com
/site
/fitc
h-ho
me/
pres
srel
ease
?id=
9964
50S
ecto
r S
peci
ficC
riter
ia A
dden
dum
: Den
mar
k11
-Dec
-15
http
s://w
ww
.fitc
hrat
ings
.com
/cre
ditd
esk/
repo
rts/
repo
rt_f
ram
e.cf
m?r
pt_i
d=87
5209
http
s://w
ww
.fitc
hrat
ings
.com
/site
/fitc
h-ho
me/
pres
srel
ease
?id=
9965
62S
ecto
r S
peci
ficE
ME
A R
MB
S R
atin
g C
riter
ia16
-Dec
-15
http
s://w
ww
.fitc
hrat
ings
.com
/cre
ditd
esk/
repo
rts/
repo
rt_f
ram
e.cf
m?r
pt_i
d=87
5102
http
s://w
ww
.fitc
hrat
ings
.com
/site
/fitc
h-ho
me/
pres
srel
ease
?id=
9968
30C
ross
Sec
tor
Exp
osur
e D
raft
: Cou
ntry
Spe
cific
Tre
atm
ent o
f R
ecov
ery
Rat
ings
16-D
ec-1
5ht
tps:
//ww
w.f
itchr
atin
gs.c
om/c
redi
tdes
k/re
port
s/re
port
_fra
me.
cfm
?rpt
_id=
8674
52ht
tps:
//ww
w.f
itchr
atin
gs.c
om/s
ite/f
itch-
hom
e/pr
essr
elea
se?i
d=99
6831
Sec
tor
Spe
cific
Crit
eria
Add
endu
m: U
K R
esid
entia
l Mor
tgag
e A
ssum
ptio
ns16
-Dec
-15
http
s://w
ww
.fitc
hrat
ings
.com
/cre
ditd
esk/
repo
rts/
repo
rt_f
ram
e.cf
m?r
pt_i
d=87
5200
http
s://w
ww
.fitc
hrat
ings
.com
/site
/fitc
h-ho
me/
pres
srel
ease
?id=
9968
35
Cro
ss S
ecto
rE
xpos
ure
Dra
ft: T
reat
men
t and
Not
chin
g of
Hyb
rids
in N
on-F
inan
cial
Cor
pora
te a
nd
RE
IT A
naly
sis
16-D
ec-1
5ht
tps:
//ww
w.f
itchr
atin
gs.c
om/c
redi
tdes
k/re
port
s/re
port
_fra
me.
cfm
?rpt
_id=
8741
34ht
tps:
//ww
w.f
itchr
atin
gs.c
om/s
ite/f
itch-
hom
e/pr
essr
elea
se?i
d=99
6845
Cro
ss S
ecto
rC
riter
ia f
or S
ervi
cing
Con
tinui
ty R
isk
in S
truc
ture
d F
inan
ce17
-Dec
-15
http
s://w
ww
.fitc
hrat
ings
.com
/cre
ditd
esk/
repo
rts/
repo
rt_f
ram
e.cf
m?r
pt_i
d=87
5586
http
s://w
ww
.fitc
hrat
ings
.com
/site
/fitc
h-ho
me/
pres
srel
ease
?id=
9969
04S
ecto
r S
peci
ficLa
tin A
mer
ica
RM
BS
Rat
ing
Crit
eria
17-D
ec-1
5ht
tps:
//ww
w.f
itchr
atin
gs.c
om/c
redi
tdes
k/re
port
s/re
port
_fra
me.
cfm
?rpt
_id=
8749
06ht
tps:
//ww
w.f
itchr
atin
gs.c
om/s
ite/f
itch-
hom
e/pr
essr
elea
se?i
d=99
6962
Sec
tor
Spe
cific
Crit
eria
Add
endu
m: N
ethe
rland
s -
Res
iden
tial M
ortg
age
Ass
umpt
ions
- A
men
ded
18-D
ec-1
5ht
tps:
//w
ww
.fitc
hrat
ings
.com
/cre
ditd
esk/
repo
rts/
repo
rt_f
ram
e.cf
m?r
pt_i
d=87
5739
Am
endm
ent:
Thi
s re
port
, orig
inal
ly p
ublis
hed
on 1
0 Ju
ne 2
015
and
amen
ded
on 2
8 A
ugus
t 201
5 ha
s be
en u
pdat
ed to
pro
vide
add
ition
al in
form
atio
n on
Fitc
h’s
appr
oach
re
gard
ing
NH
G p
ayou
t cal
cula
tions
as
spec
ified
on
page
6. A
ll ot
her
cont
ent i
s as
of
the
orig
inal
pub
licat
ion
date
.
Sec
tor
Spe
cific
U.S
. RM
BS
Sea
sone
d an
d R
e-P
erfo
rmin
g Lo
an C
riter
ia18
-Dec
-15
http
s://w
ww
.fitc
hrat
ings
.com
/cre
ditd
esk/
repo
rts/
repo
rt_f
ram
e.cf
m?r
pt_i
d=87
5109
http
s://w
ww
.fitc
hrat
ings
.com
/site
/fitc
h-ho
me/
pres
srel
ease
?id=
9970
91S
ecto
r S
peci
ficR
atin
g C
riter
ia f
or U
.S. U
tility
Tar
iff B
onds
21-D
ec-1
5ht
tps:
//ww
w.f
itchr
atin
gs.c
om/c
redi
tdes
k/re
port
s/re
port
_fra
me.
cfm
?rpt
_id=
8753
93ht
tps:
//ww
w.f
itchr
atin
gs.c
om/s
ite/f
itch-
hom
e/pr
essr
elea
se?i
d=99
7168
Sec
tor
Spe
cific
Crit
eria
for
Rat
ing
Oil
Ves
sel-B
acke
d F
inan
cing
s in
Lat
in A
mer
ica
30-D
ec-1
5ht
tps:
//ww
w.f
itchr
atin
gs.c
om/c
redi
tdes
k/re
port
s/re
port
_fra
me.
cfm
?rpt
_id=
8757
83ht
tps:
//ww
w.f
itchr
atin
gs.c
om/s
ite/f
itch-
hom
e/pr
essr
elea
se?i
d=99
7427