FISIOPATOLOGIA DELLO SCOMPENSO CARDIACO -...
35
Alma Mater Studiorum Alma Mater Studiorum – Università di Bologna Università di Bologna DOTTORATO DI RICERCA IN FISIOPATOLOGIA DELLO SCOMPENSO CARDIACO Ciclo XXV Settore Concorsuale di afferenza: 06/1D Settore scientifico-disciplinare: MED/11 Malattie dell’apparato Cardiovascolare What are the components that contribute to variability in echocardiographic measurements in aortic stenosis? Presentata dal Dr. Fabrizio Cecaro Coordinatore Dottorato Relatore Ch.mo Prof. Angelo Branzi Ch.mo Prof. Claudio Ceconi Esame finale anno 2013
Transcript of FISIOPATOLOGIA DELLO SCOMPENSO CARDIACO -...

Alma Mater Studiorum Alma Mater Studiorum –– Università di BolognaUniversità di Bologna
DOTTORATO DI RICERCA IN
FISIOPATOLOGIA DELLO SCOMPENSO
CARDIACO
Ciclo XXV
Settore Concorsuale di afferenza: 06/1D
Settore scientifico-disciplinare: MED/11 Malattie dell’apparato Cardiovascolare
What are the components that contribute to
variability in echocardiographic measurements in aortic stenosis?
Presentata dal Dr. Fabrizio Cecaro
Coordinatore Dottorato Relatore Ch.mo Prof. Angelo Branzi Ch.mo Prof. Claudio Ceconi
Esame finale anno 2013
2
Abstract
Background
Echocardiography is the standard clinical approach for quantification of the severity
of aortic stenosis. A comprehensive examination of its overall reproducibility and the
simultaneous estimation of its variance components by multiple operators, readers,
probe applications, and beats have not been undertaken. Such knowledge is key for
three groups of people. Guideline authors need to be able to both state what level of
precision can be expected with a technique, and provide evidence-based steps to
improve the precision. Clinicians need such data so that they can differentiate true
biological changes from random noise. Researchers need such data for both
designing and powering trials, and developing targeted techniques to improve their
precision.
Method + Results
As part of a quality improvement program, 27 subjects with aortic stenosis were
scanned over 7 months in the echo-department by myself and a median of 2 other
operators (range 1 to 3). From each patient and each operator multiple runs of beats
from multiple probe positions were stored for later analysis by multiple readers. A
mixed effects model was constructed to extract the variance components.
The coefficient of variation was 13.3%, 15.9%, 17.6%, and 20.2% for the aortic peak
velocity (Vmax), and velocity time integral (VTI), and left ventricular outflow tract
(LVOT) Vmax and VTI respectively. The largest individual contributors to the overall
variability were the beat-to-beat variability (9.0%, 9.3%, 9.5%, 9.4% respectively) and
that of inability of an individual operator to precisely apply the probe to the same
position twice (8.3%, 9.4%, 12.9%, 10.7% respectively). The tracing (inter-reader)
and reader (inter-reader), and operator (inter-operator) contribution were less
important.
3
Conclusions
This thesis found that the reproducibility of measurements in aortic stenosis is poorer
than often reported in the literature. However, it is comparable with a retrospective
study I have previously participated in. Furthermore, the large variability of these
simple parameters makes composite measurements for the assessment of the
severity of aortic stenosis even more unreliable. The source of this variability does
not appear, as traditionally believed, to result from a lack of training or operator and
reader specific factors. Rather the unavoidable beat-to-beat biological variability, and
the inherent impossibility of applying the ultrasound probe in exactly the same
position each time are the largest contributors.
Consequently, guidelines suggesting greater standardisation of procedures and
further training for sonographers are unlikely to result in an improvement in precision.
Clinicians themselves should be wary of relying on even three-beat averages as their
expected coefficient of variance is 10.3% for the peak velocity at the aortic valve.
4
Index
INTRODUCTION ......................................................................................................... 5 Test-retest variability ................................................................................................ 5 Guidelines ................................................................................................................ 6 Identifying a measure .............................................................................................. 7 Reliable measurements ........................................................................................... 7 Language of quantification ...................................................................................... 8
Tracing ................................................................................................................. 9 Beat-to-beat ......................................................................................................... 9 Reader ............................................................................................................... 10 Position .............................................................................................................. 10 Operator ............................................................................................................. 11 Clinical status ..................................................................................................... 11
Experimental design required ................................................................................ 11
METHODS ................................................................................................................. 13
RESULTS .................................................................................................................. 15 Baseline characteristics ......................................................................................... 15 Components contributing to the variability ............................................................. 15 Order of priority of sources of variability ................................................................ 15 Behaviour of different parameters ......................................................................... 15 Display of variability components in an understandable manner .......................... 16
DISCUSSION ............................................................................................................ 17 How clinicians are advised by guidelines to reduce variability. ............................. 17 Implications for clinical practice ............................................................................. 18
The maximum achievable precision .................................................................. 18 Advice for sonographers .................................................................................... 18 Effect on management ....................................................................................... 19 Effect on ability to measure change ................................................................... 19 Allows for the introduction of bias ...................................................................... 20 Effect on composite measures .......................................................................... 20
Implications for research ........................................................................................ 21 Effect on studies using aortic as end-points ...................................................... 21 Appreciating that the agreement between two different measurement techniques is limited by their individual reproducibility ......................................................... 21 Designing mechanisms to improve the precision of aortic stenosis assessment ........................................................................................................................... 21
Limitations .............................................................................................................. 22 Comparison with existing literature ........................................................................ 23
CONCLUSION ........................................................................................................... 24
Footnotes ................................................................................................................... 25 Conflicts of Interest and Source of Funding .......................................................... 25 Acknowledgements ................................................................................................ 25
REFERENCES .......................................................................................................... 26
5
Introduction
Echocardiography is the standard clinical approach for the quantification of aortic
stenosis, both at baseline and at follow-up. While echocardiographic follow-up of
aortic stenosis severity is recommended by every national and international
guideline, the test-retest variability of this is actually rather poor(1), although
discussion of this seems to be a “taboo”.
The science of aortic stenosis measurement suffers from two weaknesses. First
measurement technologies that have not undergone detailed, dispassionate analysis
of their measurement properties are taken straight through to end-point studies, and
become a guidelines recommended standard. Secondly, test-retest variability is not
directly taken into consideration by guidelines and mention of such variability is
answered by advice to undergo further training.
In this thesis I set out to address under formal, blinded, scientific conditions how
large the variability between one measurement of aortic stenosis and another
actually is. I designed the experiment to permit the sources of variability to be
decomposed so that we would be able to give sensible advice to those seeking more
reliable measurements – trying to do something more specific than to “undergo more
training”.
Test-retest variability
The true test-retest variability of the various measures of aortic stenosis is much
higher than previously thought. I participated in a retrospective review of repeated
echocardiograms in 70 patients with aortic stenosis(1) which demonstrated that the
coefficient of variation for the simplest estimate of the gradient, the peak
instantaneous pressure drop, was 19.1%. The dimensionless index using VTI,
traditionally thought to be more accurate as it corrects for ventricular function, was
6
higher still at 25%. The variabilities of mean trans-aortic pressure drop and left
ventricular outflow tract VTI were no better; 26.9% and 22.1% respectively(1).
These values contrast to those typically quoted in the literature of 3-4 %(2)
The following questions were left open:
1) Were these findings a consequence of its retrospective design and the scans not
having being originally acquired for research purposes?
2) Could this have been explained by some element of disease progression over time
since there was up to several months between successive scans?
3) Is the variability really caused by inadequate training or are there some
fundamental components which can be separated and quantified, as an essential
step to reducing their impact?
Guidelines
The European Society of Cardiology guidelines for the assessment of aortic
stenosis(3), in addition to the simple maximum aortic velocity which requires one
measurement to be made, details eleven other composite measures that can be
used for assessing the severity of aortic stenosis; one of which requires 5 different
parameters to be measured.
The test-retest variability of composite measures will be greater than those simple
ones as errors are propagated and compounded through an equation (unless the
errors are significantly correlated). Therefore, the addition of further parameters to a
measure to “correct” for other sources of error such as left ventricular dysfunction
may actually worsen the accuracy of the measure. This may explain why the clinical
utility of these more complex measures is less than initially believed(2).
7
Identifying a measure
It is inadequate to advise echocardiographers to make numerous measurements
without a clear algorithm about what to do with the different results, since there will
almost always be discrepancy between the grading categorisations between different
variables(4). Typically echocardiographers are advised to use their clinical judgement,
which is understandable advice in the absence of evidence that could suggest
something more meaningful. In a research environment where echocardiography is
used as a measurement, for entrance criteria, or as an endpoint, it is unacceptable
for the echocardiographer to incorporate other information into a variable that is then
presented as if it were a pure echocardiographic measurement.
When individual measurements are too variable they will never be a reliable basis for
the categorisation of individual patients or as an end-point measurement for
individual patients(5).
Reliable measurements
Instead of recommending piling one unreliable measurement upon another, it is more
rational to carefully assess why the measurements are unreliable in order to
determine whether reliability can be improved.
To select the most appropriate measure, it is essential for clinicians to be provided
with the appropriate test-retest variability. In addition, researchers in
echocardiography who hope to improve the reliability of aortic stenosis severity
assessment also need information on its constituent components. Within
echocardiography these components of variation that can be attributed to either
analytical or temporal (biological) variability. The analytical component will comprise
of differences in interpreting the Doppler tracings (intra-reader and inter-reader), and
the small changes in the probe position that the same and different operators will
obtain (intra-operator and inter-operator). The temporal component will operate on

8
different time-scales: beat-to-beat reflecting fluctuations in autonomic activation; day-
by-day reflecting filling; and over longer time periods [Figure 1]
Unfortunately, credible prospective data assessing the true test-retest variability and
its constituent components is lacking in echocardiography. Whilst some studies
report presenting reproducibility data, on close examination it is very rarely formal,
blinded, test-retest variability. The most common type of reproducibility data is
remeasuring the same stored traced, either by the same reader or a different reader,
and these characteristically are reported as a showing an extremely strong
agreement. However, such reports omit most of the scientifically relevant variability,
as shown in the figure above.
Language of quantification
For some reason, reproducibility reports often emphasise the correlation coefficient
between the two repeated measurements. This statistic is a composite of two pieces
of information:
1) The variability of the measurement.
2) The range of the variable in the patients tested.
It is an unsatisfactory summary of reproducibility for two reasons. First, the breadth of
the spectrum of patients has an overwhelming effect on the correlation coefficient
observed. If the spectrum is wide, including very mildly diseased and very severely
disease, the correlation coefficient is forced to be high even if the measurement
technique is poorly reproducible. Second, it does not present variability in units that
allow a clinician to determine for an individual patient what the uncertainty is(6).
This is in contrast to other physical sciences which use well established experimental
designs and modern statistical methods to estimate the reproducibility of
measurement device(7); with national laboratories, such as NIST, which provide
blinded and unbiased assessment culminating in an estimate of both the overall
precision of a measurement device and its constituent components.
9
We therefore designed and conducted a reproducibility experiment aiming to use
such techniques to simultaneously estimate both the total test-retest variability and its
constituent components [Figure 1]:
Tracing Working from the same frozen acquired Doppler image, the same reader is asked to
trace around the same beat on three occasions with enough time elapsing and
intervening beats measured for there to be no realistic possibility for the reader
remembering exactly how he or she decided to trace around the beat on the previous
occasion. This is sometimes called intra-reader variability.
Beat-to-beat If the same reader is asked to analyse successive beats acquired in a single Doppler
run, the two measurements will of course be different. It is important to note that
there are two contributors to this difference. The more obvious component is that due
to the change of beat. However, the second component will always be present,
namely, the variability due to the act of tracing.
The only way to extract the component specifically due to the beat-to-beat difference
is to start overall observed variability between beats and then subtract the variability
when the same beat is measured twice. In statistical terms this subtraction is valid if
the variability is measured as a variance, i.e. the square of the standard deviation.
In figure 1, the overall variance observed in the beat-to-beat experiment is composed
of the tracing component (purple) and the true beat-to-beat component (red). The
true beat-to-beat component can only be calculated by subtracting the tracing
component (purple) from the overall beat-to-beat variability (red + purple).

10
Reader A second reader carrying out a tracing will obtain different values from the first.
However, contrary to common belief amongst Authors, this should not be assumed to
be the result of the junior of the two operators being inadequately trained to match
the senior operator. It could simply be a manifestation of the within reader variability
of each. In general it is not reasonable to expect two readers to agree with each
other, better than each agrees with themselves. If they do agree better with each
other, better than with themselves, this is likely due to inadvertent collusion. If they
agree just as well with each other as they do with themselves, there is no difference
attributable to the difference in reader, only the variability introduced by having the
tracing performed by anyone.
As long as the same beat is being addressed, it is only the tracing variability that is
must be subtracted.
If on the other hand the new reader is only able to address a new beat, then the total
observed variability observed in that experiment is a combination of three
components: tracing (purple), beat-to-beat (red), reader (blue). It will be therefore
necessary to subtract the tracing and beat variabilities to obtain the pure reader
variability.
Position Working backwards to the time of acquisition, the exact position of the probe is
unique for each acquisition and can never be perfectly reproduced even with a high
level of training. To determine how much variability this causes step of probe
positioning causes it is not sufficient to repeatedly do measurements placed afresh
onto the chest each time. This is because any observed difference between probe
placements will always include variability arising from tracing (purple) and from beat-
to-beat (red). These latter two components must always be subtracted from the
experimental variability to obtain the true variability arising from probe position
(orange).

11
Operator If a second operator acquires data in the same patient, the measurements will be
different, but of course, the probe will be in a different position, the heart beats will be
different, and it will be a separate process of tracing. Therefore to determine the true,
incremental effect of changing operator, one must subtract the variability due to
probe position (orange), beat-to-beat variability (red), and tracing (purple).
Conveniently this can be done by subtracting when one operator removes the probe
from the chest, puts it back, and makes a fresh measurement, i.e. the experiment
described above as “position”.
Clinical status There can be some genuine change over time in the status of patients. For example,
over a period of weeks or months, the disease can progress, or, theoretically improve
Moreover, over short periods of time changes in volume status can increase or
decrease velocities. Treatment effects can also occur, over short, medium, or longer-
terms.
In my study I decided to specifically set these potential sources of variability aside
and focus exclusively on an accurate assessment of the five components shown
above.
Experimental design required
In my pilot studies(1) with my colleagues Dr. Finegold and Dr. Manisty we observed
the large variability in a retrospectively analysed dataset. I decided to carry out a
quality improvement program within our echocardiography department. I arranged
that whenever I was in the echo laboratory and a patient with aortic stenosis in sinus
rhythm was scanned, I ensured that the LVOT and aortic valve velocities were
measured from more than one probe position, and by more than one operator,
typically three. The clinical report was then issued by the primary operator after
viewing all the acquired data using a standard approach. The acquired data were
12
then anonymised with respect to patient identity, beat-sequence, probe position
iteration, and operator and subjected to further analysis to extract the components
shown in Figure 1.
I decided to address the variability of the key measurements - peak velocity (Vmax)
and velocity time integral (VTI) at the aortic valve (AV) and left ventricular outflow
tract (LVOT).

13
METHODS Patients attending an echocardiography department at a tertiary-referral centre in
London for routine surveillance of known aortic stenosis underwent a standard echo
according BSE guidelines(8) by myself, a consultant in cardiology with particular
interest in echocardiography. After performing a standard BSE echo(8), continuous-
wave tracings across the aortic valve and pulse-wave tracings of the LVOT were
taken in the five-chamber view. Once a satisfactory position had been obtained,
rather than selecting a single beat, and performing on-line measurement, long runs
(up to 15) of beats were captured and stored for off-line, blinded, analysis. The probe
was then removed from and then reapplied to the patient, before capturing another
run of beats. For each patient two to three other accredited sonographers captured
continuous and pulse wave traces in a similar manner.
All images were exported as TIFFs and anonymised with respect to patient
demographics. For each beat an image was generated that removed all other beats,
leaving only it and the calibration markings. The operator, position, beat number,
along with calibration data were entered into a database and then identifiers were
removed from the image. Images were then screened for quality. No whole patient,
operator, or position were excluded from the database, but 16/1880 (<1%) were
considered to be of poor quality to prevent further analysis. Images were then
analysed using an imaging software(9) to select the maximum velocity, and VTI on a
15 inch MacBook Pro (Apple Inc., California, USA) in a darkened room.
Sonographers were given the choice of using a mouse or trackball. An independent
statistician and programmer designed software and protocols to present appropriate
images to readers randomised and blinded to the patient, operator, position, and beat
number. I traced every image selecting the Vmax and tracing the VTI independently,
whilst multiple sonographers reviewed a selection (123) beats evenly distributed
across patients and operators measuring both the Vmax and VTI.
14
The measurement data was then combined with the database describing the origin of
the images within R (Version 2.15.1). A mixed-effects model was generated, with
each patients as a fixed effect, and the arbitrary beat-number nested under position-
position, which itself was nested under operator. Estimates of the variance
components with associated confidence (or credible) intervals of these components
were generated using MCMC techniques by the MCMCglmm package in R(10) (using
default priors, number of iterations = 100,000 burn-in 15,000 thin 50). The
measurements were log-transformed before processing to allow the variance
components to be easily converted to coefficients of variation(6).
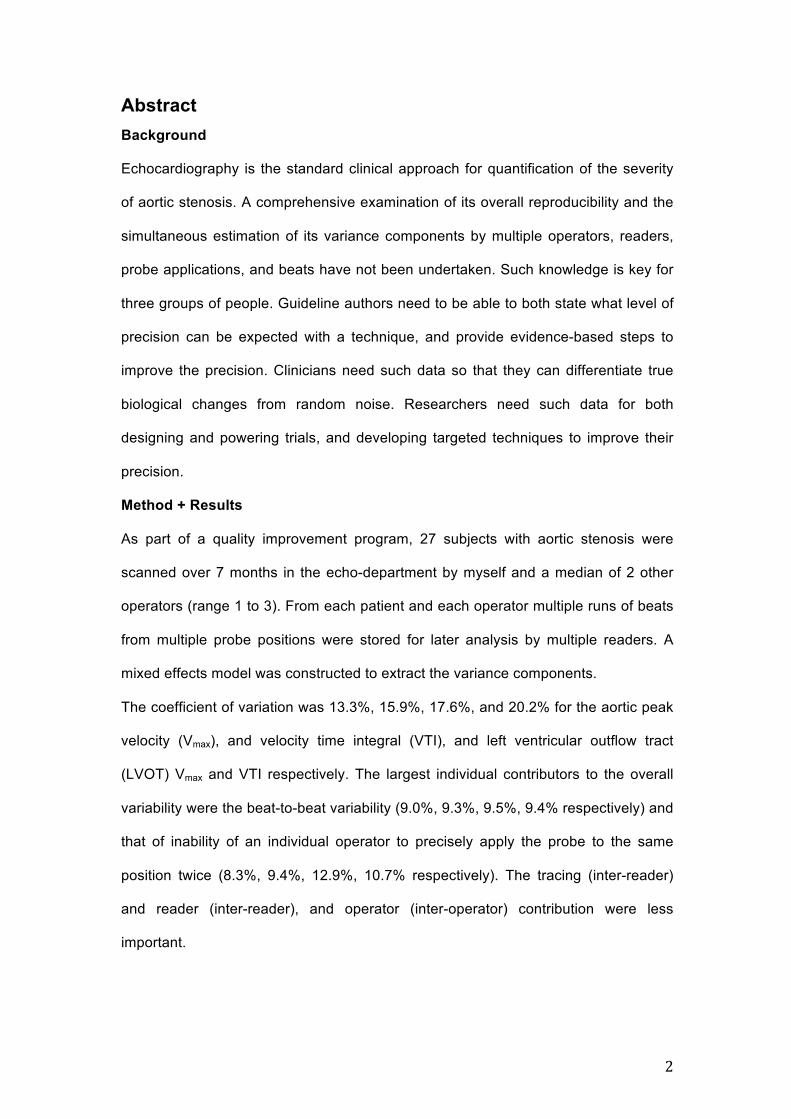
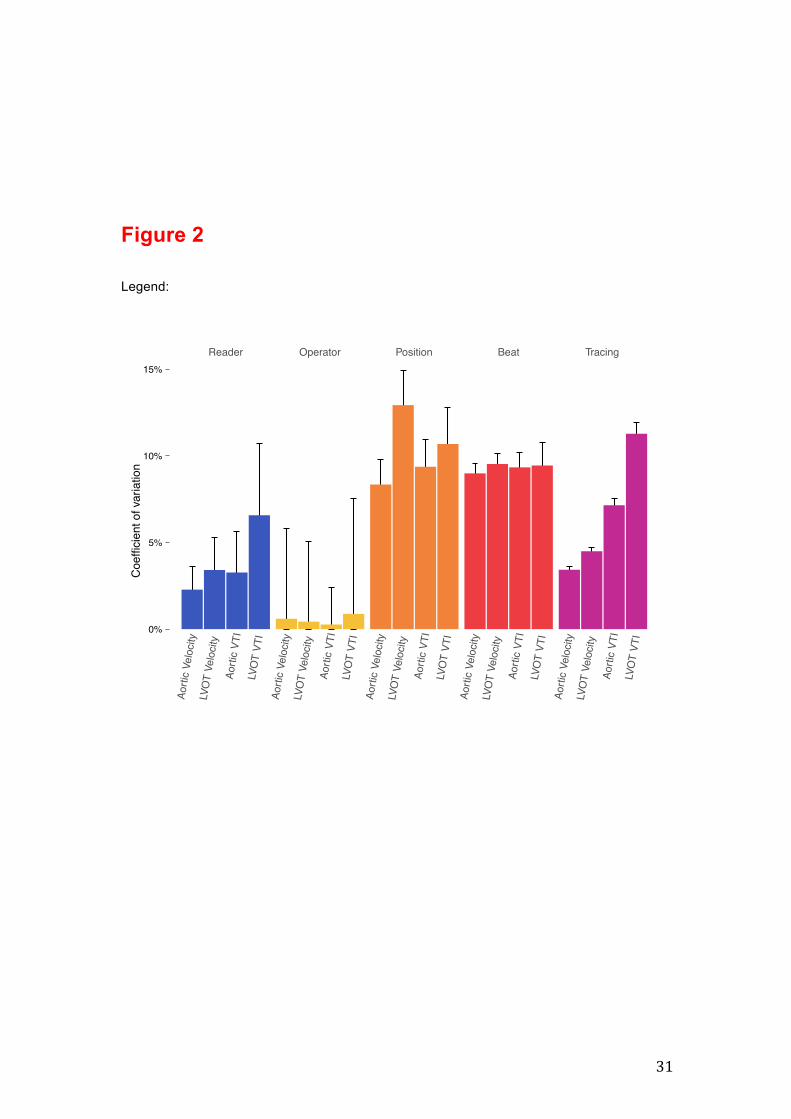
These estimates were plotted individually as bar charts, but also as a series of
nested squares (as it is the variances that are additive), along with a population
coefficient of variation to provide context.

15
RESULTS Baseline characteristics
Twenty-seven patients with aortic stenosis (Vmax mean 4.00, range 2.31 to 6.06m/s)
were scanned between (November 2011 to June 2012) in the department where I
worked when I was present. I worked as part of a pool of 17 operators, although
many only worked for a short window of time during that period, or were only part
time during the week. Each patient was scanned by a median of 3 operators (range 2
to 4). On average 3.6 (range 1-7) runs of beats were recorded by each operator for
each patient, consisting of a mean of 14.8 (range 1 to 51) for a total of 1880 beats.
The baseline characteristics are in Table 1.
Components contributing to the variability
The overall total coefficient of variation across readers, operators, positions, and
beats at for the aortic valve Vmax and VTI, and LVOT Vmax and VTI were 13.3%
15.9%, 17.6%, 20.2% respectively. Figure 2 and Table 1 show its constituent parts.
Order of priority of sources of variability
Position was the component that on average contributed most to variability, namely a
average coefficient of variation of 10.5%. A close second was true beat-to-beat
difference 9.3%. Further behind came variability arising from the act of tracing, at
7.3%. Coefficient of variation from the reader was only 4.2% on average.
Behaviour of different parameters
The four parameters behaved broadly similarly in the pattern above. However, LVOT
VTI showed a particularly large variability component attributable to tracing 11.3%
coefficient of variation whilst the other parameters the other coefficient of variation
were between 3.4% for the Vmax at the aortic valve and 7.1% for the VTI at the aortic
valve.

16
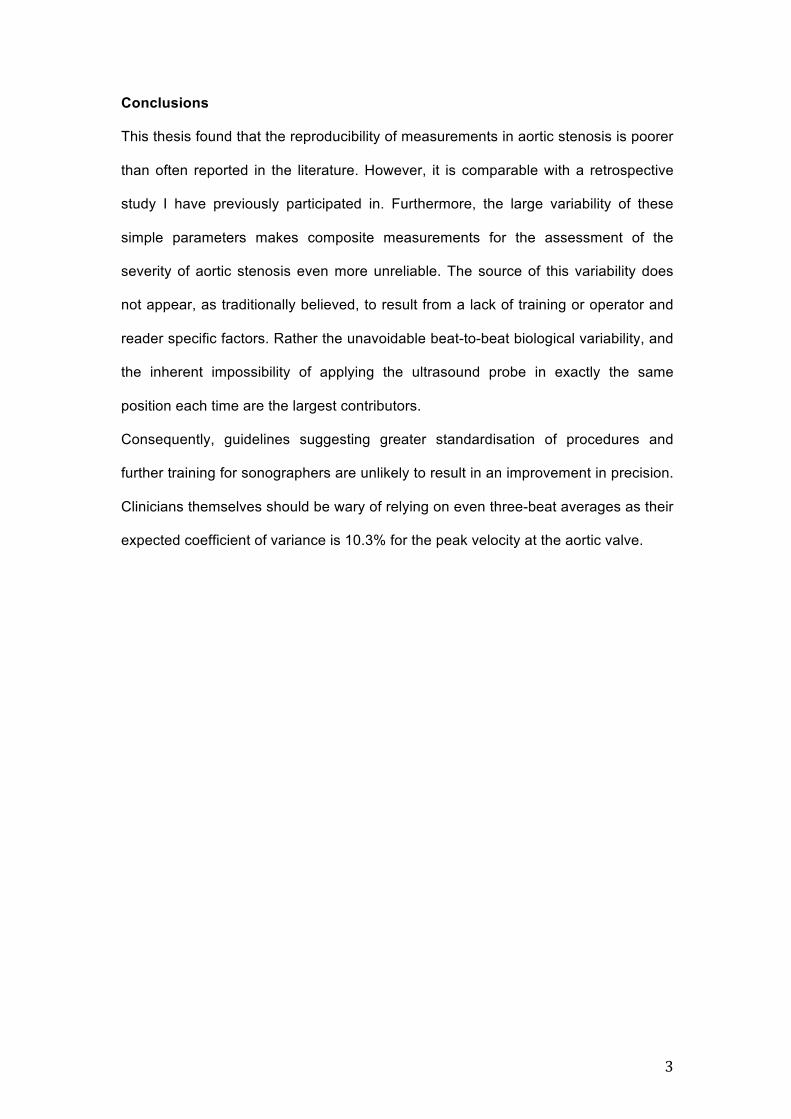
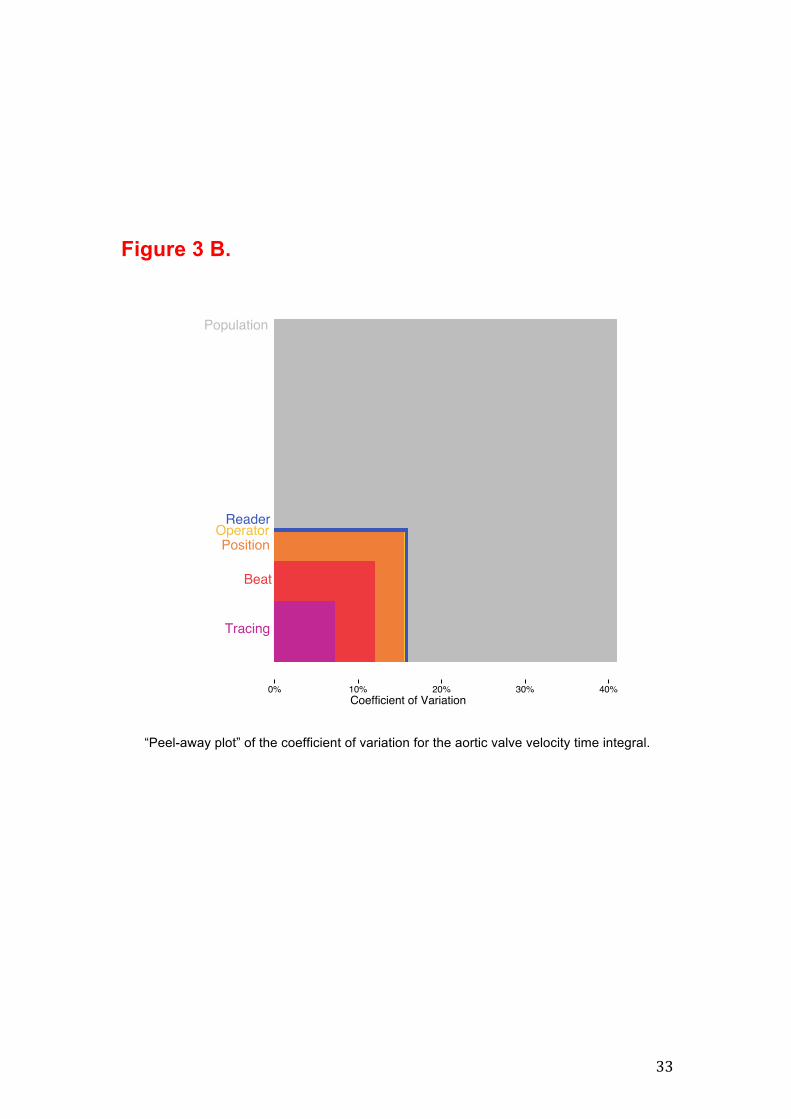
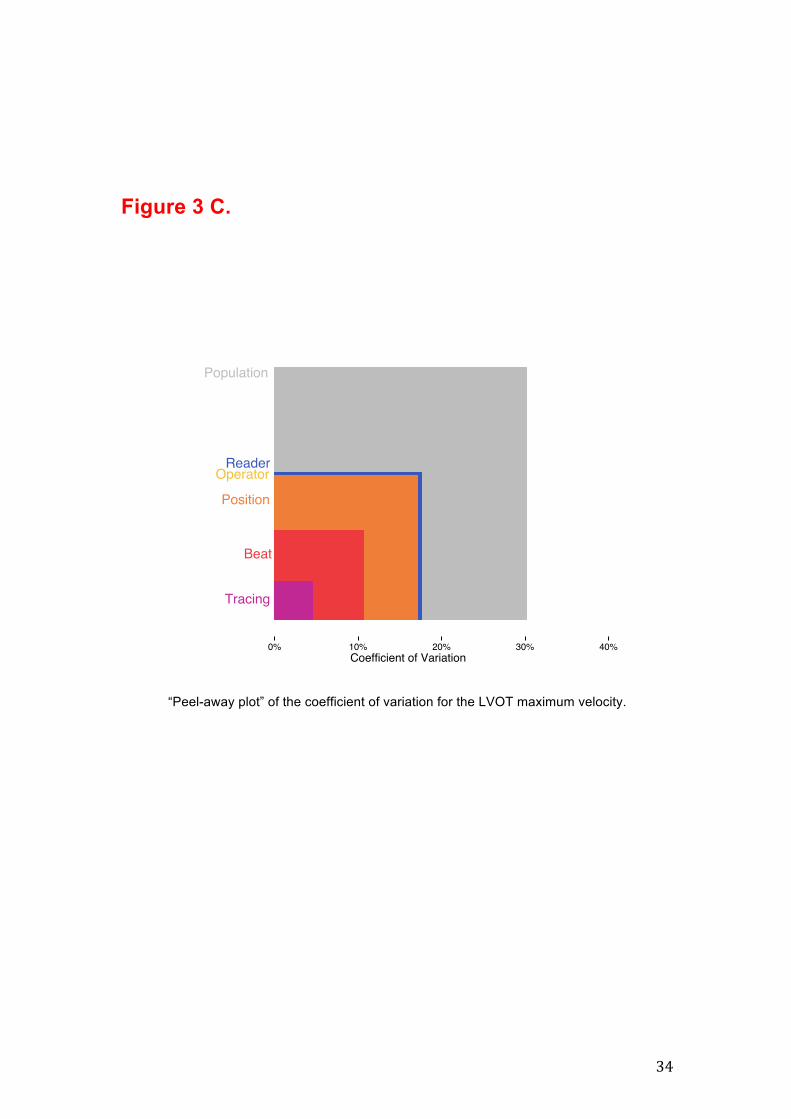
Display of variability components in an understandable manner
To help clinical echocardiographers understand the meaning of the results I am
presenting them graphically in a way that lets the subtraction of components become
intuitive, namely showing the variances as areas. This is shown for peak aortic
velocity in Figure 3.
The interpretation is as follows:
For peak aortic velocity, the tracing variability has a coefficient of variation 3.4%. This
is shown as a purple square whose side is 3.4%. In the experiment of changing beats
a total variability of 9.7% is seen, of course 3.4% must be allocated tracing variability,
and therefore only 9.0% is attributable it being a different beat. It is the squares of the
variance that summate rather than the standard deviations. This is graphically shown
by a larger red square with sides of length 9.7% surrounding the purple square. The
overall area of the larger square encompasses both sources of variability and
therefore only the outer strip of red, which is not tracing variability, is genuinely due to
the different beats.
This process can be repeated with progressively more sources of variability added
until the full variability is shown for a new operator acquiring new pictures interpreted
by a new reader that is represented by the outermost coloured square. The areas of
colour represent the size of variance introduced by each component of variability.
Note how once the squares get large, the addition of an additional variance
component has less and less effect on the magnitude of the overall coefficient of
variation.
The corresponding “peel-away variance maps” for LVOT peak velocity, aortic VTI
and LVOT VTI are shown in figures 3B, 3C, and 3D.

17
DISCUSSION The coefficient of variation was 13.3%, 15.9%, 17.6%, and 20.2% for the aortic peak
velocity (Vmax), and velocity time integral (VTI), and left ventricular outflow tract
(LVOT) Vmax and VTI respectively. This variability is clinically large, and larger than
reported in the literature. It should be remembered that, this variability does not
contain the biological components of variability that develop over a period of days. It
only includes variability in the very short term arising from rapid biological variations
or by the many steps of the measurement process.
This study suggests that the usual advice given to clinicians and researchers to help
obtain reliable measurements not accurate enough. They are typically advised to
follow a strict protocol to try to use a consistent member of staff on each occasion for
image acquisition, and a consistent member of staff to carry out each reading of the
acquired images. In reality the contribution to variance made by having a different
operator acquiring images or a different reader analysing images, is small by
comparison to the variance introduced by the act of tracing, by spontaneous beat-to-
beat variability, and probe position during acquisition.
How clinicians are advised by guidelines to reduce variability.
Multiple readings can be combined to reduce the apparent variability of a
measurement, and indeed guidelines bodies such as the ESC(11) and ASE(12)
recommend averaging across three to five beats. However, they neither provide an
estimate of what level of reproducibility before, nor after averaging. Furthermore, as I
have shown in this thesis there are multiple sources of variability; beat-to-beat and
biological variability at longer time-scales, intra- and inter-reader, and intra and inter-
operator. Averaging only across a few sequential beats will only reduce a few of the
components, and the effect on the total variability will therefore less than expected.
18
For example, if three consecutive beats are averaged only the tracing and beat-to-
beat variance will be reduced by a third, rather that the total variance. In this dataset,
this is equivalent to reducing the coefficient of variation from 13.3 to 10.3 for the
assessment of the aortic Vmax. If however, the three beats are taken from different
probe positions, the expected coefficient of variation will be 7.9%. Table 2 lists such
calculations for the other parameters.
Implications for clinical practice
The maximum achievable precision Should the clinician wish to reduce the coefficient of variation to, for example <5%,
he would need to average 9 beats from 9 different probe positions for the aortic Vmax.
If however they were to follow current guidelines and only average consecutive
beats, as the position coefficient of variation is in excess of 5% for the aortic Vmax,
such precision could not be achieved as the position variability is 8.3% and without
varying that it cannot be averaged out. Indeed, the theoretical best precision that
could be achieved for the aortic Vmax with a large number of beats would be 8.6%.
Knowledge of the true test-retest variability of a measurement and its constituent
parts is therefore essential for both the clinician and the researcher.
Advice for sonographers Whilst the typical advice to a sonographer who fails to match the reading produced
by a more experienced colleague it to undergo more training, this thesis find that the
most significant contributor to variability is not related to the reader or the operator,
which have the smallest contribution to the overall coefficient of variation, but that of
beat-to-beat and probe position. Consequently, as a science, efforts should be
directed to utilising this information in developing more robust measurement
techniques and strategies (as described below), rather than producing ever

19
expanding guidelines with recommendations that appear to be based on the belief
that a lack of precision results from a lack of standardisation(13).
Effect on management An accurate assessment of aortic stenosis severity is crucial in terms of patient’s
management, especially when the AS is in the “grey area” between moderate and
severe grade and a decision to refer the patient to surgery or postpone must be
taken(14). The variability of even a simple measure like aortic Vmax will lead to
occasional extreme values being seen that exceed a certain threshold. If guidelines
are followed and the operator selected the highest values obtained, they would
occasionally capture a beat with a Vmax higher than the threshold of 4m/s even
though the vast majority of the beats are lower. Such an error could lead to a
significant change in management (coloured in red). By requiring selection of the
maximum value, the value selected will become dependent upon the number of
beats examined as the operator waits for more and more extreme beats.
Furthermore the variability of the maximum value of a distribution is greater than that
of the mean(15).
Both these effects conspire to further diminish the parameters reproducibility.
Effect on ability to measure change Guidelines suggest that a combination of a markedly calcified valve with a rapid
increase in velocity of 0.3 m/s within one year has been shown to identify a high-risk
group of patients (about 80% death or requirement of surgery within two years). In
light of the variability identified in this thesis, this guideline may be unwise. The 95%
confidence interval for detecting a change is from -33% to +42% for Vmax (the
confidence interval is symmetric on a log scale), which is larger than the approximate
10% progression represented by 0.3 m/s in a patient with moderate aortic stenosis. If
three consecutive beats are averaged the coefficient of variation is reduced to 10.3%,
therefore the 95% confidence interval for a change is from -24.7% to +32.9%.
However, if three beats from three different probe applications are used the

20
coefficient of variation becomes 7.9%, and the associated the 95% confidence
interval for a change is from -19% to +24%. None of these confidence intervals is
sufficiently small to allow for confident detection of a true change of 10% in maximum
aortic velocity.
Allows for the introduction of bias It has been previously demonstrated that the variability of measurements from serial
echo data is reduced when performed unblinded to the study order and patient(16).
Readers, when confronted with serial measurements of a parameter that they expect
to at least stay the same and may often progress, such as with aortic stenosis will be
reluctant to report a value that the lower that the preceding one. Errors in the
opposite direction, however, will not be automatically detected by this process, and
may instead be accepted as evidence of genuine deterioration. As a result, the will
be a consistent bias towards exaggeration to the rate of progression of disease.
Effect on composite measures If the errors are not correlated, which is unlikely as they are not acquired
simultaneously (e.g. pulse wave and continuous wave Doppler tracings cannot be
recorded at the same time) the reproducibility of composite measures will be worse
than those of its constituent measurements. E.g. Whilst the coefficient of variation of
Vmax at the aortic valve and LVOT is 13.3% and 17.6% respectively, for the
dimensionless index the ratio of the two it would be 31%. It is even worse if VTIs are
used - the VTI at the AV and LVOT is 15.9% and 20.2% giving a predicted coefficient
of variation of 36% for the dimensionless index by DI. That reproducibility of the
aortic valve area, which incorporates a third measure, that of the diameter of the
LVOT squared, will be even worse. These calculations assume that the errors in
measurement are completely uncorrelated. In fact it is likely that the errors LVOT and
AV velocity are partly correlated - if an operator was particularly fastidious or lax
about ensuring correct alignment both the AV and LVOT would likely be high or low,
therefore, these estimates may represent the upper limit on the estimated coefficient
21
of variation. Indeed, in my retrospective analysis for real world data(1) these figures
were lower at 13% and 25% for the dimensionless index by Vmax and VTI
respectively.
Implications for research
Effect on studies using aortic as end-points Accurate assessment of the progression of aortic stenosis is crucial for determining
the effects of potential clinical interventions on the disease as a whole. The power of
potential future clinical trials to detect the effect of interventions on the progression of
aortic stenosis(17) is reduced by the lack of reliability in the measurements.
Appreciating that the agreement between two different measurement techniques is limited by their individual reproducibility The high concordance of simultaneous in vivo Doppler and dual catheter
measurements of aortic gradients established echocardiography as the primary
technique for the quantitative assessment of aortic stenosis(18)
Nevertheless, even these original authors’ enthusiasm was tempered by the
significantly worse concordance with non-simultaneous echocardiographic
measurements(19) (such as those values obtained from the referring clinic).
This finding is not unexpected. The analytical and biological variability of a
measurand will naturally limit the agreement between two non-simultaneous
techniques(20). A lack of test-retest reproducibility limits how much a variable can
correlate with itself, let alone another noisy variable.
Consequently, when comparing one technique with another for assessing aortic
stenosis clinical researchers should first assess its true test-retest variability before
pitting it against another noisy measure.
Designing mechanisms to improve the precision of aortic stenosis assessment The comprehensive analysis provided by this thesis of the components that
contribute to the variability of aortic stenosis assessment allows for a targeted
approach for future improvements. Removal of the variability associated with tracing
22
and readers (intra- and inter-reader variability) should be straightforward with
computer algorithms. Once such algorithms are in place, the unbiased analysis of
multiple captured beats and positions becomes easier, and their associated
variability can be reduced in proportion to the square root of the number of positions
and beats captured. Such systems have already been developed for the mitral(21)(22)
and other valves(23).
Limitations
This thesis did not examine the variability associated over time periods longer than
the minimum to allow for at most four operators to capture continuous and pulse
wave Doppler tracings of the aortic valve and LVOT as we had investigated this
previously, although in a retrospective manner(1). Due to operational constraints I did
not investigate the impact of the equipment manufacturer or training of the operator.
This was not a multicentre study. However, whilst the coefficients of variation may
vary from between centres due to operator experience my study did utilise 17
different operators, some sonographers and some doctors with a range of years of
experience since accreditation. Consequently, I expect these results to be
generalizable to similar large echocardiography units.
I did encounter some statistical issues. Whilst between two and four operators
scanned each patient, within a quality improvement programme it would have been
difficult to ensure that it were the same operators for every patient. The
computational method and statistical package (MCMCglmm) used for solving the
mixed model provided unstable estimates with large confidence intervals for the
operator coefficient of variation as it was a partially crossed factor. Other authors
have run into such issues(24), we are unaware of a straightforward, direct solution to
this problem. Therefore, the current estimate of the true operator contribution must
be considered as unreliable.
23
Comparison with existing literature
Within cardiology, and much of echocardiography, such analyses are rare, though
are not without precedent(24)(25). Often results are presented as not a standard
deviations or coefficients of variations (or corresponding Bland-Altman limits of
agreement), but as a regression line and correlation coefficient. Interpreting these
can be fraught with hazards(6). Furthermore, whilst the Bland-Altman limits of
agreement technique is a marked improvement upon reporting correlation
coefficients and p-values it tends to lead to an experimental set-up limited to two
specific observers, readers, or operators. This provides a good estimate for the
agreement between the two specified operators, but may be poorly generalisable to
multiple operators.
This thesis therefore uniquely provides estimates for the individual contribution of
many of the components that contribute to the variability of measurements of aortic
stenosis. These estimates are comparable with our previous retrospective analysis(1),
but larger than previous estimates. Other studies(26)(27) similar levels of accuracy,
reporting a coefficient of variation for Vmax ranging from 5% to 7%. The difference for
this is unclear. In one early study which reported a test-retest coefficient of 5%(27)
inspection of the provided raw data shows them to be incredibly accurate. In five out
of the twenty patients examined exactly the same Vmax to two decimal places was
found on three independent, scans taken at baseline, one week, and one month.
Review of the methods provides for no special techniques to improve precision;
perhaps inadvertent unblinding could have led to their apparent accuracy.

24
CONCLUSION
This thesis provides both an accurate assessment of the coefficient of variation that a
typical large echocardiography department would be able to ascertain for four of the
key parameters that are used to assess the severity of aortic stenosis. It finds that
there reproducibility is poorer often reported in the literature, but comparable with a
retrospective study I had previously conducted.
This large variability for these simple parameters of Vmax and VTI at the aortic valve
and LVOT makes composite measures for the assessment of the severity of aortic
stenosis even more unreliable. Within clinical practice, such variability can lead to
classification errors near the severity thresholds, or can results in inaccurate
assessments of a progression in severity. The source of this variability does not
appear, as traditionally believed, to result from a lack of training or inter-operator and
inter-reader factors, but rather the beat-to-beat biological variability, and the inherent
impossibility of applying the ultrasound probe in exactly the same position each time
are the largest contributors. Consequently, guidelines suggesting greater
standardisation of procedures and further training for sonographers are unlikely to
result in an improvement in precision.

25
Footnotes Conflicts of Interest and Source of Funding
I was supported by Fondazione Anna Maria Sechi per il Cuore (FASC) and by the European Society of Cardiology (ESC).
Acknowledgements
My thanks to Prof. Roberto Ferrari without whom I would not be in London at all.
I gratefully acknowledge Prof. Darrel Francis for his generous assistance. It was a privilege to work with him.
Thanks to Prof. Jamil Mayet for giving me the opportunity to work in such a renowned Echo Department.
Thank you very much to Dr. Matthew Shun-Shin for providing statistical, methodological, and programming expertise and support, along with Sylvie Sadiq, Arvit Homol, Michelle Sanders, Annabel Oraa, and all the Sonographers of Echo Department of St. Mary’s Hospital for their kind support.

26
REFERENCES 1. Finegold JA; Manisty CH; Cecaro F; Sutaria N; Mayet J; Francis DP. Choosing between velocity-time-integral ratio and peak velocity ratio for calculation of the dimensionless index (or aortic valve area) in serial follow-up of aortic stenosis. International Journal of Cardiology 2012 May 8 [Epub ahead of print]
2. Baumgartner H, Hung J, Bermejo J. Echocardiographic Assessment of Valve Stenosis: EAE/ASE recommendations for clinical practice, Journal American Society of Echocardiography 2009; 22: 1-23
3. Guidelines on the management of valvular heart disease. European Heart Journal 2012; 33: 2451–2496
4. Pibarot P, Dumesnil JG. Improving assessment of aortic stenosis. Journal of American College of Cardiology 2012; 60: 169-80 5. Kyriacou A; Li Kam Wa ME; Pabari PA; Unsworth B; Baruah R; Willson K; Peters NS; Kanagaratnam P; Hughes AD; Mayet J; Whinnett ZI; Francis DP. A systematic approach to designing reliable VV optimization methodology: Assessment of internal validity of echocardiographic, electrocardiographic and haemodynamic optimization of cardiac resynchronization therapy. International Journal of Cardiology. 2012 Mar 26 [Epub ahead of print]
6. Bland JM, Altman DG. Statistical methods for assessing agreement between two methods of clinical measurement. Lancet 1986; 1: 307–10
7. International Organization for Standardization. Accuracy (trueness and precision) of measurement methods and results—Part 1: general principles and definitions (ISO 5725-1). Geneva, Switzerland: ISO, 1994 8. Wharton G, Steeds R, Allen J, Brewerton H, Jones R, Kanagala P, Lloyd G, Masani N, Mathew T, Oxborough D, Rana B, Sandoval J, Wheeler R. Protocol written by the Education Committee of the British Society of Echocardiography 2012 (online: http://www.bsecho.org.uk/tte-minimum-dataset/) 9. ImagJ. http://rsb.info.nih.gov/ij/ 10. MCMCglmm. http://cran.r-project.org/web/packages/MCMCglmm/index.html 11. Vahanian A, Baumgartner H, Bax J. Guidelines on the Management of Valvular Heart Disease: The Task Force on the Management of Valvular Heart Disease of the European Society of Cardiology. European Heart Journal 2007; 28: 230-68
12. Bonow RO, Carabello BA, Chatterjee K. ACC/AHA 2006 Guidelines for the Management of Patients With Valvular Heart Disease, Journal of the American College of Cardiology 2006; 48: 1-148 13. Nihoyannopoulos P, FESC, Fox K, FESC, Fraser A. EAE laboratory standards and accreditation. European Journal of Echocardiography 2007; 8: 80-87 14. Heuvelman HJ, van Geldorp MW, Eijkemans MJ, Rajamannan NM, Bogers AJ, Roos-Hesselink JW, Takkenberg JJ. Progression of aortic valve stenosis in adults: a systematic review. Journal of Heart Valve Disease 2012; 21: 454-62
27
15. Michael J. Campbell, David Machin, Stephen J. Walter Medical Statistics: A Textbook for the Health Sciences. Wiley ed. 2007 16. Gosse P, de Simone G, Dubourg O, Guéret P, Schmieder R. Serial echocardiographic assessment of left ventricular mass: how blinded should readers be? Journal of Hypertension 2004; 22: 1813-8
17. Gerdts E, Rossebø AB, Pedersen TR, Boman K, Brudi P, Chambers JB, Egstrup K, Gohlke-Bärwolf C, Holme I, Kesäniemi YA, Malbecq W, Nienaber C, Ray S, Skjærpe T, Wachtell K, Willenheimer R. Impact of baseline severity of aortic valve stenosis on effect of intensive lipid lowering therapy (from the SEAS study). American Journal of Cardiology 2010; 106: 1634-9 18. Currie PJ, Seward JB, Reeder GS, Vlietstra RE, Bresnahan DR, Bresnahan JF, Smith HC, Hagler DJ, Tajik AJ. Continuous-wave Doppler echocardiographic assessment of severity of calcific aortic stenosis: a simultaneous Doppler-catheter correlative study in 100 adult patients. Circulation 1985; 71: 1162-9 19. Minners J, Allgeier M, Gohlke-Baerwolf C, Kienzle RP, Neumann FJ, Jander N. Inconsistencies of echocardiographic criteria for the grading of aortic valve stenosis. European Heart Journal 2008; 29: 1043–104
20. Shun-Shin M, Francis DP. Why are some studies of cardiovascular markers unreliable? The role of measurement variability and what an aspiring clinician scientist can do before it is too late. Progress in Cardiovascular Disease 2012; 55: 14-24 21. Moraldo M; Bergamini C; Malaweera AS; Dhutia NM; Pabari PA; Willson K; Baruah R; Manisty C; Davies JE; Xu XY; Hughes AD; Francis DP. A novel fully automated method for mitral regurgitant orifice area quantification. International Journal of Cardiology Jan 2012 Jan 2 [Epub ahead of print] 22. Dhutia NM, Cole GD, Willson K, Rueckert D, Parker KH, Hughes AD, Francis DP. A new automated system to identify a consistent sampling position to make tissue Doppler and transmitral Doppler measurements of E, E' and E/E'. International Journal of Cardiology 2012; 155: 394-399 23. Morita C, Nakatsu T, Kusachi S, Kitawaki T; Usui S, Tobe K; Toyonaga S, Ogawa H, Hirohata S Shiratori Y. Development of an automatic Doppler flow signal detection system: variability of pulmonary and aortic peak flow velocity. Journal of Medical Ultrasonics 2007; 34: 37-42
24. Schroeder EB; Whitsel EA; Evans GW; Prineas RJ, Chambless LE, Heiss G. Repeatability of heart rate variability measures. Journal of Electrocardiology 2004; 37: 163-72 25. Moura LM, Ramos SF, Pinto FJ, Barros IM, Rocha-Gonçalves F. Analysis of variability and reproducibility of echocardiography measurements in valvular aortic valvular stenosis. Revista Portuguesa de Cardiologia 2011; 30: 25-33
26. Ramirez ML, Wong M. Reproducibility of stand alone continuous wave Doppler recordings of aortic flow velocity across bioprosthetic valves. American Journal of Cardiology 1985; 55: 1197-9

28
27. Siostrzonek P, Kronik G, Jung M, Gössinger H, Schmoliner R, Zangeneh M, Mösslacher H. Day to day reproducibility of Doppler sonographic measurement in patients with valvular aortic stenosis. Clinical Cardiology 1988; 11: 748-50

29
Table 1. Coefficient of variation attributable to each component
Aortic LVOT
Vmax VTI Vmax VTI
Tracing 3.4% (3.3 to 3.6%) 7.1% (6.8 to 7.5%) 4.5% (4.3 to 4.7%) 11.3% (10.7 to
11.9%)
Beat-to-beat 9.0% (8.4 to 9.6%) 9.3% (8.5 to 10.2%) 9.5% (8.9 to 10.2%) 9.4% (8.1 to 10.7%)
Position 8.3% (7.2 to 9.8%) 9.4% (8.0 to 10.9%) 12.9% (11.2 to
14.9%) 10.7% (9 to 12.8%)
Operator 0.6% (0.0% to 5.8%) 0.3% (0.0 to 2.4%) 0.4% (0.0 to 5.0%) 0.9% (0.0% to 7.5%)
Reader 2.3% (1.5 to 3.6%) 3.3% (2.0 to 5.6%) 3.4% (2.2 to 5.3%) 6.6% (4. 0 to 10.7%)
The values presented are the coefficients of variation attributable to each component individually. Number in brackets - 95% confidence interval.
Table 2. Overall variability at each level
Aortic LVOT
Vmax VTI Vmax VTI
Reader 13.3% 15.9% 17.6% 20.2%
Operator 13.0% 15.5% 17.1% 18.9%
Position 13.0% 15.5% 17.1% 18.9%
Beat 9.7% 11.9% 10.6% 15.0%
Tracing 3.4% 7.1% 4.5% 11.3%
The overall variability at each level, which includes all the underlying levels. For example, the variability associated tracing around the same beet is 3.4%. If a different operator is used, the variability must also include that of a different position, beat, and tracing.
30
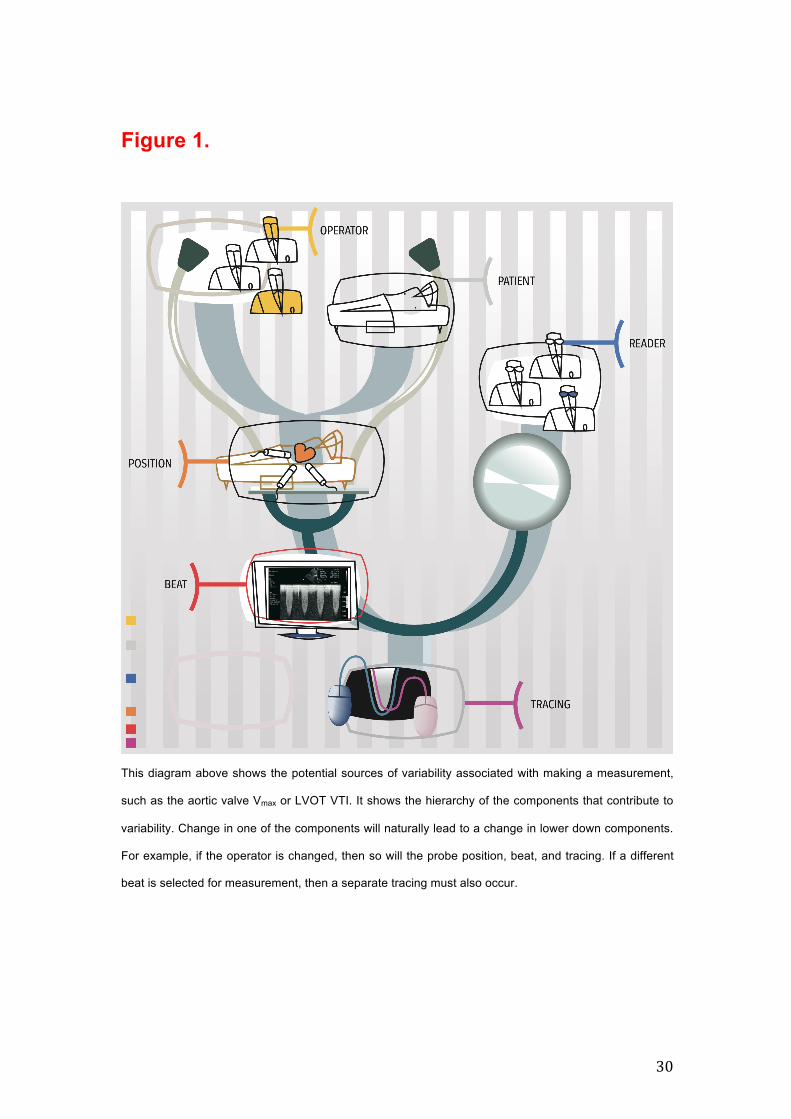
Figure 1.
This diagram above shows the potential sources of variability associated with making a measurement,
such as the aortic valve Vmax or LVOT VTI. It shows the hierarchy of the components that contribute to
variability. Change in one of the components will naturally lead to a change in lower down components.
For example, if the operator is changed, then so will the probe position, beat, and tracing. If a different
beat is selected for measurement, then a separate tracing must also occur.
31
Figure 2
Legend:
Aorti
c Ve
locit
yLV
OT
Velo
city
Aorti
c VT
ILV
OT
VTI
Aorti
c Ve
locit
yLV
OT
Velo
city
Aorti
c VT
ILV
OT
VTI
Aorti
c Ve
locit
yLV
OT
Velo
city
Aorti
c VT
ILV
OT
VTI
Aorti
c Ve
locit
yLV
OT
Velo
city
Aorti
c VT
ILV
OT
VTI
Aorti
c Ve
locit
yLV
OT
Velo
city
Aorti
c VT
ILV
OT
VTI
Reader Operator Position Beat Tracing
0%
5%
10%
15%
Coe
ffici
ent o
f var
iatio
n

32
Figure 3 A.
“Peel-away plot” of the coefficient of variation for the aortic valve maximum velocity.
33
Figure 3 B.
“Peel-away plot” of the coefficient of variation for the aortic valve velocity time integral.
34
Figure 3 C.
“Peel-away plot” of the coefficient of variation for the LVOT maximum velocity.

35
Figure 3 D.
“Peel-away plot” of the coefficient of variation for the LVOT velocity time integral.