Fisheries of the Mekong: Death by a 1000 Cuts or Just Another Day at the Office?
23
Fisheries of the Mekong: Death by a 1000 Cuts or Just Another Day at the Office Vu Vi An, Ian G. Cowx, With support from Kaviphone Phouthavong, Martin Mallen Cooper, Bun Peng, So Nam, Apiradee Hanpongkittikul
-
Upload
mekong-fish-network -
Category
Environment
-
view
250 -
download
0
Transcript of Fisheries of the Mekong: Death by a 1000 Cuts or Just Another Day at the Office?

Fisheries of the Mekong:Death by a 1000 Cuts or
Just Another Day at the OfficeVu Vi An, Ian G. Cowx,
With support from Kaviphone Phouthavong, Martin Mallen Cooper, Bun Peng,
So Nam, Apiradee Hanpongkittikul

Content:
1. Introduction
2.Trend of fisheries in the Mekong Delta
3.Pressures on the fisheries
4.Opportunities and mitigation
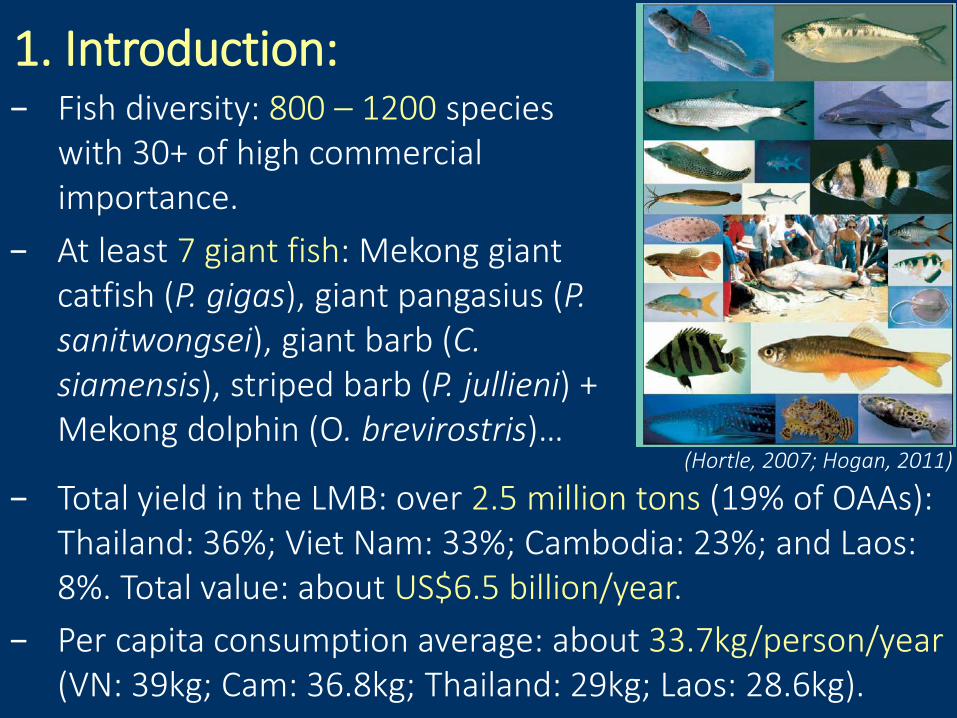
1. Introduction:
− Total yield in the LMB: over 2.5 million tons (19% of OAAs): Thailand: 36%; Viet Nam: 33%; Cambodia: 23%; and Laos: 8%. Total value: about US$6.5 billion/year.
− Per capita consumption average: about 33.7kg/person/year(VN: 39kg; Cam: 36.8kg; Thailand: 29kg; Laos: 28.6kg).
− Fish diversity: 800 – 1200 species with 30+ of high commercial importance.
− At least 7 giant fish: Mekong giant catfish (P. gigas), giant pangasius (P. sanitwongsei), giant barb (C. siamensis), striped barb (P. jullieni) + Mekong dolphin (O. brevirostris)…
(Hortle, 2007; Hogan, 2011)

1. Introduction:
-1.0
0.0
1.0
2.0
3.0
4.0
5.0
1-Ja
n-13
15-Ja
n-13
29-Ja
n-13
12-F
eb-1
326
-Feb
-13
12-M
ar-1
326
-Mar
-13
9-Ap
r-13
23-A
pr-1
37-
May
-13
21-M
ay-1
34-
Jun-
1318
-Jun-
132-
Jul-1
316
-Jul-1
330
-Jul-1
313
-Aug
-13
27-A
ug-1
310
-Sep
-13
24-S
ep-1
38-
Oct
-13
22-O
ct-1
35-
Nov
-13
19-N
ov-1
33-
Dec-
1317
-Dec
-13
31-D
ec-1
3
Wat
er le
vel (
m a
sl)
Vietnamese Mekong Delta: Tan Chau station
Up to 50%
Concentration of fish in permanent water bodies
Adults movement + Drift of larvae to feeding areas on the flooded areas
Movement to dry season refuges, and dispersal
DRY Season:FLOOD Season:

- White fish (undertaking long distance migrations): 36% of capture;
- Black fish (floodplain resident fish, limited lateral migrations): 50%of capture;
- Grey fish: 14 % of capture.
− Fish migtate all seasons of year.
1. Introduction:

2. Trend of fisheries in the Mekong Delta:Fishing habitats (gillnetting) vs Flooding scheme:− Mainstream : 52%− Tribitary : 24%− Flooded rice field : 24%
0.0
0.5
1.0
1.5
2.0
2.5
3.0
3.5
0%
20%
40%
60%
80%
100%
Jan Feb Mar Apr May Jun Jul Aug Sep Oct Nov Dec
Wat
er le
vel (
m)
Fish
ing
freq
uenc
y
Mainstream Tributary Rice field Water Level

2. Trend of fisheries in the Mekong Delta:- Statistics (capture only):
Total yield: 1,040,759 tMarine:
Fish: 653,600 tOthers: 263,184 t
Inland : 124,626 t
- 67% of households in An Giang province participate in fishing, only 7% are full time fishers.
020406080
100120140160180200
2000
2001
2002
2003
2004
2005
2006
2007
2008
2009
2010
2011
Inla
nd Y
ield
(tho
usan
d to
ns)
Year
0
100
200
300
400
500
600
70020
00
2001
2002
2003
2004
2005
2006
2007
2008
2009
2010
2011M
arin
e Fi
sh Y
ield
(tho
usan
d to
ns)
(Sjorslev et al., 2001)
Inland: decline 34%or 2.83%/year.

2. Trend of fisheries in the Mekong Delta:- Fishers' catch monitoring program (FP/MRC): 2007 – 2014
Average daily catch: 5.45kg/day/fisher gillnet.
0
5
10
15
20
25
Jun-
07
Nov
-07
Apr-
08
Sep-
08
Feb-
09
Jul-0
9
Dec-
09
May
-10
Oct
-10
Mar
-11
Aug-
11
Jan-
12
Jun-
12
Nov
-12
Apr-
13
Sep-
13
Feb-
14
Jul-1
4
Aver
age
catc
h ra
te (k
g/da
y)
2009

2. Trend of fisheries in the Mekong Delta:
0.0
0.5
1.0
1.5
2.0
2.5
3.0
3.5
0
5
10
15
20
25
Wat
er le
vel (
m)
Catc
h ra
te (k
g/da
y)
Catch rate
Water Level
- Fishers' catch monitoring program (FP/MRC): 2007 – 2014Average daily catch: 5.45kg/day/fisher gill net.
2009

2. Trend of fisheries in the Mekong Delta:2. Trend of fisheries in the Mekong Delta:- Fishers’ catch monitoring program (FP/MRC): 2007 – 2014
Decline: 8.5kg/day (2007) to 6.4kg/day (2014).
0
2
4
6
8
10
12
14
16
18
2007 2008 2009 2010 2011 2012 2013 2014
Aver
age
catc
h ra
te (k
g/da
y)

3. Pressures on the fisheries:Major threats to inland fisheries include:
• Over-fishing + destructive fishing methods
• In-channel barriers (Blocking of fish migration routes)
• Land use changes (habitat loss)
• Industrial and urban pollution
• Urbanisation • Agricultural pollution: pesticides
• Run-of-river abstractions • Mining pollution• Irrigation • Sediment mining• Impoundments • Climate change• Aquaculture linked to
invasive species• Hydrological changes (e.g.
timing and extent of flooding)• Flood mitigation measure • Hydropower
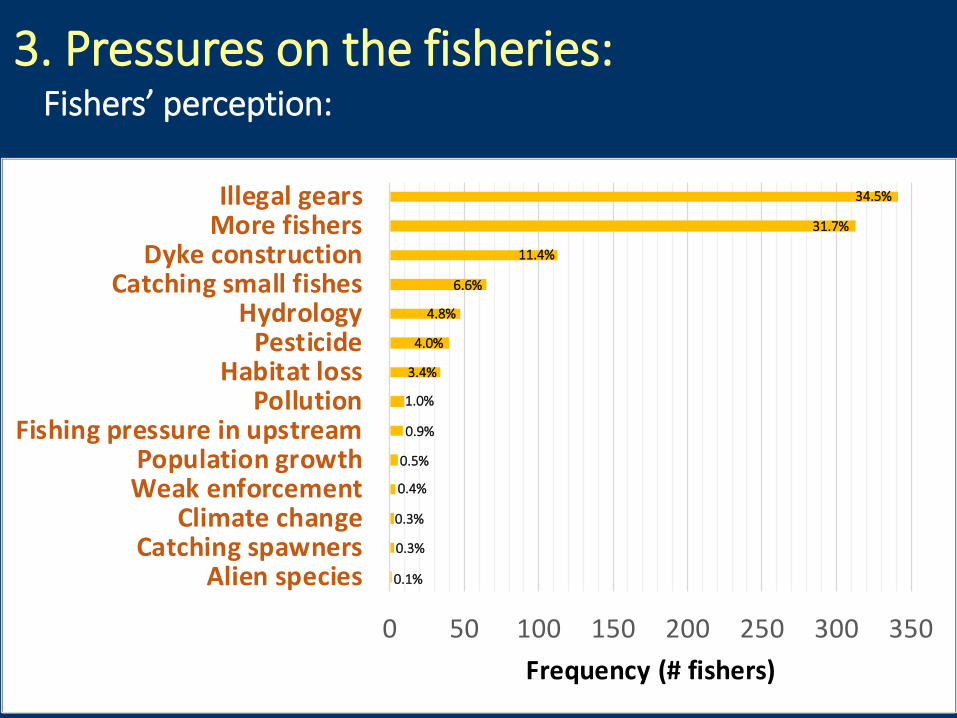
3. Pressures on the fisheries:
0 50 100 150 200 250 300 350
Alien speciesCatching spawners
Climate changeWeak enforcementPopulation growth
Fishing pressure in upstreamPollution
Habitat lossPesticide
HydrologyCatching small fishes
Dyke constructionMore fishersIllegal gears
Frequency (# fishers)
34.5%
31.7%
11.4%
6.6%
4.8%
4.0%
3.4%
1.0%
0.9%
0.5%
0.4%
0.3%
0.3%
0.1%
Fishers’ perception:

3. Pressures on the fisheries:Illegal gears in the MD:
- Fishing gears: >120 gear types: small and simple: Traps; Gillnetting; Hook and lines, Towing/ dragging; Castnet, Scooping, Collection by hand, Liftnet; Bagnet …
- Illegal gears: Fishing with electricity and chemicals; Gears with small mesh-size.
Motobyke taxi
0.09%
Aquaculture1.42% Small
business2.46%
Fishing only
22.44%
Labor28.03%
Agricultural activities45.55%
Fishers’ likelihoods:

3. Pressures on the fisheries:
% Catch of Exotic Species:
0.0
0.5
1.0
1.5
2.0
2.5
3.0
3.5
2007 2008 2009 2010 2011 2012 2013
% C
atch
of E
xotic
spec
ies
Year
Including 9 exotic species: Pterygoplichthys disjunctivus, Colossoma macropomum, Oreochromis sp., Hypophthalmichthys molitrix, Clarias gariepinus, Labeo rohita, Cyprinus carpio, Ctenopharyngodon idella, Hypophthalmichthys nobilis.
Exotic species: Fishers’s cacth monitoring program FP/MRC

3. Pressures on the fisheries:Habitat Loss in the MD: Rice…
Vo Tong Xuan (1975) Wyatt et al. (2012)
Rice farming: Change from Floating rice (6 months/crop , ~2tons/ha/ crop, 1 crop/year only, planting during flooding season) to TN rice –“God of agriculture rice” - (3 months/crop, 5-7 tons/ha/crop, up to 3 crops/year, planting in any season).
1975: Floating rice dominated2012: High yield rice +
Intensive
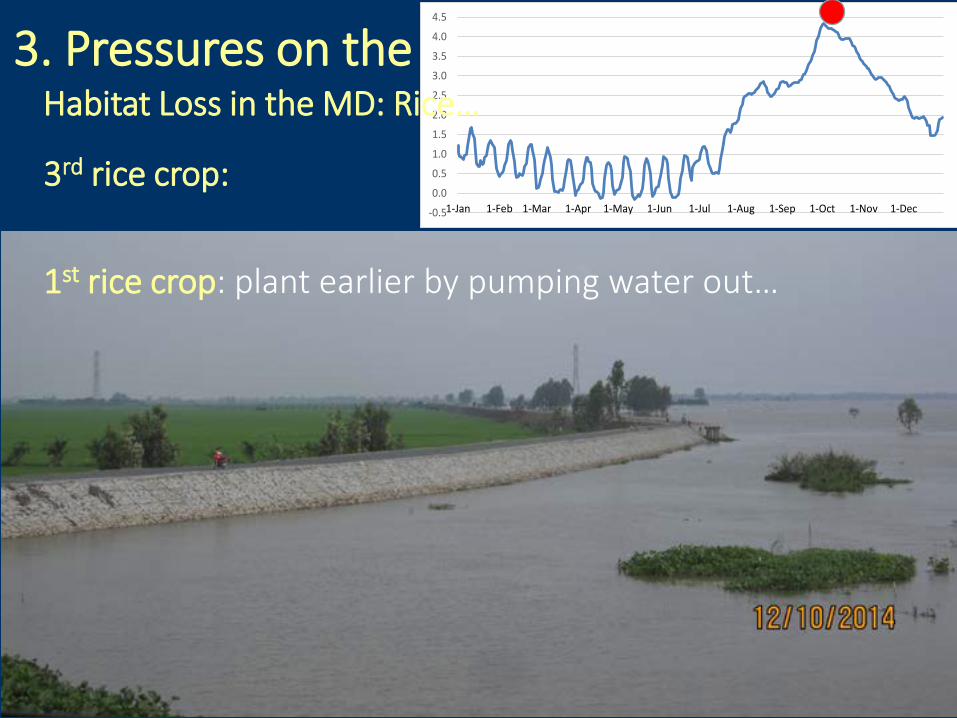
3. Pressures on the fisheries:
-0.5
0.0
0.5
1.0
1.5
2.0
2.5
3.0
3.5
4.0
4.5
1-Jan 1-Feb 1-Mar 1-Apr 1-May 1-Jun 1-Jul 1-Aug 1-Sep 1-Oct 1-Nov 1-Dec
3rd rice crop:
Habitat Loss in the MD: Rice…
1st rice crop: plant earlier by pumping water out…

3. Pressures on the fisheries:
Inland fish yield & Rice farming areas:
0
250
500
750
1,000
1,250
1,500
1,750
2,000
0
20,000
40,000
60,000
80,000
100,000
120,000
140,000
160,00019
9519
9619
9719
9819
9920
0020
0120
0220
0320
0420
0520
0620
0720
0820
0920
1020
1120
1220
13
Rice
farm
ing
area
(tho
u. H
a)
Inla
nd fi
sh y
ield
(tho
u. to
ns)
Inland capture yield
Rice farming area
Negative relationship: p<0.005
Habitat Loss in the MD: Rice…

3. Pressures on the fisheries:Water control structure:• Every dot is a registered
water control structure.• Loss of connectivity = loss
of productivity in floodplain/riverine fisheries.
The MRC water structures map
JICA/MARD’s project: in 7 coastal provinces. Structural: Saline intrusion prevention sluice gate contruction; Seashore protection and improvement. Non-Structural: Cropping calendar adjustment and improvement….

3. Pressures on the fisheries:Hydropower dams:9 planned dams on LMB
(mainstream) – two under construction.
23 existed dams (> 20 MW) on tributaries.
Many more tributary dams are projected or under construction.
- Cambodia: 20 projects (1 Ope; 1 Und; 0 Lic; 18 Plan).
- Laos: 100 projects (21 Ope; 25Und; 16 Lic; 38Plan).
- Thailand: 7 Ope prjects.- Viet Nam: 15 projects (13 Ope; 1 Und;
0 Lic; 1 Plan). Niel et al. (2014)

3. Pressures on the fisheries:Linkage Between Drivers and Impacts:
Hydropower Projects Other exogenous factors
Changes in River Flows, Sediment Transport, and
Water Quality
Obstructions in Fish Migration Routes &Habitat Connectivity
Changes in Fish Habitat Quality, Quantity, &
Productivity
Fisheries Impacts

4. Opportunities and mitigation:Fisheries’ characteristics:
Inland Fisheries Marine FisheriesSmall-scale gears Large commercial gearsInformal Formal (e.g. licenced) Dispersed, often hidden by geography/vegetation
Visible, large gears at open sea
Landings dispersed and informal
Landing centralized and visible
Part-time fishing dominates (e.g. mixed farming/fishing lifestyles on river floodplains)
Professional fishing dominates, i.e. very few part-time fishers
Most catch consumed domestically
Most is exported out of the community of capture
Many people participate Few people participate
Modified from: FAO RAP Publication 2002/11

4. Opportunities and mitigation:Mitigation measures:
Mitigation measures to ameliorate likely impacts focus on:
• in-take and outfall locations;
• fish passage facilities – upstream and downstream,
• ‘Friendly’ turbine design;
• measures to ameliorate the potential impact of depleted reaches – allocation of flows;
• replacement of lost fisheries – aquaculture and stocking;
• need habitat connectivity to complete fish life cycle;
• fish friendly irrigation scheme.

Thank youEspecially to AFS
and SEAFDEC