Fisheries Applications and Biological Impacts of Artificial Habitats

Fisheries Management and
Biological Reference Points
(BRPs)Dr. P U ZachariaDr. P U Zacharia
Head, DFD, CMFRI, Kochi
Common property and “Tragedy of the
commons”
� In the ‘Common’ grazing areas in England, grass disappeared as citizens put more cattle. Everyone lost as commons became overgrazed.
� To prevent ‘TOC’ most common property � To prevent ‘TOC’ most common property resources like fish are to be managed for the public.
� Who will manage?
By govt. by agencies who employ trained people.
up to 12 nm (territorial waters) by state govts. and beyond that managed by Union govt.
Renewable resources and surplus
production
� Fish is renewable
� For a fish species to survive each pair has to produce two offsprings
Surplus production
� In an un-fished population the biomass will approach the carrying capacity and have more larger and older population. Their presence will allow only a smaller % of younger fish to survive to become older fisha smaller % of younger fish to survive to become older fish
� By fishing many older fish will be removed and removal will allow many younger fish to survive and grow.
� This extra production with effect of fishing will result in surplus production.
� Un-fished population is relatively stable with moderate production whereas fished population is dynamic one with higher turnover of younger fish as older are replaced by younger and faster growing fish. Some of the production must be allowed to survive and reproduce. The remaining or surplus production is available for harvest.

Factors affecting surplus production
� Carrying capacity
� Habitat loss or modifications- pollution, loss of coastal wetlands and sea grass- mangroves, destruction of spawning areas, construction of dams etc.
� Changes in envtl. conditions and carrying capacity

Definitions
� Species: A group of similar organisms that can
freely interbreed
� Population: A group of individuals of the same
species living in a certain areaspecies living in a certain area
� Stock: A harvested or managed unit of fish- can be
separated by geographical boundaries. Sometimes,
more than one species is included in stock as they
are harvested together as though they are one
species

Stock assessment
� All the activities a fishery biologist will do to
describe the conditions or status of a stock.
� A SA report will contain information on health of a
stock and recommendations or action that would stock and recommendations or action that would
maintain or restore the stock
� SA- consists of two activities-one is learn abut the
biology of species in stock and second learn about
fishing activities

Stock Assessment based on
fishery
� Is the simplest one
� No need for knowledge on biology of stock
� Needs to know the history of landings and effort expended to catch the stock
Amount of effort by fishermen is important� Amount of effort by fishermen is important
� Landings divided by effort CPUE
� AFH or Vessel days or hook hours in longline fishery
� Fisheries follow a pattern in relation to CPUE
� When catch and CPUE declines, indication that stock is overfished

Draw backs of this method
� Insufficient landing data
� Insufficient effort data
� New technologies make hard to compare the effort today to several years ago
OvercapitalizationOvercapitalization
� If fishing effort is very high than required
� More capital has been invested than fishery support
� Also the ability to increase the effort without increasing the number (by double number of nets or new technology or engine HP)

Assessment when little biology is
known
� The age of spawning of the fish
� The age composition of catch
Recruitment overfishing
� When most of the fish are caught before they can spawn and replace themselves
Signs: Signs:
� Declining landings
� Greater effort to catch less quantity of fish
� Decline in average size of the catch
� Protection comes in the form of length limits (MLS) or gear restrictions (minimum mesh size of trawl or GN)
� Overfishing can still occur as smaller fish produce less offsprings than larger ones
� Protecting smaller fish does not guarantee overfishing
Closed fishing seasons and MPAs
� Closed season when stock is spawning
� Not well taken by biologists as a fish caught before, during or after spawning is not available for spawning in the next year
� Therefore to protect fishes to spawn and determine the quantity safely removed without harming the stock.
� Exceptions are when spawners gather at a place and vulnerable to be caught-MPA are suggested in such cases

Information for more complete assessment
A. Information about fishery
1. The kinds of fishermen in the fishery (trawlers, longliners, gillnetters, etc.).
2. Quantity of fish caught by each kind of fisherman over many years.
3. Fishing effort expended by each kind of fisherman over many years.
4. The age structure of the fish caught by each group of fishermen.4. The age structure of the fish caught by each group of fishermen.
5. The ratio males to females in the catch.
6. How the fish are marketed (preferred size, etc.).
7. The value of fish to the different groups of fishermen.
8. The time and geographic area of best catches.

B. Information about biology
1. The age structure of the stock.
2. The age at first spawning.
3. Fecundity (average number of eggs each age fish can produce).
4. Ratio of males to females in the stock.
5. Natural mortality (the rate at which fish die of natural causes).
6. Fishing mortality (the rate at which fish die of being harvested).
7. Growth rate of the fish.7. Growth rate of the fish.
8. Spawning behavior (time and place).
9. Habitats of recently hatched fish (larvae), of juveniles and of adults.
10. Migratory habits.
11. Food habits for all ages of fish in the stock.
12. Estimate of the total number or weight of fish in the stock

Fishery dependent and independent
data
Fishery dependent: When information is collected by landings by fishermen
Fishery independent: By biologists by their own sampling programme
High reliability on fishery dependent data
� When fishermen do not provide good data then the fishery will be managed on the data available, which may be incomplete.
� This can result in overly restrictive management which is wasteful or can result in continued overfishing and declining catches.
� It is in the long-term interest of fishermen to provide the best data possible.
Age and growth
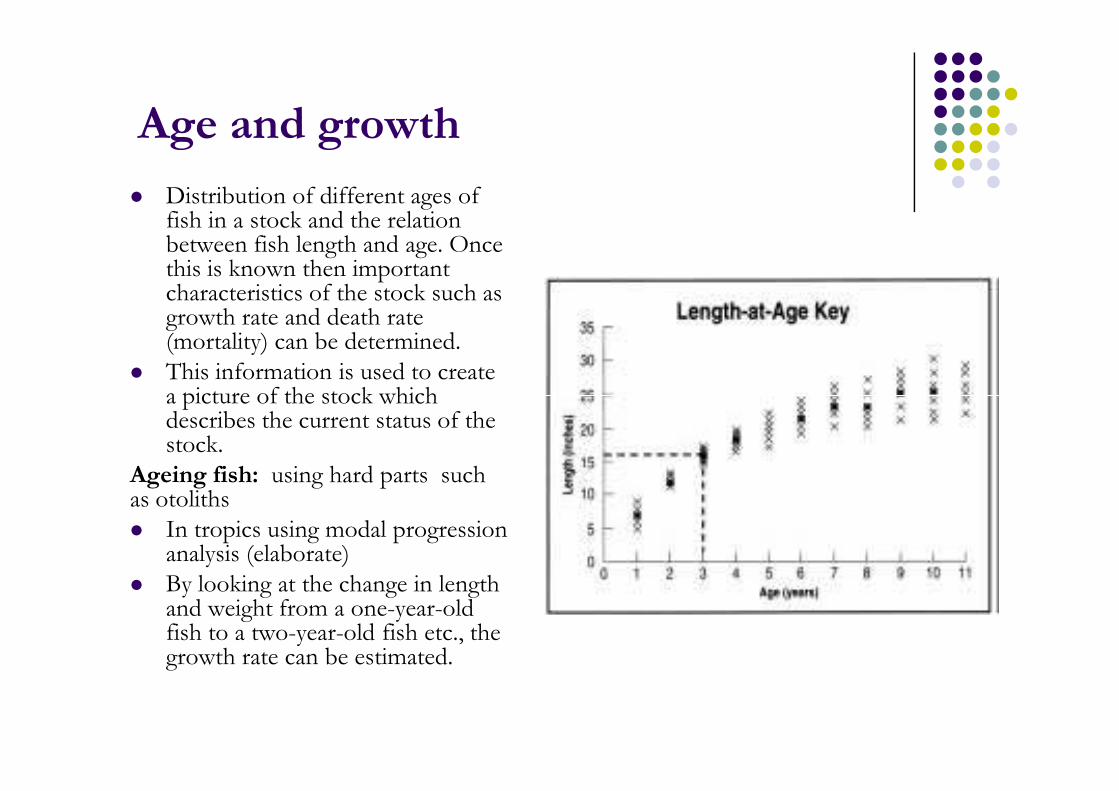
� Distribution of different ages of fish in a stock and the relation between fish length and age. Once this is known then important characteristics of the stock such as growth rate and death rate (mortality) can be determined.
� This information is used to create a picture of the stock which a picture of the stock which describes the current status of the stock.
Ageing fish: using hard parts such as otoliths
� In tropics using modal progression analysis (elaborate)
� By looking at the change in length and weight from a one-year-old fish to a two-year-old fish etc., the growth rate can be estimated.

Age structure and recruits
� When enough fish have been aged a age structure of the catch can be obtained (catch curve)
� Note: more 2 year olds than 1year olds� Probable reason: The one-year-olds may not
be abundant in the same areas as the older fish or they may not be caught by the fishing gear
� For a fishery biologists they say that the one-year-fish are “not fully recruited”year-fish are “not fully recruited”to the fishery while the two-year-olds are considered to be “fully recruited.”
The first year a fish is readily harvested in a fishery, it is referred to as a recruit.
FA is based on portion of stock that is fully recruited
Age structure contd
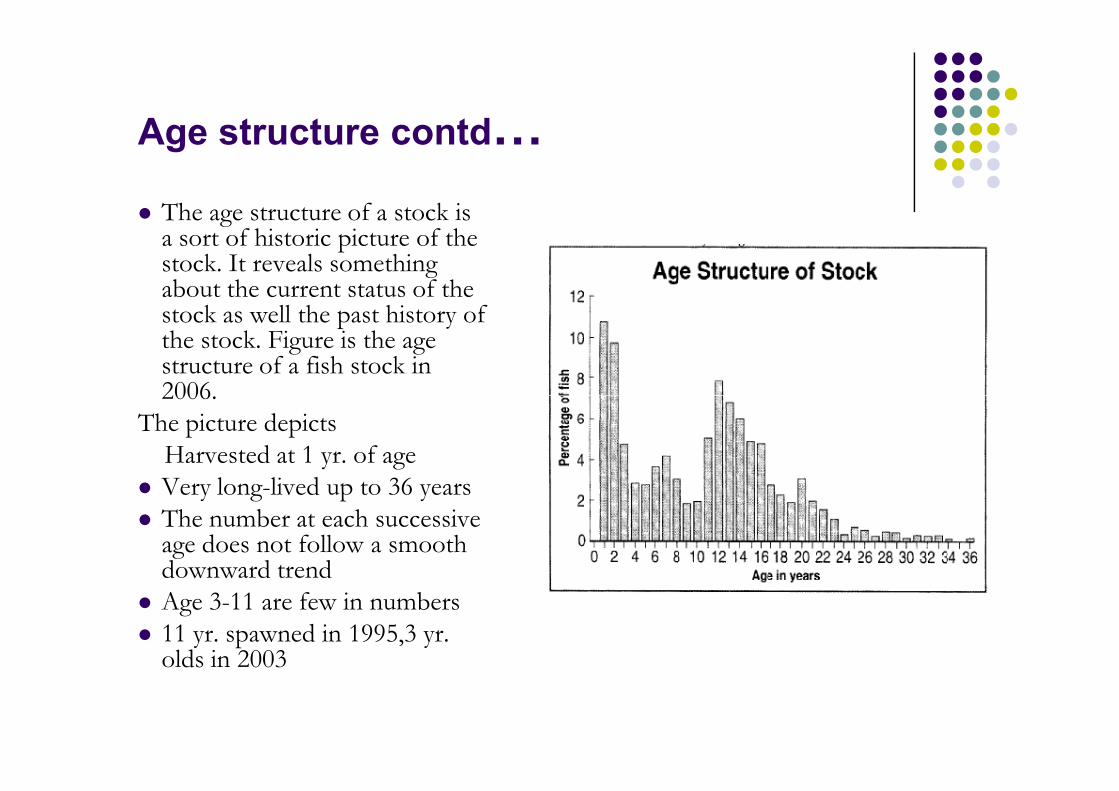
� The age structure of a stock is a sort of historic picture of the stock. It reveals something about the current status of the stock as well the past history of the stock. Figure is the age structure of a fish stock in 2006.2006.
The picture depicts Harvested at 1 yr. of age
� Very long-lived up to 36 years� The number at each successive
age does not follow a smooth downward trend
� Age 3-11 are few in numbers� 11 yr. spawned in 1995,3 yr.
olds in 2003
Age structure of stock
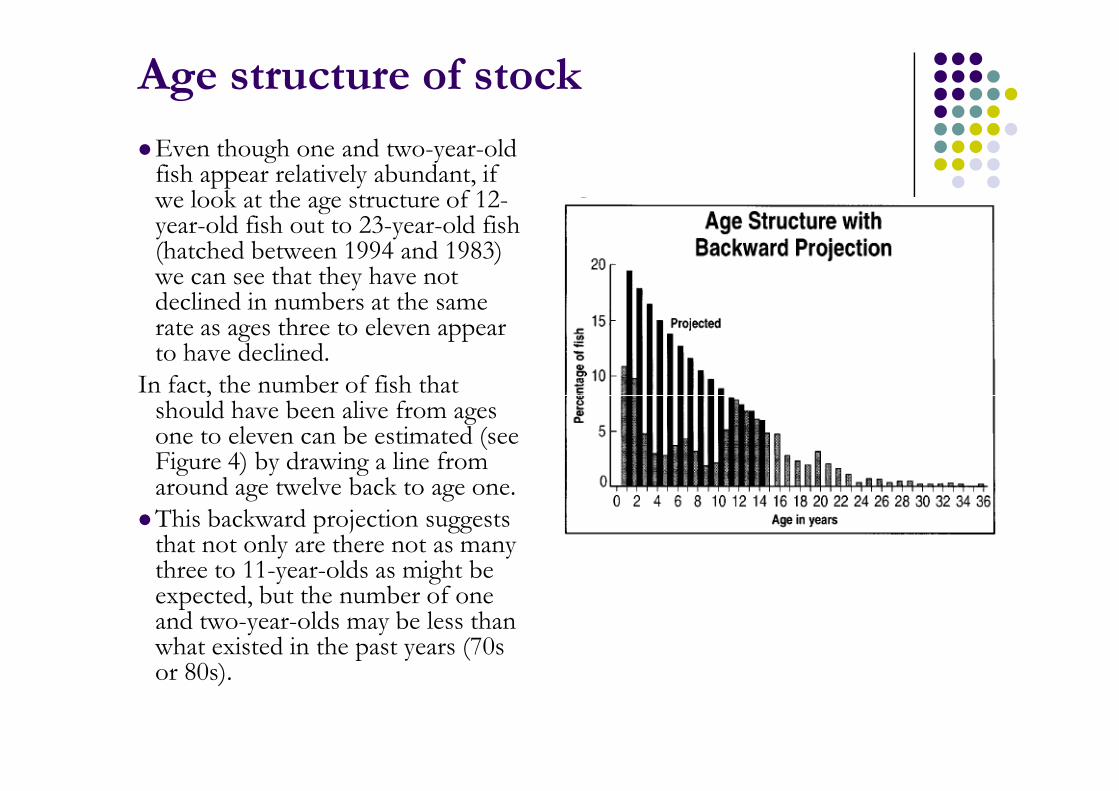
�Even though one and two-year-old fish appear relatively abundant, if we look at the age structure of 12-year-old fish out to 23-year-old fish (hatched between 1994 and 1983) we can see that they have not declined in numbers at the same rate as ages three to eleven appear to have declined.
In fact, the number of fish that should have been alive from ages
In fact, the number of fish that should have been alive from ages one to eleven can be estimated (see Figure 4) by drawing a line from around age twelve back to age one.
�This backward projection suggests that not only are there not as many three to 11-year-olds as might be expected, but the number of one and two-year-olds may be less than what existed in the past years (70s or 80s).

Inferences from age structure
� Fishery biologists take this kind of pictorial information and quantify it in
order to further describe the stock and the health of the stock
� The age distribution of a stock provides a graphic picture of the stock as it
exists today and, in the case of long-lived fish, can reveal something about
the past history. The picture by itself does not reveal how much fish can
be caught but provides information which leads to the answer.

Mortality
� The goal of fishery management was to determine how many (numbers) or how much (weight) fish can be safely harvested from a stock.
� Or how many fish in a stock can die and still allow the stock to maintain itself. The rate at which fish die is mortality or the mortality rate.
� If 1000 fish are alive at the beginning of the year and 200 fish die at the end of a year, then the annual mortality rate
� If 1000 fish are alive at the beginning of the year and 200 fish die at the end of a year, then the annual mortality rate is 20 percent (200 divided by 1000) and the survival rate is 80 percent (800 divided by 1000).
� Each year some fish die whether they are harvested or not. The rate at which fish die of natural causes is called natural mortality and the rate at which fish die from fishing is called fishing mortality.

Instantaneous rates and Z from age
structure
� To use them in mathematical formulas the annual percentages should be converted to “instantaneous rates”.
� Natural mortality (M) and fishing mortality (F) can be added together to get total mortality (Z).
� FMSY refers to the management reference point, maximum sustainable yield (MSY). FMSY is the fishing mortality rate that would result in the maximum sustainable yield for a stock of fish.maximum sustainable yield for a stock of fish.
Determining (total) mortality from age structure
There are 6.5mi 2 yr olds and 2.5 mi 6yr olds, Mortality = 6.5-2.5=4.0/6.5=0.62 or 62%. This took place over a 5 year period
Therefore annual Z rate is 62/5=0.12 which is equal to inst. rate of 0.13
However, this does not reveal how much is due to F or M
Spawning Potential Ratio (SPR)� The spawning potential ratio incorporates the principle that enough fish have to
survive to spawn and replenish the stock at a sustainable level.
� SPR is the number of eggs that could be produced by an average recruit over its lifetime when the stock is fished divided by no of eggs produced by an average recruit when it is unfished,
� SPR compares the spawning ability of a stock in the fished condition to the stock’s spawning ability in the unfished condition.
� imagine that 10 fish survive the first couple of years of life and are recruited in the fishery. Four are caught before they spawn (no eggs produced), three others are caught after they spawn once (some eggs produced), and the last three live to caught after they spawn once (some eggs produced), and the last three live to spawn three times (many eggs produced) before dying of old age. During their lifetime, the 10 fish produced 1 million eggs and the average recruit produced 100,000 eggs (1 million divided by 10).
� In the unfished population, out of 10 fish survive, three die of natural causes after spawning (some eggs produced) and the other seven spawn three times (many eggs produced) before dying of old age. During their lifetime, these 10 fish produced 5 million eggs and the average recruit produced 500,000 eggs (5 million divided by 10).
� The spawning potential ratio is then the 100,000 eggs produced by the average fished recruit divided by the 500,000 eggs produced by the average unfished recruit and is equal to 0.20 or 20 percent.
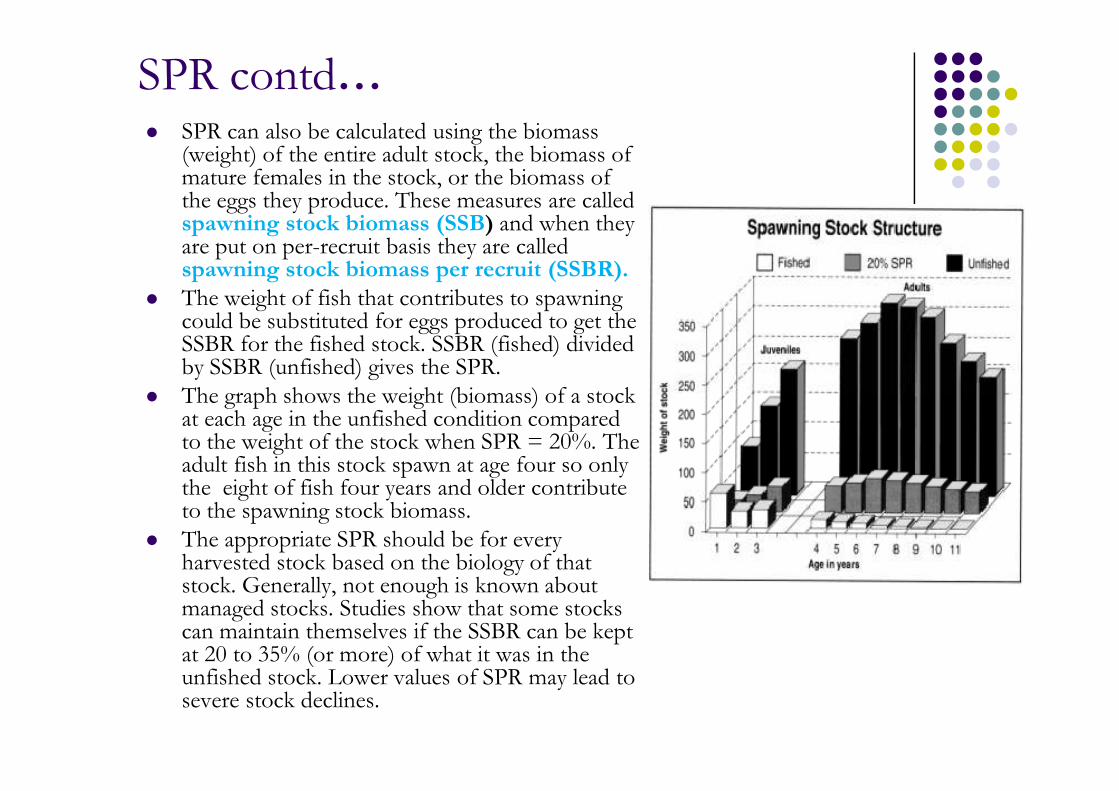
SPR contd…� SPR can also be calculated using the biomass
(weight) of the entire adult stock, the biomass of mature females in the stock, or the biomass of the eggs they produce. These measures are called spawning stock biomass (SSB) and when they are put on per-recruit basis they are called spawning stock biomass per recruit (SSBR).
� The weight of fish that contributes to spawning could be substituted for eggs produced to get the SSBR for the fished stock. SSBR (fished) divided by SSBR (unfished) gives the SPR.
� The graph shows the weight (biomass) of a stock � The graph shows the weight (biomass) of a stock at each age in the unfished condition compared to the weight of the stock when SPR = 20%. The adult fish in this stock spawn at age four so only the eight of fish four years and older contribute to the spawning stock biomass.
� The appropriate SPR should be for every harvested stock based on the biology of that stock. Generally, not enough is known about managed stocks. Studies show that some stocks can maintain themselves if the SSBR can be kept at 20 to 35% (or more) of what it was in the unfished stock. Lower values of SPR may lead to severe stock declines.

Other kinds of overfishing
� Another type of overfishing is called growth overfishing:Growth overfishing occurs when the bulk of the harvest is made up of small fish that could have been significantly larger if they survived to an older age. The concern here is that the fishery would produce more weight if the fish were harvested at a larger size. harvested at a larger size.
� The question biologists, economists, managers, and others must answer is how much bigger or older should the fish get before they are harvested.
� Fish grow rapidly at the first few years and grow slow in later years and better catch them when the growth rate levels off.

What age the fish should be caught
• There are two opposing forces at work in a stock of fish. Growth increases the weight of fish while mortality reduces the number of fish. These forces can be illustrated by following a year class (all fish hatched the same year) as they grow and die over a number of years.
• Instead of graphing the numbers of fish at each age as before, it is also necessary to graph the total weight of fish at each age as before, it is also necessary to graph the total weight of the year class.
• The weight of the year class is greatest when the fish are six to seven years old. In later years, the death rate overcomes the growth rate and the weight of the year class declines.
• Even though there are more fish to be harvested at a younger age, there is more weight of fish to be harvested at a later age.

Yield and Yield per recruit
� The shape of the curve in Figure is determined by the growth rate and the mortality rate.
� Different rates of harvest (fishing mortality) will give different curves. Using computers, fishery biologists can generate a great number of these curves to make a composite graph called a yield diagram. These diagrams composite graph called a yield diagram. These diagrams show the harvest (also called yield) that can be expected from different combinations of harvest rates and the age of the fish when they are first captured.
� As with spawning stock biomass, biologists often like to put the calculations on a per-recruit basis and so the graphs are often called yield-per-recruit diagrams.

Economic overfishing
� Another type of overfishing occurs when fishermen catch fish
before they reach their maximum price per kg. The idea here
is that the catch will have a higher value if the harvest is
delayed when there is a premium paid for larger size fish.
For example, 50 kg of 20-to-the-kg shrimp are worth � For example, 50 kg of 20-to-the-kg shrimp are worth
considerably more than 100 kg of 70-to-the-kg shrimp. As
with growth overfishing, the point of maximum value of the
stock may be determined. Beyond that point, individual large
shrimp may be more valuable but there will not be enough left
to equal the value of catches of the more abundant but less
valuable smaller shrimp.

Virtual Population Analysis (VPA)
� Year Class: A group of fish born in the same year
� Using the number of fish caught each year from an year class and
mortality rate the size of the year class can be reconstructed
� For example, if the fish born in 1998 (1998 year class) were first
harvested in 2000 and 1,000 fish from the year class were caught
during the first year, 900 fish the second year, 800 fish the third year, during the first year, 900 fish the second year, 800 fish the third year,
700 fish the fourth year, and 600 fish the fifth year (2004), then there
had to be at least 4,000 fish alive ie,
1,000+ 900+800+700+600) in the year class when fishing started in
2000.
� If the natural and fishing mortality rates are known or can be
estimated, then the number of fish in the year class that should have
been alive to produce the catch of fish can be calculated.

VPA contd..,
� If the natural and fishing mortality rates are known or can be estimated, then the number of fish in the year class that should have been alive to produce the catch of fish can be calculated.
� If 600 fish were caught in 2004, there had to be more than 600 fish alive at the end of 2003, because some would have died of natural causes during 2004 and it is unlikely that fishermen would catch all the fish in that year class (fishing mortality of 100%). For eg, assume that natural mortality equaled 20% and fishing mortality also equaled 20%
� Since a 20% fishing mortality removed 600 fish from the stock, then a 20% � Since a 20% fishing mortality removed 600 fish from the stock, then a 20% natural mortality would remove an equal number of fish (600) from the stock. This means at least 1200 fish were alive at the end of 2003. However, only some of the fish that were alive were caught or died, so there must have been more than 1200 fish alive. Dividing 1200 fish alive by the total mortality rate (20% + 20% = 40%) (1200/0.4) gives 3,000 fish alive at the end of 2003. This process can be continued backward until the total number of fish in the 1998 year class is estimated.
� The reconstructed year class then can be tested with different rates of fishing mortality to see what the effects might be, or the information can be used in other calculations such as determining the spawning stock biomass.
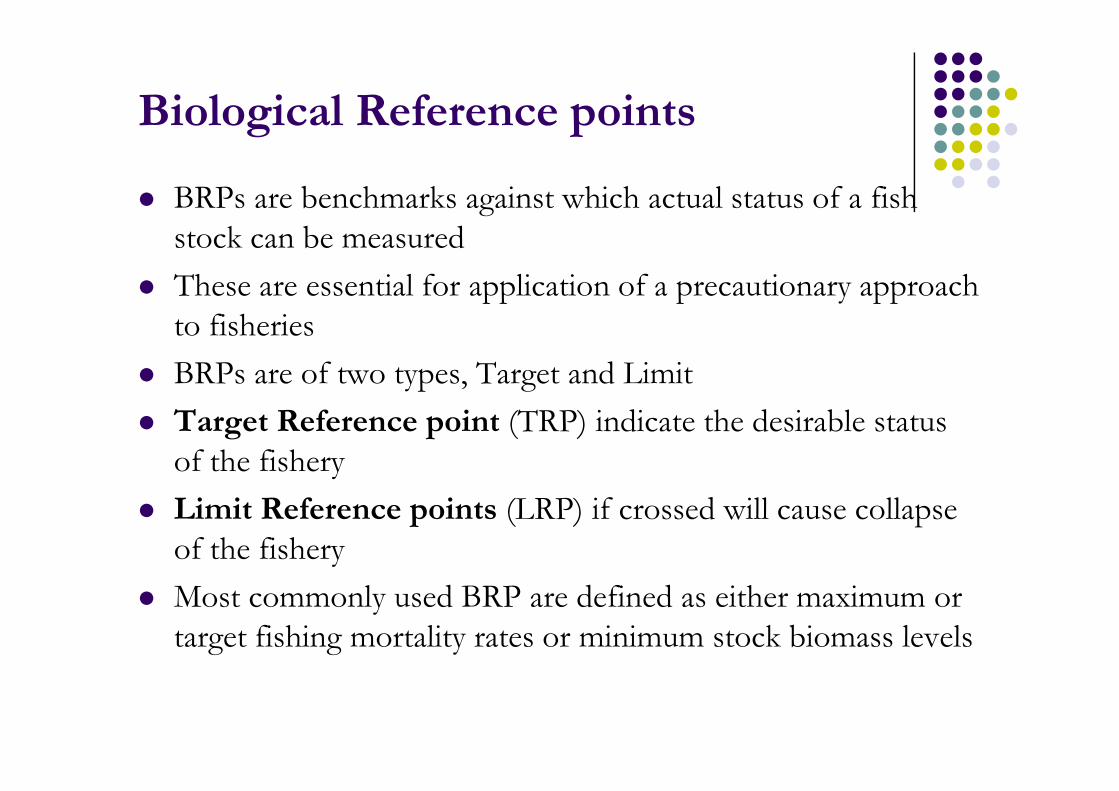
Biological Reference points
� BRPs are benchmarks against which actual status of a fish
stock can be measured
� These are essential for application of a precautionary approach
to fisheries
� BRPs are of two types, Target and Limit
� Target Reference point (TRP) indicate the desirable status
of the fishery
� Limit Reference points (LRP) if crossed will cause collapse
of the fishery
� Most commonly used BRP are defined as either maximum or
target fishing mortality rates or minimum stock biomass levels

Biological reference points contd….� The long-term objectives for fisheries management should take into
consideration scientific fishing research and population dynamics, as well as the climatic changes that may affect the stocks.
� In order to define these long-term objectives we have to consider the values of the fishing level, which allow bigger catches in weight, whilst also ensuring the conservation of the stocks. The extreme values of the biomass or the fishing level, which might seriously affect the self renovation of the stocks, also have to be considered. These fishing level values, of catch and biomass are designated as biological reference points (BRP). reference points (BRP).
� The Target Reference Points, TRP are BRP defined as the level of fishing mortality or of the biomass, which permit a long-term sustainable exploitation of the stocks, with the best possible catch. For this reason, these points are also designated as Reference Points for Management. They can be characterized as the fishing level Ftarget (or by the Biomass, Btarget). The most well known Ftarget is F0.1 but other values, like Fmax, FMSY are also used.

The Limit Reference Points
� The Limit Reference Points, LRP are maximum values of fishing mortality or minimum values of the biomass, which must not be exceeded. Otherwise, it is considered that it might endanger the capacity of self-renewal of the stock.
� In the cases where fishing is already too intensive, the LRP can be important to correct the situation or to prevent it from getting worse.
The LRP are limit values, mainly concerned with the conservation of marine � The LRP are limit values, mainly concerned with the conservation of marine stocks and they are therefore also referred to as reference points for conservation.

Examples of different types of indicators and reference points used to guide
fishery management actions.
Purpose Categories and examples
Indicators Measure the current positionof the fishery for a range ofdifferent dimensions or criteria
� State, e.g. stock biomass, Bnow ; total catch• Pressure, e.g. fishing effort; fishing mortality, Fnow• Response, e.g. quota allowed; size limit set; % of total area set aside as MPA
Performanceindicators
Measure the current state ofthe fishery, relative to theassociated reference points
• Bnow / BMSY• Fnow / FMSY
Conceptual Used to define decision control rule • Limit reference points (LRPs) identify situations to be avoided, reference points
frameworks that guide management actions
e.g. Blim , Flim• Target reference points (TRPs) identify values to aim at, e.g. MSY 2
• Precautionary reference points (PRPs), trigger management actions before a LRP is reached, and should be set according to the uncertainty in the analysis and the risk tolerance of the fishery stakeholders, e.g. Bpa , Fpa
Technicalreference points
Provide explicit mathematicaldefinitions and/or proceduresfor quantifying the conceptualreference points
• MSY-based, e.g. BMSY , FMSY , as proposed by UNCLOS etc• Proxies1 for MSY, e.g. F0.1 , Fmax• Protection of reproductive capacity, e.g. %SPR , MBAL etc, often used as LRPs
• Multispecies, e.g. permitted bycatch levels• Economic and social, e.g. FMEY
Proxy reference points are used when the preferred reference points can not be calculated e.g. due to unavailable data.MSY is also used as a limit reference point in some fisheries (e.g. in USA)
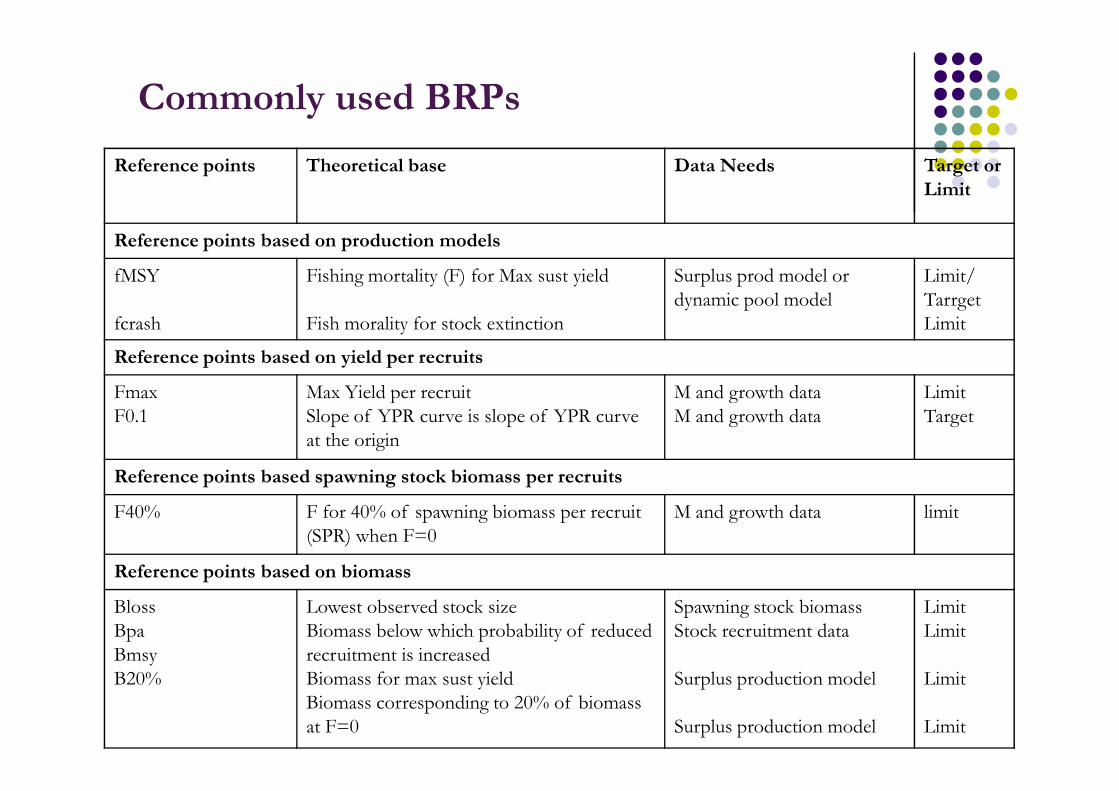
Commonly used BRPs
Reference points Theoretical base Data Needs Target or
Limit
Reference points based on production models
fMSY
fcrash
Fishing mortality (F) for Max sust yield
Fish morality for stock extinction
Surplus prod model or
dynamic pool model
Limit/
Tarrget
Limit
Reference points based on yield per recruits
Fmax Max Yield per recruit M and growth data LimitFmax
F0.1
Max Yield per recruit
Slope of YPR curve is slope of YPR curve
at the origin
M and growth data
M and growth data
Limit
Target
Reference points based spawning stock biomass per recruits
F40% F for 40% of spawning biomass per recruit
(SPR) when F=0
M and growth data limit
Reference points based on biomass
Bloss
Bpa
Bmsy
B20%
Lowest observed stock size
Biomass below which probability of reduced
recruitment is increased
Biomass for max sust yield
Biomass corresponding to 20% of biomass
at F=0
Spawning stock biomass
Stock recruitment data
Surplus production model
Surplus production model
Limit
Limit
Limit
Limit

FMSY and Fcrash
Definitions� FMSY is defined as being the
value of F which produces the maximum yield in the long-term. It is necessary to select an S-R relation to estimate FMSY. This point is different from Fmax.point is different from Fmax.
� Fcrash is a limit that corresponds to a very high value of F, showing a great probability of collapse of the fishery. Fcrash is the fishing level F which will produce a long-term spawning biomass per recruit (S/R) equal to the inverse of the instantaneous rate of variation of R with the biomass, at the initial point (S = 0, R = 0).
Equilibrium yield as a function of fishing mortality determined from an age-structured production model (after Shepherd, 1982)
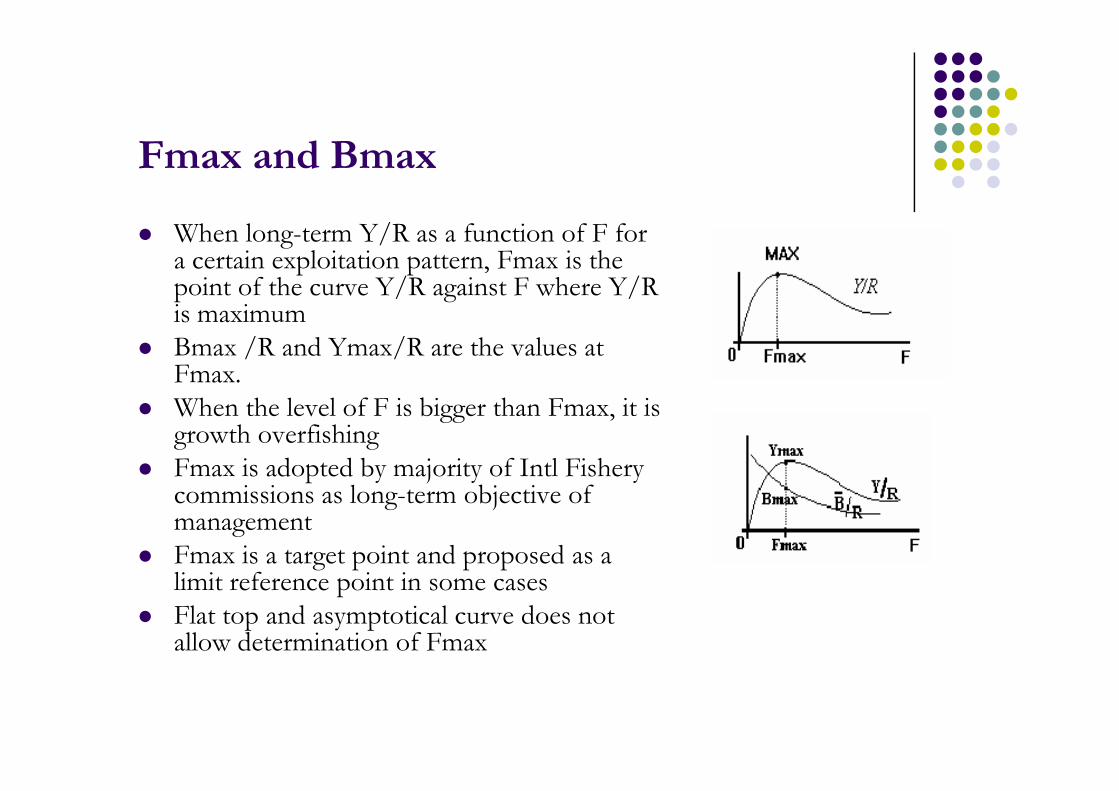
Fmax and Bmax
� When long-term Y/R as a function of F for a certain exploitation pattern, Fmax is the point of the curve Y/R against F where Y/R is maximum
� Bmax /R and Ymax/R are the values at Fmax.
When the level of F is bigger than Fmax, it is � When the level of F is bigger than Fmax, it is growth overfishing
� Fmax is adopted by majority of Intl Fishery commissions as long-term objective of management
� Fmax is a target point and proposed as a limit reference point in some cases
� Flat top and asymptotical curve does not allow determination of Fmax

F0.1
� Consider the long-term yield per recruit, Y/R, as a function of the coefficient of fishing mortality, F. One value of air(Y/R), corresponds to each fishing level, F. The air(Y/R) is maximum when F = 0 and decreases, being zero when F = Fmax.
� The point F0.1 is the value of F where air(Y/R) is equal to 10 percentof air(Y/R) maximum. Or F at which the slope of the YPR curve is 10 percent of its slope at the origin.of its slope at the origin.
� F0.1 is particularly useful in cases where Fmax occurs at infinitely high values of F, Fig A. Y/R showing the target reference pointas often found for the higher sizes at first capture. It is also widely applied, however, even where a clear Fmax does exist.
Fig B. Long-term variation of Y/R and B/R against
F and points corresponding to Fmax and F0.1
Further Reading
� Stock assessment for fishery management – A framework guide to the stock assessment tools of the Fisheries Management Science Programme (FMSP). FAO Fisheries Technical Paper. No. 487. Rome, FAO. 2006. 261p.
� Understanding fisheries management-A manual for understanding the � Understanding fisheries management-A manual for understanding the federal fisheries management process including analysis of the 1996 sustainable fisheries act. R. K. Wallace and K.M. Fletcher, Aubrun and Mississippi University, USA
� Fish stock assessment manual E.L. Cadima, FAO Fisheries Technical Paper 393. DANIDA-FAO, 2003
� Biological reference points for stocks in a multispecies context J.S. Collie and H.S. Gislason. Can J Fish &Aquat Sciences, 58 (11), 2167-2176