Effluent, nutrient and organic matter export from shrimp and fish ...
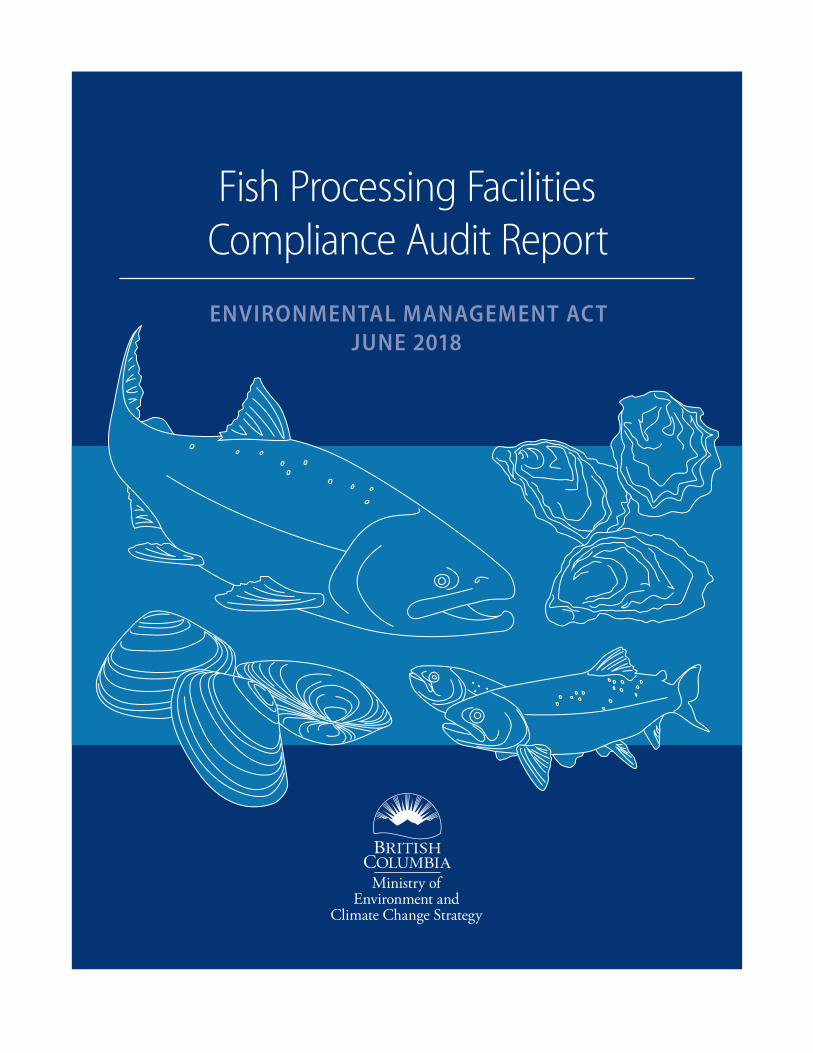
Fish Processing Facilities Compliance Audit Report
ENVIRONMENTAL MANAGEMENT ACTJUNE 2018
Table of Contents
2 EXECUTIVE SUMMARY
3 LIMITATIONS
3 INTRODUCTION
4 OVERVIEW OF FISH PROCESSING FACILITIES IN B.C.4 Fish Processing Facilities4 Economic Role4 Distribution of Fish Processing Facilities4 Types of Fish Processed7 Regulation of Fish Processing Facilities9 Effluent Quality from Fish Processing Facilities12 Treatment of Effluent from Fish Processing Facilities12 Emerging Issues of Concern
13 COMPLIANCE REVIEW13 Inspection Approach14 Inspection Results22 Potential Environmental Impact from Instances of Non-Compliance23 Compliance Response24 Impact Assessment
27 PERMIT REQUIREMENTS REVIEW27 Permit Requirements 31 Foundational Environmental Protection Provisions Assessment33 Industry Concerns
33 BEST ACHIEVABLE TECHNOLOGY (BAT)34 Best Achievable Technology (BAT) Review
37 CONCLUSIONS AND RECOMMENDATIONS
40 APPENDIX 1: LEGISLATION40 Environmental Management Act (EMA)40 Waste Discharge Regulation (WDR)
41 APPENDIX 2: LIST OF AUTHORIZED FISH PROCESSING FACILITIES INCLUDED IN THE AUDIT
42 APPENDIX 3: NON- COMPLIANCE DECISION MATRIX AND COMPLIANCE CATEGORIES42 Non-Compliance Decision Matrix43 Categories of Likelihood of Compliance44 Levels of Escalating Environmental, Human Health or Safety Impacts
45 APPENDIX 4: REFERENCES

List of Tables
8 Table 1 – Applicable Legislations and Programs in the Fish Processing Industry
10 Table 2 – Typical Parameters of Concern in Fish Processing Industry Effluent (modified from WorleyParsons, 2011)
11 Table 3 – Fish Products Industry Raw Effluent Quality (modified from WorleyParsons, 2011 and USEPA, 1975)
11 Table 4 – Fish Products Industry Raw Screened Effluent Quality (modified from WorleyParsons, 2011 and Novatec, 1994)
25 Table 5 – Effluent Discharge Quality Results
28 Table 6 – Occurrence of Effluent Discharge Quality Limits in Fish Processing Facility Permits
30 Table 7 – Occurrence of Effluent Discharge Quality Monitoring Requirements in Fish Processing Facility Permits
31 Table 8 – Occurrence of receiving environment quality monitoring requirements in fishprocessing Facility Permits
41 Table 9 – List of fish processing facilities included in the audit
List of Figures
5 Figure 1 – Locations of the Fish Processing Facilities Included in the Audit
6 Figure 2 – Types of Seafood Processed
6 Figure 3 – Mass of Fish and Seafood Processed per Year
6 Figure 4 – Volume of Effluent Discharged per Day
7 Figure 5 – Relative Tonnage of Seafood Processed
15 Figure 6 – Compliance Summary of Fish Processing Permits
16 Figure 7 – Compliance Summary of Authorized Discharges
18 Figure 8 – Compliance Summary of General Requirements
19 Figure 9 – Compliance Summary of Monitoring Requirements
20 Figure 10 – Compliance Summary of Reporting Requirements
21 Figure 11 – Compliance Summary of Fish Processing Permits
23 Figure 12 – Compliance Response
28 Figure 13 – Authorized Discharge Requirements in Fish Processing Permits
29 Figure 14 – General Requirements in Fish Processing Permits
30 Figure 15 – Monitoring Requirements in Fish Processing Permits
31 Figure 16 – Reporting Requirements in Fish Processing Permits
32 Figure 17 – Foundational Environmental Protection Provisions
| FISH PROCESSING FACILITIES COMPLIANCE AUDIT REPORT 2018: ENVIRONMENTAL MANAGEMENT AC T 2
the permits frequently do not contain effluent discharge quality limits and monitoring and reporting require-ments for discharge rate, discharge quality and receiving environment quality. It is recommended that the existing permits be amended to include these foundational environmental protection provisions.
Best achievable technology (BAT) for the sector includes preliminary treatment (solids removal), primary treatment (suspended solids removal), and disinfection where required to control the spread of fish pathogens. BAT for facilities operating continuously for more than six months of the year also may include secondary treatment (soluble BOD reduction). Most of the current permits authorize and require only preliminary treatment using fine screening. Two of the 30 permits additionally require primary treatment as well as disinfection. BAT should be considered in the determination of effluent discharge limits when amending these permits. Many of the permittees indicated that the costs associated with additional treatment would be too much of a burden on their current budgets and they would have to discontinue the operation of their facilities if additional treatment is required.
Executive Summary
The Ministry of Environment and Climate Change Strategy (ENV) has conducted an audit of the current effluent discharge authorizations under the Environmental Management Act (EMA) within the fish processing industry in British Columbia (BC). The audit was conducted in response to concerns about these effluent discharges and their potential impact on the environment and in particular, wild salmon.
The objectives of the audit were to conduct inspections to verify compliance under the regulatory requirements established in their authorizations, collect effluent samples to assess the characteristics of the effluent and determine whether the effluent is potentially causing pollution, assess whether the authorizations contain consistent foundational environmental protection provisions, and identify the best achievable technology (BAT) for the treatment of effluent.
Inspections were conducted for all 30 fish processing facilities authorized under EMA in BC. A total of 202 requirements were assessed for compliance within the 30 permits. Of the 202 permit requirements, the fish processing facilities were In Compliance with 44 percent of the requirements, Out of Compliance with 22 percent of the requirements and compliance was Not Determined for 10 percent of the requirements and Not Applicable for 24 percent of the requirements. In most cases, the instances of non-compliance were administrative in nature; however, the facilities were also found to be Out of Compliance for exceeding the discharge rate and the discharge quality. In some instances, the facilities were not conducting the required monitoring or reporting.
The effluent discharge quality and toxicity results indicate that due to high levels of BOD, COD and TSS, typical undiluted fish processing facility effluent having passed through current treatment works is frequently acutely lethal to fish.
Most of the current permits do not contain the founda-tional requirements that are necessary to be protective of the environment. Some inconsistencies are expected due to the site-specific nature of permitting; however,

FISH PROCESSING FACILITIES COMPLIANCE AUDIT REPORT 2018: ENVIRONMENTAL MANAGEMENT AC T | 3
Introduction In November 2017, various media outlets began to report on a video that showed effluent being discharged from the submerged outfall of a fish processing facility in BC (Campbell, 2017). The video footage was compiled during April, June and October 2017 (Campbell, 2017). The video footage showed fish processing effluent from the cleaning of the fish processing, being discharged into a marine environment. It was also reported that similar observations were made at another fish processing facility, also dischar-ging effluent into a marine environment (CBC, 2017).
The video footage raised concerns about the quality of the fish processing effluent and the potential impact that the effluent might be having on the environment, wild finfish, shellfish, and in particular wild salmon.
As a result of these concerns raised, the Ministry of Environment and Climate Change Strategy (ENV) has conducted an audit of the current effluent discharge author-izations under the EMA within the fish processing industry. The objectives of the audit were to:
» Conduct inspections to verify whether the fish processing facilities authorized to discharge effluent by ENV are achieving compliance under the regula-tory requirements established in their authorizations.
» Document the existing regulatory framework for fish processing facility discharges;
» Collect effluent samples to assess the characteristics of the effluent and to determine whether the effluent discharged from fish processing facilities is potentially causing pollution as defined in the EMA;
» Assess whether fish processing facility authoriza-tions contain consistent foundational environmental protection provisions; and
» Identify the best achievable technology (BAT) for the treatment of effluent from fish processing facilities and identify any barriers to the BAT.
These results would then be used to inform decisions about the enforceability and protectiveness of current regulations and authorizations.
Limitations
A requirement of the audit was that the final audit report was to be completed in the spring of 2018. As a result, it was only possible to conduct on-site inspections at those facilities that were operating at the time that the audit was conducted (January to April 2018); many facilities operate seasonally and were not operating during this time.
The audit included an assessment of those 30 fish processing facilities that are authorized to discharge effluent to the environment under the EMA. There are approximately an additional 100 fish processing facilities that operate and process fish and seafood, but do not discharge effluent directly to the environment; but instead discharge to a municipal sewer or alternate disposal. No assessment was conducted for these facilities.
The audit made assessments on the available data collected reported by the fish processing facilities. Many permits did not include any requirements to monitor the discharge rate, the discharge quality or the receiving environment quality. Effluent samples were collected from all facilities that were operating at the time of the audit; however, it was not possible to collect samples at those facilities that operate seasonally. Effluent samples were submitted for acute lethality testing, which uses rainbow trout to determine the 96 hr LC50. The salinity of two samples required that the samples were diluted until an acceptable salinity was reached to conduct the testing. The dilution meant that that the tests could not be conducted using the typical series of dilutions to determine the acute lethality. The tests were instead conducted at a single concentration and the acute lethality was determined at this concentration only.
No assessment was conducted for the presence of piscine orthoreovirus (PRV) in the fish processing effluent. PRV is generally ubiquitous in farmed Atlantic salmon. It was assessed that PRV would likely be present in the effluent from facilities that process farmed salmon; therefore, no testing was conducted. Fisheries and Oceans Canada (DFO) collected samples at two of the fish processing facilities and conducted an assessment for PRV.
| FISH PROCESSING FACILITIES COMPLIANCE AUDIT REPORT 2018: ENVIRONMENTAL MANAGEMENT AC T 4
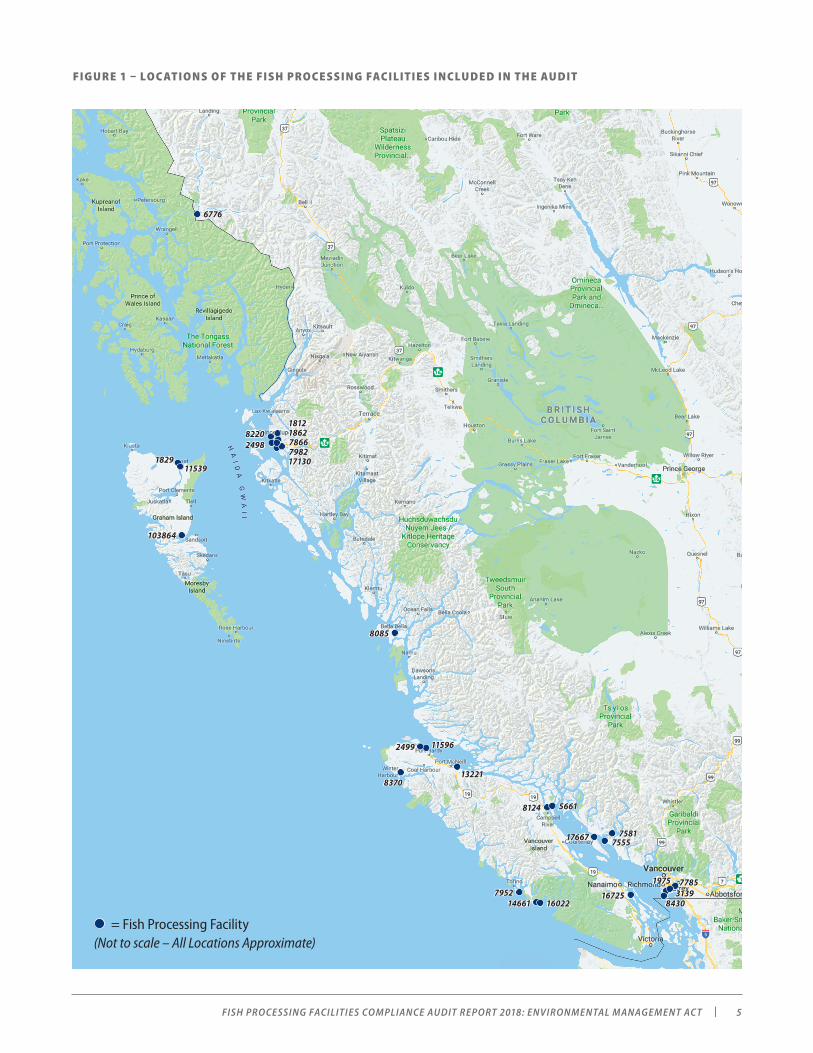
DISTRIBUTION OF FISH PROCESSING FACILITIESThe 30 active authorizations of fish processing facilities that were inspected as part of the audit are listed in Appendix 2 Table 1.
Figure 1 shows the geographic distribution of all of the fish processing facilities, with their accompanying authorization number, that were assessed as part of the audit (iMapBC, 2018).
Overview of Fish Processing Facilities in B.C.
FISH PROCESSING FACILITIESFish processing facilities are generally in operation to prepare fish and other seafood in such a way as to create a final product that can be delivered to the consumer. The fish and seafood that is processed can include both that from wild fisheries and that which is harvested from marine-based and land-based aquaculture. The processing that takes place at these facilities includes eviscerating, skinning, filleting, breading, pre-cooking and blanching and includes processing of fish oil or fish roe. The fish may arrive at the facility either whole or already partially processed.
The processing of the fish and seafood results in the production of waste. The waste includes offal and other solids created during eviscerating, skinning and, filleting and also the process water that is used in fluming, butchering and cleaning. When the process water comes into contact with the fish or seafood, the concentrations of several parameters become elevated to a degree that treatment is required. In many cases, fish processing facilities are located near shore in marine environments and it is convenient to discharge this effluent into the environment.
ECONOMIC ROLEBC’s seafood sector includes both the commercial fisheries and aquaculture industries. In 2016, provincial production from combined wild and farmed harvests of finfish and shellfish totalled 291,600 tonnes with a landed and farm-gate value of $1.17 billion (AGRI, 2017a). The tonnage and value represent increases of 12.5 and 31.2 percent, respectively, from 2015. The harvest from the commercial fisheries was 188,000 tonnes worth $392.8 million to the fishers, while aquaculture operations produced 103,600 tonnes with a farm-gate value of $776.8 million (AGRI, 2017a). In 2015, BC seafood processors produced a range of 489 seafood commod-ities with a combined wholesale value of $1.43 billion (AGRI, 2017b).
Of the 30 active EMA authorizations, only 18 were operating during the audit or planned to be operating and discharging in 2018. Of the remaining twelve fish processing facilities, nine are not in operation and three continue to operate but are no longer discharging effluent to the environment because they are now connected to a municipal sewer or do not discharge any effluent to the environment. These facilities that were not in operation or not discharging were also not operating or discharging in 2017, nor do they plan to be operating or discharging in 2018. Eight of the facilities were operating at the time of the audit and operate year round. Ten others operate only seasonally, typically between June and September.
Each of the 18 fish processing facilities that are currently discharging effluent or plan to discharge effluent in 2018 discharge to marine environments, with two exceptions; one facility discharges to a river and another facility discharges on land to ground.
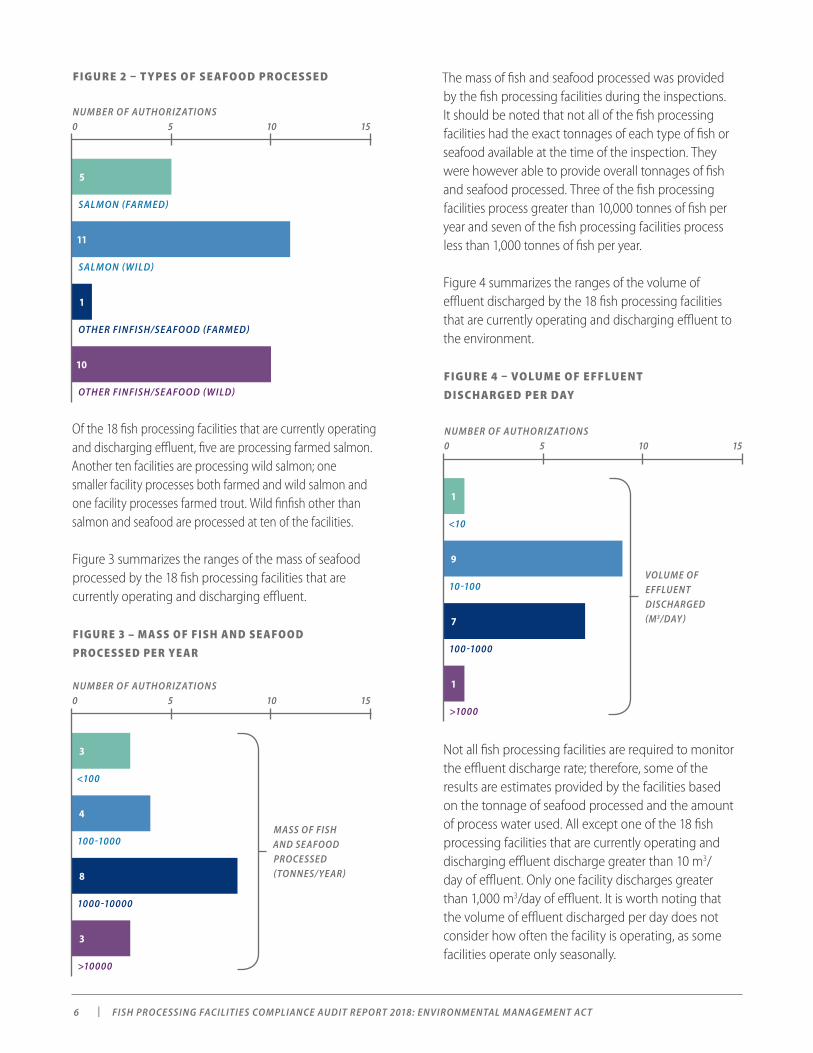
T YPES OF FISH PROCESSEDFish processing facilities in BC process many different kinds of finfish and seafood. In addition, some facilities process wild finfish and seafood and others process farmed finfish and seafood. Figure 2 lists the number of fish processing facilities that process salmon and those that process other finfish or seafood. The results are further distinguished by identifying whether the salmon or other finfish and seafood are farmed or wild. It should be noted that the sum total does not add up to 18 operating fish processing facilities because some facilities process both salmon and other finfish and seafood.
FISH PROCESSING FACILITIES COMPLIANCE AUDIT REPORT 2018: ENVIRONMENTAL MANAGEMENT AC T | 5
FIGU R E 1 – LOC ATI ONS OF TH E FISH PROCESSING FACILITIES INCLUD E D IN TH E AU DIT
103864
115391829
6776
8085
5661
8370
2499 11596
13221
8124
795214661 16022
16725
17667
1975 7785
8430
75557581
3139
24988220
171307982786618621812
= Fish Processing Facility (Not to scale – All Locations Approximate)
| FISH PROCESSING FACILITIES COMPLIANCE AUDIT REPORT 2018: ENVIRONMENTAL MANAGEMENT AC T 6
The mass of fish and seafood processed was provided by the fish processing facilities during the inspections. It should be noted that not all of the fish processing facilities had the exact tonnages of each type of fish or seafood available at the time of the inspection. They were however able to provide overall tonnages of fish and seafood processed. Three of the fish processing facilities process greater than 10,000 tonnes of fish per year and seven of the fish processing facilities process less than 1,000 tonnes of fish per year.
Figure 4 summarizes the ranges of the volume of effluent discharged by the 18 fish processing facilities that are currently operating and discharging effluent to the environment. FIG U R E 4 – VO LUM E O F E FFLU E NT
D ISCHARG E D PE R DAY
FIGU R E 2 – T YPES OF SE AFOOD PROCESSE D
Of the 18 fish processing facilities that are currently operating and discharging effluent, five are processing farmed salmon. Another ten facilities are processing wild salmon; one smaller facility processes both farmed and wild salmon and one facility processes farmed trout. Wild finfish other than salmon and seafood are processed at ten of the facilities.
Figure 3 summarizes the ranges of the mass of seafood processed by the 18 fish processing facilities that are currently operating and discharging effluent. FIG U R E 3 – M ASS O F FISH AN D SE AFOO D
PROCESSE D PE R YE AR
SALMON (FARMED)
SALMON (WILD)
OTHER FINFISH/SE AFOOD (FARMED)
OTHER FINFISH/SE AFOOD (WILD)
NUMBER OF AUTHORIZ ATIONS5 15100
1
10
5
11
<100
100 -1000
1000 -10000
>10000
NUMBER OF AUTHORIZ ATIONS5 15100
3
3
4
8
MASS OF FISH AND SEAFOOD PROCESSED (TONNES/ YEAR)
<10
10 -100
100 -1000
>1000
NUMBER OF AUTHORIZ ATIONS5 15100
1
1
9
7
VOLUME OF EFFLUENT DISCHARGED (M3/DAY)
Not all fish processing facilities are required to monitor the effluent discharge rate; therefore, some of the results are estimates provided by the facilities based on the tonnage of seafood processed and the amount of process water used. All except one of the 18 fish processing facilities that are currently operating and discharging effluent discharge greater than 10 m3/day of effluent. Only one facility discharges greater than 1,000 m3/day of effluent. It is worth noting that the volume of effluent discharged per day does not consider how often the facility is operating, as some facilities operate only seasonally.
FISH PROCESSING FACILITIES COMPLIANCE AUDIT REPORT 2018: ENVIRONMENTAL MANAGEMENT AC T | 7
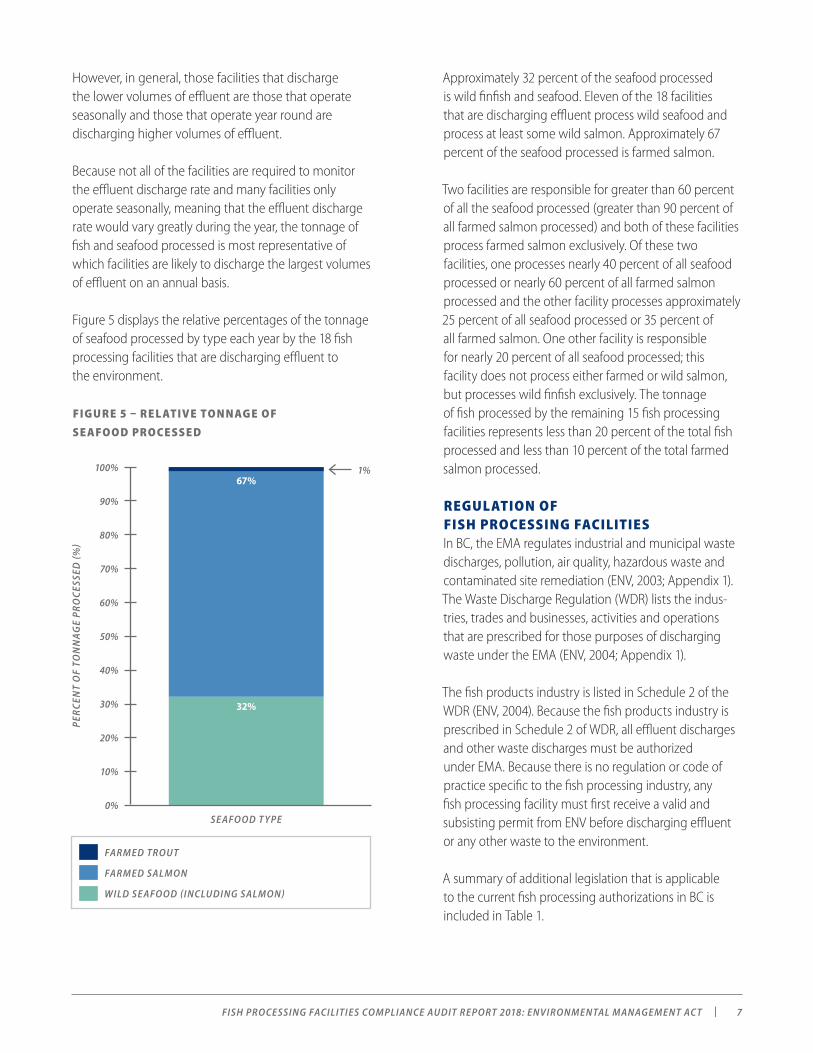
Approximately 32 percent of the seafood processed is wild finfish and seafood. Eleven of the 18 facilities that are discharging effluent process wild seafood and process at least some wild salmon. Approximately 67 percent of the seafood processed is farmed salmon.
Two facilities are responsible for greater than 60 percent of all the seafood processed (greater than 90 percent of all farmed salmon processed) and both of these facilities process farmed salmon exclusively. Of these two facilities, one processes nearly 40 percent of all seafood processed or nearly 60 percent of all farmed salmon processed and the other facility processes approximately 25 percent of all seafood processed or 35 percent of all farmed salmon. One other facility is responsible for nearly 20 percent of all seafood processed; this facility does not process either farmed or wild salmon, but processes wild finfish exclusively. The tonnage of fish processed by the remaining 15 fish processing facilities represents less than 20 percent of the total fish processed and less than 10 percent of the total farmed salmon processed.
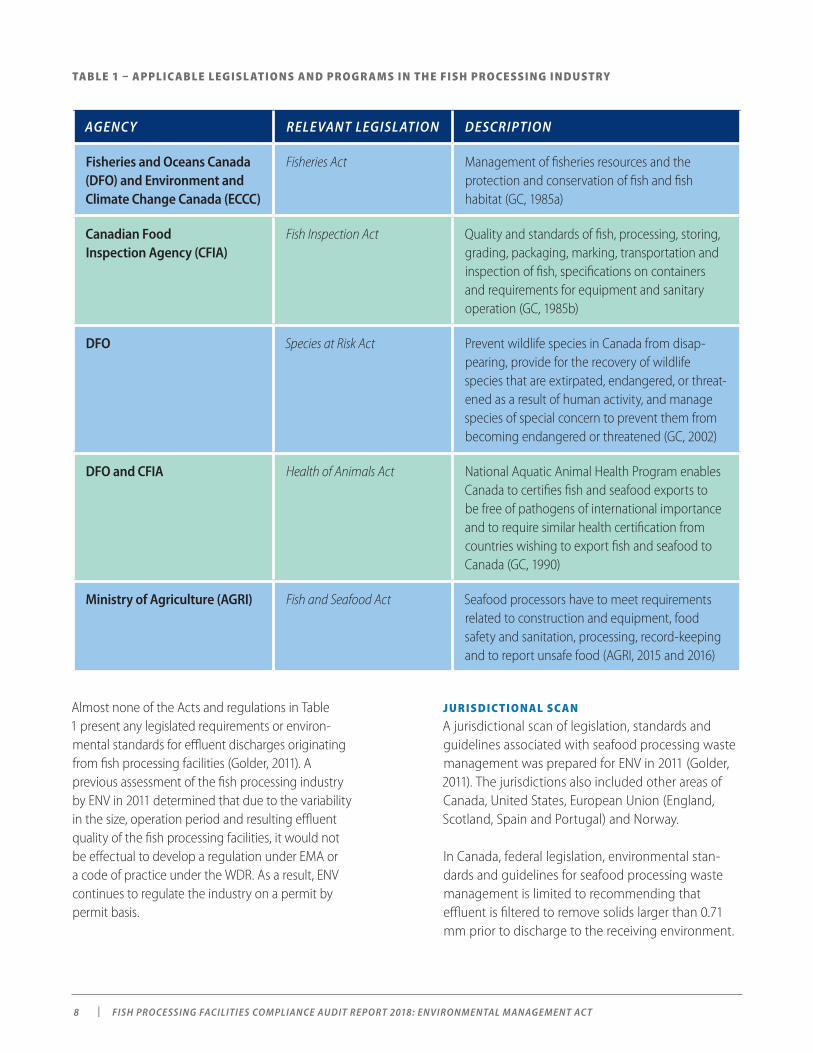
REGULATION OF FISH PROCESSING FACILITIESIn BC, the EMA regulates industrial and municipal waste discharges, pollution, air quality, hazardous waste and contaminated site remediation (ENV, 2003; Appendix 1). The Waste Discharge Regulation (WDR) lists the indus-tries, trades and businesses, activities and operations that are prescribed for those purposes of discharging waste under the EMA (ENV, 2004; Appendix 1).
The fish products industry is listed in Schedule 2 of the WDR (ENV, 2004). Because the fish products industry is prescribed in Schedule 2 of WDR, all effluent discharges and other waste discharges must be authorized under EMA. Because there is no regulation or code of practice specific to the fish processing industry, any fish processing facility must first receive a valid and subsisting permit from ENV before discharging effluent or any other waste to the environment.
A summary of additional legislation that is applicable to the current fish processing authorizations in BC is included in Table 1.
However, in general, those facilities that discharge the lower volumes of effluent are those that operate seasonally and those that operate year round are discharging higher volumes of effluent.
Because not all of the facilities are required to monitor the effluent discharge rate and many facilities only operate seasonally, meaning that the effluent discharge rate would vary greatly during the year, the tonnage of fish and seafood processed is most representative of which facilities are likely to discharge the largest volumes of effluent on an annual basis.
Figure 5 displays the relative percentages of the tonnage of seafood processed by type each year by the 18 fish processing facilities that are discharging effluent to the environment. FIG U R E 5 – R E L ATIVE TO N NAG E O F
SE AFOOD PROCESSE D
PER
CEN
T O
F TO
NN
AG
E P
RO
CES
SED
(%)
100%
90%
80%
70%
60%
50%
40%
30%
20%
10%
0%SE AFOOD T YPE
32%
1%67%
FARMED TROUT
FARMED SALMON
WILD SE AFOOD (INCLUDING SALMON)
| FISH PROCESSING FACILITIES COMPLIANCE AUDIT REPORT 2018: ENVIRONMENTAL MANAGEMENT AC T 8
J U R ISDIC TI ONAL SC AN
A jurisdictional scan of legislation, standards and guidelines associated with seafood processing waste management was prepared for ENV in 2011 (Golder, 2011). The jurisdictions also included other areas of Canada, United States, European Union (England, Scotland, Spain and Portugal) and Norway.
In Canada, federal legislation, environmental stan-dards and guidelines for seafood processing waste management is limited to recommending that effluent is filtered to remove solids larger than 0.71 mm prior to discharge to the receiving environment.
Almost none of the Acts and regulations in Table 1 present any legislated requirements or environ-mental standards for effluent discharges originating from fish processing facilities (Golder, 2011). A previous assessment of the fish processing industry by ENV in 2011 determined that due to the variability in the size, operation period and resulting effluent quality of the fish processing facilities, it would not be effectual to develop a regulation under EMA or a code of practice under the WDR. As a result, ENV continues to regulate the industry on a permit by permit basis.
TABLE 1 – APPLIC ABLE LEG ISL ATI O N S AN D PROG R AMS I N TH E FISH PROCESSI NG I N DUSTRY
AGENCY RELEVANT LEGISL ATION DESCRIPTION
Fisheries and Oceans Canada (DFO) and Environment and Climate Change Canada (ECCC)
Fisheries Act Management of fisheries resources and the protection and conservation of fish and fish habitat (GC, 1985a)
Canadian Food Inspection Agency (CFIA)
Fish Inspection Act Quality and standards of fish, processing, storing, grading, packaging, marking, transportation and inspection of fish, specifications on containers and requirements for equipment and sanitary operation (GC, 1985b)
DFO Species at Risk Act Prevent wildlife species in Canada from disap-pearing, provide for the recovery of wildlife species that are extirpated, endangered, or threat-ened as a result of human activity, and manage species of special concern to prevent them from becoming endangered or threatened (GC, 2002)
DFO and CFIA Health of Animals Act National Aquatic Animal Health Program enables Canada to certifies fish and seafood exports to be free of pathogens of international importance and to require similar health certification from countries wishing to export fish and seafood to Canada (GC, 1990)
Ministry of Agriculture (AGRI) Fish and Seafood Act Seafood processors have to meet requirements related to construction and equipment, food safety and sanitation, processing, record-keeping and to report unsafe food (AGRI, 2015 and 2016)
FISH PROCESSING FACILITIES COMPLIANCE AUDIT REPORT 2018: ENVIRONMENTAL MANAGEMENT AC T | 9
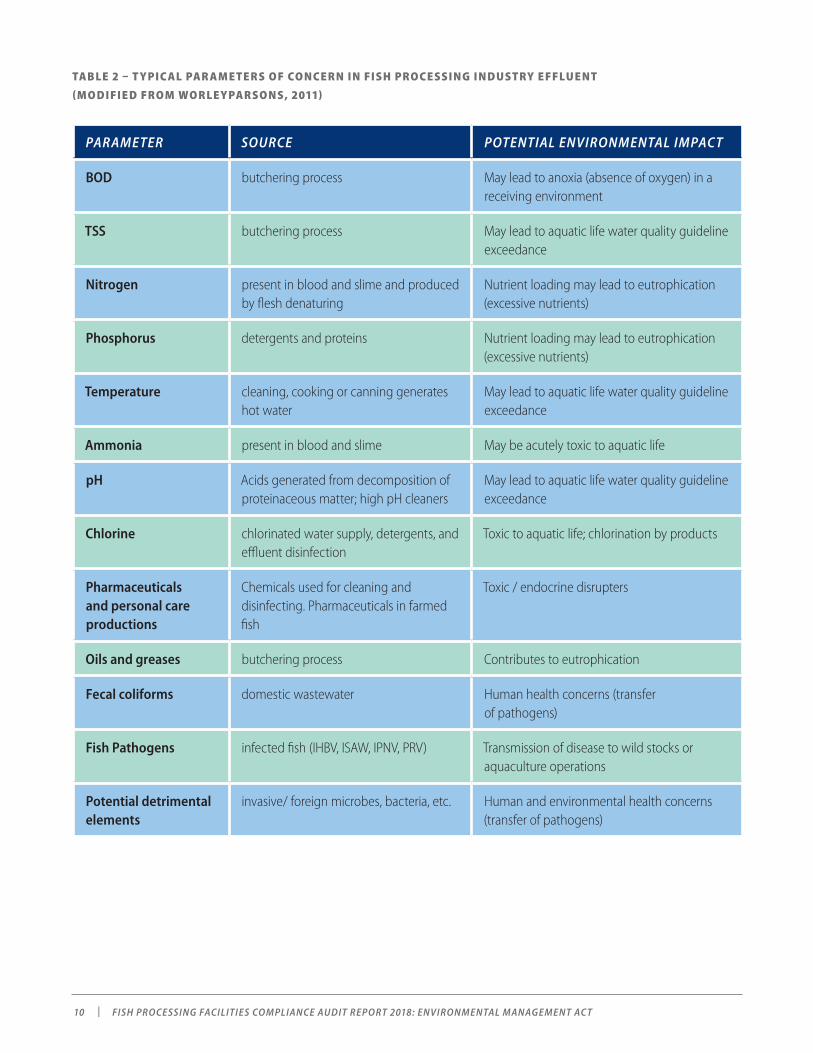
EFFLUENT QUALIT Y FROM FISH PROCESSING FACILITIESThe typical parameters of concern in fish processing industry effluent include, biological oxygen demand (BOD), total suspended solids (TSS), nitrogen, phosphorus, temperature, ammonia, pH, chlorine, oil and grease, fecal coliforms and fish pathogens (WorleyParsons, 2011).
The fecal coliforms are associated with the discharge of septic tank effluent, which is sometimes authorized as a shared discharge with the fish processing effluent. Table 2 (on page 10) presents these parameters, the sources and the potential environmental impact.
Provincially, only Newfoundland and Labrador created internal guidance pertaining to seafood processing waste; however, the guidance docu-ments did not contain environmental standards for effluent discharges to marine environments.
In the United States of America (US), the imple-mented regulations of the Clean Water Act are codified as The Code of Federal Regulations (CFR) Title 40 (GPO, 2018). Chapter 1 Subchapter N, Part 408 presents specific effluent guidelines for the canned and preserved seafood processing point source category. These effluent guidelines and standards include pH within a range of 6 to 9 and then have varying concen-trations for BOD, TSS and oil and grease and are categorized according to different types of seafood processed.
The pollution control legislation in the European Union (EU) does not specify seafood processing effluent management requirements prior to discharge to marine environments. The legislation is interpreted on a local level for the issuing of individual permits for the fish processing industry. Norway also did not have any environ-mental standards specific to seafood processing effluent discharged to marine environments.
The Nordic Council of Ministers commissioned a report on Best Available Techniques in the fish processing industry in the Nordic countries (Tomczak-Wandzel et al., 2015). The Aland Islands adopted regulation for the discharge from fish slaughterhouses, setting limits for Biological Oxygen Demand (BOD), total phos-phorus and total nitrogen that correspond with wastewater treatment plants servicing between 100 and 400 people.
There was no specific legislation or standards for Norway, Finland or the Faroe Islands. The discharges are regulated through individual permits of the fish processing facilities. In Norway, any facility that has a production capacity for finished product of more than 75 tonnes per full day of operation is required to obtain a permit.
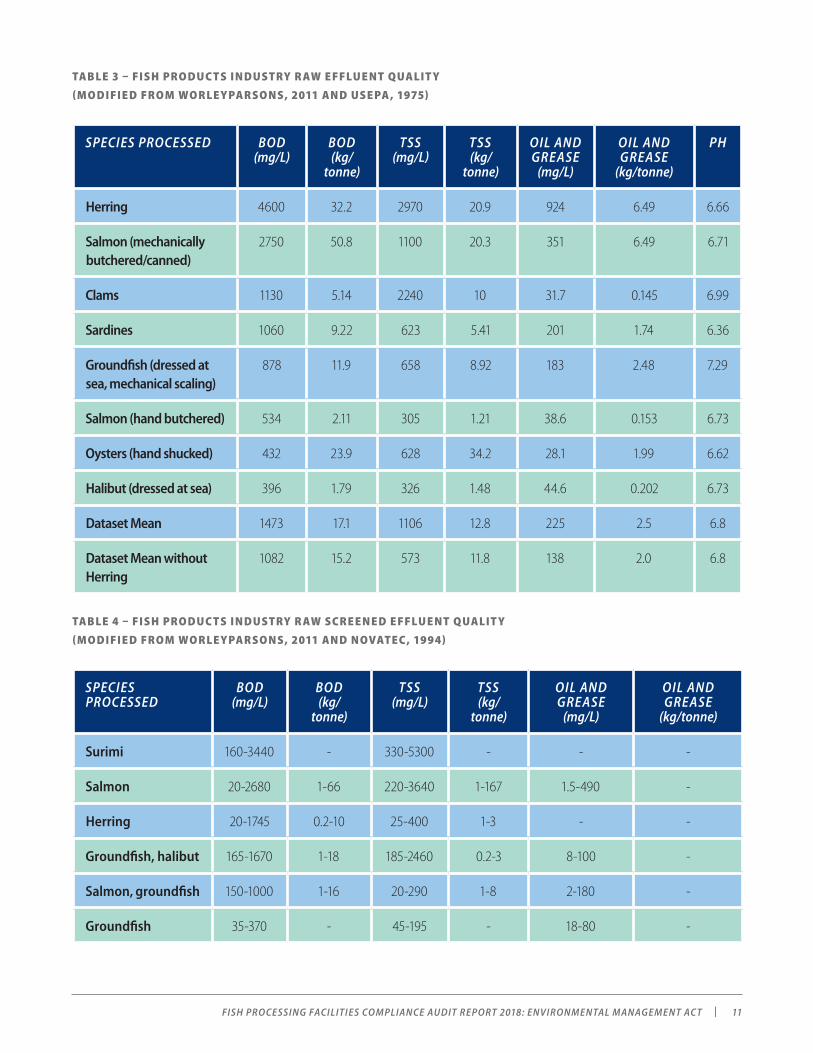
Most of the BOD, TSS and a large portion of the oil and grease in the effluent originates from the butchering process (Novatec, 1995). Table 3 (on page 11) presents the typical concentrations of BOD, TSS, Oil and Grease and pH in untreated fish processing effluent as compiled by USEPA (1975). The results are presented as both the concentration in the effluent as well as the typical loading rate in kg of each parameter that will enter the effluent per tonne of fish processed.
Table 4 (on page 11) presents the range of concentra-tions of BOD, TSS, Oil and Grease that were measured in fish processing effluent that had been treated using screening in BC and reported by Novatec (1994).
| FISH PROCESSING FACILITIES COMPLIANCE AUDIT REPORT 2018: ENVIRONMENTAL MANAGEMENT AC T 10
TABLE 2 – T YPIC AL PAR AM ETE R S O F CO NCE R N I N FISH PROCESSI NG I N DUSTRY E FFLU E NT
(MODIFIE D FROM WOR LE YPAR SONS, 2011)
PARAMETER SOURCE POTENTIAL ENVIRONMENTAL IMPACT
BOD butchering process May lead to anoxia (absence of oxygen) in a receiving environment
TSS butchering process May lead to aquatic life water quality guideline exceedance
Nitrogen present in blood and slime and produced by flesh denaturing
Nutrient loading may lead to eutrophication (excessive nutrients)
Phosphorus detergents and proteins Nutrient loading may lead to eutrophication (excessive nutrients)
Temperature cleaning, cooking or canning generates hot water
May lead to aquatic life water quality guideline exceedance
Ammonia present in blood and slime May be acutely toxic to aquatic life
pH Acids generated from decomposition of proteinaceous matter; high pH cleaners
May lead to aquatic life water quality guideline exceedance
Chlorine chlorinated water supply, detergents, and effluent disinfection
Toxic to aquatic life; chlorination by products
Pharmaceuticals and personal care productions
Chemicals used for cleaning and disinfecting. Pharmaceuticals in farmed fish
Toxic / endocrine disrupters
Oils and greases butchering process Contributes to eutrophication
Fecal coliforms domestic wastewater Human health concerns (transfer of pathogens)
Fish Pathogens infected fish (IHBV, ISAW, IPNV, PRV) Transmission of disease to wild stocks or aquaculture operations
Potential detrimental elements
invasive/ foreign microbes, bacteria, etc. Human and environmental health concerns (transfer of pathogens)
FISH PROCESSING FACILITIES COMPLIANCE AUDIT REPORT 2018: ENVIRONMENTAL MANAGEMENT AC T | 11
TABLE 3 – FISH PRO DUC TS I N DUSTRY R AW E FFLU E NT QUALIT Y
(MODI FIE D FROM WOR LE YPAR SONS, 2011 AN D USE PA , 1975)
SPECIES PROCESSED BOD (mg/L)
BOD (kg/
tonne)
TSS (mg/L)
TSS (kg/
tonne)
OIL AND GREASE
(mg/L)
OIL AND GREASE
(kg/tonne)
PH
Herring 4600 32.2 2970 20.9 924 6.49 6.66
Salmon (mechanically butchered/canned)
2750 50.8 1100 20.3 351 6.49 6.71
Clams 1130 5.14 2240 10 31.7 0.145 6.99
Sardines 1060 9.22 623 5.41 201 1.74 6.36
Groundfish (dressed at sea, mechanical scaling)
878 11.9 658 8.92 183 2.48 7.29
Salmon (hand butchered) 534 2.11 305 1.21 38.6 0.153 6.73
Oysters (hand shucked) 432 23.9 628 34.2 28.1 1.99 6.62
Halibut (dressed at sea) 396 1.79 326 1.48 44.6 0.202 6.73
Dataset Mean 1473 17.1 1106 12.8 225 2.5 6.8
Dataset Mean without Herring
1082 15.2 573 11.8 138 2.0 6.8
TABLE 4 – FISH PRO DUC TS I N DUSTRY R AW SCR E E N E D E FFLU E NT QUALIT Y
(MODI FIE D FROM WOR LE YPAR SONS, 2011 AN D N OVATEC , 1994)
SPECIES PROCESSED
BOD (mg/L)
BOD (kg/
tonne)
TSS (mg/L)
TSS (kg/
tonne)
OIL AND GREASE
(mg/L)
OIL AND GREASE
(kg/tonne)
Surimi 160-3440 - 330-5300 - - -
Salmon 20-2680 1-66 220-3640 1-167 1.5-490 -
Herring 20-1745 0.2-10 25-400 1-3 - -
Groundfish, halibut 165-1670 1-18 185-2460 0.2-3 8-100 -
Salmon, groundfish 150-1000 1-16 20-290 1-8 2-180 -
Groundfish 35-370 - 45-195 - 18-80 -
| FISH PROCESSING FACILITIES COMPLIANCE AUDIT REPORT 2018: ENVIRONMENTAL MANAGEMENT AC T 12
O FFAL
In addition to the effluent generated by the fish processing facilities, the solids or offal resulting from the butchering process also creates a waste stream requiring disposal. In most cases, the offal is collected and stored at the facility during processing. The offal generated at the fish processing facilities in BC is most often sent to fish by-product rendering facilities where the offal is rendered to produce fish mean or fish oil products. Some facilities distribute the offal to composting facilities to produce compost. Two of the facilities send their offal to landfills.
Two of the facilities are authorized to discharge their offal to the environment. One facility discharges their offal using their outfall. Another sometimes discharges their offal with the tide. This facility stated that this is only done for seven to ten days during the start and end of the season and distributes the offal to local farmers at all other times.
EMERGING ISSUES OF CONCERNRecently, pathogens and the adequacy of wastewater treatment technology in destroying pathogens have become an emerging concern for environmental health and human safety. Wastewater treatment operations for human waste and the food processing sector may contain microorganisms that can cause disease in wild fish and shellfish populations. Within salmon popula-tions, piscine orthoreovirus (PRV) is an emerging virus of concern affecting the salmon industry.
A thorough review of the existing data and knowledge of PRV in BC is presented in a report to ENV by the BC Centre for Aquatic Health Sciences and researchers at the University of British Columbia (Siah et al, 2018). A summary of the report follows. The report stated that PRV was discovered as a unique reovirus in 2010 after detailed investigations into increased mortalities of Atlantic salmon in Norwegian fish farms. Since then, PRV has been linked as the causative agent for Heart, Skeletal and Muscle Inflammation (HSMI) disease in fish in Norway. The same level of impact from PRV has not been documented in BC despite its prevalence in wild and farmed salmon and other finfish species in BC waters.
TREATMENT OF EFFLUENT FROM FISH PROCESSING FACILITIESThe effluent from fish processing facilities generally undergoes some treatment prior to being discharged into the environment. This is to reduce the concentra-tions of those parameters that may have a potential impact to the environment at the concentrations that are typical of effluent from a fish processing facility.There are three main levels of treatment for fish processing facility effluent. These are:
a. Preliminary treatment
b. Primary treatment
c. Secondary treatment
Preliminary treatment consists of screening the effluent to remove large solids. Primary treatment technology focuses on the removal of additional suspended solids, reducing the TSS, and a portion of the BOD by floating or settling the particulates. Secondary treatment is usually accomplished using biological treatment systems and is employed to reduce soluble BOD. Additional treatment can also include disinfection to inactivate fish pathogens.
The first guidelines for treatment of effluent from fish processing facilities in Canada were established in 1975 and required 1) removal of solids using a mesh screen size of 0.71 mm, 2) a well-designed outfall discharging below low tide, and 3) recovery of high strength wastes associated with the fish meal processing (ECCC, 1975). This level of treatment would be considered preliminary treatment. Some form of screening appears as required treatment works in 25 of the 30 permits. The remaining five facilities do not have any authorized treatment works required under their permits and lists only the outfall under the authorized works. Two facilities have authorized treatment works that include some form of primary or secondary treatment. One of the largest facilities uses dissolved air flotation (DAF). Another smaller facility uses a clarifier. These additional treatment works would be classified under primary treatment. These two facilities also utilize disinfection as part of their authorized treatment works.
FISH PROCESSING FACILITIES COMPLIANCE AUDIT REPORT 2018: ENVIRONMENTAL MANAGEMENT AC T | 13
Compliance Review
INSPECTION APPROACHAll 30 inspections of the fish processing facilities were completed by ENV Environmental Protection Officers (EPO). Most of the fish processing facilities were not operating at the time of the inspections. This is because the fish processing industry is a seasonal operation for many facilities, with operation typically limited to between June and September. EPOs conducted 14 on-site inspections at all eight fish processing facilities that were operating between December and March, when the inspections were conducted, and six others at facilities that were not operating during that time period. The remaining 16 inspections were conducted as office review inspections that included a review of reports and phone discussions with the facility owners or operators.
The inspections consisted of assessing compliance for all relevant requirements of each fish products facilities’ permit.
COM PLIANCE D ETE R M INATI ONS
In order to determine the compliance rate, EPOs assigned one of four compliance determinations for each assessed requirement of a fish processing facility’s permit as well as any applicable requirements under EMA. The four determinations used in the audit are defined as:
1. In – an In Compliance determination is given where a requirement of a permit is met.
2. Out – an Out of Compliance determination is given where a requirement of a permit is not met.
3. Not Determined – a Not Determined compliance determination is given where compliance was unable to be determined with a requirement of a permit.
4. Not Applicable – a Not Applicable compliance determination is given where a requirement of a permit is not relevant because a particular condition that makes the requirement be necessary is not pertinent.
To date, researchers have been unable to demon-strate a causative relationship between PRV and HSMI in BC. This remains a data gap and an area of uncertainty that is currently being researched.
Monitoring and treatment of pathogens presents a number of unknowns and challenges for the management of the spread of disease. In particular, the testing methods for virus detection and analysis are costly and in some cases, not well designed. With regards to PRV, the only test method currently available involves the detection of genetic material present in effluent. This test method does not indicate whether the virus is viable and/ or if it has the ability to transfer to wild stocks. In addition, a lack of adequate wet lab capacity in BC to monitor and report on viruses limits the ability to confirm PRV viability in effluent.
In addition to monitoring uncertainty, the under-standing of wastewater treatment disinfection technologies on PRV destruction is in its infancy. Without the ability to test for the live virus, it is unknown what the efficacy of wastewater disinfec-tion is for PRV. Chemical disinfectants such as chlorine and ozone are common methods to achieve pathogen reduction in fish processing effluent. The high variability of the effluent influences the efficacy of the chlorine disinfectant. Factors such as temper-ature, pH, concentrations of organic materials and pathogens have an impact on the levels of chlorine required to achieve virus destruction. Ultraviolet (UV) treatment is also widely used as a disinfectant, however high particulate matter in wastewater interferes with virus destruction as viruses can be adsorbed to particulates.
| FISH PROCESSING FACILITIES COMPLIANCE AUDIT REPORT 2018: ENVIRONMENTAL MANAGEMENT AC T 14
INSPECTION RESULTSAll of the 30 active authorizations of fish processing facilities were inspected for compliance with the requirements outlined in their respective permits. In some cases when the facility was no longer oper-ating or discharging or had recently been inspected, it was not necessary to assess all requirements of their permit.
As previously mentioned, of the 30 active authorizations, eight were operating at the time of the inspections, 10 other fish processing facilities operate only seasonally and the remaining 12 fish processing facilities are currently not in operation or are no longer discharging effluent to the environment because they are connected to a municipal wastewater system.
In some cases, inspections were previously conducted at these fish processing facilities in 2017 as part of the regular planned ENV inspections. In a few of these cases, the inspections were conducted at the end of the season and compliance was already assessed for each of the requirements in the respective permits.
Therefore, compliance was only assessed for require-ments that were newly relevant; however, the results of the previous inspections were used to inform the results as well. It should be noted that not all permits have all of the same requirements and an assessment of compliance can only be made for those require-ments that are contained within a specific permit.
SUM M ARY O F COM PLIANCE
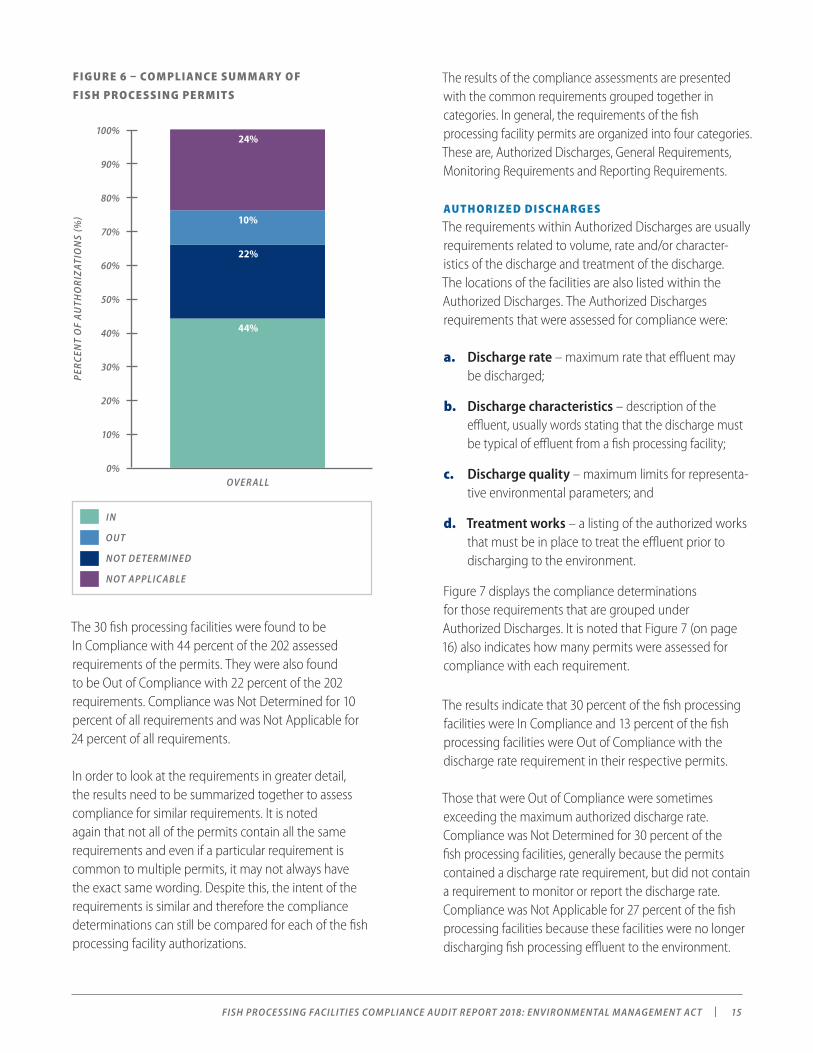
A total of 202 requirements were assessed within the 30 permits during the inspections. Figure 6 displays the compliance determinations for the 202 requirements.
COM PLIANCE R ESPONSE
A final decision on what the appropriate compliance/enforcement response for each individual fish processing facility was based on the EPO’s professional judgement and a consideration of the Non-Compliance Decision Matrix found in the ENV Compliance and Enforcement Policy and Procedure, Version 3 (ENV, 2014; summarized in Appendix 3).
An inspection report was prepared for each inspection which provided the compliance determination for each applicable requirement and presented the overall compliance/enforcement response determination.
E FFLU E NT SAM PLI NG APPROACH
At each of the eight fish processing facilities that were operating at the time of the audit, effluent discharge samples were collected and analyzed for a suite of parameters that are typical of fish processing effluent. The samples were collected, stored and transported according to the procedures outlined in ENV (2013). The samples were submitted for analysis to ALS Environmental in Vancouver, BC and Pacific and Yukon Laboratory for Environmental Testing in North Vancouver, BC.
The effluent samples were analyzed for the following parameters:
» Biological Oxygen Demand (BOD);
» Total Suspended Solids (TSS);
» Nutrients (Nitrate, Nitrite, Ammonia, Total Kjeldahl Nitrogen, Total Nitrogen, Total Organic Nitrogen, Phosphorous);
» pH;
» Residual chlorine (when chlorination was used);
» Oils and Greases;
» Bacteria (E.coli, fecal coliforms, enterococcus) (if shared septic discharge);
» Total Organic Carbon (TOC);
» Chemical Oxygen Demand (COD); and
» Acute Toxicity (96 hr LC50).
FISH PROCESSING FACILITIES COMPLIANCE AUDIT REPORT 2018: ENVIRONMENTAL MANAGEMENT AC T | 15
The results of the compliance assessments are presented with the common requirements grouped together in categories. In general, the requirements of the fish processing facility permits are organized into four categories. These are, Authorized Discharges, General Requirements, Monitoring Requirements and Reporting Requirements.
AUTH OR IZ E D DISCHARG ES
The requirements within Authorized Discharges are usually requirements related to volume, rate and/or character-istics of the discharge and treatment of the discharge. The locations of the facilities are also listed within the Authorized Discharges. The Authorized Discharges requirements that were assessed for compliance were:
a. Discharge rate – maximum rate that effluent may be discharged;
b. Discharge characteristics – description of the effluent, usually words stating that the discharge must be typical of effluent from a fish processing facility;
c. Discharge quality – maximum limits for representa-tive environmental parameters; and
d. Treatment works – a listing of the authorized works that must be in place to treat the effluent prior to discharging to the environment.
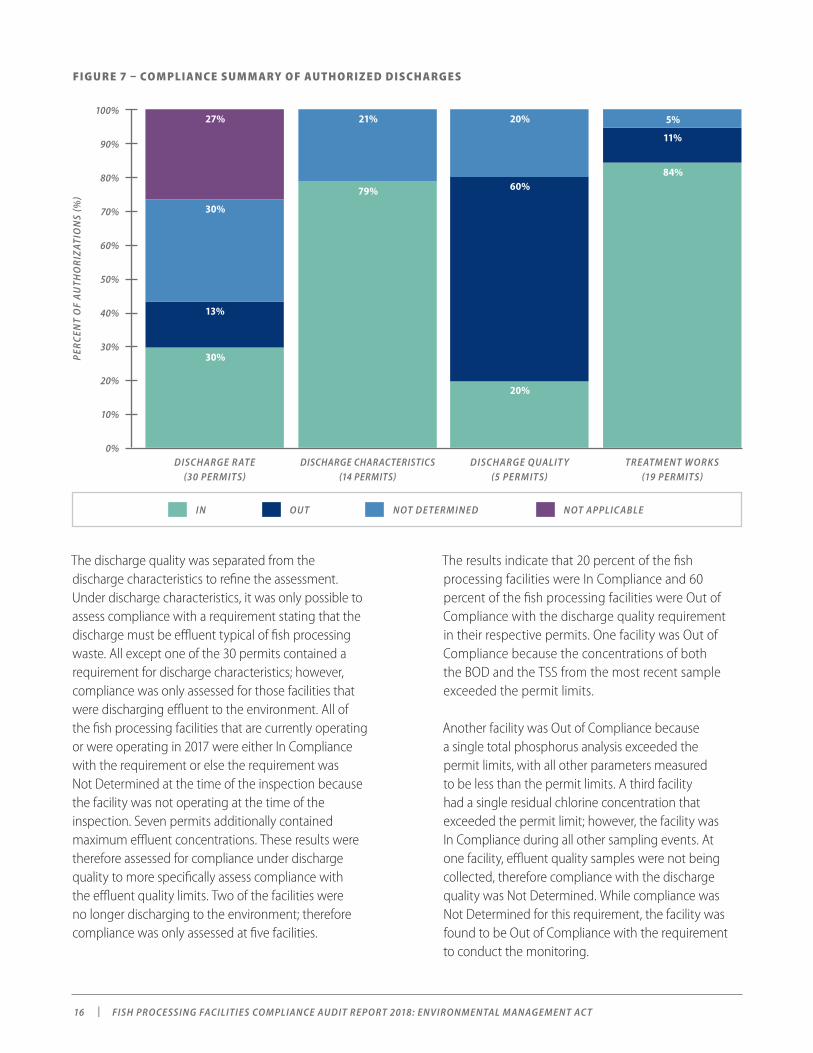
Figure 7 displays the compliance determinations for those requirements that are grouped under Authorized Discharges. It is noted that Figure 7 (on page 16) also indicates how many permits were assessed for compliance with each requirement.
FIG U R E 6 – COM PLIANCE SUM M ARY O F
FISH PROCESSING PE R M ITS
The 30 fish processing facilities were found to be In Compliance with 44 percent of the 202 assessed requirements of the permits. They were also found to be Out of Compliance with 22 percent of the 202 requirements. Compliance was Not Determined for 10 percent of all requirements and was Not Applicable for 24 percent of all requirements.
In order to look at the requirements in greater detail, the results need to be summarized together to assess compliance for similar requirements. It is noted again that not all of the permits contain all the same requirements and even if a particular requirement is common to multiple permits, it may not always have the exact same wording. Despite this, the intent of the requirements is similar and therefore the compliance determinations can still be compared for each of the fish processing facility authorizations.
The results indicate that 30 percent of the fish processing facilities were In Compliance and 13 percent of the fish processing facilities were Out of Compliance with the discharge rate requirement in their respective permits.
Those that were Out of Compliance were sometimes exceeding the maximum authorized discharge rate. Compliance was Not Determined for 30 percent of the fish processing facilities, generally because the permits contained a discharge rate requirement, but did not contain a requirement to monitor or report the discharge rate. Compliance was Not Applicable for 27 percent of the fish processing facilities because these facilities were no longer discharging fish processing effluent to the environment.
PER
CEN
T O
F A
UTH
OR
IZA
TIO
NS
(%)
100%
90%
80%
70%
60%
50%
40%
30%
20%
10%
0%OVER ALL
44%
24%
10%
22%
IN
OUT
NOT DE TERM IN ED
NOT APPLIC ABLE
| FISH PROCESSING FACILITIES COMPLIANCE AUDIT REPORT 2018: ENVIRONMENTAL MANAGEMENT AC T 16
The results indicate that 20 percent of the fish processing facilities were In Compliance and 60 percent of the fish processing facilities were Out of Compliance with the discharge quality requirement in their respective permits. One facility was Out of Compliance because the concentrations of both the BOD and the TSS from the most recent sample exceeded the permit limits.
Another facility was Out of Compliance because a single total phosphorus analysis exceeded the permit limits, with all other parameters measured to be less than the permit limits. A third facility had a single residual chlorine concentration that exceeded the permit limit; however, the facility was In Compliance during all other sampling events. At one facility, effluent quality samples were not being collected, therefore compliance with the discharge quality was Not Determined. While compliance was Not Determined for this requirement, the facility was found to be Out of Compliance with the requirement to conduct the monitoring.
The discharge quality was separated from the discharge characteristics to refine the assessment. Under discharge characteristics, it was only possible to assess compliance with a requirement stating that the discharge must be effluent typical of fish processing waste. All except one of the 30 permits contained a requirement for discharge characteristics; however, compliance was only assessed for those facilities that were discharging effluent to the environment. All of the fish processing facilities that are currently operating or were operating in 2017 were either In Compliance with the requirement or else the requirement was Not Determined at the time of the inspection because the facility was not operating at the time of the inspection. Seven permits additionally contained maximum effluent concentrations. These results were therefore assessed for compliance under discharge quality to more specifically assess compliance with the effluent quality limits. Two of the facilities were no longer discharging to the environment; therefore compliance was only assessed at five facilities.
FIG U R E 7 – COM PLIANCE SUM M ARY O F AUTH O R I Z E D D ISCHARG ESP
ERC
ENT
OF
AU
THO
RIZ
ATI
ON
S (%
)
100%
90%
80%
70%
60%
50%
40%
30%
20%
10%
0%DISCHARGE R ATE
(30 PERMIT S)
30%
27%
30%
13%
DISCHARGE CHARACTERISTICS (14 PERMITS)
21%
DISCHARGE QUALIT Y (5 PERM IT S)
20%
20%
60%
TRE ATMENT WORKS (19 PERM IT S)
84%
5%
11%
79%
IN NOT APPLIC ABLEOUT NOT DE TERM IN ED
FISH PROCESSING FACILITIES COMPLIANCE AUDIT REPORT 2018: ENVIRONMENTAL MANAGEMENT AC T | 17
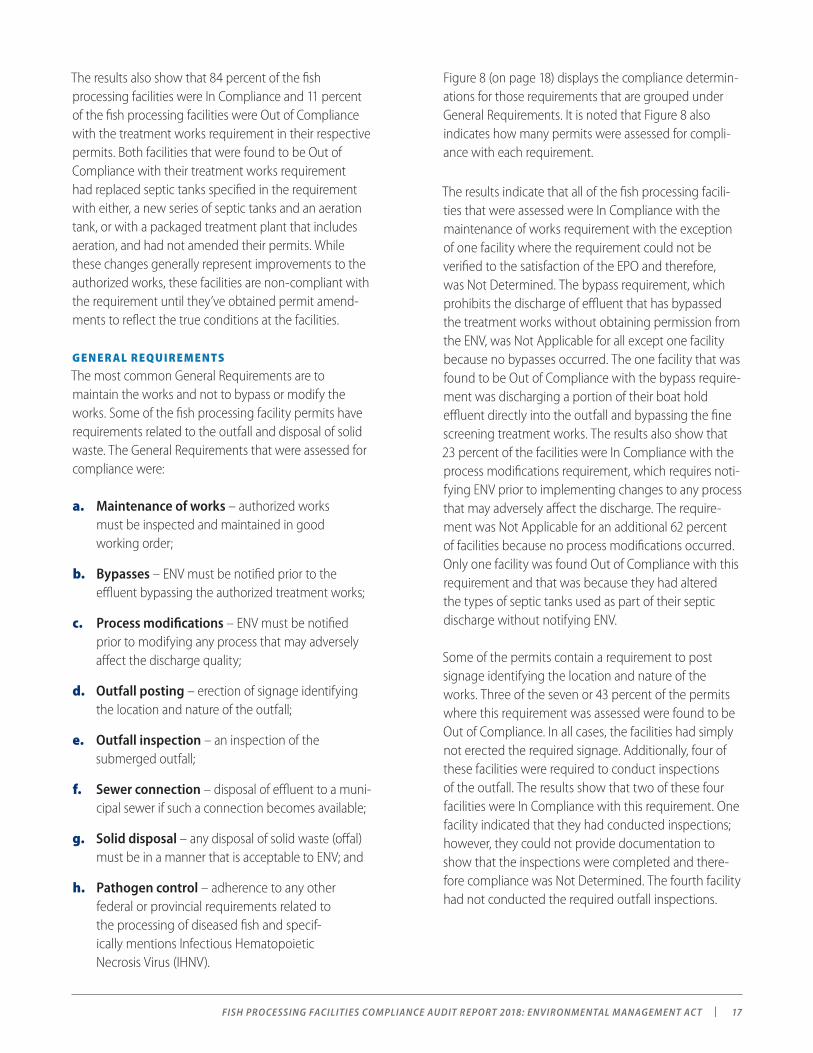
Figure 8 (on page 18) displays the compliance determin-ations for those requirements that are grouped under General Requirements. It is noted that Figure 8 also indicates how many permits were assessed for compli-ance with each requirement.
The results also show that 84 percent of the fish processing facilities were In Compliance and 11 percent of the fish processing facilities were Out of Compliance with the treatment works requirement in their respective permits. Both facilities that were found to be Out of Compliance with their treatment works requirement had replaced septic tanks specified in the requirement with either, a new series of septic tanks and an aeration tank, or with a packaged treatment plant that includes aeration, and had not amended their permits. While these changes generally represent improvements to the authorized works, these facilities are non-compliant with the requirement until they’ve obtained permit amend-ments to reflect the true conditions at the facilities.
G E N E R AL R EQU I R E M E NTS
The most common General Requirements are to maintain the works and not to bypass or modify the works. Some of the fish processing facility permits have requirements related to the outfall and disposal of solid waste. The General Requirements that were assessed for compliance were:
a. Maintenance of works – authorized works must be inspected and maintained in good working order;
b. Bypasses – ENV must be notified prior to the effluent bypassing the authorized treatment works;
c. Process modifications – ENV must be notified prior to modifying any process that may adversely affect the discharge quality;
d. Outfall posting – erection of signage identifying the location and nature of the outfall;
e. Outfall inspection – an inspection of the submerged outfall;
f. Sewer connection – disposal of effluent to a muni-cipal sewer if such a connection becomes available;
g. Solid disposal – any disposal of solid waste (offal) must be in a manner that is acceptable to ENV; and
h. Pathogen control – adherence to any other federal or provincial requirements related to the processing of diseased fish and specif-ically mentions Infectious Hematopoietic Necrosis Virus (IHNV).
The results indicate that all of the fish processing facili-ties that were assessed were In Compliance with the maintenance of works requirement with the exception of one facility where the requirement could not be verified to the satisfaction of the EPO and therefore, was Not Determined. The bypass requirement, which prohibits the discharge of effluent that has bypassed the treatment works without obtaining permission from the ENV, was Not Applicable for all except one facility because no bypasses occurred. The one facility that was found to be Out of Compliance with the bypass require-ment was discharging a portion of their boat hold effluent directly into the outfall and bypassing the fine screening treatment works. The results also show that 23 percent of the facilities were In Compliance with the process modifications requirement, which requires noti-fying ENV prior to implementing changes to any process that may adversely affect the discharge. The require-ment was Not Applicable for an additional 62 percent of facilities because no process modifications occurred. Only one facility was found Out of Compliance with this requirement and that was because they had altered the types of septic tanks used as part of their septic discharge without notifying ENV.
Some of the permits contain a requirement to post signage identifying the location and nature of the works. Three of the seven or 43 percent of the permits where this requirement was assessed were found to be Out of Compliance. In all cases, the facilities had simply not erected the required signage. Additionally, four of these facilities were required to conduct inspections of the outfall. The results show that two of these four facilities were In Compliance with this requirement. One facility indicated that they had conducted inspections; however, they could not provide documentation to show that the inspections were completed and there-fore compliance was Not Determined. The fourth facility had not conducted the required outfall inspections.
| FISH PROCESSING FACILITIES COMPLIANCE AUDIT REPORT 2018: ENVIRONMENTAL MANAGEMENT AC T 18
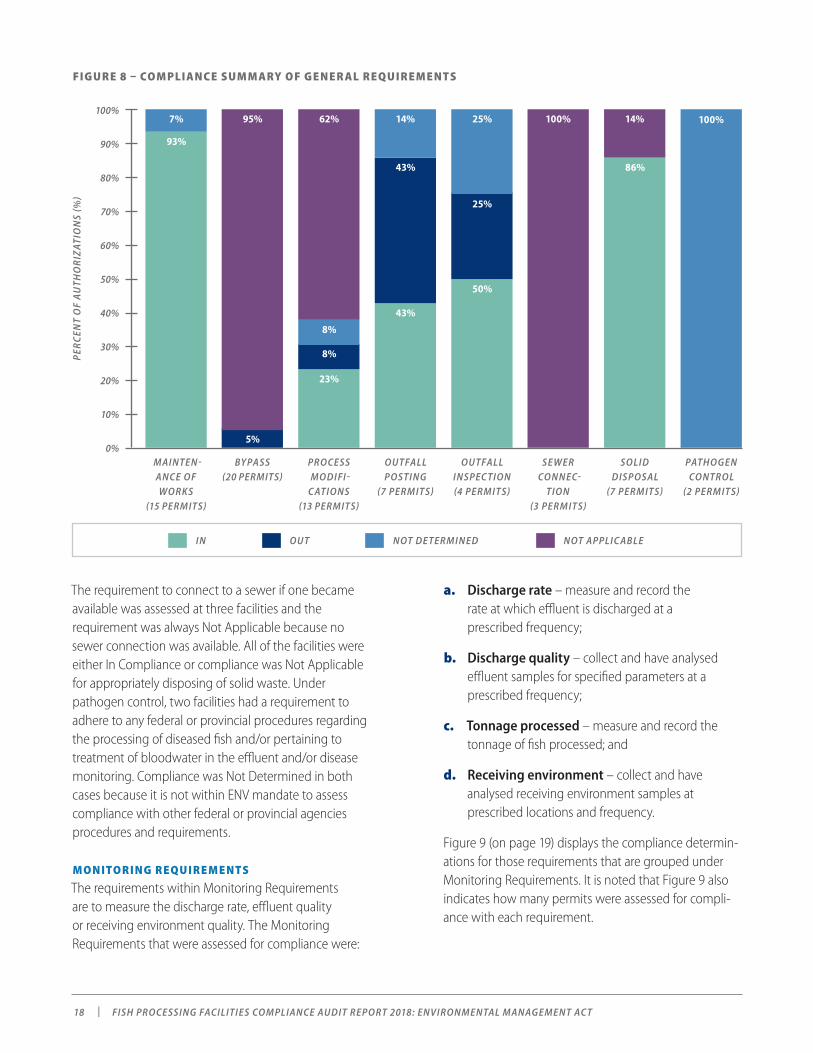
a. Discharge rate – measure and record the rate at which effluent is discharged at a prescribed frequency;
b. Discharge quality – collect and have analysed effluent samples for specified parameters at a prescribed frequency;
c. Tonnage processed – measure and record the tonnage of fish processed; and
d. Receiving environment – collect and have analysed receiving environment samples at prescribed locations and frequency.
Figure 9 (on page 19) displays the compliance determin-ations for those requirements that are grouped under Monitoring Requirements. It is noted that Figure 9 also indicates how many permits were assessed for compli-ance with each requirement.
The requirement to connect to a sewer if one became available was assessed at three facilities and the requirement was always Not Applicable because no sewer connection was available. All of the facilities were either In Compliance or compliance was Not Applicable for appropriately disposing of solid waste. Under pathogen control, two facilities had a requirement to adhere to any federal or provincial procedures regarding the processing of diseased fish and/or pertaining to treatment of bloodwater in the effluent and/or disease monitoring. Compliance was Not Determined in both cases because it is not within ENV mandate to assess compliance with other federal or provincial agencies procedures and requirements.
MON ITOR ING R EQU IR E M E NTS
The requirements within Monitoring Requirements are to measure the discharge rate, effluent quality or receiving environment quality. The Monitoring Requirements that were assessed for compliance were:
FIG U R E 8 – COM PLIANCE SUM M ARY O F G E N E R AL R EQU I R E M E NTSP
ERC
ENT
OF
AU
THO
RIZ
ATI
ON
S (%
)
100%
90%
80%
70%
60%
50%
40%
30%
20%
10%
0%MAINTEN-ANCE OF WORKS
(15 PERMITS)
93%
7%
BYPASS (20 PERMITS)
95%
PROCESS MODIFI-
C ATIONS (13 PERMITS)
23%
62%
8%
OUTFALL POSTING
(7 PERM IT S)
43%
14%
43%
OUTFALL INSPEC TION (4 PERM IT S)
50%
25%
25%
SEWER CON N EC-
TION (3 PERMIT S)
100%
SOLID DISPOSAL
(7 PERM IT S)
86%
14%
PATHOGEN CONTROL
(2 PERM IT S)
100%
8%
5%
IN NOT APPLIC ABLEOUT NOT DE TERM IN ED
FISH PROCESSING FACILITIES COMPLIANCE AUDIT REPORT 2018: ENVIRONMENTAL MANAGEMENT AC T | 19
All of the facilities were either In Compliance with the requirement to monitor the tonnage of fish processed, or else the requirement was Not Applicable because the facility was not operating or, in one case, Not Determined because the production figures were not requested by the EPO during the inspection.
Nine facilities were required to conduct receiving environment monitoring. The results indicate that three of the fish processing facilities were In Compliance and four of the fish processing facilities were Out of Compliance. For those facilities that were found to be Out of Compliance, one was not conducting any of the receiving environment monitoring, two had missed some of the receiving environment monitoring and a fourth was simply not conducting visual inspections to ensure that no floatables were present in the water. The requirement was Not Applicable for one facility because they were required to conduct the receiving environment monitoring on a three year schedule and compliance was only assessed for 2016 and 2017 during the inspection.
The results indicate that 40 percent of the fish processing facilities were In Compliance and 47 percent of the fish processing facilities were Out of Compliance with their permit requirement to monitor the discharge rate. Those that were Out of Compliance were generally not always monitoring the discharge rate as required either due to not conducting monitoring at a sufficient frequency or else because the flow meters were not working at times and therefore the monitoring was not conducted.
A total of eight facilities were assessed for compliance with the requirement to monitor the discharge quality; four were found to be In Compliance and four were found to be Out of Compliance. One facility collected a grab sample of the effluent in March 2018, but had not conducted any monitoring in 2017. Two other facilities were conducting some discharge quality monitoring; however, they were not collecting samples at the required frequency. The fourth facility was not conducting the required monitoring.
FIGU R E 9 – COM PLIANCE SUM M ARY OF MON ITOR ING R EQU IR E M E NTSP
ERC
ENT
OF
AU
THO
RIZ
ATI
ON
S (%
)
100%
90%
80%
70%
60%
50%
40%
30%
20%
10%
0%DISCHARGE R ATE
(15 PERM IT S)
40%
13%
47%
DISCHARGE QUALIT Y (8 PERMITS)
50%
TON NAGE PROCESSED (6 PERM IT S)
67%
17%
17%
RECEIVING ENVIRONMENT (9 PERMIT S)
33%
22%
44%
50%
IN NOT APPLIC ABLEOUT NOT DE TERM IN ED
| FISH PROCESSING FACILITIES COMPLIANCE AUDIT REPORT 2018: ENVIRONMENTAL MANAGEMENT AC T 20
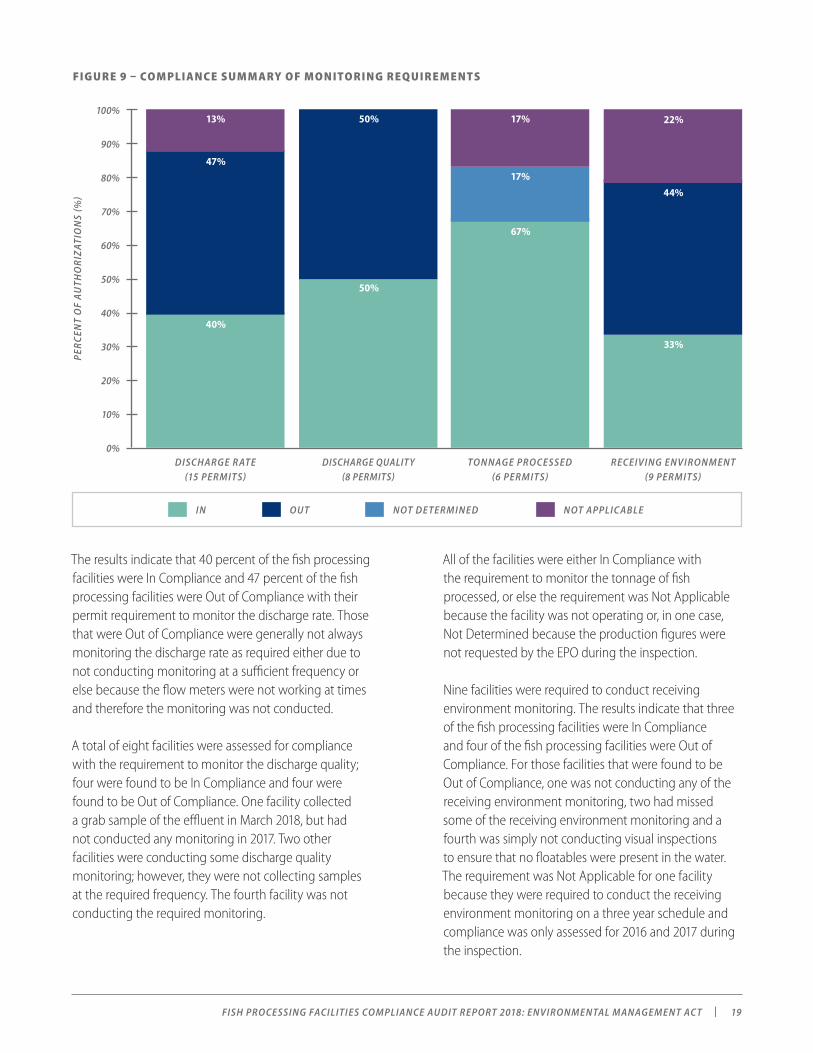
It should be noted that one of the 30 permits was also required to submit an environmental study shortly after the discharge began. That report was received and approved nearly 30 years ago and therefore no additional assessment was made for compliance with this requirement.
Figure 10 (shown above) displays the compliance determinations for those requirements that are grouped under Reporting Requirements. It is noted that Figure 10 also indicates how many permits were assessed for compliance with each requirement.
R E PORTI NG R EQU IR E M E NTS
The requirements within Reporting Requirements are usually to report on the discharge rate, effluent quality or receiving environment quality. The frequency of the reporting varies between quarterly, semi-annual and annual reporting. Additional reporting requirements can also be to report on alternate disposal options for either the effluent or the solid waste. The Reporting Requirements that were assessed for compliance were:
a. Monitoring data reporting – reporting to ENV on the tonnage of fish processed, data of discharge rate, effluent quality or receiving environment and any assessment of the impact of the discharge on the environment at a prescribed frequency; and
b. Alternate disposal reporting – reporting to ENV on potential alternative for the disposal of offal at a prescribed frequency.
FIG U R E 10 – COM PLIANCE SUM M ARY O F R E PO RTI NG R EQU I R E M E NTS
The results indicate that 29 percent of the fish processing facilities were In Compliance and 62 percent of the fish processing facilities were Out of Compliance with the monitoring data reporting requirements of their permits. There were generally three reasons that the facilities were found to be Out of Compliance with their monitoring data reporting requirements: late submis-sions, incomplete reports and not submitting reports.
PER
CEN
T O
F A
UTH
OR
IZA
TIO
NS
(%)
100%
90%
80%
70%
60%
50%
40%
30%
20%
10%
0%ALTERNATE DISPOSAL
(3 PERMIT S)MON ITORING DATA REPORTING
(21 PERMIT S)
10%
62%
29%33%
33%
33%
IN NOT APPLIC ABLEOUT NOT DE TERM IN ED
FISH PROCESSING FACILITIES COMPLIANCE AUDIT REPORT 2018: ENVIRONMENTAL MANAGEMENT AC T | 21
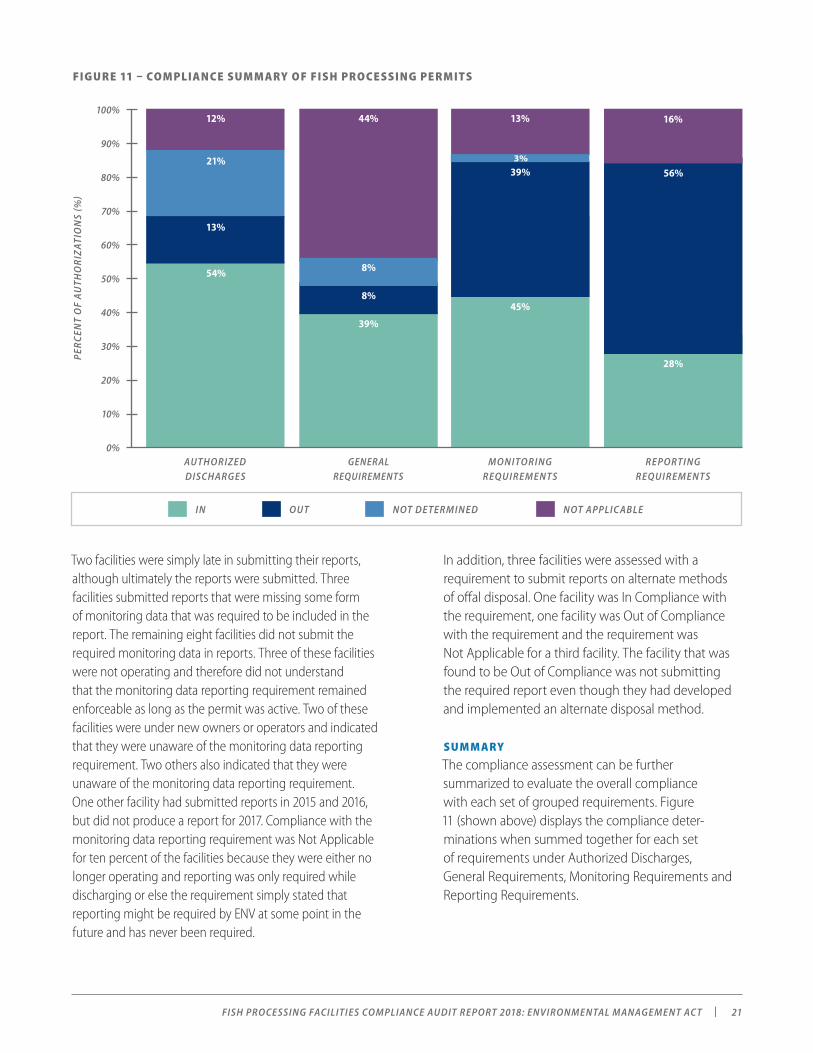
In addition, three facilities were assessed with a requirement to submit reports on alternate methods of offal disposal. One facility was In Compliance with the requirement, one facility was Out of Compliance with the requirement and the requirement was Not Applicable for a third facility. The facility that was found to be Out of Compliance was not submitting the required report even though they had developed and implemented an alternate disposal method.
SUM M ARY
The compliance assessment can be further summarized to evaluate the overall compliance with each set of grouped requirements. Figure 11 (shown above) displays the compliance deter-minations when summed together for each set of requirements under Authorized Discharges, General Requirements, Monitoring Requirements and Reporting Requirements.
Two facilities were simply late in submitting their reports, although ultimately the reports were submitted. Three facilities submitted reports that were missing some form of monitoring data that was required to be included in the report. The remaining eight facilities did not submit the required monitoring data in reports. Three of these facilities were not operating and therefore did not understand that the monitoring data reporting requirement remained enforceable as long as the permit was active. Two of these facilities were under new owners or operators and indicated that they were unaware of the monitoring data reporting requirement. Two others also indicated that they were unaware of the monitoring data reporting requirement. One other facility had submitted reports in 2015 and 2016, but did not produce a report for 2017. Compliance with the monitoring data reporting requirement was Not Applicable for ten percent of the facilities because they were either no longer operating and reporting was only required while discharging or else the requirement simply stated that reporting might be required by ENV at some point in the future and has never been required.
FIG U R E 11 – COM PLIANCE SUM M ARY O F FISH PROCESSI NG PE R M ITSP
ERC
ENT
OF
AU
THO
RIZ
ATI
ON
S (%
)
100%
90%
80%
70%
60%
50%
40%
30%
20%
10%
0%AUTHORIZED DISCHARGES
54%
12%
21%
GENERAL REQUIREMENTS
44%
MON ITORING REQUIREMENT S
45%
13%
39%
REPORTING REQUIREMENT S
28%
16%
56%
39%
13%
8%
8%
3%
IN NOT APPLIC ABLEOUT NOT DE TERM IN ED
| FISH PROCESSING FACILITIES COMPLIANCE AUDIT REPORT 2018: ENVIRONMENTAL MANAGEMENT AC T 22
Compliance was Not Applicable for 16 percent of the requirements, generally because the requirements were only applicable if the facilities were discharging effluent to the environment and several facilities were no longer discharging.
POTENTIAL ENVIRONMENTAL IMPACT FROM INSTANCES OF NON- COMPLIANCEOverall, 202 requirements were assessed for compliance in the 30 permits. The fish processing facilities were found to be In Compliance with 44 percent of the 202 requirements of their respective permits. They were also found to be Out of Compliance with 22 percent of the 202 requirements. Compliance was Not Determined for ten percent of all requirements. In addition, compliance was Not Applicable for 24 percent of all requirements.
The 22 percent of requirements that were Out of Compliance equates to 44 requirements. Of these 44 requirements that were found to be Out of Compliance, ten have the potential to result in an impact to the environment. Four instances of non-compliance were for exceeding the permitted discharge rate. One exceeded the permitted discharge rate for two months in 2016, but did not in 2017; this facility was dischar-ging at a rate of approximately 150 to 300 m3/day under a permitted discharge rate of approximately 100 m3/day. Another facility was consistently exceeding their permitted discharge rate of 800 m3/day by between approximately ten and 25 percent for much of 2017. One facility was greatly exceeding their discharge limit of 28 m3/day, with average daily rates between 186 and 484 m3/day. It is worth noting that this facility has applied for a permit amendment to increase their authorized discharge rate, which is currently under review. The fourth facility had not been connected to a municipal sewer yet as required by the permit and was still discharging a small volume of effluent each processing season; however, this facility only processes nine tonnes of wild finfish and seafood per year. One other facility was Out of Compliance for bypassing the authorized treatment works by discharging some effluent directly into the outfall prior to passing through the treatment works but that facility has since modified its procedures to ensure all effluent passes through the treatment works prior to discharge. Three facilities were Out of Compliance for exceeding the permitted discharge quality; one for a single phosphorus exceedance, one for a single residual chlorine exceedance and one for exceeding the permitted BOD and TSS limits. It is worth mentioning that the facility that was exceeding its permitted BOD and TSS limits does not discharge to a marine environ-ment, but instead to a ground disposal field.
The results indicate that 54 percent of the fish processing facilities were In Compliance with the requirements grouped together under the category of Authorized Discharges. The facilities were Out of Compliance for 13 percent of these requirements, mainly because of exceeding the discharge rate limits or discharge quality limits. Compliance was Not Determined for 21 percent of the requirements, generally because there was no monitoring requirement associated with the discharge requirement, and was Not Applicable for 12 percent of the requirements, generally because the facilities were no longer discharging effluent to the environment.
The results indicate that 39 percent of the fish processing facilities were In Compliance with the requirements grouped together under the category of General Requirements. The facilities were Out of Compliance for eight percent of these requirements, mainly due to not posting signage for their outfalls and not conducting inspections of their outfalls. Compliance was Not Determined for eight percent of the requirements and was Not Applicable for 44 percent of the requirements. The requirements that were not applicable were generally because no bypasses of the authorized works or changes to the process modifications were occurring and the requirement is only applicable when a bypass or process modification has taken place.
The results indicate that 45 percent of the fish processing facilities were In Compliance with the requirements grouped together under the category of Monitoring Requirements. The facilities were Out of Compliance for 37 percent of these requirements due to not conducting all or some of the required monitoring of the discharge rate, discharge quality or receiving environment quality. Compliance was Not Determined for three percent of the requirements and was Not Applicable for 16 percent of the requirements, generally because the facilities were no longer discharging effluent to the environment and therefore were no longer required to conduct the monitoring.
The summary of results for Reporting Requirements shows that 28 percent of the fish processing facilities were In Compliance with the requirements and 56 percent of the facilities were Out of Compliance. As stated above, those facilities that were found to be Out of Compliance with the reporting requirements were either not submitting the required reports or were not submitting all of the required information in their reports.
FISH PROCESSING FACILITIES COMPLIANCE AUDIT REPORT 2018: ENVIRONMENTAL MANAGEMENT AC T | 23
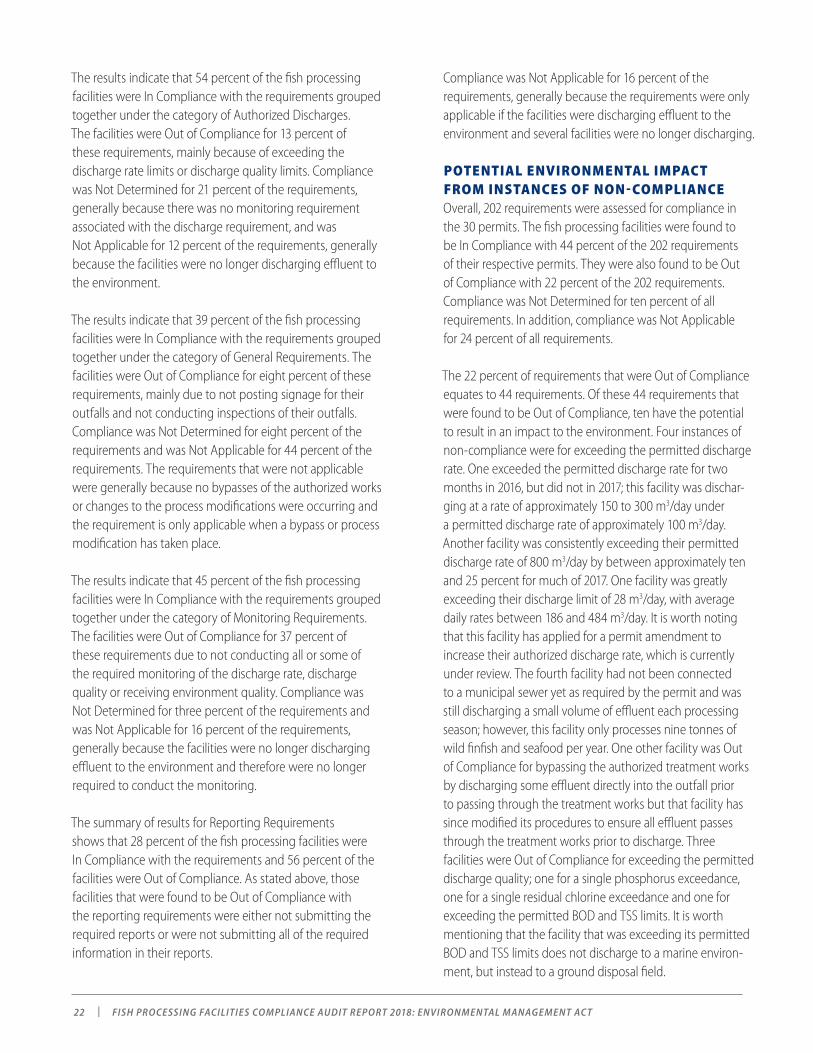
Of the 30 fish processing facilities, 28 percent were In Compliance with all assessed requirements of their permits and were issued a Notice (Figure 12). The remaining 72 percent of fish processing facilities were Out of Compliance with at least one requirement of their permits and were issued an Advisory (Figure 12). Advisories are considered a first level enforcement response to address instances of non-compliance. Advisories are issued when the instance of non-compliance only causes a minor temporary impact or is of a significant administrative nature and there are indicates that future and ongoing compliance is likely. FIGU R E 12 – COM PLIANCE R ESPONSE
The discharge rates and effluent discharge quality limits are established in permits to be protective of the environment. In each of the above listed cases, these established discharge rates and effluent discharge quality limits were being exceeded. While exceeding a permit requirement alone does not result in an impact to the environment, there is the potential that these instances of non-compliance could result in some impact to the environment.
All of the other 34 requirements that were found to be Out of Compliance were administrative requirements that would not directly result in an impact to the environment. These instances of non-compliance included: modifying the treatment works, not posting outfall signage, not conducting inspections of the outfall, not conducting monitoring or sufficient monitoring of the discharge rate, discharge quality or receiving environment quality or not submitting the required data or reports. In the cases of two facilities that were Out of Compliance for updating their septic tank treatment works for their septic discharges without notifying ENV of the process modification, the modi-fied treatment works are likely to be suitable and the instances of non-compliance are assessed to be more administrative for not notifying ENV.
The requirement that was most often assessed as Not Determined was the discharge rate requirement. For nine of the permits, compliance could not be assessed for this requirement because even though there was a limit for the discharge rate, there was no companion requirement to monitor the discharge rate. As a result, there were no records or measuring devices in place that could be used to compare the actual discharge rate with the limit. This means that it is not possible to ensure that the facilities are compliant with the discharge rate limit in their permits and that there is no potential for an impact to the environment.
COMPLIANCE RESPONSEThe response to the non-compliances was based on consideration of the Non-Compliance Decision Matrix found in the ENV Compliance and Enforcement Policy and Procedure Version 3 (ENV, 2014 and Appendix 3).
Advisories were assessed to be the appropriate level of enforcement in all cases where there were instances of non-compliance with the permits. This is because, in general, most of the instances of non-compliance were administrative in nature and in all cases the fish processing facilities showed a cooperative attitude and indicated a willingness to comply in future or were already proceeding with amendments to their permit where they recognized that they could no longer be In Compliance with the existing requirements.
PER
CEN
T O
F A
UTH
OR
IZA
TIO
NS
(%)
100%
90%
80%
70%
60%
50%
40%
30%
20%
10%
0%RESPONSE
28%
ADVISORY
NOTICE
72%
| FISH PROCESSING FACILITIES COMPLIANCE AUDIT REPORT 2018: ENVIRONMENTAL MANAGEMENT AC T 24
The data presented in Table 5 show a wide range of concentrations in all effluents tested. For example, BOD and TSS, key indicator parameters for the sector, ranged from <2.0 to 1920 mg/L and <3.0 to 639 mg/L, respectively. The range in concentrations of the effluent sample results displayed in Table 5 may be attributed to the volume of fish processed prior to effluent sampling, the composition of the effluent — whether it is combined sewage and fish processing waste and the different treatment technologies authorized to treat the effluent.
WQGs for the protection of marine aquatic life have been developed for ammonia, nitrate and TSS, although the TSS guidelines are relative to a change from the background concentration. In addition, WQGs have been developed for recreational water quality and assess the risks to human health. The recreational WQGs include microbiological WQG for shellfish harvesting.
A comparison of the effluent concentrations to WQGs was conducted by an ENV Impact Assessment Biologist. This analysis showed that for nitrate and ammonia, the concentrations in the effluent samples are below marine aquatic life guidelines. In contrast, concentrations of E. coli, Enterococcus and fecal coliform bacteria are above WQGs for recreational waters and shellfish harvesting.
Hence the results from a single grab sample may not necessarily be representative of the average or long term conditions at any one facility. Regardless, the results are able to provide information about the range of effluent quality in the sector.
The effluent samples were collected from facilities that processed farmed salmon, farmed finfish, and wild finfish and seafood and facilities. The effluent samples were also collected from facilities where the treatment works were limited to fine screening as well as both facilities that utilize additional treatment, including disinfection. The samples were collected after the effluent had passed through the authorized treatment works, prior to discharge through the outfall.
Sample results are displayed in Table 5 (on page 25) for the eight facilities which are designated A through H.
IMPACT ASSESSMENTAn assessment was conducted to determine whether the effluent discharged from fish processing facilities is potentially causing pollution as defined in the EMA. Pollution is defined in EMA as the presence in the environment of substances or contaminants that substantially alter or impair the usefulness of the environment.
Two lines of evidence were used for this assessment. First, effluent samples were collected by ENV staff during inspections and compared to provincial water quality guidelines, toxicity thresholds, permit limits and other legislation. British Columbia Water Quality Guidelines (WQGs) provide a concentration threshold for ambient water quality parameters and are used to assess water quality in receiving environments. Some WQGs have both acute and chronic values. In general, WQGs do not apply to undiluted effluent prior to entering the receiving environment. However, a comparison of discharge data to WQG can provide information about the potential for impacts, because if effluent concentrations are below WQG there is no potential for the effluent to lead to WQG exceedances in the environment. Alternatively, if effluent concentrations are above WQG, there is potential for WQG exceedances in the environment; sampling in the ambient environment would be needed for additional information.
The second line of evidence used for this assessment was an evaluation of receiving environment data obtained from facilities that have requirements to conduct this monitoring within their permits. Receiving environment data is the strongest line of evidence for determining the potential for impacts.
IN SPEC TI ON SAM PLE R ESU LTS
Effluent samples were collected at all eight fish processing facilities that were operating at the time of the inspection. These samples were collected to obtain a snapshot of the range of effluent quality from the facilities. The sampling program consisted of a single grab sample from treated, undiluted effluent from each of the facilities. It is noted that effluent quality changes with time, sometimes quite rapidly even throughout a one day period, as it is dependent on changes in fish processing activities.

FISH PROCESSING FACILITIES COMPLIANCE AUDIT REPORT 2018: ENVIRONMENTAL MANAGEMENT AC T | 25
PARAMETER A B C D E F G H
Tonnages (tonnes/year) 2000 2200 2000 22000 36500 18140 2711 943
Treatment Works 25 mesh rotary drum screen
0.5 mm rotary drum screen
25 mesh screen
0.5 and 0.2 mm screens
pre-screening, equalization tank, DAF, second-ary-screening, UV disinfec-tion, solids centrifuging
Rotary drum screen
Rotary drum screen
screens, ozone separation and disinfection, secondary treatment plant (primary sedimentation, aeration, settling tank), ground disposal field
pH (-) 6.88 6.97 6.78 6.68 7.14 6.72 7.45 6.77
Total Suspended Solids (mg/L) 242 155 139 218 77.1 639 <3.0 56.1
Ammonia, Total (as N) (mg/L) 1.12 0.635 7.34 1.54 3.31 1.35 0.0805 20.8
Nitrate (as N) (mg/L) - <0.50 0.104 <0.25 <0.30 - 0.103 0.0667
Nitrite (as N) (mg/L) - <0.10 0.0021 <0.050 <0.10 - 0.0049 0.0235
Total Kjeldahl Nitrogen (mg/L) 46.5 42.3 - - 36 65.7 0.103 47.2
Total Nitrogen (mg/L) 47.7 42.3 36.4 116 36.0 65.7 0.211 47.3
Total Organic Nitrogen (mg/L) 45.3 41.7 28.9 115 32.7 64.4 <0.050 26.5
Phosphorus (P)-Total (mg/L) 11.5 6.99 - - 0.70 12.0 0.170 6.21
Total Organic Carbon (mg/L) 149 125 - - 52.8 344 1.01 165
Chlorine, Free (mg/L) <0.10 0.11 - - 0.30 - - -
E. coli (CFU/100mL) 130 - <10 <10 - <10 <10 -
Enterococcus (CFU/100mL) 8100 - >60000 >60000 - >6000 <10 -
Coliform Bacteria - Fecal (CFU/100mL)
350 - - - - 1300 <2 -
BOD (mg/L) 500 246 337 930 234 1920 <2.0 280
COD (mg/L) 609 740 671 1890 470 1870 <20 680
Oil and Grease (mg/L) 44.9 22.5 - - 1.2 296 <5.0 74.3
Toxicity - 96hr LC50 (percent of effluent concentration)
acutely lethal at 74.83% effluent
- - - - acutely lethal at 42.33% effluent
acutely lethal at 25.4% effluent
acutely lethal at 24% effluent
Toxicity - 96hr static single concentration*(percent of effluent concentration)
- not acutely lethal at 36% effluent
- - not acutely lethal at 73% effluent
- - -
Notes: ‘-‘ indicates that no analyses for the parameter was requested. * Acutely lethal – 50 percent or more fish mortality over the 96hr exposure period.
TABLE 5 – E FFLU E NT D ISCHARG E QUALIT Y R ESU LTS
| FISH PROCESSING FACILITIES COMPLIANCE AUDIT REPORT 2018: ENVIRONMENTAL MANAGEMENT AC T 26
It is possible that different results would be obtained using a different test or test organism. This may be appropriate given the salinity of the effluent samples. The observed mortality in toxicity tests appear to be related to elevated BOD and COD levels in the effluent, as there was a steady decline of dissolved oxygen in test vessels. However, it is observed that sample G, which was acutely toxic at 25.4 percent effluent concentration, had the lowest concentration of BOD and COD (and all other parameters) compared to all of other the samples collected. This may be due to sample variability, and speaks to the difficulties in drawing conclusions from such a limited dataset.
Overall, the results of the effluent sampling and data analysis show that there is potential for environmental impacts downstream of the fish processing plant discharges, as some sample results exceeded either permit limits, MWR discharge limits or WQG, and some samples were acutely toxic to fish under laboratory conditions. It is important to note that once released into the receiving environment, effluent mixing and dilution occurs, potentially reducing harmful concen-trations of contaminants. To assess if effluent is having an effect on aquatic life and causing pollution in the receiving environment, additional information is required including a description of the ecosystem near the discharge, an assess-ment of effluent mixing and additional sampling at the edge of the initial dilution zone.
R ECE IVING E NVIRON M E NT
A review of receiving environment monitoring data from two fish processing facilities was also completed to evaluate whether fish processing effluent is having an impact on water quality in the receiving environment. These are two of the larger fish processing facilities and have the most comprehensive receiving environment programs as requirements in their permits. The first facility processes exclusively farmed salmon and the authorized works include pre-screening, equalization tank, DAF, secondary screening, UV disinfection, and solids centrifuging. The permit require-ments include specific limits on discharge volume, effluent quality and receiving environment monitoring. The second facility processes exclusively wild finfish and shares an outfall and receiving environment with a municipal wastewater treatment facility and another smaller fish processing facility that also processes exclusively wild finfish. The authorized works of these two fish processing facilities that share this outfall are limited to fine screening. In the cases of these fish processing facilities, the permit requirements lack numerical values for effluent quality.
For an assessment of TSS and BOD concentrations, sample results were compared to permit discharge limits where applicable, as well the Municipal Wastewater Regulation (MWR) effluent discharge limits for discharges to open marine waters (ENV, 2012). These values were used to provide some information on the potential for environment impacts, as there are no WQG for BOD and interpretation of the WQG for TSS depends on knowledge of the ambient TSS concen-trations in the receiving environment, which was unavailable for the assessment.
TSS discharge limits for open marine waters in the MWR are 130 mg/L for discharges less than 50 m3/day, and 45 mg/L for discharges greater than 50 m3/day (ENV, 2012). One of fish processing facilities sampled discharges less than 50 m3/day and the TSS of the effluent slightly exceeded the permit limit of 45 mg/L, but not the MWR TSS threshold of 130 mg/L. Each of the remaining seven facilities discharges greater than 50 m3/day. The TSS concentrations were above the MWR TSS threshold of 45 mg/L in six of these effluent samples, but only above the permit limit in one sample. It should be noted that only three of the seven facilities had TSS limits in their permits.
BOD discharge limits for open marine waters in the MWR are 130 mg/L for discharges less than 50 m3/day, and 45 mg/L for discharges greater than 50 m3/day (ENV, 2012). Of the seven fish processing facilities sampled that discharge greater than 50 m3/day, six of the results were above the MWR BOD threshold of 45 mg/L. However, only these two facilities have effluent permit requirements for BOD and only one facility was exceeding their permit limit.
The results of the fish toxicity tests show that four out of six effluent samples taken are acutely lethal to fish in the lab environment, meaning that the toxicity tests resulted in 50% or more fish mortality. Effluent samples A, F, G, and H were used for the toxicity tests at five dilutions (100 percent effluent, 56 percent effluent, 32 percent effluent, 18 percent effluent and 10 percent effluent) and the calculated lethal concen-trations ranged from 24 to 75 percent effluent concentration. Effluent samples B and E were tested for acute toxicity at 36 and 73 percent effluent concentrations, respectively. The salinity concentrations in these two samples limited the ability to run toxicity tests at higher effluent concentrations. Each of the two single concentration toxicity tests did not result in acute lethality, meaning the tests resulted in less than 50 percent fish mortality; however, it is unknown if these effluent samples would be acutely toxic at 100 percent concentrations.
FISH PROCESSING FACILITIES COMPLIANCE AUDIT REPORT 2018: ENVIRONMENTAL MANAGEMENT AC T | 27
Permit Requirements Review
PERMIT REQUIREMENTS A review was conducted of the 30 permits to assess whether they contain consistent requirements for protection of the environment. It should be noted that permit requirements are not expected to be identical between all facilities due to the site-specific nature of the discharges. The discharge rate, effluent discharge quality limits and associated monitoring requirements are set based on many considerations including: loading rate, receiving environment sensitivity and assimilative capacity, and policies at the time the permits were written. The assessment of the require-ments is conducted under the grouped categories of Authorized Discharges, General Requirements, Monitoring Requirements and Reporting Requirements similar to the inspection results.
AUTH OR IZ E D DISCHARG ES
Figure 13 (on page 28) displays the number of permits out of the 30 total permits that contain a requirement for discharge rate, discharge characteristics, discharge quality and treatment works.
The receiving environment monitoring data were evaluated by an ENV Impact Assessment Biologist. The results for the first facility shows that the water column profiling for pH, temperature, salinity and dissolved oxygen were similar to reference conditions, and the water quality results show that 100 m from the outfall terminus, the WQGs are met for ammonia and nitrate. Based on the effluent quality and this receiving environment water quality results, it appears that the effluent is being sufficiently mixed within the IDZ in the receiving environment as to not be causing an impact to the environment beyond the IDZ.
The results of the receiving environment monitoring program for the second facility (with a combined discharged) also do not appear to indicate that there is an impact on water quality in the receiving environment. All parameters from the water column profile results were reported to be within WQG and similar to reference conditions. Water quality samples for ammonia nitrogen were collected at three depths at the edge of the IDZ and the results showed ammonia nitrogen levels were below WQGs. Despite these results, there were some concerns with the receiving environment monitoring program being effective in capturing the effluent plume to adequately assess whether impacts to the receiving environment are occurring. The water column profile locations were not the same as the sample locations and the profiling and sampling were conducted at different times. In addition, the sampling frequency is not consistent with current ENV guidance. It was also found that fecal coliforms were being used as the microbiological indicator; however, fecal coliforms do not survive in seawater as long as Enterococci, which is the therefore the recommended microbio-logical indicator.
CO NCLUSI O N
The amount of data analyzed for this assessment is small, and as a result it is not possible to make widespread conclusions about the sector. The inspection samples showed there is some potential for environmental impacts from fish processing discharges, based on effluent toxicity and concentrations of some parameters. However, there is no evidence from the existing receiving environment data that indicates that impacts are occurring. Additional receiving environment monitoring would be required to fully assess whether fish processing facilities are potentially causing pollution as defined in EMA.
Under Authorized Discharges, all 30 of the fish processing facility permits contain a requirement that specifies a maximum discharge rate. All except one permit contain a requirement describing the discharge characteristics as being typical of effluent from a fish processing facility. This permit is written quite differently than all other permits in that it is formatted as a letter. Only seven of the 30 permits contain effluent discharge quality limits, which can be measured to assess compli-ance. Table 6 (on page 28) provides a summary of the parameters that have permit limits and their concentra-tions in those seven permits.
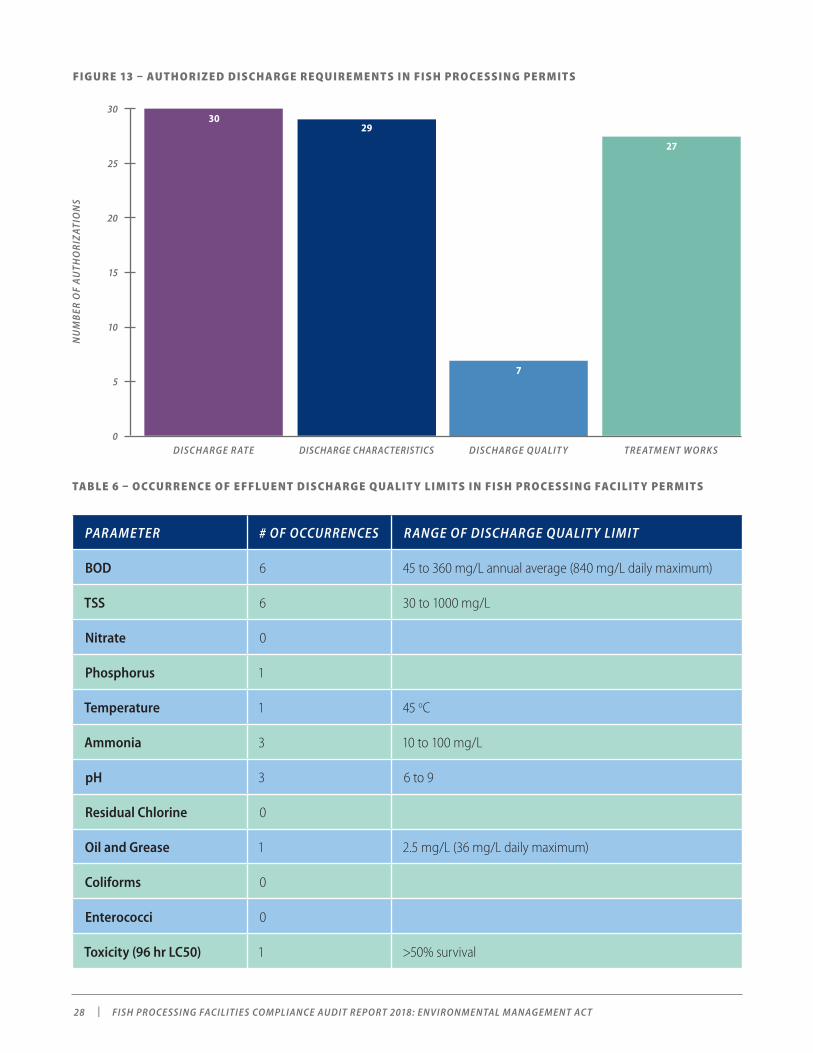
| FISH PROCESSING FACILITIES COMPLIANCE AUDIT REPORT 2018: ENVIRONMENTAL MANAGEMENT AC T 28
TABLE 6 – OCCU R R E NCE O F E FFLU E NT D ISCHARG E QUALIT Y LI M ITS I N FISH PROCESSI NG FACI LIT Y PE R M ITS
PARAMETER # OF OCCURRENCES RANGE OF DISCHARGE QUALIT Y LIMIT
BOD 6 45 to 360 mg/L annual average (840 mg/L daily maximum)
TSS 6 30 to 1000 mg/L
Nitrate 0
Phosphorus 1
Temperature 1 45 oC
Ammonia 3 10 to 100 mg/L
pH 3 6 to 9
Residual Chlorine 0
Oil and Grease 1 2.5 mg/L (36 mg/L daily maximum)
Coliforms 0
Enterococci 0
Toxicity (96 hr LC50) 1 >50% survival
FIGU R E 13 – AUTH OR IZ E D DISCHARG E R EQU IR E M E NTS IN FISH PROCESSING PE R M ITSN
UM
BER
OF
AU
THO
RIZ
ATI
ON
S
30
25
20
15
10
5
0DISCHARGE R ATE
30
DISCHARGE CHARACTERISTICS DISCHARGE QUALIT Y
7
TRE ATMENT WORKS
27
29
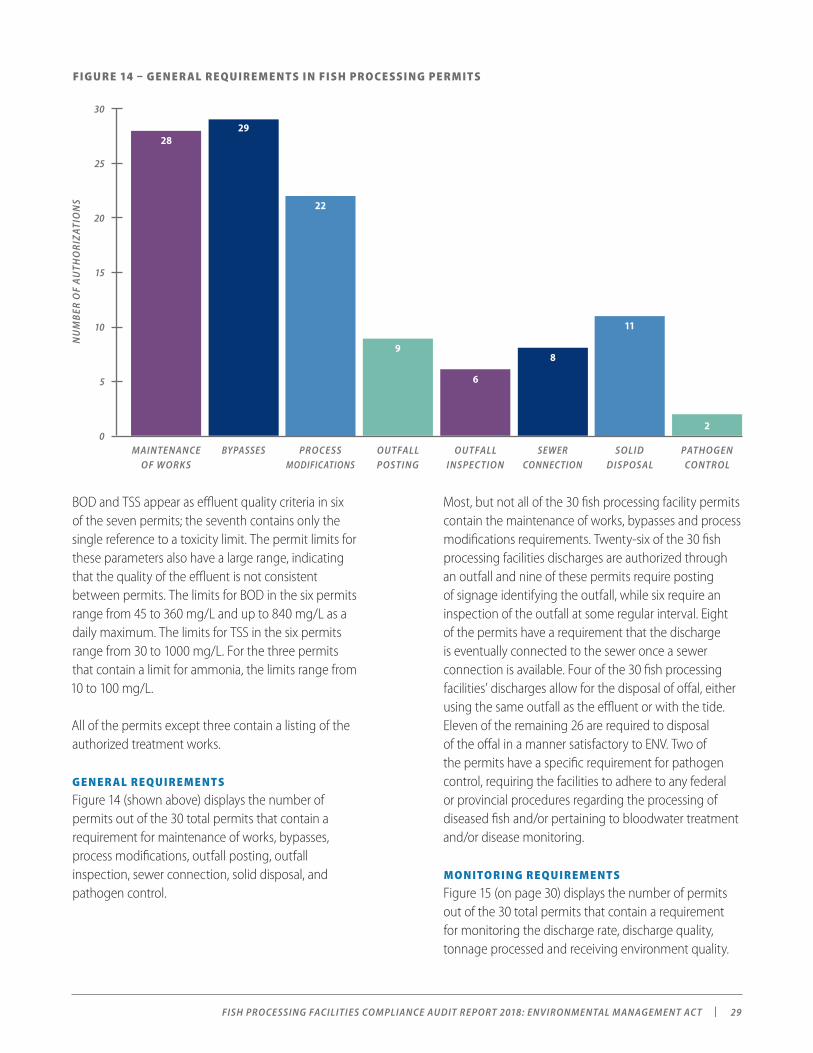
FISH PROCESSING FACILITIES COMPLIANCE AUDIT REPORT 2018: ENVIRONMENTAL MANAGEMENT AC T | 29
Most, but not all of the 30 fish processing facility permits contain the maintenance of works, bypasses and process modifications requirements. Twenty-six of the 30 fish processing facilities discharges are authorized through an outfall and nine of these permits require posting of signage identifying the outfall, while six require an inspection of the outfall at some regular interval. Eight of the permits have a requirement that the discharge is eventually connected to the sewer once a sewer connection is available. Four of the 30 fish processing facilities’ discharges allow for the disposal of offal, either using the same outfall as the effluent or with the tide. Eleven of the remaining 26 are required to disposal of the offal in a manner satisfactory to ENV. Two of the permits have a specific requirement for pathogen control, requiring the facilities to adhere to any federal or provincial procedures regarding the processing of diseased fish and/or pertaining to bloodwater treatment and/or disease monitoring.
MON ITOR ING R EQU IR E M E NTS
Figure 15 (on page 30) displays the number of permits out of the 30 total permits that contain a requirement for monitoring the discharge rate, discharge quality, tonnage processed and receiving environment quality.
BOD and TSS appear as effluent quality criteria in six of the seven permits; the seventh contains only the single reference to a toxicity limit. The permit limits for these parameters also have a large range, indicating that the quality of the effluent is not consistent between permits. The limits for BOD in the six permits range from 45 to 360 mg/L and up to 840 mg/L as a daily maximum. The limits for TSS in the six permits range from 30 to 1000 mg/L. For the three permits that contain a limit for ammonia, the limits range from 10 to 100 mg/L.
All of the permits except three contain a listing of the authorized treatment works.
G E N E R AL R EQU I R E M E NTS
Figure 14 (shown above) displays the number of permits out of the 30 total permits that contain a requirement for maintenance of works, bypasses, process modifications, outfall posting, outfall inspection, sewer connection, solid disposal, and pathogen control.
FIG U R E 14 – G E N E R AL R EQU I R E M E NTS I N FISH PROCESSI NG PE R M ITSN
UM
BER
OF
AU
THO
RIZ
ATI
ON
S
30
25
20
15
10
5
0MAINTENANCE
OF WORKS
28
BYPASSES PROCESS MODIFICATIONS
22
OUTFALL POSTING
9
29
OUTFALL INSPEC TION
6
SEWER CONNECTION
SOLID DISPOSAL
11
PATHOGEN CONTROL
2
8
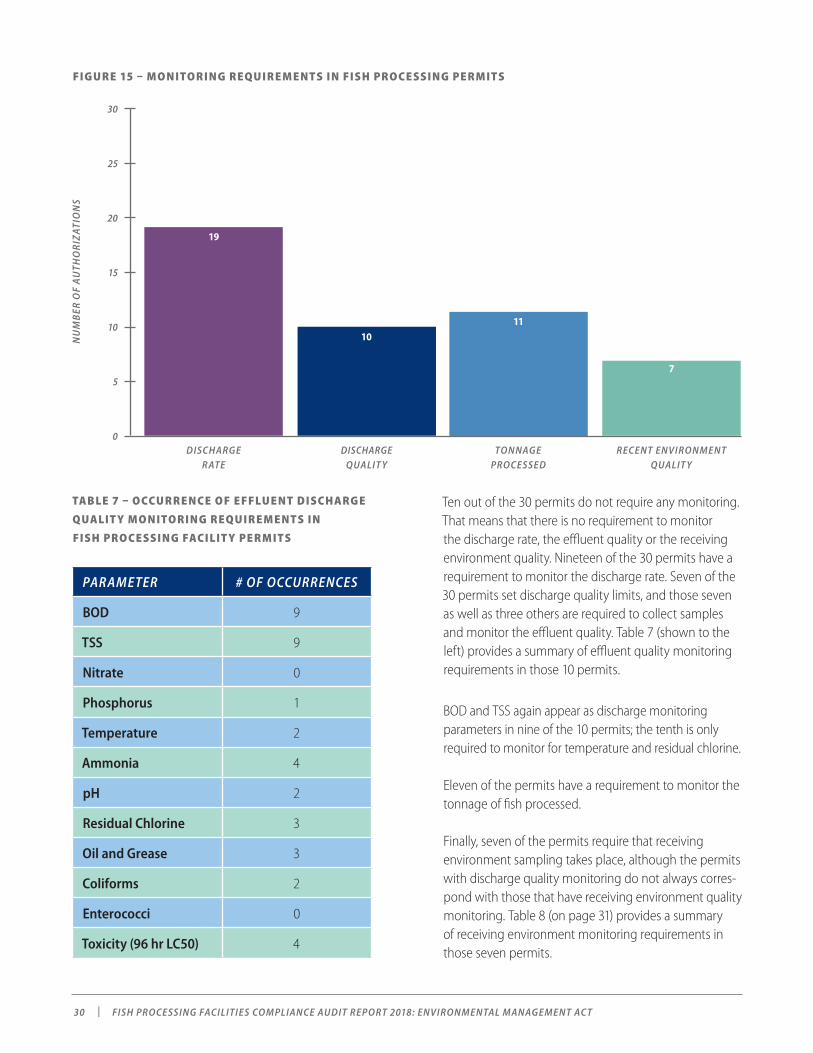
| FISH PROCESSING FACILITIES COMPLIANCE AUDIT REPORT 2018: ENVIRONMENTAL MANAGEMENT AC T 30
TABLE 7 – OCCU R R E NCE O F E FFLU E NT D ISCHARG E
QUALIT Y MON ITOR ING R EQU IR E M E NTS IN
FISH PROCESSING FACILIT Y PE R M ITS
PARAMETER # OF OCCURRENCES
BOD 9
TSS 9
Nitrate 0
Phosphorus 1
Temperature 2
Ammonia 4
pH 2
Residual Chlorine 3
Oil and Grease 3
Coliforms 2
Enterococci 0
Toxicity (96 hr LC50) 4
Ten out of the 30 permits do not require any monitoring. That means that there is no requirement to monitor the discharge rate, the effluent quality or the receiving environment quality. Nineteen of the 30 permits have a requirement to monitor the discharge rate. Seven of the 30 permits set discharge quality limits, and those seven as well as three others are required to collect samples and monitor the effluent quality. Table 7 (shown to the left) provides a summary of effluent quality monitoring requirements in those 10 permits.
NU
MB
ER O
F A
UTH
OR
IZA
TIO
NS
30
25
20
15
10
5
0DISCHARGE
R ATE
19
DISCHARGE QUALIT Y
TON NAGE PROCESSED
11
RECENT ENVIRONMENT QUALIT Y
7
10
FIGU R E 15 – MON ITOR ING R EQU IR E M E NTS IN FISH PROCESSING PE R M ITS
BOD and TSS again appear as discharge monitoring parameters in nine of the 10 permits; the tenth is only required to monitor for temperature and residual chlorine.
Eleven of the permits have a requirement to monitor the tonnage of fish processed.
Finally, seven of the permits require that receiving environment sampling takes place, although the permits with discharge quality monitoring do not always corres-pond with those that have receiving environment quality monitoring. Table 8 (on page 31) provides a summary of receiving environment monitoring requirements in those seven permits.
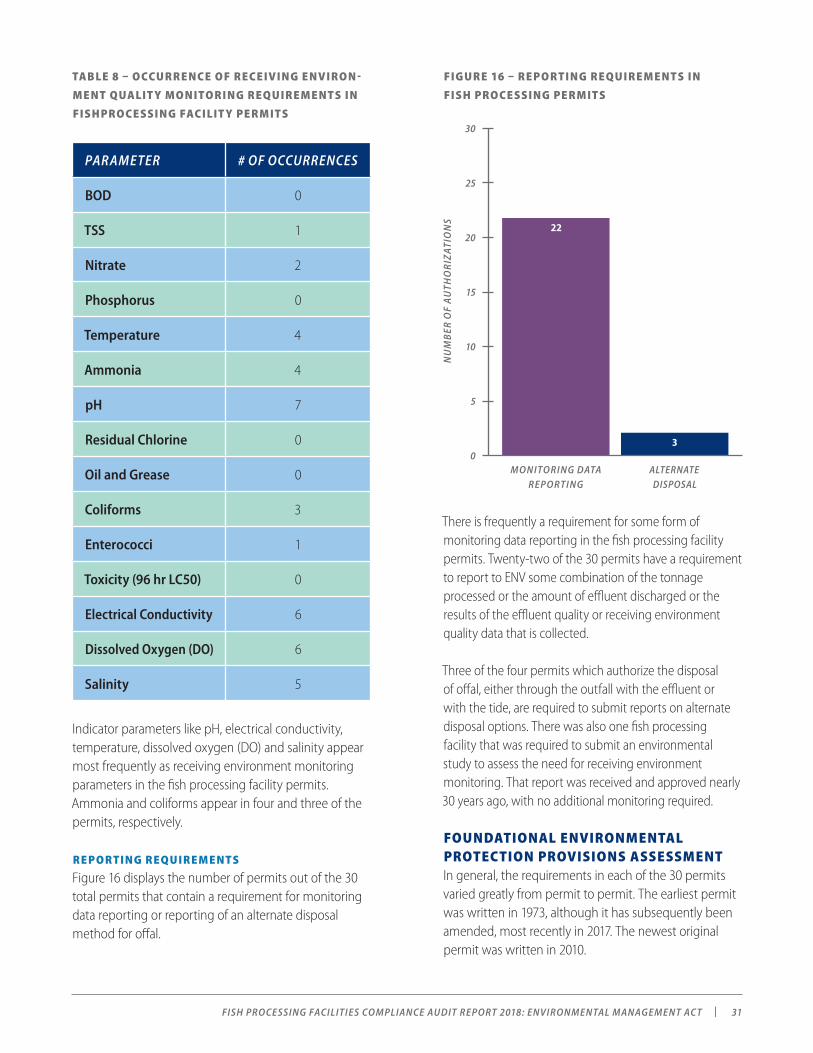
FISH PROCESSING FACILITIES COMPLIANCE AUDIT REPORT 2018: ENVIRONMENTAL MANAGEMENT AC T | 31
FIGU R E 16 – R E PORTING R EQU IR E M E NTS IN
FISH PROCESSING PE R M ITS
TABLE 8 – OCCU R R E NCE O F R ECE IVI NG E NVI RO N -
M E NT QUALIT Y MON ITOR ING R EQU IR E M E NTS IN
FISH PROCESSING FACILIT Y PE R M ITS
PARAMETER # OF OCCURRENCES
BOD 0
TSS 1
Nitrate 2
Phosphorus 0
Temperature 4
Ammonia 4
pH 7
Residual Chlorine 0
Oil and Grease 0
Coliforms 3
Enterococci 1
Toxicity (96 hr LC50) 0
Electrical Conductivity 6
Dissolved Oxygen (DO) 6
Salinity 5
Indicator parameters like pH, electrical conductivity, temperature, dissolved oxygen (DO) and salinity appear most frequently as receiving environment monitoring parameters in the fish processing facility permits. Ammonia and coliforms appear in four and three of the permits, respectively.
R E PORTI NG R EQU IR E M E NTS
Figure 16 displays the number of permits out of the 30 total permits that contain a requirement for monitoring data reporting or reporting of an alternate disposal method for offal.
NU
MB
ER O
F A
UTH
OR
IZA
TIO
NS
30
25
20
15
10
5
0MON ITORING DATA
REPORTING
22
ALTERNATE DISPOSAL
3
There is frequently a requirement for some form of monitoring data reporting in the fish processing facility permits. Twenty-two of the 30 permits have a requirement to report to ENV some combination of the tonnage processed or the amount of effluent discharged or the results of the effluent quality or receiving environment quality data that is collected.
Three of the four permits which authorize the disposal of offal, either through the outfall with the effluent or with the tide, are required to submit reports on alternate disposal options. There was also one fish processing facility that was required to submit an environmental study to assess the need for receiving environment monitoring. That report was received and approved nearly 30 years ago, with no additional monitoring required.
FOUNDATIONAL ENVIRONMENTAL PROTECTION PROVISIONS ASSESSMENTIn general, the requirements in each of the 30 permits varied greatly from permit to permit. The earliest permit was written in 1973, although it has subsequently been amended, most recently in 2017. The newest original permit was written in 2010.

| FISH PROCESSING FACILITIES COMPLIANCE AUDIT REPORT 2018: ENVIRONMENTAL MANAGEMENT AC T 32
The foundational environmental protection provisions that are necessary to ensure permits are protective of the environment often include: limits for discharge rate and discharge quality, requirements to monitor the discharge rate, the discharge quality and the receiving environ-ment quality, and a requirement to report the results to ENV. Figure 17 displays a summary of the percentages of the 30 fish processing facility permits that contain these foundational environmental protection requirements.
Almost all of the permits have been amended at some time; however, many of the permits were last amended in the 1990s or 2000s and there remain some permits that have not been altered for greater than 30 years.
Those that have been amended recently have typically been amended only to change the name on the permit or to add in some requirements that are now common to all permits, like requirements for maintenance of works, bypasses, process modifica-tions, non-compliance notification, non-compliance reporting and spill reporting. All of the permits that have been amended in the last 10 years to require new discharge requirements or additional discharge quality or receiving environment monitoring requirements and have been permits where the amendment process was initiated by the fish processing facility, usually because they wanted to increase their authorized discharge rate.
PER
CEN
T O
F A
UTH
OR
IZA
TIO
NS
(%)
100%
90%
80%
70%
60%
50%
40%
30%
20%
10%
0%DISCHARGE R ATE DISCHARGE QUALIT Y RECEIVING ENVIRONMENT
PERM IT LIM IT S MON ITORING REPORTING
100%
70%
63%
23%
33%33%
23%23%
FIGU R E 17 – FOU N DATI ONAL E NVIRON M E NTAL PROTEC TI ON PROVISI ONS
All of permits contained a discharge rate limit; however, only 63 percent also contained a requirement to monitor the discharge, making it difficult to determine the amount of effluent being discharged at many of the facilities.
All except one of the permits contained a discharge characteristics requirement; however, this requirement is usually limited to wording indicating that the discharge must be “typical of a fish processing facility”. Twenty-three percent of the permits contain additional discharge quality requirements that set specific concentration limits for the effluent.
FISH PROCESSING FACILITIES COMPLIANCE AUDIT REPORT 2018: ENVIRONMENTAL MANAGEMENT AC T | 33
Best Achievable Technology (BAT)
In the absence of modern treatment guidelines, ENV uses a Best Achievable Technology (BAT) policy to inform the drafting of permit requirements across all sectors. BAT refers to technology which can achieve the best waste discharge standards, and that has been shown to be economically feasible through commercial application (ENV, 2015). It should be noted that best achievable technology differs from best available technology. There are situations where a technology is available; however, it is not considered appropriate or economically feasible for the industry. While BAT is often common across a sector, it is heavily dependent on what is available and it is possible that site-specific circumstances may dictate that different technologies are appropriate in different site-specific circumstances within a particular sector.
The federal guidelines for treatment of effluent from fish processing facilities were established in 1975 and recom-mended fine screening as the appropriate treatment (ECCC, 1975). Two facilities currently have authorized treatment works that exceed those recommended in the guidelines. Since that time ENV has developed policy around BAT. Screening as the sole treatment technology for fish processing waste is no longer accepted as BAT.
As previously mentioned, a jurisdictional scan of legis-lation, standards and guidelines associated with seafood processing waste management was prepared for ENV in 2011 (Golder, 2011). The jurisdictional scan notes several references to best available technology rather than best achievable technology. The US Clean Water Act requires that effluent guidelines are developed that represent best available technology that is economic-ally achievable for pollutants and discharges. The EU has the Integrated Pollution Prevention and Control (IPPC) Directive, which establishes a procedure for authorising activities and sets minimum requirements for permits. Any implementation of the IPPC stresses the uses of best available technology; however, there are no specific best available technology reference documents for the fish processing industry.
The parameters referenced to have limits in these permits were typically, but not always, BOD and TSS. Some permits set pH and ammonia limits. Others set temperature, residual chlorine, oil and grease and toxicity limits. The ranges of concentrations of each of these parameters varied greatly (Table 6). Thirty-three percent of the permits contained a requirement to monitor the discharge quality, making it difficult to determine what the quality of the effluent might be at most facilities.
Permit limits for receiving environment quality are not common to most ENV permits; rather, WQGs are the primary criteria for comparison to receiving environ-ment data. However, monitoring of the receiving environment is typically a foundational requirement. In the fish processing sector, this was a requirement in only 23 percent of the permits. In one of these permits, the monitoring was only required for the first three years of operation.
In all cases where monitoring was required, there was a corresponding requirement to submit the data in a report to ENV. It is worth noting, that only five of these permits required any assessment or interpretation of the results to identify potential environmental impacts, as is commonly included in more modern permit language.
INDUSTRY CONCERNSMultiple fish processing facilities stated that they felt that the permits issued by ENV as they currently exist are unfair because some facilities are operating under older permits with less restrictive and cheaper treatment requirements compared with the newer permits. They believed that they were losing processing contracts because they could be underbid by others with lower treatment costs associated with the treatment requirements in those permits. Three other facilities indicated that they were operating less because much of the processing of fish is taking place at sea, where the offal is dumped over the side of the boat, and that the fishing boats return without requiring authorized fish processing facilities.
| FISH PROCESSING FACILITIES COMPLIANCE AUDIT REPORT 2018: ENVIRONMENTAL MANAGEMENT AC T 34
WorleyParsons (2011) indicates that screening can remove 75 to 80 percent of TSS with a rotary screen at 420 microns although 50 percent removal of TSS is typically used for design. WorleyParsons (2011) also identifies belt filters as a preliminary method of treat-ment and indicates that 94 to 95 percent TSS and 23 to 40 percent BOD removal can be achieved; however, 70 percent TSS removal is used in design. Some form of screening appears as authorized treatment works in 83 percent of the permits.
PR I M ARY TR E ATM E NT
Once the preliminary screening has taken place there are several other technologies that can be utilized as primary treatment to further treat the fish processing effluent by removing additional particulate and a portion of particulate BOD. Clarification and dissolved air flotation (DAF) can be used to remove suspended solids that sink or float when chemical coagulants and flocculants are added. The flocs can then be removed from the effluent. Removed solids can have high moisture content and require additional treatment before disposal (Aqua-Terra, 2014). Clarification involves settling of particles, whereas with DAF solids are floated to the surface with air where they can then be removed. Clarifiers can remove 50 to 70 percent for TSS and 25 to 40 percent for BOD in municipal wastewater (Tchobanoglous et al., 2003). DAF can remove up to 50 percent of suspended solids and 80 percent of fat, oil and grease without the use of coagulants and floccu-lants, and between 80 and 95 percent with the use of coagulants and flocculants (Tomczak-Wandzel et al., 2015). The removal of COD/BOD depends on the amount of dissolved materials and can vary between 15 and 65 percent (Tomczak-Wandzel et al., 2015). Both clarifiers and DAF systems have a large footprint and will take up considerable space at a facility. Centrifuges can also be used to remove suspended solids. Centrifuges have very high capital and operating costs and are typically used for recovering high value fish solids and dewatering DAF sludge (Aqua-Terra, 2014). Membrane Filtration can be used to remove the suspended solids and a portion of the dissolved solids, depending on the size of the filter. The capital costs are very high and the membranes are prone to being plugged or destroyed when using fish processing effluent (Aqua-Terra, 2014).
BEST ACHIEVABLE TECHNOLOGY (BAT) REVIEWA review of waste treatment and disposal technologies for the fish products industry was prepared for ENV in 2011 (WorleyParsons, 2011). This included an assessment of the current treatment works utilized in BC as well as technologies used elsewhere in the world.
Before discussing the BAT for treatment of those parameters that are typical of fish processing effluent, it is necessary to acknowledge that Best Management Practices (BMP) when employed can greatly reduce the need for and cost of treatment. In terms of treatment, the focus of BMP is on the reduction of water usage. Reducing the amount of water used in processing means that fewer solids are likely to come in contact with the water, resulting in lower concentrations of BOD and TSS in the effluent (WorleyParsons, 2011). In addition, the longer the solids are in contact with the water, the higher the BOD and TSS concentrations will be in the effluent. Therefore, improved handling of the solids to limit the contact time with the process water can decrease the BOD and TSS concentrations in the effluent (WorleyParsons, 2011). Decreasing water use also limits the quantity of the discharge.
The discussion of BAT will look at each of the three main levels of treatment for fish processing facility effluent, preliminary treatment, primary treatment and secondary treatment.
PR E LI M I NARY TR E ATM E NT
Preliminary treatment of fish processing facility effluent is generally performed by screening the effluent. Screening is the first method of treatment in the fish processing industry. Screening removes the larger particulates in the fish processing effluent. Aqua-Terra (2014) indicates that the slot openings typically range from 381 to 500 microns. Tomczak-Wandzel et al. (2015) state that screening is to remove larger solids greater than 0.7 mm. Screening can be accomplished by static fixed screens or rotary drum filters. Screens are the preferred method for removing larger particles of seafood (Aqua-Terra, 2014). The limitation is that only suspended particles greater than the screen opening are removed. Tchobanoglous et al. (2003) indicate that rotary drum filters achieve higher BOD and TSS removal than fixed screens in wastewater treatment.
FISH PROCESSING FACILITIES COMPLIANCE AUDIT REPORT 2018: ENVIRONMENTAL MANAGEMENT AC T | 35
Both chlorine and ozone gas are hazardous, though not all chlorination systems utilize chlorine gas. UV light can also be used, but has not been widely implemented due to requiring effluent with a high UV transmittance, meaning that the effluent must be reasonably clear and free of suspended solids. UV disinfection does not have any hazardous chemicals. Each of these technologies typically results in 3 log removal of viruses (WorleyParsons, 2011). Ozone and UV are more effective than chlorine in inactivating most viruses, spores, cysts and oocysts (Tchobanoglous et al., 2003). Two fish processing facilities in BC are or have used a UV disinfection system operating at very low UV transmittance (Aqua-Terra, 2014).
OUTFALLS
In addition to treatment facilities, a submerged outfall is part of the authorized works for 87 percent of the 30 authorized fish processing facilities. While not applicable to fish processing plants, the MWR requirements may be considered for comparison. The MWR requires that marine outfalls are designed by a qualified professional to meet certain requirements and that the diffusers also meet certain requirements, including providing at least 10:1 dilution within the IDZ and to not cause water quality parameters to fail to meet water quality guide-lines outside the IDZ (ENV, 2012). Maximum dilution will depend on the effluent flow rate, depth of water, length of diffuser, outlet diameter, configuration of the diffuser and ocean conditions (Dhanak and Xiros, 2016).
BEST ACH IEVABLE TECH N OLOGY
(BAT) ASSESSM E NT
WorleyParsons (2011) ranked the technologies based on reliability, control effectiveness and cost effectiveness. The review further developed a matrix of technologies as a guide for selection of BAT based on how often the facility was in operation, the concentration of fats, oils and greases and the disposal costs for solids. The assessment was not able to determine if the technology is economically achievably on a facility by facility basis because assessing socioeconomic factors was outside of that project’s scope; however, the relative equipment and operation costs associated with each technology were assessed. The calculated costs were 25 year life cycle costs and accounted for capital, building, instal-lation, engineering, power, chemical, maintenance and solids disposal. It should be noted that these costs were developed in 2011 and may not reflect current costs.
SECON DARY TR E ATM E NT
Secondary treatment provides additional treatment following the preliminary and primary treatments. It is typically employed in instances where reduction of soluble BOD is required (WorleyParsons, 2011). Secondary treatment technologies can use either aerobic or anaer-obic biological treatment systems. The aerobic systems include activated sludge, aerated lagoons, aerobic digestion, trickling filters, rotating biological contractors and packed-bed reactors (Tchobanoglous et al., 2003). The resulting effluent from activated sludge typically has a BOD concentration of 20 to 50 mg/L for municipal wastewater (WorleyParsons, 2011). Trickling filters can remove 45 to 70 percent of BOD for single stage filters and 90 percent for two stage filters (WorleyParsons, 2011). Moving-bed bioreactors can remove almost 100 percent of BOD (WorleyParsons, 2011). Membrane bioreactors are another secondary treatment method and removal of BOD and TSS is very high with effluent quality typically measuring only 1 to 2 mg/L for both BOD and TSS (WorleyParsons, 2011). The anaerobic systems included anaerobic filter anaerobic digester, anaerobic packed and fluidized bed and upflow anaerobic sludge blanket (Tchobanoglous et al., 2003). This treatment method requires steady and stable flows of effluent which is not always the case with fish processing facilities (Aqua-Terra, 2014). The treatment efficacy is also affected by temper-ature and salinity (Aqua-Terra, 2014). The capital and operational expenditures of biological treatment can be extremely high (Tomczak-Wandzel et al., 2015).
DISI N FEC TI ON
Disinfection can be the final treatment before discharge of the effluent. Disinfection is the inactivation of disease-causing organisms and is not equivalent to sterilization, which is the destruction of all organisms (Tchobanoglous et al., 2003). Aqua-Terra (2014) indicates that chlorination has been the conventional method for disinfection as the cost of chlorine is relatively low. The use of chlorine does form organochlorine compounds therefore, dechlorination is required prior to discharge. In addition, if the BOD and TSS are not sufficiently reduced, the chlorine will react with the organic matter and a substantial portion of the chlorine is lost at a consider-able cost (Aqua-Terra, 2014). Ozone has also been used, but similar to chlorination, if the organic matter is not greatly reduced, then the ozone will react and be lost at considerable cost (Aqua-Terra, 2014).
| FISH PROCESSING FACILITIES COMPLIANCE AUDIT REPORT 2018: ENVIRONMENTAL MANAGEMENT AC T 36
BAR R IE R S TO BEST ACH IEVABLE
TECH N O LOGY (BAT)
Most of the permittees indicated during the inspections that the costs associated with increased treatment would be too great and many indicated that if additional treatment was required, they would likely have to shut down. The permittees also stated that access to trained labour to oversee and operate the facility or the access to infrastructure to run the facilities would limit their ability to add additional treatment works. Two facilities indicated they would not have the physical space to add any additional treatment works. At the same time, some permittees indicated that the inconsistences in the treatment works requirements issued by ENV, presented an unfair advantage to those facilities that did not have to account for the increased costs associated with additional treatment.
Preliminary screening is considered BAT for non-oily effluent and where offal disposal costs are low, whereas belt filters were BAT when disposal costs are high (WorleyParsons, 2011). The costs for screening and belt filters are $0.09 and $0.27/kg of TSS removed, respectively (WorleyParsons, 2011). Using the typical mean TSS loading rate as displayed in Table 3, the mean costs for screening are $1.15 per tonne of fish processed and for belt filters is $3.46 per tonne of fish processed.
DAF was reported to be BAT under primary treatment for both oily and non-oily effluent and costs $0.79 to $0.94/kg of TSS removed (WorleyParsons, 2011). These costs include preliminary screening. Using mean TSS loading rate, the mean costs for DAF are between $10.11 and $12.03 per tonne of fish processed. DAF is also effective at removing oil and grease prior to secondary treatment. Two of the 30 authorized fish processing facilities currently use either a clarifier or DAF.
Secondary treatment for the reduction of soluble BOD is considered only suitable for facilities that operate continuously for more than six months per year due to the amount of start-up, optimization and decommissioning time (WorleyParsons, 2011). Moving-bed bioreactors are considered the BAT (WorleyParsons, 2011). The costs of secondary treatment when combined with screening and clarification were $1.00 to $1.60/kg of soluble BOD reduced or $1.25 to $2.50/kg of TSS removed (WorleyParsons, 2011). Using the typical mean BOD and TSS loading rates as displayed in Table 3, the cost of secondary treatment is between $17.10 and $27.36 per tonne of fish processed for BOD removal and between $16.00 and $32.00 per tonne of fish processed for TSS removal. These costs are consider-ably higher than preliminary and primary treatment. None of the 30 facilities use any form of secondary treatment.
Disinfection is commonly adopted at facilities that process farmed salmon to control the spread of fish pathogens (WorleyParsons, 2011). Residual chlorine can be toxic to marine environments; therefore, UV is considered the BAT (WorleyParsons, 2011). Effluent treated with UV must first be treated through screening and DAF to reduce or remove solids. The disinfection costs of using UV are roughly $0.24/m3 of effluent disinfected or $1.00/kg of TSS removed (WorleyParsons, 2011). One facility currently uses UV for disinfection and another facility currently uses ozone.
FISH PROCESSING FACILITIES COMPLIANCE AUDIT REPORT 2018: ENVIRONMENTAL MANAGEMENT AC T | 37
6. A jurisdictional scan of seafood processing waste discharge legislation, standards and guidelines identified almost no requirements or environmental standards of effluent discharges.
7. A consultant’s review of the existing data and knowledge of piscine orthoreovirus (PRV) in BC determined that, researchers have been unable to demonstrate a causative relationship between PRV and Heart, Skeletal and Muscle Inflammation (HSMI) disease, testing for PRV does not indicate whether the virus is viable and without the ability to test for the live virus, it is unknown what the efficacy of wastewater disinfection is for PRV.
8. The fish processing facilities were In Compliance with 44 percent of their permit requirements and Out of Compliance with 22 percent of their permit requirements. Compliance was Not Determined for 10 percent of all requirements and Not Applicable for 24 percent of all requirements. The instances of non-compliance were due to:
a. Exceeding discharge rate;
b. Exceeding discharge quality;
c. Modifying authorized treatment works without approvals;
d. Failure to post outfall signage;
e. Failure to conduct outfall inspections;
f. Failure to conduct monitoring or sufficient monitoring of the discharge rate, discharge quality or receiving environment quality; and
g. Failure to submit required data or reports.
9. Effluent discharge samples were collected at eight fish processing facilities that were currently operating and discharging to the environment at the time of the inspectiosn. These included facilities that process farmed salmon, wild salmon and wild finfish and seafood as well as facilities that have treatment works that ranged from only fine screening to fine screening in combination with primary treatment and disinfection.
Conclusions and Recommendations
Based on the results of the audit following inspections of the 30 fish processing facilities and a review of effluent discharge quality samples, permit requirements, a jurisdictional scan and best achievable technology (BAT), it can be concluded that:
1. Eighteen of the 30 fish processing facilities are currently operating or plan to be operating in 2018, and are or will be discharging effluent to the environment.
2. Eight of these 18 facilities operate year round and the remaining 10 operate seasonally, generally between June and September.
3. The tonnage of farmed salmon processed repre-sents 67 percent of all fish processed at these 18 facilities operating in BC. All of the farmed salmon is being processed by five fish processing facilities.
4. Two of these facilities processing farmed salmon, process greater than 60 percent of all fish. One other facility, processing exclusively wild finfish, processes nearly 20 percent of all fish. The tonnage of fish processed by the remaining 15 facilities represents less than 20 percent of the total fish processed and less than 10 percent of the total farmed salmon processed.
5. The effluent discharges are also regulated by with Fisheries and Oceans Canada (DFO) and Environment and Climate Change Canada (ECCC) under the Fisheries Act, which prohibits causing serious harm to fish and the deposit of deleterious substances into waters frequented by fish. The effluent discharges are also regulated by the DFO and Canadian Food Inspection Agency (CFIA) co-led National Aquatic Animal Health Program, which prevents the transfer of pathogens and the DFO administered the Species at Risk Act. This Act currently lists in BC, chinook, coho and sockeye salmon as endangered, threatened or of special concern.

| FISH PROCESSING FACILITIES COMPLIANCE AUDIT REPORT 2018: ENVIRONMENTAL MANAGEMENT AC T 38
16. Many of the permittees indicated that the costs associated with additional treatment would be too much of a burden on their current budgets and would likely mean that in the event that they are required to add additional treatment, they would have to discontinue the operation of their facilities.
It is recommended that:
1. The existing permits be amended to include foundational environmental protection provisions such as:
a. Numerical values for effluent discharge quality, in particular BOD, COD, TSS and nutrients. ENV should engage with DFO and ECCC to ensure that these values consider existing legislation such as the Fisheries Act, to ensure that the effluent discharge quality limits do not cause serious harm to fish and the effluent would not be considered a deleterious substance;
b. Monitoring for effluent discharge quality and toxicity;
c. A well-designed receiving environment monitoring program; and
d. An interpretation of the receiving environment data and an assessment of the impact of the discharge on the environment.
2. The existing permits be amended to include consistent and verifiable requirements for all permits to the extent possible without limiting the site-specific nature of permitting. Wherever there is a limit or rate, there must be requirements to monitor and report. Wherever there is an authorized works, there must be requirements to maintain the works and to not bypass the works or modify the works without notifying ENV.
3. The amending of the existing permits should priori-tize facilities based on relative environmental risk, the existing treatment technologies, the tonnage of fish processed and the volume of effluent being discharged.
10. The effluent discharge quality and toxicity results indicate that typical undiluted fish processing facility effluent having passed through current treatment works is frequently acutely lethal to fish due to high levels of BOD, COD and TSS. Once released into the receiving environment effluent mixing and dilution occurs potentially reducing harmful concentrations of contaminants.
11. The requirements of the 30 EMA permits, which were assessed in this audit do not contain consistent wording or requirements. All permits contain a maximum discharge rate; however, only some permits set effluent discharge quality limits, have maintenance of works, bypass and process modification requirements, outfall posting and outfall inspection requirements, discharge rate, discharge quality and receiving environment quality monitoring and reporting requirements.
12. Most of the current permits do not contain foundational environmental protection provisions. Some inconsistencies are expected due to the site-specific nature of permitting; however, the permits frequently do not contain effluent discharge quality limits and monitoring and reporting requirements for discharge rate, discharge quality and receiving environment quality.
13. Most of the current permits authorize treatment works that utilize treatment guidelines developed in 1975 and are generally limited to fine screening.
14. Best achievable technology (BAT) for the sector includes: preliminary treatment (solids removal), primary treatment (suspended solids removal), and disinfection where required to control the spread of fish pathogens. The authorized treatment works of 24 of the 30 fish processing facilities is limited to preliminary treatment using fine screening. Two of the 30 permits require fine screening and also primary treatment and disinfection. These two facilities, process nearly 40 percent of all farmed salmon and 40 percent of all fish.
15. BAT for facilities operating continuously for more than six months of the year also includes secondary treatment (soluble BOD reduction). None of the 30 permits currently require secondary treatment.
FISH PROCESSING FACILITIES COMPLIANCE AUDIT REPORT 2018: ENVIRONMENTAL MANAGEMENT AC T | 39
4. The fish processing facilities develop and review their Standard Operational Procedures to reduce the volume and improve the quality of the effluent discharged to the environment.
5. The treatment capabilities of best achievable tech-nology (BAT) should be considered in determination of effluent discharge limits.
6. In the event that BAT is not possible to achieve effluent discharge quality limits, that the fish processing facilities consider alternatives for effluent disposal including connection to a municipal sewerage system, if possible.
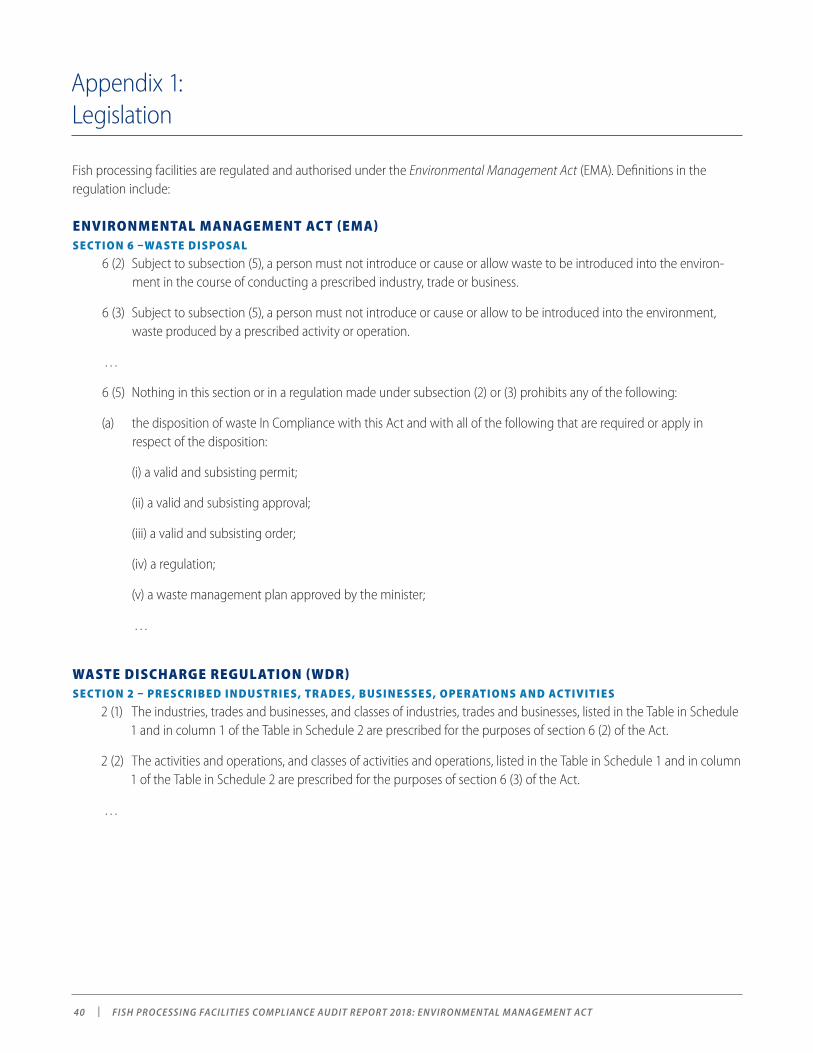
| FISH PROCESSING FACILITIES COMPLIANCE AUDIT REPORT 2018: ENVIRONMENTAL MANAGEMENT AC T 40
Appendix 1: Legislation
Fish processing facilities are regulated and authorised under the Environmental Management Act (EMA). Definitions in the regulation include:
ENVIRONMENTAL MANAGEMENT ACT (EMA)SEC TI ON 6 –WASTE DISPOSAL
6 (2) Subject to subsection (5), a person must not introduce or cause or allow waste to be introduced into the environ-ment in the course of conducting a prescribed industry, trade or business.
6 (3) Subject to subsection (5), a person must not introduce or cause or allow to be introduced into the environment, waste produced by a prescribed activity or operation.
…
6 (5) Nothing in this section or in a regulation made under subsection (2) or (3) prohibits any of the following:
(a) the disposition of waste In Compliance with this Act and with all of the following that are required or apply in respect of the disposition:
(i) a valid and subsisting permit;
(ii) a valid and subsisting approval;
(iii) a valid and subsisting order;
(iv) a regulation;
(v) a waste management plan approved by the minister;
…
WASTE DISCHARGE REGULATION (WDR)SEC TI ON 2 – PR ESCR IBE D IN DUSTR IES, TR AD ES, BUSIN ESSES, OPE R ATI ONS AN D AC TIVITIES
2 (1) The industries, trades and businesses, and classes of industries, trades and businesses, listed in the Table in Schedule 1 and in column 1 of the Table in Schedule 2 are prescribed for the purposes of section 6 (2) of the Act.
2 (2) The activities and operations, and classes of activities and operations, listed in the Table in Schedule 1 and in column 1 of the Table in Schedule 2 are prescribed for the purposes of section 6 (3) of the Act.
…
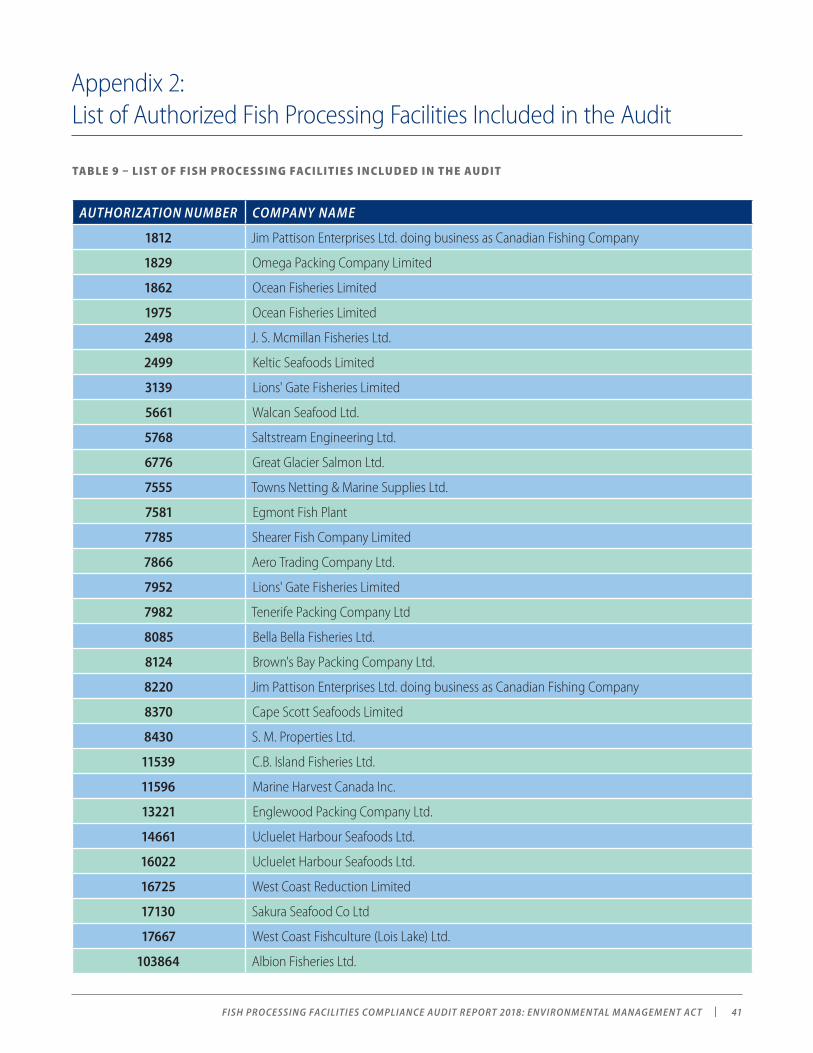
FISH PROCESSING FACILITIES COMPLIANCE AUDIT REPORT 2018: ENVIRONMENTAL MANAGEMENT AC T | 41
Appendix 2: List of Authorized Fish Processing Facilities Included in the Audit
TABLE 9 – LIST OF FISH PROCESSING FACILITIES INCLUD E D IN TH E AU DIT
AUTHORIZATION NUMBER COMPANY NAME
1812 Jim Pattison Enterprises Ltd. doing business as Canadian Fishing Company
1829 Omega Packing Company Limited
1862 Ocean Fisheries Limited
1975 Ocean Fisheries Limited
2498 J. S. Mcmillan Fisheries Ltd.
2499 Keltic Seafoods Limited
3139 Lions' Gate Fisheries Limited
5661 Walcan Seafood Ltd.
5768 Saltstream Engineering Ltd.
6776 Great Glacier Salmon Ltd.
7555 Towns Netting & Marine Supplies Ltd.
7581 Egmont Fish Plant
7785 Shearer Fish Company Limited
7866 Aero Trading Company Ltd.
7952 Lions' Gate Fisheries Limited
7982 Tenerife Packing Company Ltd
8085 Bella Bella Fisheries Ltd.
8124 Brown's Bay Packing Company Ltd.
8220 Jim Pattison Enterprises Ltd. doing business as Canadian Fishing Company
8370 Cape Scott Seafoods Limited
8430 S. M. Properties Ltd.
11539 C.B. Island Fisheries Ltd.
11596 Marine Harvest Canada Inc.
13221 Englewood Packing Company Ltd.
14661 Ucluelet Harbour Seafoods Ltd.
16022 Ucluelet Harbour Seafoods Ltd.
16725 West Coast Reduction Limited
17130 Sakura Seafood Co Ltd
17667 West Coast Fishculture (Lois Lake) Ltd.
103864 Albion Fisheries Ltd.
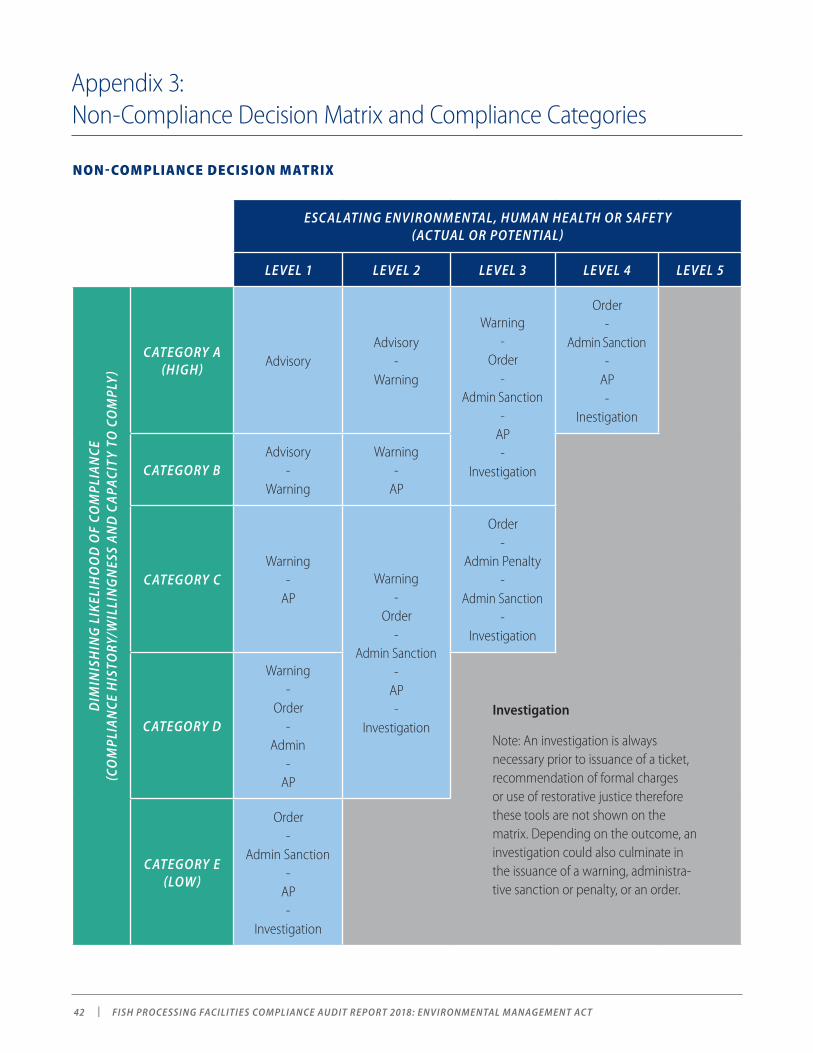
| FISH PROCESSING FACILITIES COMPLIANCE AUDIT REPORT 2018: ENVIRONMENTAL MANAGEMENT AC T 42
Appendix 3: Non-Compliance Decision Matrix and Compliance Categories
NON- COMPLIANCE DECISION MATRIX
ESCAL ATING ENVIRONMENTAL, HUMAN HEALTH OR SAFET Y (ACTUAL OR POTENTIAL)
LEVEL 1 LEVEL 2 LEVEL 3 LEVEL 4 LEVEL 5
CATEGORY A (HIGH)
AdvisoryAdvisory
-Warning
Warning-
Order-
Admin Sanction-
AP-
Investigation
Order-
Admin Sanction-
AP-
Inestigation
CATEGORY BAdvisory
-Warning
Warning-
AP
CATEGORY CWarning
- AP
Warning-
Order-
Admin Sanction-
AP-
Investigation
Order-
Admin Penalty-
Admin Sanction-
Investigation
CATEGORY D
Warning-
Order-
Admin-
AP
Investigation
Note: An investigation is always necessary prior to issuance of a ticket, recommendation of formal charges or use of restorative justice therefore these tools are not shown on the matrix. Depending on the outcome, an investigation could also culminate in the issuance of a warning, administra-tive sanction or penalty, or an order.
CATEGORY E (LOW)
Order-
Admin Sanction-
AP-
Investigation
DIM
INIS
HIN
G L
IKEL
IHO
OD
OF
COM
PLIA
NCE
(C
OM
PLIA
NCE
HIS
TORY
/WIL
LIN
GN
ESS
AN
D C
APA
CITY
TO
CO
MPL
Y)
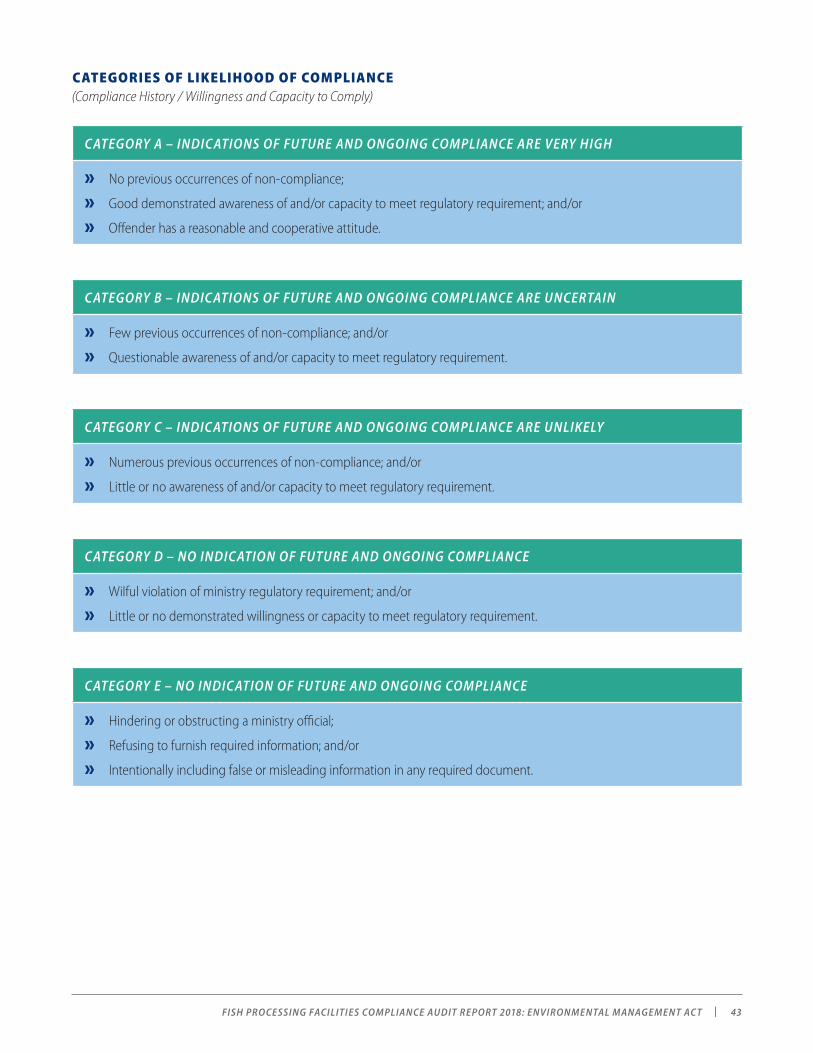
FISH PROCESSING FACILITIES COMPLIANCE AUDIT REPORT 2018: ENVIRONMENTAL MANAGEMENT AC T | 43
CATEGORIES OF LIKELIHOOD OF COMPLIANCE(Compliance History / Willingness and Capacity to Comply)
CATEGORY A – INDICATIONS OF FUTURE AND ONGOING COMPLIANCE ARE VERY HIGH
» No previous occurrences of non-compliance;
» Good demonstrated awareness of and/or capacity to meet regulatory requirement; and/or
» Offender has a reasonable and cooperative attitude.
CATEGORY B – INDICATIONS OF FUTURE AND ONGOING COMPLIANCE ARE UNCERTAIN
» Few previous occurrences of non-compliance; and/or
» Questionable awareness of and/or capacity to meet regulatory requirement.
CATEGORY C – INDICATIONS OF FUTURE AND ONGOING COMPLIANCE ARE UNLIKELY
» Numerous previous occurrences of non-compliance; and/or
» Little or no awareness of and/or capacity to meet regulatory requirement.
CATEGORY D – NO INDICATION OF FUTURE AND ONGOING COMPLIANCE
» Wilful violation of ministry regulatory requirement; and/or
» Little or no demonstrated willingness or capacity to meet regulatory requirement.
CATEGORY E – NO INDICATION OF FUTURE AND ONGOING COMPLIANCE
» Hindering or obstructing a ministry official;
» Refusing to furnish required information; and/or
» Intentionally including false or misleading information in any required document.
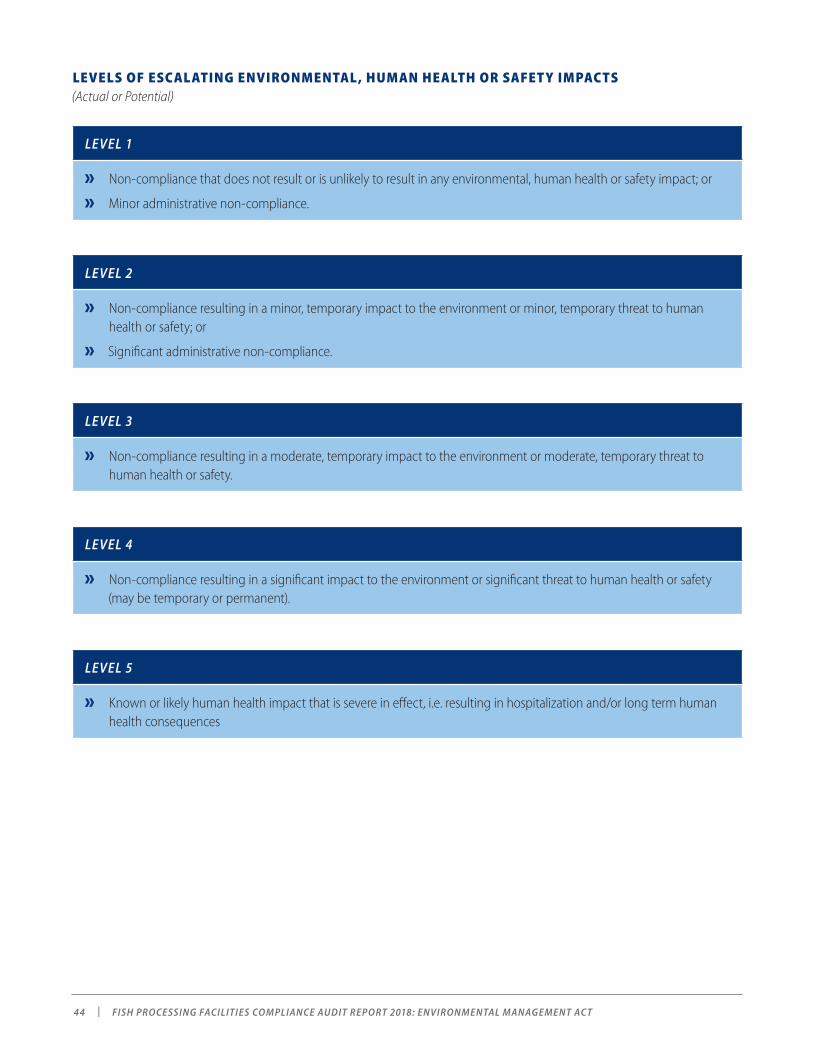
| FISH PROCESSING FACILITIES COMPLIANCE AUDIT REPORT 2018: ENVIRONMENTAL MANAGEMENT AC T 44
LEVELS OF ESCALATING ENVIRONMENTAL, HUMAN HEALTH OR SAFET Y IMPACTS(Actual or Potential)
LEVEL 1
» Non-compliance that does not result or is unlikely to result in any environmental, human health or safety impact; or
» Minor administrative non-compliance.
LEVEL 2
» Non-compliance resulting in a minor, temporary impact to the environment or minor, temporary threat to human health or safety; or
» Significant administrative non-compliance.
LEVEL 3
» Non-compliance resulting in a moderate, temporary impact to the environment or moderate, temporary threat to human health or safety.
LEVEL 4
» Non-compliance resulting in a significant impact to the environment or significant threat to human health or safety (may be temporary or permanent).
LEVEL 5
» Known or likely human health impact that is severe in effect, i.e. resulting in hospitalization and/or long term human health consequences
FISH PROCESSING FACILITIES COMPLIANCE AUDIT REPORT 2018: ENVIRONMENTAL MANAGEMENT AC T | 45
Appendix 4: References
» Aqua-Terra Consultants (Aqua-Terra). 2014. Best Practical and Available Technology Assessment, Marine Harvest Canada, Port Hardy, BC. Report dated December 2014.
» Campbell, Tavish. 2017. Blood Water: B.C.’s Dirty Salmon Farming Secret. https://vimeo.com/238445419 [Accessed March 19, 2018].
» Canadian Broadcasting Corporation (CBC). 2017. Blood Discharge Spewing i nto B.C. Ocean Infecting Salmon: Scientist. http://www.cbc.ca/radio/thecurrent/the-current-for-november-30-2017-1.4425138/blood-discharge-spewing-into- b-c-ocean-infecting-salmon-scientist-1.4425193 [Accessed March 19, 2018].
» Dhanak, M.R. and N.I. Xiros (Editors). 2016. Springer Handbook of Ocean Engineering. Springer International Publishing. 1345p.
» Environment and Climate Change Canada (ECCC). 1975. Fish Processing Operations Liquid Effluent Guidelines. Environmental Protection Service, Water Pollution Control Directorate. Report No. EPS 1-WP-75-1.
» Golder Associates Ltd. (Golder). 2011. Jurisdictional Scan, Seafood Processing Waste Management Legislation, Standards and Guidelines. Submitted to: Environmental Standards Branch, Environmental Protection Division, BC Ministry of Environment, dated January 31, 2011. Report Number: 10-1478-0028.
» Government of Canada (GC). 1985a. Fisheries Act. Royal Society of Canada c. F-14. Last amended on April 5, 2016.
» Government of Canada (GC). 1985b. Fish Inspection Act. Royal Society of Canada c. F-12. Last amended on December 12, 2005.
» Government of Canada (GC). 1990. Health of Animals Act. Society of Canada c. 21. Last amended on February 27, 2015.
» Government of Canada (GC). 2002. Species at Risk Act. Society of Canada c. 29. Last amended on February 2, 2018.
» Government of Canada (GC). 2012. Wastewater Systems Effluent Regulations. Society of Canada. SOR/2012-139.
» iMapBC. 2018. http://maps.gov.bc.ca/ess/sv/imapbc/ [Accessed on February 14, 2018].
» Ministry of Agriculture (AGRI). 2015. Fish and Seafood Act, SBC 2015, Chapter 14. Victoria, BC.
» Ministry of Agriculture (AGRI). 2016. Fish and Seafood Licensing Regulation. BC Reg. 261/2016. Victoria, BC.
» Ministry of Agriculture (AGRI). 2017a. Sector Snapshot 2016: B.C. Seafood. Ministry of Agriculture – Corporate Statistics & Research Unit. Victoria, BC.
» Ministry of Agriculture (AGRI). 2017b. British Columbia Seafood Industry, Year in Review 2015. Ministry of Agriculture – Corporate Statistics & Research Unit. Victoria, BC.
» Ministry of Environment and Climate Change Strategy (ENV). 1975. Pollution Control Objectives for Municipal Type Waste Discharges in British Columbia. Water Management Branch. Victoria, BC.
» Ministry of Environment and Climate Change Strategy (ENV). 2003. Environmental Management Act, SBC 2003, Chapter 53, including amendments up to BC Reg. 179/2016. Victoria, BC.
» Ministry of Environment and Climate Change Strategy (ENV). 2004. Waste Discharge Regulation. BC Reg. 320/2004. Victoria, BC.
| FISH PROCESSING FACILITIES COMPLIANCE AUDIT REPORT 2018: ENVIRONMENTAL MANAGEMENT AC T 46
» Ministry of Environment and Climate Change Strategy (ENV). 2012. Municipal Wastewater Regulation. BC Reg. 87/2012, including amendments up to BC Reg. 41/2016. Victoria, BC.
» Ministry of Environment and Climate Change Strategy (ENV). 2013. British Columbia Field Sampling Manual: 2013 - For Continuous Monitoring and the Collection of Air, Air-Emission, Water, Wastewater, Soil, Sediment, and Biological Samples. Victoria, BC.
» Ministry of Environment and Climate Change Strategy (ENV). 2014. Compliance and Enforcement Policy and Procedure Version 3. https://www2.gov.bc.ca/assets/gov/environment/research-monitoring-and-reporting/reporting/ reporting-documents/environmental-enforcement-docs/ce_policy_and_procedure_2018.pdf
» Ministry of Environment and Climate Change Strategy (ENV). 2015. Best Achievable Technology, Fact Sheet Waste Discharges. https://www2.gov.bc.ca/assets/gov/environment/waste-management/industrial-waste/ industrial-waste/pulp-paper-wood/best_achievable_control_tech.pdf [Accessed May 9, 2018].
» Novatec. 1994. Guide for Best management Practices for Process Water management at Fish Processing Plants in British Columbia. Vancouver, BC: Environment Canada.
» Novatec. 1995. Technical Guide for the Development of Pollution Prevention Plans for Fish Processing Operations in the Lower Fraser basin. North Vancouver: Environment Canada Fraser River Action Plan.
» Siah, A., J. Powell and A. Farrell. 2018. Piscine Orthoreovirus (PRV) in Processing Plant Wastewater: A Review of Risk Factors for Wild Pacific Salmon. Prepared for the BC Ministry of Environment and Climate Change Strategy. March 28, 2018. 51p.
» Tchobanoglous, George, Franklin L. Burton and H. David Stensel. 2003. Wastewater Engineering: Treatment and Reuse / Metcalf & Eddy, Inc. – 4th Edition. McGraw-Hill. New York, NY.
» Thériault, Marie-Hélène, Simon C. Courtenay, Kelly R. Munkittrick, and Alyre G. Chiasson. 2007. The Effect of Seafood Processing Plant Effluent on Sentinel Fish Species in Coastal Waters of the Southern Gulf of St. Lawrence, New Brunswick. Water Quality Research Journal. Volume 42, No. 3, pp. 172-183.
» Tomczak-Wandzel, Renata, Eilen Arctander Vik and Tomasz Wandzel. 2015. BAT in Fish Processing Industry, Nordic Perspective. Norden, Noric Council of Ministers. Copenhagen K.
» United States Environmental Protection Agency (USEPA). 1975. Development Document for Effluent Limitations Guidelines and New Source Performance Standards for the Fish Mean, Salmon, Bottom Fish, Clam, Oyster, Sardine, Scallop, Herring, and Abalone Segment of the Canned and Preserved Fish and Seafood Processing Industry. Wasting: Effluent Guidelines Division, Office of Water and Hazardous Materials.
» United States Government Publishing Office (GPO). 2018. Code of Federal Regulations (Annual Edition). https://www.ecfr.gov/cgi-bin/text-idx?gp=&SID=cd60633d98ff1a4395a41d6f9c7c70a3&mc=true&tpl=/ecfrbrowse/ Title40/40CIsubchapN.tpl [Accessed on April 10, 2018].
» WorleyParsons Canada (WorleyParsons). 2011. Review of Waste Treatement and Disposal Technologies and Options for the Fish Products Industry, British Columbia Ministry of Environment. Submitted to: British Columbia Ministry of Environment, dated April 13, 2011. Project Number: 09407.

FISH PROCESSING FACILITIES COMPLIANCE AUDIT REPORT 2018: ENVIRONMENTAL MANAGEMENT AC T | 47
FISH PROCESSING FACILITIES COMPLIANCE AUDIT REPORT: JUN E 2018
COPYRIGHT © 2018, PROVINCE OF BRITISH COLUMBIA . ALL RIGHTS RESERVED.
THIS MATERIAL IS OWNED BY THE GOVERNMENT OF BRITISH COLUMBIA AND PROTEC TED BY COPYRIGHT L AW. IT MAY NOT BE REPRODUCED OR REDISTRIBUTED WITHOUT THE PRIOR WRIT TEN PERMISSION OF THE PROVINCE OF BRITISH COLUMBIA .
WWW.GOV.BC.CA