Fish Passage Barrier Inventory, Assessment, and Prioritization, Mark ...
41
Fish passage barrier inventory, assessment, and prioritization Mark Fedora, [email protected] Matt Diebel, [email protected]
Transcript of Fish Passage Barrier Inventory, Assessment, and Prioritization, Mark ...

Fish passage barrier inventory, assessment, and prioritization
Mark Fedora, [email protected] Matt Diebel, [email protected]
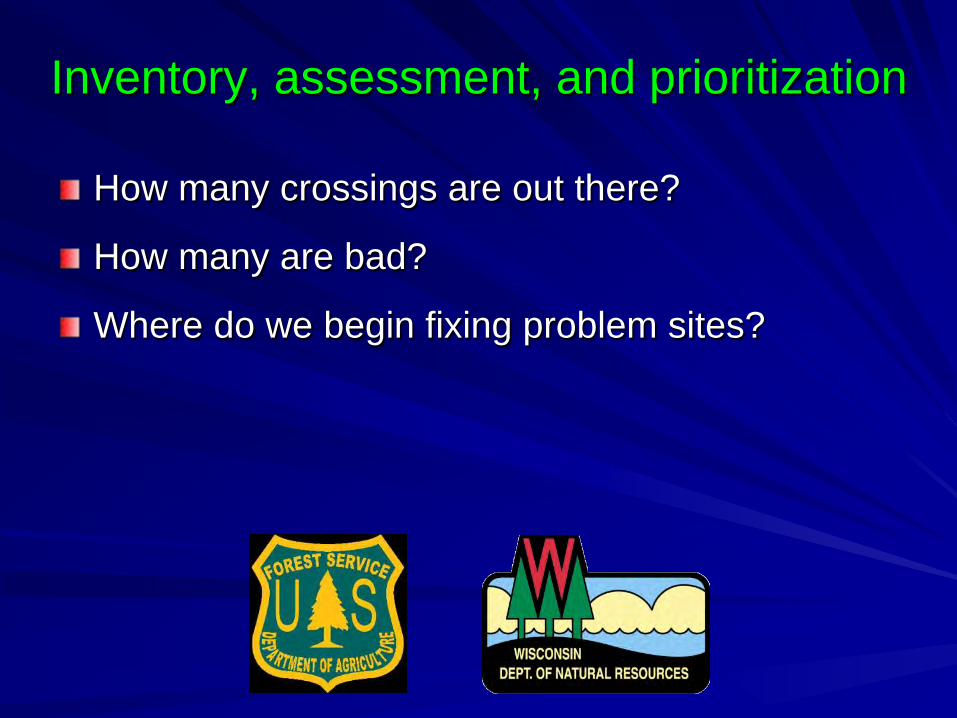
Inventory, assessment, and prioritization
How many crossings are out there?
How many are bad?
Where do we begin fixing problem sites?

How many road/stream crossings are out there?
(Velocity barrier)

Upper Menominee Watershed
649 Crossings!

A few cautions
Scale matters Some roads are not mapped Some streams are not streams Some roads are not roads Some crossings are not crossings Some crossings don’t show up

Zoom in to field sites
Looks good!

What crossing?
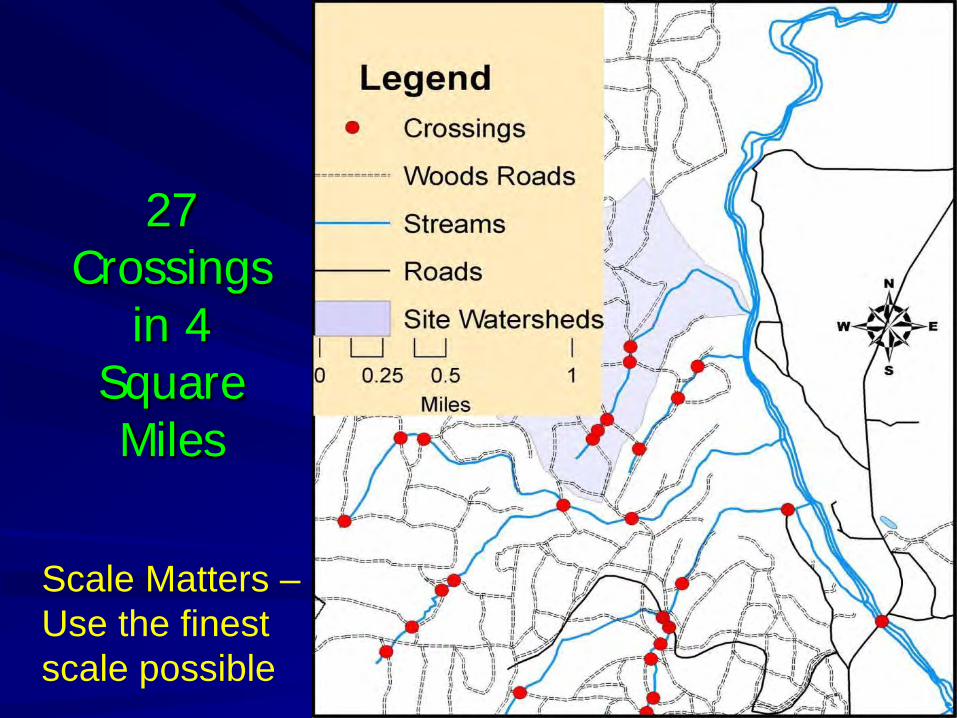
27
Crossings in 4
Square Miles
Scale Matters – Use the finest scale possible
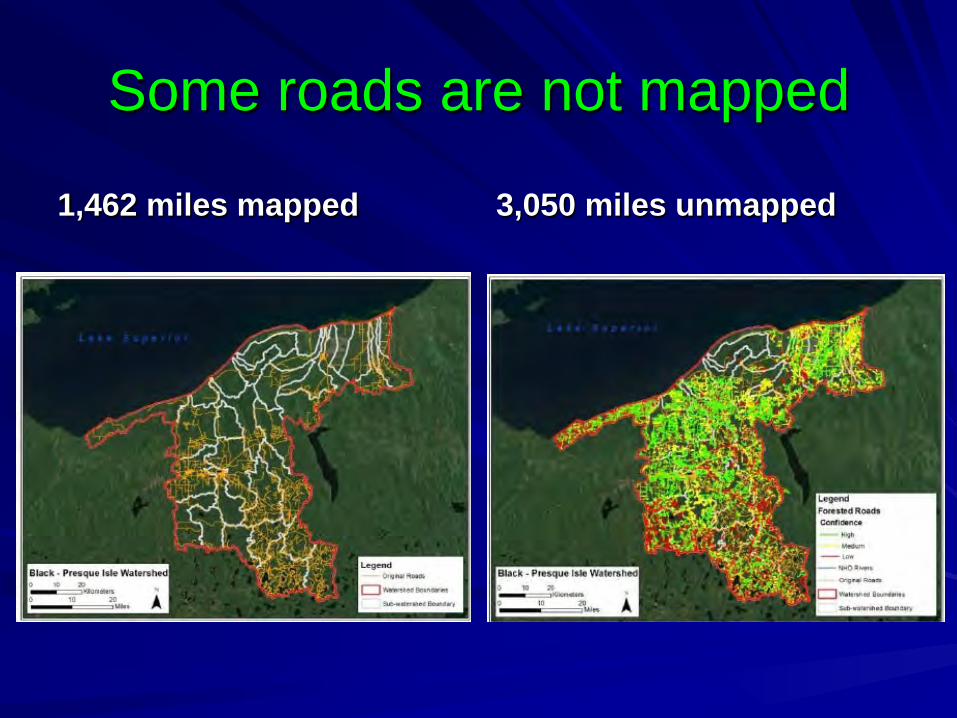
Some roads are not mapped
1,462 miles mapped 3,050 miles unmapped
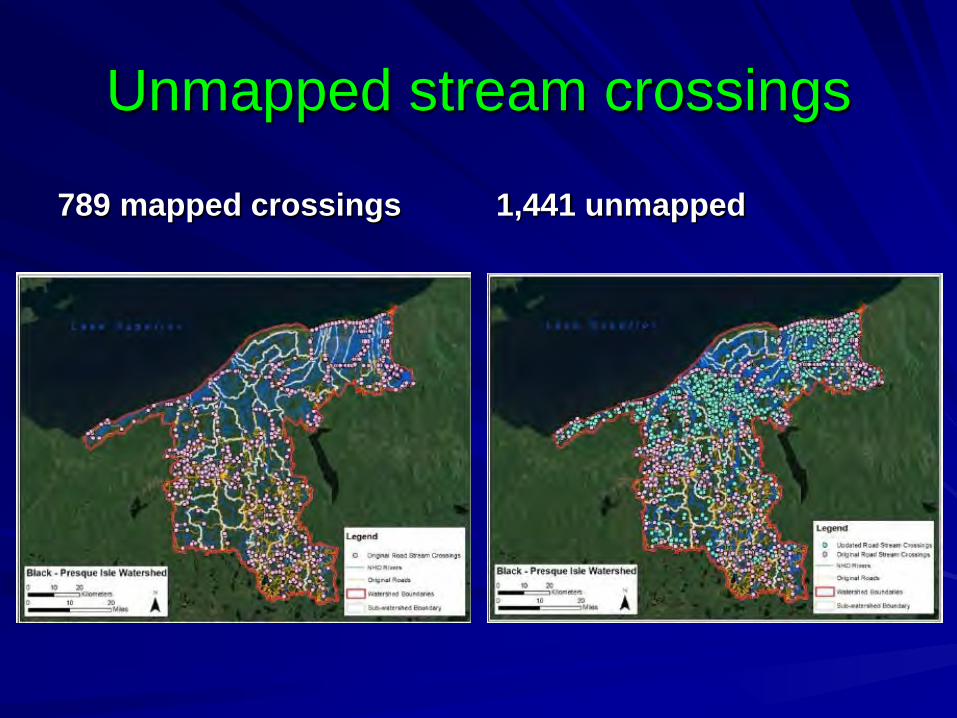
Unmapped stream crossings
789 mapped crossings 1,441 unmapped

Some crossings may not be crossings
False Positive Crossings?

There is a trout stream and culvert here.
A stream may not be mapped
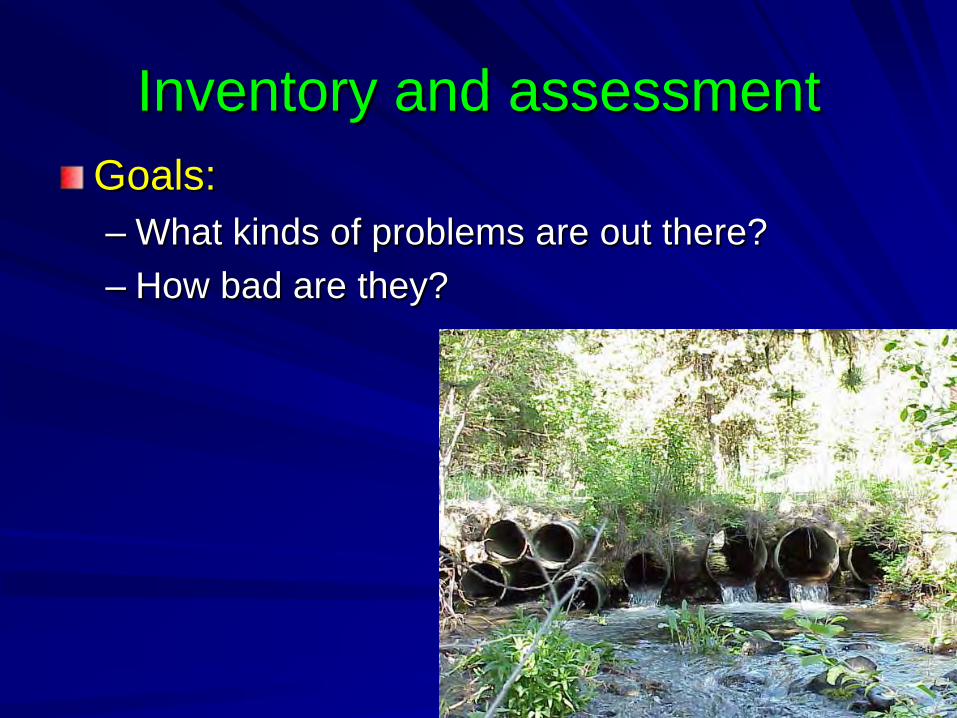
Inventory and assessment Goals: – What kinds of problems are out there? – How bad are they?

Two tier approach to inventory
Tier 1– Rapid assessment (volunteers) Tier 2 – More in-depth (more equipment and skills required)

Field equipment
Traffic cones & safety vest Clipboard & pencils Camera Maps Clinometer/hand level
GPS 100’ tape Waders Survey rod or tape measure Flashlight Flow velocity meter/ float and stopwatch
Communication plan, first aid kit, sunscreen, insect repellent, water, knowledge of safety hazards.

Data Collection

Data Collection
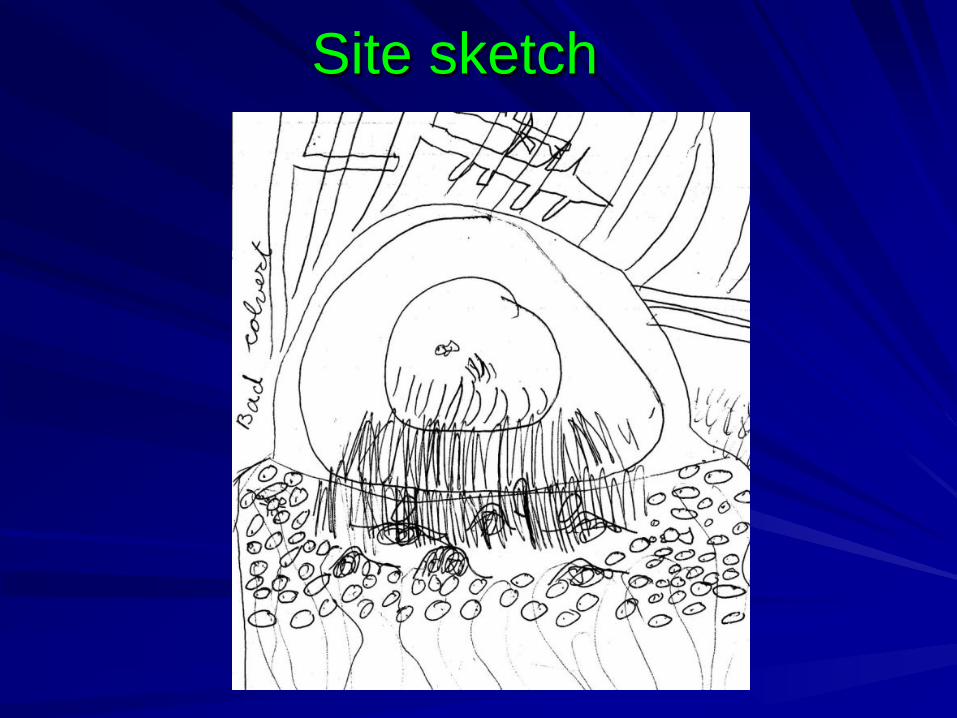
Site sketch

Database
Quick assessment metrics
Outlet drop Compare culvert geometry and hydraulics to natural channel – Water velocity – Water depth – Structure width
Substrate?

0.9
0.5 0
1
Estimating passability
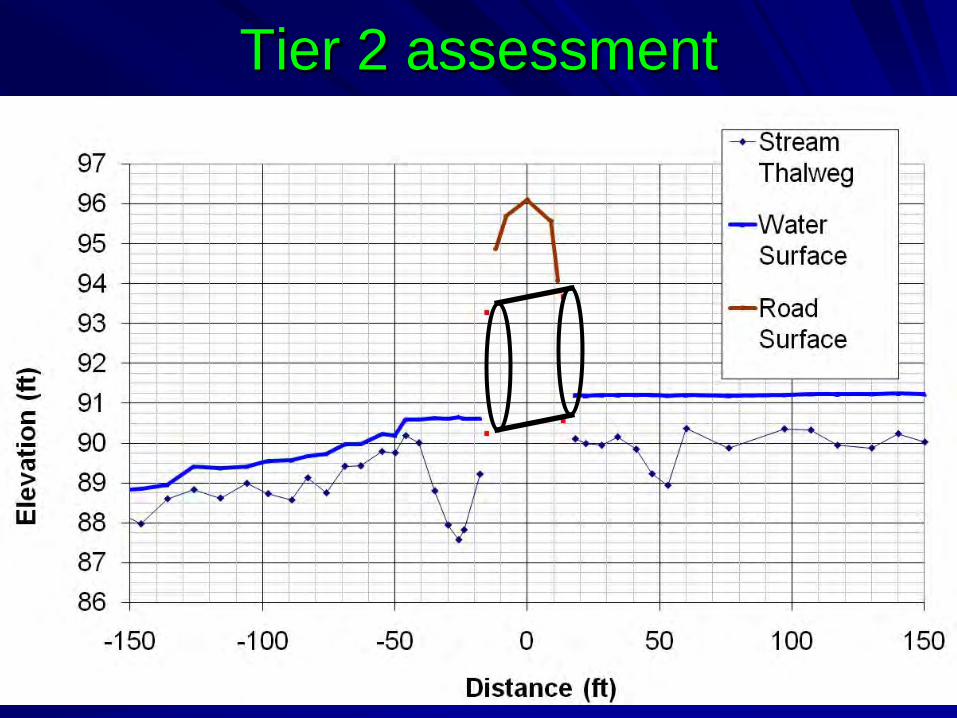
Tier 2 assessment
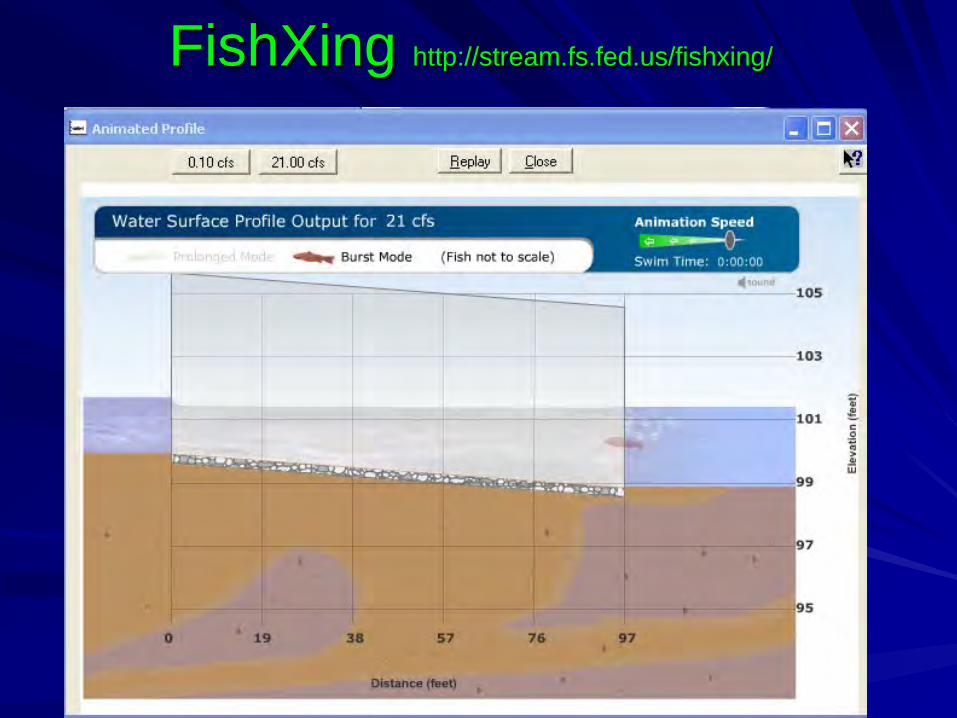
FishXing http://stream.fs.fed.us/fishxing/
Prioritization Screening tools – Passability model – LiDAR assessment
Selecting projects – Factors to consider – Tools
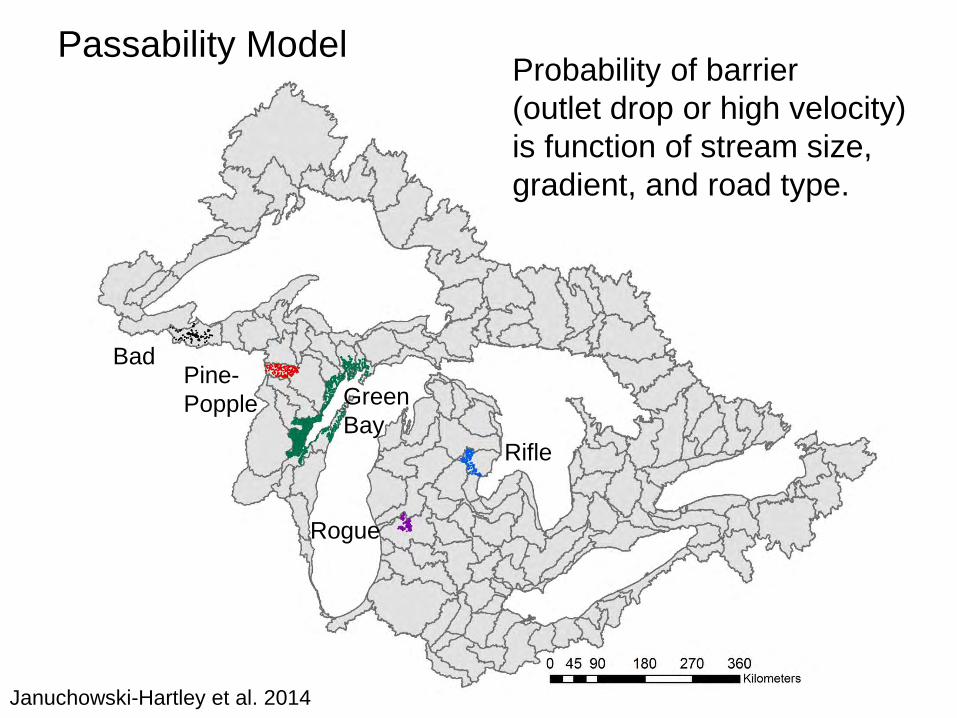
Passability Model Probability of barrier (outlet drop or high velocity) is function of stream size, gradient, and road type.
Januchowski-Hartley et al. 2014
Bad Pine-Popple Green
Bay Rifle
Rogue

Passability Model
Januchowski-Hartley et al. 2014
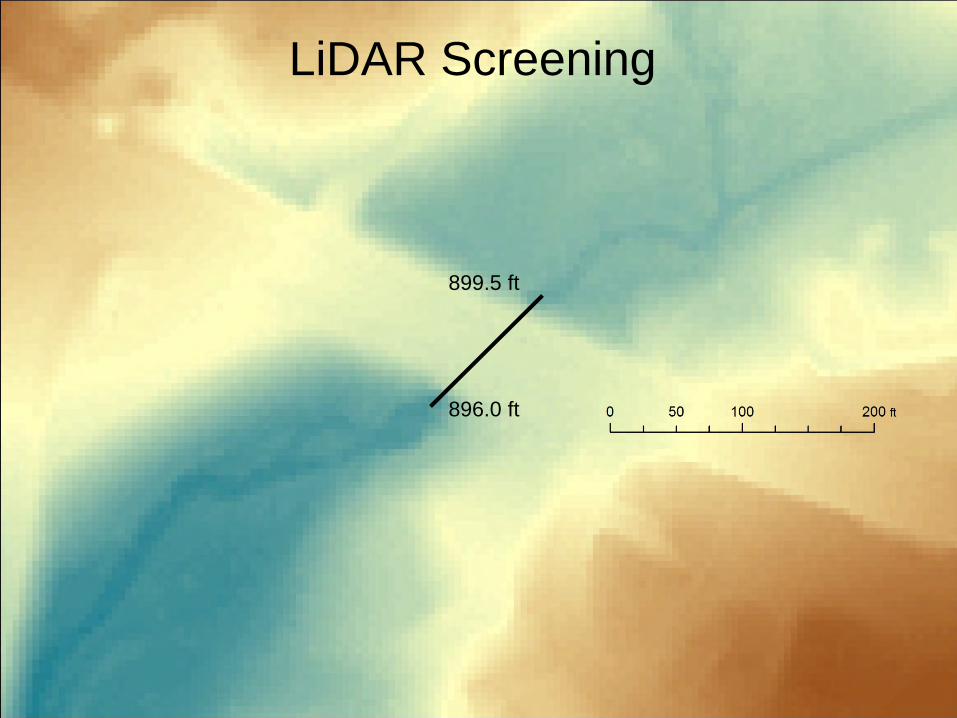
LiDAR Screening
899.5 ft
896.0 ft
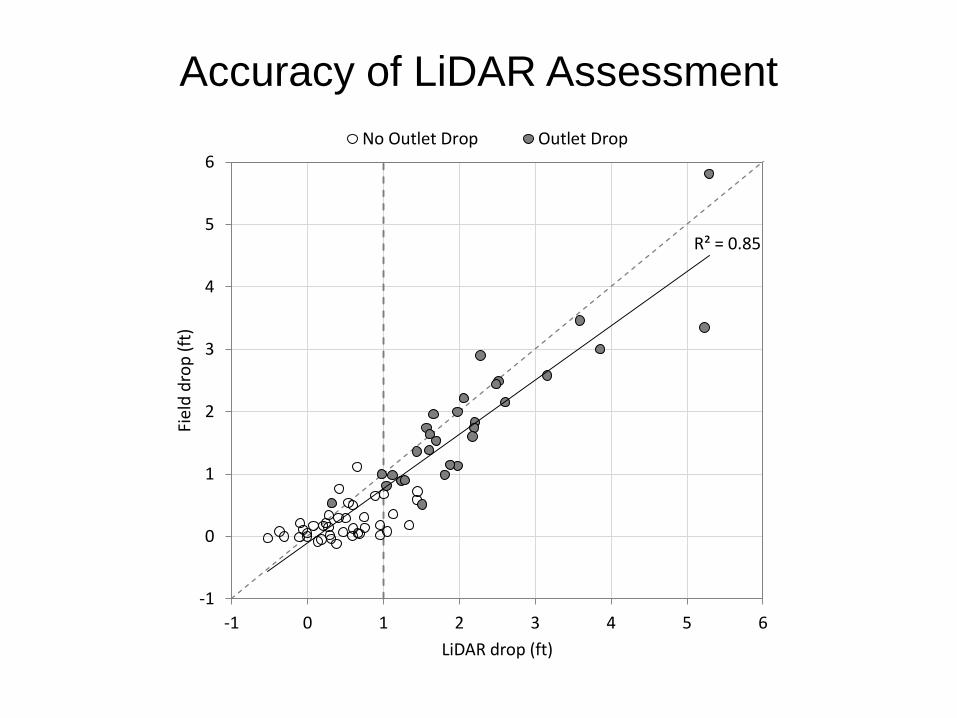
Accuracy of LiDAR Assessment
R² = 0.85
-1
0
1
2
3
4
5
6
-1 0 1 2 3 4 5 6
Fiel
d dr
op (f
t)
LiDAR drop (ft)
No Outlet Drop Outlet Drop

Inventory Status
All Road Crossings (19,420)
Culvert Digitized
49%
Bridge 15%
No Channel 27%
No Crossing 8%
DEM Problem
1% Ford 0.2%
Culvert Vertical Drop (8,760)
< 0.5 ft 42%
1 - 2 ft 20%
> 2 ft 21%
0.5 - 1 ft 17%


Comparison of Methods Criteria Fish Xing Field Surveys LiDAR Statistical
Model
Accu
racy
Passability Highest High Moderate-High Low-Moderate
Cost Highest High Moderate-High Low-Moderate
Speed 1 site/day 20 sites/day 200 sites/day Completed for
all RSX in GL Basin
Completeness Depends on methods used to identify crossings for field surveys Highest Moderate
Other
Estimate how passability
varies with flow
Identify defined channels / fish habitat Evaluate
landscape factors that
influence passability
Identify site-specific factors that influence replacement cost
Condition DEM for hydrography
development

Need for Prioritization
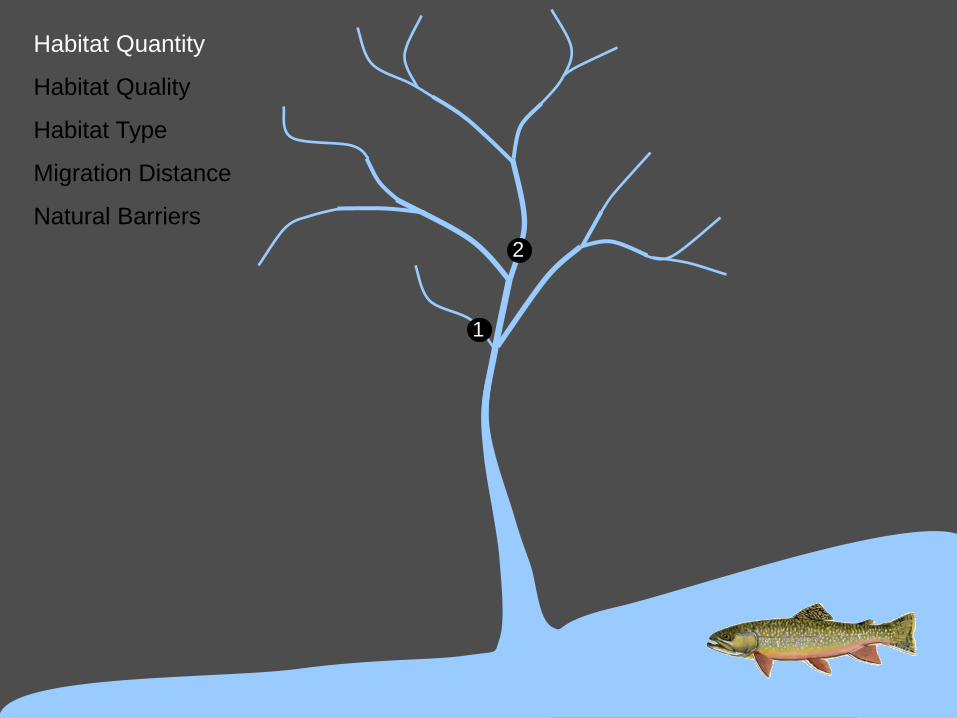
1
2
Habitat Quantity
Habitat Quality
Habitat Type
Migration Distance
Natural Barriers

1 2
Habitat Quantity
Habitat Quality
Habitat Type
Migration Distance
Natural Barriers
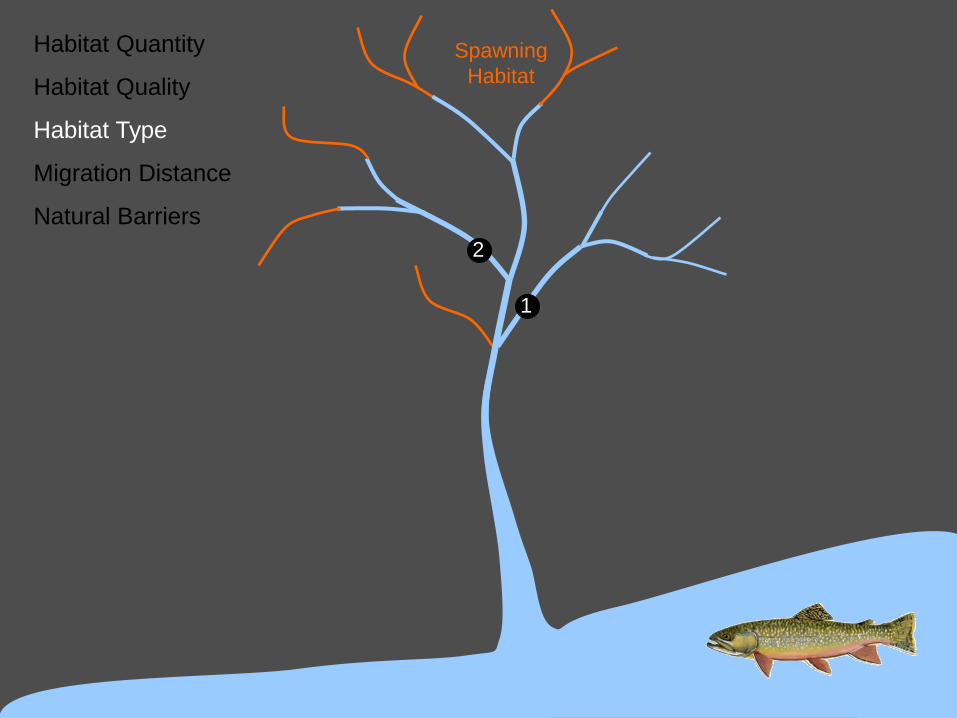
Spawning Habitat
Habitat Quantity
Habitat Quality
Habitat Type
Migration Distance
Natural Barriers
1
2
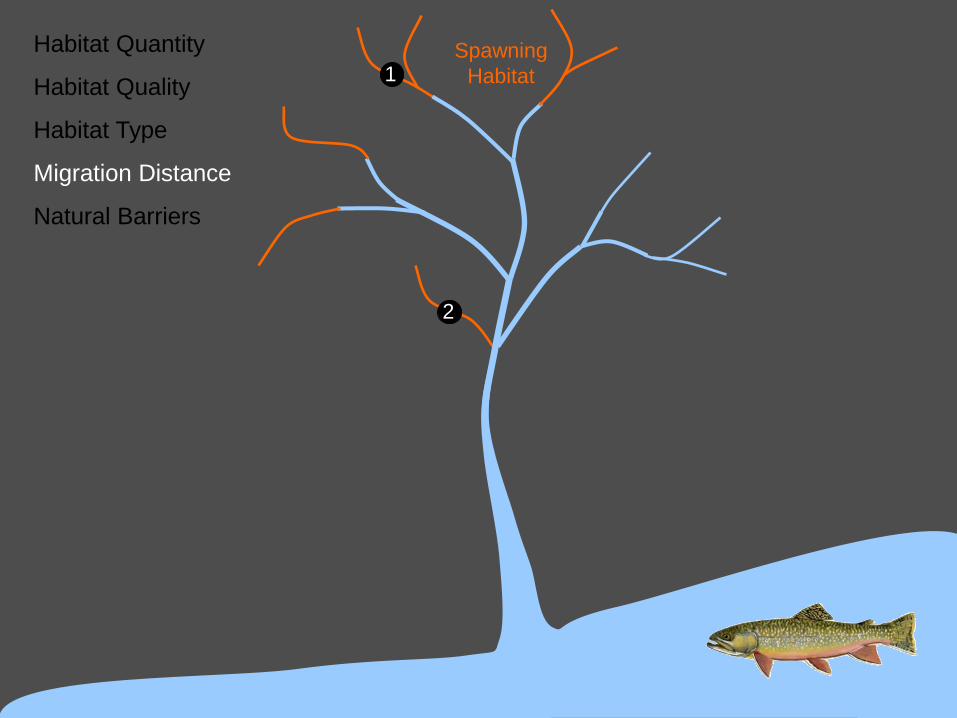
Spawning Habitat
Habitat Quantity
Habitat Quality
Habitat Type
Migration Distance
Natural Barriers
1
2

Spawning Habitat
Habitat Quantity
Habitat Quality
Habitat Type
Migration Distance
Natural Barriers 2 1
Waterfall
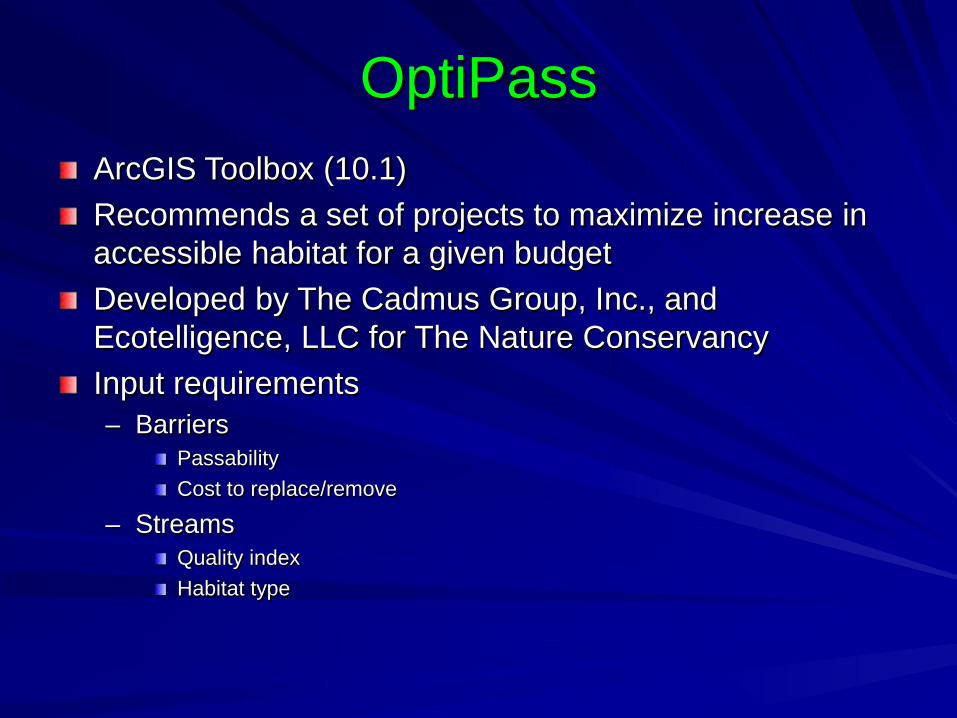
OptiPass ArcGIS Toolbox (10.1) Recommends a set of projects to maximize increase in accessible habitat for a given budget Developed by The Cadmus Group, Inc., and Ecotelligence, LLC for The Nature Conservancy Input requirements – Barriers
Passability Cost to replace/remove
– Streams Quality index Habitat type
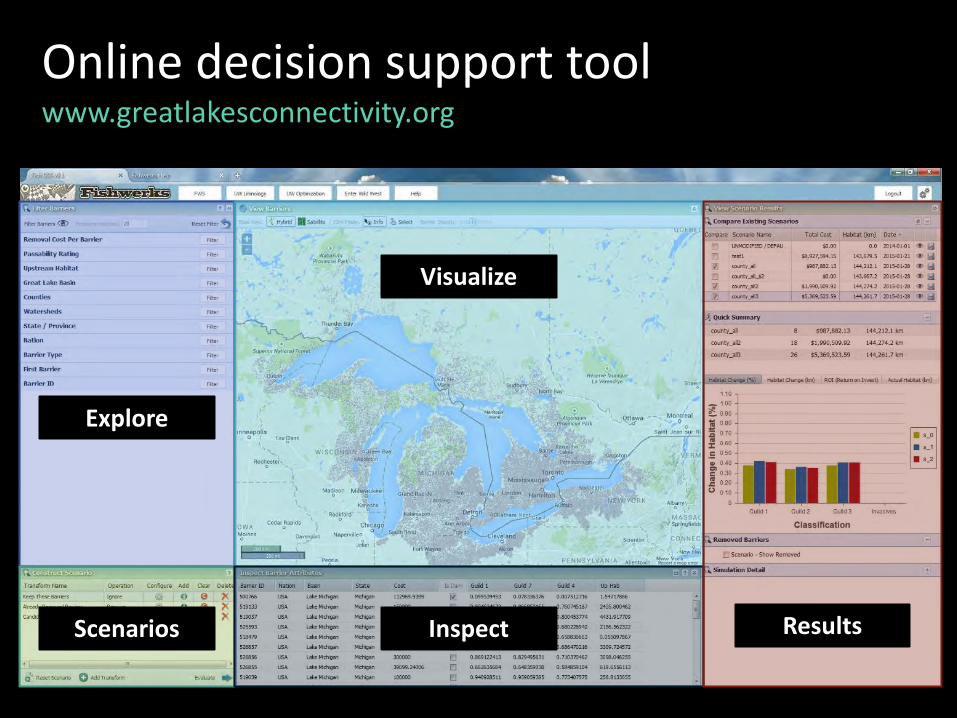
Online decision support tool www.greatlakesconnectivity.org
Explore
Inspect Scenarios
Visualize
Results

Summary How many crossings are out there? – Use GIS to get an estimate of road/stream
crossing numbers and locations How many are bad? – Simple inventories can be conducted quickly – More detailed assessments require surveying
skills Where do we begin? – Prioritization can identify where you can get
the most bang for the buck

© Harley Soltes (The Seattle Times)
Questions?