Fish Consumption Pattern and its Association with Household ...
7
International Journal of Science and Research (IJSR) ISSN (Online): 2319-7064 Index Copernicus Value (2013): 6.14 | Impact Factor (2013): 4.438 Volume 4 Issue 5, May 2015 www.ijsr.net Licensed Under Creative Commons Attribution CC BY Fish Consumption Pattern and its Association with Household Characteristics in Select Coastal and Non –Coastal Districts of Andhra Pradesh D. Madhavi 1 , D. L. Kusuma 2 1 Research Scholar, Department of Home Science, S. V. University, Tirupati, Andhra Pradesh, India 2 Professor, Department of Home Science, S. V. University, Tirupati, Andhra Pradesh, India Abstract: The purpose of this study was to explore the regional differences in the fish consumption pattern and its association with select household (Hh) characteristics, utilizing the survey data obtained from two districts of the state of Andhra Pradesh. The survey was carried out with representative samples from the non-coastal Tirupati and the coastal Nellore urban areas. The randomly selected non-vegetarian households representing each of the urban region was grouped according to religion, social status, occupational lifestyle and economic status. The sample consisted of 1200 respondents (700 Hhs from Tirupati and 500 Hhs from Nellore), who were responsible for food purchasing and cooking in the households. The fish consumption pattern was examined in terms of regional availability of fish, fish consumption habit, frequency and varieties of fish consumed. The results reveal that no significant association was observed between religion and fish consumption in Tirupati Hhs; whereas, a significant association (P<0.01) was evident for the Nellore Hhs. There was no significant association observed between social groups, occupational lifestyle and fish consumption when the data of both urban areas were assessed independently. A significant association (P<0.05) was observed between the family monthly income of the Hhs with respect to the fish consumption in Tirupati; no significant association was observed in the Nellore urban Hhs. The frequency and variety of fish consumption was high among Nellore urban Hhs when compared with Tirupati urban Hhs. Although a number of differences between households with respect to their fish consumption intake are uncovered, the findings suggest that fish consumption traditions and habits – accounts for large differences between the regions. Keywords: fish consumption, urban area, religion, social status, occupation, income. 1. Introduction Fish makes a vital contribution to the survival and health of a significant portion of the world’s population. Fish and seafood products were recommended to take a prominent position in the human diet due to their beneficial role in the prevention of chronic degenerative diseases, more so in the context of the CVDs. Further, role of fish towards reducing poverty and hunger is well recognized. Fish consumption depends on many factors such as increasing population along with sufficient supply of fish and fish products, demand, income, education level, consumer preference and fish prices. During 1980 to 2000, the per capita consumption of milk increased from 43 kg to 63 kg, of fish from 3.5 kg to 5.8 kg, and of meat and poultry from 5 kg to 6.8 kg (Paroda and Kumar, 2000). The consumption of fish has grown faster than that of any other animal product. Disparities in the fish consumption pattern exist widely across the income groups, location of the Hhs (rural, urban, costal, etc.), and regions (Kumar and Dey, 2004). The fish production and consumption in India is characterized by a large number of species coming from marine and inland sources. Each species varies with its commercial value which is governed by the catch and production pattern, consumer’s taste and preference. Production requirements, consumer’s preference and demand elasticity may vary across sources of fish and its species (Kumar and Dey, 2004). In this backdrop the present study was undertaken focusing on the regional fish consumption pattern among the coastal Nellore and non- coastal Tirupati urban regions. Further, the association existing between fish consumption pattern and select household characteristics was also discussed. 2. Materials and Methods The present study involves the urban communities from two districts of the state of Andhra Pradesh, India. The two districts were purposively chosen representing coastal and non-coastal districts. Tirupati urban of non-coastal Chittoor district and Nellore urban of coastal Sri Potti Sri Ramulu Nellore district were chosen to focus on the fish consumption pattern. A preliminary survey was undertaken to obtain the first hand information on general and socio-economic backgrounds of households (Hhs) within the city limits excluding the newly expanding suburban areas. The study area was visited many times to identify and enlist the non-vegetarian households belonging to different income groups in each area. On the basis of income the households were categorized into Low Income Group (LIG), Middle Income Group (MIG), and Higher Income Group (HIG)). From each income group statistically appropriate number of households was randomly chosen. Thus, 700 Hhs from Tirupati urban and 500 Hhs Nellore urban formed the sample of the study. A house-to- house survey was conducted using a survey schedule including the items on general information, food habits and specific items pertaining to fish consumption and practices. Paper ID: SUB154704 2472
-
Upload
nguyenduong -
Category
Documents
-
view
216 -
download
1
Transcript of Fish Consumption Pattern and its Association with Household ...

International Journal of Science and Research (IJSR) ISSN (Online): 2319-7064
Index Copernicus Value (2013): 6.14 | Impact Factor (2013): 4.438
Volume 4 Issue 5, May 2015
www.ijsr.net Licensed Under Creative Commons Attribution CC BY
Fish Consumption Pattern and its Association with
Household Characteristics in Select Coastal and
Non –Coastal Districts of Andhra Pradesh
D. Madhavi1, D. L. Kusuma
2
1Research Scholar, Department of Home Science, S. V. University, Tirupati, Andhra Pradesh, India
2Professor, Department of Home Science, S. V. University, Tirupati, Andhra Pradesh, India
Abstract: The purpose of this study was to explore the regional differences in the fish consumption pattern and its association with
select household (Hh) characteristics, utilizing the survey data obtained from two districts of the state of Andhra Pradesh. The survey
was carried out with representative samples from the non-coastal Tirupati and the coastal Nellore urban areas. The randomly selected
non-vegetarian households representing each of the urban region was grouped according to religion, social status, occupational lifestyle
and economic status. The sample consisted of 1200 respondents (700 Hhs from Tirupati and 500 Hhs from Nellore), who were
responsible for food purchasing and cooking in the households. The fish consumption pattern was examined in terms of regional
availability of fish, fish consumption habit, frequency and varieties of fish consumed. The results reveal that no significant association
was observed between religion and fish consumption in Tirupati Hhs; whereas, a significant association (P<0.01) was evident for the
Nellore Hhs. There was no significant association observed between social groups, occupational lifestyle and fish consumption when the
data of both urban areas were assessed independently. A significant association (P<0.05) was observed between the family monthly
income of the Hhs with respect to the fish consumption in Tirupati; no significant association was observed in the Nellore urban Hhs.
The frequency and variety of fish consumption was high among Nellore urban Hhs when compared with Tirupati urban Hhs. Although
a number of differences between households with respect to their fish consumption intake are uncovered, the findings suggest that fish
consumption traditions and habits – accounts for large differences between the regions.
Keywords: fish consumption, urban area, religion, social status, occupation, income.
1. Introduction
Fish makes a vital contribution to the survival and health of
a significant portion of the world’s population. Fish and
seafood products were recommended to take a prominent
position in the human diet due to their beneficial role in the
prevention of chronic degenerative diseases, more so in the
context of the CVDs. Further, role of fish towards reducing
poverty and hunger is well recognized.
Fish consumption depends on many factors such as
increasing population along with sufficient supply of fish
and fish products, demand, income, education level,
consumer preference and fish prices.
During 1980 to 2000, the per capita consumption of milk
increased from 43 kg to 63 kg, of fish from 3.5 kg to 5.8 kg,
and of meat and poultry from 5 kg to 6.8 kg (Paroda and
Kumar, 2000). The consumption of fish has grown faster
than that of any other animal product. Disparities in the fish
consumption pattern exist widely across the income groups,
location of the Hhs (rural, urban, costal, etc.), and regions
(Kumar and Dey, 2004). The fish production and
consumption in India is characterized by a large number of
species coming from marine and inland sources. Each
species varies with its commercial value which is governed
by the catch and production pattern, consumer’s taste and
preference. Production requirements, consumer’s preference
and demand elasticity may vary across sources of fish and its
species (Kumar and Dey, 2004).
In this backdrop the present study was undertaken focusing
on the regional fish consumption pattern among the coastal
Nellore and non- coastal Tirupati urban regions. Further, the
association existing between fish consumption pattern and
select household characteristics was also discussed.
2. Materials and Methods
The present study involves the urban communities from two
districts of the state of Andhra Pradesh, India. The two
districts were purposively chosen representing coastal and
non-coastal districts. Tirupati urban of non-coastal Chittoor
district and Nellore urban of coastal Sri Potti Sri Ramulu
Nellore district were chosen to focus on the fish
consumption pattern.
A preliminary survey was undertaken to obtain the first hand
information on general and socio-economic backgrounds of
households (Hhs) within the city limits excluding the newly
expanding suburban areas. The study area was visited many
times to identify and enlist the non-vegetarian households
belonging to different income groups in each area. On the
basis of income the households were categorized into Low
Income Group (LIG), Middle Income Group (MIG), and
Higher Income Group (HIG)). From each income group
statistically appropriate number of households was randomly
chosen. Thus, 700 Hhs from Tirupati urban and 500 Hhs
Nellore urban formed the sample of the study. A house-to-
house survey was conducted using a survey schedule
including the items on general information, food habits and
specific items pertaining to fish consumption and practices.
Paper ID: SUB154704 2472

International Journal of Science and Research (IJSR) ISSN (Online): 2319-7064
Index Copernicus Value (2013): 6.14 | Impact Factor (2013): 4.438
Volume 4 Issue 5, May 2015
www.ijsr.net Licensed Under Creative Commons Attribution CC BY
3. Statistical Analysis
All the collected data were tabulated and subjected to
descriptive analyses using the computer software SPSS
(Statistical Package for Social Sciences, version 20.00) and
Microsoft Office Excel 2007 to understand the differences
between the variables. Throughout the report an attempt has
been made to include data which clearly demonstrates
significant trends, associations and differences.
4. Results
The sample Hhs were classified as fish consumers and non-
consumers and further subdivided based on the chosen
familial characteristic and the results obtained were
presented and discussed.
Religion vs Fish consumption:
The data presented in table no.1 reveal that Hindus were the
dominant religious group in both the urban areas Tirupati
and Nellore with 91.4 and 79.6 per cent respectively. This
was followed by 6.6 and 15.2 per cent belonging to Muslim
community in Tirupati and Nellore respectively. The
proportion of Christian Hhs was the least in both urban areas
with a per cent distribution as 2.0 and 5.2 respectively. Fish
consumption was observed that 20.6 per cent among Hindus,
10.9 per cent of Muslims and 14.3 per cent of Christians
were non fish consumers.
Table 1: Distribution of households as per religion and fish consumption
Religion
Tirupati Urban Hhs Nellore Urban Hhs
Total Hhs Per
cent (no)
Fish
consumers
Non fish
consumers
Total Hhs
Per cent (no)
Fish
consumers
Non fish
consumers
Percent (no) Percent (no) Percent (no) Percent (no)
Hindu 91.4
(640)
79.4
(508)
20.6
(132)
79.6
(398)
85.9
(342)
14.1
(56)
Muslim 6.6
(46)
89.1
(41)
10.9
(5)
15.2
(76)
100.0
(76)
0.0
(0)
Christian 2.0
(14)
85.7
(12)
14.3
(2)
5.2
(26)
92.3
(24)
7.7
(2)
Total Hhs 100
(700)
80.1
(561)
19.9
(139)
100
(500)
88.4
(442)
11.6
(58)
X2 –value 2.845 NS 12.72** ** Significant at p<0.01 * Significant at p<0.05
NS Not Significant
The data on religion as related to fish consumption reveal
that among Tirupati urban Hhs a higher percentage (89.1) of
Muslims consume fish when compared to either Hindus
(79.4) or Christians (85.4). In Nellore urban Hhs a similar
trend was observed. While, 100 per cent of Muslim Hhs
consumed fish, 95.9 per cent of Christians and 85.9 per cent
of Hindus consume fish. It was observed that 14.1 per cent
among Hindus, and 7.7 per cent of Christians were non fish
consumers. The results reveal that no significant association
was observed between Religion and fish consumption in
Tirupati Hhs; whereas, a significant association (P<0.01)
was evident for the Nellore Hhs.
Social status vs. Fish consumption:
The data presented in table no.2 reveal that BC’s are the
dominant social group (54.4 per cent) in Tirupati urban Hhs,
followed by the other social groups of OC, SC and ST with
32.3, 8.2 and 5.1 per cent respectively. In Nellore urban Hhs
the dominant social group was OC’s (75.8 per cent)
followed by BC, SC and ST with 15.4, 6.0 and 2.8 per cent
respectively. It was observed that among the Hhs of SC, BC,
ST and OC’s non fish consumers were 24.6, 20.5, 19.1 and
19.0 per cent respectively.
Table 2: Distribution of households as per social groups and fish consumption
Social
groups
Tirupati Urban Hhs Nellore Urban Hhs
Total Hhs
Per cent
(no)
Fish
consumers
Non fish
consumers
Total
Hhs Per
cent (no)
Fish
consumers
Non fish
consumers
Per cent (no) Per cent(no) Per cent (no) Per cent (no)
OC 32.3
(226)
81.0
(183)
19.0
(43)
75.8
(379)
87.9
(333)
12.1
(46)
BC 54.4
(381)
79.5
(303)
20.5
(78)
15.4
(77)
88.3
(68)
11.7
(9)
SC 8.2
(57)
75.4
(43)
24.6
(14)
6.0
(30)
90.0
(27)
10.0
(3)
ST 5.1
(36)
88.9
(32)
19.1
(4)
2.8
(14)
100.0
(14)
0.0
(0)
Total Hhs 100
(700)
80.1
(561)
19.9
(139)
100
(500)
88.4
(442)
11.6
(58)
X2 –value 2.712NS 2.019NS
** Significant at p<0.01
* Significant at p<0.05
NS Not Significant
Paper ID: SUB154704 2473
International Journal of Science and Research (IJSR) ISSN (Online): 2319-7064
Index Copernicus Value (2013): 6.14 | Impact Factor (2013): 4.438
Volume 4 Issue 5, May 2015
www.ijsr.net Licensed Under Creative Commons Attribution CC BY
The data related to social group revealed that fish
consumption was high among ST’s in both the urban areas,
Tirupati and Nellore with 88.9 and 100 per cent respectively.
This was followed by 81.0 and 75.8 per cent of consumption
of fish by OC group, 79.5 and 88.3 per cent in BC group and
75.4 and 90.0 per cent of SC in Tirupati and Nellore areas
respectively. The non fish consumers among the Hhs of OC,
BC, and SC’s were 12.1, 11.7 and 10.0 per cent respectively.
There was no significant association observed between
social groups and fish consumption when the data of both
urban areas were assessed independently.
Occupational Lifestyle vs Fish consumption:
The life style of head of the Hhs was assessed from
occupation and calculation of physical activity ratio (PAR).
The data presented in table no.3 reveal that in both the urban
areas the sedentary lifestyles were predominant among the
head of the Hhs with 66.6 per cent and 61.4 per cent
respectively in Tirupati and Nellore urban Hhs. This was
followed by 18.8 per cent and 25.0 per cent of respondents
respectively in Tirupati and Nellore belonging to moderate
work lifestyle. The proportion of heavy work group was the
least in both urban areas with a per cent distribution of 14.2
and 13.2 respectively. It was evident from the data that a
majority of respondents in the sedentary (81.3 per cent)
moderate (80.3 per cent) and heavy work (74.5 per cent)
groups were fish consumers. It was observed that the
remaining 25.5 per cent among heavy, 19.7 per cent of
moderate and 18.7 per cent of sedentary work groups were
not consuming fish.
Table 3: Distribution of households as per lifestyle of head of the family and fish consumption Occupati-
onal
lifestyle
Tirupati Urban Hhs Nellore Urban Hhs
Total Hhs
Per cent
(no)
Fish
consumers
Non fish
consumers
Total Hhs
Per cent
(no)
Fish
consumers
Non fish
consumers
Per cent (no) Per cent (no) Per cent (no) Per cent (no)
Sedentary 66.6
(466)
81.3
(379)
18.7
(87)
61.4
(307)
86.6
(266)
13.4
(41)
Moderate 18.8
(132)
80.3
(106)
19.7
(26)
25.0
(125)
89.6
(112)
10.4
(13)
Heavy 14.6
(102)
74.5
(76)
25.5
(26)
13.6
(68)
94.1
(64)
5.9
(4)
Total Hhs 100
(700)
80.1
(561)
19.9
(139)
100
(500)
88.4
(442)
11.6
(58)
X2 –value 2.449 NS 3.266 NS
** Significant at p<0.01 * Significant at p<0.05
NS Not Significant
In Nellore urban Hhs higher percentage (94.1) of heavy
work group were consuming fish when compared to either
sedentary (86.6) or moderate work (89.6) groups. It was
observed that 13.4 per cent among sedentary work, 10.4 per
cent of moderate work and 5.9 per cent of heavy work
groups were not consuming fish. No significant association
was evident between lifestyle and fish consumption in
Tirupati, Nellore urban areas.
Monthly Income vs Fish consumption:
The data presented in table no.4 reveal that middle income
group (MIG) with a monthly income of Rs. 8000 to 20000/-
is the dominant group in both the urban areas with 37.4 and
48.0 per cent Hhs in Tirupati and Nellore respectively. This
was followed by 26.6 and 35.2 per cent of low income (LIG)
(Rs. <8000/-), 36.0 and 16.8 per cent high income (HIG)
(Rs. >20,000/-) groups respectively among Tirupati and
Nellore urban Hhs.
Table 4: Distribution of households as per monthly income of the family and fish consumption Monthly income in Rs.
(Income Group)
Tirupati Urban Hhs Nellore Urban Hhs
Total Hhs Per
cent (no)
Fish consumers Non fish consumers Total Hhs Per
cent (no)
Fish consumers Non fish consumers
Per cent (no) Per cent no) Per cent (no) Per cent (no)
<8,000 (LIG) 26.6
(186)
78.5
(146)
21.5
(40)
35.2
(171)
90.3
(159)
9.7
(12)
8,000 to 20,000 (MIG) 37.4
(262)
76.3
(200)
23.7
(62)
48.0
(240)
88.8
(213)
11.2
(27)
>20,000 (HIG) 36.0
(252)
85.3
(215)
14.7
(37)
16.8
(84)
83.3
(70)
16.7
(14)
Total Hhs 100
(700)
80.1
(561)
19.9
(139)
100
(500)
88.4
(442)
11.6
(58)
X2 –value 6.943* 2.778 NS ** Significant at p<0.01
* Significant at p<0.05 NS Not Significant
The data on monthly income of the family as related to fish
consumption reveal that among Tirupati urban Hhs a higher
percentage (85.3) of HIG Hhs consume fish when compared
to either LIG (78.5) or MIG (76.3) Hhs. It is evident that the
Hhs not consuming fish range from about 15 to 23 per cent.
In Nellore urban area a higher percentage (90.3) of LIG Hhs
consume fish when compared to either MIG (88.8) or HIG
(83.3). It was observed that the Hhs not consuming fish
range from about 10 to 17 per cent. A significant association
Paper ID: SUB154704 2474

International Journal of Science and Research (IJSR) ISSN (Online): 2319-7064
Index Copernicus Value (2013): 6.14 | Impact Factor (2013): 4.438
Volume 4 Issue 5, May 2015
www.ijsr.net Licensed Under Creative Commons Attribution CC BY
(P<0.05) was observed between the family monthly income
of the Hhs with respect to the fish consumption in Tirupati;
no significant association was observed in the Nellore urban
Hhs.
Per Capita Income vs Fish consumption:
The data presented in table no.5 reveal that a high (41.4) per
cent of Hhs in Tirupati have per capita income of Rs>5,000
per month, followed by 32.0 per cent and 26.6 per cent of
Hhs with an income of Rs. 2,000 – 5,000/- per capita income
and <Rs. 2,000/- per capita income respectively.
Table 5: Distribution of households as per monthly per-capita income of the family and fish consumption Monthly per
capita income
in Rs.
Tirupati Urban Hhs Nellore Urban Hhs
Total Hhs Per
cent (no)
Fish
consumers
Non fish
consumers
Total Hhs Per
cent (no)
Fish
consumers
Non fish
consumers
Per cent(no) Per cent(no) Per cent (no) Per cent (no)
<2,000 26.6
(186)
78.5
(146)
21.5
(40)
30.6
(153)
90.8
(139)
9.2
(14)
2,000 to 5,000 32.0
(224)
80.8
(181)
19.2
(43)
38.6
(193)
87.6
(169)
12.4
(24)
>5,000 41.4
(290)
80.7
(234)
19.3
(56)
30.8
(154)
87.0
(134)
13.0
(20)
Total Hhs 100
(700)
80.1
(561)
19.9
(139)
100
(500)
88.4
(442)
11.6
(58)
X2 –value 0.433* 1.316 NS ** Significant at p<0.01 * Significant at p<0.05
NS Not Significant
In Nellore urban 38.6 per cent of Hhs have per capita
income of Rs. 2,000/- to 5,000/- followed by 30.8 and 30.6
per cent of Hhs having a per capita income of Rs. > 5,000/-
and < 2,000/- respectively.
The data on monthly per capita income as related to fish
consumption reveal that among Tirupati urban Hhs a higher
percentage (80.8) with a per capita monthly income of Rs.
2,000- 5,000/- consume fish when compared with Hhs with
a monthly per capita income of Rs. >5,000/- (80.7 per cent)
and those Hhs with per capita income of Rs. <2,000/- (78.5
per cent). It was evident that in Tirupati Hhs not consuming
fish range from about 20 to 22 per cent. In Nellore urban a
higher percentage of Hhs (90.8) with a per capita income of
Rs. <2,000/- consume fish when compared to Hhs either
with monthly per capita income of Rs. 2,000- 5,000/- (87.6
per cent) or those with a per capita income of Rs. >5,000/-
(80.7 per cent). It was observed that the Hhs not consuming
fish range from about 10 to 20 per cent in Nellore.
The X2 test for association revealed a significant association
(p<0.05) between per capita income and fish consumption
among Tirupati Hhs and no association among Nellore urban
Hhs.
Frequency and variety of fish consumption:
The data on distribution of urban Hhs according to
frequency and variety of fish consumption is presented in
table no.6. The data reveal that in Tirupati urban a highest
percentage (32.5) of Hhs consume freshwater fish weekly,
followed by monthly (21.6 per cent), fortnightly (18.6 per
cent) and seldom (7.4 per cent). Whereas in Nellore urban a
highest percentage (38.0) of Hhs consume freshwater fish
monthly, followed by fortnightly (24.6 per cent), weekly
(21.8 per cent) and seldom (3.4 per cent).
Table 6: Percentage distribution of urban households according to frequency of consumption of fish varieties
Frequency
Tirupati(700 Hhs) Nellore(500 Hhs)
Fresh water
fish
Sea fish Dry fish Fresh water
fish
Sea fish Dry fish
No Per
cent
No Per
cent
No Per
cent
No Per
cent
No Per
cent
No Per
cent
Weekly 228 32.5 16 2.3 164 23.4 109 21.8 125 25.0 91 18.2
Fortnightly 130 18.6 29 4.1 88 12.6 123 24.6 147 29.4 65 13.0
Monthly 151 21.6 38 5.4 47 6.7 190 38.0 134 26.8 120 24.0
Seldom 52 7.4 140 20.0 13 1.9 17 3.4 37 7.4 11 2.2
Never 139 19.9 477 68.2 388 55.4 61 12.2 57 11.4 213 42.6
Total 700 100.0 700 100.0 700 100.0 500 100.0 500 100.0 500 100.0
The sea fish consumption data shows that a high percentage
(29.4) of Nellore urban Hhs consume fortnightly, followed
by monthly (26.8 per cent), weekly (25.0 per cent) and
seldom (7.4 per cent). Whereas in Tirupati urban a highest
percentage (20.0) of Hhs consume sea fish seldom, followed
by monthly (5.4 per cent), fortnightly (4.1 per cent) and
weekly (2.3 per cent) frequency.
The dry fish consumption data reveal that in Tirupati urban a
highest percentage (23.4) of Hhs consume weekly, followed
by fortnightly (12.6 per cent), monthly (6.7 per cent) and
Paper ID: SUB154704 2475

International Journal of Science and Research (IJSR) ISSN (Online): 2319-7064
Index Copernicus Value (2013): 6.14 | Impact Factor (2013): 4.438
Volume 4 Issue 5, May 2015
www.ijsr.net Licensed Under Creative Commons Attribution CC BY
seldom (1.9 per cent). Whereas in Nellore urban Hhs a
highest percentage (24.0) of Hhs consume dry fish monthly,
followed by weekly (18.2), fortnightly (13.0) and seldom
(2.2).
5. Discussion
The survey carried out in the present study constitute the
most important part focusing on the profile of familial
characteristics that are related to fish consumption among
the Hhs (Hhs) of Tirupati and Nellore urban areas. These
data provide useful information on the different
characteristics of the Hhs such as religion, social status,
occupational lifestyle and income aiding in the
understanding of the fish consumption behavior of
communities. It is important to have as much detailed
information as possible of the Hhs not only for assessing
their socio-economic status and associated characteristics,
but also to understand the nature of determinants of fish
consumption that are dynamic and thus, serve as pointers
towards promotion of fish consumption.
The distribution of Hhs belonging to Tirupati and Nellore
urban areas reveal that in both regions the religious group of
the Hindus (H) were dominant compared to Muslims (M) or
Christians (C). The social group of BCs were high in
Tirupati urban, whereas in Nellore OCs were higher than the
other groups. ST Hhs constitute a small per cent in both the
urban areas. The sedentary lifestyle was more dominant in
Tirupati and Nellore, followed by moderate work categories.
Works in private or government sector, business were the
occupation of sedentary working group. The percent of Hhs
in heavy work category were lower. Studies by Vinod and
Sharma (2011) showed that among urban communities the
occupation of the bread winner or head of the family is the
primary determinant of the lifestyle of the family members.
The present survey revealed that a majority of Hhs in both
Tirupati and Nellore belong to middle income group (MIG).
The percentage of LIG families was less in Tirupati while
the percentage of HIG was low in Nellore.
The data on monthly per capita income reveal that the Hhs
with per capita income of Rs. > 5,000/- was dominant group
in Tirupati. In Nellore the Hhs with monthly per capita
income of Rs. 2,000/- to 5,000/- was high. The Hhs with per
capita income of Rs. < 2,000/- was lower in both the urban
areas. India is currently undergoing rapid socio-economic,
demographic, health and nutritional transition. The rate of
transition varies substantially between states, urban and rural
population and income groups. It is essential that the trends
in food consumption patterns are monitored to identify
trend. Strengthening the positive trends and combating the
negative ones can go a long way in improving the dietary
intake, lifestyle and nutritional status of the population
(NSSO, 2005).
The general food consumption pattern of the Hhs can be
arrived at, on the basis of food habit survey with a special
focus on the survey of specific items pertaining to fish
consumption and practices. It gives an overview of the meal
patterns and variety and frequency of fish consumed and
aids in identifying the dietary etiological factors of fish
consumption in the urban area being studied.
In the present context the fish consumption behavior studied
among 700 Hhs of Tirupati urban reveal that only 561(80
per cent) Hhs were consuming fish as food. In Nellore urban
out of 500 Hhs, 442 (88 per cent) Hhs were consuming fish.
It was thus observed that irrespective of community about
80 to 90 per cent of Hhs were in the habit of consuming fish
in Tirupati and Nellore areas. The reasons put forth by non-
vegetarians for not consuming fish in the present study were
non-availability of fresh fish, cost factor, cumbersome
cleaning, dislike of smell and taste. Similar reasons were
reported by Leek, et.al, (2000) and Olsen, et.al, (2007) that
the Hhs of non-vegetarians also were not consuming fish
because of prime reasons such as fish availability, perceived
difficulty or easiness in the preparation and cooking of fish,
perception that fish is expensive compared to other food
types, physical properties such as bones and smell, and taste
preference. And these factors were found to be important
factors shaping fish consumption.
The fish consumption was prevalent highly among Muslim
(M) Hhs, when compared with Christians (C)or Hindus(H).
Fish consumption thus appears to be to some extent
dependent on the religion. Religion showed a significant
association for Nellore and for the combined data. It is a
known fact that fish eating habits are common among
coastal areas. Therefore, the food related behaviors might
get established as food habits. The fish consumption pattern
studied in different community groups showed that seventy
six per cent fish consumers were Hindus followed by
Muslims (12.66per cent) (Vinod and Sharma, 2011).
The total amount of fish consumed and the species
composition of the food fish supply vary according to
regions and countries, reflecting the different levels of
availability of fish and other foods, including the
accessibility of fishery resources in adjacent waters as well
as the interaction of several socio-economic and cultural
factors. These factors include food traditions, tastes,
demand, income levels, seasons, prices, and health
infrastructure and communication facilities. Annual per
capita apparent fish consumption can vary from less than
one kg in one country to more than hundred kg in another.
Differences may also be significant within countries, with
consumption usually higher in coastal, riverine and inland
water areas (FAO, 2012). When resources are limited the
differences between groups tend to disappear as there are
limited choices. The set trend in relation to religion was
evident with Nellore coastal areas as plenty of fish were
available regionally. Whereas, in Tirupati, fish availability
being unstable scope for establishment of a set pattern of
consumption of fish may not be evident.
The data on fish consumption as related to social group
revealed that ST’s were the dominant fish consuming group
both among the Hhs in Tirupati (89 per cent) and Nellore
(100 per cent). The fish consumption was high among all
social groups of Nellore, when compared with social groups
of Tirupati. However, only the combined data showed a
significant association between the social groups and fish
consumption. Dried fish in particular are a cheap non-
vegetarian food consumed by those living in coastal as well
as non-coastal areas. Therefore, the social classes in the
lower order also have high scope for dry fish consumption.
Paper ID: SUB154704 2476

International Journal of Science and Research (IJSR) ISSN (Online): 2319-7064
Index Copernicus Value (2013): 6.14 | Impact Factor (2013): 4.438
Volume 4 Issue 5, May 2015
www.ijsr.net Licensed Under Creative Commons Attribution CC BY
The fact that fish consumption is high among all social
groups in Nellore is justified for it being coastal area with a
better availability of fish all through the year. Further,
Scheduled Tribe (ST) communities whether nomadic or
static have fishing and hunting for animals as a habit in the
process of procuring food. For them fish consumption is a
highly preferred food choice and is customarily included as
an item in their regular dietaries particularly during fishing
seasons.
The diet of the family mainly depends on the occupation of
main income earner in a family (Jamdade, et.al, 2011). The
occupational lifestyle data showed that the fish consumption
was high among all occupations among Nellore Hhs, when
compared with Tirupati. In the lifestyle groups the fish
consumption was high in Tirupati sedentary work group,
whereas in Nellore the consumption was high among heavy
work groups. While occupation does not appear to be
significantly associated with consumption of fish, when fish
availability is limited the consumption of the sedentary
lifestyle groups with the probability of also being a higher
income group may surpass of other groups. On the other
hand, where habits were established even among the lower
income groups who engage in heavy works show higher
frequency of consumption, through utilization of cheaply
available fish varieties.
A study conducted in Kolhapur on fish consumption
revealed that fish plays crucial role in the diet of poor. Cat
fish though sold cheaply are rich source of protein for lower
strata. This also indicates that the availability of a variety of
fish products to suit individual household budgets may
determines the fish consumption (Jamadade, et.al, 2011).
Incidence of the fish consumption was high among LIG of
Nellore, which was higher than that of the HIG of Tirupati.
Among all income groups high fish consumption was
observed in Nellore, than in Tirupati. A significant
association was observed between income and fish
consumption in Tirupati urban area.
The monthly per capita income as related to fish
consumption revealed that the consumption was high among
all groups of Nellore compared with the Tirupati Hhs. A
significant association was observed between the per capita
income and fish consumption in Tirupati. It may be because
of the fact that the fish was expensive item in Tirupati, thus
the income influence the consumption of fish. Where as in
Nellore, it is situated near to the coastline of Bay of Bengal
and the Hhs include the fish as one of the main and regular
food item in their diet. Further, fish was less expensive when
compared with the Tirupati markets (non-coastal area).
Therefore, all income groups prefer to eat fish in Nellore;
with a greater diversification among the upper income
groups.
Leoffer, et.al, (2003) stated that fish consumption pattern is
heavily dependent on the religion and socio-economic back
ground of the Hhs and distinct differences in fish
consumption occur between regional areas. The observations
of the researcher are in accordance with the findings of the
present study.
The frequency of fresh water fish consumption was high in
Tirupati. The frequency of sea fish consumption was
observed to be high in Nellore. The frequency of weekly
consumption of dry fish was observed in Tirupati urban Hhs
and Nellore urban Hhs showed a preference to eat monthly.
Despite the fact that dried fish is liked by all consumers,
both in terms of taste as well as convenience, there is a
certain degree of embarrassment in admitting it. This is
partly because of the poor status value associated with its
consumption and partly because of practical difficulties, viz,
the strong and unpleasant smell, excessive salt content, poor
quality etc.
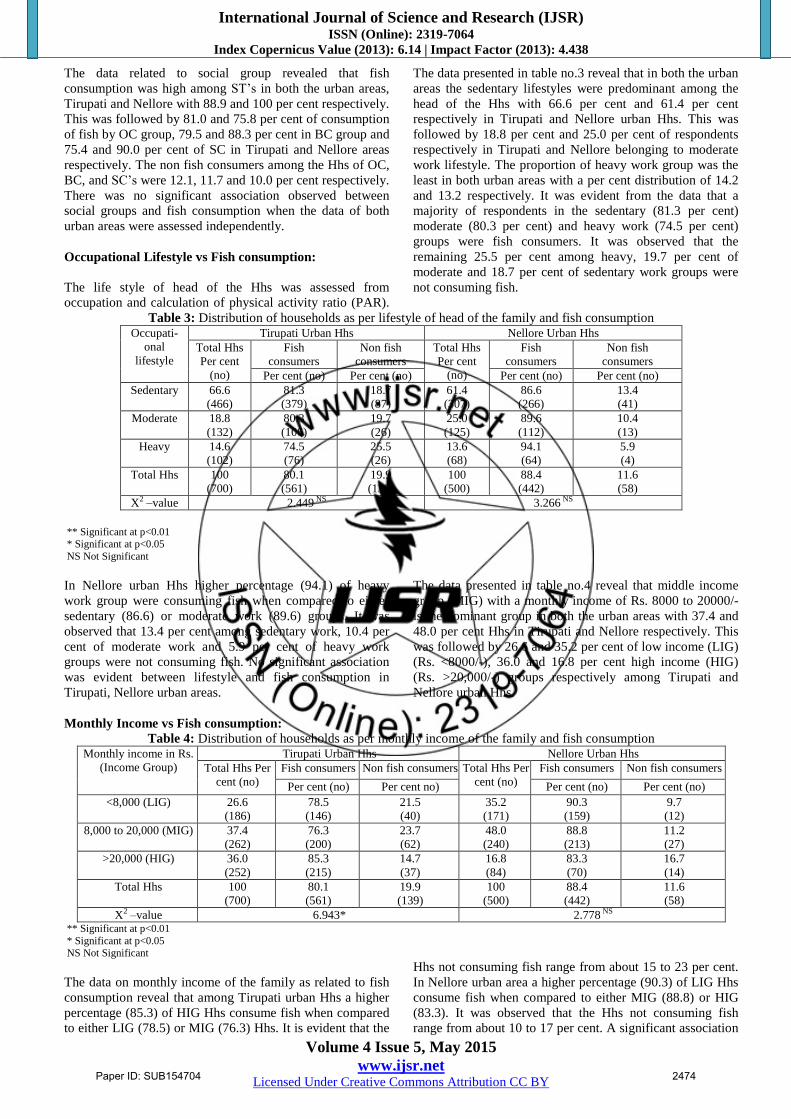
Fish varieties available include a wide spectrum ranging
from regionally available low cost varieties to costly locally
available or important special varieties. The varieties of fish
available in the Tirupati and Nellore urban markets were
presented in table 7.
The varieties of fish consumed to a greater extent are
dependent on the availability of fish locally, regionally or
seasonally. When compared to the fish farming, the
marketing has experienced tremendous developments. As a
result the habituation of Hhs to the consumption of locally
available fish variety have shown a shift to consuming other
imported varieties too. In consequence, in addition to the
local varieties of fish other fish inputs have increased.
It was observed that about 31 different varieties of fish were
available in Nellore urban area among which 21 no. were
sea fish varieties and rest was fresh water fish. In Tirupati
urban markets only 16 fish varieties were reported to be
available and of which majority are fresh water fish. It is
also evident that the prices of about 90 per cent of fish
varieties were higher in Tirupati markets when compared to
that of Nellore markets; which may be attributed to the
regional availability of fish. With regard to Tirupati the costs
incurred through importing fish and consumer demand may
influence the prices fixed for different varieties. It is evident
that the availability of sea fish is limited to a few varieties of
fish in Tirupati. While several different varieties were
available in Nellore market, only few varieties such as
thataku and small fish were available in Tirupati markets.
Thus, the differential regional trends observed in fish
consumption might to a considerable extent able to be
dependent as the availability and prices of fish.
Table 7: The fish varieties available in Tirupati and Nellore
S.No Fish Species available in
Tirupati
Fish Species available in
Nellore
Vernacular Name (Telugu)
1 Anchovies (S) Anchovies (S) Pasupuchukka
2 Bombay Duck (S) Barracudas (S) Seelabotu
3 Cat fishes (S and F) Bombay Duck (S) Vanamattalu/ Sawada
4 Catla (Bengal Carp) (F) Cat fishes (S and F) Jellalu
Paper ID: SUB154704 2477
International Journal of Science and Research (IJSR) ISSN (Online): 2319-7064
Index Copernicus Value (2013): 6.14 | Impact Factor (2013): 4.438
Volume 4 Issue 5, May 2015
www.ijsr.net Licensed Under Creative Commons Attribution CC BY
5 Croakers (F) Croakers (F) Goraka
6 Eels and Congers (F) Eels and Congers (F) Maluguchepa
7 Catla (Bengal Carp) (F) Botcha
8 Goat Fish (F) Golivindalu
9 Greas Carp fish (Carp) (F) Greas Carp fish (Carp) (F) Erramosu
10 King fish (S) Peddah/ Mottam
11 Mackerals (S) Mackerals (S) Kanakanthalu
12 Mullets (S) Kathipariga
13 Pomfrets (S) Pomfrets (S) Tella/Nalla Chanduva
14 Prawns (S and F) Prawns (S and F) Royyalu
15 Rays (S) Teku cheap
16 Red Snapper (F) Red Snapper (F) Korameenu
17 Rohu (Carp) (F) Rohu (Carp) (F) Gandi
18 Ribbon fish (S) Ribbon fish (S) Savallu/ Savida
19 Salmon (S) Maga/ Budatha Maga
20 Sardines (S) Kavalu, Noona kavalu
21 Sea Basses/ Reef Cods (S) Bontha cheap
22 Sea-Perches (S) Pandu cheap
23 Seer-fishes (S) Seer-fishes (S) Vanjaramu
24 Sharks (S) Sharks (S) Sorra chepa/ Sorraputtu
25 Sickle fishes (S) Chukkagoraka
26 Silver Bellies (S) Karrachukka
27 Skates (S) Yalam/ Tipulavi
28 Thread fins (S) Maga/Bodu Maga
29 Tunas (S) Thura
30 Tilapia (F) Tilapia (F) Jilebi cheap
31 Wolf Herring (S) Parava/ Kannagi
6. Conclusion
This study was conducted in an ethnically diverse population
to identify fish consumption patterns and the findings were
similar to those reported in more heterogeneous populations.
Consumption of frequency and variety of fish by all Hhs in
Nellore urban area found to be high; whereas, among the
Hhs of Tirupati urban area fish consumption was low.
Findings of the study clearly indicate a strong association
between fish consumption patterns and familial Hhs
characteristics such as religion, social status and income. In
addition uncertainties and low availability of fish, high
prices may aggravate the already existing low fish intake
particularly in the non-coastal areas. The findings thus focus
on the dire need to encourage fish consumption through
overcoming the barriers as a public health measure to
prevent the mounting incidence of chronic degenerative
diseases.
References
[1] Kumar, P. and M.M. Dey, (2004) A study on modelling
of household demand for fish in India. Indian Journal of
Agricultural Economics, 59(3): 465-475.
[2] Paroda, R.S. and P. Kumar, (2000) Food production and
demand in South Asia, Agricultural Economics Research
Review, 13(1): 1-24.
[3] Khajuria Vinod, Sharma O.P. (2011) Socio-economic
status and consumption pattern of fish consumers in
Udaipur (Rajasthan) Progressive Agriculture Year :
2011, 11: pp. 89- 94.
[4] FAO, 2012, State of World Fisheries, Aquaculture
Report.
[5] Jamdade,R .A., Deshpande, V.Y., Parakhe, Y.B., and
Bhilave M.P. (2011) Status of fish consumption in
Kolhapur City, Recent Research in Science and
Technology, 3(3):pp. 143-146.
[6] National Sample Survey Organisation (NSSO) surveys
1973-2005 (2008).
[7] Leoffler,G., Meyer, J.L., Trammell, H., and Holmbeck-
Pelham, S. (2003) Fish consumption patterns along the
Upper Chattahoochee River, Proceedings of the 2003
Georgia Water Resources Conference- 2003.
[8] Sheena Leek, Sarah Maddock, Gordon Foxall, (2000)
"Situational determinants of fish consumption", British
Food Journal, Vol. 102 Iss: 1, pp.18 – 39.
[9] Olsen S O, Scholderer J, Brunsø K et al (2007) Exploring
the relationship between convenience and fish
consumption: A cross-cultural study. Appetite, 49(1), 84-
91.
Author Profile
D. Madhavi received the B.Sc. and M.Sc. degrees in Home
Science (Specialization: Food Science and Nutrition) from Sri
Venketeswara University in 2003 and 2005, respectively. Now, she
is pursuing Ph.D., Degree from Department of Home Science, Sri
Venkateswara University, Tirupati. Participated in National and
International seminars and Work Shops
Dr. D. L. Kusuma received the Ph.D. degree in Home Science
(Specialization: Food Science and Nutrition) from Sri
Venketeswara University. She is a Rtd. Professor of the Dept. of
Home Science and while in service served as Head, BOS
Chairperson and Coordinator of UGC-SAP of the Department of
Home Science, Sri Venkateswara University, Tirupati.
Paper ID: SUB154704 2478