Fiscal Year 2017 Data Center Services Consolidation ...
52
TEXAS DEPARTMENT OF INFORMATION RESOURCES | DCS CONSOLIDATION MEASUREMENT REPORT 1 Fiscal Year 2017 Data Center Services Consolidation Measurement Report Texas Department of Information Resources August 2019 DocuSign Envelope ID: EE63AB8D-66DE-4943-9AB7-BF3CB6EAE20D
Transcript of Fiscal Year 2017 Data Center Services Consolidation ...
TEXAS DEPARTMENT OF INFORMATION RESOURCES | DCS CONSOLIDATION MEASUREMENT REPORT 1
Fiscal Year 2017 Data Center Services Consolidation Measurement Report
Texas Department of Information Resources
August 2019
DocuSign Envelope ID: EE63AB8D-66DE-4943-9AB7-BF3CB6EAE20D
TEXAS DEPARTMENT OF INFORMATION RESOURCES | DCS CONSOLIDATION MEASUREMENT REPORT 2
Contents Executive Summary ....................................................................................................................................... 4
DCS Background ........................................................................................................................................ 4
Consolidation Measurement Report ........................................................................................................ 4
Baseline Assessment of Financial Performance ............................................................................................ 6
Program Performance ............................................................................................................................... 6
Fiscal Year 2017 Unit Rate Analysis .............................................................................................................. 8
Transition and Transformation Investments .............................................................................................. 10
DCS Infrastructure Consolidation Progress ................................................................................................. 11
Consolidation Status ............................................................................................................................... 11
DCS Program Progress ............................................................................................................................ 12
Conclusion ................................................................................................................................................... 13
Appendix A – Unit Rate Analysis Methodology .......................................................................................... 14
Methodology ........................................................................................................................................... 14
Base Rates ............................................................................................................................................... 15
Inclusion/Exclusion of Resource Units .................................................................................................... 15
Appendix B – Detailed Unit Rate Analysis ................................................................................................... 17
Mainframe .............................................................................................................................................. 17
Print-Mail ................................................................................................................................................ 17
Consolidated Server ................................................................................................................................ 17
Consolidated Server Storage & Offsite Tape .......................................................................................... 18
DBaaS (Database as a Service) ................................................................................................................ 18
Non-Consolidated Servers ...................................................................................................................... 19
Non-Consolidated Server Storage & Offsite Tape .................................................................................. 19
Appendix C – Designated DCS Customer Analysis ...................................................................................... 20
Department of Aging and Disability Services (DADS) ............................................................................. 20
Department of Family and Protective Services (DFPS) ........................................................................... 21
Department of Information Resources - Agency (DIR-A) ........................................................................ 22
Department of Information Resources - Texas.gov ................................................................................ 23
Department of State Health Services (DSHS) .......................................................................................... 24
Health and Human Services Commission (HHSC) ................................................................................... 25
Health Professions Council (HPC) ........................................................................................................... 27
Office of the Attorney General – Administration & Legal Division (OAG-AL) ......................................... 28
DocuSign Envelope ID: EE63AB8D-66DE-4943-9AB7-BF3CB6EAE20D

TEXAS DEPARTMENT OF INFORMATION RESOURCES | DCS CONSOLIDATION MEASUREMENT REPORT 3
Office of the Attorney General – Child Support Division (OAG-CS) ........................................................ 29
Public Utility Commission (PUC) ............................................................................................................. 30
Railroad Commission of Texas (RRC) ...................................................................................................... 31
Secretary of State (SOS) .......................................................................................................................... 32
Texas Alcoholic Beverage Commission (TABC) ....................................................................................... 33
Texas Commission on Environmental Quality (TCEQ) ............................................................................ 34
Texas Department of Agriculture (TDA).................................................................................................. 35
Texas Department of Criminal Justice (TDCJ) ......................................................................................... 36
Texas Department of Insurance (TDI) ..................................................................................................... 37
Texas Department of Licensing and Regulation (TDLR) .......................................................................... 38
Texas Department of Motor Vehicles (TxDMV) ...................................................................................... 39
Texas Department of Transportation (TxDOT) ....................................................................................... 40
Texas Education Agency (TEA) ................................................................................................................ 41
Texas Facilities Commission (TFC) ........................................................................................................... 42
Texas Higher Education Coordinating Board (THECB) ............................................................................ 43
Texas Juvenile Justice Department (TJJD) ............................................................................................... 44
Texas Parks and Wildlife Department (TPWD) ....................................................................................... 45
Texas State Library and Archives Commission (TSLAC) .......................................................................... 46
Texas Veterans Commission (TVC) .......................................................................................................... 47
Texas Workforce Commission (TWC) ...................................................................................................... 48
Texas Water Development Board (TWDB) ............................................................................................. 49
Voluntary Customers – State Agencies4.................................................................................................. 50
Appendix D – Definition of Terms ............................................................................................................... 51
Acknowledgements ..................................................................................................................................... 52
DocuSign Envelope ID: EE63AB8D-66DE-4943-9AB7-BF3CB6EAE20D

TEXAS DEPARTMENT OF INFORMATION RESOURCES | DCS CONSOLIDATION MEASUREMENT REPORT 4
Executive Summary
DCS Background In 2005, the 79th Legislature passed House Bill 1516, directing the Texas Department of Information
Resources (DIR) to consolidate agencies’ information technology (IT) infrastructure to reduce statewide
costs for IT services, modernize aging state infrastructure, and increase overall security and disaster
recovery capability. The goal of the legislation was to reduce overall taxpayer costs by consolidating and
standardizing IT infrastructure, products, and services across agencies with large IT investments.
Additionally, the State sought to reduce disaster recovery, security and critical state data and system
assets backup risks, and to stay current with best practices that accrue from a public-private
partnership.
In 2006, 29 state agencies were selected, and DIR released a request for offer to outsource the
management of these agencies’ IT infrastructure, while consolidating from over 31 disparate, legacy
data centers into two highly secure, redundant data centers in Austin and San Angelo, Texas. With
designated agency participation, DIR entered a seven-year contract in 2007. In 2010, DIR re-procured
and re-structured data center services into a service integration model with multiple Service Component
Providers (SCP) and a Multi-Sourcing Service Integrator (MSI) that positioned the state to achieve more
flexibility, accountability, and functionality.
The DCS Program currently serves 47 state and local entities: 28 designated state agencies with fully
managed mainframe, server, and bulk print-mail services, twelve agencies with email only services, one
agency with print-mail only services, five entities with other optional services only and the Texas.gov
program. Fully managed services mean that DIR, through its service provider partners, provide the
hardware, software, tools, and technical staff to fully support IT infrastructure.
Data center services are a foundational technology component and, as such, are necessary for every
state agency, college, university, and local government. As Texas experiences rapid population and
economic growth, state governmental entities must deliver more constituent services with greater
efficiency. As a result, the state is progressively investing in IT to accomplish many goals. These goals
include more effectively supporting business operations, pursuing cost efficiencies, providing secure and
innovative ways for citizens to interact with the State, enhancing the digital experience of government
services, and supporting open data initiatives to gain insights into how government works. As
governments are challenged to do more with less, the ability to outsource and optimize their
infrastructure and IT services becomes increasingly necessary to achieve economies of scale. The DCS
Program provides a strong foundation for an ever-growing and enhanced set of IT services by enabling
government entities to meet these demands.
Consolidation Measurement Report The 83rd legislative session enacted a change to Texas Government Code, Section 2054.0621 for
Information Resources Technology Consolidation requiring DIR to measure and report on financial
5 Source: September 2016 Business Executive Leadership Council meeting slide deck
DocuSign Envelope ID: EE63AB8D-66DE-4943-9AB7-BF3CB6EAE20D
TEXAS DEPARTMENT OF INFORMATION RESOURCES | DCS CONSOLIDATION MEASUREMENT REPORT 5
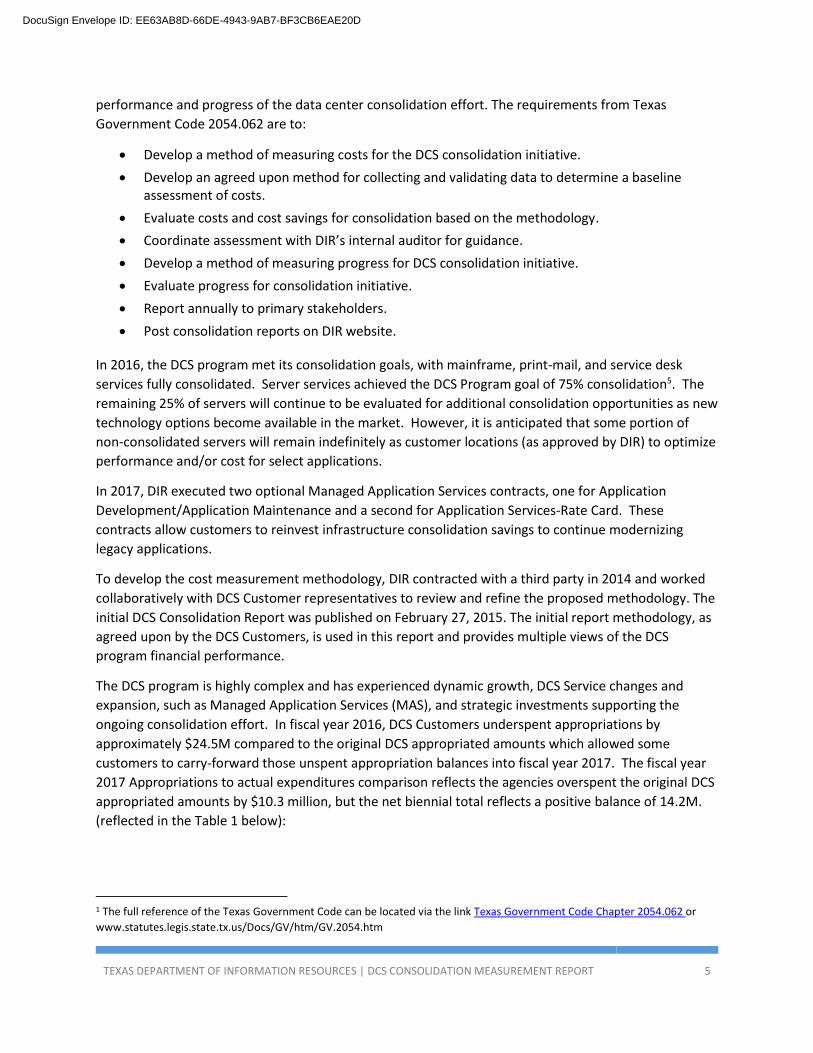
performance and progress of the data center consolidation effort. The requirements from Texas
Government Code 2054.062 are to:
Develop a method of measuring costs for the DCS consolidation initiative.
Develop an agreed upon method for collecting and validating data to determine a baseline assessment of costs.
Evaluate costs and cost savings for consolidation based on the methodology.
Coordinate assessment with DIR’s internal auditor for guidance.
Develop a method of measuring progress for DCS consolidation initiative.
Evaluate progress for consolidation initiative.
Report annually to primary stakeholders.
Post consolidation reports on DIR website.
In 2016, the DCS program met its consolidation goals, with mainframe, print-mail, and service desk
services fully consolidated. Server services achieved the DCS Program goal of 75% consolidation5. The
remaining 25% of servers will continue to be evaluated for additional consolidation opportunities as new
technology options become available in the market. However, it is anticipated that some portion of
non-consolidated servers will remain indefinitely as customer locations (as approved by DIR) to optimize
performance and/or cost for select applications.
In 2017, DIR executed two optional Managed Application Services contracts, one for Application
Development/Application Maintenance and a second for Application Services-Rate Card. These
contracts allow customers to reinvest infrastructure consolidation savings to continue modernizing
legacy applications.
To develop the cost measurement methodology, DIR contracted with a third party in 2014 and worked
collaboratively with DCS Customer representatives to review and refine the proposed methodology. The
initial DCS Consolidation Report was published on February 27, 2015. The initial report methodology, as
agreed upon by the DCS Customers, is used in this report and provides multiple views of the DCS
program financial performance.
The DCS program is highly complex and has experienced dynamic growth, DCS Service changes and
expansion, such as Managed Application Services (MAS), and strategic investments supporting the
ongoing consolidation effort. In fiscal year 2016, DCS Customers underspent appropriations by
approximately $24.5M compared to the original DCS appropriated amounts which allowed some
customers to carry-forward those unspent appropriation balances into fiscal year 2017. The fiscal year
2017 Appropriations to actual expenditures comparison reflects the agencies overspent the original DCS
appropriated amounts by $10.3 million, but the net biennial total reflects a positive balance of 14.2M.
(reflected in the Table 1 below):
1 The full reference of the Texas Government Code can be located via the link Texas Government Code Chapter 2054.062 or
www.statutes.legis.state.tx.us/Docs/GV/htm/GV.2054.htm
DocuSign Envelope ID: EE63AB8D-66DE-4943-9AB7-BF3CB6EAE20D

TEXAS DEPARTMENT OF INFORMATION RESOURCES | DCS CONSOLIDATION MEASUREMENT REPORT 6
Table 1. Fiscal Year 2016 & 2017 Appropriated versus Actual for DCS Appropriated
Agencies
Original DCS
Appropriation* Actual - DCS
Infrastructure Services
Actual – Managed Application
Services Variance
Fiscal Year 2016 $246,344,166 $221,850,730 $0 $24,493,436
Fiscal Year 2017 $254,379,998 $263,941,117 $687,921 ($10,249,040)
Biennial Total: $500,724,164 $485,791,847 $687,921 $14,244,396 *Note: Appropriated amounts reflect the original DCS Services Capital Budget appropriations and do not include subsequent transfers.
This consolidation measurement report provides analysis and insight into the following DCS program
elements:
1. Baseline Assessment of Financial Performance
Actual annual spend versus appropriated amounts at the agency and program level.
Actual annual spend by service category. 2. Fiscal Year 2017 Unit rate impact analysis
Rate analysis based on volume fluctuations and total extended charges. 3. Transition and Transformation Investments
A financial summary of one-time investments required to transition services and transform and consolidate the legacy IT environment.
4. DCS Infrastructure Consolidation Progress
Current status of infrastructure consolidation initiatives.
Description of DCS program accomplishments.
Baseline Assessment of Financial Performance
Program Performance Fiscal year 2017 DCS appropriations, exclusive of any fiscal year 2016 appropriation carryforward, were
approximately $254.4 million, while actual spend was near $264.6 million. DCS appropriation transfers
are not captured in this analysis.
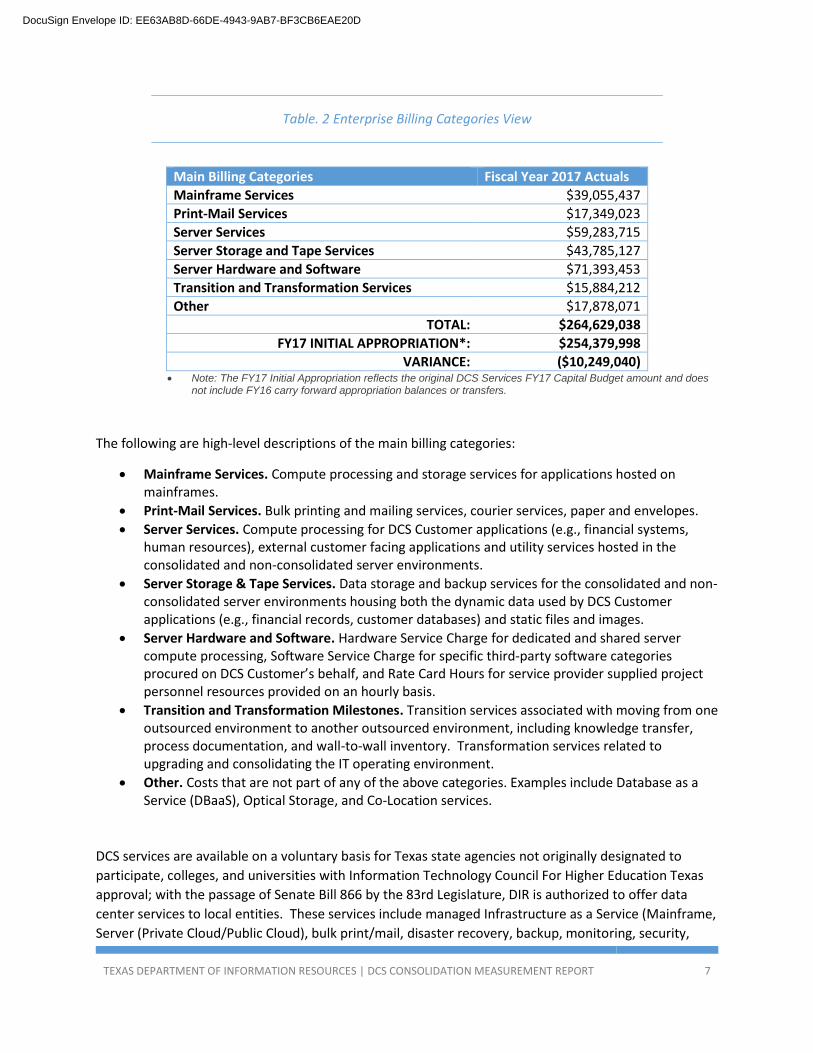
Table 2 below shows the actual fiscal year 2017 expenditures against the fiscal year 2017 appropriations
for the main billing categories. Individual DCS Customer analyses are documented in Appendix C.
DocuSign Envelope ID: EE63AB8D-66DE-4943-9AB7-BF3CB6EAE20D
TEXAS DEPARTMENT OF INFORMATION RESOURCES | DCS CONSOLIDATION MEASUREMENT REPORT 7
Table. 2 Enterprise Billing Categories View
Main Billing Categories Fiscal Year 2017 Actuals
Mainframe Services $39,055,437
Print-Mail Services $17,349,023
Server Services $59,283,715
Server Storage and Tape Services $43,785,127
Server Hardware and Software $71,393,453
Transition and Transformation Services $15,884,212
Other $17,878,071
TOTAL: $264,629,038
FY17 INITIAL APPROPRIATION*: $254,379,998
VARIANCE: ($10,249,040) Note: The FY17 Initial Appropriation reflects the original DCS Services FY17 Capital Budget amount and does
not include FY16 carry forward appropriation balances or transfers.
The following are high-level descriptions of the main billing categories:
Mainframe Services. Compute processing and storage services for applications hosted on mainframes.
Print-Mail Services. Bulk printing and mailing services, courier services, paper and envelopes.
Server Services. Compute processing for DCS Customer applications (e.g., financial systems, human resources), external customer facing applications and utility services hosted in the consolidated and non-consolidated server environments.
Server Storage & Tape Services. Data storage and backup services for the consolidated and non-consolidated server environments housing both the dynamic data used by DCS Customer applications (e.g., financial records, customer databases) and static files and images.
Server Hardware and Software. Hardware Service Charge for dedicated and shared server compute processing, Software Service Charge for specific third-party software categories procured on DCS Customer’s behalf, and Rate Card Hours for service provider supplied project personnel resources provided on an hourly basis.
Transition and Transformation Milestones. Transition services associated with moving from one outsourced environment to another outsourced environment, including knowledge transfer, process documentation, and wall-to-wall inventory. Transformation services related to upgrading and consolidating the IT operating environment.
Other. Costs that are not part of any of the above categories. Examples include Database as a Service (DBaaS), Optical Storage, and Co-Location services.
DCS services are available on a voluntary basis for Texas state agencies not originally designated to
participate, colleges, and universities with Information Technology Council For Higher Education Texas
approval; with the passage of Senate Bill 866 by the 83rd Legislature, DIR is authorized to offer data
center services to local entities. These services include managed Infrastructure as a Service (Mainframe,
Server (Private Cloud/Public Cloud), bulk print/mail, disaster recovery, backup, monitoring, security,
DocuSign Envelope ID: EE63AB8D-66DE-4943-9AB7-BF3CB6EAE20D
TEXAS DEPARTMENT OF INFORMATION RESOURCES | DCS CONSOLIDATION MEASUREMENT REPORT 8
storage, production control, data center network, architecture design, capacity management, operating
system support, database support, middleware support, hardware refresh, software currency, Microsoft
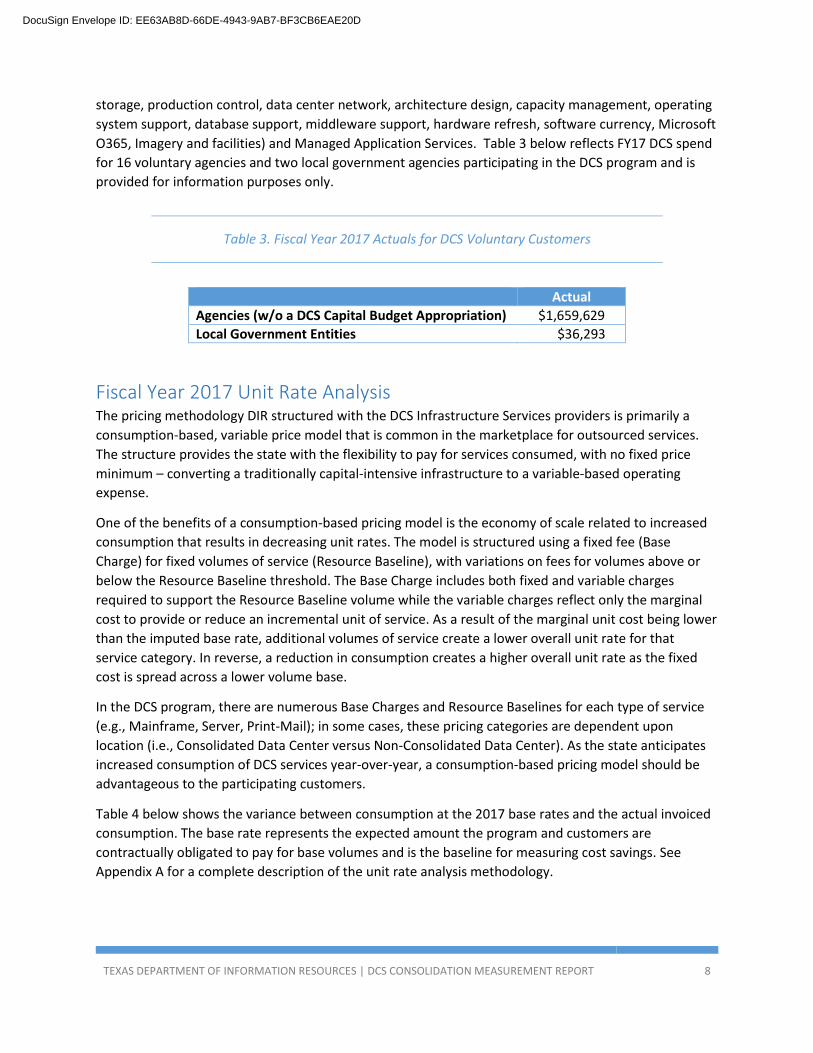
O365, Imagery and facilities) and Managed Application Services. Table 3 below reflects FY17 DCS spend
for 16 voluntary agencies and two local government agencies participating in the DCS program and is
provided for information purposes only.
Table 3. Fiscal Year 2017 Actuals for DCS Voluntary Customers
Actual
Agencies (w/o a DCS Capital Budget Appropriation) $1,659,629
Local Government Entities $36,293
Fiscal Year 2017 Unit Rate Analysis The pricing methodology DIR structured with the DCS Infrastructure Services providers is primarily a
consumption-based, variable price model that is common in the marketplace for outsourced services.
The structure provides the state with the flexibility to pay for services consumed, with no fixed price
minimum – converting a traditionally capital-intensive infrastructure to a variable-based operating
expense.
One of the benefits of a consumption-based pricing model is the economy of scale related to increased
consumption that results in decreasing unit rates. The model is structured using a fixed fee (Base
Charge) for fixed volumes of service (Resource Baseline), with variations on fees for volumes above or
below the Resource Baseline threshold. The Base Charge includes both fixed and variable charges
required to support the Resource Baseline volume while the variable charges reflect only the marginal
cost to provide or reduce an incremental unit of service. As a result of the marginal unit cost being lower
than the imputed base rate, additional volumes of service create a lower overall unit rate for that
service category. In reverse, a reduction in consumption creates a higher overall unit rate as the fixed
cost is spread across a lower volume base.
In the DCS program, there are numerous Base Charges and Resource Baselines for each type of service
(e.g., Mainframe, Server, Print-Mail); in some cases, these pricing categories are dependent upon
location (i.e., Consolidated Data Center versus Non-Consolidated Data Center). As the state anticipates
increased consumption of DCS services year-over-year, a consumption-based pricing model should be
advantageous to the participating customers.
Table 4 below shows the variance between consumption at the 2017 base rates and the actual invoiced
consumption. The base rate represents the expected amount the program and customers are
contractually obligated to pay for base volumes and is the baseline for measuring cost savings. See
Appendix A for a complete description of the unit rate analysis methodology.
DocuSign Envelope ID: EE63AB8D-66DE-4943-9AB7-BF3CB6EAE20D

TEXAS DEPARTMENT OF INFORMATION RESOURCES | DCS CONSOLIDATION MEASUREMENT REPORT 9
Table 4. Summary by Resource Unit Group
Rate Based Billing Categories (Included) Contracted Base
Costs Actuals Variance
Mainframe Services $29,516,389 $29,878,884 ($362,495)
Print-Mail Services $13,237,715 $13,984,497 ($746,782)
Server Services
-Consolidated Server $42,990,026 $41,497,933 $1,492,092
-Non-Consolidated Server $16,185,135 $12,371,718 $3,813,417
-DBaaS $5,730,612 $5,713,714 $16,898
Server Storage & Tape Services
-Consolidated Server Storage and Tape $17,972,005 $14,835,553 $3,136,451
-Non-Consolidated Server Storage and Tape $7,275,333 $4,422,522 $2,852,812
Total: $132,907,215 $122,704,822 $10,202,393
The above summary demonstrates fiscal year 2017 variability across the DCS program with a favorable
outcome. Analysis of each service follows:
Mainframe o Consumption was slightly lower than the base volume projection resulting in an
unfavorable variance. The Texas Department of Motor Vehicles eliminated their need for mainframe services, opting instead to move applications to a server-based platform. Other mainframe customers, such as the Texas Workforce Commission and the Texas Department of Criminal Justice opted to leverage mainframe CPU Specialty Engine services at a lower cost.
Print-Mail o Print-Mail volumes resulted in an overall unfavorable variance primarily due to Mail
Insertions and Print Images running lower than base volumes. Consolidated Server
o Consolidated server volumes were generally higher than the base rate projection, resulting in an overall lower unit cost and favorable variance.
Non-Consolidated Server o Higher actual volumes in Non-Consolidated Intel Bronze and Unix Silver offset lower
volumes in all other Non-Consolidated Server tiers volumes, resulting in an overall favorable variance.
Consolidated Server Storage and Offsite Tape o Consolidated Server Storage and Offsite Tape volumes were higher than the
contractual baseline volumes resulting an overall lower unit cost and a favorable variance. The higher volumes reflect the transition from legacy tape storage and non-consolidated environments.
Non-Consolidated Server Storage and Offsite Tape
DocuSign Envelope ID: EE63AB8D-66DE-4943-9AB7-BF3CB6EAE20D

TEXAS DEPARTMENT OF INFORMATION RESOURCES | DCS CONSOLIDATION MEASUREMENT REPORT 10
o Non-consolidated Server Storage and Offsite Tape volumes were generally higher than the contractual baseline volumes. The higher volumes reflect actual non-consolidated storage usage not declining as fast as anticipated by contract volumes.
A more detailed analysis of the results is included in the Appendix A. The Detailed Unit Rate Analysis is
documented in Appendix B and the individual DCS Customer analyses are documented in Appendix C.
NOTE: To facilitate a technology upgrade, the DCS program instituted a freeze on Enterprise Tape
fluctuations in January 2015; the 4 Resource Unit Categories below remained frozen throughout FY17
and were invoiced under the Enterprise Tape Resource Unit based on an agreed amount.
Consolidated Tape Stored
Consolidated Tape Written
Non-Consolidated Tape Other
Non-Consolidated Tape Stored
In January 2015, DIR worked with the Service Provider to implement an Enterprise Tape/Backup freeze
and cost reduction, resulting in an estimated reduction of $2.52 million annually. Effective September 1,
2016, the Enterprise Tape/Backup amount was further reduced by $1.38 million annually which
eliminated the full $3.9 million unfavorable variance noted in the DCS pricing benchmark completed in
April 2016. This reduced, fixed monthly backup charge will continue until the Enterprise Tape/Backup
RUs are repriced and volumes adjusted following completion of the migration to the new backup
technology.
Transition and Transformation Investments In addition to the consumption-based charges that compensate the DCS service providers for day-to-day
delivery of IT services, there are also separate transition and transformation (T&T) charges for certain
activities and investments that occurred during the first 48 months of the DCS Master Services
Agreement (Agreement). These services included the transition planning and execution of services from
legacy data centers and the previous service provider, as well as infrastructure investments to stabilize
and consolidate the operations. These one-time T&T activities, totaling $95.86 million, are charged to
the state upon successful completion of defined milestones and are funded through amounts billed to
and collected from state agencies on a monthly basis over the life of the Agreements.
The T&T phase is summarized into four initiatives:
1. Transition. The takeover of services from the incumbent service provider with minimal impact on the performance of the operations. Includes knowledge transfer and documentation, as well as, the implementation of service management tools and processes in order to facilitate effective service management when the new service providers take over the operations.
2. Stabilization. Remediation activities, immediate asset refresh, new backup and recovery solutions, and a comprehensive inventory.
3. Consolidation. Multi-year effort to complete the migration of servers (and related storage and backup environments) from legacy data centers and agency business offices into consolidated data centers.
DocuSign Envelope ID: EE63AB8D-66DE-4943-9AB7-BF3CB6EAE20D

TEXAS DEPARTMENT OF INFORMATION RESOURCES | DCS CONSOLIDATION MEASUREMENT REPORT 11
4. Optimization. Ongoing improvements to the environment that will benefit the state by reducing costs, improving services, or both.
Table 5. Transition and Transformation Charges
Milestone Total Milestone
Charge Paid Over Term
Accepted Total Paid Over Term
Invoiced through August 2017
Accepted Paid Over Term TnT
Liability
Non-Accepted Paid Over Term TnT Liability
Server $19.04 $19.04 $19.04 $0.00 $0.00
Data Center $2.02 $2.02 $2.02 $0.00 $0.00
Network $4.97 $4.97 $4.97 $0.00 $0.00
Hybrid Cloud $35.48 $35.48 $12.75 $22.73 $0.00
Mainframe $6.78 $6.78 $4.23 $2.55 $0.00
MSI $20.83 $20.76 $16.05 $4.71 $0.07
Xerox Print Mail $0.16 $0.16 $0.16 $0.00 $0.00
TOTAL: $89.28 $89.21 $59.22 $29.99 $0.07 Dollars in millions
Of the $89.28 million in T&T charges over the term of the Agreement, $89.21 million in milestone
charges were approved through the end of fiscal year 2017. The fiscal year 2017 expense for T&T was
$15.4 million excluding the recovery fee.
DCS Infrastructure Consolidation Progress
Consolidation Status Since its inception in 2007, the DCS program has met many of its objectives, including consolidation of
operations from disparate legacy data centers into the two consolidated data centers in Austin and San
Angelo. In 2016, the DCS program met its consolidation goals:
Mainframe. 100% consolidated into the two state data centers with full redundancy and tested disaster recovery capability. The consolidation replaced 14 mainframes with seven new machines.
Print-Mail. 100% consolidated providing high speed print and bulk mail technology, resulting in reduced postage rates. Annually, the program prints nearly 393 million images and mails nearly 56 million items.
Server. In July 2016, the DCS program achieved its end state goal for server consolidation. The goal of 75% of the designated agencies’ servers equates to almost 4,700 consolidated servers out of nearly 6,200 total servers in the DCS program. The remaining 25% of servers are anticipated to remain non-consolidated to optimize performance and/or cost for select applications. The DCS program also maintains a hardware refresh program to ensure the state’s assets remain current and supportable.
DocuSign Envelope ID: EE63AB8D-66DE-4943-9AB7-BF3CB6EAE20D
TEXAS DEPARTMENT OF INFORMATION RESOURCES | DCS CONSOLIDATION MEASUREMENT REPORT 12
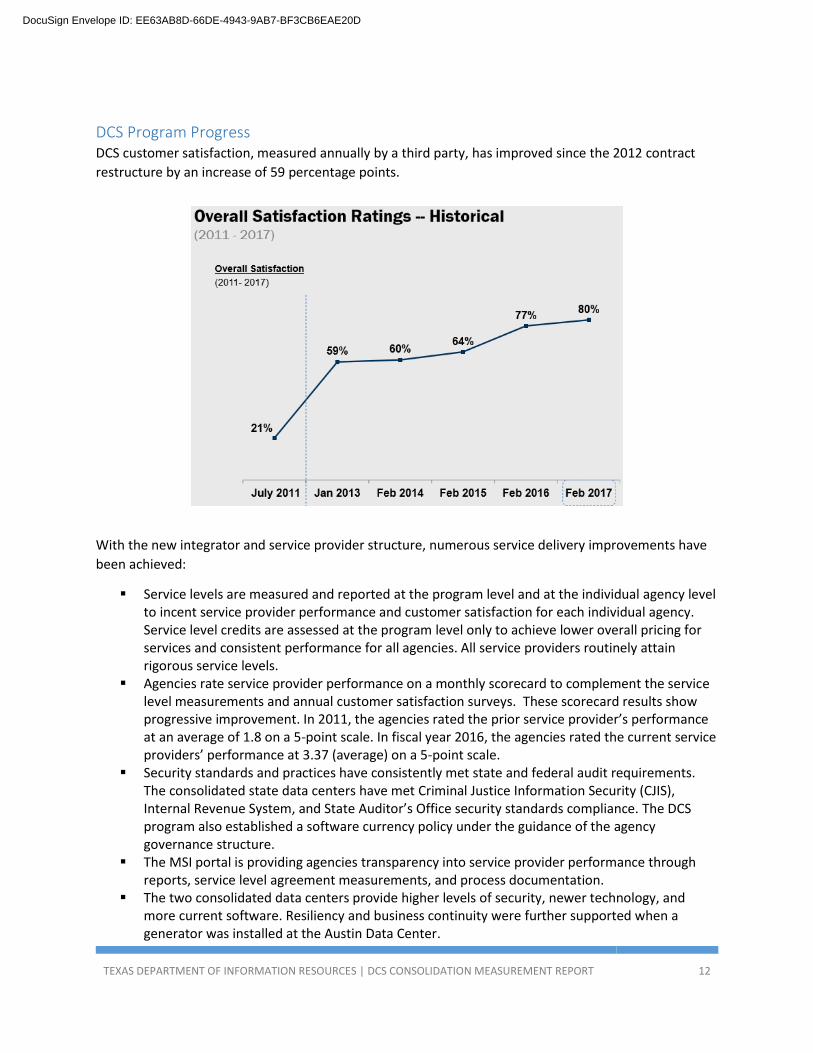
DCS Program Progress DCS customer satisfaction, measured annually by a third party, has improved since the 2012 contract
restructure by an increase of 59 percentage points.
With the new integrator and service provider structure, numerous service delivery improvements have
been achieved:
Service levels are measured and reported at the program level and at the individual agency level to incent service provider performance and customer satisfaction for each individual agency. Service level credits are assessed at the program level only to achieve lower overall pricing for services and consistent performance for all agencies. All service providers routinely attain rigorous service levels.
Agencies rate service provider performance on a monthly scorecard to complement the service level measurements and annual customer satisfaction surveys. These scorecard results show progressive improvement. In 2011, the agencies rated the prior service provider’s performance at an average of 1.8 on a 5-point scale. In fiscal year 2016, the agencies rated the current service providers’ performance at 3.37 (average) on a 5-point scale.
Security standards and practices have consistently met state and federal audit requirements. The consolidated state data centers have met Criminal Justice Information Security (CJIS), Internal Revenue System, and State Auditor’s Office security standards compliance. The DCS program also established a software currency policy under the guidance of the agency governance structure.
The MSI portal is providing agencies transparency into service provider performance through reports, service level agreement measurements, and process documentation.
The two consolidated data centers provide higher levels of security, newer technology, and more current software. Resiliency and business continuity were further supported when a generator was installed at the Austin Data Center.
DocuSign Envelope ID: EE63AB8D-66DE-4943-9AB7-BF3CB6EAE20D
TEXAS DEPARTMENT OF INFORMATION RESOURCES | DCS CONSOLIDATION MEASUREMENT REPORT 13
The Data Center Services program in 2016 also met modernization goals inherent in the consolidation initiative. The SAN storage environment went from 0% current in 2013 to 92% current in 2016. The mainframe operating system was upgraded and migrated to a virtual tape (meaning “tape-less”) environment. Server hardware achieved 82% currency and Server Operating System software achieved 75% currency, significant improvements since 2012.
Conclusion Per Texas Government Code 2054.062, DIR will prepare this Consolidation Measurement Report
annually. This annual report presents multiple views of the financial performance of the DCS program to
capture the complexity and dynamic nature of the program, while capturing the progress made towards
the consolidation program.
Achieving the 75% server consolidation target was a major accomplishment for the DCS program and
the state. DIR will continue to research and provide flexible and reliable data center services for its
designated and voluntary customers.
DocuSign Envelope ID: EE63AB8D-66DE-4943-9AB7-BF3CB6EAE20D

TEXAS DEPARTMENT OF INFORMATION RESOURCES | DCS CONSOLIDATION MEASUREMENT REPORT 14
Appendix A – Unit Rate Analysis Methodology2
Methodology An analysis framework and timeline were established in 2015 to meet the objectives of Government
Code Sec. 2054.062. The framework included establishing a working team that consisted of
representatives from the DIR, a representative from each of the DCS five (5) partner groups,
representing their agency members, a representative from DIR Internal Audit, and assistance from
Gartner, an independent third-party consulting firm.
Since this cost measurement effort is not an audit, the role of the DIR Internal Auditor was to provide
guidance and advice. Also, this effort was not intended to be a market price evaluation, but a
methodology to help address the mandate of Government Code Sec. 2054.062.
The methodology compares the actual enterprise and customer fiscal year 2017 invoiced volumes and
charges for services to a base rate. The base rate used represents the expected amount the enterprise
and customers are contractually obligated to pay for base volumes and is the basis for forecasting
expected expenditures. A comparison of the actual invoiced amounts against the base rate provides
one component of the financial performance assessment to help determine if DCS is meeting its
objectives.
Customers receive invoices from DIR for DCS services that are primarily (but not exclusively) rate-based.
“Rate-based service” refers to a service that has a base charge and base volume for each unit of
consumption. For instance, mainframe processing is a rate-based service. Mainframe is invoiced to
customers based on consumption of five rate-based services or Resource Units (RUs): CPU Hours, CPU
hours Specialty Engine, Allocated Application DASD, Application Tapes in Storage VTS, and Mainframe
Offsite Tape. Due to a technology change, Mainframe Offsite Tape services were not consumed after
December 2014. For each customer consuming mainframe services, their actual monthly charges are
based on the number of units consumed of each RU for a particular month.
For the unit rate analysis, the model takes into consideration approximately 46% (roughly $123 Million
out of $264.6 Million) of the total amount invoiced by DIR to its customers. The 46% includes the actual
invoiced amounts for rate-based services. The remaining 54% (approximately $143 Million) of the DCS
invoice charges do not have a base rate against which to compare, and thus were excluded for
comparative purposes. Additional information on included and excluded RUs is contained in the
Inclusion/Exclusion of Resource Units section below. The four main drivers for the increase in excluded
charges are:
1. Hardware Service Charge/Software Service Charge/Infrastructure and MAS Rate Card activity - $80M or 30% of FY17 actual charges. HSC/SSC are provided on a custom quote basis without vendor markup.
2. Enterprise Tape - $24M or 9% of FY17 actual charges 3. Transformation and Transition Charges - $15.4M or 6% of FY17 actual charges 4. Managed Application Development - $113k
2 Methodology and analysis provided by Gartner for DIR pursuant to DBITS Contract Number DIR-SDD-2042, Engagement 330024351.
DocuSign Envelope ID: EE63AB8D-66DE-4943-9AB7-BF3CB6EAE20D

TEXAS DEPARTMENT OF INFORMATION RESOURCES | DCS CONSOLIDATION MEASUREMENT REPORT 15
5. Optional and Services - $22.5M or 8% of FY17 actual charges At a customer summary level, this analysis considers the customer’s actual monthly invoice total compared to a calculated amount at the Base Rate. Actual invoiced amounts have variable rate adjustments depending on the actual program level consumption. If consumption is ahead of projections, the actual unit rate invoiced will be lower than the Base Rate. Conversely, if program consumption is lower than projected, the actual unit rate invoiced will be higher than the Base Rate.
Base Rates The DCS methodology team determined the fiscal year base rate provided the best basis from which to
make the comparison against actuals. The fiscal year base rates reflect initial contracted amounts
adjusted for actual variances observed during the consolidation effort. While these rates were
established at the current contract inception, they are modified on an annual basis based on
consolidation progresses. This methodology meets the requirement of Section 2054.062 (b):
The department shall use the data both in the department's initial cost
projections and in any later cost comparison.
The Base Rate used in this assessment is the average chargeback rate for the fiscal year (in this case
fiscal year 2017), excluding inflation factors (Economic Change Adjustment or ECA), for each resource
unit calculated by dividing the current year base charges (Attachment 4A of the contract) by the current
year base volumes (Attachment 4D of the current contract) for the service component providers (SCP)
and the Multi-sourcing Service Integrator (MSI) and then adding the MSI charges to the SCP rates
according to the current chargeback allocation methodology.
The formula for calculating the Base Rate is as follows:
(Base Charges from Attachment 4A / Base Volumes from Attachment 4-D) + MSI charges
Inclusion/Exclusion of Resource Units The methodology started with the premise that as much of the costs as possible would be included in
the analysis. There is a need to be able to make a valid comparison against an outcome to garner
meaning for the analysis. Some new RUs that did not have an initial fiscal year 2017 Base Rate, but
subsequently had a rate established (i.e., New Service RU), were included, in addition to all the Base
Rate RUs. For the New Service RUs, in lieu of the fiscal year 2017 Base Rate, the rate for first month the
RU was invoiced was used as its fiscal year 2017 Base Rate. These RUs include:
Remote File – Small (September 2016)
Remote File – Medium (September 2016)
Remote File – Large (September 2016)
Oracle Exadata Gold – Small (September 2016)
Oracle Exadata Gold – Medium (September 2016)
Oracle Exadata Gold – Large (January 2016)
Oracle Exadata Silver – Extra Small (September 2016)
Oracle Exadata Silver –Small (September 2016)
Oracle Exadata Silver –Medium (September 2016)
Oracle Exadata Silver – Large (September 2016)
Optional Additional Advanced Storage (September 2016)
DocuSign Envelope ID: EE63AB8D-66DE-4943-9AB7-BF3CB6EAE20D

TEXAS DEPARTMENT OF INFORMATION RESOURCES | DCS CONSOLIDATION MEASUREMENT REPORT 16
Additional O365 offerings
Examples of charges excluded from this assessment are software, hardware and optional services. The
excluded charges do not have Base Rates, or they may have a rate that does not fluctuate based on
volume. These RUs include but are not limited to:
Co-Location Services
Rate Card Services
Hardware Service Charges
Server Software Service Charges (New & Renewal)
Oracle Enterprise Exadata Service Charges
Mainframe Software Service Charge (New & Renewal)
Hardware Maintenance – DCS Customer Owned
Enterprise Tape
Transition & Transformation
Miscellaneous Charges
Optional Services
Public Cloud
Hybrid Cloud Server Services
Server Monitoring
Wide Area Network Services (WAAS/WAE)
Service Level Credits
Custom Waste Credit
Optional Print/Mail Services
DocuSign Envelope ID: EE63AB8D-66DE-4943-9AB7-BF3CB6EAE20D

TEXAS DEPARTMENT OF INFORMATION RESOURCES | DCS CONSOLIDATION MEASUREMENT REPORT 17
Appendix B – Detailed Unit Rate Analysis
Mainframe The Mainframe RU category is made up of four resource units, which include:
1. CPU Hours 2. CPU Hours Specialty Engine 3. Allocated Application DASD 4. Application Tapes in Storage VTS
Analysis: Mainframe CPU Hours, the largest invoicing RU in this grouping, was below the base volume
for 7 months in fiscal year 2017, resulting in an unfavorable variance for the year. Additionally,
allocated Application DASD RU showed an unfavorable result for the year. Actual consumption was
ahead of the fiscal year 2017 base volume estimates for CPU Hours Specialty Engine and Application
Tapes in Storage VTS for the entire year.
Overall analysis of the Mainframe RU category indicates mainframe processing was consumed less than
fiscal year 2016 primarily due to the reduction in CPU hours.
Print-Mail The Print-Mail RU category is made up of three resource units, which include:
1. Mail Insertions 2. Courier Services 3. Print Images
Analysis: All three RUs were below the base volume for most of the year. This reflects Customer
migrations away from paper-based workloads to automated technology solutions.
Overall analysis of the Print-Mail category indicates a slight decrease in consumption as compared to
fiscal year 2016.
Consolidated Server The Consolidated Server RU category is made of twenty-one resource units which include:
1. Consolidated Intel Gold 2. Consolidated Intel Silver 3. Consolidated Intel Bronze 4. Consolidated Unix Gold 5. Consolidated Unix Silver 6. Consolidated Unix Bronze 7. Enterprise File/Print 8. MO365 – Enterprise Cloud Suite 9. MO365 – Exchange Plan 1 10. MO365 – Exchange Plan 2 11. MO365 – Office Suite E1 12. MO365 – Office Suite G1
DocuSign Envelope ID: EE63AB8D-66DE-4943-9AB7-BF3CB6EAE20D

TEXAS DEPARTMENT OF INFORMATION RESOURCES | DCS CONSOLIDATION MEASUREMENT REPORT 18
13. MO365 – Kiosk Worker Plan 1 14. MO365 – Educational Workers A3 15. MO365 – Suite E3 16. MO365 – Suite G3 17. MO365 – Suite K1 18. Appliances 19. Remote File - Large 20. Remote File - Medium 21. Remote File - Small
Analysis: The Consolidated Server RUs showed a favorable variance triggered primarily by better than
estimated base volumes for most RUs. However, the individual RUs within this category show mixed
results.
For the Consolidated Intel Server categories (Gold, Silver, and Bronze), volumes were higher than the
base, resulting in favorable variances.
For Consolidated UNIX Servers, only Unix Bronze was ahead of volume expectations for all 12 months in
fiscal year 2017, resulting in a favorable variance. UNIX Silver and Gold RUs trended below base volumes
for most of the year, showing unfavorable variances.
Consolidated Server Storage & Offsite Tape The Consolidated Server Storage & Tape RU category is made of four resource units, which include:
1. Consolidated Tier 1 2. Consolidated Tier 2 3. Consolidated Tier 3 4. SVR Consolidated Offsite Tape
Analysis: Consolidated Server Storage & Tape had an overall favorable variance.
Consolidated Tier 1 and Tier 2 Storage volumes trended above expectations, showing favorable
variances. Consolidated Tier 3 Storage RU showed an unfavorable result for the year and Server
Consolidated Offsite Tape trended below the baseline with a large decrease in volumes at the end of the
year.
DBaaS (Database as a Service) The DBaaS RU category is made of eight resource units which include:
1. Oracle Exadata Gold – Small 2. Oracle Exadata Gold – Medium 3. Oracle Exadata Gold – Large 4. Oracle Exadata Silver – Extra Small 5. Oracle Exadata Silver – Small 6. Oracle Exadata Silver – Medium 7. Oracle Exadata Silver - Large 8. Optional Additional Advanced Storage
DocuSign Envelope ID: EE63AB8D-66DE-4943-9AB7-BF3CB6EAE20D
TEXAS DEPARTMENT OF INFORMATION RESOURCES | DCS CONSOLIDATION MEASUREMENT REPORT 19
Analysis: Volumes were relatively low and actual charges did not vary greatly compared to base charges.
DbaaS volumes continue to grow based on DCS Customer demand with a 67% increase in usage as
compared to fiscal year 2016.
Non-Consolidated Servers The Non-Consolidated Servers RU category is made of seven resource units. Those include:
1. Non-Consolidated Intel Gold 2. Non-Consolidated Intel Silver 3. Non-Consolidated Intel Bronze 4. Non-Consolidated Unix Gold 5. Non-Consolidated Unix Silver 6. Non-Consolidated Unix Bronze 7. Non-Consolidated SCCM (System Center Configuration Manager)
Analysis: Non-Consolidated Intel Silver and Bronze server volumes began the year significantly higher
than contract base volumes, trended downward throughout the year, but still ended slightly above
expectations resulting in a favorable FY variance.
Non-Consolidated Unix Silver RUs experienced a similar trend and favorable variance. Non-Consolidated
Unix Gold and Bronze both began and ended the year below expected volumes producing a slightly
unfavorable variance.
Non-Consolidated Server Storage & Offsite Tape The Non-Consolidated Server Storage & Tape RU category is made of two resource units. Those include:
1. Non-Consolidated Dedicated and Shared 2. SVR Non-Consolidated Offsite Tape
Analysis: Non-Consolidated Server Storage & Offsite Tape had an overall favorable variance. Non-
Consolidated Dedicated and Shared showed favorable variances because volumes were significantly
higher than base volumes. SVR Non-Consolidated Offsite Tape showed unfavorable variance due to
lower volumes than expected; these volumes decreased significantly during the fiscal year.
DocuSign Envelope ID: EE63AB8D-66DE-4943-9AB7-BF3CB6EAE20D

TEXAS DEPARTMENT OF INFORMATION RESOURCES | DCS CONSOLIDATION MEASUREMENT REPORT 20
Appendix C – Designated DCS Customer Analysis3
Department of Aging and Disability Services (DADS) The tables below provide different views of agency performance.
The first view is fiscal year 2017 Appropriation versus actuals with a variance. A positive variance for
this view indicates the agency’s actual spend was less than the fiscal year 2017 Appropriations amount
and a negative variance indicates the actual spend was more than the initial fiscal year 2017
Appropriation, excluding any fiscal year 2016 carry-forward balance. Subject to the limitations
contained within the General Appropriations Act, Article IX, Sec. 14.03, agencies have varying levels of
authority to address amounts spent in excess or less than the individual DCS capital budget line item
amounts.
Fiscal Year 2017 Actuals
Rate Based Resource Unit-Included $4,213,200
Rate Based Resource Unit-Excluded $434,421
HSC/SSC/Rate Card-Excluded $382,295
Transition and Transformation $433,380
Other Credits-Excluded $0
TOTAL: $5,463,296
FY17 INITIAL APPROPRIATION: $9,218,023
VARIANCE: $3,754,727
Note: See the Inclusion/Exclusion of Resource Units in Appendix A and Appendix B of this report for
additional information related to costs/volumes included and excluded from the Unit Rate Analysis
below.
The second view provides a summary of results for each of the RUs included within the Unit Rate
Analysis Methodology defined and described within this report. These results are specific to the
Department of Aging and Disability Services and do not include any recovery fees that are seen in the
agency invoices. A positive variance for this view indicates the agency financially benefited from unit
rates that were lower than the base rate (essentially a larger volume discount than anticipated), while a
negative variance reflects unit rates higher than base rates (essentially a smaller volume discount than
anticipated).
Summary by RU Group DADS
Mainframe $0
Print - Mail $0
Consolidated Server $52,729
Non-Consolidated Server $96,801
Consolidated Server Storage & Tape $70,601
Non-Consolidated Server Storage & Tape $102,006
DBaaS $2,390
DADS Net Posture of Summary RU Results $324,526
3 Methodology and analyses provided by Gartner for DIR pursuant to DBITS Contract Number DIR-SDD-2042, Engagement 330024351.
DocuSign Envelope ID: EE63AB8D-66DE-4943-9AB7-BF3CB6EAE20D

TEXAS DEPARTMENT OF INFORMATION RESOURCES | DCS CONSOLIDATION MEASUREMENT REPORT 21
Department of Family and Protective Services (DFPS) The tables below provide different views of agency performance.
The first view is fiscal year 2017 Appropriation versus actuals with a variance. A positive variance for
this view indicates the agency’s actual spend was less than the fiscal year 2017 Appropriations amount
and a negative variance indicates the actual spend was more than the initial fiscal year 2017
Appropriation, excluding any fiscal year 2016 carry-forward balance. Subject to the limitations
contained within the General Appropriations Act, Article IX, Sec. 14.03, agencies have varying levels of
authority to address amounts spent in excess or less than the individual DCS capital budget line item
amounts.
Fiscal Year 2017 Actuals
Rate Based Resource Unit-Included $2,885,677
Rate Based Resource Unit-Excluded $4,952,599
HSC/SSC/Rate Card-Excluded $157,338
Transition and Transformation $388,228
Other Credits-Excluded $0
TOTAL: $8,383,842
TOTAL FY17 APPROPRIATION: $6,188,796
VARIANCE: ($2,195,046)
Note: See the Inclusion/Exclusion of Resource Units in Appendix A and Appendix B of this report for
additional information related to costs/volumes included and excluded from the Unit Rate Analysis
below.
The second view provides a summary of results for each of the RUs included within the Unit Rate
Analysis Methodology defined and described within this report. These results are specific to the
Department of Family and Protective Services and do not include any recovery fees that are seen in the
agency invoices. A positive variance for this view indicates the agency financially benefited from unit
rates that were lower than the base rate (essentially a larger volume discount than anticipated), while a
negative variance reflects unit rates higher than base rates (essentially a smaller volume discount than
anticipated).
Summary by RU Group DFPS
Mainframe $0
Print - Mail $0
Consolidated Server ($96,196)
Non-Consolidated Server $8,737
Consolidated Server Storage & Tape ($13,912)
Non-Consolidated Server Storage & Tape $4,826
DBaaS $0
DFPS Net Posture of Summary RU Results ($96,544)
DocuSign Envelope ID: EE63AB8D-66DE-4943-9AB7-BF3CB6EAE20D

TEXAS DEPARTMENT OF INFORMATION RESOURCES | DCS CONSOLIDATION MEASUREMENT REPORT 22
Department of Information Resources - Agency (DIR-A) The tables below provide different views of agency performance.
The first view is fiscal year 2017 Appropriation versus actuals with a variance. A positive variance for
this view indicates the agency’s actual spend was less than the fiscal year 2017 Appropriations amount
and a negative variance indicates the actual spend was more than the initial fiscal year 2017
Appropriation, excluding any fiscal year 2016 carry-forward balance. Subject to the limitations
contained within the General Appropriations Act, Article IX, Sec. 14.03, agencies have varying levels of
authority to address amounts spent in excess or less than the individual DCS capital budget line item
amounts.
Fiscal Year 2017 Actuals
Rate Based Resource Unit-Included $594,829
Rate Based Resource Unit-Excluded $628
HSC/SSC/Rate Card-Excluded $335,331
Transition and Transformation $112,358
Other Credits-Excluded $0
TOTAL: $1,043,146
FY17 INITIAL APPROPRIATION: $1,020,024
VARIANCE: ($23,122)
Note: See the Inclusion/Exclusion of Resource Units in Appendix A and Appendix B of this report for
additional information related to costs/volumes included and excluded from the Unit Rate Analysis
below.
The second view provides a summary of results for each of the RUs included within the Unit Rate
Analysis Methodology defined and described within this report. These results are specific to the
Department of Information Resources - Agency and do not include any recovery fees that are seen in the
agency invoices. A positive variance for this view indicates the agency financially benefited from unit
rates that were lower than the base rate (essentially a larger volume discount than anticipated), while a
negative variance reflects unit rates higher than base rates (essentially a smaller volume discount than
anticipated).
Summary by RU Group DIR-A
Mainframe $0
Print - Mail $0
Consolidated Server $5,357
Non-Consolidated Server $0
Consolidated Server Storage & Tape $31,431
Non-Consolidated Server Storage & Tape $0
DBaaS $523
DIR-A Net Posture of Summary RU Results $37,312
DocuSign Envelope ID: EE63AB8D-66DE-4943-9AB7-BF3CB6EAE20D

TEXAS DEPARTMENT OF INFORMATION RESOURCES | DCS CONSOLIDATION MEASUREMENT REPORT 23
Department of Information Resources - Texas.gov The tables below provide different views of agency performance.
The first view is fiscal year 2017 Appropriation versus actuals with a variance. A positive variance for
this view indicates the agency’s actual spend was less than the fiscal year 2017 Appropriations amount
and a negative variance indicates the actual spend was more than the initial fiscal year 2017
Appropriation, excluding any fiscal year 2016 carry-forward balance. Subject to the limitations
contained within the General Appropriations Act, Article IX, Sec. 14.03, agencies have varying levels of
authority to address amounts spent in excess or less than the individual DCS capital budget line item
amounts.
Fiscal Year 2017 Actuals
Rate Based Resource Unit-Included $1,483,930
Rate Based Resource Unit-Excluded $523,847
HSC/SSC/Rate Card-Excluded $153,443
Transition and Transformation $338,574
Other Credits-Excluded $0
TOTAL: $2,499,795
FY17 INITIAL APPROPRIATION: $2,559,730
VARIANCE: $59,935
Note: See the Inclusion/Exclusion of Resource Units in Appendix A and Appendix B of this report for
additional information related to costs/volumes included and excluded from the Unit Rate Analysis
below.
The second view provides a summary of results for each of the RUs included within the Unit Rate
Analysis Methodology defined and described within this report. These results are specific to the DIR-
Texas.gov and do not include any recovery fees that are seen in the agency invoices. A positive variance
for this view indicates the agency financially benefited from unit rates that were lower than the base
rate (essentially a larger volume discount than anticipated), while a negative variance reflects unit rates
higher than base rates (essentially a smaller volume discount than anticipated).
Summary by RU Group Texas.gov
Mainframe $0
Print - Mail $0
Consolidated Server ($196,097)
Non-Consolidated Server $0
Consolidated Server Storage & Tape $32,987
Non-Consolidated Server Storage & Tape $0
DBaaS $0
Texas.gov Net Posture of Summary RU Results
($163,110)
DocuSign Envelope ID: EE63AB8D-66DE-4943-9AB7-BF3CB6EAE20D

TEXAS DEPARTMENT OF INFORMATION RESOURCES | DCS CONSOLIDATION MEASUREMENT REPORT 24
Department of State Health Services (DSHS) The tables below provide different views of agency performance.
The first view is fiscal year 2017 Appropriation versus actuals with a variance. A positive variance for
this view indicates the agency’s actual spend was less than the fiscal year 2017 Appropriations amount
and a negative variance indicates the actual spend was more than the initial fiscal year 2017
Appropriation, excluding any fiscal year 2016 carry-forward balance. Subject to the limitations
contained within the General Appropriations Act, Article IX, Sec. 14.03, agencies have varying levels of
authority to address amounts spent in excess or less than the individual DCS capital budget line item
amounts.
Fiscal Year 2017 Actuals
Rate Based Resource Unit-Included $8,338,445
Rate Based Resource Unit-Excluded $3,703,057
HSC/SSC/Rate Card-Excluded $7,565,902
Transition and Transformation $1,750,030
Other Credits-Excluded $0
TOTAL: $21,357,434
FY17 INITIAL APPROPRIATION: $18,397,843
VARIANCE: ($2,959,591)
Note: See the Inclusion/Exclusion of Resource Units in Appendix A and Appendix B of this report for
additional information related to costs/volumes included and excluded from the Unit Rate Analysis
below.
The second view provides a summary of results for each of the RUs included within the Unit Rate
Analysis Methodology defined and described within this report. These results are specific to the
Department of State Health Services and do not include any recovery fees that are seen in the agency
invoices. A positive variance for this view indicates the agency financially benefited from unit rates that
were lower than the base rate (essentially a larger volume discount than anticipated), while a negative
variance reflects unit rates higher than base rates (essentially a smaller volume discount than
anticipated).
Summary by RU Group DSHS
Mainframe $0
Print - Mail ($331)
Consolidated Server $97,404
Non-Consolidated Server $436,289
Consolidated Server Storage & Tape $101,731
Non-Consolidated Server Storage & Tape $505,378
DBaaS $148
DSHS Net Posture of Summary RU Results $1,140,619
DocuSign Envelope ID: EE63AB8D-66DE-4943-9AB7-BF3CB6EAE20D
TEXAS DEPARTMENT OF INFORMATION RESOURCES | DCS CONSOLIDATION MEASUREMENT REPORT 25
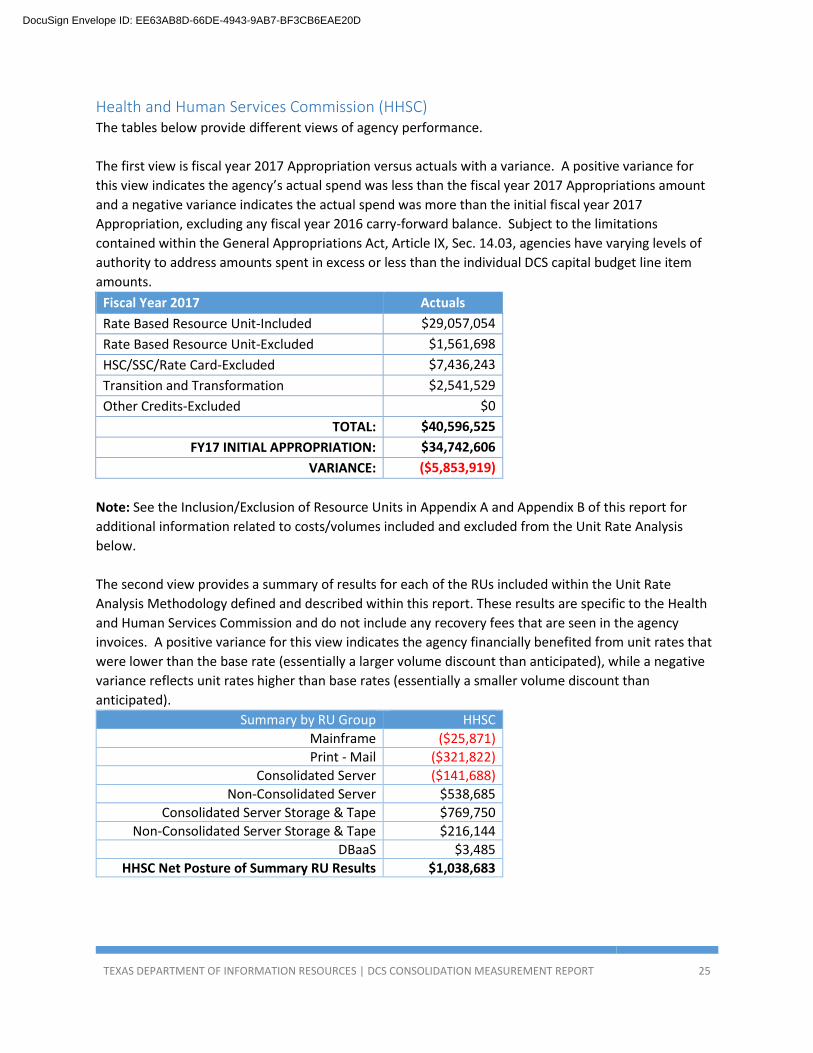
Health and Human Services Commission (HHSC) The tables below provide different views of agency performance.
The first view is fiscal year 2017 Appropriation versus actuals with a variance. A positive variance for
this view indicates the agency’s actual spend was less than the fiscal year 2017 Appropriations amount
and a negative variance indicates the actual spend was more than the initial fiscal year 2017
Appropriation, excluding any fiscal year 2016 carry-forward balance. Subject to the limitations
contained within the General Appropriations Act, Article IX, Sec. 14.03, agencies have varying levels of
authority to address amounts spent in excess or less than the individual DCS capital budget line item
amounts.
Fiscal Year 2017 Actuals
Rate Based Resource Unit-Included $29,057,054
Rate Based Resource Unit-Excluded $1,561,698
HSC/SSC/Rate Card-Excluded $7,436,243
Transition and Transformation $2,541,529
Other Credits-Excluded $0
TOTAL: $40,596,525
FY17 INITIAL APPROPRIATION: $34,742,606
VARIANCE: ($5,853,919)
Note: See the Inclusion/Exclusion of Resource Units in Appendix A and Appendix B of this report for
additional information related to costs/volumes included and excluded from the Unit Rate Analysis
below.
The second view provides a summary of results for each of the RUs included within the Unit Rate
Analysis Methodology defined and described within this report. These results are specific to the Health
and Human Services Commission and do not include any recovery fees that are seen in the agency
invoices. A positive variance for this view indicates the agency financially benefited from unit rates that
were lower than the base rate (essentially a larger volume discount than anticipated), while a negative
variance reflects unit rates higher than base rates (essentially a smaller volume discount than
anticipated).
Summary by RU Group HHSC
Mainframe ($25,871)
Print - Mail ($321,822)
Consolidated Server ($141,688)
Non-Consolidated Server $538,685
Consolidated Server Storage & Tape $769,750
Non-Consolidated Server Storage & Tape $216,144
DBaaS $3,485
HHSC Net Posture of Summary RU Results $1,038,683
DocuSign Envelope ID: EE63AB8D-66DE-4943-9AB7-BF3CB6EAE20D

TEXAS DEPARTMENT OF INFORMATION RESOURCES | DCS CONSOLIDATION MEASUREMENT REPORT 26
DocuSign Envelope ID: EE63AB8D-66DE-4943-9AB7-BF3CB6EAE20D

TEXAS DEPARTMENT OF INFORMATION RESOURCES | DCS CONSOLIDATION MEASUREMENT REPORT 27
Health Professions Council (HPC) The tables below provide different views of agency performance.
The first view is fiscal year 2017 Appropriation versus actuals with a variance. A positive variance for
this view indicates the agency’s actual spend was less than the fiscal year 2017 Appropriations amount
and a negative variance indicates the actual spend was more than the initial fiscal year 2017
Appropriation, excluding any fiscal year 2016 carry-forward balance. Subject to the limitations
contained within the General Appropriations Act, Article IX, Sec. 14.03, agencies have varying levels of
authority to address amounts spent in excess or less than the individual DCS capital budget line item
amounts.
Fiscal Year 2017 Actuals
Rate Based Resource Unit-Included $202
Rate Based Resource Unit-Excluded ($0)
HSC/SSC/Rate Card-Excluded $141,297
Transition and Transformation $0
Other Credits-Excluded $0
TOTAL: $141,499
FY17 INITIAL APPROPRIATION: $100,239
VARIANCE: ($41,261)
Note: See the Inclusion/Exclusion of Resource Units in Appendix A and Appendix B of this report for
additional information related to costs/volumes included and excluded from the Unit Rate Analysis
below.
The second view provides a summary of results for each of the RUs included within the Unit Rate
Analysis Methodology defined and described within this report. These results are specific to the Health
Professions Council and do not include any recovery fees that are seen in the agency invoices. A positive
variance for this view indicates the agency financially benefited from unit rates that were lower than the
base rate (essentially a larger volume discount than anticipated), while a negative variance reflects unit
rates higher than base rates (essentially a smaller volume discount than anticipated).
Summary by RU Group HPC
Mainframe $0
Print - Mail $0
Consolidated Server $0
Non-Consolidated Server $0
Consolidated Server Storage & Tape ($156)
Non-Consolidated Server Storage & Tape $0
DBaaS $0
HPC Net Posture of Summary RU Results ($156)
DocuSign Envelope ID: EE63AB8D-66DE-4943-9AB7-BF3CB6EAE20D

TEXAS DEPARTMENT OF INFORMATION RESOURCES | DCS CONSOLIDATION MEASUREMENT REPORT 28
Office of the Attorney General – Administration & Legal Division (OAG-AL) The tables below provide different views of agency performance.
The first view is fiscal year 2017 Appropriation versus actuals with a variance. A positive variance for
this view indicates the agency’s actual spend was less than the fiscal year 2017 Appropriations amount
and a negative variance indicates the actual spend was more than the initial fiscal year 2017
Appropriation, excluding any fiscal year 2016 carry-forward balance. Subject to the limitations
contained within the General Appropriations Act, Article IX, Sec. 14.03, agencies have varying levels of
authority to address amounts spent in excess or less than the individual DCS capital budget line item
amounts.
Fiscal Year 2017 Actuals
Rate Based Resource Unit-Included $2,471,178
Rate Based Resource Unit-Excluded ($46,564)
HSC/SSC/Rate Card-Excluded $1,049,737
Transition and Transformation $346,462
Other Credits-Excluded $0
TOTAL: $3,820,813
FY17 INITIAL APPROPRIATION: $4,112,099
VARIANCE: $291,286
Note: See the Inclusion/Exclusion of Resource Units in Appendix A and Appendix B of this report for
additional information related to costs/volumes included and excluded from the Unit Rate Analysis
below.
The second view provides a summary of results for each of the RUs included within the Unit Rate
Analysis Methodology defined and described within this report. These results are specific to the Office
of the Attorney General - Administrative & Legal Division and do not include any recovery fees that are
seen in the agency invoices. A positive variance for this view indicates the agency financially benefited
from unit rates that were lower than the base rate (essentially a larger volume discount than
anticipated), while a negative variance reflects unit rates higher than base rates (essentially a smaller
volume discount than anticipated).
Summary by RU Group OAG-AL
Mainframe $0
Print - Mail ($5,157)
Consolidated Server ($25,990)
Non-Consolidated Server $28,450
Consolidated Server Storage & Tape $125,606
Non-Consolidated Server Storage & Tape $104,612
DBaaS $72,660
OAG-AL Net Posture of Summary RU Results $300,181
DocuSign Envelope ID: EE63AB8D-66DE-4943-9AB7-BF3CB6EAE20D
TEXAS DEPARTMENT OF INFORMATION RESOURCES | DCS CONSOLIDATION MEASUREMENT REPORT 29
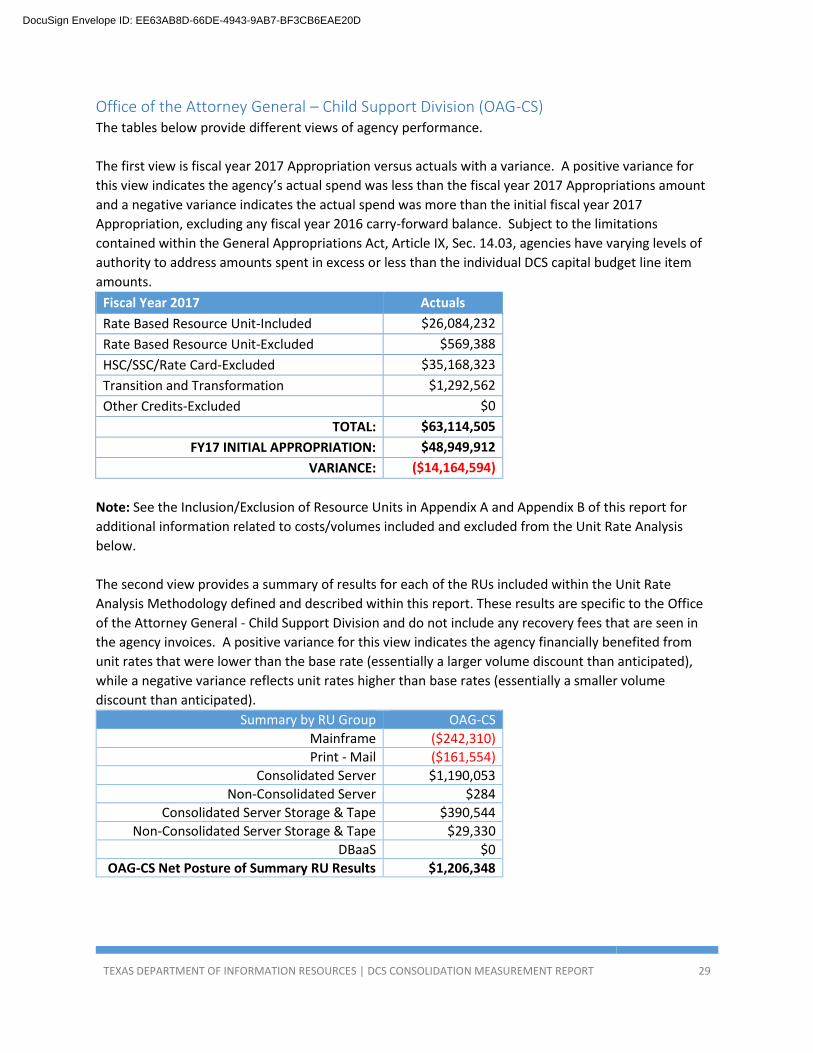
Office of the Attorney General – Child Support Division (OAG-CS) The tables below provide different views of agency performance.
The first view is fiscal year 2017 Appropriation versus actuals with a variance. A positive variance for
this view indicates the agency’s actual spend was less than the fiscal year 2017 Appropriations amount
and a negative variance indicates the actual spend was more than the initial fiscal year 2017
Appropriation, excluding any fiscal year 2016 carry-forward balance. Subject to the limitations
contained within the General Appropriations Act, Article IX, Sec. 14.03, agencies have varying levels of
authority to address amounts spent in excess or less than the individual DCS capital budget line item
amounts.
Fiscal Year 2017 Actuals
Rate Based Resource Unit-Included $26,084,232
Rate Based Resource Unit-Excluded $569,388
HSC/SSC/Rate Card-Excluded $35,168,323
Transition and Transformation $1,292,562
Other Credits-Excluded $0
TOTAL: $63,114,505
FY17 INITIAL APPROPRIATION: $48,949,912
VARIANCE: ($14,164,594)
Note: See the Inclusion/Exclusion of Resource Units in Appendix A and Appendix B of this report for
additional information related to costs/volumes included and excluded from the Unit Rate Analysis
below.
The second view provides a summary of results for each of the RUs included within the Unit Rate
Analysis Methodology defined and described within this report. These results are specific to the Office
of the Attorney General - Child Support Division and do not include any recovery fees that are seen in
the agency invoices. A positive variance for this view indicates the agency financially benefited from
unit rates that were lower than the base rate (essentially a larger volume discount than anticipated),
while a negative variance reflects unit rates higher than base rates (essentially a smaller volume
discount than anticipated).
Summary by RU Group OAG-CS
Mainframe ($242,310)
Print - Mail ($161,554)
Consolidated Server $1,190,053
Non-Consolidated Server $284
Consolidated Server Storage & Tape $390,544
Non-Consolidated Server Storage & Tape $29,330
DBaaS $0
OAG-CS Net Posture of Summary RU Results $1,206,348
DocuSign Envelope ID: EE63AB8D-66DE-4943-9AB7-BF3CB6EAE20D

TEXAS DEPARTMENT OF INFORMATION RESOURCES | DCS CONSOLIDATION MEASUREMENT REPORT 30
Public Utility Commission (PUC) The tables below provide different views of agency performance.
The first view is fiscal year 2017 Appropriation versus actuals with a variance. A positive variance for
this view indicates the agency’s actual spend was less than the fiscal year 2017 Appropriations amount
and a negative variance indicates the actual spend was more than the initial fiscal year 2017
Appropriation, excluding any fiscal year 2016 carry-forward balance. Subject to the limitations
contained within the General Appropriations Act, Article IX, Sec. 14.03, agencies have varying levels of
authority to address amounts spent in excess or less than the individual DCS capital budget line item
amounts.
Fiscal Year 2017 Actuals
Rate Based Resource Unit-Included $246,820
Rate Based Resource Unit-Excluded $16,806
HSC/SSC/Rate Card-Excluded $20,317
Transition and Transformation $59,702
Other Credits-Excluded $0
TOTAL: $343,645
FY17 INITIAL APPROPRIATION: $436,168
VARIANCE: $92,523
Note: See the Inclusion/Exclusion of Resource Units in Appendix A and Appendix B of this report for
additional information related to costs/volumes included and excluded from the Unit Rate Analysis
below.
The second view provides a summary of results for each of the RUs included within the Unit Rate
Analysis Methodology defined and described within this report. These results are specific to the Public
Utility Commission and do not include any recovery fees that are seen in the agency invoices. A positive
variance for this view indicates the agency financially benefited from unit rates that were lower than the
base rate (essentially a larger volume discount than anticipated), while a negative variance reflects unit
rates higher than base rates (essentially a smaller volume discount than anticipated).
Summary by RU Group PUC
Mainframe $0
Print - Mail $0
Consolidated Server $10,101
Non-Consolidated Server ($1,947)
Consolidated Server Storage & Tape $4,420
Non-Consolidated Server Storage & Tape $1,144
DBaaS $0
PUC Net Posture of Summary RU Results $13,718
DocuSign Envelope ID: EE63AB8D-66DE-4943-9AB7-BF3CB6EAE20D

TEXAS DEPARTMENT OF INFORMATION RESOURCES | DCS CONSOLIDATION MEASUREMENT REPORT 31
Railroad Commission of Texas (RRC) The tables below provide different views of agency performance.
The first view is fiscal year 2017 Appropriation versus actuals with a variance. A positive variance for
this view indicates the agency’s actual spend was less than the fiscal year 2017 Appropriations amount
and a negative variance indicates the actual spend was more than the initial fiscal year 2017
Appropriation, excluding any fiscal year 2016 carry-forward balance. Subject to the limitations
contained within the General Appropriations Act, Article IX, Sec. 14.03, agencies have varying levels of
authority to address amounts spent in excess or less than the individual DCS capital budget line item
amounts.
Fiscal Year 2017 Actuals
Rate Based Resource Unit-Included $2,203,032
Rate Based Resource Unit-Excluded $99,177
HSC/SSC/Rate Card-Excluded $3,857,263
Transition and Transformation $370,376
Other Credits-Excluded $0
TOTAL: $6,529,848
FY17 INITIAL APPROPRIATION: $8,697,203
VARIANCE: $2,167,355
Note: See the Inclusion/Exclusion of Resource Units in Appendix A and Appendix B of this report for
additional information related to costs/volumes included and excluded from the Unit Rate Analysis
below.
The second view provides a summary of results for each of the RUs included within the Unit Rate
Analysis Methodology defined and described within this report. These results are specific to the Railroad
Commission of Texas and do not include any recovery fees that are seen in the agency invoices. A
positive variance for this view indicates the agency financially benefited from unit rates that were lower
than the base rate (essentially a larger volume discount than anticipated), while a negative variance
reflects unit rates higher than base rates (essentially a smaller volume discount than anticipated).
Summary by RU Group RRC
Mainframe ($6,409)
Print - Mail ($18,918)
Consolidated Server $30,309
Non-Consolidated Server $102,833
Consolidated Server Storage & Tape $34,036
Non-Consolidated Server Storage & Tape $2,500
DBaaS $0
RRC Net Posture of Summary RU Results $144,350
DocuSign Envelope ID: EE63AB8D-66DE-4943-9AB7-BF3CB6EAE20D
TEXAS DEPARTMENT OF INFORMATION RESOURCES | DCS CONSOLIDATION MEASUREMENT REPORT 32
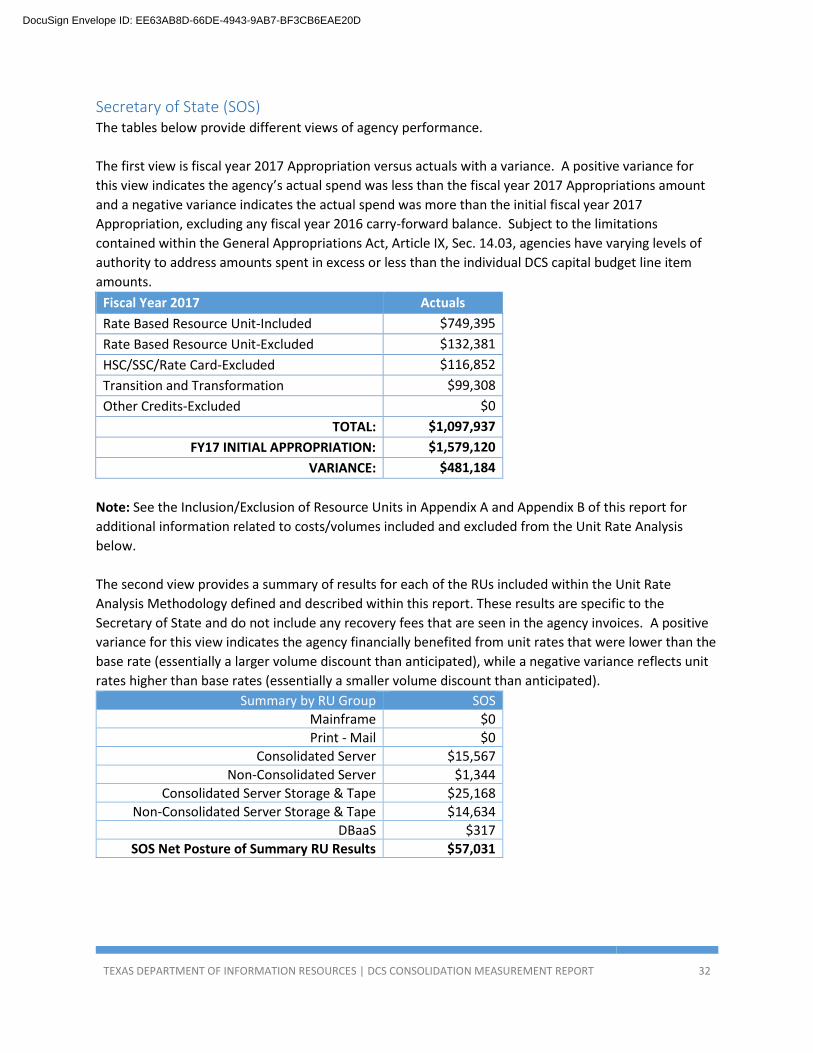
Secretary of State (SOS) The tables below provide different views of agency performance.
The first view is fiscal year 2017 Appropriation versus actuals with a variance. A positive variance for
this view indicates the agency’s actual spend was less than the fiscal year 2017 Appropriations amount
and a negative variance indicates the actual spend was more than the initial fiscal year 2017
Appropriation, excluding any fiscal year 2016 carry-forward balance. Subject to the limitations
contained within the General Appropriations Act, Article IX, Sec. 14.03, agencies have varying levels of
authority to address amounts spent in excess or less than the individual DCS capital budget line item
amounts.
Fiscal Year 2017 Actuals
Rate Based Resource Unit-Included $749,395
Rate Based Resource Unit-Excluded $132,381
HSC/SSC/Rate Card-Excluded $116,852
Transition and Transformation $99,308
Other Credits-Excluded $0
TOTAL: $1,097,937
FY17 INITIAL APPROPRIATION: $1,579,120
VARIANCE: $481,184
Note: See the Inclusion/Exclusion of Resource Units in Appendix A and Appendix B of this report for
additional information related to costs/volumes included and excluded from the Unit Rate Analysis
below.
The second view provides a summary of results for each of the RUs included within the Unit Rate
Analysis Methodology defined and described within this report. These results are specific to the
Secretary of State and do not include any recovery fees that are seen in the agency invoices. A positive
variance for this view indicates the agency financially benefited from unit rates that were lower than the
base rate (essentially a larger volume discount than anticipated), while a negative variance reflects unit
rates higher than base rates (essentially a smaller volume discount than anticipated).
Summary by RU Group SOS
Mainframe $0
Print - Mail $0
Consolidated Server $15,567
Non-Consolidated Server $1,344
Consolidated Server Storage & Tape $25,168
Non-Consolidated Server Storage & Tape $14,634
DBaaS $317
SOS Net Posture of Summary RU Results $57,031
DocuSign Envelope ID: EE63AB8D-66DE-4943-9AB7-BF3CB6EAE20D
TEXAS DEPARTMENT OF INFORMATION RESOURCES | DCS CONSOLIDATION MEASUREMENT REPORT 33
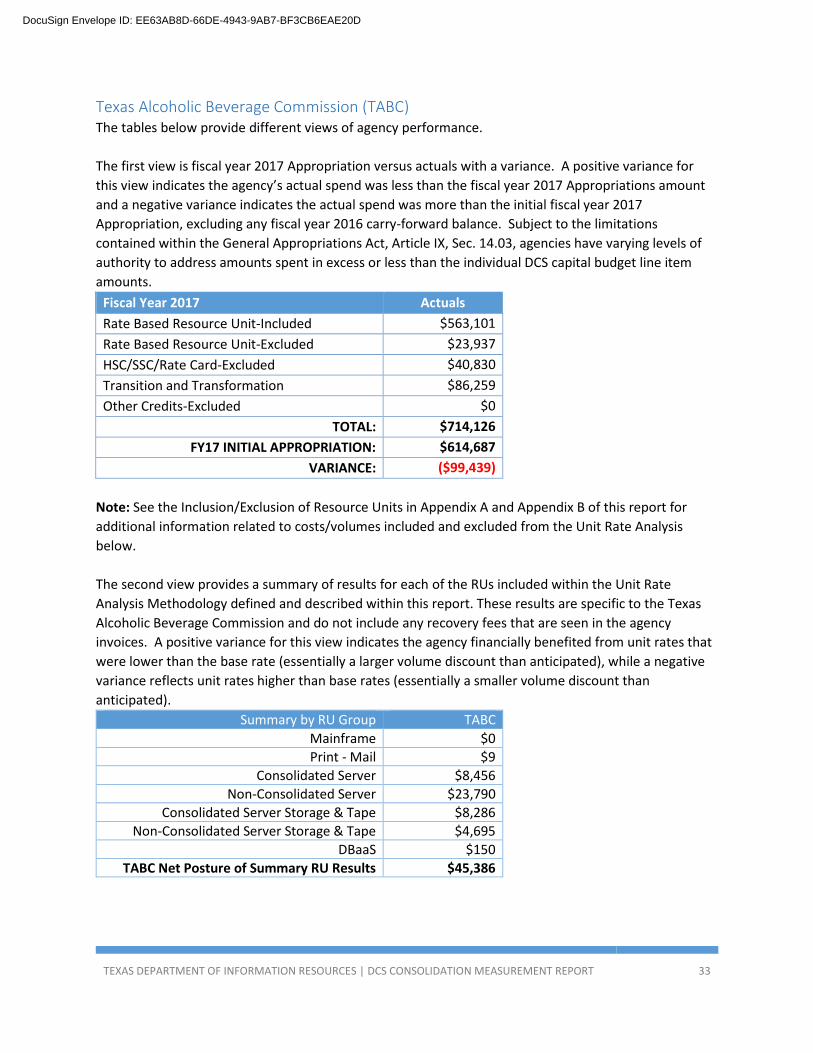
Texas Alcoholic Beverage Commission (TABC) The tables below provide different views of agency performance.
The first view is fiscal year 2017 Appropriation versus actuals with a variance. A positive variance for
this view indicates the agency’s actual spend was less than the fiscal year 2017 Appropriations amount
and a negative variance indicates the actual spend was more than the initial fiscal year 2017
Appropriation, excluding any fiscal year 2016 carry-forward balance. Subject to the limitations
contained within the General Appropriations Act, Article IX, Sec. 14.03, agencies have varying levels of
authority to address amounts spent in excess or less than the individual DCS capital budget line item
amounts.
Fiscal Year 2017 Actuals
Rate Based Resource Unit-Included $563,101
Rate Based Resource Unit-Excluded $23,937
HSC/SSC/Rate Card-Excluded $40,830
Transition and Transformation $86,259
Other Credits-Excluded $0
TOTAL: $714,126
FY17 INITIAL APPROPRIATION: $614,687
VARIANCE: ($99,439)
Note: See the Inclusion/Exclusion of Resource Units in Appendix A and Appendix B of this report for
additional information related to costs/volumes included and excluded from the Unit Rate Analysis
below.
The second view provides a summary of results for each of the RUs included within the Unit Rate
Analysis Methodology defined and described within this report. These results are specific to the Texas
Alcoholic Beverage Commission and do not include any recovery fees that are seen in the agency
invoices. A positive variance for this view indicates the agency financially benefited from unit rates that
were lower than the base rate (essentially a larger volume discount than anticipated), while a negative
variance reflects unit rates higher than base rates (essentially a smaller volume discount than
anticipated).
Summary by RU Group TABC
Mainframe $0
Print - Mail $9
Consolidated Server $8,456
Non-Consolidated Server $23,790
Consolidated Server Storage & Tape $8,286
Non-Consolidated Server Storage & Tape $4,695
DBaaS $150
TABC Net Posture of Summary RU Results $45,386
DocuSign Envelope ID: EE63AB8D-66DE-4943-9AB7-BF3CB6EAE20D

TEXAS DEPARTMENT OF INFORMATION RESOURCES | DCS CONSOLIDATION MEASUREMENT REPORT 34
Texas Commission on Environmental Quality (TCEQ) The tables below provide different views of agency performance.
The first view is fiscal year 2017 Appropriation versus actuals with a variance. A positive variance for
this view indicates the agency’s actual spend was less than the fiscal year 2017 Appropriations amount
and a negative variance indicates the actual spend was more than the initial fiscal year 2017
Appropriation, excluding any fiscal year 2016 carry-forward balance. Subject to the limitations
contained within the General Appropriations Act, Article IX, Sec. 14.03, agencies have varying levels of
authority to address amounts spent in excess or less than the individual DCS capital budget line item
amounts.
Fiscal Year 2017 Actuals
Rate Based Resource Unit-Included $5,338,470
Rate Based Resource Unit-Excluded $12,729
HSC/SSC/Rate Card-Excluded $4,119,136
Transition and Transformation $1,073,924
Other Credits-Excluded $0
TOTAL: $10,544,260
FY17 INITIAL APPROPRIATION: $12,122,879
VARIANCE: $1,578,619
Note: See the Inclusion/Exclusion of Resource Units in Appendix A and Appendix B of this report for
additional information related to costs/volumes included and excluded from the Unit Rate Analysis
below.
The second view provides a summary of results for each of the RUs included within the Unit Rate
Analysis Methodology defined and described within this report. These results are specific to the Texas
Commission on Environmental Quality and do not include any recovery fees that are seen in the agency
invoices. A positive variance for this view indicates the agency financially benefited from unit rates that
were lower than the base rate (essentially a larger volume discount than anticipated), while a negative
variance reflects unit rates higher than base rates (essentially a smaller volume discount than
anticipated).
Summary by RU Group TCEQ
Mainframe $0
Print - Mail $0
Consolidated Server $91,721
Non-Consolidated Server $26,009
Consolidated Server Storage & Tape $132,651
Non-Consolidated Server Storage & Tape $96,920
DBaaS $3,061
TCEQ Net Posture of Summary RU Results $350,362
DocuSign Envelope ID: EE63AB8D-66DE-4943-9AB7-BF3CB6EAE20D

TEXAS DEPARTMENT OF INFORMATION RESOURCES | DCS CONSOLIDATION MEASUREMENT REPORT 35
Texas Department of Agriculture (TDA) The tables below provide different views of agency performance.
The first view is fiscal year 2017 Appropriation versus actuals with a variance. A positive variance for
this view indicates the agency’s actual spend was less than the fiscal year 2017 Appropriations amount
and a negative variance indicates the actual spend was more than the initial fiscal year 2017
Appropriation, excluding any fiscal year 2016 carry-forward balance. Subject to the limitations
contained within the General Appropriations Act, Article IX, Sec. 14.03, agencies have varying levels of
authority to address amounts spent in excess or less than the individual DCS capital budget line item
amounts.
Fiscal Year 2017 Actuals
Rate Based Resource Unit-Included $27,397
Rate Based Resource Unit-Excluded $1,499
HSC/SSC/Rate Card-Excluded $0
Transition and Transformation $0
Other Credits-Excluded $0
TOTAL: $28,896
FY17 INITIAL APPROPRIATION: $25,578
VARIANCE: ($3,318)
Note: See the Inclusion/Exclusion of Resource Units in Appendix A and Appendix B of this report for
additional information related to costs/volumes included and excluded from the Unit Rate Analysis
below.
The second view provides a summary of results for each of the RUs included within the Unit Rate
Analysis Methodology defined and described within this report. These results are specific to the Texas
Department of Agriculture and do not include any recovery fees that are seen in the agency invoices. A
positive variance for this view indicates the agency financially benefited from unit rates that were lower
than the base rate (essentially a larger volume discount than anticipated), while a negative variance
reflects unit rates higher than base rates (essentially a smaller volume discount than anticipated).
Summary by RU Group Actuals
Mainframe $0
Print - Mail ($1,488)
Consolidated Server $0
Non-Consolidated Server $0
Consolidated Server Storage & Tape $0
Non-Consolidated Server Storage & Tape $0
DBaaS $0
TDA Net Posture of Summary RU Results ($1,488)
DocuSign Envelope ID: EE63AB8D-66DE-4943-9AB7-BF3CB6EAE20D

TEXAS DEPARTMENT OF INFORMATION RESOURCES | DCS CONSOLIDATION MEASUREMENT REPORT 36
Texas Department of Criminal Justice (TDCJ) The tables below provide different views of agency performance.
The first view is fiscal year 2017 Appropriation versus actuals with a variance. A positive variance for
this view indicates the agency’s actual spend was less than the fiscal year 2017 Appropriations amount
and a negative variance indicates the actual spend was more than the initial fiscal year 2017
Appropriation, excluding any fiscal year 2016 carry-forward balance. Subject to the limitations
contained within the General Appropriations Act, Article IX, Sec. 14.03, agencies have varying levels of
authority to address amounts spent in excess or less than the individual DCS capital budget line item
amounts.
Fiscal Year 2017 Actuals
Rate Based Resource Unit-Included $10,025,690
Rate Based Resource Unit-Excluded $132,325
HSC/SSC/Rate Card-Excluded $1,546,605
Transition and Transformation $745,635
Other Credits-Excluded $0
TOTAL: $12,450,255
FY17 INITIAL APPROPRIATION: $12,839,397
VARIANCE: $389,143
Note: See the Inclusion/Exclusion of Resource Units in Appendix A and Appendix B of this report for
additional information related to costs/volumes included and excluded from the Unit Rate Analysis
below.
The second view provides a summary of results for each of the RUs included within the Unit Rate
Analysis Methodology defined and described within this report. These results are specific to the Texas
Department of Criminal Justice and do not include any recovery fees that are seen in the agency
invoices. A positive variance for this view indicates the agency financially benefited from unit rates that
were lower than the base rate (essentially a larger volume discount than anticipated), while a negative
variance reflects unit rates higher than base rates (essentially a smaller volume discount than
anticipated).
Summary by RU Group TDCJ
Mainframe $27,394
Print - Mail ($12,915)
Consolidated Server $49,610
Non-Consolidated Server $77,302
Consolidated Server Storage & Tape $73,461
Non-Consolidated Server Storage & Tape $29,676
DBaaS $0
TDCJ Net Posture of Summary RU Results $244,528
DocuSign Envelope ID: EE63AB8D-66DE-4943-9AB7-BF3CB6EAE20D
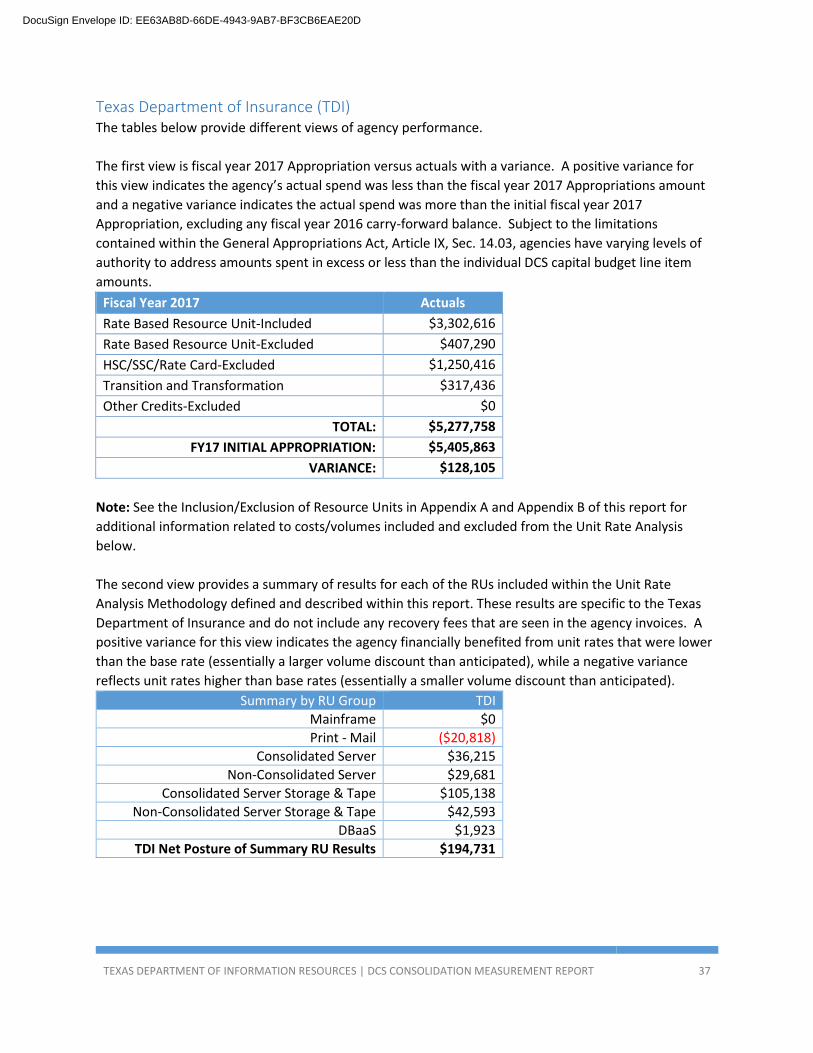
TEXAS DEPARTMENT OF INFORMATION RESOURCES | DCS CONSOLIDATION MEASUREMENT REPORT 37
Texas Department of Insurance (TDI) The tables below provide different views of agency performance.
The first view is fiscal year 2017 Appropriation versus actuals with a variance. A positive variance for
this view indicates the agency’s actual spend was less than the fiscal year 2017 Appropriations amount
and a negative variance indicates the actual spend was more than the initial fiscal year 2017
Appropriation, excluding any fiscal year 2016 carry-forward balance. Subject to the limitations
contained within the General Appropriations Act, Article IX, Sec. 14.03, agencies have varying levels of
authority to address amounts spent in excess or less than the individual DCS capital budget line item
amounts.
Fiscal Year 2017 Actuals
Rate Based Resource Unit-Included $3,302,616
Rate Based Resource Unit-Excluded $407,290
HSC/SSC/Rate Card-Excluded $1,250,416
Transition and Transformation $317,436
Other Credits-Excluded $0
TOTAL: $5,277,758
FY17 INITIAL APPROPRIATION: $5,405,863
VARIANCE: $128,105
Note: See the Inclusion/Exclusion of Resource Units in Appendix A and Appendix B of this report for
additional information related to costs/volumes included and excluded from the Unit Rate Analysis
below.
The second view provides a summary of results for each of the RUs included within the Unit Rate
Analysis Methodology defined and described within this report. These results are specific to the Texas
Department of Insurance and do not include any recovery fees that are seen in the agency invoices. A
positive variance for this view indicates the agency financially benefited from unit rates that were lower
than the base rate (essentially a larger volume discount than anticipated), while a negative variance
reflects unit rates higher than base rates (essentially a smaller volume discount than anticipated).
Summary by RU Group TDI
Mainframe $0
Print - Mail ($20,818)
Consolidated Server $36,215
Non-Consolidated Server $29,681
Consolidated Server Storage & Tape $105,138
Non-Consolidated Server Storage & Tape $42,593
DBaaS $1,923
TDI Net Posture of Summary RU Results $194,731
DocuSign Envelope ID: EE63AB8D-66DE-4943-9AB7-BF3CB6EAE20D
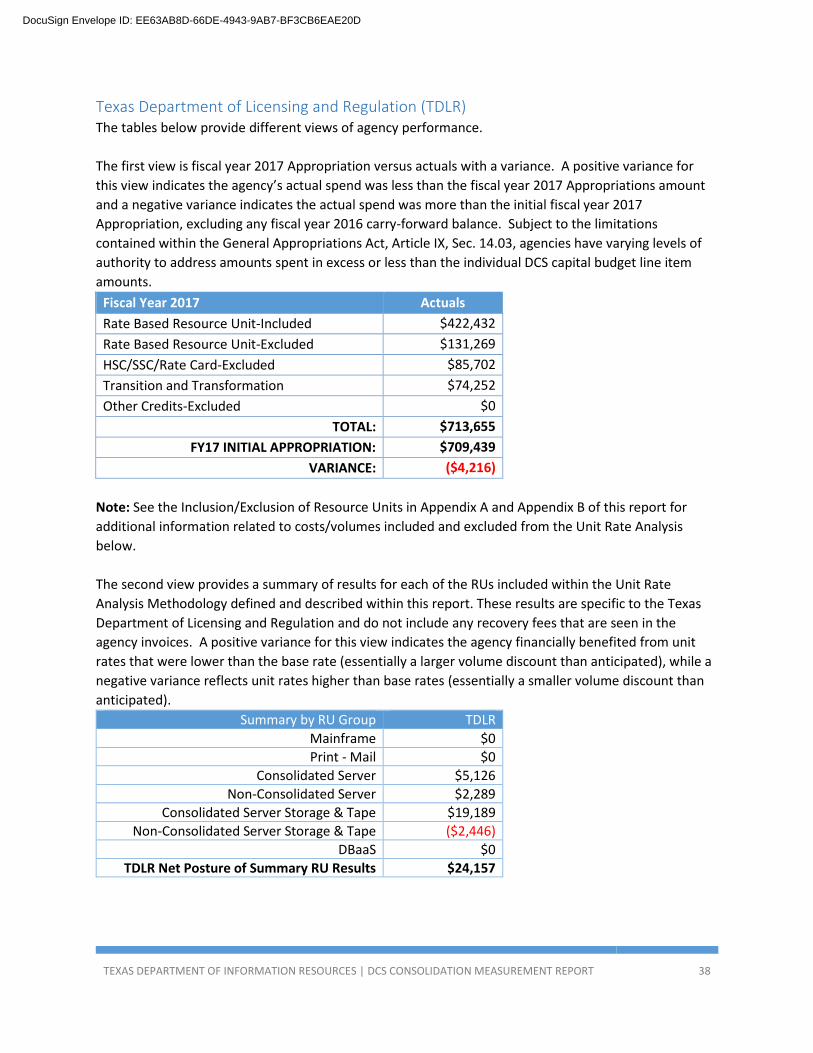
TEXAS DEPARTMENT OF INFORMATION RESOURCES | DCS CONSOLIDATION MEASUREMENT REPORT 38
Texas Department of Licensing and Regulation (TDLR) The tables below provide different views of agency performance.
The first view is fiscal year 2017 Appropriation versus actuals with a variance. A positive variance for
this view indicates the agency’s actual spend was less than the fiscal year 2017 Appropriations amount
and a negative variance indicates the actual spend was more than the initial fiscal year 2017
Appropriation, excluding any fiscal year 2016 carry-forward balance. Subject to the limitations
contained within the General Appropriations Act, Article IX, Sec. 14.03, agencies have varying levels of
authority to address amounts spent in excess or less than the individual DCS capital budget line item
amounts.
Fiscal Year 2017 Actuals
Rate Based Resource Unit-Included $422,432
Rate Based Resource Unit-Excluded $131,269
HSC/SSC/Rate Card-Excluded $85,702
Transition and Transformation $74,252
Other Credits-Excluded $0
TOTAL: $713,655
FY17 INITIAL APPROPRIATION: $709,439
VARIANCE: ($4,216)
Note: See the Inclusion/Exclusion of Resource Units in Appendix A and Appendix B of this report for
additional information related to costs/volumes included and excluded from the Unit Rate Analysis
below.
The second view provides a summary of results for each of the RUs included within the Unit Rate
Analysis Methodology defined and described within this report. These results are specific to the Texas
Department of Licensing and Regulation and do not include any recovery fees that are seen in the
agency invoices. A positive variance for this view indicates the agency financially benefited from unit
rates that were lower than the base rate (essentially a larger volume discount than anticipated), while a
negative variance reflects unit rates higher than base rates (essentially a smaller volume discount than
anticipated).
Summary by RU Group TDLR
Mainframe $0
Print - Mail $0
Consolidated Server $5,126
Non-Consolidated Server $2,289
Consolidated Server Storage & Tape $19,189
Non-Consolidated Server Storage & Tape ($2,446)
DBaaS $0
TDLR Net Posture of Summary RU Results $24,157
DocuSign Envelope ID: EE63AB8D-66DE-4943-9AB7-BF3CB6EAE20D
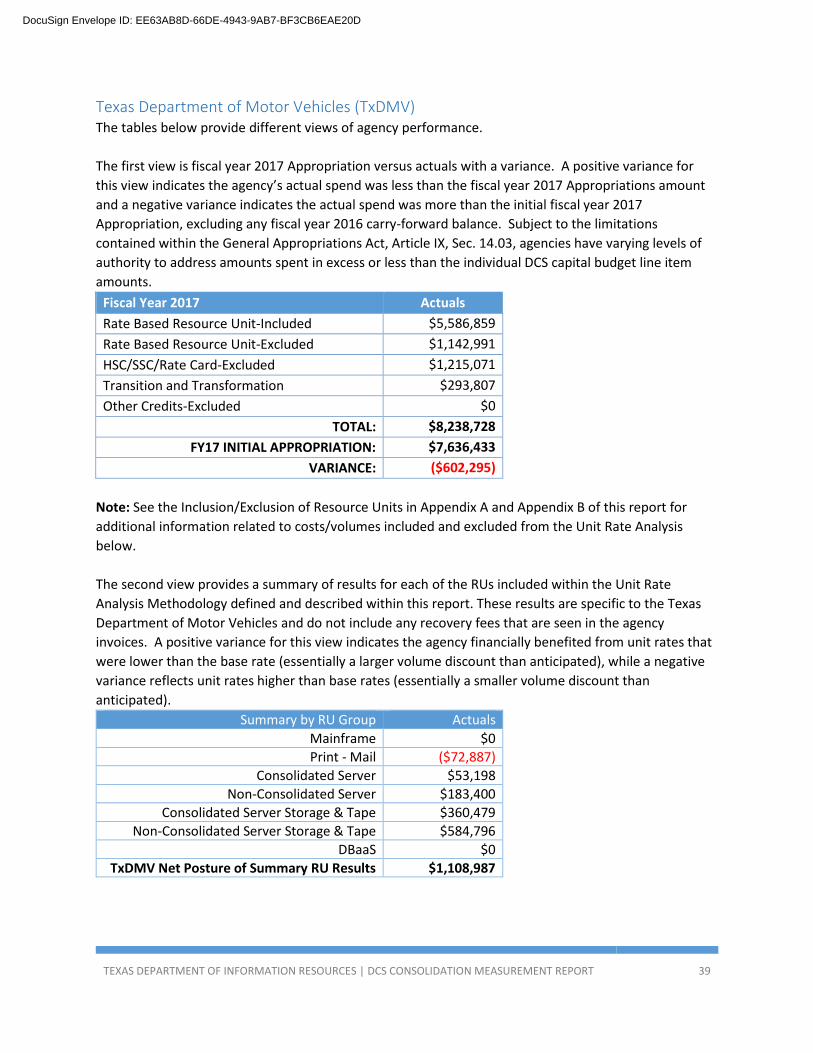
TEXAS DEPARTMENT OF INFORMATION RESOURCES | DCS CONSOLIDATION MEASUREMENT REPORT 39
Texas Department of Motor Vehicles (TxDMV) The tables below provide different views of agency performance.
The first view is fiscal year 2017 Appropriation versus actuals with a variance. A positive variance for
this view indicates the agency’s actual spend was less than the fiscal year 2017 Appropriations amount
and a negative variance indicates the actual spend was more than the initial fiscal year 2017
Appropriation, excluding any fiscal year 2016 carry-forward balance. Subject to the limitations
contained within the General Appropriations Act, Article IX, Sec. 14.03, agencies have varying levels of
authority to address amounts spent in excess or less than the individual DCS capital budget line item
amounts.
Fiscal Year 2017 Actuals
Rate Based Resource Unit-Included $5,586,859
Rate Based Resource Unit-Excluded $1,142,991
HSC/SSC/Rate Card-Excluded $1,215,071
Transition and Transformation $293,807
Other Credits-Excluded $0
TOTAL: $8,238,728
FY17 INITIAL APPROPRIATION: $7,636,433
VARIANCE: ($602,295)
Note: See the Inclusion/Exclusion of Resource Units in Appendix A and Appendix B of this report for
additional information related to costs/volumes included and excluded from the Unit Rate Analysis
below.
The second view provides a summary of results for each of the RUs included within the Unit Rate
Analysis Methodology defined and described within this report. These results are specific to the Texas
Department of Motor Vehicles and do not include any recovery fees that are seen in the agency
invoices. A positive variance for this view indicates the agency financially benefited from unit rates that
were lower than the base rate (essentially a larger volume discount than anticipated), while a negative
variance reflects unit rates higher than base rates (essentially a smaller volume discount than
anticipated).
Summary by RU Group Actuals
Mainframe $0
Print - Mail ($72,887)
Consolidated Server $53,198
Non-Consolidated Server $183,400
Consolidated Server Storage & Tape $360,479
Non-Consolidated Server Storage & Tape $584,796
DBaaS $0
TxDMV Net Posture of Summary RU Results $1,108,987
DocuSign Envelope ID: EE63AB8D-66DE-4943-9AB7-BF3CB6EAE20D

TEXAS DEPARTMENT OF INFORMATION RESOURCES | DCS CONSOLIDATION MEASUREMENT REPORT 40
Texas Department of Transportation (TxDOT) The tables below provide different views of agency performance.
The first view is fiscal year 2017 Appropriation versus actuals with a variance. A positive variance for
this view indicates the agency’s actual spend was less than the fiscal year 2017 Appropriations amount
and a negative variance indicates the actual spend was more than the initial fiscal year 2017
Appropriation, excluding any fiscal year 2016 carry-forward balance. Subject to the limitations
contained within the General Appropriations Act, Article IX, Sec. 14.03, agencies have varying levels of
authority to address amounts spent in excess or less than the individual DCS capital budget line item
amounts.
Fiscal Year 2017 Actuals
Rate Based Resource Unit-Included $11,186,553
Rate Based Resource Unit-Excluded $7,062,065
HSC/SSC/Rate Card-Excluded $5,202,817
Transition and Transformation $1,996,208
Other Credits-Excluded $0
TOTAL: $25,447,644
FY17 INITIAL APPROPRIATION: $27,707,506
VARIANCE: $2,259,862
Note: See the Inclusion/Exclusion of Resource Units in Appendix A and Appendix B of this report for
additional information related to costs/volumes included and excluded from the Unit Rate Analysis
below.
The second view provides a summary of results for each of the RUs included within the Unit Rate
Analysis Methodology defined and described within this report. These results are specific to the Texas
Department of Transportation and do not include any recovery fees that are seen in the agency invoices.
A positive variance for this view indicates the agency financially benefited from unit rates that were
lower than the base rate (essentially a larger volume discount than anticipated), while a negative
variance reflects unit rates higher than base rates (essentially a smaller volume discount than
anticipated).
Summary by RU Group TxDOT
Mainframe ($15,356)
Print - Mail $0
Consolidated Server $129,977
Non-Consolidated Server $1,974,142
Consolidated Server Storage & Tape $258,037
Non-Consolidated Server Storage & Tape $794,474
DBaaS $0
TxDOT Net Posture of Summary RU Results $3,141,274
DocuSign Envelope ID: EE63AB8D-66DE-4943-9AB7-BF3CB6EAE20D

TEXAS DEPARTMENT OF INFORMATION RESOURCES | DCS CONSOLIDATION MEASUREMENT REPORT 41
Texas Education Agency (TEA) The tables below provide different views of agency performance.
The first view is fiscal year 2017 Appropriation versus actuals with a variance. A positive variance for
this view indicates the agency’s actual spend was less than the fiscal year 2017 Appropriations amount
and a negative variance indicates the actual spend was more than the initial fiscal year 2017
Appropriation, excluding any fiscal year 2016 carry-forward balance. Subject to the limitations
contained within the General Appropriations Act, Article IX, Sec. 14.03, agencies have varying levels of
authority to address amounts spent in excess or less than the individual DCS capital budget line item
amounts.
Fiscal Year 2017 Actuals
Rate Based Resource Unit-Included $4,901,525
Rate Based Resource Unit-Excluded $2,558,945
HSC/SSC/Rate Card-Excluded $5,130,583
Transition and Transformation $956,021
Other Credits-Excluded $0
TOTAL: $13,547,074
FY17 INITIAL APPROPRIATION: $13,421,592
VARIANCE: ($125,481)
Note: See the Inclusion/Exclusion of Resource Units in Appendix A and Appendix B of this report for
additional information related to costs/volumes included and excluded from the Unit Rate Analysis
below.
The second view provides a summary of results for each of the RUs included within the Unit Rate
Analysis Methodology defined and described within this report. These results are specific to the Texas
Education Agency and do not include any recovery fees that are seen in the agency invoices. A positive
variance for this view indicates the agency financially benefited from unit rates that were lower than the
base rate (essentially a larger volume discount than anticipated), while a negative variance reflects unit
rates higher than base rates (essentially a smaller volume discount than anticipated).
Summary by RU Group TEA
Mainframe $0
Print - Mail $0
Consolidated Server $96,472
Non-Consolidated Server ($6,769)
Consolidated Server Storage & Tape $231,018
Non-Consolidated Server Storage & Tape $128,761
DBaaS $3,942
TEA Net Posture of Summary RU Results $453,425
DocuSign Envelope ID: EE63AB8D-66DE-4943-9AB7-BF3CB6EAE20D

TEXAS DEPARTMENT OF INFORMATION RESOURCES | DCS CONSOLIDATION MEASUREMENT REPORT 42
Texas Facilities Commission (TFC) The tables below provide different views of agency performance.
The first view is fiscal year 2017 Appropriation versus actuals with a variance. A positive variance for
this view indicates the agency’s actual spend was less than the fiscal year 2017 Appropriations amount
and a negative variance indicates the actual spend was more than the initial fiscal year 2017
Appropriation, excluding any fiscal year 2016 carry-forward balance. Subject to the limitations
contained within the General Appropriations Act, Article IX, Sec. 14.03, agencies have varying levels of
authority to address amounts spent in excess or less than the individual DCS capital budget line item
amounts.
Fiscal Year 2017 Actuals
Rate Based Resource Unit-Included $104,998
Rate Based Resource Unit-Excluded $12,112
HSC/SSC/Rate Card-Excluded $44,059
Transition and Transformation $29,558
Other Credits-Excluded $0
TOTAL: $190,728
FY17 INITIAL APPROPRIATION: $259,966
VARIANCE: $69,238
Note: See the Inclusion/Exclusion of Resource Units in Appendix A and Appendix B of this report for
additional information related to costs/volumes included and excluded from the Unit Rate Analysis
below.
The second view provides a summary of results for each of the RUs included within the Unit Rate
Analysis Methodology defined and described within this report. These results are specific to the Texas
Facilities Commission and do not include any recovery fees that are seen in the agency invoices. A
positive variance for this view indicates the agency financially benefited from unit rates that were lower
than the base rate (essentially a larger volume discount than anticipated), while a negative variance
reflects unit rates higher than base rates (essentially a smaller volume discount than anticipated).
Summary by RU Group TFC
Mainframe $0
Print - Mail $0
Consolidated Server $3,094
Non-Consolidated Server $0
Consolidated Server Storage & Tape $2,194
Non-Consolidated Server Storage & Tape $0
DBaaS $0
TFC Net Posture of Summary RU Results $5,288
DocuSign Envelope ID: EE63AB8D-66DE-4943-9AB7-BF3CB6EAE20D

TEXAS DEPARTMENT OF INFORMATION RESOURCES | DCS CONSOLIDATION MEASUREMENT REPORT 43
Texas Higher Education Coordinating Board (THECB) The tables below provide different views of agency performance.
The first view is fiscal year 2017 Appropriation versus actuals with a variance. A positive variance for
this view indicates the agency’s actual spend was less than the fiscal year 2017 Appropriations amount
and a negative variance indicates the actual spend was more than the initial fiscal year 2017
Appropriation, excluding any fiscal year 2016 carry-forward balance. Subject to the limitations
contained within the General Appropriations Act, Article IX, Sec. 14.03, agencies have varying levels of
authority to address amounts spent in excess or less than the individual DCS capital budget line item
amounts.
Fiscal Year 2017 Actuals
Rate Based Resource Unit-Included $996,351
Rate Based Resource Unit-Excluded $422,326
HSC/SSC/Rate Card-Excluded $671,387
Transition and Transformation $169,516
Other Credits-Excluded $0
TOTAL: $2,259,581
FY17 INITIAL APPROPRIATION: $1,850,314
VARIANCE: ($409,267)
Note: See the Inclusion/Exclusion of Resource Units in Appendix A and Appendix B of this report for
additional information related to costs/volumes included and excluded from the Unit Rate Analysis
below.
The second view provides a summary of results for each of the RUs included within the Unit Rate
Analysis Methodology defined and described within this report. These results are specific to the Texas
Higher Education Coordinating Board and do not include any recovery fees that are seen in the agency
invoices. A positive variance for this view indicates the agency financially benefited from unit rates that
were lower than the base rate (essentially a larger volume discount than anticipated), while a negative
variance reflects unit rates higher than base rates (essentially a smaller volume discount than
anticipated).
Summary by RU Group THECB
Mainframe $0
Print - Mail ($4,415)
Consolidated Server $21,970
Non-Consolidated Server $4,875
Consolidated Server Storage & Tape $120,431
Non-Consolidated Server Storage & Tape $7,397
DBaaS $0
THECB Net Posture of Summary RU Results $150,258
DocuSign Envelope ID: EE63AB8D-66DE-4943-9AB7-BF3CB6EAE20D

TEXAS DEPARTMENT OF INFORMATION RESOURCES | DCS CONSOLIDATION MEASUREMENT REPORT 44
Texas Juvenile Justice Department (TJJD) The tables below provide different views of agency performance.
The first view is fiscal year 2017 Appropriation versus actuals with a variance. A positive variance for
this view indicates the agency’s actual spend was less than the fiscal year 2017 Appropriations amount
and a negative variance indicates the actual spend was more than the initial fiscal year 2017
Appropriation, excluding any fiscal year 2016 carry-forward balance. Subject to the limitations
contained within the General Appropriations Act, Article IX, Sec. 14.03, agencies have varying levels of
authority to address amounts spent in excess or less than the individual DCS capital budget line item
amounts.
Fiscal Year 2017 Actuals
Rate Based Resource Unit-Included $859,739
Rate Based Resource Unit-Excluded $631,589
HSC/SSC/Rate Card-Excluded $385,626
Transition and Transformation $179,676
Other Credits-Excluded $0
TOTAL: $2,056,630
FY17 INITIAL APPROPRIATION: $2,561,685
VARIANCE: $505,055
Note: See the Inclusion/Exclusion of Resource Units in Appendix A and Appendix B of this report for
additional information related to costs/volumes included and excluded from the Unit Rate Analysis
below.
The second view provides a summary of results for each of the RUs included within the Unit Rate
Analysis Methodology defined and described within this report. These results are specific to the Texas
Juvenile Justice Department and do not include any recovery fees that are seen in the agency invoices.
A positive variance for this view indicates the agency financially benefited from unit rates that were
lower than the base rate (essentially a larger volume discount than anticipated), while a negative
variance reflects unit rates higher than base rates (essentially a smaller volume discount than
anticipated).
Summary by RU Group TJJD
Mainframe ($2,677)
Print - Mail $0
Consolidated Server $17,399
Non-Consolidated Server $19,836
Consolidated Server Storage & Tape $38,152
Non-Consolidated Server Storage & Tape $31,978
DBaaS $0
TJJD Net Posture of Summary RU Results $104,689
DocuSign Envelope ID: EE63AB8D-66DE-4943-9AB7-BF3CB6EAE20D
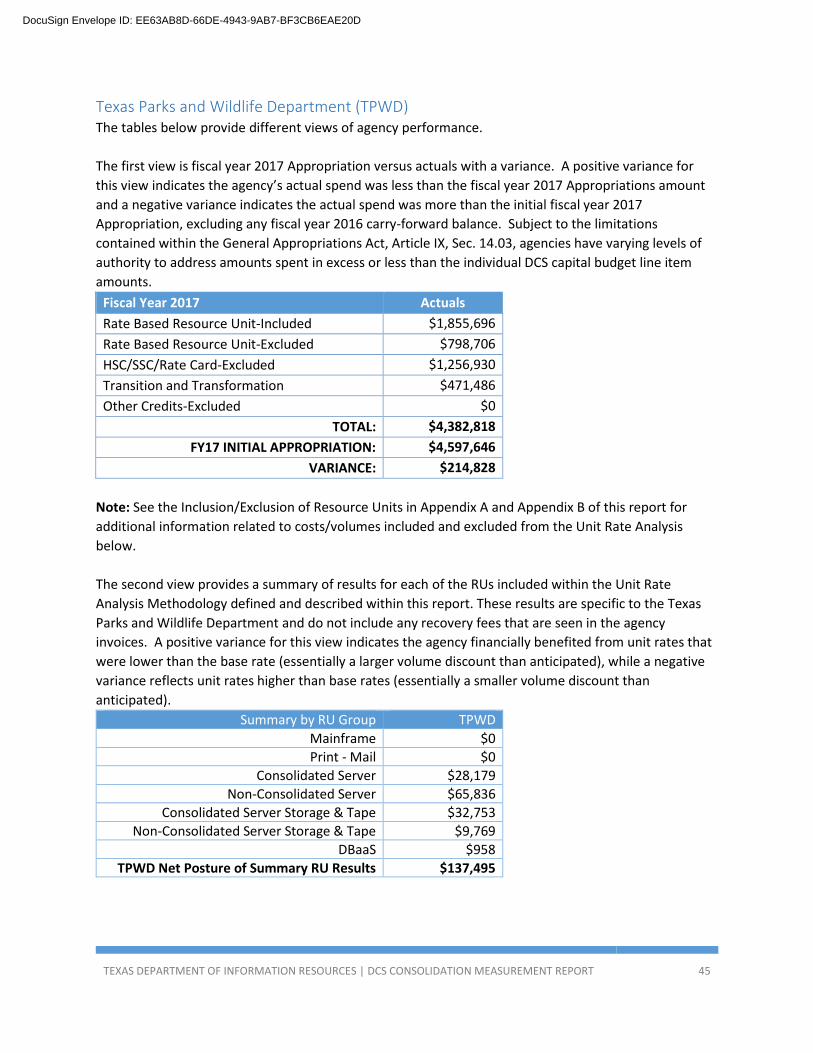
TEXAS DEPARTMENT OF INFORMATION RESOURCES | DCS CONSOLIDATION MEASUREMENT REPORT 45
Texas Parks and Wildlife Department (TPWD) The tables below provide different views of agency performance.
The first view is fiscal year 2017 Appropriation versus actuals with a variance. A positive variance for
this view indicates the agency’s actual spend was less than the fiscal year 2017 Appropriations amount
and a negative variance indicates the actual spend was more than the initial fiscal year 2017
Appropriation, excluding any fiscal year 2016 carry-forward balance. Subject to the limitations
contained within the General Appropriations Act, Article IX, Sec. 14.03, agencies have varying levels of
authority to address amounts spent in excess or less than the individual DCS capital budget line item
amounts.
Fiscal Year 2017 Actuals
Rate Based Resource Unit-Included $1,855,696
Rate Based Resource Unit-Excluded $798,706
HSC/SSC/Rate Card-Excluded $1,256,930
Transition and Transformation $471,486
Other Credits-Excluded $0
TOTAL: $4,382,818
FY17 INITIAL APPROPRIATION: $4,597,646
VARIANCE: $214,828
Note: See the Inclusion/Exclusion of Resource Units in Appendix A and Appendix B of this report for
additional information related to costs/volumes included and excluded from the Unit Rate Analysis
below.
The second view provides a summary of results for each of the RUs included within the Unit Rate
Analysis Methodology defined and described within this report. These results are specific to the Texas
Parks and Wildlife Department and do not include any recovery fees that are seen in the agency
invoices. A positive variance for this view indicates the agency financially benefited from unit rates that
were lower than the base rate (essentially a larger volume discount than anticipated), while a negative
variance reflects unit rates higher than base rates (essentially a smaller volume discount than
anticipated).
Summary by RU Group TPWD
Mainframe $0
Print - Mail $0
Consolidated Server $28,179
Non-Consolidated Server $65,836
Consolidated Server Storage & Tape $32,753
Non-Consolidated Server Storage & Tape $9,769
DBaaS $958
TPWD Net Posture of Summary RU Results $137,495
DocuSign Envelope ID: EE63AB8D-66DE-4943-9AB7-BF3CB6EAE20D

TEXAS DEPARTMENT OF INFORMATION RESOURCES | DCS CONSOLIDATION MEASUREMENT REPORT 46
Texas State Library and Archives Commission (TSLAC) The tables below provide different views of agency performance.
The first view is fiscal year 2017 Appropriation versus actuals with a variance. A positive variance for
this view indicates the agency’s actual spend was less than the fiscal year 2017 Appropriations amount
and a negative variance indicates the actual spend was more than the initial fiscal year 2017
Appropriation, excluding any fiscal year 2016 carry-forward balance. Subject to the limitations
contained within the General Appropriations Act, Article IX, Sec. 14.03, agencies have varying levels of
authority to address amounts spent in excess or less than the individual DCS capital budget line item
amounts.
Fiscal Year 2017 Actuals
Rate Based Resource Unit-Included $224,725
Rate Based Resource Unit-Excluded $104,684
HSC/SSC/Rate Card-Excluded $40,418
Transition and Transformation $42,150
Other Credits-Excluded $0
TOTAL: $411,977
FY17 INITIAL APPROPRIATION: $556,916
VARIANCE: $144,939
Note: See the Inclusion/Exclusion of Resource Units in Appendix A and Appendix B of this report for
additional information related to costs/volumes included and excluded from the Unit Rate Analysis
below.
The second view provides a summary of results for each of the RUs included within the Unit Rate
Analysis Methodology defined and described within this report. These results are specific to the Texas
State Library and Archives Commission and do not include any recovery fees that are seen in the agency
invoices. A positive variance for this view indicates the agency financially benefited from unit rates that
were lower than the base rate (essentially a larger volume discount than anticipated), while a negative
variance reflects unit rates higher than base rates (essentially a smaller volume discount than
anticipated).
Summary by RU Group TSLAC
Mainframe $0
Print - Mail ($1,450)
Consolidated Server $6,705
Non-Consolidated Server $7,495
Consolidated Server Storage & Tape $8,069
Non-Consolidated Server Storage & Tape $9,633
DBaaS $0
TSLAC Net Posture of Summary RU Results $30,453
DocuSign Envelope ID: EE63AB8D-66DE-4943-9AB7-BF3CB6EAE20D

TEXAS DEPARTMENT OF INFORMATION RESOURCES | DCS CONSOLIDATION MEASUREMENT REPORT 47
Texas Veterans Commission (TVC) The tables below provide different views of agency performance.
The first view is fiscal year 2017 Appropriation versus actuals with a variance. A positive variance for
this view indicates the agency’s actual spend was less than the fiscal year 2017 Appropriations amount
and a negative variance indicates the actual spend was more than the initial fiscal year 2017
Appropriation, excluding any fiscal year 2016 carry-forward balance. Subject to the limitations
contained within the General Appropriations Act, Article IX, Sec. 14.03, agencies have varying levels of
authority to address amounts spent in excess or less than the individual DCS capital budget line item
amounts.
Fiscal Year 2017 Actuals
Rate Based Resource Unit-Included $87,369
Rate Based Resource Unit-Excluded $3,945
HSC/SSC/Rate Card-Excluded $4,099
Transition and Transformation $3,002
Other Credits-Excluded $0
TOTAL: $98,414
FY17 INITIAL APPROPRIATION: $90,929
VARIANCE: ($7,486)
Note: See the Inclusion/Exclusion of Resource Units in Appendix A and Appendix B of this report for
additional information related to costs/volumes included and excluded from the Unit Rate Analysis
below.
The second view provides a summary of results for each of the RUs included within the Unit Rate
Analysis Methodology defined and described within this report. These results are specific to the Texas
Veterans Commission and do not include any recovery fees that are seen in the agency invoices. A
positive variance for this view indicates the agency financially benefited from unit rates that were lower
than the base rate (essentially a larger volume discount than anticipated), while a negative variance
reflects unit rates higher than base rates (essentially a smaller volume discount than anticipated).
Summary by RU Group TVC
Mainframe $0
Print - Mail $0
Consolidated Server $1,123
Non-Consolidated Server $0
Consolidated Server Storage & Tape $863
Non-Consolidated Server Storage & Tape $0
DBaaS $0
TVC Net Posture of Summary RU Results $1,987
DocuSign Envelope ID: EE63AB8D-66DE-4943-9AB7-BF3CB6EAE20D

TEXAS DEPARTMENT OF INFORMATION RESOURCES | DCS CONSOLIDATION MEASUREMENT REPORT 48
Texas Workforce Commission (TWC) The tables below provide different views of agency performance.
The first view is fiscal year 2017 Appropriation versus actuals with a variance. A positive variance for
this view indicates the agency’s actual spend was less than the fiscal year 2017 Appropriations amount
and a negative variance indicates the actual spend was more than the initial fiscal year 2017
Appropriation, excluding any fiscal year 2016 carry-forward balance. Subject to the limitations
contained within the General Appropriations Act, Article IX, Sec. 14.03, agencies have varying levels of
authority to address amounts spent in excess or less than the individual DCS capital budget line item
amounts.
Fiscal Year 2017 Actuals
Rate Based Resource Unit-Included $14,861,778
Rate Based Resource Unit-Excluded $3,988,928
HSC/SSC/Rate Card-Excluded $2,337,336
Transition and Transformation $1,541,756
Other Credits-Excluded $0
TOTAL: $22,729,798
FY17 INITIAL APPROPRIATION: $26,676,315
VARIANCE: $3,946,517
Note: See the Inclusion/Exclusion of Resource Units in Appendix A and Appendix B of this report for
additional information related to costs/volumes included and excluded from the Unit Rate Analysis
below.
The second view provides a summary of results for each of the RUs included within the Unit Rate
Analysis Methodology defined and described within this report. These results are specific to the Texas
Workforce Commission and do not include any recovery fees that are seen in the agency invoices. A
positive variance for this view indicates the agency financially benefited from unit rates that were lower
than the base rate (essentially a larger volume discount than anticipated), while a negative variance
reflects unit rates higher than base rates (essentially a smaller volume discount than anticipated).
Summary by RU Group TWC
Mainframe ($92,108)
Print - Mail ($103,426)
Consolidated Server ($57,521)
Non-Consolidated Server $93,685
Consolidated Server Storage & Tape $198,790
Non-Consolidated Server Storage & Tape $156,563
DBaaS $0
TWC Net Posture of Summary RU Results $195,983
DocuSign Envelope ID: EE63AB8D-66DE-4943-9AB7-BF3CB6EAE20D

TEXAS DEPARTMENT OF INFORMATION RESOURCES | DCS CONSOLIDATION MEASUREMENT REPORT 49
Texas Water Development Board (TWDB) The tables below provide different views of agency performance.
The first view is fiscal year 2017 Appropriation versus actuals with a variance. A positive variance for
this view indicates the agency’s actual spend was less than the fiscal year 2017 Appropriations amount
and a negative variance indicates the actual spend was more than the initial fiscal year 2017
Appropriation, excluding any fiscal year 2016 carry-forward balance. Subject to the limitations
contained within the General Appropriations Act, Article IX, Sec. 14.03, agencies have varying levels of
authority to address amounts spent in excess or less than the individual DCS capital budget line item
amounts.
Fiscal Year 2017 Actuals
Rate Based Resource Unit-Included $249,981
Rate Based Resource Unit-Excluded $635,820
HSC/SSC/Rate Card-Excluded $87,594
Transition and Transformation $171,017
Other Credits-Excluded $0
TOTAL: $1,144,413
FY17 INITIAL APPROPRIATION: $1,301,090
VARIANCE: $156,677
Note: See the Inclusion/Exclusion of Resource Units in Appendix A and Appendix B of this report for
additional information related to costs/volumes included and excluded from the Unit Rate Analysis
below.
The second view provides a summary of results for each of the RUs included within the Unit Rate
Analysis Methodology defined and described within this report. These results are specific to the Texas
Water Development Board and do not include any recovery fees that are seen in the agency invoices. A
positive variance for this view indicates the agency financially benefited from unit rates that were lower
than the base rate (essentially a larger volume discount than anticipated), while a negative variance
reflects unit rates higher than base rates (essentially a smaller volume discount than anticipated).
Summary by RU Group TWDB
Mainframe $0
Print - Mail $0
Consolidated Server $2,613
Non-Consolidated Server $3,213
Consolidated Server Storage & Tape ($4,485)
Non-Consolidated Server Storage & Tape $9,380
DBaaS $0
TWDB Net Posture of Summary RU Results $10,722
DocuSign Envelope ID: EE63AB8D-66DE-4943-9AB7-BF3CB6EAE20D

TEXAS DEPARTMENT OF INFORMATION RESOURCES | DCS CONSOLIDATION MEASUREMENT REPORT 50
Voluntary Customers – State Agencies4
4 Voluntary Data Center Service customer that purchases email, print mail, or other optional services only and are not appropriated funds for
DCS capital budgets
Voluntary Customers - State Agencies Actual Consumption
Board of Law Examiners 9,217$
Commission on State Emergency Communications 60,508$
General Land Office 145,403$
State Security Board 22,509$
Texas A&M University Central Texas 72,554$
Texas Board of Architectual Examiners 3,985$
Texas Board of Professional Engineers 7,971$
Texas Department of Housing & Community Affairs 54,209$
Texas Department of Public Safety 1,097,172$
Texas Historic Commission 43,041$
Texas Lottery Commission 35,042$
Texas Military Department 54,070$
Texas Real Estate Commission 19,163$
Tarleton State University 19,988$
Texas Department of Banking 7,802$
Texas Racing Commission 6,998$
TOTAL 1,659,629$
Voluntary Customers - Local Entities Actual Consumption
Bexar Metro 30,885$
CapCOG 5,408$
TOTAL 36,293$
DocuSign Envelope ID: EE63AB8D-66DE-4943-9AB7-BF3CB6EAE20D
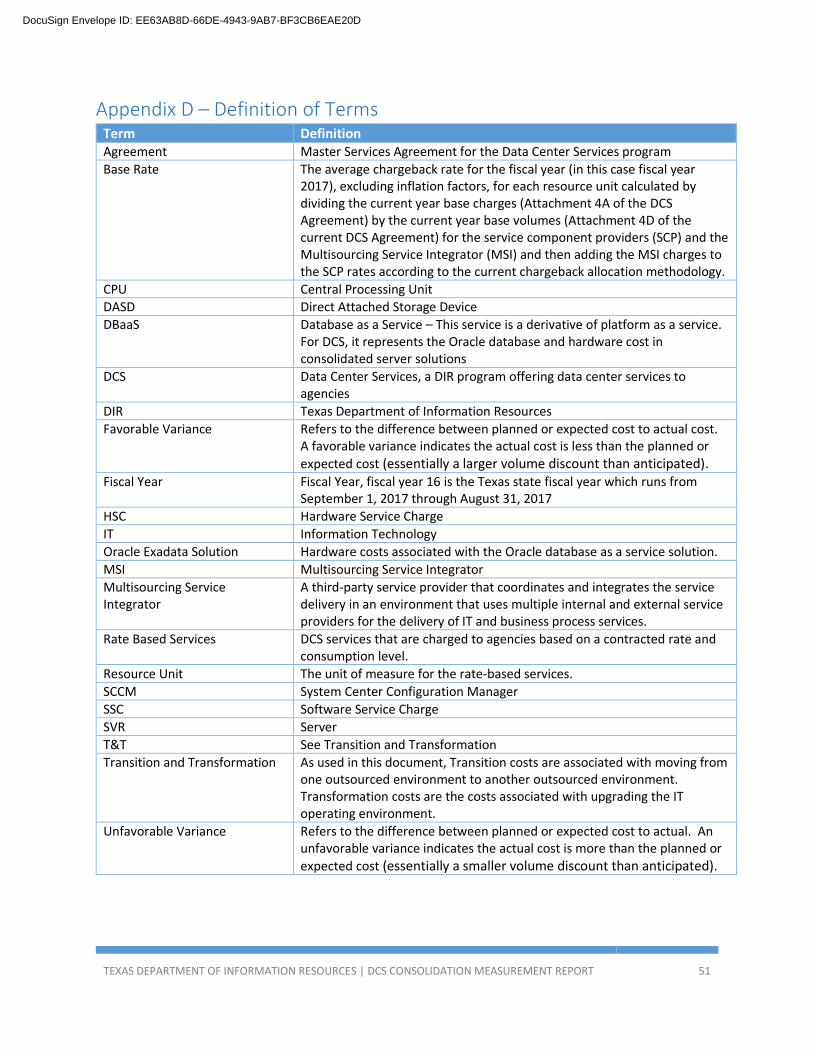
TEXAS DEPARTMENT OF INFORMATION RESOURCES | DCS CONSOLIDATION MEASUREMENT REPORT 51
Appendix D – Definition of Terms Term Definition Agreement Master Services Agreement for the Data Center Services program
Base Rate The average chargeback rate for the fiscal year (in this case fiscal year 2017), excluding inflation factors, for each resource unit calculated by dividing the current year base charges (Attachment 4A of the DCS Agreement) by the current year base volumes (Attachment 4D of the current DCS Agreement) for the service component providers (SCP) and the Multisourcing Service Integrator (MSI) and then adding the MSI charges to the SCP rates according to the current chargeback allocation methodology.
CPU Central Processing Unit
DASD Direct Attached Storage Device
DBaaS Database as a Service – This service is a derivative of platform as a service. For DCS, it represents the Oracle database and hardware cost in consolidated server solutions
DCS Data Center Services, a DIR program offering data center services to agencies
DIR Texas Department of Information Resources
Favorable Variance Refers to the difference between planned or expected cost to actual cost. A favorable variance indicates the actual cost is less than the planned or
expected cost (essentially a larger volume discount than anticipated). Fiscal Year Fiscal Year, fiscal year 16 is the Texas state fiscal year which runs from
September 1, 2017 through August 31, 2017
HSC Hardware Service Charge
IT Information Technology
Oracle Exadata Solution Hardware costs associated with the Oracle database as a service solution.
MSI Multisourcing Service Integrator
Multisourcing Service Integrator
A third-party service provider that coordinates and integrates the service delivery in an environment that uses multiple internal and external service providers for the delivery of IT and business process services.
Rate Based Services DCS services that are charged to agencies based on a contracted rate and consumption level.
Resource Unit The unit of measure for the rate-based services.
SCCM System Center Configuration Manager
SSC Software Service Charge
SVR Server
T&T See Transition and Transformation
Transition and Transformation As used in this document, Transition costs are associated with moving from one outsourced environment to another outsourced environment. Transformation costs are the costs associated with upgrading the IT operating environment.
Unfavorable Variance Refers to the difference between planned or expected cost to actual. An unfavorable variance indicates the actual cost is more than the planned or
expected cost (essentially a smaller volume discount than anticipated).
DocuSign Envelope ID: EE63AB8D-66DE-4943-9AB7-BF3CB6EAE20D

TEXAS DEPARTMENT OF INFORMATION RESOURCES | DCS CONSOLIDATION MEASUREMENT REPORT 52
Acknowledgements DIR would like to thank the members of the original working group for their participation, collaboration,
and support in developing the cost measurement methodology:
Participant Agency DCS Partner Group
Michael Gray Office of the Attorney General – Child Support Partner Group 1
Bill Parker Health and Human Services Commission Partner Group 2
Jason Storey Texas Workforce Commission Partner Group 3
Sage Chandrasoma Texas Department of Transportation Partner Group 4
Lara Coffer Texas Education Agency Partner Group 5
DocuSign Envelope ID: EE63AB8D-66DE-4943-9AB7-BF3CB6EAE20D