Fiscal space and the composition of public finances - Jean-Marc Fournier, OECD
21
6 April 2017 The effect of the size and mix of public spending on growth and inequality http://www.oecd.org/eco/the-effect-of-the-size-and-mix-of-public-spending-on- growth-and-inequality.htm ECOSCOPE blog: oecdecoscope.wordpress.com
-
Upload
oecd-governance -
Category
Government & Nonprofit
-
view
8 -
download
3
Transcript of Fiscal space and the composition of public finances - Jean-Marc Fournier, OECD
6 April 2017
The effect of the size and mix
of public spending on growth and inequality
http://www.oecd.org/eco/the-effect-of-the-size-and-mix-of-public-spending-on-growth-and-inequality.htm
ECOSCOPE blog: oecdecoscope.wordpress.com
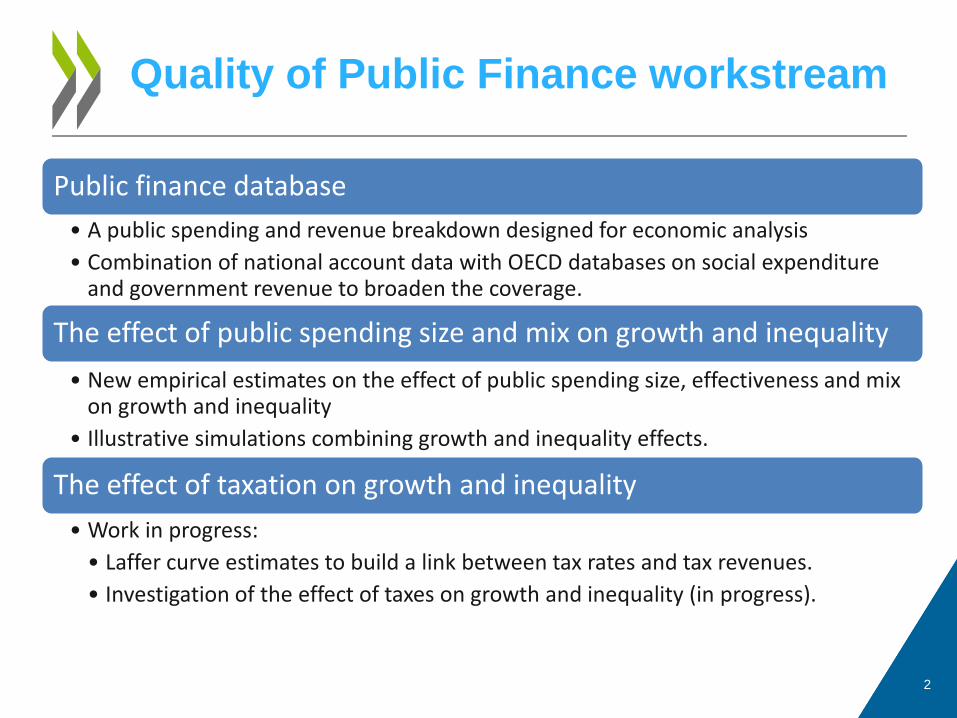
Quality of Public Finance workstream
2
Public finance database • A public spending and revenue breakdown designed for economic analysis • Combination of national account data with OECD databases on social expenditure
and government revenue to broaden the coverage.
The effect of public spending size and mix on growth and inequality • New empirical estimates on the effect of public spending size, effectiveness and mix
on growth and inequality • Illustrative simulations combining growth and inequality effects.
The effect of taxation on growth and inequality • Work in progress: • Laffer curve estimates to build a link between tax rates and tax revenues. • Investigation of the effect of taxes on growth and inequality (in progress).

3
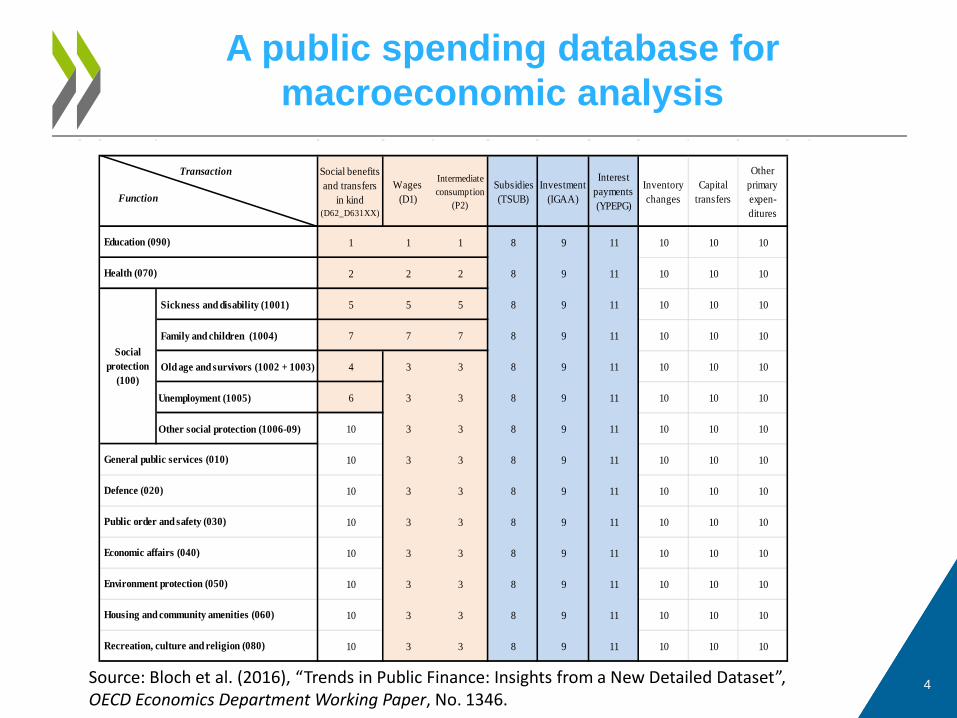
1. Public finance database
Social benefits and transfers
in kind (D62_D631XX)
Wages (D1)
Intermediate consumption
(P2)
Subsidies (TSUB)
Investment (IGAA)
Interest payments (YPEPG)
Inventory changes
Capital transfers
Other primary expen-ditures
1 1 1 8 9 11 10 10 10
2 2 2 8 9 11 10 10 10
Sickness and disability (1001) 5 5 5 8 9 11 10 10 10
Family and children (1004) 7 7 7 8 9 11 10 10 10
Old age and survivors (1002 + 1003) 4 3 3 8 9 11 10 10 10
Unemployment (1005) 6 3 3 8 9 11 10 10 10
Other social protection (1006-09) 10 3 3 8 9 11 10 10 10
10 3 3 8 9 11 10 10 10
10 3 3 8 9 11 10 10 10
10 3 3 8 9 11 10 10 10
10 3 3 8 9 11 10 10 10
10 3 3 8 9 11 10 10 10
10 3 3 8 9 11 10 10 10
10 3 3 8 9 11 10 10 10
Economic affairs (040)
Environment protection (050)
Housing and community amenities (060)
Recreation, culture and religion (080)
Social protection
(100)
Public order and safety (030)
Defence (020)
General public services (010)
Education (090)
Health (070)
Function
Transaction
A public spending database for macroeconomic analysis
4 Source: Bloch et al. (2016), “Trends in Public Finance: Insights from a New Detailed Dataset”, OECD Economics Department Working Paper, No. 1346.
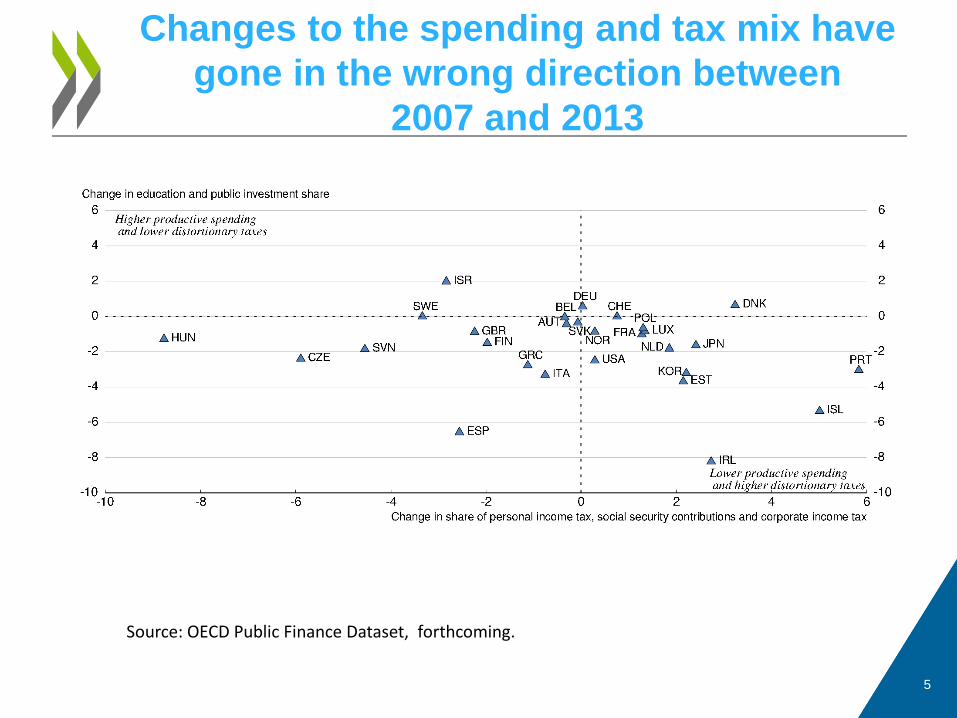
Changes to the spending and tax mix have gone in the wrong direction between
2007 and 2013
5
Source: OECD Public Finance Dataset, forthcoming.
6
2. New estimates of the effect of public spending
size, effectiveness and mix on growth and inequality
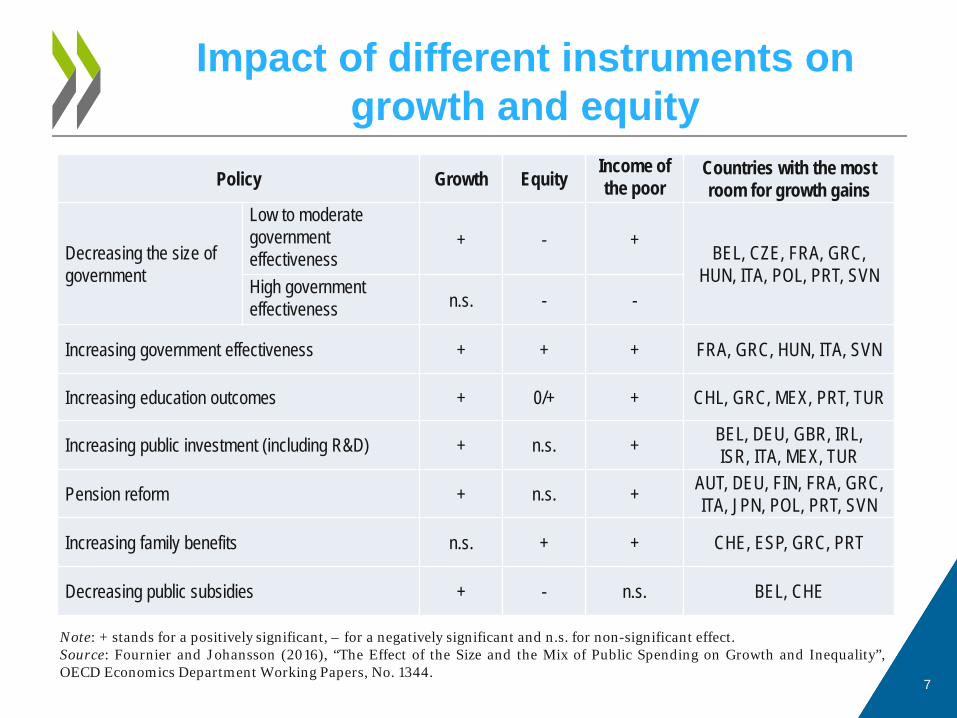
Impact of different instruments on growth and equity
7
Policy Growth Equity Income of the poor
Countries with the most room for growth gains
Decreasing the size of government
Low to moderate government effectiveness
+ - + BEL, CZE, FRA, GRC,
HUN, ITA, POL, PRT, SVN High government effectiveness n.s. - -
Increasing government effectiveness + + + FRA, GRC, HUN, ITA, SVN
Increasing education outcomes + 0/+ + CHL, GRC, MEX, PRT, TUR
Increasing public investment (including R&D) + n.s. + BEL, DEU, GBR, IRL, ISR, ITA, MEX, TUR
Pension reform + n.s. + AUT, DEU, FIN, FRA, GRC, ITA, JPN, POL, PRT, SVN
Increasing family benefits n.s. + + CHE, ESP, GRC, PRT
Decreasing public subsidies + - n.s. BEL, CHE
Note: + stands for a positively significant, – for a negatively significant and n.s. for non-significant effect. Source: Fournier and Johansson (2016), “The Effect of the Size and the Mix of Public Spending on Growth and Inequality”, OECD Economics Department Working Papers, No. 1344.
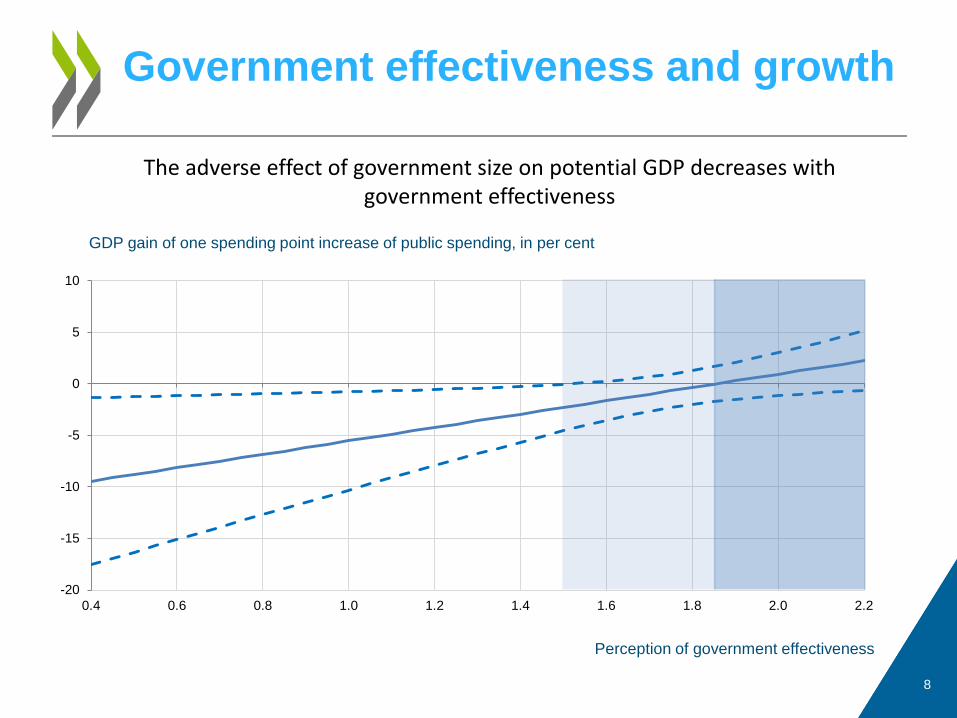
Government effectiveness and growth
8
The adverse effect of government size on potential GDP decreases with government effectiveness
GDP gain of one spending point increase of public spending, in per cent
Perception of government effectiveness
-20
-15
-10
-5
0
5
10
0.4 0.6 0.8 1.0 1.2 1.4 1.6 1.8 2.0 2.2
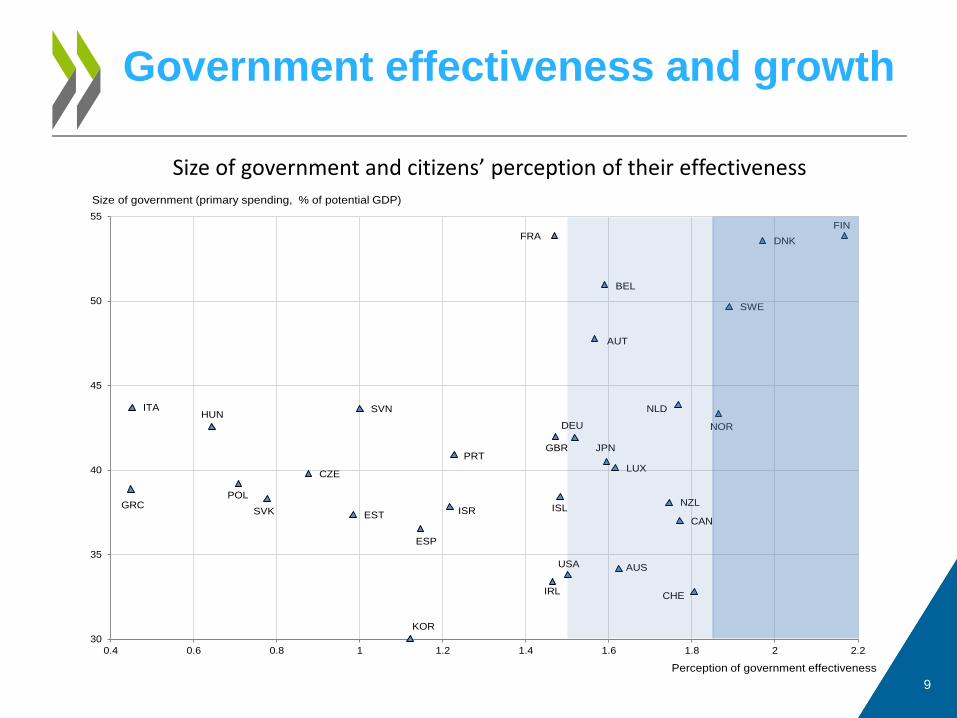
Government effectiveness and growth
9
Size of government and citizens’ perception of their effectiveness
AUS
AUT
BEL
CAN
CHE
CZE
DEU
DNK
ESP
EST
FINFRA
GBR
GRC
HUN
IRL
ISLISR
ITA
JPN
KOR
LUX
NLD
NOR
NZLPOL
PRT
SVK
SVN
SWE
USA
30
35
40
45
50
55
0.4 0.6 0.8 1 1.2 1.4 1.6 1.8 2 2.2
Perception of government effectiveness
Size of government (primary spending, % of potential GDP)
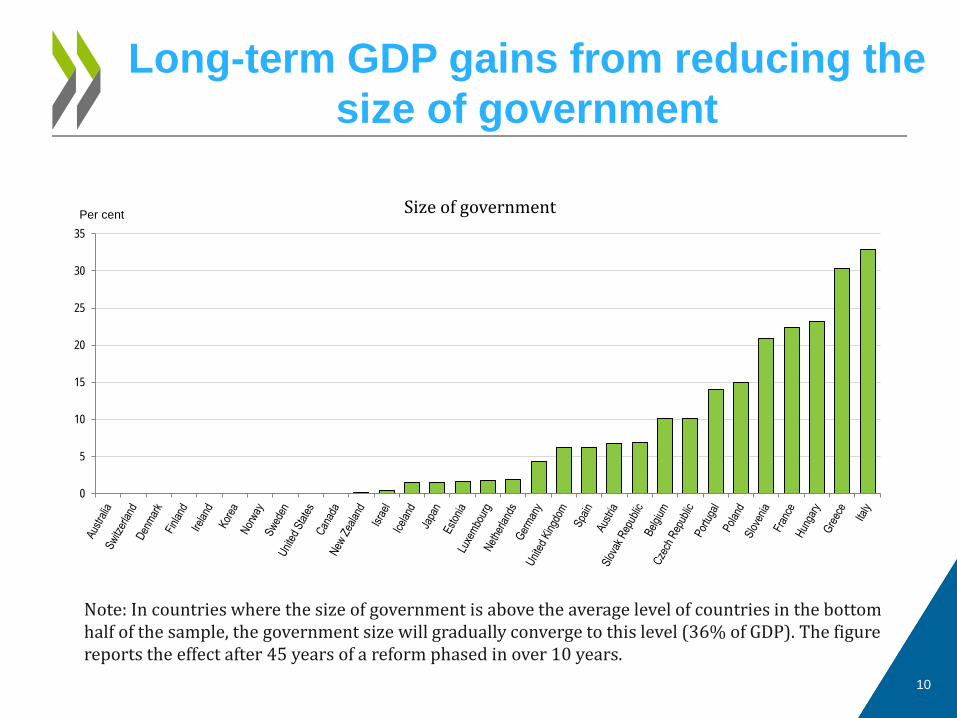
Long-term GDP gains from reducing the size of government
10
0
5
10
15
20
25
30
35
Size of governmentPer cent
Note: In countries where the size of government is above the average level of countries in the bottom half of the sample, the government size will gradually converge to this level (36% of GDP). The figure reports the effect after 45 years of a reform phased in over 10 years.
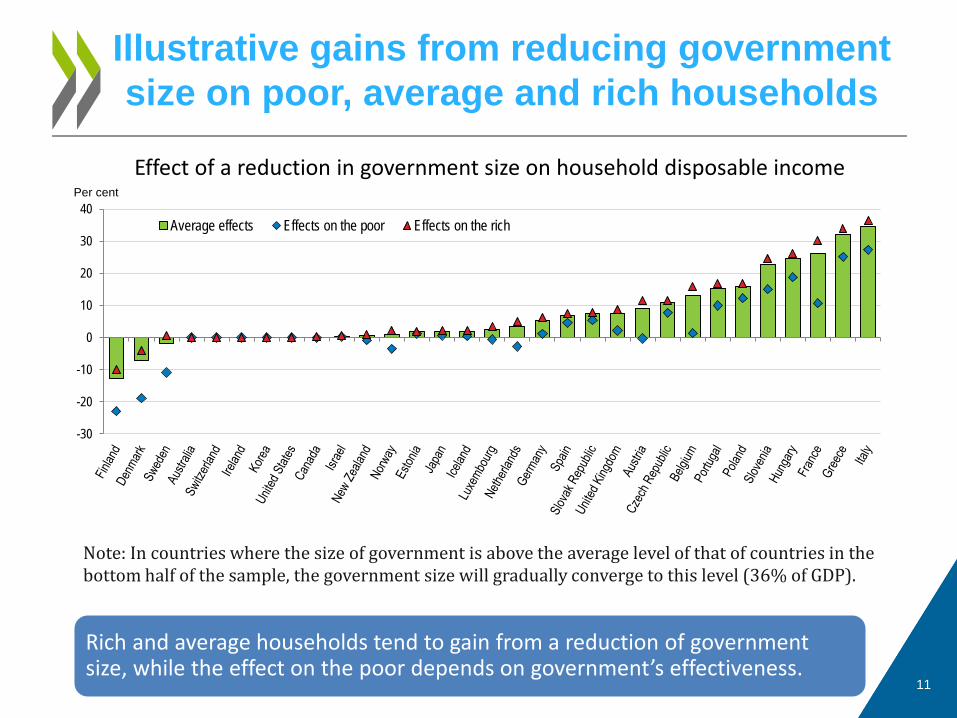
Illustrative gains from reducing government size on poor, average and rich households
11
Effect of a reduction in government size on household disposable income
Note: In countries where the size of government is above the average level of that of countries in the bottom half of the sample, the government size will gradually converge to this level (36% of GDP).
Rich and average households tend to gain from a reduction of government size, while the effect on the poor depends on government’s effectiveness.
-30
-20
-10
0
10
20
30
40Average effects Effects on the poor Effects on the rich
Per cent
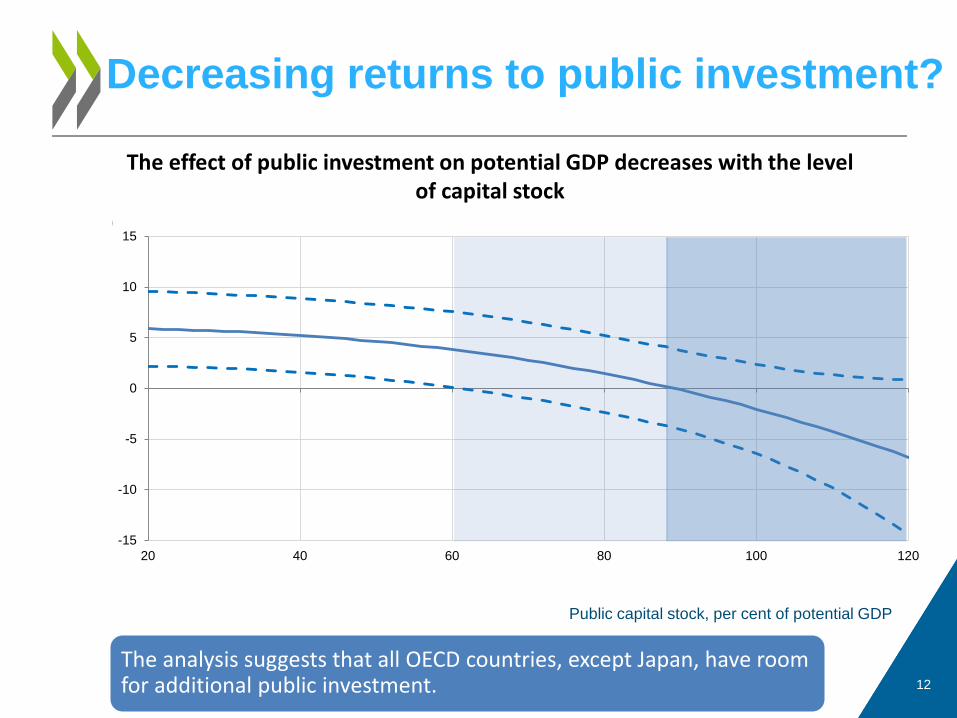
Decreasing returns to public investment?
12
The effect of public investment on potential GDP decreases with the level of capital stock
GDP gain of one spending point increase of public investment, in per cent
Public capital stock, per cent of potential GDP
The analysis suggests that all OECD countries, except Japan, have room for additional public investment.
-15
-10
-5
0
5
10
15
20 40 60 80 100 120
13
3. The effect of taxation on growth and inequality (in progress)
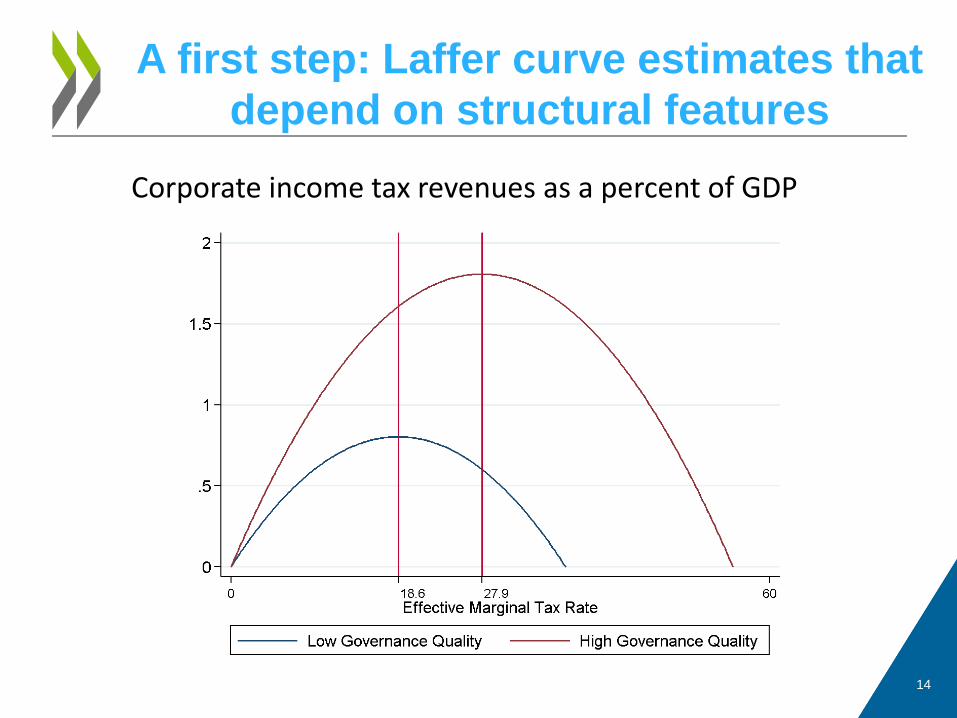
A first step: Laffer curve estimates that depend on structural features
14
Corporate income tax revenues as a percent of GDP
15
More information
Fournier, J-M. and A Johansson (2016), “The effect of the size and mix of public spending on growth and inequality”, OECD Economics Department Working Papers, No. 1344.
Bloch et al. (2016), “Trends in public finance: Insights from a new dataset”, OECD Economics Department Working Papers, No. 1345. Johansson, A. (2016), “Public finance, economic growth and inequality: A survey of the evidence”, OECD Economics Department Working Papers, No. 1346.
Fournier, J-M. (2016), “The positive effect of public investment on potential growth”, OECD Economics Department Working Papers, No. 1347. Disclaimers: The statistical data for Israel are supplied by and under the responsibility of the relevant Israeli authorities. The use of such data by the OECD is without prejudice to the status of the Golan Heights, East Jerusalem and Israeli settlements in the West Bank under the terms of international law. This document and any map included herein are without prejudice to the status of or sovereignty over any territory, to the delimitation of international frontiers and boundaries and to the name of any territory, city or area.

16
Additional slides
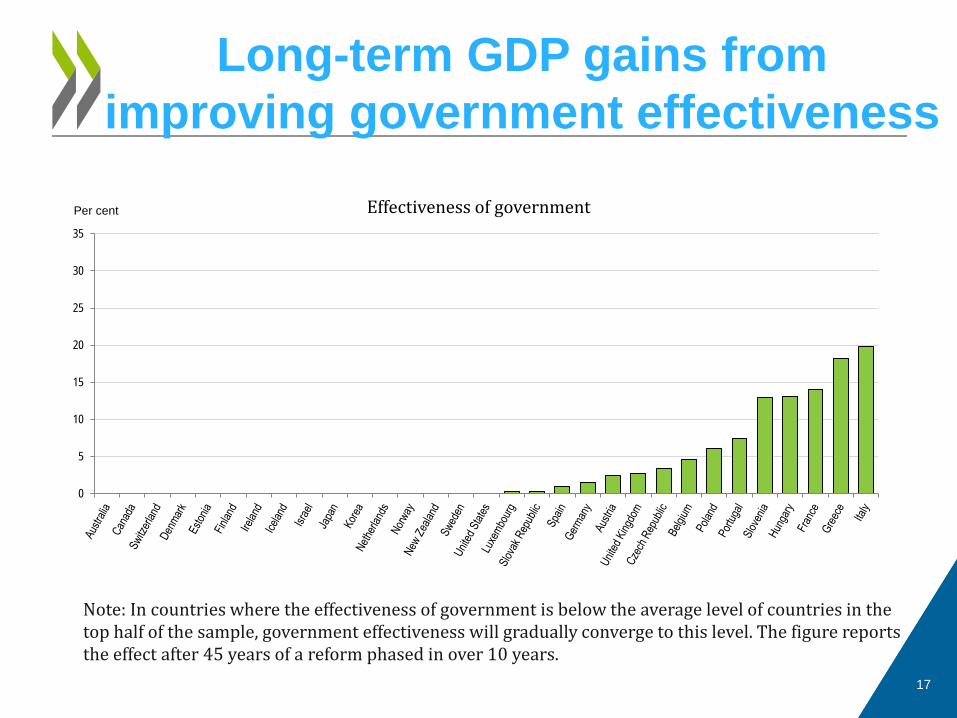
Long-term GDP gains from improving government effectiveness
17
0
5
10
15
20
25
30
35
Effectiveness of governmentPer cent
Note: In countries where the effectiveness of government is below the average level of countries in the top half of the sample, government effectiveness will gradually converge to this level. The figure reports the effect after 45 years of a reform phased in over 10 years.
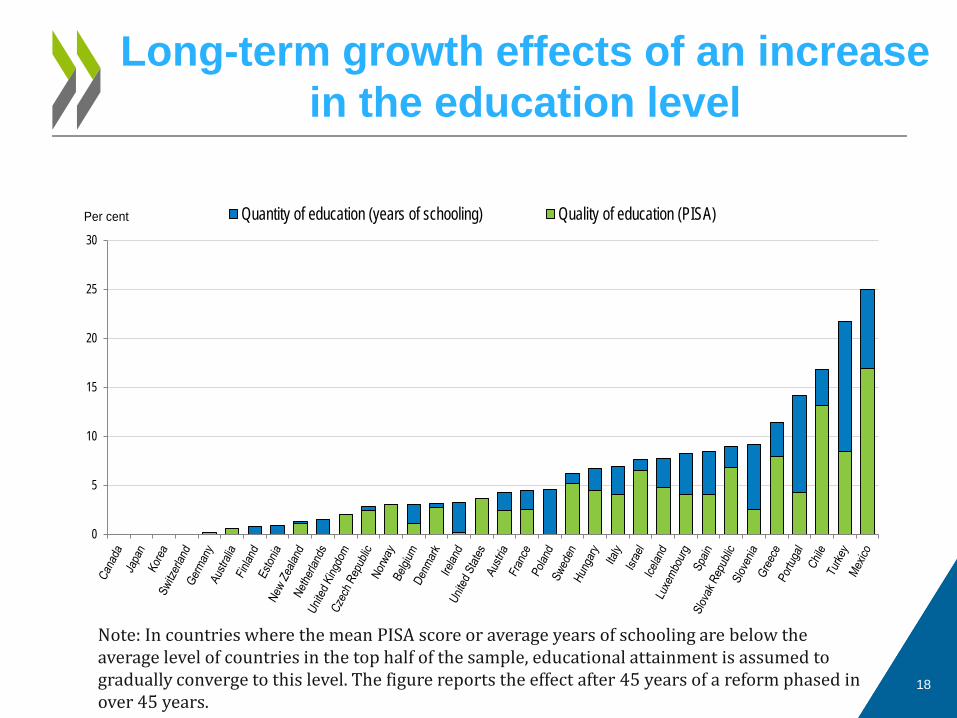
Long-term growth effects of an increase in the education level
18
0
5
10
15
20
25
30
Quantity of education (years of schooling) Quality of education (PISA)Per cent
Note: In countries where the mean PISA score or average years of schooling are below the average level of countries in the top half of the sample, educational attainment is assumed to gradually converge to this level. The figure reports the effect after 45 years of a reform phased in over 45 years.
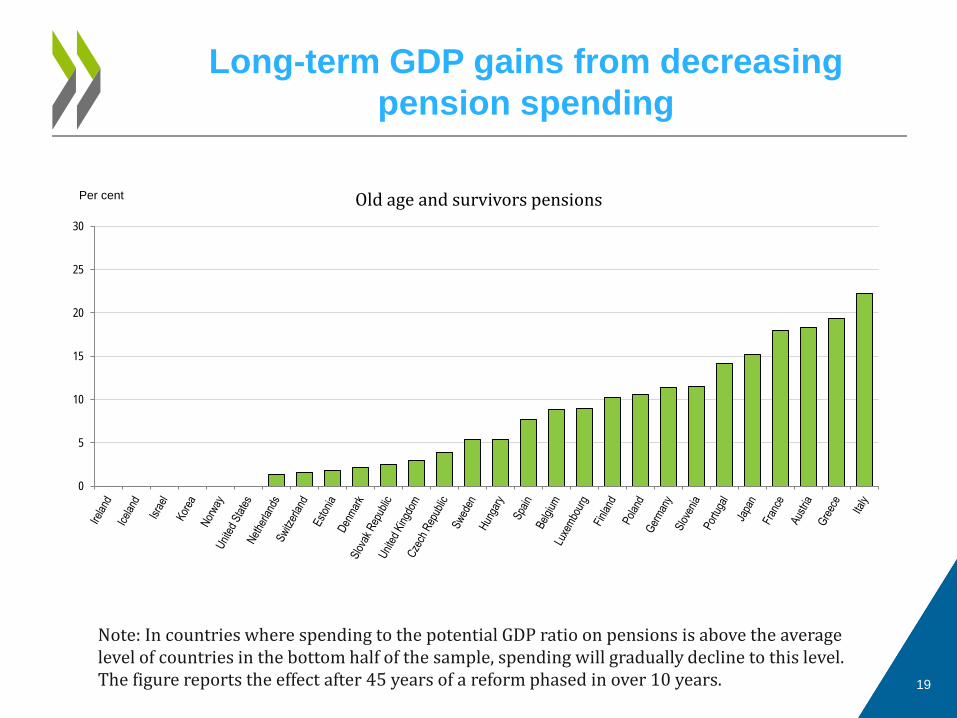
Long-term GDP gains from decreasing pension spending
19
0
5
10
15
20
25
30
Old age and survivors pensionsPer cent
Note: In countries where spending to the potential GDP ratio on pensions is above the average level of countries in the bottom half of the sample, spending will gradually decline to this level. The figure reports the effect after 45 years of a reform phased in over 10 years.
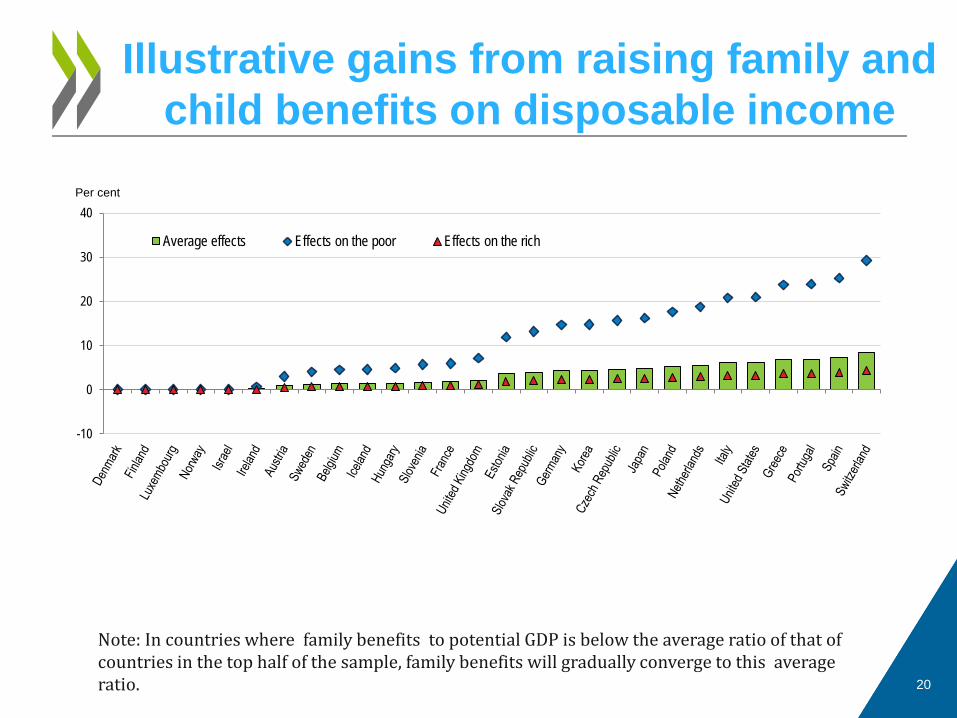
Illustrative gains from raising family and child benefits on disposable income
20
Note: In countries where family benefits to potential GDP is below the average ratio of that of countries in the top half of the sample, family benefits will gradually converge to this average ratio.
-10
0
10
20
30
40
Average effects Effects on the poor Effects on the rich
Per cent
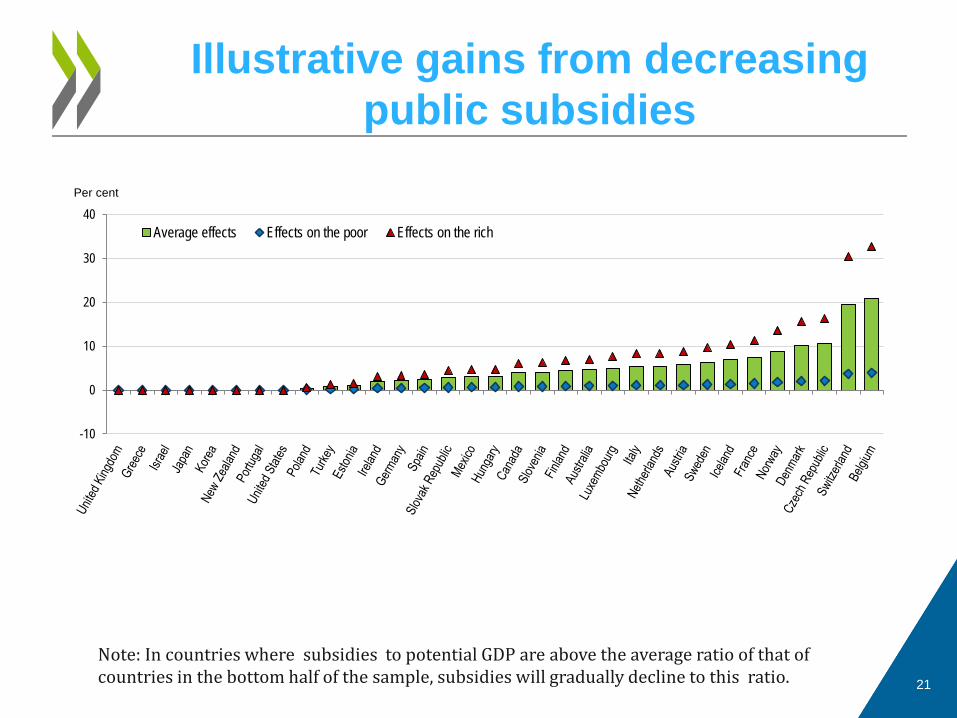
Illustrative gains from decreasing public subsidies
21
Note: In countries where subsidies to potential GDP are above the average ratio of that of countries in the bottom half of the sample, subsidies will gradually decline to this ratio.
-10
0
10
20
30
40Average effects Effects on the poor Effects on the rich
Per cent