FISCAL POLICY AND NATIONAL SAVING IN MEXICO,...
32
FISCAL POLICY AND NATIONAL SAVING IN MEXICO, 1980-2006 * Rodolfo Cerme˜ no Centro de Investigaci´ on y Docencia Econ´ omicas Bernardo D. Roth Protego Evercore F. Alejandro Villag´omez Centro de Investigaci´ on y Docencia Econ´ omicas Tecnol´ ogico de Monterrey, Campus Ciudad de M´ exico Resumen: Se aplican modelos estructurales de vectores autorregresivos para ca- racterizar el impacto din´amico de la pol´ ıtica fiscal sobre el ahorro na- cional, modelos ampliamente utilizados en el caso de la pol´ ıtica mone- taria. Usamos datos ajustados por inflaci´on, fuga de capital, p´ erdida del valor de la deuda y efectos c´ ıclicos, en vez de trabajar con medi- das tradicionales. Nuestros resultados sugieren que, pol´ ıticas fiscales que aumentan el super´ avit estructural, tienen impacto positivo sobre el ahorro nacional, cierto impacto negativo sobre el ahorro privado en el corto plazo, pero ninguno en el largo plazo, as´ ı como un efecto negativo sobre la brecha del producto. Abstract: This paper uses structural vector autoregression (SVAR) models to characterize the dynamic impact of fiscal policy on national saving. SVARs have extensively been used in case of monetary policy. Data adjusted for inflation, capital flight, the value loss of debt and cyclical effects, is used rather than traditional measures. Our results suggest that fiscal policy that increases the structural surplus has a positive impact on national saving, some negative impact on private savings in shorter horizons but any significant effect over longer horizons, and a negative effect on the output gap. Clasificaci´ on JEL: E290, E620, H300 Palabras clave: fiscal policy, national saving, privatesaving, pol´ ıtica fiscal, ahorro nacional, ahorro privado Fecha de recepci´ on: 26 IX 2007 Fecha de aceptaci´ on: 10 VI 2008 * [email protected], [email protected], alejandro.villagomez@ cide. edu Estudios Econ´ omicos, vol. 23, n´ um. 2, julio-diciembre 2008, p´ aginas 281-312
Transcript of FISCAL POLICY AND NATIONAL SAVING IN MEXICO,...
FISCAL POLICY AND NATIONAL SAVINGIN MEXICO, 1980-2006∗
Rodolfo CermenoCentro de Investigacion y Docencia Economicas
Bernardo D. RothProtego Evercore
F. Alejandro VillagomezCentro de Investigacion y Docencia Economicas
Tecnologico de Monterrey, Campus Ciudad de Mexico
Resumen: Se aplican modelos estructurales de vectores autorregresivos para ca-
racterizar el impacto dinamico de la polıtica fiscal sobre el ahorro na-
cional, modelos ampliamente utilizados en el caso de la polıtica mone-
taria. Usamos datos ajustados por inflacion, fuga de capital, perdida
del valor de la deuda y efectos cıclicos, en vez de trabajar con medi-
das tradicionales. Nuestros resultados sugieren que, polıticas fiscales
que aumentan el superavit estructural, tienen impacto positivo sobre el
ahorro nacional, cierto impacto negativo sobre el ahorro privado en el
corto plazo, pero ninguno en el largo plazo, ası como un efecto negativo
sobre la brecha del producto.
Abstract: This paper uses structural vector autoregression (SVAR) models to
characterize the dynamic impact of fiscal policy on national saving.
SVARs have extensively been used in case of monetary policy. Data
adjusted for inflation, capital flight, the value loss of debt and cyclical
effects, is used rather than traditional measures. Our results suggest
that fiscal policy that increases the structural surplus has a positive
impact on national saving, some negative impact on private savings in
shorter horizons but any significant effect over longer horizons, and a
negative effect on the output gap.
Clasificacion JEL: E290, E620, H300
Palabras clave: fiscal policy, national saving, private saving, polıtica fiscal, ahorro
nacional, ahorro privado
Fecha de recepcion: 26 IX 2007 Fecha de aceptacion: 10 VI 2008
∗ [email protected], [email protected], alejandro.villagomez@
cide. edu
Estudios Economicos, vol. 23, num. 2, julio-diciembre 2008, paginas 281-312
¶282 E S T U D IO S E C O N O M IC O S
1 . In tro d u c tio n
During the last three decades the relationship between ¯scal policyand national saving has been at the center of many theoretical andpolicy debates, amid the repeated economic and ¯nancial crises thatMexico has experienced. The 1988 crisis, which had a global e®ect,was caused by huge de¯cits that quickly went beyond the govern-ment's capacity to repay. During the \T equ ila C risis" of 1994, lownational saving contributed to huge macroeconomic problems. Al-though many authors, including Hernandez and Villag¶omez (2001)argue that the lack of national saving was not the cause of this cri-sis, they nonetheless agree that it helped to accelerate the process,leaving the country with huge liquidity constraints and restricted ac-cess to capital markets, thus curtailing its ability to grow. In theaftermath of these events, public policy makers and economic the-orists suggested raising national saving levels by maintaining sound¯nances, and identi¯ed ¯scal policy as the most important transmis-sion channel.
It is known that public de¯cits reduce national savings and in-vestment, and contribute to current account de¯cits. One commonexplanation for this phenomenon is that de¯cits tend to raise realinterest rates which lead, in the short run, to a negative e®ect on bal-ance sheets inducing individuals to consume less, invest less and savemore, just like a negative wealth e®ect. However, in the long run, thise®ect on saving will be reverted by a fall in output. Most economistsagree that public de¯cits reduce, in the long run, domestic capitalstocks, and increase foreign debt, thus increasing the burden for fu-ture generations. Other economists that believe that public de¯citsdo not matter at all, since they will be o®set by the same amountof private saving in the long run. In any case, the impact of ¯scalpolicy on national saving is an unsolved question in macroeconomicsand justi¯es further empirical investigation.
This paper uses structural vector autoregression (S V A R ) modelsto characterize the dynamic impact of ¯scal policy on national sav-ing. S V A R 's have been used extensively to characterize the impact ofmonetary policy on the economy, e.g. Sims and Zha (1998) , Bernankeand Mihov (1998) among others, but have not been applied as oftento ¯scal policy. This paper focuses on the impact of ¯scal policy onnational saving. One important aspect of this research is the use of
1data adjusted for in°ation, capital °ight, the value loss of debt, and
1 T h e d ecrea se in th e rea l va lu e o f d eb t d u e to in ° a tio n .
F IS C A L P O L IC Y A N D N A T IO N A L S A V IN G IN M E X IC O 283
cyclical e®ects, following the work of Amador (2004) , and Pastor andVillag¶omez (2007) , rather than using o±cial data.
2 . R e v ie w o f th e T h e o r e tic a l a n d E m p ir ic a l L ite ra tu re
There are three major theories that explain the relationship between¯scal policy and national saving (Hayford, 2005) . The ¯rst one, aspresented in macroeconomic textbooks, predicts that increases in gov-ernment purchases and/or cuts in taxes reduce national saving. Thisis the traditional Keynesian view (Mankiw, 2007) , where consumptionis independent of government purchases, and consumption increaseswhenever taxes net of transfer payments decrease. Distinctions be-tween temporary versus permanent changes in ¯scal policy do notmatter in this theory.
A second view is based on the ¯nite horizon life-cycle model(L C M , Modigliani and Ando, 1963) , and shows that the impact ofchanges in taxes net of transfer payments depends on the expectedduration of the change. Temporary changes in taxes net of transferpayments have a small impact on national saving. A di®erent versionof the ¯nite L C M is the in¯nite L C M , which is similar to the perma-nent income model if there are operative intergenerational transfers.By introducing government's budgetary constraint in this model, theRicardian Equivalence theorem (R E T ) is obtained (Barro, 1974) .
This third view holds that tax cuts that leave the present valueof government spending constant have no impact on national sav-ing. In this perspective, people, save their tax cut, since they realizethat tax cuts with no change in government spending imply simplya deferment of taxes. Therefore, the reduction in the governmentbudgetary surplus is exactly o®set by an increase in private savingleaving national saving at the same level.
In the R E T view, the impact of changes in government purchasesdepend on whether they are considered to be temporary or perma-nent. Permanent increases in government purchases as percentageof output imply a permanent increase in taxes, thus causing privatesaving to increase by the same amount as the increase in governmentpurchases. In this case, there will be no impact on national savingas percentage of output. However, a temporary increase in govern-ment purchases will cause a smaller increase in private saving, thusreducing national saving.
To sum up, holding the present value of government purchasesconstant, increases in taxes net of transfer payments increase national
¶284 E S T U D IO S E C O N O M IC O S
saving according to the traditional Keynesian view and have no im-pact on national saving according to the R E T . The L C M is betweenthe Keynesian view and the R E T , if the tax change is perceived aspermanent. All three alternative views of the impact of ¯scal policyon national saving hold that increases in government purchases de-crease national saving, particularly in the L C M and R E T , if the changein government purchases is viewed as temporary.
The empirical literature has addressed the impact of ¯scal policyon national saving in Mexico and around the world. This literaturehas focused on di®erent kinds of data as well as estimation methods,supporting the R E T in some cases and the Keynesian view in oth-ers (Burnside, Schmidt-Hebbel, and Serv¶en, 1999) . Gramlich (1989)addresses the importance of data adjustments when estimating theimpact of ¯scal policy on national saving, including adjustments forinterest payments, and business cycle corrections. In a similar con-text, Loayza, Schmidt-Hebbel, and Serv¶en (1998) have constructeda very large savings database, that includes a broader set of coun-tries than earlier databases (150 countries) , corrects inconsistenciesin national accounts data and savings determinants, standardizes de¯-nitions relating to the composition of the public sector, and includes aset of related savings and consumption determinants, such as incomegrowth rates, interest rates, monetary aggregates, and demographicindicators. Using the generalized method of moments (G M M ) they¯nd that the R E T doesn't hold in its strict version, i.e. governmentconsumption is not o®set totally by private saving. They claim thatthis is due to the strong assumptions the R E T implies a p rio ri. Similarstudies analyze the substitutability or complementarity of public andprivate saving in cross-country panels, ¯nding most of the time thatprivate saving is a non-perfect substitute for public saving (Haqueand Montiel, 1989; Campbell y Mankiw, 1990; Corbo and Schmidt-Hebbel,1992; Karras, 1994; Evans and Karras, 1996; Khalid, 1996;and Loayza, Schmidt-Hebbel, and Serv¶en, 2000) .
On the other hand, other types of studies on the impact of ¯scalpolicy on national saving have found that the Keynesian view pre-vails. Using an error correction framework, Pradhan and Upadhyaya(2001) , ¯nd that increases in budget de¯cits reduce national saving.Blanchard and Perotti (2002) use structural vector autoregressions tocharacterize the dynamic response of output to tax and governmentspending shocks. They ¯nd that, consistent with standard textbookmacroeconomics, positive shocks to government spending and neg-ative shocks to taxes increase output. Hayford (2005) performs asimilar analysis using data obtained from the Congressional Budget
F IS C A L P O L IC Y A N D N A T IO N A L S A V IN G IN M E X IC O 285
O±ce (C B O ) , rather than a constructed measure of ¯scal policy as inBlanchard and Perotti (2002) .
The impact of ¯scal policy on national saving, using di®erentdata-adjustments, has been studied for the case of Mexico as well.There are several di®erent methodologies for adjusting savings datain Mexico, but the main adjustments are for gains and losses due toin°ation, for advanced payments of debt due to external and internalin°ation and for foreign interest payments (Arrau and Oks, 1992;Eggerstedt, Hall, and van Wijnbergen, 1995; Carstens and Gil D¶³az,1996; Puchet, 1996; Burnside, Schmidt-Hebbel, and Serv¶en, 1999;and Amador, 2004) . These adjustments are important since Mexicohas experienced high in°ation during the past two decades. Otheradjustments attempt to correct for business cycle °uctuations andseasonal patterns in order to obtain structural measures (Pastor andVillag¶omez, 2007) .
\ T h e lo g ic b eh in d stru ctu ra l m ea su res is th a t o n e p ro b lem in id en tify -
in g th e e® ects o f ¯ sca l p o licy o n n a tio n a l sav in g is th a t g ov ern m en t rev en u es a n d
tra n sfer p ay m en ts resp o n d to ° u ctu a tio n s in eco n o m ic a ctiv ity a s w ell a s p o ten -
tia lly ca u se ° u ctu a tio n s in eco n o m y a ctiv ity. O n e w ay to d ea l w ith th is p ro b lem
is to co n tro l fo r th e e® ects o f cy clica l ° u ctu a tio n s b y u sin g cy clica l a d ju sted o r
stru ctu ra l m ea su res o f ¯ sca l p o licy..." (H ay fo rd , 2 0 0 5 :9 8 3 ).
Several studies have addressed the impact of ¯scal policy on na-tional saving in Mexico, ¯nding in most cases no support for theR E T . G¶omez-Oliver (1989) shows independence between public savingand private saving, while Arrau and Van Wijnbergen (1991) and Oks(1992) ¯nd the same result by showing that consumers perceive pub-lic debt as wealth. Corbo and Schmidt-Hebbel (1992) also obtain thisresult by showing the existence of consumer's liquidity constraints.
However, some studies ¯nd that the R E T holds partially, i. e. gov-ernment purchases are not totally o®set by private saving. Buira(1990) analyzes the determinants of the fall in national saving, ¯ndingthat private saving is the second most important variable, explainingapproximately 35 percent of the decrease. Burnside, Schmidt-Hebbel,and Serv¶en, (1999) ¯nd that public saving has a negative and signif-icant impact on private saving. Finally, the most recent study madeby Burnside (2000) , using structural vector autorregressions (S V A R ) ,¯nds that positive shocks on world oil prices, on the monetary pol-icy of the U S , and on the tax revenues of the Mexican governmenthave a negative e®ect on the Mexican private saving rate, while posi-tive shocks on government consumption-innovations and on the pesodepreciation rate have a positive e®ect.

¶286 E S T U D IO S E C O N O M IC O S
3 . E m p ir ic a l M e th o d o lo g y
3.1 . D a ta a n d V a ria bles
This study uses available quarterly data from the ¯rst quarter of 1980to the ¯rst quarter of 2006, a total of 105 observations. The variablesincluded in the analysis are the adjusted primary structural surplus as
2a percentage of potential G D P , the output gap, and adjusted national3and private saving as a percentage of actual real G D P .
The potential G D P is what an economy can produce in a givenperiod of time without causing destabilizing in°ationary pressures.Two measures of potential G D P were used in this study (graph 1) .They are obtained using the Hodrick-Prescott ¯lter and a vector au-
4toregression model (V A R ) . As mentioned before, the reason for usingpotential G D P is to maintain the structural character of the primarysurplus in order to avoid the possibility that the series is responding to°uctuations in economy activity as well as potentially causing them.Variables taken as a percentage of these two measures of potentialG D P are denoted with the endings H P and V A R respectively.
Three adjustments were performed, following the discussion pre-sented in Amador (2004) . The ¯rst adjustment was for the in°ationtax, which refers to the value loss of money due to in°ation. Whenthe economy goes through a period of high in°ation, money looses itspurchasing power in terms of goods it can buy, although the nomi-nal amount remains the same. This adjustment takes into accountthe fact that the government can ¯nance its expenditures by printing
2 T h e p rim a ry su rp lu s in clu d es th e p u b lica lly -ow n ed secto r a n d leav es o u tin terest p ay m en ts. In terest p ay m en ts a re left o u t sin ce th ey h av e a stro n g cy clica lco m p o n en t w h ich w e w a n t to av o id . S u rp lu s is u sed in stea d o f d e¯ cit b eca u se o f
ea se o f in terp reta tio n .3 In th is p a p er th e co n cep t o f n a tio n a l sav in g is w h a t a n eco n o m y sav es in sid e
its b o u n d a ries, w ith o u t d istin g u ish in g b etw een fo reig n a n d d o m estic sav in g .4 F o llow in g th e d iscu ssio n o f P a sto r a n d V illa g ¶o m ez (2 0 0 7 ), th e V A R w a s
estim a ted w ith tw o la g s, in clu d in g 1 0 5 q u a rterly o b serva tio n s d u rin g th e p erio d o f1 9 8 0 to 2 0 0 6 , o f tw o ex o g en o u s va ria b les: th e in d u stria l p ro d u ctio n o f th e U n itedS ta tes a n d th e rea l M ex ica n p etro leu m ex p o rts (rep o rted b y th e In tern a tio n a lM o n eta ry F u n d S ta tistics a n d th e In stitu to N a cio n a l d e E sta d¶³stica , G eogra f¶³ae In fo rm ¶a tica (IN E G I), resp ectiv ely ), a n d th ree en d o g en o u s va ria b les: th e rea lM ex ica n G D P , th e em p loy m en t lev el a n d th e m o n eta ry a g g reg a te M 1 (rep o rtedb y IN E G I a n d B a n xico ). A ll series w ere sea so n a lly a d ju sted u sin g e-v iew s a d d itiv e
X 1 1 .

F IS C A L P O L IC Y A N D N A T IO N A L S A V IN G IN M E X IC O 287
money, as Mexico did before the Salinas presidency. The in°ationtax is estimated by multiplying the average monetary base times the
5in°ation of the IN P C of corresponding periods. This adjustmentaccounts for 6, 4.2 and 1.3 percent of annual G D P , when in°ationreached 75 percent in 1982, 110 percent in 1988 and 32 percent in1995, respectively (graph 2) .
6The second adjustment was for the value loss of internal and ex-7ternal debt, due to internal and external in°ation, respectively. The
spikes shown in graph 3 correspond to peaks in the rate of in°ationin 1982 and 1987, when the value loss of debt accounted for 11.4 and20 percent of annual G D P , respectively. The value loss of debt was
8calculated assuming that all debt was contracted with the U S .The third adjustment was for capital °ight: asset-°ows ending
abroad which are not captured by the current account. Since thecapital °ight normally has a positive value, omitting this adjustmentwould lead to an overestimation of the amount of foreign saving andunderestimation of national saving. The capital °ight is obtainedby an indirect method; adding the debt °ow and the F D I and thensubtracting the current account balance, which is the change in in-ternational reserves and the change in public assets abroad. Thisadjustment assumes that the debt °ow and the F D I should ¯nancethe current account de¯cit or the accumulation of public reserves.The residual value of these transfers is thus the capital °ight, mean-ing, when positive, that capital is going out of the country and whennegative, that capital is °owing into the country. Finally, interestrates on Mexican assets held abroad are estimated with a weighted
9return rate and then added to this residual.
5 ¶In d ice n a cio n a l d e p recio s a l co n su m id o r (n a tio n a l co n su m er p rice in d ex )
rep o rted b y th e B a n co d e M ¶exico .6 In o rd er to o b ta in th e va lu e lo ss o f in tern a l d eb t d u e to in ° a tio n , th e b ro a d
in tern a l eco n o m ica l d eb t, rep o rted b y B a n x ico , w a s m u ltip lied b y th e ch a n g e in
th e IN P C .7 T o ca lcu la te th e va lu e lo ss o f ex tern a l d eb t d u e to fo reig n in ° a tio n , th e b ro a d
ex tern a l d eb t rep o rted b y B a n xico w a s m u ltip lied b y th e ch a n g e in th e C P I o f th e
U n ited S ta tes.8 T h is is n o t q u ite tru e. H ow ev er, A m a d o r su g g ests th a t th is is a g o o d a p -
p rox im a tio n fo r th e rea l va lu e lo ss, sin ce m o st o f th e d eb t h a s b een co n tra ctedw ith th e U S a n d th e rest w ith E u ro p ea n co u n tries a n d J a p a n , w h ich h av e sim ila r
ra tes o f in ° a tio n .9 F o r a m o re d eta iled ex p la n a tio n see A m a d o r (2 0 0 4 ).

288 ESTUDIOS ECONOMICOS
Graph 1Actual GDP, HP-GDP and VAR-GDP(billions of pesos of 2002)
Source: INEGI and estimations based on the metho-
dology suggested in Pastor and Villagomez (2007).
Graph 2Inflationary Tax as Percentage of GDP
Source: Banco de Mexico.

FISCAL POLICY AND NATIONAL SAVING IN MEXICO 289
Graph 3Inflation and Value Loss of Debt as Percentage of GDP
Source: Banco de Mexico, and estimations based on
the methodology suggested in Amador (2004).
The primary structural surplus10 is obtained by taking the dif-ference between the budgetary income and expenses, adjusting thefiscal component of the budgetary income. This adjustment is madeby multiplying income from taxes times the potential GDP to actualGDP ratio raised to the power of the tax-income elasticity11 with re-spect to actual real GDP. To obtain the adjusted primary structuralsurplus (SUPA HP or SUPA VAR) as a percentage of potential GDP theinflation tax and the value loss of debt are added. Just as the incometax needs to be adjusted when calculating the traditional primarystructural surplus, in this case, the inflation tax has to be adjusted
10 Data was obtained from Secretarıa de Hacienda y Credito Publico (SHCP).Budgetary data was used rather than actual income and expenses, since this data
was not available for 2006 when we were running the models.11 The product elasticity is obtained by running a regression of the income
from taxes against the actual GDP, both in logarithms. By using this approachthe cyclical impact of actual GDP over tax income is mitigated, since it preventsoverestimation or underestimation of its value during an expansive or recessive
phase.

290 ESTUDIOS ECONOMICOS
as well, by multiplying it by ratio of the potential GDP to actual GDP
ratio raised to the power of its elasticity with respect to the actualreal GDP (graph 4).
Graph 4Actual and Adjusted Structural Deficits as Percentage of GDP
Source: Subsecretarıa de Hacienda y Credito Publico, Direccion
General de Planeacion Hacendaria, Sistema de Finanzas y Deuda
Publica.
National saving was calculated as the difference between totalsaving and foreign saving. Total saving is the sum of gross capitalformation and inventory changes, while foreign saving is just mea-sured by the current account.12 To obtain the adjusted national sav-ing series as a percentage of GDP (ANS), the value loss of debt andcapital flight were subtracted from foreign saving. Adjusted nationalsaving is obtained by taking the difference between total saving andthe adjusted foreign saving series. This new series, as graph 5 shows,
12 All saving series were obtained from the INEGI.

FISCAL POLICY AND NATIONAL SAVING IN MEXICO 291
presents a deeper fall than the official series due to the capital repa-triation during 1988-1993.
Graph 5Traditional and Adjusted National Saving as Percentage of GDP
Source: INEGI, and estimations based on the methodology sug-
gested in Amador (2004).
Private saving is calculated by subtracting public saving from na-tional saving, while public saving is calculated by taking the differencebetween capital expenditures (public investment) and the economicdeficit13 (graph 6). The adjusted private saving series is obtained asthe difference between adjusted national and public saving. Adjustedpublic saving is calculated by adding the inflation tax and the value
13 The economic deficit includes the public sector but doesn’t discount interestpayments as does the primary deficit. Capital expenditures are the sum of three
components: physical investment, financial investment, and capital expendituresunder the net transference category (to other states and public sector dependen-
cies).

292 ESTUDIOS ECONOMICOS
loss of debt. The main difference between the official series and theadjusted series, as graph 7 shows, is that the adjusted private savingseries as percentage of GDP (APS) has a deeper fall before the 1994crisis, accounting for 6.18 and 5.19 percent annually during the twoyears before the crisis.
Finally the output gap is calculated as the deviation of actualGDP from potential GDP (graph 8). This variable indicates whetherthe economy is in an expansive or recessive phase. The output gapis included in the analysis because this variable should represent thestabilization motive of fiscal policy, reflecting the trade-off betweenhaving major surpluses, which improve the budgetary sustainability,and having a negative impact in the short run on the output gap.There are two measures of output gap; one considers the HP-potentialGDP, and the other the VAR-potential GDP. These two measures aredenoted as GAP HP and GAP VAR, respectively.
Graph 6Traditional and Adjusted Public Saving as Percentage of GDP
Source: INEGI, and estimations based on the methodology sug-
gested in Amador (2004).

FISCAL POLICY AND NATIONAL SAVING IN MEXICO 293
Graph 7Traditional and Adjusted Private Saving as Percentage of GDP
Source: INEGI, and estimations based on the methodology
suggested in Amador (2004).
Graph 8Output Gap HP and VAR
Source: INEGI.
294 ESTUDIOS ECONOMICOS
Summing up, three major adjustments have been made to theseries, namely the inflation tax, the value loss of debt and the capitalflight. Adjusted primary structural surplus is calculated by correct-ing for the inflation tax and the value loss of debt. Adjusted nationalsaving was obtained by correcting foreign saving for the value lossof debt and the capital flight, while adjusted private saving was ob-tained as the residual of adjusted national saving and adjusted publicsaving, the latter being corrected by the inflation tax and the valueloss of debt. The output gap is included because this variable shouldrepresent the stabilization motive of fiscal policy.
3.2. Econometric Model
This paper uses structural vector autoregression (SVAR) models tocharacterize the dynamic impact of fiscal policy on national saving.The general specification of the model is given by:
AXt = B(L)Xt−1 + εt (1)
where Xt is a (nx1) vector of endogenous variables, A is a (nxn) pa-rameter matrix with ones on its main diagonal and with off diagonalelements capturing the contemporaneous relationships between theendogenous variables, B(L) is a polynomial matrix in the lag opera-tor, and εt is a (nx1) vector of structural shocks. The reduced formof (1) is given by the standard VAR model:
Xt = D(L)Xt−1 + ut (2)
Where D(L) = A−1B(L) and ut = A−1εt. Notice that (1) is asystem of simultaneous equations and needs to be identified in orderto have proper economic interpretation. Econometrically, if the sys-tem is identified, then it will be possible to recover the parameters ofthe structural model (1) from the estimates of the reduced form givenby (2). One common procedure for identification is to impose restric-tions on the coefficients of matrix A such that it becomes triangular.This procedure, which results in a recursive system, was first proposedby Sims (1980) and is widely used in the macroeconometric literature.In this paper, we will pursue a similar approach for identification. Itis important to remark that this procedure implies imposing certainexogeneity restrictions on the variables in Xt, which needs theoreti-cal or empirical justification. In terms of impulse-response analysis,identification is crucial since it makes it possible to properly simulate
FISCAL POLICY AND NATIONAL SAVING IN MEXICO 295
the effects of structural shocks (εt) on the dynamics of the system,which are different from reduced form shocks (ut). Technically, theelements in the error vector ut are in fact linear combinations of thepure structural shocks in εt and it is necessary to establish these re-lationships in order to have a proper economic interpretation. Thisis possible when the system is identified. It is well known that a nec-essary condition for identification of system (1) can be obtained byimposing n(n− 1)/2 restrictions on the A matrix (Enders, 1995; andLutkepohl and Krazig, 2002).
To be more specific, in the present study X will be a three-dimensional vector defined as X ′
t = [x1t, x2t, x3t], where x1t is theadjusted structural surplus, x2t is the output gap, and x3t is adjustednational saving or adjusted private saving. Let ε′t = [ε1t, ε2t, ε3t]be the corresponding vector of structural shocks. Without loss ofgenerality, we can assume that B(L) = 0 and express the originalstructural system as:
1 a12 a13
a21 1 a23
a31 a32 1
×
x1t
x2t
x3t
=
ε1t
ε2t
ε3t
(3)
Since n = 3, only three restrictions on the elements of matrix Aare needed in order to identify the system. To this end, we follow theargument that: “Given the inside lags of fiscal policy, Blanchard andPerotti (2002) argue that discretionary changes in fiscal policy willnot respond contemporaneously to the economy” (Hayford, 2005:985).This implies that a12 = a13 = 0, leaving one additional restriction tobe imposed.14 One possibility is to set a21 = 0 which implies thatnational saving does not depend contemporaneously on the outputgap, an assumption that might be difficult to defend. A more plau-sible alternative is to set a23 = 0, which implies that the output gapdoes not depend contemporaneously on national saving, for exampleto shocks on consumption.
14 Suggestions were made to control for the possibility that discretional fiscalpolicy changes on taxation and public saving could have different effects on privateand national saving. However, since the theoretical framework that assesses theseeffects, is approached through a consumption function, it is not possible to controlfor these effects under the proposed system of equations, which is based on asaving function. Furthermore, Mexican data on consumption has been recordedsince 1993; this reduces the number of observation available and consequently
decreases the robustness of any analysis.

296 ESTUDIOS ECONOMICOS
One possible justification for this assumption is that shocks tonational saving are initially absorbed by changes in inventories andonly in later periods will they impact the output gap.
Altogether, the previous restrictions produce a recursive systemas suggested by Sims (1980). These restrictions imply that the outputgap is contemporaneously affected only by the structural surplus whileadjusted saving is contemporaneously affected by both the structuralsurplus and the output gap. Given that these identification restric-tions imposed on matrix A are crucial to the rest of the analysis theywill be tested explicitly as discussed in the following section.
3.3. Empirical Strategy
In the first place we perform unit root tests on all the variables. Aspercentages of either potential GDP or actual GDP, all variables arebounded between 0 and 100 percent and hence on logical groundsthey are stationary variables. However, given the limited sample size,and as graphical inspection suggests, the dynamics of the variables inlevels appears to be consistent with processes with stochastic trends,i.e. unit root processes. It is important to consider, though, thatthe bounded feature of all variables strongly suggests that if indeedthey can be described by unit root processes they are unlikely tohave drifts for otherwise they will have an ever increasing or everdecreasing pattern which would not be consistent with their characterand observed behavior. In practice, this means that if the variablescan be modeled as unit root processes they should not have interceptsor time trends.15
Given the previous scenario, we believe that the best strategyto follow is the one developed by Perron (1988), who suggests a se-quential testing procedure to determine if a process have unit rootsand, in addition, if they include deterministic components or not.The sequence of tests starts with the more general case under thealternative hypothesis, which is a model with an intercept and a timetrend. If no deterministic components are found, the final model un-
15 Strictly, these processes would be better modeled as bounded random walksas suggested by Nicolau (2002). Although they are stationary processes theybehave exactly like random walks except that they are stochastically bounded byupper and lower finite limits. We thank an anonymous referee for suggesting this
clarification.

FISCAL POLICY AND NATIONAL SAVING IN MEXICO 297
der the null hypothesis will be a unit root process without drift.16 Weclearly expect to find that this is indeed the case for all of our vari-ables. Next, and before going on to estimation of the model, somedescriptive analysis based on dynamic correlations is in order, andas well as attempts to provide a preliminary picture of the dynamicinterrelationships among the variables under study.
Since we have to perform some tests of hypothesis, particularlythe identification restrictions discussed in the previous sub-section,the model must be stationary. Thus, if indeed our variables can becharacterized as unit root processes (without drifts) we proceed toestimate the SVAR model with the variables in first differences. Foursets of estimations will be performed depending on the type of mea-sure considered (relative to potential GDP estimated by HP filter or aVAR model) and the measure of savings (national or private).
In order to test for the validity of the identification restrictionsdiscussed in the previous section (a12 = a13 = a23 = 0) we will carryout Wald and Likelihood-ratio tests. In the first case, we estimate theSVAR model in unrestricted form while in the second case we estimateboth the restricted and unrestricted specifications. The unrestrictedmodel assumes that all coefficients in matrix A are different fromzero while the restricted model assumes that a12 = a13 = a23 = 0 asdiscussed in section 3.2. Both tests will be contrasted with criticalvalues from a Chi-squared distribution with 3 degrees of freedom.All specifications for this purpose will be estimated by maximumlikelihood.17
Finally, once the identification restrictions are validated we willestimate the proposed SVAR models. For practical considerations wewill only report results on the impulse-response functions, focusing onthe impact of structural policy shocks. The following section discussesthe most relevant empirical findings.
16 If deterministic components were found, then we will consider the morepowerful unit root tests by Elliot, Rothenberg, and Stock (1996) and Ng andPerron (2001). Also, we will use the test by Kwiatkowsky et al. (1992), popularly
known as KPSS test, which considers stationarity under the null hypothesis.17 It is important to remark that this testing procedure directly evaluates the
contemporaneous relationship among the variables in the system and the validityof the assumed exogenous or endogenous character of the variables. Notice that wedo not follow Granger-causality tests since they would only shed light on whetherlagged values of a variable will influence actual values of another variable but not
on the contemporaneous relationship among variables.
298 ESTUDIOS ECONOMICOS
4. Estimations and Results
4.1. Unit Root Tests
Table 1 shows the results of the sequential unit root testing imple-mented following Perron (1988). The sequence of tests for each vari-able is shown in each column. Starting from the most general model,the sequential testing procedure continues to the next test as longas the null hypothesis is not rejected. Specifically, if test 1 acceptsthe null unit root, we go on with test 2 which is a joint test of thenull of unit root and no time trend in the model. If this test acceptsthe null, we proceed with test 3 which is a unit root test in a modelthat only has an intercept since the time trend was discarded by theprevious test. Provided test 3 accepts the null of unit root we applytest 4 which tests the null of unit root and no drift (intercept) in themodel. If this hypothesis is accepted we conclude that the processhas a unit root but does not have intercept or trend. In order toreconfirm the previous result we finally test for a unit root in a modelwithout deterministic components, which is done through test 5. Forcompleteness, we report in the last row of table 1 the ADF test appliedto the first differences of the variables.
In all cases, tests 1 through 4 show unambiguously non-rejectionof the null hypotheses confirming that all variables can be modeled asunit root processes without trends or intercepts, which is consistentwith their bounded feature. The results of test 5 reconfirm (at the1 percent significance level) that all the variables can be modeled asunit root processes and the results of test (6) in the last row indicatethat the first differences of all variables are stationary.18
4.2. Dynamic Cross-Correlation Analysis
Before presenting and discussing the main results, dynamic cross-correlations of adjusted national saving and adjusted private sav-ing with the other variables are shown in order to provide stylized
18 In the case of test (5) we find that it is significant at the 5 percent levelfor one variable and at the 10 percent level for two variables pointing to possibly
stationary processes. However, given the results from tests (1) through (4) andtest (6) we will assume that all processes have a unit root. Further research to
achieve a more definite characterization of these processes is certainly necessary.

FISCAL POLICY AND NATIONAL SAVING IN MEXICO 299
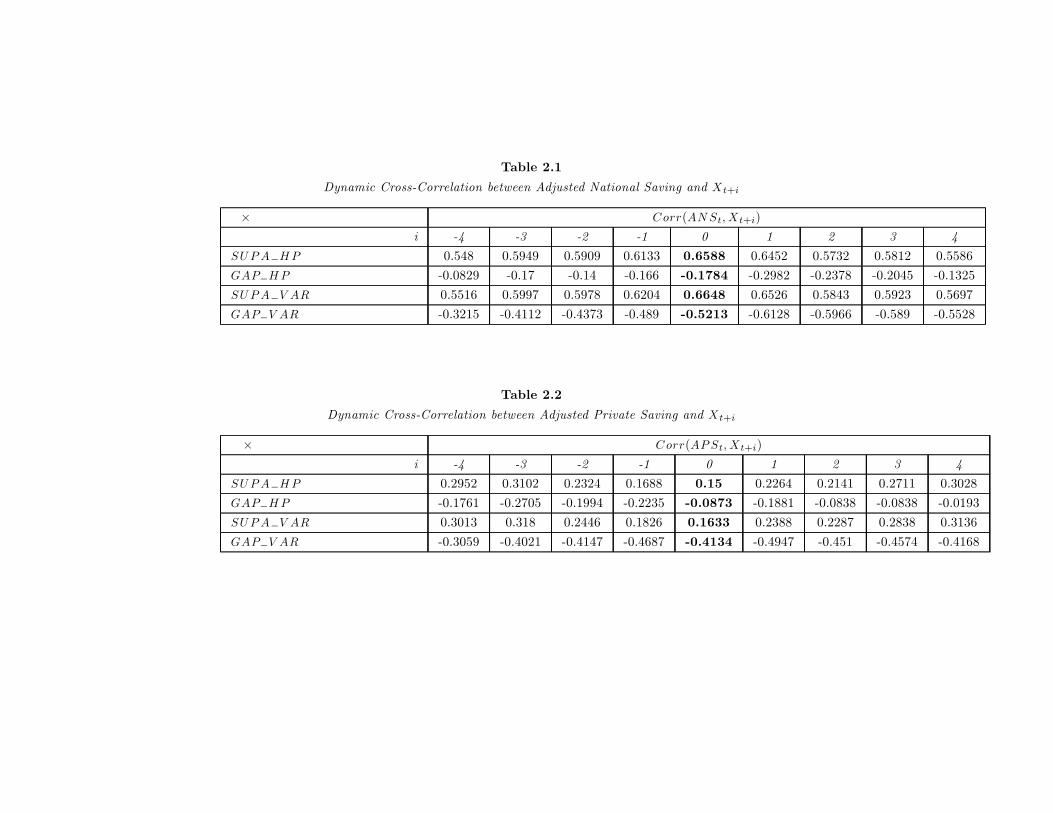
findings that may be consistent with the regression analysis. Ta-ble 2.1 shows the dynamic cross-correlations between adjusted na-tional saving (ANS) and both adjusted structural surpluses (SUPA HP
and SUPA VAR), and both measures of the output gap (GAP HP andGAP VAR), for four lags and leads.
The most striking finding from the correlation matrix in table2.1 is the strong positive contemporaneous correlation between ANS
and both measures of adjusted structural surpluses. This strong cor-relation persists at leads and lags, suggesting the possibility that theKeynesian view holds.
Another interesting feature of the data is that the negative cor-relation with the GAP VAR is greater than with the GAP HP, althoughboth of them show a slight asymmetry between lead and lag. In dy-namic cross-correlation analysis, asymmetries are often taken as anindication of a lead-lag relationship between two variables. For exam-ple, whenever adjusted national saving is more highly correlated withfuture output gap than past output gap, we might say that outputgap lags adjusted national saving. This finding suggests that whenadjusted national saving is high the output gap will fall in the nextperiods.
Table 2.2 provides the correlation matrix for adjusted privatesaving (APS) and both adjusted structural surpluses and output gapmeasures.
Contrary to what was found in table 2.1, APS contemporane-ous correlation with both adjusted structural surpluses is near tozero, positive and symmetrical. This finding indicates possible non-completion of the RET. The negative correlations between APS andboth output gaps show an asymmetry towards the leads, even thoughthe only strong correlation is between APS and GAP VAR. This wouldsuggest, as in the former case in which the correlations between ANS
and both output gaps is discussed, that APS leads the output gap,which is not so surprising since APS forms part of ANS.
Summing up, both measures of the adjusted structural surplusshow positive and non dynamic cross-correlation with ANS and APS,respectively, while both measures of the output gap show negativedynamic cross-correlations with ANS and APS with asymmetries, sug-gesting that both saving measures lead both output gap measures.
4.3. Testing the Exogeneity Restrictions
As mentioned in section 3.2. the order of the variables in the SVAR
model is as follows: first we include the adjusted structural surplus,

T a b le 1
U n it R oo t T ests
M od el a n d V a ria ble
N u ll H ypo th esis A N S A P S G A P H P G A P V A R S U P A H P S U P A V A R¡ ¡ ¡ ¡M od el A : ¢y = ® + ¯ t + ± y + vt t¡ 1 t
(1) H : ± = 0 -2.05 -2.34 -2.16 -1 .958 -1 .35 -1 .330
(2) H : ± = 0;¯ = 0 2.11 2.76 2.39 1 .92 1 .05 1 .010
M od el B : ¢y = ® + ± y + vt t¡ 1 t
(3) H : ± = 0 -1.55 -2.29 -2.18 -1 .88 -1 .09 -1 .080
(4) H : ± = 0;® = 0 1.22 2.64 2.38 1 .79 1 .45 1 .370
M od el C : ¢y = ± y + vt t¡ 1 t
(5) H : ± = 0 -0.67 -0.68 -2.19** -1 .90* -1 .71* -1 .660
2M od el D : ¢ y = ±¢y + vt t¡ 1 t
(6) H : ± = 0 -15*** -15*** -7.9*** -2.5** -9.5*** -9.5***0
N o te: T h e seq u en tia l testin g in clu d es tests (1 ) th ro u g h (5 ). H y p o th eses (1 ), (3 ) a n d (5 ) a re eva lu a ted w ith A D F t-tests
a n d p -va lu es in p a ren th esis a re b a sed o n M a cK in n o n 's resp o n se su rfa ce ta b les. H y p o th eses (2 ) a n d (4 ) a re eva lu a ted w ith A D F
F -tests. C ritica l va lu es a t th e 5 % a n d 1 0 % lev els a re a p p rox im a tely 8 .7 3 a n d 6 .4 9 fo r (2 ) a n d 6 .7 0 a n d 4 .7 1 fo r h y p o th esis (4 ).
T h e la st row rep o rts A D F t-tests a p p lied to th e ¯ rst d i® eren ces o f th e va ria b les a s sp eci ed b y m o d el D . In a ll ca ses th e term
v in clu d es p la g s o f th e co rresp o n d in g left h a n d sid e va ria b le o f ea ch m o d el w ith p d eterm in ed b y th e m o d i ed A IC criterio n .t
T h e sy m b o ls * , * * , * * * in d ica te resp ectiv ely, 1 0 , 5 a n d 1 p ercen t sig n i ca n ce lev els.
T a b le 2 .1
D yn a m ic C ro ss-C o rrela tio n betw een A d ju sted N a tio n a l S a vin g a n d X t+ i
£ C o r r (A N S ;X )t t+ i
i -4 -3 -2 -1 0 1 2 3 4
S U P A H P 0.548 0.5949 0.5909 0.6133 0 .6 5 8 8 0.6452 0.5732 0.5812 0.5586¡G A P H P -0.0829 -0.17 -0.14 -0.166 -0 .1 7 8 4 -0.2982 -0.2378 -0.2045 -0.1325¡S U P A V A R 0.5516 0.5997 0.5978 0.6204 0 .6 6 4 8 0.6526 0.5843 0.5923 0.5697¡G A P V A R -0.3215 -0.4112 -0.4373 -0.489 -0 .5 2 1 3 -0.6128 -0.5966 -0.589 -0.5528¡
T a b le 2 .2
D yn a m ic C ro ss-C o rrela tio n betw een A d ju sted P riva te S a vin g a n d X t+ i
£ C o r r (A P S ;X )t t+ i
i -4 -3 -2 -1 0 1 2 3 4
S U P A H P 0.2952 0.3102 0.2324 0.1688 0 .1 5 0.2264 0.2141 0.2711 0.3028¡G A P H P -0.1761 -0.2705 -0.1994 -0.2235 -0 .0 8 7 3 -0.1881 -0.0838 -0.0838 -0.0193¡S U P A V A R 0.3013 0.318 0.2446 0.1826 0 .1 6 3 3 0.2388 0.2287 0.2838 0.3136¡G A P V A R -0.3059 -0.4021 -0.4147 -0.4687 -0 .4 1 3 4 -0.4947 -0.451 -0.4574 -0.4168¡
¶302 E S T U D IO S E C O N O M IC O S
then the output gap, and ¯nally one measure of adjusted savings,either A N S or A P S . This ordering, together with the identi¯cationrestrictions imposed on the A matrix imply that structural adjustedsurplus is fully exogenous, i.e. it a®ects but is not a®ected by all othervariables, while saving (national or private) is fully endogenous. Onthe other hand, the output gap variable is endogenous with respectto the structural surplus and exogenous to adjusted savings.
Before estimating the S V A R models we tested the previous iden-ti¯cation restrictions, and found strong support for their validity in
1 9all four cases considered. Speci¯cally, the Wald test statistics are1 .43, 0.19, 2.39 and 1.74 and the Likelihood Ratio tests are 2.05, 0.69,3.94 and 4.39. None of these values are signi¯cant when contrastedwith critical values from a C h i-square distribution with 3 degrees offreedom, and therefore the joint hypothesis that a = a = a = 01 2 1 3 2 3
cannot be rejected implying that the assumption on the exogenousor endogenous nature of the variables postulated in this exercise isstatistically valid.
4.4. S V A R Im p u lse-R espo n se A n a lysis
Following our discussion in section 3.2. we specify two S V A R mod-els. Model 1 includes adjusted national saving (A N S ) and model 2includes adjusted private saving (A P S ) . Both models include struc-tural surplus and output gap measures. Two versions of each modelhave been estimated depending on whether these measures are takenas percentage of the potential G D P obtained from the H P -¯lter or theV A R model. The order of the variables is as follows: ¯rst we includethe adjusted structural surplus, then the output gap, and ¯nally onemeasure of adjusted savings, either A N S or A P S .
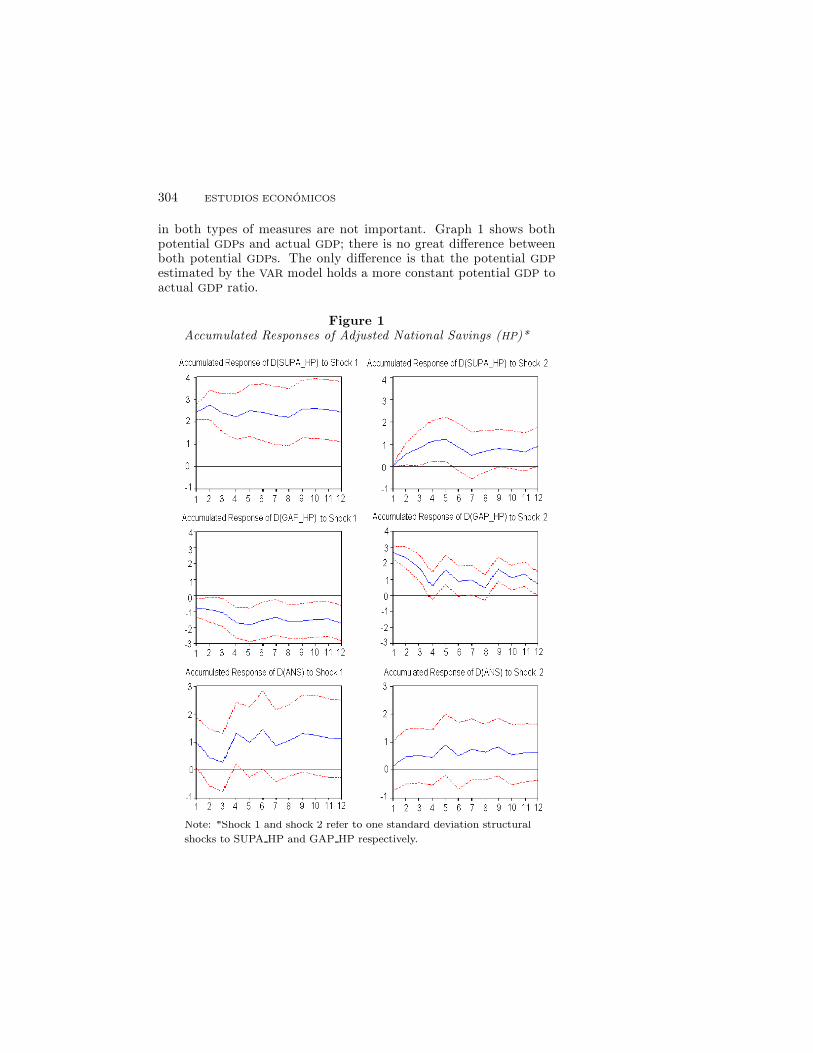
Since all variables are considered in ¯rst di®erences the S V A Rmodel was estimated without constant or linear trends. The AkaikeInformation Criterion suggests ¯ve lags in all cases. Figure 1 showsthe impulse-response function for model 1 which considers A N S andH P ¯ltered measures of the other variables. The results show thatadjusted national saving as percentage of actual G D P (A N S ) respondspositively to positive shocks of the adjusted structural surplus as per-centage of potential G D P (S U P A H P ). It is important to note, though,that the e®ects are clearly positive and di®erent from zero with 95%con¯dence for periods 1, 4 and 6. For all other periods the e®ects
1 9 In th e n ex t sectio n w e d escrib e ea ch o f th ese ca ses.

F IS C A L P O L IC Y A N D N A T IO N A L S A V IN G IN M E X IC O 303
continue to be positive but they are di®erent from zero with less than95% con¯dence. A negative e®ect on the output gap (G A P H P ) dueto a positive shock to S U P A H P can be observed as well and this hap-pens at any conventional signi¯cance level. This result indicates thatwhen the adjusted structural surplus increases, output falls, which islogical since countercyclical government policies reduce expendituresand hence make output fall. Summarizing, the results for model 1indicate that positive shocks to the adjusted structural surplus willincrease adjusted national saving while contracting output below itspotential level.
When we consider model 2, which includes adjusted private sav-ing (A P S ) as a percentage of G D P , we ¯nd that a positive shock tothe adjusted structural surplus as percentage of G D P measured bythe H P -¯lter has a negative e®ect the on output gap. The responseof A P S to the S U P A H P shock indicates a negative e®ect during the¯rst three periods. This e®ect remains negative after the third periodbut is not signi¯cantly di®erent from zero. These results combinedwith the result for model 1 provide some support for the traditionalKeynesian view: a positive shock to the structural surplus increasesnational saving, reduces private saving over short horizons but has nosigni¯cant impact over longer horizons, and contracts output belowits potential level.
According to the Keynesian view, consumption and hence privatesaving are independent of government purchases and national savingincrease whenever taxes net of transfer payments increase or govern-ment expenditure falls. These kind of results are found in G¶omez-Oliver (1989) , Arrau and Van Wijnbergen (1991) , Oks (1992) , Corboand Schmidt-Hebbel (1992) . In contrast, Buira (1990) , Burnside,Schmidt-Hebbel and Serven (1999) , and Burnside (2000) , ¯nd thatthe R E T holds in a partial manner. The authors who claim that theR E T doesn't hold argue that the assumptions made for this theoryto hold are too strong and do not necessarily apply in countries likeMexico. Regarding the responses of positive shocks to the outputgap, we ¯nd that while they have some positive e®ect on nationalsaving over the following four quarters, they have negative but notsigni¯cant e®ect on private saving. This ¯nding suggests that thewealth e®ect caused due by an increase in income is netted out bythe substitution e®ect.
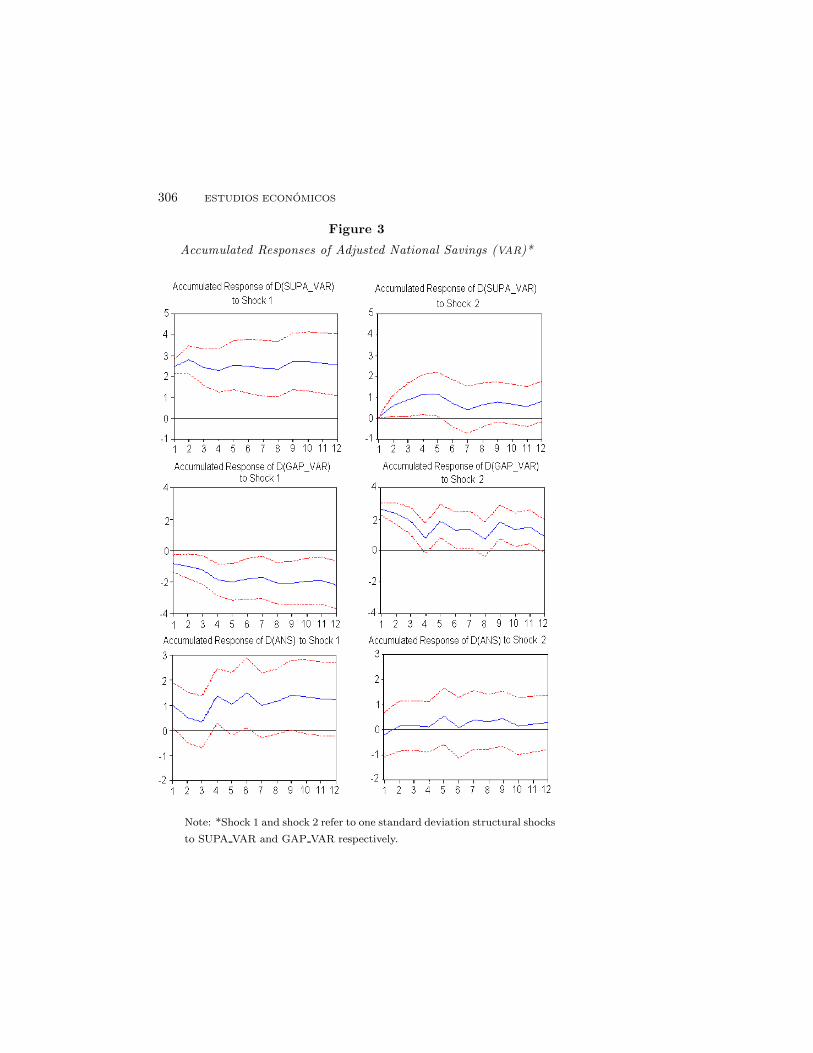
Figures 3 and 4 show the results obtained for the same previ-ous models using variables measured as percentage of potential G D Pestimated by the V A R model. The results are very similar to thoseobtained using the H P measure, re°ecting the fact that the di®erences
¶304 E S T U D IO S E C O N O M IC O S
in both types of measures are not important. Graph 1 shows bothpotential G D P s and actual G D P ; there is no great di®erence betweenboth potential G D P s. The only di®erence is that the potential G D Pestimated by the V A R model holds a more constant potential G D P toactual G D P ratio.
F ig u re 1A ccu m u la ted R espo n ses o f A d ju sted N a tio n a l S a vin gs (H P )*
N o te: * S h o ck 1 a n d sh o ck 2 refer to o n e sta n d a rd d ev ia tio n stru ctu ra l
sh o ck s to S U P A H P a n d G A P H P resp ectiv ely.

F IS C A L P O L IC Y A N D N A T IO N A L S A V IN G IN M E X IC O 305
F ig u re 2
A ccu m u la ted R espo n ses o f A d ju sted P riva te S a vin gs (H P )*
N o te: * S h o ck 1 a n d sh o ck 2 refer to o n e sta n d a rd d ev ia tio n stru ctu ra l
sh o ck s to S U P A H P a n d G A P H P resp ectiv ely.
¶306 E S T U D IO S E C O N O M IC O S
F ig u re 3
A ccu m u la ted R espo n ses o f A d ju sted N a tio n a l S a vin gs (V A R )*
N o te: * S h o ck 1 a n d sh o ck 2 refer to o n e sta n d a rd d ev ia tio n stru ctu ra l sh o ck s
to S U P A V A R a n d G A P V A R resp ectiv ely.

F IS C A L P O L IC Y A N D N A T IO N A L S A V IN G IN M E X IC O 307
F ig u re 4
A ccu m u la ted R espo n ses o f A d ju sted P riva te S a vin gs (V A R )*
N o te: * S h o ck 1 a n d sh o ck 2 refer to o n e sta n d a rd d ev ia tio n stru ctu ra l sh o ck s
to S U P A V A R a n d G A P V A R resp ectiv ely.

¶308 E S T U D IO S E C O N O M IC O S
These results are, certainly, conditional on the limited availabilityof the data, which can a®ect the accuracy of the tests and estimators.More importantly, given this limitation, the issue of possible struc-tural change has not been approached, although the adjusted dataseem to show a pattern that may be consistent with possible struc-tural changes. Certainly, this issue can have important implications
2 0and may explain why di®erent authors ¯nd opposite results. Also,a new discussion concerning debt sustainability and o±cial debt tar-gets has arisen recently. The response of actual public saving levelsto the previous debt levels has shown di®erent results for the E U andanalysis of this kind of relationship for the Mexican case in order toevaluate the government's performance achieved by pursing debt tar-gets seems desirable. All previous issues are, however, beyond thescope of this paper and deserve further investigation.
5 . C o n c lu sio n s
This paper shows that ¯scal policy has an important impact on na-tional saving, some negative impact on private savings over shorthorizons but none over the longer term, and a negative e®ect on theoutput gap. On the other hand, positive shocks to the output gap donot seem to have signi¯cant e®ects on private savings over any periodof time.
Assuming that the adjustments are correct and relevant for theMexican case, the main implication of this study would be that ¯s-cal policies that improve the government's budgetary position willcontribute to increase national saving. Throughout Mexican history,especially during the 1994 crisis, the country has su®ered the conse-quences of low levels of national saving. High levels of national savingwould assure enough liquidity for bad times, and leave the country inbetter position to face old and new debt commitments.
Further research to overcome the limitations of sample size, pos-sible structural changes as well as to asses the government's perfor-mance achieved by pursing debt targets would contribute signi¯cantlyto this policy debate and is recommended.
2 0 T h e a u th o rs a ck n ow led g e a n a n o n y m o u s referee fo r p o in tin g th is o u t.
F IS C A L P O L IC Y A N D N A T IO N A L S A V IN G IN M E X IC O 3 0 9
R e fe re n c e s
A m a d o r, P . (2 0 0 4 ). S eries a ltern a tiva s d e a h o rro pa ra M ¶exico 1 9 8 0 -2 0 0 2 , C ID E ,d eg ree th esis.
A rra u , P . a n d D . O k s (1 9 9 2 ). E l a h o rro p riva d o en M ¶ex ico : 1 9 8 0 -1 9 9 0 , E co n o m ¶³aM exica n a , v o l. 1 (2 ), 3 1 1 -3 7 8 .
A rra u , P . a n d S . va n W ijn b erg en (1 9 9 1 ). In tertem po ra l S u bstitu tio n , R isk A ver-sio n a n d P riva te S a vin gs in M exico , P R E W o rk in g P a p er, 6 8 2 , T h e W o rldB a n k .
B a rro , R . J . (1 9 7 4 ). A re G ov ern m en t B o n d s N et W ea lth ? J o u rn a l o f P o litica lE co n o m y, v o l. 8 2 , 1 0 9 5 -1 1 1 7 .
B ern a n k e, B . S . a n d I. M ih ov (1 9 9 8 ). M ea su rin g M o n eta ry P o licy, Q u a rterlyJ o u rn a l o f E co n o m ics, v o l. 1 1 3 (3 ), 8 6 9 -9 0 2 .
B la n ch a rd , O . a n d I. P ero tti (2 0 0 2 ). A n E m p irica l C h a ra cteriza tio n o f D y n a m icE ® ects o f C h a n g es in G ov ern m en t S p en d in g a n d T a x es o n O u tp u t, Q u a rterlyJ o u rn a l o f E co n o m ics, v o l. 1 1 7 (4 ), 1 3 2 9 -1 3 6 8 .
B u ira , A . (1 9 9 0 ). L o s d eterm in a n tes d el a h o rro en M ¶ex ico , in C . M a ssa d a n d N .E y za g u irre (ed s.), A h o rro y fo rm a ci¶o n d e ca p ita l: experien cia s la tin oa m er-ica n a s, C E P A L / P N U D , C o lecci¶o n d e E stu d io s P o l¶³tico s y S o cia les.
B u rn sid e, C . (2 0 0 0 ). P riva te S a vin g in M exico , 1 9 8 0 -1 9 9 5 , T h e W o rld B a n k .| | , K . S ch m id t-H eb b el, a n d L . S erv ¶en (1 9 9 9 ). S av in g in M ex ico : T h e N a tio n a l
a n d In tern a tio n a l E v id en ce, E co n o m ¶³a M exica n a , v o l. 8 (2 ).C a m p b ell, J . a n d N . M a n k iw (1 9 9 0 ). T h e R esp o n se o f C o n su m p tio n to In co m e:
A C ro ss C o u n try In v estig a tio n , E u ro pea n E co n o m ic R eview , v o l. 3 5 , 7 1 5 -7 2 1 .
C a rsten s A . a n d F . G il D ¶³a z (1 9 9 6 ). O n e Y ea r o f S o litu d e: S o m e P ilg rim T a lesA b o u t M ex ico 's 1 9 9 4 -1 9 9 5 C risis, T h e A m erica n E co n o m ic R eview , v o l.8 2 (2 ), 1 6 4 -1 6 9 .
C o rb o , V . a n d K . S ch m id t-H eb b el (1 9 9 2 ). P u b lic P o licies a n d S av in g in D ev el-o p in g C o u n tries, J o u rn a l o f D evelo p m en t E co n o m ics, v o l. 3 6 , 8 9 -1 1 5 .
E g g ersted t H ., R . H a ll, a n d S . va n W ijn b erg en (1 9 9 5 ). M ea su rin g C a p ita l F lig h t:A C a se S tu d y o f M ex ico , W o rld D evelo p m en t, v o l. 2 3 (2 ), 2 1 1 -2 3 2 .
E n d ers, W . (1 9 9 5 ). A p p lied E co n o m etrics T im e S eries, J o h n W iley a n d S o n s,N ew Y o rk .
E va n s, P . a n d G . K a rra s (1 9 9 6 ). D o E co n o m ies C o n v erg e? E v id en ce fro m aP a n el o f U S S ta tes, T h e R eview o f E co n o m ics a n d S ta tistics, v o l. 7 8 (3 ),3 8 4 -3 8 8 .
G ra m lich , E . M . (1 9 8 9 ). B u d g et D e¯ cits a n d N a tio n a l S av in g : A re P o liticia n sE x o g en o u s? T h e J o u rn a l o f E co n o m ic P erspectives, v o l. 3 (2 ), 2 3 -3 5 .
G o m ez-O liv er, A . (1 9 8 9 ). P riva te C o n su m p tio n a n d S a vin g: T h e C a se o f M exicoa n d C h ile, IM F W o rk in g P a p er n o . 8 9 / 5 1 .
H a q u e, N . U . a n d P . M o n tiel (1 9 8 9 ). C o n su m p tio n in D ev elo p in g C o u n tries: T estfo r L iq u id ity C o n stra in ts a n d F in ite H o rizo n s, T h e R eview o f E co n o m ics a n dS ta tistics, v o l. 7 1 (3 ), 4 0 8 -4 1 5 .
H ay fo rd , M . D . (2 0 0 5 ). F isca l P o licy a n d N a tio n a l S av in g , A p p lied E co n o m ics,v o l. 3 7 , 9 8 1 -9 9 2 .
H ern ¶a n d ez, F . y A . V illa g ¶o m ez (2 0 0 1 ). L a estru ctu ra d e la d eu d a p ¶u b lica enM ¶ex ico , R evista d e A n ¶a lisis E co n ¶o m ico , v o l. 1 6 (1 ).

¶310 E S T U D IO S E C O N O M IC O S
K a rra s, G . (1 9 9 4 ). G ov ern m en t S p en d in g a n d P riva te C o n su m p tio n : S o m e In -tern a tio n a l E v id en ce, J o u rn a l o f M o n ey, C red it a n d B a n kin g, v o l. 2 6 (1 ),9 -2 2 .
K h a lid , A . M . (1 9 9 6 ). R ica rd ia n E q u iva len ce: E m p irica l E v id en ce fro m D ev el-o p in g E co n o m ies, J o u rn a l o f D evelo p m en t E co n o m ics, v o l. 5 1 , 4 1 3 -4 3 2 .
K w ia tk ow sk i, D ., et a l. (1 9 9 2 ). T estin g th e N u ll H y p o th esis o f S ta tio n a ritya g a in st th e A ltern a tiv e o f a U n it R o o t, J o u rn a l o f E co n o m etrics, v o l. 5 4 ,1 5 9 -1 7 8 .
L o ay za , N ., K . S ch m id t-H eb b el, a n d L . S erv ¶en (2 0 0 0 ). W h a t D riv es P riva teS av in g A ro u n d th e W o rld ? T h e R eview o f E co n o m ics a n d S ta tistics, v o l.8 2 (2 ), 1 6 5 -1 8 1 .
| | (1 9 9 8 ). T h e W o rld S a vin g D a ta B a se, T h e W o rld B a n k (m im eo ).L o p ez H . J ., K . S ch m id t-H eb b el, a n d L . S erv ¶en (2 0 0 0 ). H ow E ® ectiv e is F isca l
P o licy in R isin g N a tio n a l S av in g ? T h e R eview o f E co n o m ics S ta tistics, v o l.8 2 (2 ), 2 2 6 -2 3 8 .
L Äu tk ep o h l, H . a n d M . K rÄa tzig (2 0 0 2 ). A p p lied T im e S eries E co n o m etrics, C a m -b rid g e U n iv ersity P ress.
M a d d a la , G . S . a n d I. K im (1 9 9 8 ). U n it R oo ts, C o in tegra tio n a n d S tru ctu ra lC h a n ge, C a m b rid g e U n iv ersity P ress.
M a n k iw , G . N . (2 0 0 7 ). M a croeco n o m ics, W o rth P u b lish ers.M o d ig lia n i, F . a n d A . A n d o (1 9 6 3 ). T h e L ife C y cle H y p o th esis o f S av in g : A g g re-
g a ted Im p lica tio n s a n d T ests, A m erica n E co n o m ic R eview , v o l. 5 3 , 5 5 -8 4 .N ico la u , J o a o (2 0 0 2 ). S ta tio n a ry P ro cesses th a t L o o k lik e R a n d o m W a lk s: T h e
B o u n d ed R a n d o m W a lk P ro cess in D iscrete a n d C o n tin u o u s T im e, E co n o -m etric T h eo ry , v o l. 1 8 , 9 9 -1 1 8 .
N g , S eren a a n d P . P erro n , (2 0 0 1 ). L a g L en g th S electio n a n d th e C o n stru ctio no f U n it R o o t T ests w ith G o o d S ize a n d P ow er, E co n o m etrica , v o l. 6 9 (6 ),1 5 1 9 -1 5 5 4 .
O k s, D . (1 9 9 2 ). S ta biliza tio n a n d G ro w th R eco very in M exico : L esso n s a n dD ilem m a s, T h e W o rld B a n k .
P a sto r, J . a n d A . V illa g ¶o m ez (2 0 0 7 ). T h e S tru ctu ra l B u d g et B a la n ce: A P relim -in a ry E stim a tio n fo r M ex ico , A p p lied E co n o m ics, (fo rth co m in g ).
P erro n , P . (1 9 8 8 ). T ren d s a n d R a n d o m W a lk s in M a cro eco n o m ic T im e S eries:F u rth er E v id en ce fro m a N ew A p p ro a ch , J o u rn a l o f E co n o m ic D yn a m icsa n d C o n tro l, v o l. 1 2 , 2 9 7 -3 3 2 .
P u ch et, M . (1 9 9 6 ). U n a m eto d o lo g¶³a p a ra m ed ir el a h o rro en M ¶ex ico , 1 9 8 0 -1 9 9 4 ,R evista d e E co n o m ¶³a , v o l. 3 (2 ), 4 1 -7 5 .
P ra d h a n , G . a n d K . P . U p a d h y ay a (2 0 0 1 ). T h e Im p a ct o f B u d g et D e¯ cits o nN a tio n a l S av in g in th e U S A , A p p lied E co n o m ics, v o l. 3 3 (1 3 ), 1 7 4 5 -1 7 5 0 .
S im s, C . A . (1 9 8 0 ). M a cro eco n o m ics a n d R ea lity, E co n o m etrica , v o l. 4 8 (1 ), 1 -4 8 .| | a n d T . Z h a (1 9 9 8 ). B ay esia n M eth o d s fo r D y n a m ic M u ltiva ria te M o d els,
In tern a tio n a l E co n o m ic R eview , v o l. 3 9 (4 ), 9 4 9 -9 6 8 .V illa g ¶o m ez, A . (1 9 9 3 ). L o s d eterm in a n tes d el a h o rro en M ¶ex ico : u n a rese~n a d e
la in v estig a ci¶o n em p¶³rica , E co n o m ¶³a M exica n a , v o l. 2 (2 ), 3 0 5 -3 2 7 .

F IS C A L P O L IC Y A N D N A T IO N A L S A V IN G IN M E X IC O 311
A p p e n d ix
Q u a rterly S eries in L evels
¶312 E S T U D IO S E C O N O M IC O S
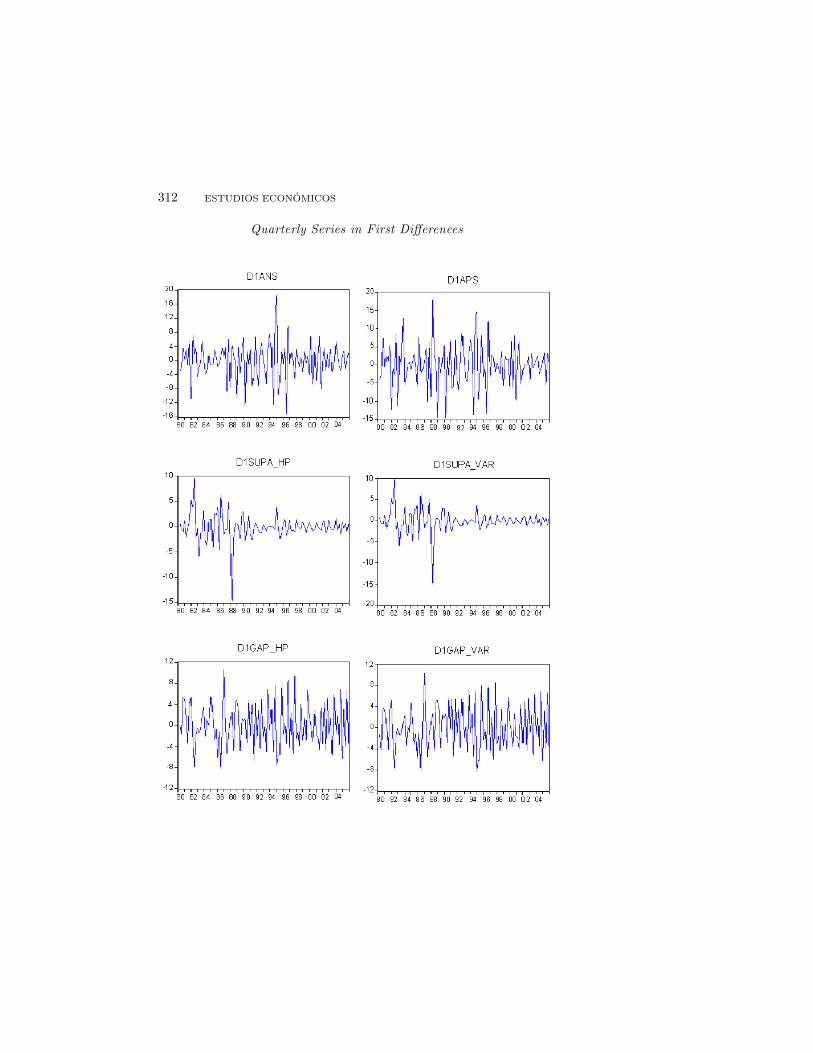
Q u a rterly S eries in F irst D i® eren ces