Fiscal Discipline, Financial Development Economic Growth ...

ASIAN DEVELOPMENT BANK
AsiAn Development BAnk6 ADB Avenue, Mandaluyong City1550 Metro Manila, Philippineswww.adb.org
Fiscal Policy and Growth in Developing Asia
The study shows that there are conceptual grounds why fiscal policy, including the composition of taxes and government spending, can have a significant effect on growth. Property taxes can have a more benign impact on growth than direct taxes, and shifting government spending to education can have a sizable impact. Developing Asia’s governments must pay attention to the mix of both their revenues and expenditures in order to maximize the contribution of fiscal policy to growth.
About the Asian Development Bank
ADB’s vision is an Asia and Pacific region free of poverty. Its mission is to help its developing member countries reduce poverty and improve the quality of life of their people. Despite the region’s many successes, it remains home to approximately two-thirds of the world’s poor: 1.6 billion people who live on less than $2 a day, with 733 million struggling on less than $1.25 a day. ADB is committed to reducing poverty through inclusive economic growth, environmentally sustainable growth, and regional integration.
Based in Manila, ADB is owned by 67 members, including 48 from the region. Its main instruments for helping its developing member countries are policy dialogue, loans, equity investments, guarantees, grants, and technical assistance.
FiscAl Policy AnD Growth in DeveloPinG AsiAArnelyn Abdon, Gemma B. Estrada, Minsoo Lee, and Donghyun Park
adb economicsworking paper series
no. 412
october 2014

ADB Economics Working Paper Series
Fiscal Policy and Growth in Developing Asia Arnelyn Abdon, Gemma B. Estrada, Minsoo Lee, and Donghyun Park
No. 412 | 2014
Arnelyn Abdon ([email protected]) was anEconomics Officer, Gemma Estrada ([email protected]) is a Senior Economics Officer, Minsoo Lee ([email protected]) is a Senior Economist, and Donghyun Park ([email protected]) is a Principal Economist at the Economics and Research Department of the Asian Development Bank.
ASIAN DEVELOPMENT BANK

Asian Development Bank 6 ADB Avenue, Mandaluyong City 1550 Metro Manila, Philippines www.adb.org
© 2014 by Asian Development Bank October 2014 ISSN 2313-6537 (Print), 2313-6545 (e-ISSN) Publication Stock No. WPS146907-3
The views expressed in this paper are those of the author and do not necessarily reflect the views and policies of the Asian Development Bank (ADB) or its Board of Governors or the governments they represent.
ADB does not guarantee the accuracy of the data included in this publication and accepts no responsibility for any consequence of their use.
By making any designation of or reference to a particular territory or geographic area, or by using the term “country” in this document, ADB does not intend to make any judgments as to the legal or other status of any territory or area.
Note: In this publication, “$” refers to US dollars.
The ADB Economics Working Paper Series is a forum for stimulating discussion and eliciting feedback on ongoing and recently completed research and policy studies undertaken by the Asian Development Bank (ADB) staff, consultants, or resource persons. The series deals with key economic and development problems, particularly those facing the Asia and Pacific region; as well as conceptual, analytical, or methodological issues relating to project/program economic analysis, and statistical data and measurement. The series aims to enhance the knowledge on Asia’s development and policy challenges; strengthen analytical rigor and quality of ADB’s country partnership strategies, and its subregional and country operations; and improve the quality and availability of statistical data and development indicators for monitoring development effectiveness.
The ADB Economics Working Paper Series is a quick-disseminating, informal publication whose titles could subsequently be revised for publication as articles in professional journals or chapters in books. The series is maintained by the Economics and Research Department.

CONTENTS TABLES AND FIGURES iv ABSTRACT v I. INTRODUCTION 1 II. REVIEW OF LITERATURE 1 III. OVERALL TRENDS 4
A. Taxation 4 B. Government Expenditure 7
IV. QUANTIFYING THE IMPACT ON GROWTH OF FISCAL POLICY CHANGES 8
A. Tax Structure 8 B. Composition of Government Expenditures 12
V. CONCLUDING OBSERVATIONS 14 REFERENCES 17

TABLES AND FIGURES
TABLES 1 Estimation Coefficients on the Impact of Changes on Tax Composition
on per Capita Gross Domestic Product Growth 10 2 Impact of Changing Tax Structure on Growth in Selected Developing Asian Economies 11 3 Estimated Effects of Education Spending on Growth 14 4 Simulated Impact on Gross Domestic Product and Gross Domestic Product
per Capita Growth of Increasing Expenditure on Education 14 FIGURES 1 Tax Revenue Indicators, 2012 4 2 Tax Revenues 5 3 Share of Components to Overall Taxes in Developing Asia 6 4 Taxation by Type 6 5 Tax Revenue 7 6 Total Expenditure, 1990–2011 8 7 Gross Domestic Product per Capita Growth versus Change in Tax Ratio 9 8 Expenditure Components 13 9 Education Spending, 1990–2011 13

ABSTRACT
In this paper we empirically explore the relationship between fiscal policy and economic growth in developing Asia. The region’s overall level of taxes and government spending are substantially lower than those prevailing in advanced economies. Nevertheless, there are conceptual grounds why fiscal policy, including the composition of taxes and government spending, can have a significant effect on growth, as our empirical analysis shows. In line with economic theory, property taxes have a more benign impact on growth than direct taxes, and spending more on education has a sizable positive impact on growth. Keywords: fiscal policy, growth, taxation, government spending, Asia. JEL Classification: H20, H50.

I. INTRODUCTION Fiscal policy can play a significant role in economic growth. In the short term, counter-cyclical fiscal expansion can help support aggregate demand and growth during cyclical downturns. Conversely, fiscal contraction can cool down an economy that is growing at an unsustainable pace and thus faces the risk of overheating. Advanced economies in particular have a long history of using taxes and government spending to smooth the business cycle. At the same time, fiscal policy can also have a major impact on medium- and long-term economic growth. This is especially true in developing economies where the private sector is relatively weak and underdeveloped. Public spending on physical infrastructure, such as roads, ports, and power plants, affects the productivity of all firms and industries, and the entire economy. Likewise, public spending on education fosters human capital, a vital ingredient to long-term growth. Taxes can harm growth because they distort economic incentives and behavior; for example, corporate income taxes have a negative impact on investment. But generally, different taxes vary in the extent of their distortionary impacts.
In developing Asia, as in the rest of the world, fiscal policy can influence both short- and long-term growth. The region has very limited experience in using fiscal policy for counter-cyclical purposes than advanced economies. Nevertheless, during the global financial and economic crisis in the period 2008–2009, developing Asia’s governments forcefully unleashed large fiscal stimulus programs that helped the region stave off recession. More broadly, in much of the region, the primary strategic objective of fiscal policy—and of public policy in general—has been to foster long-term economic growth. The prioritization of growth was perfectly understandable in light of developing Asia’s low income levels in the past. A tradition of fiscal prudence laid the foundation for macroeconomic stability in large parts of the region which, combined with large public investments in physical infrastructure and human capital, brought about sustained rapid growth. Different components of public spending will likely have different impacts on growth; for example, spending on health care is likely to have a bigger effect than spending on military equipment.
The central objective of this paper is to take a closer look at the role of fiscal policy in
developing Asia’s economic growth. To do so, we first review the literature on fiscal policy and economic growth before taking a look at the overall trends in taxation and government spending in the region. We then empirically analyze the effect of a change in the composition of taxes on growth and do the same for a change in the composition of government spending before concluding with a few observations.
II. REVIEW OF LITERATURE
The question of whether changes in fiscal policy—both taxation and expenditure—can affect growth has been widely explored in the literature. Endogenous growth models (e.g., Barro 1990) predict that fiscal policy will have both temporary and permanent effects on growth. Empirical studies on whether taxation or government spending fosters economic growth, however, have yielded mixed results.
On the link between taxes and growth, there are studies that show weak or non-robust
relationships, such as those by Easterly and Rebelo (1993); and Agell, Lindh, and Ohlsson (1997); and studies that reveal strong associations, such as those by Skinner (1987); Arnold et al. (2011); and Gemmell, Kneller, and Sanz (2011). Skinner showed that the increase in tax effort in Sub-Saharan countries was predicted to have reduced output growth, even accounting for the positive effects of additional government spending. Comparing various taxes, Skinner found that personal income and

2 | ADB Economics Working Paper Series No. 412
corporate tax rates had a negative direct effect on output growth, trade taxes had little direct effect, and sales and excise taxes were neutral with respect to both output growth and investment. King and Rebelo (1990) showed that tax policy can have a potentially large impact on long-term growth. Public policies can exert a significant influence on economic growth rates by affecting private incentives for accumulating physical and human capital. Even relatively small changes in tax rates can lead countries to stagnate or even regress if these policies eliminate incentives for growth.
In contrast, earlier studies found a weak relationship between tax policy and growth. To
examine this relationship, Easterly and Rebelo (1993) used cross-section data for 100 countries from 1970 to 1988 and a panel of annual data for 28 countries from 1870 to 1988. They applied different approaches to measuring tax rates namely (i) statutory tax rates, (ii) tax revenue as a fraction of gross domestic product (GDP), (iii) income-weighted marginal income tax rates that combine information on the lowest and highest statutory tax rates, and (iv) marginal tax rates obtained by regressing the revenue from each type of tax to its tax base. Still, they found that the effects of taxation are difficult to isolate empirically. In the same way, using data for 23 Organisation for Economic Co-operation and Development (OECD) members, Agell, Lindh, and Ohlsson (1997) found no firm evidence regarding the relationship between growth and tax share. In his review of studies consisting mostly of cross-country evidence for advanced economies, Slemrod (1995) concluded that there was no compelling evidence that the extent of government spending had either a positive or negative impact on growth owing to weaknesses in the estimation models used in these studies.
According to Gemmell and Au (2012), much has changed since Slemrod’s review with cross-
section studies giving way to panel analyses across or within countries and to country-specific, time-series evidence. Theory on output effects has also developed substantially, and improvements in econometric methods and new datasets have been noted. Thus, aggregated studies have produced more robust results and reliable magnitudes of fiscal impacts. Gemmel and Au (2012) also indicated that recent studies, mainly done after 2000, have taken into account the testing of the government budget constraint, have allowed for potential growth differences from tax or spending decompositions, and have used panel or time series rather than cross-section methods.
Kneller and Misch (2011) categorized recent literature broadly into two groups: one mostly
dealing with medium- and long-run relationships and employing panel methods, and the other relying on time series for particular countries and mainly applying vector autoregressions, and referring to short-run effects. Their review suggests that the direction of the long-run impacts of tax changes can be predicted with some degree of certainty and are mainly in line with theory (i.e., increases in non-distortionary taxation offset by declines in distortionary taxation have positive growth effects). Different magnitudes of the estimated long-run effects are often due to varying measurements of tax burdens or the offsetting factors considered. However, they found that predicting short-run effects is associated with greater uncertainty as most tax measures used are rather broad and the estimated output effects can be difficult to interpret for policy purposes.
Fairly recent studies that have focused on long-term growth impacts while considering both
short-run and long-run dynamics in their models include those by Arnold et al. (2011); Gemmell, Kneller, and Sanz (2011); and Acosta-Ormaechea and Yoo (2012). A key feature of recent estimations is having revenue-neutral tax changes in which more use of a given type of tax entails lesser amounts of revenue to be raised from other taxes. Applying data on 69 countries from 1970 to 2009, Acosta-Ormaechea and Yoo (2012) found that lowering income taxes while raising consumption taxes (i.e., value-added and sales tax) can be favorable to growth. Based on a panel of 21 OECD countries over 34 years, results from Arnold et al. (2011) suggest a “tax and growth ranking” with recurrent taxes on

Fiscal Policy and Growth in Developing Asia | 3
immovable property the least harmful (or most beneficial) to growth followed by consumption taxes and other property taxes, personal income taxes, and corporate income taxes. Applying data for 17 OECD countries from the early 1970s to 2004, Gemmell, Kneller, and Sanz (2011) found that those taxes predicted by theory to be distortionary (i.e., income and profit, payroll and manpower, property taxes, and social security contributions) tended to have persistent effects on GDP growth. Still, the largest fiscal policy impacts on growth were relatively short-lived and might persist as long as the relevant fiscal policy changes were in effect.
On government spending, varying results have also been reported regarding its relationship
with economic development, i.e., whether Wagner’s Law1 holds. Some found a significant and positive association between public expenditure and growth (e.g., Ram 1986; and Wu, Tang, and Lin 2010), while others recorded a negative relationship (e.g., Landau 1983, Alfonso and Furceri 2010). In addition, there were studies that found no relationship (e.g., Durevall and Henrekson 2011). In a survey, Bergh and Henrekson (2011) explained that the conflicting results were due to inconsistency in definitions and variations in the countries studied.
Using a panel Granger causality test on data from 1950 to 2004, Wu, Tang, and Lin (2010)
found that government expenditure promoted economic growth even across different levels of development, except for low-income countries (with a per capita gross national income of less than $936) which, according to the authors, was most likely due to generally poor institutions and high levels of corruption. Bose, Emranul, and Osborn (2007) examined the growth effects of government expenditure using a panel of 30 developing countries from 1970 to 1990 and found that the size of government capital expenditure with respect to GDP was positively and significantly correlated with economic growth but that the same did not hold for current expenditure. This was in contrast to Devarajan, Swaroop, and Zou (1996) who found a positive relationship between the share of current expenditure and per capita income growth in developing countries but a negative relationship between capital public expenditure and growth. The authors showed that there are certain conditions under which a change in expenditure composition leads to a higher steady state growth. This includes the productivity of the various expenditure components and the level of initial shares.
At the disaggregated level of expenditure, Bose, Emranul, and Osborn (2007) found a robust,
positive relationship between investments and spending on education, and economic growth. Similarly, using annual data from 1970 to 2005 on 10 developing countries in Asia (Bangladesh, India, Indonesia, the Republic of Korea, Malaysia, Pakistan, the Philippines, Singapore, Sri Lanka, and Thailand), Alam, Sultana, and Butt (2010) found evidence that greater social expenditure—on education, health, and social welfare—enhanced productivity, thereby fostering economic growth.
Some studies have focused on the effects of changing the composition of government
expenditure or reallocating spending on long-term growth and on understanding which elements of public expenditure have the most significant impact on growth and development. Results consistently point to the importance of reallocating funds to education and infrastructure for long-term growth (e.g., Gemmell, Kneller, and Sanz 2012; Baffes and Shah 1998; and Acosta-Ormaechea and Morozumi 2013). These findings are consistent in the context of the endogenous growth theory that the main contributors to cross-country differences in the level of development and growth are investment in human capital, physical capital and infrastructure, and knowledge spillovers. Along these lines, the theoretical work of Barro (1990) predicted that increasing “utility-enhancing” public consumption
1 This is also known as the law of increased state spending and states that as an industrial economy grows, it will be
accompanied by an increased share of public expenditure in gross national product.
4 | ADB Economics Working Paper Series No. 412
while reducing “production-enhancing” public spending would reduce growth regardless of the level of total spending, and that of Agenor (2010) showed that reallocating expenditures from “unproductive” public spending to infrastructure spending would lead to higher steady state growth.
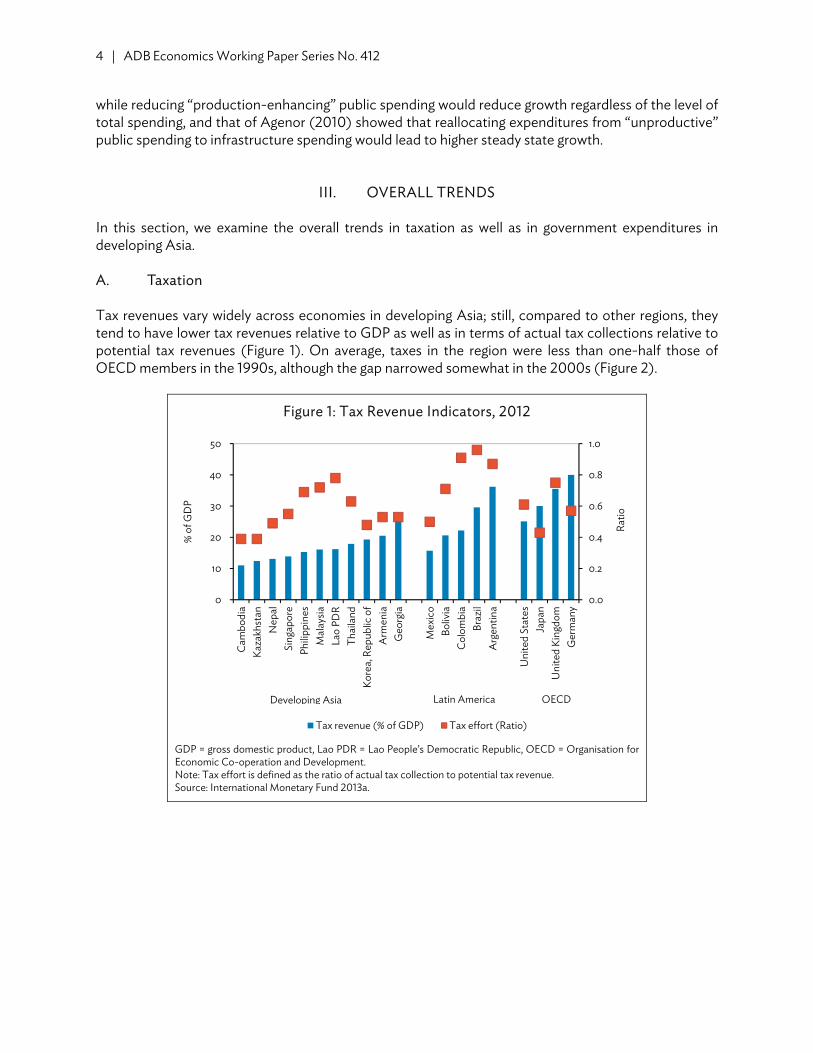
III. OVERALL TRENDS In this section, we examine the overall trends in taxation as well as in government expenditures in developing Asia. A. Taxation Tax revenues vary widely across economies in developing Asia; still, compared to other regions, they tend to have lower tax revenues relative to GDP as well as in terms of actual tax collections relative to potential tax revenues (Figure 1). On average, taxes in the region were less than one-half those of OECD members in the 1990s, although the gap narrowed somewhat in the 2000s (Figure 2).
Figure 1: Tax Revenue Indicators, 2012
GDP = gross domestic product, Lao PDR = Lao People’s Democratic Republic, OECD = Organisation for Economic Co-operation and Development. Note: Tax effort is defined as the ratio of actual tax collection to potential tax revenue. Source: International Monetary Fund 2013a.
0.0
0.2
0.4
0.6
0.8
1.0
0
10
20
30
40
50
Cam
bodi
aKa
zakh
stan
Nep
alSi
ngap
ore
Phili
ppin
esM
alay
siaLa
o PD
RTh
aila
ndKo
rea,
Rep
ublic
of
Arm
enia
Geo
rgia
Mex
ico
Boliv
iaC
olom
bia
Braz
ilA
rgen
tina
Uni
ted
Stat
esJa
pan
Uni
ted
King
dom
Ger
man
y
Ratio
% o
f GD
P
Tax revenue (% of GDP) Tax effort (Ratio)
Developing Asia Latin America OECD

Fiscal Policy and Growth in Developing Asia | 5
Figure 2: Tax Revenues
GDP = gross domestic product, OECD = Organisation for Economic Co-operation and Development. Source: Authors’ estimates based on data from the International Monetary Fund’s Government Financial Statistics and World Development Indicators (accessed 30 October 2013).
Given its level of development, developing Asia may be expected to have lower tax revenues
compared to advanced economies. This is consistent with Wagner’s Law which supports the notion that the size of government tends to increase with per capita income. Since economic development can bring in higher government revenues thereby enabling greater public spending, then Wagner’s Law is plausible. Furthermore, as economies get richer, people tend to demand better and more varied public services.
While there has been no discernable change in overall taxes in the region during the past
decades, the structure of taxes has generally evolved. In the 1990s, trade taxes were still a substantial part of overall taxation and were about one-half that of consumption taxes (Figure 3). However, since 2000, as economies around the region—especially those in East and Southeast Asia—rapidly expanded external trade and continued to post robust growth, the importance of trade taxes has greatly diminished. Indeed, other studies have noted the declining importance of trade taxes as economies develop (Acosta-Ormaechea and Yoo 2012, IMF 2011).
7
14
21
28
35
Developing Asia Latin America andCaribbean
OECD World
% o
f GD
P
1990s 2000s

6 | ADB Economics Working Paper Series No. 412
Figure 3: Share of Components to Overall Taxes in Developing Asia
OECD = Organisation for Economic Co-operation and Development. Notes: Data are based on simple averages. Other taxes include social security contributions and other taxes. Sources: Acosta-Ormaechea and Yoo 2012, International Monetary Fund’s Government Financial Statistics online database, and OECD StatExtracts. http://stats.oecd.org (databases accessed 29 October 2013).
While trade taxes have fallen in developing Asia, other types of taxes have increased. In
particular, income taxes rose in the 2000s compared to the 1990s (Figure 4). With the increase, corporate income tax rates have remained close to the OECD levels, but the gap in personal income taxes remains huge. There has been no noticeable increase in consumption taxes, which are just about half the OECD level. Still, consumption taxes account for the bulk of the region’s taxes at 44.0% followed by corporate taxes at 25.0%. In contrast, consumption and personal income taxes in developed economies are almost equally important and account for a large part of total taxes.
Figure 4: Taxation by Type
OECD: Organisation for Economic Co-operation and Development. Note: Data are based on simple averages. Sources: Acosta-Ormaechea and Yoo 2012, IMF Government Financial Statistics online database, and OECD StatExtracts. http://stats.oecd.org (databases accessed 29 October 2013).
0
20
40
60
80
100
1990s 2000s 1990s 2000s
Developing Asia OECD
%
Personal income Corporate income International tradeConsumption Other taxes
0 3 6 9 12
Personal incomeCorporate income
International tradeConsumption
OthersPersonal income
Corporate incomeInternational trade
ConsumptionOthers
Personal incomeCorporate income
International tradeConsumption
Others
Dev
elop
ing A
siaO
ECD
Latin
Am
eric
a
%1990s 2000s

Fiscal Policy and Growth in Developing Asia | 7
In Asia, indirect taxes are more important than direct taxes. Indirect taxes, i.e., consumption
and trade taxes, account for over one-half of total taxes in the region. Taxes covering social security contributions and property taxes may be substantial in developed economies, but this is not the case in developing Asia.
Tax ratios have increased in some economies, but in others, taxes have fallen, especially in
those with relatively high tax ratios in the 1990s. For example, Indonesia, Malaysia, and Singapore were among those with the highest tax ratios in the 1990s but have since seen their tax revenues fall (Figure 5). The source of changes in the tax ratios differs across countries and appears to reflect government policy objectives. Further investigation reveals that in Indonesia, the source of the decline was income taxes, which may be linked to tax amendments in the recent decade. In Malaysia, it was due to falling trade taxes. For Singapore, the decline was primarily due to income taxes, although other taxes also fell.2 Efforts had already been made to accelerate tax cuts in the 1990s, after which, the government continued to lower income tax rates consistent with the policy to boost in-migration and to increase the workforce.
Figure 5: Tax Revenue
GDP = gross domestic product, OECD = Organisation for Economic Co-operation and Development, PRC = People’s Republic of China. Sources: Acosta-Ormaechea and Yoo 2012, International Monetary Fund’s Government Financial Statistics online database, and OECD StatExtracts. http://stats.oecd.org (databases accessed 29 October 2013).
B. Government Expenditure Public expenditures of developing Asian economies with unweighted average incomes per capita of purchasing power parity (PPP) $6,000 averaged around 20.0% of GDP between 1990 and 2011 while those of the OECD members with unweighted average incomes per capita of PPP $29,000 were 30.0% of GDP. The size of government generally rises as income increases (Wagner’s Law), but at a certain level of income, the size of government expenditure flattens and then slightly declines. Acosta-
2 Due to lack of data, it cannot be determined whether the decline in income taxes was due to corporate or personal
income taxes.
0 5 10 15 20
PRC
India
Indonesia
Republic of Korea
Malaysia
Nepal
Pakistan
Philippines
Singapore
Sri Lanka
Thailand
% of GDP1990s 2000s

8 | ADB Economics Working Paper Series No. 412
Ormaechea and Morozumi (2013) show that this non-monotonic relationship between the level of development and public expenditure happens at about a per capita income of $20,000 in PPP terms.
Figure 6 shows the evolution of average total government expenditure as a share of GDP of developing Asia and OECD members between 1990 and 2011. There is a marked shift in the trend beginning in 2004 for developing Asia and in 2007 for the OECD. Government size was gradually declining with respect to the size of the economy prior to the shift. In the case of high-income economies, the decline was generally due to waning spending on general public services as a share of GDP and on social protection. The shift in the trend in the expenditure–GDP ratio of high-income economies beginning in 2009 is associated with the rebound in spending of these two groups of economies. For developing Asia, the declining trend from 1990 to around 2004 was driven by lower expenditures on economic affairs and education as a share of GDP. The shift in the trend that peaked around 2009 was due to an increase in all expenditure components in developing Asia.
Figure 6: Total Expenditure, 1990–2011
GDP = gross domestic product, OECD = Organisation for Economic Co-operation and Development. Note: Unweighted average. Source: Authors’ estimates based on International Monetary Fund’s Government Financial Statistics (accessed 15 October 2013).
IV. QUANTIFYING THE IMPACT ON GROWTH OF FISCAL POLICY CHANGES A. Tax Structure Figure 7 plots the relationship between tax ratios and GDP per capita growth from 1970 to 2011 for 13 developing Asian economies, 25 high-income OECD economies, and 33 economies from other regions. The trend in all indicates no clear association between GDP per capita growth and changes in tax ratios given the presence of outlying observations, but the trend in developing Asian economies indicates that there may be a positive association between growth and taxation. It is, however, difficult to model the relationship between the two given that it is likely endogenous. While government taxation may impact growth, higher growth may also lead to higher taxes.
0
10
20
30
40
1990 1993 1996 1999 2002 2005 2008 2011
% o
f GD
P
OECD Developing Asia

Fiscal Policy and Growth in Developing Asia | 9
Figure 7: Gross Domestic Product per Capita Growth versus Change in Tax Ratio
GDP = gross domestic product, OECD = Organisation for Economic Co-operation and Development. Note: The period ranges between 1970 and 2011 depending on the availability of country data. Sources: Acosta-Ormaechea and Yoo 2012, International Monetary Fund’s Government Financial Statistics online database, and OECD StatExtracts. http://stats.oecd.org (databases accessed 29 October 2013).
Kneller and Misch (2011) provide a summary of panel estimates of growth effects by type of
taxation for OECD members. In general, results indicate that raising the proportion of personal and corporate income taxation tends to decrease growth, although the magnitude of the effect differs across studies. Another common result is the positive effect on growth of higher shares of consumption and property taxes.
In contrast to most studies that focused only on advanced economies, a recent study that
examines the fiscal policy and growth relationship across income groups is that by Acosta-Ormaechea and Yoo (2012). In particular, they analyzed the impact of changes in tax composition on long-run economic growth for low-, middle-, and high-income economies. Their estimation also corrected for possible endogeneity arising from the simultaneous relationship between tax burden and growth. While tax burden affects growth, changes in growth may also lead to changes in the tax level or structure.
This paper uses the estimates from Acosta-Ormaechea and Yoo (2012) to examine the impact
of changing the composition of taxation on long-run economic growth for selected Asian economies. Table 1 shows their results by income class on changing the shares of income and property taxes. Their estimation assumes that altering one given tax instrument requires an offsetting change in other taxes, thus the tax-policy change occurs in a context of revenue neutrality. In the table, changes in income taxes are offset by changes in consumption and other taxes, thus keeping the overall tax revenue unchanged. The coefficients for income tax are significant and negative for high- and middle-income economies indicating a negative relationship between changes in income tax share and growth; however, the result is insignificant for low-income economies. Disaggregating by type of income tax,
People's Rep. of ChinaPeople's Rep. of ChinaPeople's Rep. of ChinaPeople's Rep. of ChinaPeople's Rep. of ChinaPeople's Rep. of ChinaPeople's Rep. of ChinaPeople's Rep. of ChinaPeople's Rep. of ChinaPeople's Rep. of ChinaPeople's Rep. of ChinaPeople's Rep. of ChinaPeople's Rep. of ChinaPeople's Rep. of ChinaPeople's Rep. of ChinaPeople's Rep. of ChinaPeople's Rep. of ChinaPeople's Rep. of ChinaPeople's Rep. of ChinaPeople's Rep. of ChinaPeople's Rep. of China
IndiaIndiaIndiaIndiaIndiaIndiaIndiaIndiaIndiaIndiaIndiaIndiaIndiaIndiaIndiaIndiaIndiaIndiaIndiaIndiaIndiaIndiaIndiaIndiaIndiaIndiaIndiaIndiaIndiaIndiaIndiaIndia
IndonesiaIndonesiaIndonesiaIndonesiaIndonesiaIndonesiaIndonesiaIndonesiaIndonesiaIndonesiaIndonesiaIndonesiaIndonesia
Rep. of KoreaRep. of KoreaRep. of KoreaRep. of KoreaRep. of KoreaRep. of KoreaRep. of KoreaRep. of KoreaRep. of KoreaRep. of KoreaRep. of KoreaRep. of KoreaRep. of KoreaRep. of KoreaRep. of KoreaRep. of KoreaRep. of KoreaRep. of KoreaRep. of KoreaRep. of KoreaRep. of KoreaRep. of KoreaRep. of KoreaRep. of KoreaRep. of KoreaRep. of KoreaRep. of KoreaRep. of KoreaRep. of KoreaRep. of KoreaRep. of KoreaRep. of Korea
MalaysiaMalaysiaMalaysiaMalaysiaMalaysiaMalaysiaMalaysiaMalaysiaMalaysiaMalaysiaMalaysiaMalaysiaMalaysiaMalaysiaMalaysiaMalaysiaMalaysiaMalaysiaMalaysiaMalaysiaMalaysiaMalaysiaMalaysiaMalaysiaMalaysiaMalaysiaMalaysiaMalaysiaMalaysiaMalaysiaMalaysiaMalaysiaNepalNepalNepalNepalNepalNepalNepalNepalNepalNepalNepalNepalNepalNepalNepalNepalNepalNepalNepalNepalNepalNepalPakistanPakistanPakistanPakistanPakistanPakistanPakistanPakistanPakistanPakistanPakistanPakistanPakistanPakistanPakistanPakistanPakistanPakistanPakistanPakistanPakistanPakistanPakistanPakistanPakistanPakistanPakistanPakistanPakistanPakistanPakistan
PhilippinesPhilippinesPhilippinesPhilippinesPhilippinesPhilippinesPhilippinesPhilippinesPhilippinesPhilippinesPhilippinesPhilippinesPhilippinesPhilippinesPhilippinesPhilippinesPhilippinesPhilippinesPhilippinesPhilippinesPhilippinesPhilippines
SingaporeSingaporeSingaporeSingaporeSingaporeSingaporeSingaporeSingaporeSingaporeSingaporeSingaporeSingaporeSingaporeSingaporeSingaporeSingaporeSingaporeSingaporeSingaporeSingaporeSingaporeSingaporeSingaporeSingaporeSingaporeSingaporeSingaporeSingaporeSingaporeSingaporeSingaporeSingaporeSri LankaSri LankaSri LankaSri LankaSri LankaSri LankaSri LankaSri LankaSri LankaSri LankaSri LankaSri LankaSri LankaSri LankaSri LankaSri LankaSri LankaSri LankaSri LankaSri LankaSri LankaSri Lanka ThailandThailandThailandThailandThailandThailandThailandThailandThailandThailandThailandThailandThailandThailandThailandThailandThailandThailandThailandThailandThailandThailandThailandThailandThailandThailandThailandThailandThailandThailand
–5
0
5
10
GD
P pe
r cap
ita g
row
th (%
)
–10 0 10 20 30Change in tax (% of GDP)
Developing Asia OECDRest of the world Trend, developing asiaTrend, all economies

10 | ADB Economics Working Paper Series No. 412
the results on personal income tax are significant for all income groups, i.e., negative for high- and middle-income economies and positive for low-income economies. For corporate income tax, the impact is significant only for middle-income economies. They also found that increasing property taxes and reducing income taxes increased long-term growth.
Table 1: Estimation Coefficients on the Impact of Changes on Tax Composition on per Capita Gross Domestic Product Growth
Tax Structure Omitted Tax
Variable
Impact on Growth (Percentage points)
High income Middle income Low income
Income tax Consumption and
other taxesa –0.119 –0.089 Insignificant
Personal income tax Consumption and
other taxesa –0.207 –0.327 0.475
Corporate income tax Consumption and
other taxesa Insignificant –0.084 Insignificant
Property tax Income tax 0.278 0.427 Insignificant a Includes taxes on property, goods and services, international trade and transactions, and other consumption and property taxes. Source: Acosta-Ormaechea and Yoo 2012.
Table 2 shows the results for developing Asian economies in terms of the growth impacts of changing the tax structure. Included are two high-income economies—the Republic of Korea and Singapore—and 11 middle-income economies: Armenia, Azerbaijan, Bhutan, the People's Republic of China, India, Indonesia, Kazakhstan, Malaysia, the Philippines, Sri Lanka, and Thailand. Since there tends to be a negative relationship between income tax share and growth, the first exercise deals with the likely impact on growth of reducing the income tax to OECD levels. Column 1 shows that the shares of income taxes of nine economies are higher than the average for the OECD. Reducing the proportion of their income taxes to OECD levels may raise GDP per capita growth on average by about 1.0 percentage point (column 2) in the long run. The impact is relatively substantial for Bhutan, Indonesia, and Malaysia given their huge discrepancies from OECD levels. Disaggregating income tax, shares of personal income tax among developing Asian economies are already lower than those of the OECD. Thus, the benchmark used for examining the impact of reducing the proportion of personal income tax is the average for Asian economies instead of the OECD. Column 4 shows that this applies to eight economies, and the impact averages 1.4 percentage points of GDP per capita growth. On corporate income tax shares, Column 5 shows that there is a huge gap between developing Asian economies and OECD economies. While the average for Asia is 21.7%, it is only 8.9% for the OECD. Among those with the highest shares are Bhutan, Indonesia, and Malaysia. Similar to personal income tax, corporate income tax is reduced to the regional average. Results indicate that reducing the proportion of corporate income tax while raising that of consumption and other taxes can raise long-run GDP per capita growth by 0.9 percentage points (column 6). Columns 7 and 8 show the impact of raising shares of property taxes to OECD levels considering the negative relationship between property taxes and growth. This was done for seven economies with India having the largest gains at more than 3 percentage point rise in long-term GDP per capita growth.

Fiscal Policy and Growth in Developing Asia | 11
Table 2: Impact of Changing Tax Structure on Growth in Selected Developing Asian Economies
Initial Income Tax
(% of tax)
Percentage Point Change in GDP per Capita Growth Due
to Reduction in Income Taxa
Initial Personal
Income Tax (% of tax)
Percentage Point Change in GDP per
Capita Growth Due to Reduction
in Personal Income Taxb
Initial Corporate
Income Tax (% of tax)
Percentage PointChange in GDP
per Capita Growth Due to
Reduction in Corporate
Income Taxb
Initial Property
Tax (% of tax)
Percentage Point Change in GDP
per Capita Growth Due to
Increase in Property Taxc
Economy (1) (2) (3) (4) (5) (6) (7) (8) Armenia 26.7 NA 12.1 1.0 14.6 NA 2.4 2.6 Azerbaijan 44.7 0.8 11.4 0.7 33.4 1.0 2.4 2.6 Bhutan 58.0 2.0 6.9 NA 51.2 2.5 – – China, People's
Republic of 22.7 NA 6.2 NA 16.5 NA 10.0 NA
India 35.5 NA 11.8 0.9 23.6 0.2 0.4 3.5 Indonesia 54.1 1.6 0.4 NA 53.7 2.7 3.8 2.1 Kazakhstan 41.1 0.5 5.5 NA 35.6 1.2 2.3 2.7 Korea, Republic of 39.6 0.5 21.3 2.5 18.3 NA 12.9 NA Malaysia 70.3 3.1 15.0 1.9 55.3 2.9 – – Philippines 45.7 0.9 16.7 2.4 29.1 0.6 – – Singapore 44.6 1.1 14.9 1.2 29.7 0.0 8.5 0.0 Sri Lanka 15.9 NA 3.2 NA 12.7 NA – NA Thailand 42.4 0.6 10.7 0.5 31.8 0.9 2.5 2.6 Developing Asia 30.5 0.9 8.7 1.4 21.7 0.9 7.8 2.8 OECD 35.8 26.7 8.9 8.6
– = data not available, GDP = growth domestic product, NA = not applicable, OECD = Organisation for Economic Co-operation and Development. a Tax share is brought down to OECD average. b Tax share is brought down to regional average. c Tax share is raised to OECD average. Note: Data on initial tax structure are between 2009 and 2011. Source: Authors’ estimates using data from Acosta-Ormaechea and Yoo (2012).

12 | ADB Economics Working Paper Series No. 412
Corporate income taxes are expected to be harmful to growth because they discourage
investment in capital and productivity improvements in addition to reducing foreign direct investment (Arnold et al. 2011, Myles 2009, and Hajkova et al. 2006). Owing to their progressive nature, personal income taxes can discourage growth more per unit of tax revenue than consumption taxes, which are generally flat. In addition, they can discourage savings by taxing both the return on savings and the income from which the savings originated. While consumption taxes raise the price of goods, they are not expected to discourage saving and investment as long as they remain constant over time. Property taxes are preferred over income taxes since they can help shift investment from housing into activities with higher returns, and thus increase the rate of growth.
The above exercise has shown which changes in tax structure are more beneficial to economic
growth. For example, raising consumption tax rather than personal or corporate income tax can have better effects on long-term growth. Still, the projected growth rates from altering tax structures should be interpreted with caution. There are other factors that need to be considered, such as revenue sufficiency, equity, simplicity, and compliance (Arnold et al. 2011). It would be insufficient, for example, to recommend reducing corporate taxes alone without considering other critical factors. A key benefit from the exercise is that it can help provide a basis for the direction of tax reforms.
If public spending reforms are implemented alongside changes in tax structures, then it is
possible that an increase in long-run GDP growth due to productive spending will be offset by the impact of distortionary taxes resulting in negligible or no long-run growth (Gemmell and Au 2012). Hence, there is a need to carefully measure the growth impacts of fiscal reforms involving both tax and spending reform.
B. Composition of Government Expenditures
Reallocating spending to infrastructure (usually transportation and communication) and education has been shown to have a positive impact on long-term growth. Looking at expenditure components in developing Asia by decade, however, public expenditures on transportation and communication and education, on average, have dropped (Figure 8). In some economies, education spending has been consistently low. India’s and Pakistan’s spending on education, for example, has been less than 1.0% of GDP (Figure 9). Between 1990s and 2000s, the region’s expenditures on education as a share of GDP dropped to 2.9% from 3.1% on average. It is interesting to quantify the impact on growth of reallocating spending to these components, particularly to education. The focus on education is based on empirical studies (e.g., Acosta-Ormaechea and Morozumi 2013; Bose, Emranul, and Osborn 2007) that show the robustness of expenditures on education across different estimation specifications.

Fiscal Policy and Growth in Developing Asia | 13
Figure 8: Expenditure Components
GDP = gross domestic product. Note: Unweighted average. Source: Authors’ estimates based on International Monetary Fund’s Government Financial Statistics (accessed 15 October 2013).
Figure 9: Education Spending, 1990–2011
GDP = gross domestic product, PRC = People’s Republic of China. Source: International Monetary Fund’s Government Financial Statistics online database (accessed 15 October 2013).
0
2
4
6
8
Generalpublic
services
Defense andpublic orderand safety
Transportand
communica-tion
Health Education Socialprotection
% o
f GD
P
1990–1999 2000–2011
0
2
4
6
8
10
1990 1993 1996 1999 2002 2005 2008 2011
% o
f GD
P
India Malaysia NepalPakistan PRC PhilippinesSingapore Sri Lanka Thailand

14 | ADB Economics Working Paper Series No. 412
Following a similar exercise on tax structure, we use estimates from existing studies to simulate the effect of increasing the share of education expenditures on growth in income per capita in developing Asian economies. Table 3 presents estimates obtained by Acosta-Ormaechea and Morozumi (2013) across different compensating factors and specifications. The results show that the magnitude of the effects of reallocating spending toward education is not trivial. In specification (1) for example, a 1 percentage point increase in education spending offset by a 1 percentage point drop in spending on other components results in a 1.1 percentage point increase in growth over a 5-year period or around 0.2 percentage point annually.
Table 3: Estimated Effects of Education Spending on Growth
Compensating Factor (1) (2) (3) (4)
All others 1.098* 1.278* 0.741 Defense 0.539 0.761 0.811 1.417** Health 1.553** 1.423 1.154 0.594 Social protection 1.090** 1.234** 0.804* 1.380** Transportation and communication –0.816 0.785 –0.601 1.555***
Notes: (1) to (4) represents estimates from different specifications done by Acosta-Ormaechea and Morozumi (2013) to check for robustness. See Tables 3, 5, 6, and 7 in Acosta-Ormaechea and Morozumi (2013); *** p < 1% ; ** p < 5%; * p < 10%. Source: Acosta-Ormaechea and Morozumi 2013.
We estimate that the average education spending (as a percentage of total expenditure) in
developing Asia is 13.6%. The seven countries in Table 4—Azerbaijan, Georgia, India, Kazakhstan, the Kyrgyz Republic, Pakistan, and Sri Lanka—have expenditure ratios below this average. The table presents the simulated impact on annual GDP and GDP per capita growth if the level of public expenditure on education in these economies were to be increased to the regional average. Table 4: Simulated Impact on Gross Domestic Product and Gross Domestic Product per Capita
Growth of Increasing Expenditure on Education
Education Expenditure (% of total)
Impact (Annual, percentage points) GDP per
Capita Growth GDP Growth Azerbaijan 8.6 1.1 1.4 Georgia 7.7 1.3 1.4 India 2.7 2.4 2.7 Kazakhstan 7.0 1.5 1.8 Kyrgyz Republic 11.9 0.4 0.6 Pakistan 1.8 2.6 2.9 Sri Lanka 9.1 1.0 1.1
Source: Authors’ estimates.
V. CONCLUDING OBSERVATIONS Developing Asia stands at a crossroads in the aftermath of the global financial and economic crisis. After decades of sustained, rapid economic growth that has lifted general living standards and sharply reduced poverty, the region’s growth is slowing down noticeably. To some extent, the deceleration is the consequence of a less favorable external environment due to the weakening of advanced

Fiscal Policy and Growth in Developing Asia | 15
economies since the global economic crisis, and there are also a number of homegrown issues that have contributed to moderating the growth momentum. For example, India continues to suffer from an infrastructure deficit and a difficult business environment, while the People’s Republic of China is in the midst of a strategic transition toward a more sustainable growth paradigm in which domestic demand and private consumption play a bigger role. While the magnitude and the cause of the deceleration differ across economies, sustaining rapid growth after the global crisis remains a difficult yet urgent challenge for the whole region.
Fiscal policy can help developing Asia meet this challenge. Fiscal policy contributed to the region’s growth in the past, and it can continue to do so in the future. Our analysis indicates that in developing Asia, the composition of taxes and government spending matters for economic growth. In theory, different types of taxes and public spending have different effects on growth. In line with theory, we find that in developing Asia, property taxes are more conducive for growth than personal and corporate income taxes. Therefore, when the region improves fiscal revenue mobilization efforts across all revenue categories to expand its relatively limited revenue base, governments would do well to pursue a mix of taxes and other fiscal revenues that minimize adverse growth effects. We find that the composition of government spending also has a significant effect on economic growth. More specifically, our analysis indicates that shifting public spending to education will yield a sizable growth dividend. To sum it up, developing Asia’s governments must pay attention to the mix of both their revenues and expenditures in order to maximize the contribution of fiscal policy to growth.
Finally, in light of growing popular demand for more inclusive growth, which benefits the
broadest possible swathes of the Asian population, Asian governments must explore ways to leverage fiscal policy for inclusive growth. That is, while sustaining growth is a key objective of fiscal policy, making sustained growth more inclusive should be an important additional consideration. The two objectives need not be mutually exclusive; public investments in education and health can augment overall human capital and thus foster growth while augmenting the productive capacity of the poor.

REFERENCES Acosta-Ormaechea, S. and A. Morozumi. 2013. Can a Government Enhance Long-Run Growth by
Changing the Composition of Public Expenditure? IMF Working Paper 13/162. Washington, DC: International Monetary Fund.
Acosta-Ormaechea, S. and J. Yoo. 2012. Tax Composition and Growth: A Broad Cross-country
Perspective. IMF Working Paper 12/257. Washington, DC: International Monetary Fund. Agell, J., T. Lindh, and H. Ohlsson. 1997. Growth and the Public Sector: A Critical Review Essay.
European Journal of Political Economy. 13 (1). pp. 33–52. Agenor, P.-R. 2010. A Theory of Infrastructure-led Development. Journal of Economic Dynamics &
Control. 34 (5). pp. 932–950. Alam, S., A. Sultana, and M. Butt. 2010. Does Social Expenditure Promote Economic Growth? A
Multivariate Panel Cointegration Analysis for Asian Countries. European Journal of Social Sciences. 14 (1). pp. 44–54.
Alfonso, A. and D. Furceri. 2010. Government Size, Composition, Volatility, and Economic Growth.
European Journal of Political Economy. 26 (4). pp. 517–532. Arnold, J. M., B. Brys, C. Heady, A. Johansson, C. Schwellnus, and L. Vartia. 2011. Tax Policy for
Economic Recovery and Growth. The Economic Journal. 121 (February). pp. F59–F80. Baffes, J. and A. Shah. 1998. Productivity of Public Spending, Sectoral Allocation Choices and
Economic Growth. Economic Development and Cultural Change. 46 (2). pp. 291–303. Barro, R. 1990. Government Spending in a Simple Model of Endogenous Growth. Journal of Political
Economy. 98 (5). pp. S103–S125. Bergh, A. and M. Henkerson. 2011. Government Size and Growth: A Survey and Interpretation of the
Evidence. Journal of Economic Surveys. 25 (5). pp. 872–897. Bose, N., H. M. Emranul, and D. R. Osborn. 2007. Public Expenditure and Economic Growth: A
Disaggregated Analysis for Developing Countries. The Manchester School. 75 (5). pp. 533–556. Devarajan, S., V. Swaroop, and H. Zou. 1996. The Composition of Public Expenditure and Economic
Growth. Journal of Monetary Economics. 37 (2). pp. 313–344. Durevall, D. and M. Henrekson. 2011. The Futile Quest for a Grand Explanation of Long-run
Government Expenditure. Journal of Public Economics. 95 (7–8). pp. 708–722. Easterly, W. and S. Rebelo. 1993. Fiscal Policy and Economic Growth: An Empirical Investigation. NBER
Working Paper No. 4499. Cambridge, MA: National Bureau of Economic Research. Gemmell, N. and J. Au. 2012. Government Size, Fiscal Policy and the Level and Growth of Output: A
Review of Recent Evidence. Working Paper in Public Finance 10/12. Wellington: Victoria Business School.

18 | References
Gemmell, N., R. Kneller, and I. Sanz. 2011. The Timing and Persistence of Fiscal Policy Impacts on Growth: Evidence from OECD Countries. Economic Journal. 121 (550). F33–F58.
———. 2012. Does the Composition of Government Expenditure Matter for Economic Growth.
Manuscript. http://www.victoria.ac.nz/sacl/about/cpf/research/pdfs-research/1GKSOECDPubExp-and-Growth.pdf (accessed 15 October 2013).
Hajkova, D., G. Nicoletti, L. Vartia, and K. Y. Yoo. 2006. Taxation and Business Environment as Drivers
of Foreign Direct Investment in OECD Countries. OECD Economic Studies No. 43. pp. 7–38. International Monetary Fund (IMF). 2011. Revenue Mobilization in Developing Countries. Washington,
DC. ———. 2013a. Fiscal Monitor: Taxing Times. World Economic and Financial Surveys. Washington, DC. ———. 2013b. Government Financial Statistics online database (accessed 29 and 30 October 2013). King, R. G. and S. Rebelo. 1990. Public Policy and Economic Growth: Developing Neoclassical
Implications. Journal of Political Economy. 98 (5). Part 2: The Problem of Development: A Conference of the Institute for the Study of Free Enterprise Systems. pp. S126-S150.
Kneller, R. and F. Misch. 2011. What Does Ex-post Evidence Tell Us about the Output Effects of Future
Tax Reforms? Mannheim: Centre for European Economic Research. Landau, D. 1983. Government Expenditure and Economic Growth: A Cross-country Study. Southern
Economic Journal. 49 (3). pp. 783–792. Myles, G. D. 2009. Economic Growth and the Role of Taxation—Disaggregate Data. OECD Economics
Department Working Paper. No. 715. Organisation for Economic Co-operation and Development Publishing. http://dx.doi.org/10.1787/222775817802 (accessed 20 September 2013).
Organisation for Economic Co-operation and Development. 2013. OECD StatExtracts. http://stats
.oecd.org (accessed 29 October 2013). Ram, R. 1986. Government Size and Economic Growth: A New Framework and some Evidence from
Cross-section and Time-series Data. American Economic Review. 76 (1). pp. 191–203. Skinner, J. 1987. Taxation and Output Growth: Evidence from African Countries. NBER Working Paper
Series No. 2335. Cambridge, MA: National Bureau of Economic Research. Slemrod, J. 1995. What Do Cross-country Studies Teach about Government Involvement, Prosperity,
and Economic Growth? Brookings Papers on Economic Activity. 2. pp. 373–431. World Bank. 2013. World Development Indicators database. http://databank.worldbank.org/data/
views/variableSelection/selectvariables.aspx? (accessed 30 October 2013). Wu, S.-Y., J.-H. Tang, and E. Lin. 2010. The Impact of Government Expenditure on Economic Growth:
How Sensitive to the Level of Development. Journal of Policy Modeling. 32 (6). pp. 804–817.

ASIAN DEVELOPMENT BANK
AsiAn Development BAnk6 ADB Avenue, Mandaluyong City1550 Metro Manila, Philippineswww.adb.org
Fiscal Policy and Growth in Developing Asia
The study shows that there are conceptual grounds why fiscal policy, including the composition of taxes and government spending, can have a significant effect on growth. Property taxes can have a more benign impact on growth than direct taxes, and shifting government spending to education can have a sizable impact. Developing Asia’s governments must pay attention to the mix of both their revenues and expenditures in order to maximize the contribution of fiscal policy to growth.
About the Asian Development Bank
ADB’s vision is an Asia and Pacific region free of poverty. Its mission is to help its developing member countries reduce poverty and improve the quality of life of their people. Despite the region’s many successes, it remains home to approximately two-thirds of the world’s poor: 1.6 billion people who live on less than $2 a day, with 733 million struggling on less than $1.25 a day. ADB is committed to reducing poverty through inclusive economic growth, environmentally sustainable growth, and regional integration.
Based in Manila, ADB is owned by 67 members, including 48 from the region. Its main instruments for helping its developing member countries are policy dialogue, loans, equity investments, guarantees, grants, and technical assistance.
FiscAl Policy AnD Growth in DeveloPinG AsiAArnelyn Abdon, Gemma B. Estrada, Minsoo Lee, and Donghyun Park
adb economicsworking paper series
no. 412
october 2014