FISCAL IMPACTS OF CHARTER SCHOOLS - Columbia …rr2165/pdfs/nycharterfiscal.pdf · FISCAL IMPACTS...
28
FISCAL IMPACTS OF CHARTER SCHOOLS: LESSONS FROM NEW YORK 1 Robert Bifulco Syracuse University 426 Eggers Hall Syracuse, New York 13244-1020 Randall Reback Barnard College 3009 Broadway New York, NY 10027-6598 Acknowledgments: The authors would like to thank the New York State Education Research Consortium and the Research Foundation of the State University of New York for funding the research project on which this article is based, and the New York State Education Department for providing some of the data needed for the project. 1 The analysis presented in this brief is based on a longer report that the authors prepared for the New York State Education Department—Robert Bifulco and Randall Reback, Effect of Charter Schools on School District Finance, Final Report submitted to the New York State Education Department and The Education Finance Research Consortium at SUNY Albany on December 31, 2011.
Transcript of FISCAL IMPACTS OF CHARTER SCHOOLS - Columbia …rr2165/pdfs/nycharterfiscal.pdf · FISCAL IMPACTS...

FISCAL IMPACTS OF CHARTER SCHOOLS:
LESSONS FROM NEW YORK1
Robert Bifulco
Syracuse University 426 Eggers Hall
Syracuse, New York 13244-1020
Randall Reback Barnard College 3009 Broadway
New York, NY 10027-6598
Acknowledgments: The authors would like to thank the New York State Education Research Consortium and the Research Foundation of the State University of New York for funding the research project on which this article is based, and the New York State Education Department for providing some of the data needed for the project.
1 The analysis presented in this brief is based on a longer report that the authors prepared for the New York State Education Department—Robert Bifulco and Randall Reback, Effect of Charter Schools on School District Finance, Final Report submitted to the New York State Education Department and The Education Finance Research Consortium at SUNY Albany on December 31, 2011.
Abstract
Given the budgetary strain that school districts have been facing in recent years and the impetus
to increase the number of charter schools, concerns about the fiscal impacts of charter schools
are more salient than ever. However, very little research has addressed this issue. Using the city
school districts of Albany and Buffalo in New York, this brief addresses this gap in the literature
by demonstrating how fiscal impacts on local school districts can be estimated and offering a
way to conceptualize fiscal impacts that is useful for framing charter school policy objectives.
We find that charter schools have had negative fiscal impacts on these two school districts, and
argue that there are two reasons for these impacts. First, operating two systems of public schools
under separate governance arrangements can create excess costs. Second, charter school
financing policies can distribute resources to or away from districts. We argue that charter
schools policies should seek to minimize any avoidable excess costs created by charter schools
and ensure that the burden of any unavoidable excess costs is equitably distributed across
traditional public schools, charter schools, and the state. We offer concrete policy
recommendations that may help to achieve these objectives.

1
INTRODUCTION
Charter schools have been a rapidly growing part of U.S. education for two decades, and
the U.S. Department of Education’s Race to the Top initiative is likely to spur continued growth.
Since the birth of charter schools, concerns have been raised that they would drain resources
from traditional public schools (Molnar, 1996; Arsen, Plank, & Sykes, 1999). Given the
budgetary strain that school districts have been facing in recent years and the impetus to increase
the number of charter schools, concerns about the fiscal impacts of charter schools are more
salient than ever.
Charter school policy debates often mention potential negative fiscal impacts on local
public schools, but relatively little research has focused on this issue. A search of the ERIC,
EconLit and RePEc databases found just one peer review study that provides measures of the
fiscal impact of charter schools.2 This brief is intended to address this gap in the literature by
demonstrating how fiscal impacts can be estimated and offering a way to conceptualize fiscal
impacts that is useful for framing charter school policy objectives.
Charter school programs can have negative fiscal impacts on local school districts for two
reasons. One reason is that operating two systems of public schools under separate governance
arrangements can create excess costs. A second reason is that charter school financing policies
can distribute resources to or away from districts. We argue that charter schools policies should
seek to minimize any avoidable excess costs created by charter schools and ensure that the
burden of any unavoidable excess costs is equitably distributed across traditional public schools,
charter schools, and the state.
2 Arsen and Ni (2012) find that higher levels of charter school enrollments in Michigan school districts are strongly associated with declining fund balances, and that revenues declined more rapidly than costs in districts losing students to charter schools. A few other reports prepared by research centers or advocacy organization have made arguments about likely fiscal impacts, but do not actually attempt to estimate those impacts, see for instance, Anderson, 2004 and Little et al., 2003.
2
We begin by defining the concept of excess costs and identifying the types of costs
incurred when charter schools enter a school district. Next, we identify the ways that charter
school finance policies can redistribute revenues either to or away from local schools districts.
Third, we summarize our attempts to estimate the fiscal impacts of charter schools on two local
school districts in New York-the city school districts of Albany and Buffalo. Albany and
Buffalo are interesting case studies because they have relatively large concentrations of charter
school students, and they have, respectively, stagnant and shrinking enrollment bases. Thus, we
would expect larger fiscal impacts of charter schools in these districts than most other places,
such that these cases provide an indication of how large charter school fiscal impacts might be.
Finally, we discuss how charter school financing policies can help to address negative fiscal
impacts by creating incentives to minimize avoidable excess costs and promoting a fair
distribution of the burden of the unavoidable excess costs that remain.
EXCESS COSTS GENERATED BY CHARTER SCHOOLS
Charter schools can increase educational costs either by causing an increase in revenues
devoted to education or by causing a reduction in services. If the revenues devoted to education
are increased, an additional burden is placed on taxpayers. The additional costs borne by
taxpayers might be justified by increased educational benefits, but nonetheless can be
conceptualized as additional costs. Reductions in services represent a burden borne primarily by
students and their families. We refer to the burdens created for taxpayers and students as a result
of charter schools as “excess costs.”
Charter schools can generate excess costs for a number of reasons. First, charter schools
can be expected to attract some number of students from private schools (Buddin, 2012; Toma,
Zimmer, & Jones, 2006; Ludner, 2007). The additional resources that charter schools use to

3
educate these students are not necessarily new resources from the point of view of society.
Nonetheless, transfers from private to charter schools do shift educational costs from the private
schools and their parents to the public sector and taxpayers, and thus, create fiscal impacts for
public education systems.
Second, charter schools might cause more personnel resources to be used to educate a
given number of students. In our case studies of Buffalo and Albany, district officials indicated
that it is difficult to reduce the number of teachers when enrollment losses are spread across a
large number of schools and grades. For instance, if five students are the most any particular
grade in a school loses to charter schools, if might not be possible reduce the number of
classroom teachers in the district.3 In this case, the additional teachers hired by charter schools
would not be offset by reductions in the number of district teachers. More generally, uncertainty
about charter school enrollments can make it difficult for districts to project enrollments and to
maintain targeted class sizes and student teacher ratios. If districts are apprehensive about
exceeding class size targets, then they will tend to err on the side of smaller classes. While class
size reductions may be beneficial to students, the benefits generated might not be sufficient to
offset the costs to taxpayers or the reductions in other areas of the school budget required to
finance the reduced class-sizes.
Third, charter school entry into a district typically increases the number of school
buildings used to serve students, increasing facility and related maintenance costs. Closing a
school in a district is a politically contentious undertaking and is typically not feasible until
enrollment losses are sufficiently large in particular grade ranges and are expected to persist.
Another factor that limits a district’s ability to close schools is the need to maintain excess
3 Officials in Buffalo pointed to a study of enrollment patterns in seven charter schools that indicated those schools drew students from 61 different schools and that the typical school lost only 5 students.

4
physical capacity in case charter schools close and enrollments suddenly increase. In 1999, the
year when the first charter school opened in Albany, the Albany City School District served
10,380 students in 17 schools. As of 2009-10, public resources supported 24 schools (15 district
and 9 charter schools) that served 10,568 students.
Finally, in many states, districts are required to provide several services for charter school
students including transportation, special education evaluation services, and health services. The
costs of these services might be higher as a result of charter schools because the services have to
be delivered to students spread across a larger number of schools and locations. For instance, the
district may need to establish additional bus routes to transport students to charter schools. In
addition, administering charter school payments, coordinating special education service, and
addressing other coordination issues with charter schools places increased demands on district
offices. For example, the Chief Financial Officer for Buffalo Public Schools indicated that one
of her staff members works full time on charter school payment issues.
These are all excess costs created by the introduction of charter schools, and many of
them result from coordination difficulties associated with separately operating two systems of
publicly-funded schools. It might be possible to reduce some of these costs through improved
planning by the district or improved coordination between the district and charter schools. In
principle, then, one may distinguish avoidable excess cost from unavoidable excess costs.4
IMPACTS OF CHARTER SCHOOL FINANCE POLICIES
The size of the excess costs generated by charter schools is an important question, as
these costs need to be weighed against any benefits of charter schools in comprehensive policy
4 We do not assume that the education sector operates with perfect efficiency here. If we did, then costs would be defined as the minimum resources required to provide a given level of services and only the unavoidable excess costs would properly be called “costs.”

5
assessments. The fiscal impacts of charter schools on local school districts, however, depend not
only on the size of these excess costs but also on the distribution of revenues to and away from
school districts that result from charter school financing policies, which vary considerably across
states (Goldhaber et al., 2005; Ni & Arsen, 2010).
To understand how charter school policies distribute revenues, it is useful to distinguish
two basic approaches to charter school financing. One approach is for the state to make per pupil
payments directly to the charter school without any involvement of local school districts. Under
this approach, district residents who enroll in charter schools would typically not be included in
enrollment counts for purposes of determining most state aid awards. Thus, charter school
payments are at least in part financed by reductions in state aid payments to districts, and the
primary effect of charter schools on school districts is reduced state aid receipts. The second
approach is for local school districts to make payments to charter schools for each resident
student that enrolls in a charter school. Under this approach the charter school students that
reside in the district would typically continue to be included in district enrollment counts, and
thus, charter school enrollments would not reduce state aid awards to the district. The primary
fiscal impacts on charter schools are the payments they are required to make to charter schools.
When charter school payments are made directly by the state, fiscal impacts will depend
on how much a district depends on state aid. In districts that receive only small amounts of aid,
charters will be likely to shed costs at least as great as revenue losses resulting from charter
school enrollments. In this case, the burden of any excess costs generated by charter schools will
be split between the state and charter schools, and the split will depend on the size of charter
school payments. In districts that rely heavily on state aid payments, the fiscal impacts of charter

6
schools will be more negative, and the students and taxpayers in these districts may bear some of
the burden of the excess costs generated by charter schools.
In places where charter school payments are made by districts, fiscal impacts will
naturally depend on the size of the payments made to charter schools. If per pupil charter school
payments are low relative to per pupil spending in a district, negative fiscal impacts will be
minimized and much of the cost of additional resource usage caused by charter schools will be
borne by charter school students in the form of reduced services. Alternatively, high charter
school reimbursement rates will increase negative fiscal impacts and force much of the excess
cost created by charter schools onto local public school students and taxpayers.
The effect of transfers from private schools into charter schools will also depend on the
school finance regime. Where the state makes charter school payments directly, transfers from
private schools will have no direct effect on district budgets, although they will place increased
burdens on the state. Where districts make charter school payments, the effects are more
complicated. The enrollment of private school students will increase the payments that districts
need to make to charter schools, but will also increase the count of public school students who
reside in the district and thereby, increase state aid awards to the district. The net effect on the
district will depend on the relative sizes of its per pupil aid awards and charter school payments.
Finally, state financing programs can serve to disperse the costs created by charter
schools to taxpayers statewide. For instance, New York State provides districts with increasing
charter school enrollments transitional aid meant to reduce any negative fiscal impacts on the
district. The state also provides limited start-up and facility grants to charter schools, essentially
passing some of the costs of excess facility capacity onto taxpayers statewide.

7
ESTIMATING FISCAL IMPACTS IN BUFFALO AND ALBANY
Buffalo and Albany are interesting case studies because they have a high concentration of
charter schools. Approximately 20 percent of public school students in Albany and 17 percent in
Buffalo attend charter schools. These market shares, respectively, rank 10th and 15th highest
among districts nationwide (NAPCS 2011). Also, the school-aged population in Albany has
been stagnant for the last decade and the school-aged population in Buffalo has been falling for
at least two decades. Transfers to charter schools thus result in shrinking enrollments in these
districts rather than merely slower enrollment growth.5 Finally, state law in New York requires
districts to pay charter schools an amount equal to per pupil operating expenditures for each
resident student who enrolls in a charter school. Due to each of these factors, fiscal impacts of
charter schools are likely to be larger in Buffalo and Albany than in most other locations.
A straightforward way to estimate the fiscal impacts of charter schools is to compare the
change in district revenues net of charter school payments to the expenditure reductions that the
districts are able to make as a result of charter school enrollments. The changes in both revenues
and expenditures depend on the impacts that charter schools have on district enrollments. So we
begin by presenting estimates of enrollment impacts. Next, we estimate the changes in revenue
and expenditures generated by these enrollment decreases. In presenting each of these analyses,
we first identify the data sources used, describe the challenges to generating impacts estimates
and how we addressed them, and then summarize the results of our analysis.
5 Teske, et al. (2000) argue that in areas with rising total enrollment, districts avoid any fiscal pain associated with charter school enrollments because they are able to maintain enrollment levels despite declining market share. See also RPI, 2001 which finds that districts with declining enrollment reported that charter schools had a negative impact on their budget, while in districts with increasing enrollment trends, administrators were more likely to report no fiscal impacts.

8
Enrollment Impacts
Data on district enrollments were drawn from the New York State Education
Department’s (NYSED) School Report Cards, and counts of district residents attending charter
schools were provide to us by the NYSED Office of State Aid. As shown in Figure 1, between
1999 and 2009, K-12 enrollment has decreased 19.4 percent in Albany and 26.7 percent in
Buffalo. The enrollment of students in district schools plus the charter schools located in the
Albany has remained roughly flat over the last 10 years. Nonetheless, the district saw significant
declines in enrollments, especially between 2002 and 2008 as charter schools in the district were
expanding. In Buffalo, enrollment declines had already begun during the 1990s, prior to charter
schools, but have accelerated over the last decade, particularly between 2002 and 2005.
During 2009-10, 2,054 students residing in Albany attended charter schools,
approximately 20 percent of public school enrollment. In Buffalo, 6,557 resident students
attended charter schools in 2009-2010, which is approximately 17 percent of public school
enrollment. Smaller percentages of limited English proficient students from these districts are
enrolled in charter schools, and charter schools in Albany enroll few students with disabilities
(see first column, Scenario 1, in Table 1), which limits the ability of districts to reduce spending
on bilingual, English as Second Language, and special education services.
Charter school enrollments among resident students are upper bound estimates of the
numbers of students districts have lost to charter schools. Some of the students who reside in a
district and attend charter schools might have chosen to attend private schools or might have
moved out of the district if charter school options were not available. To address the uncertainty
regarding how many charter school students would have attended district schools in the absence
of charters, we developed estimates of fiscal impacts under three scenarios. Under Scenario 1,

9
we assume that all charter school students would have attended district schools if charter school
options were not available. Under Scenario 2, we assume that in the absence of charter schools,
charter school students would have enrolled in private schools at the same rates as resident
students with a similar poverty, English language proficiency, and disability profile. Rates of
private school attendance for each district (by poverty status, English language background, and
disability status) were obtained using data from the 2000 U.S. Census. Under Scenario 3, we
assume that charter school students would have enrolled in private schools or left the district at
twice the rate that other resident students enroll in private schools. The estimated impacts on
district enrollments under each scenario are presented in Table 1.
Fiscal Impacts
Charter school enrollments affect net district revenues in New York State in three ways.
First, districts are required to make payments to charter schools for each resident charter school
student. Second, awards from Title I, Part A, the largest single federal aid program, are
determined based on district enrollments excluding charter school students. Thus, when Title I
students who otherwise would attend district schools choose to enroll in charter school, the
federal aid received by the district is reduced. Third, other state and federal aid programs base
awards on counts of resident pupils in the district, including charter school students. Charter
school students who are drawn from private schools or who would otherwise have moved out of
the district generate additional aid that the district would not have received in the absence of
charter schools.
Data on revenues and charter school payments used in our analysis were drawn from
Annual Financial Reports (ST-3 files) collected by the NYSED. The second rows of each panel
of Table 2 display our estimates of revenue losses. We estimate that the Albany City School

10
District lost between $23.6 and $26.1 million (between 11.4 and 12.5 percent of total revenues)
during 2009-10 as a result of charter schools, and the Buffalo Public Schools lost between $57.3
and $76.8 million (between 7.5 and 9.9 percent of total revenues). The range of estimates is
wider for Buffalo because it relies more heavily on state aid than Albany, and thus, variation in
assumptions about how many charter school students would have attended district schools has a
larger effect on state aid awards for Buffalo.
The key question for determining fiscal impacts is whether enrollment reductions allow a
district to achieve expenditure reductions commensurate with revenue reductions. To address
this question we used detailed reports of expenditures by function to divide district spending into
fixed components that cannot be adjusted in response to charter enrollments, and step or variable
costs, which can be adjusted. Next, for each variable or step cost we identified key cost drivers,
either the number of students or number of teachers, which allowed us to compute per unit cost
figures. Finally, we used estimates of enrollment changes together with per unit cost figures to
estimate how much expenditures could be reduced. Data on expenditures by function were
drawn from the ST-3 files and counts of teachers were drawn from the Personnel Master File
maintained by the NYSED.
For these purposes, fixed costs include spending for services that districts have to provide
for resident students, regardless of whether they attend district or charter schools. In New York,
these services include textbooks, computer hardware and software, pupil transportation, pre-K
services, and health services. Also included among fixed expenditures is spending that is
difficult to reduce when enrollments decrease, at least in the short-run. These include
expenditures for general support functions, principals, capital expenditures, debt service, special
schools, community services, and retiree health care benefits. The remaining expenditure items

11
we count as variable costs, including spending on instructional supervision other than principals,
teachers, pupil services other than health, employee preparation programs, and occupational
education. For Albany, 66.3 percent of the expenditures are counted here as variable, and for
Buffalo, 54.6 percent. The Appendix provides details on our categorization of various types of
expenditures and our corresponding calculations of cost savings permitted by enrollment losses.
The third rows of each panel of Table 2 report our estimates of cost savings. We estimate
that charter school enrollments allowed the Albany City School District to reduce expenditures
by between $15.0 and $19.1 million, which is between 7.8 and 8.7 percent of the expenditures
that would have been required in the absence of charter schools. For the Buffalo Public Schools,
we estimate that charter school enrollments allowed expenditure reductions between $36.7 and
$52.6 million, which is between 5.1 percent and 7.2 percent of total expenditures.
The estimated revenues lost due to charter schools by the Albany City School District
exceed the estimated reduction in expenditure needs by between $7.0 and $8.5 million,
depending on how many charter school students would have otherwise attended district schools.
These imply negative impacts between $976 and $1,070 per pupil. For the Buffalo Public
Schools we estimate negative fiscal impacts between $20.6 and $24.2 million, or between $633
and $744 per pupil. In Albany, negative fiscal impacts increase as the number of charter school
students drawn from the private sector increases because the additional state aid those students
generate does not offset the additional payments to charter schools. In Buffalo, however, per
pupil state aid amounts are much higher than in Albany, and additional students drawn from
private schools reduce estimated fiscal impacts in Buffalo.
The sixth row of each panel of Table 2 lists the transition aid that New York State
provided to the districts to reduce the fiscal burden of their charter school payments. We discuss
12
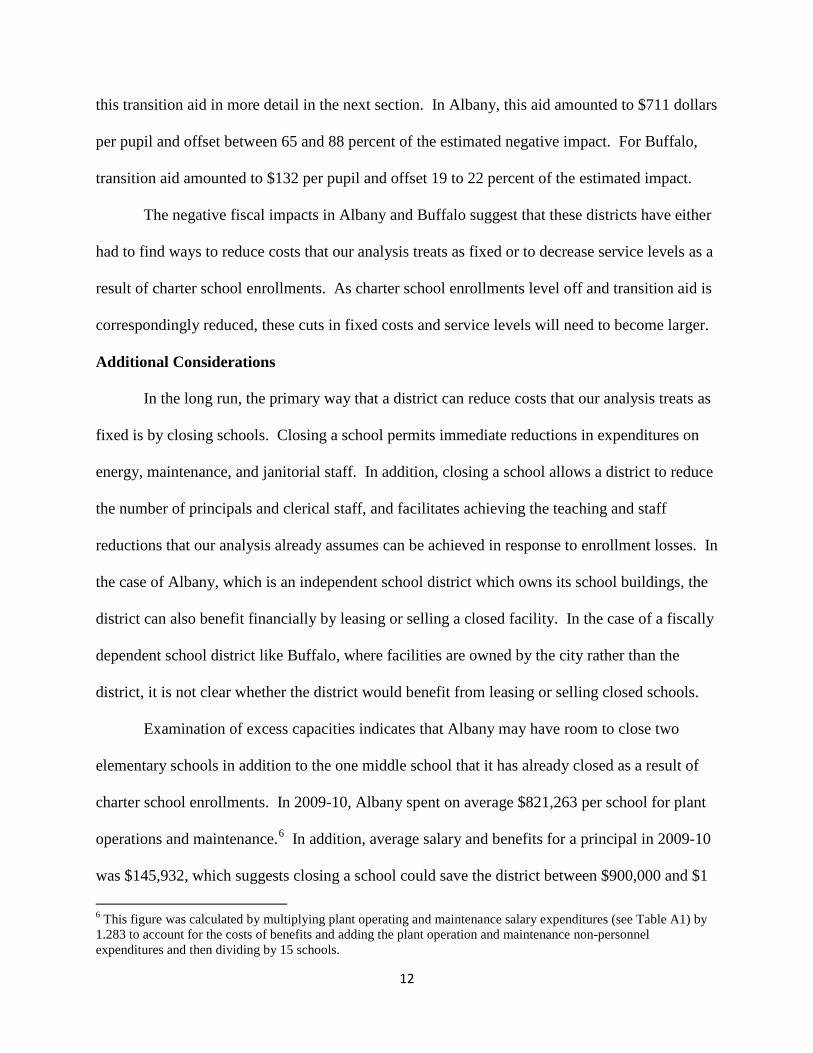
this transition aid in more detail in the next section. In Albany, this aid amounted to $711 dollars
per pupil and offset between 65 and 88 percent of the estimated negative impact. For Buffalo,
transition aid amounted to $132 per pupil and offset 19 to 22 percent of the estimated impact.
The negative fiscal impacts in Albany and Buffalo suggest that these districts have either
had to find ways to reduce costs that our analysis treats as fixed or to decrease service levels as a
result of charter school enrollments. As charter school enrollments level off and transition aid is
correspondingly reduced, these cuts in fixed costs and service levels will need to become larger.
Additional Considerations
In the long run, the primary way that a district can reduce costs that our analysis treats as
fixed is by closing schools. Closing a school permits immediate reductions in expenditures on
energy, maintenance, and janitorial staff. In addition, closing a school allows a district to reduce
the number of principals and clerical staff, and facilitates achieving the teaching and staff
reductions that our analysis already assumes can be achieved in response to enrollment losses. In
the case of Albany, which is an independent school district which owns its school buildings, the
district can also benefit financially by leasing or selling a closed facility. In the case of a fiscally
dependent school district like Buffalo, where facilities are owned by the city rather than the
district, it is not clear whether the district would benefit from leasing or selling closed schools.
Examination of excess capacities indicates that Albany may have room to close two
elementary schools in addition to the one middle school that it has already closed as a result of
charter school enrollments. In 2009-10, Albany spent on average $821,263 per school for plant
operations and maintenance.6 In addition, average salary and benefits for a principal in 2009-10
was $145,932, which suggests closing a school could save the district between $900,000 and $1
6 This figure was calculated by multiplying plant operating and maintenance salary expenditures (see Table A1) by 1.283 to account for the costs of benefits and adding the plant operation and maintenance non-personnel expenditures and then dividing by 15 schools.

13
million per year.7 If so, charter school enrollments would allow the district to reduce
expenditures by between $2.7 and $3.0 million in addition to the expenditure reductions
summarized in Table 2. Put another way, closing schools would allow the district to offset
between 32 and 43 percent of the negative fiscal impact estimated in Table 2.
In Buffalo, the district has closed a number of schools over the last decade. We estimate
that charter school enrollments have allowed the district to close 7 or 8 more schools than it
otherwise could have. In 2009-2010, the Buffalo City School District spent on average
$1,063,517 per school for plant operations and maintenance.8 In addition, average annual salary
and benefits for a principal in the Buffalo City school district is $128,346. This suggests that a
school closure could reduce the costs we have treated as fixed in our analysis by between $1 and
$1.2 million. Thus, closing 7 or 8 schools may have saved the district between $7 and $9.6
million, and may have reduced the negative fiscal impacts that we estimated for Buffalo by
between 29 and 44 percent.
While school closures can help districts reduce fiscal impacts, it is also important to note
that our estimates of fiscal impacts are not estimates of how much the Albany and Buffalo
districts have been able to reduce expenditures as a result of charter school enrollments. Rather,
we have estimated expenditure reductions that may be possible without sacrificing the levels of
service that districts provide. Actual reductions do not necessarily match possible reductions.
For instance, our analysis assumes that districts maintain constant student/staff ratios as
enrollment declines. Between the 2001-02 and 2008-09 school years, enrollment in the Albany
7 District officials in Albany indicated that the recent closure of a middle school in the district created an estimated $750,000 per year in savings, after netting out costs of approximately $150,000 per year associated with maintaining the school as a vacant building. We were also told that the district is in the process of finalizing sale of the building, which will eliminate the costs of “mothballing” the building plus generate fiscal benefits from the sale. 8 This figure was calculated by taking plant operating and maintenance salary expenditures from Table A2 by 1.331 to account for the costs of benefits and adding the plant operation and maintenance non-personnel and then dividing by 58 schools.

14
City School District fell by almost 18 percent, but the district made few staffing changes. As a
result, student/teacher ratios decreased from 12.4 in 2001-02 to 10.6 in 2008-09. Ratios of
students to other types of staff also were substantially lower in 2008-09 than in 2001-02. Buffalo
saw the largest drops in enrollment during the 2002 to 2006, during which time enrollment
declined by an average a more than 5 percent per year. During this period, the district was able
to cut staff, and as a result maintained similar staffing ratios each year during this period.
The experiences in Albany and Buffalo indicate that over some period of time, staffing
can be adjusted in response to enrollment declines. They also suggest that Albany was slower
than Buffalo to adjust staffing in response to charter school enrollments. There are three possible
reasons why Buffalo was able to respond more quickly than Albany. First, Buffalo underwent
enrollment declines during the 1990s, so district officials there may have gained experience
managing enrollment reductions sooner than officials in Albany. Second, enrollment declines
were larger in Buffalo than in Albany, so Buffalo may have reached thresholds that made staff
reductions easier and more urgent earlier than in Albany. Third, Buffalo was closing schools
beginning earlier in the decade, and closing schools facilitates staff reductions. Albany did not
close any schools until 2008-09, after which it began to make staff reductions.
POLICY IMPLICATIONS
Our case studies suggest that charter schools can have negative fiscal impacts on school
districts. Even assuming districts are able to make staffing reductions commensurate with
enrollment losses, we estimate negative fiscal impacts ranging from $883 to $1,070 per pupil in
Albany and $633 to $744 per pupil in Buffalo. In the long run, districts may be able to reduce
some of the expenditures that our analysis treats as fixed, and this would mitigate some of the
negative fiscal impact. At the same time, however, there are several factors that make it difficult

15
to achieve expenditure reductions immediately in response to enrollment losses, and thus, in the
short run, the negative impacts of charter schools might be larger than our estimates indicate.
Operating separate systems of public schools in the same area creates excess costs.
Revenues diverted from school districts to charter schools exceed the costs that charter school
enrollments allow districts to shed, and thereby cause districts to bear part of the burden of the
excess costs charter schools generate. This analysis suggests two objectives for policies to
address charter school fiscal impacts. The first objective is to reduce the avoidable excess costs
that operating separate school systems create. The second objective is to ensure that the burden
of these costs is divided in a sensible manner between the districts and their students and
taxpayers, the charter schools and their students, and the state and its taxpayers. In the remainder
of this brief we discuss policies that can help promote these objectives.
Policies to Promote Coordination between Districts and Charter Schools
Many of the excess costs created when charter schools enter an area arise because of
difficulty coordinating service delivery across separate systems of schools, resulting in
duplication of services and failure to realize potential economies of scale. Several measures can
help encourage stronger coordination.
1. Constrain the timing of charter school enrollments to facilitate budget planning. States
should consider requiring charter schools to have earlier, binding admissions deadlines.
Students should not be allowed to enter a charter school during the upcoming school year
unless they: (i) had declared that intention by the deadline, or (ii) are replacing other
students from their district that had declared by the deadline but later transferred back to
a district school. Charter schools would have to send their preliminary rosters of each
district’s resident-students with signed declarations shortly after the deadline. Such
requirements would significantly reduce uncertainty regarding district enrollments and
thus facilitate timely adjustment of staffing levels.

16
2. Create incentives for districts and charter schools to share facilities. Charter schools
frequently close, which creates incentives for districts to maintain excess capacity as a
hedge against possible enrollment increases. Districts might be better positioned to close
schools if they could retain flexibility to reopen those schools should the need arise. One
way to reduce excess capacity while retaining flexibility is to lease excess space to
charter schools. States offering aid to charter schools to help them finance facilities
could create incentives for facility sharing by providing more favorable aid to charters
that lease space from public school districts. Favorable aid terms for charter schools that
lease from district schools can be justified because the charter schools would be assuming
some risk by leasing rather than purchasing facilities. The ability to reduce expenditures
and/or receive lease payments may provide districts sufficient incentives to share excess
space with charter schools. If these incentives are insufficient, then the state might
consider requiring districts with excess capacity to offer space to charter schools.
3. Encourage districts to use existing intra-district choice programs to facilitate staffing
adjustments. Like many urban districts, both Albany and Buffalo offer intra-district
school choice. Such choice programs provide an opportunity to ensure that schools
achieve class-size targets. The number of teachers allocated to each school should be
coordinated with enrollment decisions to ensure that class sizes do not deviate from
established targets. For instance, assuming a class size target of 20 students, a school
with a historical enrollment of 40 kindergarten students per year should be allocated a
third kindergarten teacher unless demonstrated demand is sufficient to ensure enrollment
as high as 60. Such a policy might require leaving classrooms vacant in some buildings
and redeploying them for other purposes, and it may also mean fewer students get their
first choice of school. However, such a policy can help ensure the district is able to make
staffing reductions commensurate with enrollment losses.
Policies to Promote Equity without Sacrificing Efficiency
In pursuing the objective of dividing the burden of excess costs sensibly, two
considerations are relevant. One, incentives to reduce avoidable excess costs need to be
maintained. For instance, it may not be optimal to shift the burden of all negative fiscal impacts

17
from the districts to the state, because districts would no longer face pressure to make long run
expenditure reductions in response to reduced enrollments. Two, districts should not be required
to bear the burden of excess costs that they cannot do anything to address. These burdens put
undue pressure on services in these districts. Several measures can help achieve these objectives.
4. Link districts’ charter school payments to estimates of costs that the district can reduce
in response to enrollment losses. Currently in New York, several types of district
expenditures affect the size of the payments made to charter schools even though these
expenditures represent fixed costs to the district. For example, current retiree health care
expenditures are not affected by charter school enrollments and they are costs that charter
schools typically avoid. In 2009-10, the Buffalo City School District spent
approximately $1,658 per pupil and the Albany City School District spent approximately
$1,064 per pupil for current retiree health benefits. Removing these expenditures from
the computation of charter school payments would substantially relieve much of the fiscal
impact of charter schools on districts. Since districts can do little to control these costs,
and charter schools do not typically have similar costs, this adjustment would serve to
distribute cost burdens more fairly across the sectors. If payment amounts linked to the
marginal costs that districts can shed when students transfer to charter schools are
insufficient to support charter school operations, then the state can consider providing
additional aid to charter schools. Charter school policies are established by states to
promote statewide education goals, suggesting that taxpayers statewide should share the
burden of any excess costs such policies generate.
5. Provide transitional aid to districts experiencing large growth in charter schools. New
York’s transitional aid program reimburses the districts for a portion of their charter
school payments that are attributable to recent increases in charter school enrollment.
The award amounts are computed as 80 percent of the payments attributed to increased
charter school enrollment during the last year, 60 percent of payments attributed to
increases in charter school enrollments two years earlier, and 20 percent of the payments
attributed to increases in charter school enrollments three years earlier. Above we
discussed reasons why districts might have difficulty achieving staff reductions

18
commensurate with enrollment losses in the short term. This aid program is well-
designed to provide relief to districts who are experiencing rapid increases in charter
school enrollments and who may need time to adjust. Also, because the aid phases out as
charter school enrollments stabilize, it does not undermine incentives for districts to
adjust spending in the longer run.
SUMMARY
Our analysis suggests that charter schools can create negative fiscal impacts on school
districts, particularly in districts with rapid growth in charter schools and declining or stagnant
enrollment bases. If districts are able to reduce costs that are fixed in the short run by closing
schools and taking other measures, they might be able to avoid long-run reductions in service
quality. However, achieving expenditures reductions commensurate with enrollment and
revenue losses is difficult in the short run for a number of reasons. The primary reason why
charter schools impose negative fiscal impacts is that running two systems of schools in parallel
creates excess costs. Policies should be designed to minimize any avoidable excess costs that are
created by the introduction of charter schools, and to ensure that districts, their taxpayers, and the
charter schools themselves do not bear an undue portion of the excess costs. As discussed above,
there are a number of steps state policy makers can take to promote these policy goals.
REFERENCES
Anderson, Amy Berk. 2004. Charter schools in Washington State: A financial drain or gain? Seattle, WA: Center for Reform of Public Education.
Arsen, David and Yongmei Ni. 2012. The effects of charter school competition on school district resource allocation. Educational Administration Quarterly, 48(1): 3-38.
Arsen, David, David Plank, and Gary Sykes. 1999. School choice policies in Michigan: The rules matter. Lansing, MI: Michigan State University. Buddin, Richard. 2012. The impact of charter schools on public and private school enrollments. Washington, DC: Cato Institute.

19
Goldhaber, Dan, Kacey Guin, Jeffrey Henig, Frederick Hess, & Janet Weiss. 2005. How school choice affects students who do not choose. In J. Betts & T. Loveless (Eds.), Getting choice right: Ensuring equity and efficiency in education policy (pp. 101-129). Washington, DC: Brookings Institution. Little, David, Gregory Roberts, Diane Ward, Alison B. Bianchi, and Mary Metheny. 2003. Charter schools: investment in innovation or folly? Latham, NY: New York State School Boards Association.
Ludner, Mattew. 2007. “The impact of charter schools on Catholic schools: A comparison of programs in Arizona and Michigan. Catholic Education: A Journal of Inquiry and Practice, 11(1): 102-114.
Molnar, Alex. 1996. Charter schools: The smiling face of disinvestment. Educational Leadership 54(2): 9-15.
National Alliance of Public Charter Schools (NAPCS). 2011. A growing movement: America’s largest charter school communities. Washington, DC: author.
Ni, Yongmei and David Arsen. 2010. The competitive effect of charter schools on public school districts. In C. Lubienski & P. Weitzel (Eds.), The charter school experiment: Expectations, evidence, and implications (pp. 93-120). Cambridge, MA: Harvard Education Press.
RPP International. 2001. Challenge and opportunity: The impact of charter schools on school districts. Washington, DC: U.S. Department of Education, Office of Educational Research and Improvement.
Teske, Paul, Mark Schneider, Jack Buckley, and Sara Clark. 2000. Does charter school competition improve traditional public schools. New York, NY: Manhattan Institute for Policy Research.
Toma, Eugenia, Ron Zimmer, and John T. Jones, “Beyond achievement: enrollment con-sequences of charter schools in Michigan,” Advances in Applied Microeconomics 14 (2006): 241–55.

20
Figure 1: K-12 Enrollment in Albany and Buffalo, 1990-2009
Albany
Buffalo
Source: National Center for Education Statistics Common Core of Data and New York State School Report Cards-Accountability and Overview Reports.
0
2000
4000
6000
8000
10000
1200019
90
1991
1992
1993
1994
1995
1996
1997
1998
1999
2000
2001
2002
2003
2004
2005
2006
2007
2008
2009
District Enrollment District+Charter Enrollment
30000
32000
34000
36000
38000
40000
42000
44000
46000
48000
1990
1991
1992
1993
1994
1995
1996
1997
1998
1999
2000
2001
2002
2003
2004
2005
2006
2007
2008
2009
District Enrollment District+Charter Enrollment

21
Table 1: Resident Students Enrolled in Charter Schools, 2009-10 Albany Scenario 1 Scenario 2 Scenario 3
# % of public enrollment #
% of public enrollment #
% of public enrollment
Total1 2054 20.5 1837 18.7 1620 16.9 Free Lunch Eligible2 1655 29.2 1524 27.5 1392 25.7 Limited English Proficient2 50 9.1 39 7.2 28 5.3 Students with Disabilities2 89 6.1 80 5.5 71 4.9
Buffalo Scenario 1 Scenario 2 Scenario 3
# % of public enrollment #
% of public enrollment #
% of public enrollment
Total1 6557 16.7 5832 15.2 5107 13.5 Free Lunch Eligible2 4011 14.9 3829 14.3 3647 13.7 Limited English Proficient2 107 3.4 98 3.1 90 2.8 Students with Disabilities2 855 12.2 808 11.6 760 11.0 1. Total enrollment figures were provided by NYSED Office of State Aid 2. Figures in these rows are estimates. Estimates were computed by obtaining the percentage of students enrolled in each category in charter schools located in the district from the School Report Cards and then multiplying that percentage by the total count of resident students enrolled in charters.

22
Table 2: Net Fiscal Impacts of Charter School Enrollments, 2009-10
Albany
Scenario 1 Scenario 2 Scenario 3
Lost Enrollment 2054 1837 1620
Lost Revenue (26,138,249) (24,864,664) (23,573,995)
Reduced Expenditure Need 19,093,955 17,080,297 15,033,683
Net Fiscal Impact (7,044,294) (7,784,367) (8,540,312)
Net Fiscal Impact Per Pupil (883) (976) (1,070)
Transition Aid 6,179,250 6,179,250 6,179,250
Transition Aid Per Pupil 711 711 711
Buffalo
Scenario 1 Scenario 2 Scenario 3
Lost Enrollment 6557 5832 5107
Lost Revenue (76,801,485) (67,036,444) (57,285,636)
Reduced Expenditure Need 52,552,238 43,227,065 36,659,765
Net Fiscal Impact (24,249,247) (23,809,379) (20,625,871)
Net Fiscal Impact Per Pupil (744) (730) (633)
Transition Aid 4,634,647 4,634,647 4,634,647
Transition Aid Per Pupil 132 132 132

23
Appendix: Calculations of Cost Savings due to Lost Enrollments in Albany and Buffalo School Districts
Table A1: Expenditures by Function in Albany City School District, 2009-10
Total fixed step/variable Cost Driver Cost Per
Unit Administration General support – salaries 1,829,479 1,829,479 0 General support - non-personnel 3,580,208 3,580,208 0 Plant oper. & maint.-salaries 4,952,447 4,952,447 0 Plant oper. & maint.-non-personnel 5,964,954 5,964,954 0 Superv. & improvement - salaries 9,083,981 2,274,936 6,809,045 Teachers 9,004 Superv. & improvement - non-personnel 1,316,570 0 1,316,570 Teachers 1,741
Teachers & Instruction (Regular Ed)
Kindergarten teacher salaries 2,652,857 0 2,652,857 K students 3,971 G1-G6 teachers salaries 20,173,902 0 20,173,902 G1-G6 stu. 5,616
G7-G12 teachers salaries 19,860,578 0 19,860,578 G7-G12 stu. 5,412
Bilingual/ESL teachers salaries 955,745 0 955,745 LEP stu. 1,904 Non-instructional salaries 3,381,555 0 3,381,555 All students 424 Non-personnel 5,076,845 0 5,076,845 All students 636
Special Education Salaries 17,259,348 0 17,259,348 Stu. w Disabil. 10,005 Non-personnel 2,792,079 0 2,792,079 Stu. w Disabil. 1,619
Pupil Services1 0 - Salaries 10,756,927 2,150,720 8,606,207 All students 1,348 Non-personnel 3,114,031 304,570 2,809,461 All students 381
Transportation
Salaries 166,835 166,835 0 Non-personnel 6,047,031 6,047,031 0
Pre-K
Salaries 1,311,506 1,311,506 0 Non-personnel 1,065,089 1,065,089 0
Other Expenditures2
Salaries 3,311,550 1,143,498 2,168,052 G7-G12 stu. 481 Non-personnel 853,660 407,949 445,711 G7-G12 stu. 121 Capital & debt service 16,027,764 16,027,764 0 TOTAL 177,134,243 59,631,447 117,502,796 Source: Authors computations based on 2009-10 ST-3 and PMF files. 1. Includes library/instructional technology and food services, which are not typically classified as pupil services. 2. Includes employment preparation, occupational education, special schools, community service, athletics, as well as capital and debt service.

24
Table A2: Expenditures by Function in Buffalo City School District, 2009-10
Total Fixed Step/
Variable Cost Driver Cost Per
Unit Administration General support – salaries 7,364,408 7,364,408 0 General support - non-personnel 4,206,187 4,206,187 0 Plant oper. & maint.-salaries 16,487,821 16,487,821 0 Plant oper. & maint.-non-personnel 39,755,695 39,755,695 0 Superv. & improvement - salaries 26,896,356 5,207,867 21,688,489 Teachers 6,972 Superv. & improvement - non-personnel 4,406,707 0 4,406,707 Teachers 1,416 Teachers & Instruction (Regular Ed) Kindergarten teacher salaries 7,059,512 0 7,059,512 K students 2,894 G1-G6 teachers salaries 52,479,365 0 52,479,365 G1-G6 stu. 3,533 G7-G12 teachers salaries 66,209,428 0 66,209,428 G7-G12 stu. 4,364 Bilingual/ESL teachers salaries 7,224,325 0 7,224,325 LEP stu. 2,349 Non-instructional salaries 320,519 0 320,519 All students 10 Non-personnel 23,589,493 0 23,589,493 All students 723 Special Education Salaries 62,274,732 0 62,274,732 Stu. w Disabil. 10,101 Non-personnel 5,751,079 0 5,751,079 Stu. w Disabil. 933 Pupil Services1 Salaries 15,767,630 154,339 15,613,291 All students 484 Non-personnel 9,023,971 7,558,539 1,465,432 All students 202 Transportation Salaries 8,453,579 8,453,579 0 Non-personnel 40,948,094 40,948,094 0 Pre-K Salaries 7,221,685 7,221,685 0 Non-personnel 1,930,745 1,930,745 0 Other Expenditures2 Salaries 24,152,178 6,000,644 18,151,534 G7-G12 stu. 1,109 Non-personnel 5,464,061 3,321,041 2,143,020 G7-G12 stu. 141 Capital & debt service 89,303,537 89,303,537 0 TOTAL 680,234,255 308,818,182 371,416,073 Source: Authors computations based on 2009-10 ST-3 and PMF files. 1. Includes library/instructional technology and food service, which are not typically classified as pupil services. 2. Includes employment preparation, occupational education, special schools, community service, athletics, as well as capital and debt service.

25
Table A3: Reduction in Expenditure Needs Due to Charter School Enrollments in Albany, 2009-10
Spending Reductions, Scenario 1
Spending Reductions, Scenario 2
Spending Reductions, Scenario 3
Administration General support - salaries 0 0 0 General support - non-personnel 0 0 0 Plant oper. & maint.-salaries 0 0 0 Plant oper. & maint.-non-personnel 0 0 0 Superv. & improvement - salaries 1,152,549 1,037,294 900,429 Superv. & improvement - non-personnel 278,565 250,709 217,629 Teachers & Instruction (Regular Ed) Kindergarten teacher salaries 841,925 752,967 664,009 G1-G6 teachers salaries 6,164,497 5,513,002 4,861,506 G7-G12 teachers salaries 1,805,310 1,614,822 1,424,334 Bilingual/ESL teachers salaries 76,155 59,401 42,647 Non-instructional salaries 696,399 622,827 549,254 Non-personnel 1,306,911 1,168,839 1,030,767 Special Education Salaries 712,386 640,347 568,308 Non-personnel 144,055 129,488 114,920 Pupil Services Salaries 1,772,367 1,585,121 1,397,875
Non-personnel 93,308 83,449 73,590 Transportation Salaries 0 0 0 Non-personnel 0 0 0 Pre-K Salaries 0 0 0 Non-personnel 0 0 0 Other Expenditures Salaries 197,074 176,280 155,485
Non-personnel 50,643 45,300 39,956 Capital & debt service 0 0 0
TOTAL 19,093,955 17,080,297 15,033,683

26
Table A4: Reduction in Expenditure Needs Due to Charter School Enrollments in Buffalo, 2009-10
Spending Reductions, Scenario 1
Spending Reductions, Scenario 2
Spending Reductions, Scenario 3
Administration General support - salaries 0 0 0 General support - non-personnel 0 0 0 Plant oper. & maint.-salaries 0 0 0 Plant oper. & maint.-non-personnel 0 0 0 Superv. & improvement - salaries 3,016,879 2,436,925 2,029,841 Superv. & improvement - non-personnel 766,219 618,924 515,534 Teachers & Instruction (Regular Ed) Kindergarten teacher salaries 1,252,709 1,102,198 910,008 G1-G6 teachers salaries 9,448,688 8,411,396 6,955,795 G7-G12 teachers salaries 8,652,180 5,610,998 4,319,107 Bilingual/ESL teachers salaries 208,624 184,191 169,155 Non-instructional salaries 49,794 45,862 40,160 Non-personnel 4,580,877 4,219,153 3,694,653 Special Education Salaries 7,143,664 6,529,503 6,141,612 Non-personnel 824,648 753,750 708,973 Pupil Services1 Salaries 2,425,574 2,234,041 1,956,318 Non-personnel 24,314 21,393 17,662 Transportation Salaries 0 0 0 Non-personnel 0 0 0 Pre-K Salaries 0 0 0 Non-personnel 0 0 0 Other Expenditures Salaries 2,372,024 1,538,274 1,184,097
Non-personnel 350,060 227,016 174,747 Capital & debt service 0 0 0
TOTAL 52,552,238 43,227,065 36,659,765