FISCAL ACCOUNTABILITY REPORT FISCAL … overarching trends identified in previous Fiscal...
76
FISCAL ACCOUNTABILITY REPORT FISCAL YEARS 2017 – 2020 A REPORT TO THE APPROPRIATIONS COMMITTEE AND THE FINANCE, REVENUE AND BONDING COMMITTEE PURSUANT TO SECTION 2-36B OF THE CONNECTICUT GENERAL STATUTES BENJAMIN BARNES, SECRETARY NOVEMBER 15, 2016
Transcript of FISCAL ACCOUNTABILITY REPORT FISCAL … overarching trends identified in previous Fiscal...

FISCAL ACCOUNTABILITY REPORT
FISCAL YEARS 2017 – 2020
A REPORT TO
THE APPROPRIATIONS COMMITTEE AND
THE FINANCE, REVENUE AND BONDING COMMITTEE
PURSUANT TO SECTION 2-36B OF THE CONNECTICUT GENERAL STATUTES
BENJAMIN BARNES, SECRETARY
NOVEMBER 15, 2016


CONTENTS Summary ........................................................................................................................................... 1
Section 1 – Estimate of State Revenues and Fixed Expenditures
Assumptions Used to Develop Growth Estimates for Fixed Costs ............................................................ 3
Projected Growth in Fixed Cost Drivers .................................................................................................... 5
Projected Revenues .................................................................................................................................. 6
Assumptions Used to Develop Revenue Estimates .................................................................................. 7
Section 2 – Projected Tax Credits ........................................................................................................ 8
Section 3 – Summary of Estimated Deficiencies .................................................................................. 9
Section 4 – Budget Reserve Fund ...................................................................................................... 11
Section 5 – Projected Bond Authorizations, Allocations and Issuances ............................................... 14
Section 6 – Revenue and Expenditure Trends, Major Cost Drivers
Expenditure Cap ...................................................................................................................................... 16
Economic Recovery ................................................................................................................................. 17
General Fund Economic Growth Rates ................................................................................................... 19
Personal Income Tax ............................................................................................................................... 20
Sales and Use Tax .................................................................................................................................... 24
Motor Fuels Tax ...................................................................................................................................... 25
Transportation Initiatives and Financing ................................................................................................ 26
General Fund Fixed Cost Drivers ............................................................................................................. 27
Long Term Obligations ............................................................................................................................ 28
State Employees Retirement System ...................................................................................................... 29
Teachers Retirement System .................................................................................................................. 34
Other Post-Employment Benefits ........................................................................................................... 35
State Employees Pension and Health ..................................................................................................... 36
Connecticut’s Bond Rating ...................................................................................................................... 37
Reducing the Size of State Government ................................................................................................. 39
State Full Time Workforce ...................................................................................................................... 41
Medicaid Expenditure Trends ................................................................................................................. 42
Federal Budget and Policy Issues, and Efforts to Preserve and Maximize Federal Funds ...................... 44
Municipal Aid .......................................................................................................................................... 44
Contingent Liabilities............................................................................................................................... 48
Unemployment Compensation Fund ...................................................................................................... 50
Section 7 – Analysis of Possible Uses of Surplus Funds
Possible Uses of Surplus Funds ............................................................................................................... 53
History of General Fund Operating Surplus or Deficit ............................................................................ 54

SUMMARY INTRODUCTION
In accordance with CGS 2-36b, this report outlines significant factors affecting Connecticut’s budgetary and economic outlook for fiscal years 2017 through 2020. Statutory provisions and the state constitution require the Governor to present, and the Legislature to adopt, a budget that is both balanced and within levels allowed by the spending cap. The information in this report outlines the challenges facing decision-makers when developing future budgets.
OVERVIEW
Revenues in this document align with the consensus forecast issued jointly by the Office of Policy and Management and the legislature’s Office of Fiscal Analysis on November 10, 2016.
Pursuant to the requirements of Section 78 of Public Act 16-3 of the May special session of the legislature, the methodology for this report varies from that used in prior years. This report shows the level of expenditure change from current year expenditures allowable by consensus revenue estimates in the General Fund and Special Transportation Fund, the changes to current year expenditures necessitated by fixed cost drivers, and the aggregate changes to current year expenditures required to accommodate fixed cost drivers without exceeding current revenue estimates.
A $67.7 million shortfall is currently estimated in the General Fund in FY 2017.
When comparing estimated costs for “fixed” components of the budget to the November consensus revenue forecast, fixed cost growth in the General Fund exceeds revenue growth for FY 2018 by nearly $1.3 billion. Beyond FY 2018, revenue and fixed cost growth are anticipated to be much more closely matched.
In order to remain compliant with the statutory debt limit on General Obligation bonding, the General Assembly will be required to repeal authorizations of at least $316.1 million in FY 2018, $481.3 million in FY 2019, and $531.6 million in FY 2020.
The state’s expenditure cap will allow growth in capped expenditures of roughly $300 million in FY 2018 over FY 2017 levels. Allowable growth rates are 2.0 percent in FY 2018 over FY 2017, 2.3 percent in FY 2019 over FY 2018, and 3.4 percent in FY 2020 over FY 2019.
MAJOR ISSUES AND TRENDS IMPACTING THE STATE’S FISCAL SITUATION
The overarching trends identified in previous Fiscal Accountability Reports remain relevant today:
Connecticut has made progress over the last six years by addressing long term obligations, streamlining state government, and undertaking a broad program of economic development.
Recovery from the “Great Recession” has been uneven both nationally and in Connecticut. While steady progress has been made in Connecticut, more work remains to be done.
Economic conditions in Connecticut are impacted by national and international factors. In particular, the transition of administrations underway in Washington, D.C. creates uncertainty, and agreement on a budget—or another continuing resolution to fund government operations—must occur by December 9, 2016. Global political and economic uncertainty could affect the national and regional economies.
1

FINANCIAL SUMMARY YEAR OVER YEAR REVENUE GROWTH vs. FIXED COST GROWTH
FY 2018 vs.
FY 2017
FY 2019 vs.
FY 2018
FY 2020 vs.
FY 2019
Revenue Growth (189.7)$ 363.5$ 451.1$
Fixed Cost Growth
Debt Service 257.4 (65.8) 155.7
State Employee Pensions 78.4 33.9 46.5
Teacher Pensions 278.3 41.9 42.6
State and Teachers OPEB 206.3 77.2 36.3
Medicaid 246.7 133.3 147.7
Other Entitlements 29.0 34.8 40.4
Total Fixed Cost Growth 1,096.1 255.3 469.3
Difference (1,285.8)$ 108.2$ (18.2)$
FY 2018 vs.
FY 2017
FY 2019 vs.
FY 2018
FY 2019 vs.
FY 2018
Revenue Growth 176.0$ 44.4$ 52.7$
Fixed Cost Growth
Debt Service 57.4 64.8 66.9
State Employee Pensions 5.1 6.2 5.2
Total Fixed Cost Growth 62.6 71.0 72.1
Difference 113.4$ (26.6)$ (19.4)$
SPECIAL TRANSPORTATION FUND
GENERAL FUND
(in millions)
As shown above, fixed cost growth for FY 2018 exceeds revenue growth in the General Fund by nearly
$1.3 billion. The largest one-time factors for this difference include:
o Increased transfers of sales tax revenue out of
the General Fund in support of Municipal
Revenue Sharing and the Special Transportation
Fund. As depicted in the table at right, in FY
2018, these transfers total $682.6 million, an
increase of $484.9 million over FY 2017.
o Adoption of more conservative actuarial
assumptions for the Teachers’ Retirement
System is the most significant factor in the
projected $278.3 million increase in the State’s
required contribution to the fund.
o The final year of repayment of the 2009
Economic Recovery Notes contributes $178.7
million to non-recurring debt service costs in FY 2018.
o The first year of matching contributions to the Retiree Healthcare Fund adds $120 million the
State’s OPEB contribution.
Beyond FY 2018, revenue and fixed cost growth are anticipated to be much more closely matched.
Fiscal Year MRSA STF Total
2017* $0.0 $197.7 $197.7
2018 $341.3 $341.3 $682.6
2019 $352.2 $352.2 $704.4
2020 $363.6 $363.6 $727.2
*General Fund revenues appropriated to the
Municipal Revenue Sharing Fund for FY 2017, per
PA 16-2, Sec. 46.
Sales Tax Revenue Transfers to the
Municipal Revenue Sharing Account (MRSA) and
($ in Millions)
the Special Transportation Fund (STF)
Amount Dedicated
2


SECTION 1
ESTIMATE OF STATE REVENUES AND
FIXED EXPENDITURES


ASSUMPTIONS USED TO DEVELOP GROWTH ESTIMATES FOR FIXED COSTS
The FY 2018 column reflects the anticipated increase in spending versus the FY 2017 appropriated level. The FY 2019 and FY 2020 columns reflect the estimated increase over FY 2018 and FY 2019 respectively. STATE TREASURER – DEBT SERVICE
Reflects Treasurer’s estimates of debt service requirements for FY 2018 through FY 2020. STATE COMPTROLLER – FRINGE BENEFITS
State Employees Retirement Contributions – Reflects the estimated actuarially determined employer contributions from the pension actuary.
Higher Education Alternative Retirement System – Reflects estimated expenditure requirements.
Judges and Compensation Commissioners Retirement – Reflects estimates of the actuarially determined employer contributions.
Retired State Employee Health Service Cost – Reflects medical inflation.
Other Post Employment Benefits – Reflects the estimated matching state contribution commencing in FY 2018 per the 2011 SEBAC Agreement.
DEPARTMENT OF MENTAL HEALTH AND ADDICTION SERVICES
General Assistance Managed Care – Reflects anticipated caseload growth. DEPARTMENT OF SOCIAL SERVICES
State-Funded Supplemental Nutrition Assistance Program, HUSKY B Program, Medicaid, Old Age Assistance, Aid to the Blind, Aid to the Disabled, Temporary Assistance to Families, Connecticut Home Care Program, Protective Services to the Elderly, State Administered General Assistance, and Community Residential Services - Reflects anticipated cost and caseload changes based on current trends, as well as annualization of adjustments.
Medicaid, Old Age Assistance, Aid to the Blind, Aid to the Disabled, and Community Residential Services – Reflects leap year payments in FY 2020.
Medicaid – Reflects decrease in federal reimbursement for the Medicaid expansion population (HUSKY D) in accordance with the provisions of the Affordable Care Act (from 100% in FY 2016 to 95% in FY 2017, 94% in FY 2018, 93% in FY 2019 and 90% in FY 2020).
HUSKY B Program – Reflects the provision in the Affordable Care Act which increases federal reimbursement for the Children's Health Insurance Program (CHIP) by 23 percentage points effective October 1, 2015 through September 30, 2019. For Connecticut, reimbursement is increased from 65% to 88% during this period.
Connecticut Home Care Program – Reflects the anticipated increases in enrollment as a result of the expiration of the statutory freeze on Category 1 intake. (Category 1, the lowest level of need under the state-funded program, is targeted to individuals who are
3

at risk of hospitalization or short-term nursing facility placement but are not frail enough to require long-term nursing facility care.)
OFFICE OF EARLY CHILDHOOD
Birth to Three and Care4Kids TANF/CCDF – Reflects no increase over current year appropriations, since eligibility for these programs is subject to some level of administrative control.
TEACHERS RETIREMENT BOARD
Retirement Contributions – Reflects the FY 2018 and FY 2019 actuarially determined employer contributions from the pension valuation as of June 30, 2016. FY 2020 reflects the increase estimated by the plan actuary.
Retirees Health Service Cost – Reflects the state share returning to the statutory one-third of costs for the basic health plan starting in FY 2018 and the medical inflation rate.
Municipal Retiree Health Insurance – Reflects the state share returning to the statutory one-third of the subsidy starting in FY 2018. FYs 2019 and 2020 reflect level funding based on flat volume.
DEPARTMENT OF CHILDREN AND FAMILIES
Board and Care for Children - Foster & Adoption – Reflects anticipated growth in the number of children in foster care and subsidized adoptive homes, and additional post-secondary education costs for children adopted after January 1, 2005.
Board and Care for Children - Short Term & Residential – Reflects impact of regulatory increases in per diem rates for room and board at in-state residential treatment facilities.
Board and Care for Children - Foster and Individualized Family Supports – Reflects increased child day care payments as a result of the closure of intake to Care4Kids program in 2016.
Board and Care for Children - Adoption, Foster Care, and Short-Term and Residential – Board and Care for Children accounts have been adjusted in 2020 for the cost of an additional per diem payment due to leap year.
4

GENERAL FUND
FY 2018 Increase
over FY 2017
FY 2019 Increase
over FY 2018
FY 2020 Increase
over FY 2019
DMHAS - General Assistance Managed Care 947,171$ 752,544$ 1,004,106$
DMHAS - Medicaid Adult Rehabilitation Option - - -
DSS - HUSKY B Program(1)
730,000 240,000 8,050,000
DSS - Medicaid(1)246,728,739 133,300,000 147,650,600
DSS - Old Age Assistance 2,518,715 1,961,611 1,430,618
DSS - Aid To The Blind (43,290) (811) 3,825
DSS - Aid To The Disabled 2,498,548 2,240,277 1,497,207
DSS - Temporary Assistance to Families - TANF (8,070,659) 897,822 1,056,604
DSS - Connecticut Home Care Program 1,970,000 4,370,000 1,400,000
DSS - Community Residential Services 26,257,976 18,709,531 20,134,648
DSS - Protective Services to the Elderly 158,351 47,578 33,771
DSS - State Administered General Assistance (746,505) 661,101 653,825
OEC - Birth to Three - - -
OEC - Care4Kids TANF/CCDF - - -
TRB - Retirement Contributions 278,267,000 41,939,000 42,632,000
TRB - Retirees Health Service Cost 19,239,140 4,961,000 1,550,680
TRB - Municipal Retiree Health Insurance Costs 800,000 - -
DCF - No Nexus Special Education 574,122 - -
DCF - Board and Care for Children - Adoption 879,938 2,106,159 3,154,380
DCF - Board and Care for Children - Foster 8,468,453 1,820,022 1,178,026
DCF - Board and Care for Children - Short-term and Residential (3,741,999) 924,975 821,870
DCF - Individualized Family Supports (3,386,494) 38,305 -
OTT - Debt Service 218,936,426 (64,890,710) 137,678,668
OTT - UConn 2000 - Debt Service 17,803,170 20,904,000 18,030,125
OTT - CHEFA Day Care Security - - -
OTT - Pension Obligation Bonds - TRB 20,621,050 (21,818,500) -
OSC - Adjudicated Claims - - -
OSC - State Employees Retirement Contributions 80,668,457 32,791,000 45,471,247
OSC - Higher Education Alternative Retirement System (3,204,934) 52,000 66,424
OSC - Pensions and Retirements - Other Statutory (54,008) 50,452 -
OSC - Judges and Compensation Commissioners Retirement 958,174 1,006,083 1,003,568
OSC - Retired State Employees Health Service Cost 66,290,000 72,200,000 34,783,960
OSC - Other Post Employment Benefits 120,000,000 - -
TOTAL - GENERAL FUND 1,096,067,541$ 255,263,439$ 469,286,152$
SPECIAL TRANSPORTATION FUND
OTT - Debt Service 57,439,103$ 64,805,305$ 66,891,039$
OSC - State Employees Retirement Contributions 5,132,022 6,244,000 5,163,823
TOTAL - SPECIAL TRANSPORTATION FUND 62,571,125$ 71,049,305$ 72,054,862$
(1) Medicaid and Husky B amounts reflect the state share of these net-appropriated programs.
PROJECTED GROWTH IN EXPENDITURESFIXED COST DRIVERS
(Amounts Represent Year over Year Change)
5

Taxes FY 2017 FY 2018 FY 2019 FY 2020Personal Income Tax 9,452.5$ 9,754.6$ 10,083.2$ 10,434.9$ Sales & Use Tax 4,279.8 3,921.8 4,046.6 4,177.9 Corporation Tax 839.3 787.7 815.8 776.7 Public Service Tax 283.9 292.3 301.2 310.3 Inheritance & Estate Tax 174.6 180.1 186.1 192.4 Insurance Companies Tax 245.4 227.0 230.5 234.1 Cigarettes Tax 371.1 354.1 336.8 320.3 Real Estate Conveyance Tax 201.8 208.3 214.9 223.2 Alcoholic Beverages Tax 62.2 62.6 63.0 63.4 Admissions & Dues Tax 39.0 39.5 39.8 40.1 Health Provider Tax 701.5 701.1 700.2 700.1 Miscellaneous Tax 20.1 20.5 21.0 21.5
Total Taxes 16,671.2$ 16,549.6$ 17,039.1$ 17,494.9$ Less Refunds of Tax (1,106.5) (1,146.8) (1,201.0) (1,257.4) Less Earned Income Tax Credit (133.6) (150.0) (155.6) (161.8) Less R&D Credit Exchange (8.5) (8.8) (9.2) (9.6)
Total - Taxes Less Refunds 15,422.6$ 15,244.0$ 15,673.3$ 16,066.1$
Other RevenueTransfers-Special Revenue 355.5$ 372.1$ 380.9$ 389.9$ Indian Gaming Payments 267.0 267.3 199.0 196.6 Licenses, Permits, Fees 269.2 298.3 275.9 306.4 Sales of Commodities 42.6 43.8 44.9 46.1 Rents, Fines, Escheats 128.0 130.1 132.1 134.1 Investment Income 3.8 5.9 7.0 7.9 Miscellaneous 299.0 181.3 185.0 188.8 Less Refunds of Payments (66.1) (67.5) (68.9) (70.4)
Total - Other Revenue 1,299.0$ 1,231.3$ 1,155.9$ 1,199.4$
Other SourcesFederal Grants 1,229.0$ 1,194.8$ 1,203.9$ 1,218.9$ Transfer From Tobacco Settlement 108.5 93.7 94.2 94.0 Transfers From (To) Other Funds (218.3) (112.7) (112.7) (112.7)
Total - Other Sources 1,119.2$ 1,175.8$ 1,185.4$ 1,200.2$
Total - General Fund Revenues 17,840.8$ 17,651.1$ 18,014.6$ 18,465.7$
Taxes FY 2017 FY 2018 FY 2019 FY 2020Motor Fuels Tax 503.7$ 506.8$ 507.6$ 507.8$ Oil Companies Tax 255.7 278.8 308.0 345.3 Sales & Use Tax 197.7 341.3 352.2 363.6 Sales Tax - DMV 90.3 90.9 91.9 92.6
Total Taxes 1,047.4$ 1,217.8$ 1,259.7$ 1,309.3$ Less Refunds of Taxes (14.5) (12.6) (14.1) (14.5)
Total - Taxes Less Refunds 1,032.9$ 1,205.2$ 1,245.6$ 1,294.8$
Other SourcesMotor Vehicle Receipts 256.4$ 258.7$ 261.4$ 263.8$ Licenses, Permits, Fees 141.5 142.0 142.6 143.1 Interest Income 8.5 9.5 10.4 11.2 Federal Grants 12.1 12.1 12.1 12.1 Transfers From (To) Other Funds (6.5) (6.5) (6.5) (6.5) Less Refunds of Payments (3.8) (3.9) (4.1) (4.3)
Total - Other Sources 408.2$ 411.9$ 415.9$ 419.4$
Total - STF Revenues 1,441.1$ 1,617.1$ 1,661.5$ 1,714.2$
Note: The above schedule reflects the November 10, 2016 consensus revenue estimates pursuant to C.G.S. 2-36c.
Special Transportation Fund
PROJECTED REVENUESConsensus Revenue Forecast - November 10, 2016
General Fund
(In Millions)
6

Fiscal Fiscal Fiscal Fiscal
2017 2018 2019 2020
UNITED STATES
Gross Domestic Product 3.8% 4.6% 4.4% 4.2%
Real Gross Domestic Product 2.0% 2.2% 2.2% 2.1%
G.D.P. Deflator 1.9% 2.3% 2.1% 2.1%
Unemployment Rate 4.8% 4.7% 4.6% 4.6%
New Vehicle Sales (M) 17.5 17.6 17.6 17.5
Consumer Price Index 1.9% 2.5% 2.4% 2.4%
CONNECTICUT
Personal Income 2.7% 4.1% 4.3% 4.4%
Nonagricultural Employment 0.8% 0.2% 0.2% 0.3%
Housing Starts (T) 5.2 5.9 6.7 7.3
Unemployment Rate 5.6% 5.4% 5.2% 5.1%
(M) denotes millions
(T) denotes thousands
(As Estimated by OPM Based Upon the November 10, 2016 Consensus Revenue Forecast)
Taxes 2017 2018 2019 2020
Personal Income Tax 1 3.3, 2.9 3.6, 2.6 3.9, 2.3 3.4, 3.3
Sales & Use Tax 3.1 3.1 3.3 3.2
Corporation Tax 9.3 2.9 3.1 2.9
Public Service Tax 6.5 2.9 2.9 2.9
Inheritance & Estate Tax -19.7 3.2 3.3 3.4
Insurance Companies Tax 1.4 1.8 1.4 1.4
Cigarettes Tax -4.5 -4.6 -4.9 -4.9
Real Estate Conveyance Tax 2.6 3.2 3.2 3.9
Alcoholic Beverages Tax 0.5 0.5 0.5 0.5
Admissions & Dues Tax 1.0 1.3 0.8 0.8
Health Provider -0.4 0.6 0.5 0.5
Taxes 2017 2018 2019 2020
Motor Fuels Tax 2.0 0.6 0.2 0.1
Oil Companies Tax 2.3 9.0 10.5 12.1
Sales Tax - DMV 1.0 0.7 1.1 0.8
NOTES:
1. Rates for withholding and "estimates and final" filings.
General Fund
Special Transportation Fund
ASSUMPTIONS USED TO DEVELOP REVENUE ESTIMATES
ECONOMIC GROWTH RATES FOR PROJECTED TAX REVENUES
(Percent Change)
7


SECTION 2
PROJECTED TAX CREDITS


PROJECTED TAX CREDITS
Projected Total Amounts of Tax Credits Claimed(In Thousands)
Fiscal Year Fiscal Year Fiscal Year Fiscal Year Fiscal Year
2016 2017 2018 2019 2020
Est. Proj. Proj. Proj. Proj.
Personal Income Tax Credits
Property Tax 159,000$ 115,000$ 119,000$ 123,000$ 127,000$
Earned Income Tax Credit 127,400 133,600 150,000 155,600 161,800
Connecticut Higher Education Trust (CHET) 9,500 9,500 9,500 9,500 9,500
Angel Investor 3,000 3,000 3,000 3,000 -
Total Personal Income Tax 298,900$ 261,100$ 281,500$ 291,100$ 298,300$
Business Tax Credits
Fixed Capital 49,500 53,500 53,500 53,500 53,500
Film Industry Production(1)31,500 33,500 45,500 47,000 48,000
Film Industry Digital Animation(1)15,000 15,000 15,000 15,000 15,000
Film Industry Infrastructure(1)15,500 16,500 23,000 23,500 24,000
Electronic Data Processing(1)22,500 24,000 30,500 31,500 32,500
Research and Experimental Expenditures 13,500 15,000 16,000 16,500 17,000
Research and Development Expenditures 25,000 27,000 30,000 32,000 33,500
Urban and Industrial Reinvestment(1)31,000 34,900 39,200 43,100 46,100
Housing Program Contribution(1)10,000 10,000 10,000 10,000 10,000
Historic Rehabilitation(1)3,000 3,000 3,000 3,000 3,000
Human Capital 2,500 2,500 2,500 2,500 2,500
Machinery and Equipment 700 800 800 800 800
All Other Credits(1)16,500 16,500 16,500 22,500 22,500
Total Business Tax Credits 236,200$ 252,200$ 285,500$ 300,900$ 308,400$
Total Projected Amount Claimed 535,100$ 513,300$ 567,000$ 592,000$ 606,700$
In addition, tax credit projections have been adjusted to account for policy changes through the 2016 legislative
session. Business tax credits have been prorated to account for the 50.01% credit cap effective January 1, 2015.
Tax credit projections are based on data from the Department of Revenue Services. Personal income tax credits
are projected using income year 2014 data. Corporation business tax credits are projected using income year
2011-2013 data. This is because information regarding tax credits is typically delayed as firms often request an
extension to file their final returns. This delays the receipt of such data by the Department of Revenue Services
which then must still capture information from the return. Appropriate growth rates are applied to base year
data to derive an estimate for future fiscal years.
(1) Includes credits claimed under the Corporation Tax, Insurance Premiums Tax, Hospital Net Revenue Tax, the Public Service
Companies Tax, and Sales Tax abatements per PA 16-1 of the September Special Session in FY 2019 and FY 2020.
8


SECTION 3
SUMMARY OF ESTIMATED DEFICIENCIES


GENERAL FUND ESTIMATE - FISCAL YEAR 2017(In Millions)
General Revised
Assembly Estimates Over/
Budget Plan 1.OPM (Under)
REVENUE
Taxes 16,768.5$ 16,671.2$ (97.3)$
Less: Refunds (1,248.6) (1,248.6) -
Taxes - Net 15,519.9$ 15,422.6$ (97.3)$
Other Revenue 1,219.0 1,299.0 80.0
Other Sources 1,147.8 1,119.2 (28.6)
TOTAL Revenue 17,886.7$ 17,840.8$ (45.9)$
EXPENDITURES
Initial Current Year Appropriations 18,073.3$ 18,073.3$ 0.0$
Prior Year Appropriations Continued to FY 2017 2.96.5 96.5
TOTAL Adjusted Appropriations 18,073.3$ 18,169.8$ 96.5$
Net Additional Expenditure Requirements 29.5 29.5
Estimated Appropriations Lapsed (209.3) (203.3) 6.0
TOTAL Estimated Expenditures 17,864.0$ 17,996.0$ 132.0$
Net Change in Fund Balance - Continuing Appropriations (96.5) (96.5)
Miscellaneous Adjustments/Rounding (9.0) (9.0)
Net Change in Unassigned Fund Balance - 6/30/2017 22.7$ (67.7)$ (90.4)$
SPECIAL TRANSPORTATION FUND ESTIMATE - FISCAL YEAR 2017(In Millions)
General Revised
Assembly Estimates Over/
Budget Plan 1.OPM (Under)
Fund Balance as of June 30, 2016 3.150.4$ 142.8$ (7.6)$
REVENUE
Taxes 1,065.3$ 1,047.4$ (17.9)$
Less: Refunds of Taxes (14.5) (14.5) -
Taxes - Net 1,050.8 1,032.9 (17.9)
Other Revenue 413.6 408.2 (5.4)
TOTAL - Revenue 1,464.4$ 1,441.1$ (23.3)$
EXPENDITURES
Appropriations 1,475.4$ 1,475.4$ -$
Prior Year Appropriations Continued to FY 2016 3.22.6 22.6
TOTAL Initial and Continued Appropriations 1,475.4$ 1,498.0$ 22.6$
Net Additional Expenditure Requirements - -
Estimated Appropriations Lapsed (12.0) (20.3) (8.3)
TOTAL Estimated Expenditures 1,463.4$ 1,477.7$ 14.3$
Net Change in Fund Balance - Continuing Appropriations (22.6) (22.6)
Net Change in Unassigned Fund Balance - FY 2017 1.0$ (14.0)$ (15.0)$
Estimated Fund Balance - June 30, 2017 151.4$ 128.8$ (22.6)$
1. P.A. 15-244, as amended by P.A. 15-5, June Spec. Sess. and P.A. 16-2, May Spec. Sess., after gubernatorial line item vetoes.
2. P.A. 15-244, as amended by P.A. 15-5, June Spec. Sess., P.A. 16-2, May Spec. Sess., and other statutory provisions.
3. Budget plan as estimated by the Office of Policy and Management.
9

SUMMARY OF ESTIMATED DEFICIENCIES (REASONS FOR DEFICIENCIES AND BASIS OF ASSUMPTIONS)
The Office of Policy and Management is projecting agency deficiencies in the General Fund totaling $29.475 million for Fiscal Year 2017, as described below.
Office of the Chief Medical Examiner. A total shortfall of $275,000 is estimated, consisting of $245,000 in Personal Services and $30,000 in Other Expenses, as the adopted budget did not annualize funding provided via deficiency appropriation in FY 2016.
Office of Early Childhood. A total shortfall $13.5 million is projected, with $8.1 million of that in the Birth to Three account due to caseload increases and increased utilization of more costly services, and $5.4 million in the Care for Kids account as a result of increases in subsidy rates to reflect collective bargaining increases for day care workers and changes in federal regulations.
Public Defender Services Commission. A total shortfall of $3.7 million is projected, with $2.4 million in Personal Services, $1.0 million in Assigned Counsel – Criminal, and $300,000 in Expert Witnesses.
State Treasurer – Debt Service. A shortfall of $12.0 million is anticipated. Although the Treasurer’s office recently projected a deficiency that is $7.4 million greater than this, our estimate reflects the likely result of a scheduled refunding sale and minor differences in the assumed timing, amounts and interest rates related to debt issuance for the remainder of the fiscal year.
Also affecting balance is $9.0 million in estimated requirements for Adjudicated Claims. Existing law requires that Adjudicated Claims payments be made from the resources of the General Fund. Settlement costs related to the SEBAC v. Rowland decision are made from the Adjudicated Claims account, but updated information regarding the exact monetary costs to be paid as part of the settlement during FY 2017 is not yet available.
10

SECTION 4
BUDGET RESERVE FUND


HISTORY OF BUDGET RESERVE FUND(In Millions)
Following Year % of NetFiscal Deposits / G. F. Net General FundYear (Withdrawals) Balance Appropriation Appropriation
1983-84 165.2$ 165.2$ 3,624.6$ 4.61984-85 33.4 198.6 3,709.2 5.41985-86 16.2 214.8 3,972.3 5.41986-87 104.8 319.6 4,339.4 7.41987-88 (115.6) 204.0 4,966.6 4.11988-89 (101.7) 102.3 5,594.4 1.81989-90 (102.3) - 6,372.6 0.01990-91 - - 6,981.8 0.01991-92 - - 7,317.7 0.01992-93 - - 8,589.6 0.01993-94 - - 8,571.2 0.01994-95 80.5 80.5 8,836.8 0.91995-96 160.5 241.0 9,049.4 2.71996-97 95.9 336.9 9,342.2 3.61997-98 161.7 498.6 9,972.0 5.01998-99 30.5 529.1 10,581.6 5.0
1999-2000 34.9 564.0 11,280.8 5.02000-01 30.7 594.7 11,894.0 5.02001-02 (594.7) - 12,387.8 0.02002-03 - - 12,452.0 0.02003-04 302.2 302.2 13,336.2 2.32004-05 363.9 666.0 14,131.7 4.72005-06 446.5 1,112.5 14,837.2 7.52006-07 269.2 1,381.7 16,314.9 8.52007-08 - 1,381.7 17,101.8 8.12008-09 - (1) 1,381.7 17,370.3 8.02009-10 (1,278.5) (2) 103.2 17,667.2 0.62010-11 (103.2) (2) 0.0 18,707.7 0.02011-12 93.5 (3) 93.5 19,140.1 0.52012-13 177.2 270.7 17,188.7 (4) 1.62013-14 248.5 (5) 519.2 17,457.7 3.02014-15 (113.2) 406.0 18,161.6 2.22015-16 (170.4) (6) 235.6 17,864.0 1.3
Note:(1) Per PA 09-2 of the June Special Session, a deficit of $947.6 million was funded by
issuing Economic Recovery Notes.(2) Per Section 17 of PA 10-3 of the September Special Session, transfer $1,278.5 million
in FY 2010 and $103.2 million in FY 2011 to the resources of the General Fund.(3) Per section 28 of PA 12-104 and Comptroller reclassification, deposit of $236.9 million was
made, of which $143.6 million was withdrawn to mitigate the FY 2012 deficit.(4) Per PA 13-184, net fund Medicaid.(5) Includes $190.8 million of FY 2013 surplus.(6) Per State Comptroller's letter dated September 30, 2016.
C.G.S. 4-30a directs any unappropriated surplus to the Budget Reserve Fund (BRF).
Sections 164-169 of PA 15-244 amend C.G.S. 4-30a, effective July 1, 2019, to direct additionalrevenue to the BRF based on a formula, and increase the maximum cap on BRF deposits from 10%to 15%. Unappropriated surplus will still be directed to the BRF.
Disposition of Future Surpluses
11

BUDGET RESERVE FUND Reforms Enacted During the 2015 Legislative Session
Sections 164 to 169 of Public Act 15-244 included several reforms to the Budget Reserve Fund (BRF). The intent
of these changes is to mitigate the revenue volatility which has led to budget uncertainty in recent years.
Section 1. Effective Date The effective date of the legislation is July 1, 2019. However,
certain provisions will not take effect until FY 2021.
All
2. BRF Maximum Effective July 1, 2019, the cap on the Budget Reserve Fund is increased from 10% to 15% of the ensuing fiscal year General Fund appropriations.
164
3. Combined Revenue The bill requires that growth in “combined revenue” above a threshold be deposited to the Budget Reserve Fund beginning in FY 2021. This occurs when current year growth in combined revenue exceeds the ten year average growth in the ten year moving average of combined revenue.
164
Definition “Combined Revenue” means tax revenue from estimated and final payments of the personal income tax and the corporation business tax.
164
Threshold The threshold is a dollar amount that is derived by taking the ten year average of combined revenue and multiplying that average by the ten year average growth in the ten year moving average of combined revenue.
The Comptroller is responsible for determining the threshold for deposits to the BRF.
164, 166
4. Temporary Holding Account
Creates a Restricted Grants Fund as a temporary holding account of surplus funds in excess of the threshold within a fiscal year.
Amounts above threshold level deposited to Restricted Grants Fund on 1/31 and 5/15.
If forecasted combined revenue declines after 1/31, revenue within the restricted grants fund can be transferred back to the General Fund based upon a formula.
If the consensus revenue estimate of 1/15 or 4/30 projects a deficit no transfers will be made to the Restricted Grants Fund.
Amounts held in the Restricted Grants Fund are transferred to Budget Reserve Fund at close of fiscal year.
164
12

5. SERS Diversion The bill requires that a portion of deposits to the BRF be diverted to the State Employees Retirement Fund (SERF) beginning in FY 2021 according to the following schedule: o If the BRF is more than 10% but less than 15% funded, 15%
of the deposit shall be diverted to SERF. o If the BRF is more than 5% but less 10% funded, 10% of the
deposit shall be diverted to SERF. o If the BRF is less than 5% funded, 5% of the deposit shall be
diverted to SERF.
164
6. Amendments The bill requires that any bill which would reduce or eliminate a deposit to the BRF or Restricted Grants Fund be passed by a 3/5ths majority by the appropriations and finance committees.
164
7. Fiscal Notes The bill requires that, beginning in FY 2020, the fiscal note for any bill which has an impact on the personal income tax or the corporation tax shall identify any resulting impact on deposits to the BRF.
169
8. Tax Changes If tax changes are enacted that affect combined revenue by 1% or more OFA and OPM are responsible to determine the threshold. The growth should be adjusted for any policy changes. Adjustments shall be made for a period of ten fiscal years. If revisions in the January or April consensus estimate impact combined reporting in the current year, OFA and OPM may recalculate the threshold level and shall report such revisions along with consensus revenue.
168
9. Revenue Schedule Beginning in FY 2020, the revenue schedule in the state budget act shall separately itemize the two main components of the income tax: a) withholding; and, b) estimated and final payments.
167
10. Transfers Out Beginning in FY 2021, if April consensus projects a 2% decline in General Fund tax revenues from the current fiscal year to a subsequent fiscal year, the General Assembly may transfer funds from the BRF to the General Fund in each of the subsequent three fiscal years.
If there is a deficit greater than 1% in a fiscal year, the bill allows the Governor to direct any money in the Restricted Grants Fund for deficit mitigation.
164, 165
11. Reporting Not later than December 15, 2024, and every five years thereafter, the bill requires OPM, OFA, and OSC to submit a report to the Finance committee and the Governor on the formula’s impact on General Fund tax revenue volatility and recommend changes, as necessary, to the deposit formula or maximum cap balance.
164
13


SECTION 5
PROJECTED BOND AUTHORIZATIONS,
ALLOCATIONS AND ISSUANCES


FY 2017 FY 2018 FY 2019 FY 2020 FY 2021
Bond Authorizations
General Obligation Bonds 986,643,080$ 1,625,000,000$ 1,625,000,000$ 1,625,000,000$ 1,625,000,000$
Special Tax Obligation Bonds
Base Transportation Program 703,663,380 700,000,000 700,000,000 700,000,000 700,000,000
Let's Go ! CT Program 520,200,000 551,700,000 749,800,000 706,000,000 700,000,000
Clean Water Fund Revenue Bonds 180,000,000 200,000,000 200,000,000 200,000,000 200,000,000
Bioscience Collaboration Program 21,108,000 15,820,000 12,525,000 10,565,000 10,570,000
Bioscience Innovation Fund - 25,000,000 25,000,000 25,000,000 25,000,000
Connecticut Strategic Defense Investment Act 8,921,436 - - 9,096,428 9,446,428
UCONN 21st Century 240,400,000 295,500,000 251,000,000 269,000,000 191,500,000
CSUS 2020 40,000,000 150,000,000 95,000,000 - -
Total Bond Authorizations 2,700,935,896$ 3,563,020,000$ 3,658,325,000$ 3,544,661,428$ 3,461,516,428$
Bond Allocations
General Obligation Bonds
School Construction Program 700,000,000$ 650,000,000$ 650,000,000$ 650,000,000$ 650,000,000$
Urban Action Grants 80,000,000 75,000,000 75,000,000 75,000,000 75,000,000
Small Town Economic Assistance Program 20,000,000 20,000,000 20,000,000 20,000,000 20,000,000
Housing Trust Fund & Housing Programs 135,000,000 135,000,000 125,000,000 125,000,000 125,000,000
Clean Water Grants 100,000,000 125,000,000 150,000,000 150,000,000 150,000,000
Manufacturing Assistance Act 125,000,000 125,000,000 125,000,000 125,000,000 125,000,000
Small Business Express Program 40,000,000 37,800,000 25,000,000 25,000,000 -
Local Capital Improvement Program 30,000,000 30,000,000 30,000,000 30,000,000 30,000,000
Grants to Municipalities using TAR Purposes 60,000,000 60,000,000 60,000,000 60,000,000 60,000,000
Town Aid Road Grants 60,000,000 60,000,000 60,000,000 60,000,000 60,000,000
State Office Building Renovation 90,000,000 92,750,000 - - -
Board of Regents 100,000,000 50,000,000 85,000,000 135,000,000 100,000,000
Board of Regents - CSCU2020 Program 40,000,000 150,000,000 95,000,000 - -
Bioscience Collaboration Program 21,108,000 15,820,000 12,525,000 10,565,000 10,570,000
Bioscience Innovation Fund - 25,000,000 25,000,000 25,000,000 25,000,000
Connecticut Innovations Recapitalization 25,000,000 25,000,000 25,000,000 25,000,000 25,000,000
Connecticut Strategic Defense Investment Act 8,921,436 - - 9,096,428 9,446,428
All other GO projects/programs 500,000,000 500,000,000 500,000,000 500,000,000 500,000,000
UCONN Next Generation 240,400,000 295,500,000 251,000,000 269,000,000 191,500,000
Total General Obligation Bonds 2,375,429,436$ 2,471,870,000$ 2,313,525,000$ 2,293,661,428$ 2,156,516,428$
Special Tax Obligation Bonds 1,200,000,000 1,300,000,000 1,300,000,000 1,400,000,000 1,400,000,000
Clean Water Fund Revenue Bonds 200,000,000 125,000,000 200,000,000 150,000,000 250,000,000
Total Bond Allocations 3,775,429,436$ 3,896,870,000$ 3,813,525,000$ 3,843,661,428$ 3,806,516,428$
FY 2017 FY 2018 FY 2019 FY 2020 FY 2021
Bond Issuance
General Obligation Bonds 2,000,000,000$ 2,000,000,000$ 2,000,000,000$ 2,000,000,000$ 2,000,000,000$
Special Tax Obligation Bonds 800,000,000 900,000,000 900,000,000 900,000,000 900,000,000
Clean Water Revenue Bonds 250,000,000 - 250,000,000 200,000,000 -
UCONN Next Generation 300,000,000 300,000,000 300,000,000 300,000,000 300,000,000
Total Bond Issuance 3,350,000,000$ 3,200,000,000$ 3,450,000,000$ 3,400,000,000$ 3,200,000,000$
Debt Service
General Fund 2,075,088,166$ 2,320,448,812$ 2,254,643,602$ 2,410,352,395$ 2,632,158,567$
Transportation Fund 562,993,251 620,432,354 685,237,659 752,128,698 839,211,328
Total Debt Service 2,638,081,417$ 2,940,881,166$ 2,939,881,261$ 3,162,481,093$ 3,471,369,895$
Assumptions
Bond Authorizations
Projected General Obligation Bond authorizations assume that authorizations continue at historical average levels.
Clean Water Program Revenue Bond authorizations based on projected allocations.
UConn Next Generation authorizations in accordance with C.G.S. Section 10a-109g as amended.
CSCU 2020 authorizations in accordance with C.G.S. Section 10a-91e as amended.
Bioscience Collaboration Program authorizations in accordance with C.G.S. Section 32-41z.
Bioscience Innovation Fund authorizations in accordance with C.G.S. Section 32-41dd.
Connecticut Strategic Defense Investment Act in accordance with P.A. 16-1, September Special Session.
General Obligation figures do not reflect repeal of existing authorizations required to comply with the debt limitation.
Bond Allocations
The projected bond allocations shown above do not represent a commitment to fund any of these programs or projects.
FIVE YEAR BOND PROJECTIONS
14

STATUTORY GENERAL OBLIGATION BOND DEBT LIMIT
Section 3-21 of the General Statutes, as amended, provides that “No bonds, notes or other evidences of indebtedness for borrowed money payable from General Fund tax receipts of the State shall be authorized by the general assembly except such as shall not cause the aggregate amount of (1) the total amount of bonds, notes or other evidences of indebtedness payable from General Fund tax receipts authorized by the general assembly but which have not been issued and (2) the total amount of such indebtedness which has been issued and remains outstanding, to exceed one and six-tenths times the total general fund tax receipts of the State for the fiscal year in which any such authorization will become effective, as estimated for such fiscal year by the joint standing committee of the general assembly having cognizance of finance, revenue and bonding in accordance with section 2-35.” Tax Incremental Financings, Special Transportation, Bradley Airport, Clean Water Fund Revenue, Connecticut Unemployment Revenue Bonds, Economic Recovery Notes and Pension Obligation Bonds are excluded from the calculation. GAAP deficit bonds are included in the calculation. In accordance with the General Statutes, the Treasurer computes the aggregate amount of indebtedness as of January 1, and July 1 each year and certifies the results of such computation to the Governor and the General Assembly. If the aggregate amount of indebtedness reaches 90% of the statutory debt limit, the Governor is required to review each bond act for which no bonds, notes or other evidences of indebtedness have been issued, and recommend to the General Assembly priorities for repealing authorizations for remaining projects. The estimated debt-incurring margins as of July 1 of each fiscal year are as follows:
FY 2017 FY 2018 FY 2019 FY 2020
Revenues 11/10/2016 Consensus $15,519,900,000 $15,244,000,000 $15,673,300,000 $16,066,100,000
Multiplier 1.6 1.6 1.6 1.6
100% Limit 24,831,840,000 24,390,400,000 25,077,280,000 25,705,760,000
Bonds Subject to Limit $21,886,730,888 $21,659,930,900 $22,220,825,331 $22,709,270,288
Debt Incurring Margin $ 2,945,806,459 $ 2,122,969,100 $ 2,026,454,669 $ 2,038,989,712
Percentage of Limit 88.14% 91.30% 91.92% 92.07%
Margin to 90% Limit $462,622,459 $(316,070,900) $(481,273,331) $(531,586,288)
FY 2017 represents the actual debt incurring margin. The estimates for FY 2018 through FY 2020 assume that all existing bond authorizations continue and that $1.625 billion of new bond authorizations is enacted each year. As shown in the table above, the General Assembly will be required to repeal bond authorizations to comply with the debt limitation.
15

SECTION 6
REVENUE AND EXPENDITURE TRENDS,
MAJOR COST DRIVERS


EXPENDITURE CAP
Average personal income growth over a five year period serves as the cap’s proxy for the
economy’s ability to pay for government services.
The Great Recession resulted in the lowest allowable expenditure cap growth rates since its
inception.
Connecticut personal income is the limiting factor for FY 2015 – FY 2020.
The adopted FY 2017 revised budget is $635.3 million below the cap.
FY 2015 – FY 2020 growth rates are calculated on a calendar year basis.
For FY 2018, a growth rate of 2 percent would allow capped expenditures to grow by approximately
$300 million over FY 2017 levels.
PA 15-1 of the December Special Session, section 24, established a spending cap commission. The
commission is charged with proposing definitions of “increase in personal income,” “increase in
inflation,” and “general budget expenditures” for purposes of implementing the constitutional
expenditure cap. The commission must submit its recommendations to the General Assembly by
December 1, 2016. Adoption of the final recommendations of the commission may impact how the
cap is calculated.
1.9%
3.2% 3.3%
2.0%2.3%
3.4%
-2.0%
-1.0%
0.0%
1.0%
2.0%
3.0%
4.0%
2015 2016 2017 2018Proj.
2019Proj.
2020Proj.
Perc
enta
ge G
row
th
Fiscal Year
CT Spending Cap Growth Rate
16

SLOWER ECONOMIC RECOVERY Sub-Par State Revenue Growth
By setting peak years to an index value of 100 and removing the impact of tax changes, ready comparisons can be made about subsequent performance. For the two most recent recessions, revenue peaked in FY 2001 and FY 2008, respectively. Given revenues had fallen in FY 2009 due to the recession, ready comparisons cannot be made between the currently completed FY 2016 and FY 2009.
• Income tax revenues have exceeded their pre-recession peak for the last three fiscal years.
• Removing the impact of tax changes, revenue is 10.4% above pre-recession levels.
• If this recovery had been similar to the 2003 recovery, income tax revenue would have been $2.5 billion higher in FY 2015.
• In FY 2015, for the first time since the recovery began, Sales tax revenues exceeded their pre-recession peak.
• Had the sales tax recovered at the same pace as in 2003, revenues would have been $560 million higher in FY 2015.
17

EMPLOYMENT AND WAGES STRONG RECENT EMPLOYMENT RECOVERY BUT WEAK WAGE GROWTH
Connecticut’s average employment growth is approximately the same pre- and post-recession.
However, average annual wage growth has slowed dramatically post-recession from 16.9% to 6.6%.
In fiscal year 2016, employment grew 0.7% while the average annual wage grew 1.9%.
As of September 2016,
Connecticut has
recovered 76.2% of jobs
lost during the recession.
Employment growth since
the recession has been
skewed toward lower-
wage industries,
especially when
compared to the jobs lost
during the recession.
As of September 2016,
four labor market areas in
Connecticut have seen
full job recovery from the
recession: Hartford,
Bridgeport-Stamford-
Norwalk, New Haven, and
Danbury.
Source: IHS. Average Annual Wage is not adjusted for inflation.
Source: IHS, Bureau of Labor Statistics
18

GENERAL FUND ECONOMIC GROWTH RATES
The onset of the recession led to two years of decline in FY 2009 and FY 2010.
Federal stimulus, rebounding equity markets, and the expectation that the Bush-era tax cuts were going to expire at the end of 2010 led to a 10.3% jump in FY 2011 followed by a relatively low 0.9% increase in FY 2012.
Similar to the pattern exhibited in FY 2011 and FY 2012, the partial expiration of the Bush tax cuts at the end of 2012 led to a 6.6% increase in FY 2013 followed by 0.6% growth in FY 2014, and a 1.8% increase in FY 2015 followed by a 0.2% growth in FY 2016.
In the outyears, the latest consensus revenue forecast anticipates a weaker recovery than was exhibited after the 2002 recession.
19

REVENUE TRENDS AND PROJECTIONS ECONOMIC GROWTH RATES FOR PERSONAL INCOME TAX
20

REVENUE VOLATILITY ESTIMATES AND FINALS PERSONAL INCOME TAX COLLECTIONS
The volatile estimates and finals (E&F) component of the income tax typically represents one-third of total income tax collections.
In FY 2002, E&F fell by $424.1 million. In FY 2003, E&F fell by an additional $131.1 million for a total of $555.2 million, or 31% from the 2001 peak.
In FY 2009 alone, E&F fell by $904.4 million. Excluding the impact of the tax increase on millionaires, E&F fell an additional $475.4 million in FY 2010, for a total two-year decline of approximately $1.4 billion or 44.5% from the 2008 peak.
The increase in actual collections in FY 2010 was a result of increasing the top tax rate from 5% to 6.5%, the underlying economic growth rate was -21.3%. Similarly, almost all of the 13.3% growth in FY 2012 was due to the tax increase enacted during the 2011 legislative session.
The 14.9% growth in FY 2013 followed by a decline of 5.8% in FY 14 was due to tax planning strategies as federal income tax rates were increased on January 1, 2013.
Over 40% of E&F collections are received in April when final tax returns are filed, concentrating the volatility to the end of the fiscal year.
21

CAPITAL GAINS ARE A VOLATILE REVENUE SOURCE (In Millions)
Conn. S&P 500 Income Capital Percent Percent
Year Gains Change Change 1994 $2,547 -16% -2%
1995 $3,832 50% 34%
1996 $5,428 42% 20%
1997 $8,368 54% 31%
1998 $9,763 17% 27%
1999 $11,792 21% 20%
2000 $14,547 23% -10%
2001 $8,435 -42% -13%
2002 $5,130 -39% -23%
2003 $7,158 40% 26%
2004 $10,626 48% 9%
2005 $13,765 30% 3%
2006 $15,783 15% 12%
2007 $21,006 33% 4%
2008 $8,377 -60% -38%
2009 $5,172 -38% 23%
2010 $9,962 93% 13%
2011 $8,977 -10% 0%
2012 $13,142 46% 12%
2013* $11,977 -9% 30%
2014 $15,772 32% 11%
2015 Data not yet available -1%
2016 Data not yet available 4% YTD
Sources: Department of Revenue Services through 1995 and Internal Revenue Service 1996 and thereafter. YTD through 10/31/2016. *Decrease in capital gains of 9%, despite 30% increase in S&P 500 index, due to investor behavior arising from the expiration of federal tax cuts in 2012.
Capital gains income is strongly influenced by the performance of the stock market.
In high years capital gains can
represent almost 15% of total adjusted gross income.
In low years, capital gains can
represent just 4% of total adjusted gross income.
Unfortunately, a record high
year can be immediately followed by a record low year, creating extreme volatility in state finances.
In 2009, during the “Great
Recession,” capital gains revenues were less than 25% of the 2007 record high.
Changes in federal tax policy
have also created volatility.
22

COMPARISON OF TAXPAYER INCOME AND
TAXPAYER LIABILITY
Source: Department of Revenue Services – Resident Returns Only. Approximately 1.6 million returns.
Data for Income Year 2014.
Connecticut relies on the Personal Income Tax for 52% of net General Fund revenues. At
times, capital gains can represent more than 15% of personal income tax collections.
Connecticut has a progressive income tax rate structure.
Connecticut residents derive a large proportion of their income from the stock market in the
form of capital gains, dividends, and bonus income.
Fluctuations in the stock market are greater than typical fluctuations in wages and salaries
and therefore have a larger effect on personal income tax volatility.
0-50%
2.6%
50-75%
13.9%
75%-99%
47.6%
99-100%
35.9%
0%
10%
20%
30%
40%
50%
60%
70%
80%
90%
100%
% Filers % Liability
0-50% 50-75% 75%-99% 99-100%
$700,000
$46,000
$93,000
23

REVENUE TRENDS AND PROJECTIONS ECONOMIC GROWTH RATES FOR SALES AND USE TAX
The sales tax dropped in two consecutive years, FY 2009 and 2010, due to upheaval in the financial markets and the worst economic downturn since WWII.
Collections in late FY 2011 improved markedly as employment and personal income increased.
Weak economic growth and the expiration of the payroll tax cut, effective January 2013, led to a relatively low 1.3% growth rate in FY 2013.
Growth in the sales and use tax reached 3.9% in FY 2015, then fell slightly to 2.8% in FY 2016.
Sales tax is forecast to grow in the low 3% range over the next few fiscal years.
A 1.0% increase in the sales and use tax growth rate results in a revenue gain of more than $40 million.
24

MOTOR FUELS TAX TRENDS AND THE SPECIAL TRANSPORTATION FUND
ECONOMIC GROWTH RATES OF THE MOTOR FUELS TAX
By the summer of 2008, record high gasoline prices and the onset of a severe national recession forced consumers to significantly alter their driving habits and/or mode of transportation in an effort to reduce their gasoline bills in the short term.
Gasoline consumption rose in FY 2010 but the decline in FY 2011 consumption more than offset the one year of positive growth.
From FY 2006 through FY 2014, the cumulative decline in Motor Fuels tax revenue is 11.6%.
FY 2015 marked the first year in a reversal of a near decade-long reduction in the growth of motor fuels tax revenues. This change was fueled by sharp declines in the price of oil, which in turn led to increased consumption of motor fuels.
In FY 2016, Motor Fuels tax revenue equaled 38.3% of the total revenue of the Special Transportation Fund, down from 55.4% in FY 2003. Declining growth in motor fuels revenue over the last decade has led to an increasing reliance on other revenue sources to support the fund, including transfers from the General Fund.
The current positive growth trend is not indicative of a long term growth in motor fuels tax. Long term trends in motor fuels tax growth are still expected to be negative as more fuel efficient vehicles come onto the market to meet rising federal fuel economy standards and from consumer behavior changes as prices begin to normalize.
-3.7%-3.2%
0.9%
-1.1%
-1.9%
-1.2% -0.8%
1.8%
2.9%
2.0%
0.6% 0.2% 0.1%
-5.0%
-3.0%
-1.0%
1.0%
3.0%
5.0%
'08 '09 '10 '11 '12 '13 '14 '15 '16 '17Est.
'18Fcst.
'19Fcst.
'20Fcst.
Fiscal Year
25

LET’S GO CT! – TRANSPORTATION EXPANSION
Let’s Go CT! is a long-term plan to update and improve Connecticut’s transportation system by:
Creating a more comprehensive intermodal system;
Reducing congestion on roadways;
Enhancing quality of life with more livable, walkable, bikeable communities;
Partnering with communities to advance mixed use Transit-Oriented Development (TOD);
Fostering economic growth by enabling people and products to move more freely throughout the state.
Over 50% of the state’s transportation infrastructure was built before 1962. Significant improvements will need to be made in order to ensure Connecticut’s economic growth in the future. Let’s Go CT! targets investment to the highest priority transportation infrastructure projects throughout Connecticut. Some of the major projects include, but are not limited to:
I-84 Viaduct through Hartford;
I-95 Stamford to Bridgeport expansion;
I-84 “Mixmaster” through the City of Waterbury;
Completion of the New Haven/Hartford/Springfield rail line (includes new trains);
An expansion of bus service.
DEDICATING NEW REVENUE TO THE TRANSPORTATION FUND
The 2015 legislative session took the first major step to fund the overhaul of the state of
Connecticut’s transportation infrastructure by dedicating a portion of sales tax to the Special
Transportation Fund. A schedule of rates and the revenue impact can be seen in the table below.
Fiscal Year Ending June 30 Rate
Forecasted Sales Tax ($ In Millions)
2017 0.3% and 0.4% 197.7 2018 0.5% 341.3 2019 0.5% 352.2 2020 0.5% 363.6
Although significant steps have already been taken to address the state’s transportation needs,
much more needs to be done to ensure the long term viability of all the state’s transit systems.
TRANSPORTATION FINANCE PANEL RECOMMENDATIONS
In 2015, in conjunction with the announcement by Governor Malloy of the Let’s Go CT!
transportation initiative—a 30-year, $100 billion plan to modernize Connecticut’s transportation
infrastructure—the Governor established the Transportation Finance Panel, and appointed its
members consisting of experts in transportation, finance, and economic development. The
Transportation Finance Panel is charged with examining funding options and developing
recommendations for the implementation of the Let’s Go CT! transportation initiative.
The Transportation Finance Panel released its final report on January 15, 2016, recommending,
among other things, increases to existing pledged revenues and the implementation of new
revenue sources, including electronic tolling across all state and interstate highways.
26

FY 2006 FY 2011 FY 2012
FY 2017
Est.
All "Non-Fixed" Costs 7,508.9 8,695.4 8,809.3 9,126.0 3.0% 0.8%
Fixed Costs:
Debt Service 1,306.1 1,629.7 1,813.4 2,075.1 4.5% 4.1%
Teachers' Pensions 396.2 581.6 757.2 1,012.2 8.0% 9.7%
State Employees Retirement System 447.2 563.3 652.6 1,124.7 4.7% 12.2%
Other State Pensions 40.5 24.4 37.8 23.8 -9.6% -0.4%
State and Teacher OPEB 410.6 490.9 584.3 751.0 3.6% 7.3%
Medicaid * 1,570.3 2,232.9 2,357.2 2,447.2 7.3% 1.5%
Other Entitlement Accounts 1,249.4 1,393.9 1,412.6 1,348.5 2.2% -0.6%
Total "Fixed" Costs 5,420.3 6,916.7 7,615.2 8,782.5 5.0% 4.1%
General Fund Total 12,929.3 15,612.2 16,424.5 17,908.5 3.8% 2.3%
* Medicaid estimate based on 50% of gross General Fund expenditures for FY 2013 and earlier.
GROWTH IN FIXED AND NON-FIXED COSTS(in $millions)
Prior Administrations Current Administration FY06 - 11
Annual
Growth
Rate
FY11 - 17
Annual
Growth
Rate
Non-Fixed Costs
Fixed Costs
FY 2017
Non-Fixed Costs
Fixed Costs
FY 2006
27
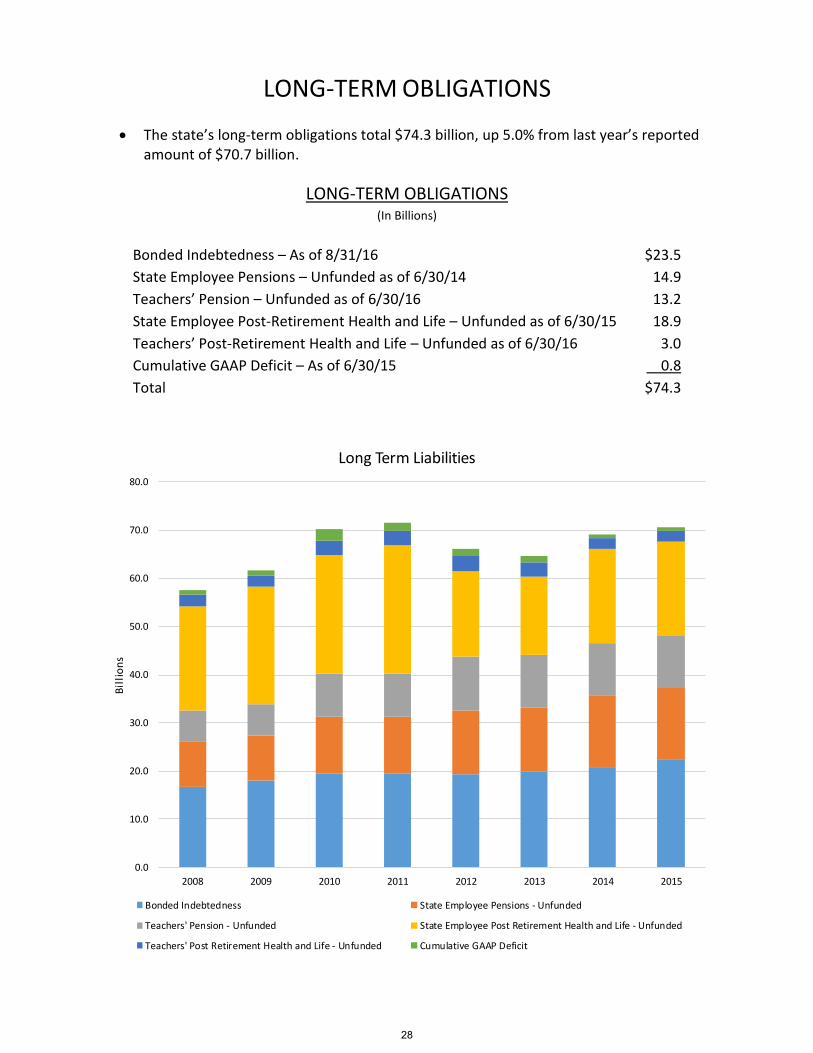
LONG-TERM OBLIGATIONS
The state’s long-term obligations total $74.3 billion, up 5.0% from last year’s reported amount of $70.7 billion.
LONG-TERM OBLIGATIONS
(In Billions)
Bonded Indebtedness – As of 8/31/16 $23.5
State Employee Pensions – Unfunded as of 6/30/14 14.9
Teachers’ Pension – Unfunded as of 6/30/16 13.2
State Employee Post-Retirement Health and Life – Unfunded as of 6/30/15 18.9
Teachers’ Post-Retirement Health and Life – Unfunded as of 6/30/16 3.0
Cumulative GAAP Deficit – As of 6/30/15 0.8
Total $74.3
0.0
10.0
20.0
30.0
40.0
50.0
60.0
70.0
80.0
2008 2009 2010 2011 2012 2013 2014 2015
Bil
lio
ns
Long Term Liabilities
Bonded Indebtedness State Employee Pensions - Unfunded
Teachers' Pension - Unfunded State Employee Post Retirement Health and Life - Unfunded
Teachers' Post Retirement Health and Life - Unfunded Cumulative GAAP Deficit
28

PENSION OBLIGATIONS - SERS STATE EMPLOYEES RETIREMENT SYSTEM AS OF 6/30
Unfunded pension liabilities for the State Employees’ pension system have grown since the 6/30/11 valuation due to changes in the economic and demographic assumptions.
The state’s
obligations at the end of FY 2014 total $14.9 billion.
State Employee Retirement
State Employee Retirement
System Pension Contributions
Fund Rate of Return = 8%
Fiscal Year Actuarially Determined Employer Contribution
State Contribution Percent
Fiscal Year Rate of Return
Market Value Basis 2001-02 $415 $415 100%
2001-02 -6.6%
2002-03 $426 $421 99%
2002-03 1.9%
2003-04 $474 $470 99%
2003-04 15.2%
2004-05 $516 $516 100%
2004-05 10.5%
2005-06 $623 $623 100%
2005-06 11.0%
2006-07 $664 $664 100%
2006-07 17.1%
2007-08 $717 $712 99%
2007-08 -4.8%
2008-09 $754 $700 93%
2008-09 -18.3%
2009-10 $897 $721 80%
2009-10 12.9%
2010-11 $944 $826 88%
2010-11 21.2%
2011-12 $926 $926 100%
2011-12 -0.9%
2012-13 $1,060 $1,058 100%
2012-13 11.9%
2013-14 $1,269 $1,269 100% 2013-14 15.6%
2014-15 $1,379 $1,372 99% 2014-15 2.8%
2015-16 $1,514 $1,502 99% 2015-16 0.3%
2016-17 est. $1,569 $1,569 100%
SERS utilizes 5 year smoothing. 2017-18 est. $1,652 $1,652 100% 2018-19 est. $1,713 $1,713 100% 2019-20 est. $1,776 $1,776 100%
* In Millions
SERS contributions were deferred by $50 million in FY 2009, $164.5 million in FY 2010 and $100 million in FY 2011.
Starting in FY 2013, the SEBAC IV & V adjustments were eliminated.
Through FY 2008, the assumed rate of return was 8.5%. In FY 2009 it was lowered from 8.5% to 8.25%, and in FY 2014, it was lowered again from 8.25% to 8%.
* The certified actuarial valuation as of 6/30/2016 has not been issued.
$3.2 $3.4 $3.5$3.9
$4.3 $4.5$4.9
$6.2$6.9
$7.9
$9.3
$11.7$11.0
$13.3
$14.9
51%
54%
57%
59%
63% 63%62%
57%
54%53%
52%
44%
48%
42% 42%
$2.0
$4.0
$6.0
$8.0
$10.0
$12.0
$14.0
$16.0
40%
45%
50%
55%
60%
65%
1992 1994 1996 1998 2000 2001 2002 2003 2004 2006 2008 2010 2011 2012 2014
Billio
ns
Fun
ded
Rat
io
Unfunded Actuarial Accrued Liabilities
Unfunded Pension
Funded Ratio
29

SERS – COMPONENTS OF PENSION LIABILITY
Based on 6/30/14 Valuation ($ in Thousands)
Retired/Deferred Liability $18,129,796 71.1%
Active – Tier I Hazardous 49,210 0.2%
Active – Tier IB 1,173,883 4.6%
Active – Tier IC 37,752 0.1%
Active – Tier II Hazardous 1,188,011 4.7%
Active – Tier II Others 2,715,216 10.6%
Active – Tier IIA Hazardous 912,872 3.6%
Active – Tier IIA Others 1,057,034 4.1%
Active - Tier III Hazardous 9,672 0.0%
Active - Tier III Hybrid 204,950 0.8%
Active - Tier III Others 27,213 0.1%
Total Accrued Liability $25,505,609
Actuarial Value of Assets 10,584,795
Unfunded Accrued Liability $14,920,814
Normal cost $288,492
Amortization of UAL $1,363,814
FY 2018 Estimated Actuarially
Determined Employer Contribution
(ADEC)
$1,652,306
* The certified actuarial valuation as of 6/30/2016 has not been issued.
Retired/ Deferred Liability, 71.1%
Active –Tier I , 4.9%
Active – Tier II, 15.3%
Active – Tier IIA, 7.7%
Active - Tier III, 0.9%
Tier I
Tier II
Tier IIA
Tier III
0 5,000 10,000 15,000 20,000 25,000 30,000
Retired and Inactive Members by Tier
$25.5 billion total liability.
$14.9 billion unfunded liability.
Most of the liability is related to already-retired employees.
Over 62% of current retirees are part of Tier I.
82.5% of the FY 2018 estimated actuarially determined employer contribution is for the unfunded actuarial accrued liability.
30

STATE EMPLOYEES RETIREMENT SYSTEM STEPS TOWARD ADDRESSING LIABILITY
The state is committed to a sustainable and affordable State Employees Retirement System (SERS). Progress has been made towards this goal with the following recent steps:
1) The 2011 SEBAC agreement made the following changes: a) The maximum salary that can be considered part of an employee’s pension benefit is now
consistent with the maximum amount outlined in the Internal Revenue Code. b) The minimum cost of living adjustment (COLA) was reduced to 2% for employees retiring
on or after October 2, 2011. c) The early retirement reduction factor was doubled to 6% for employees retiring on or
after October 2, 2011. d) The age for normal retirement eligibility was increased by three years for all non-hazard
duty employees who retire after July 1, 2022. If employees wanted to be “grandfathered” and maintain the existing normal retirement age, they had to pay the actuarial pension cost of maintaining that normal retirement age.
e) A new Tier III was created for all employees hired on or after July 1, 2011. The ages for normal and early retirement are at the increased level. In addition, hazard duty eligibility was increased from 20 years of service regardless of age to age 50 and 20 years of service or 25 years of service regardless of age. The benefit calculation for this tier uses the average of the five highest paid years of services versus the three highest.
2) In 2012, more conservative actuarial assumptions were adopted which included lowering the assumed rate of investment return from 8.25% to 8%.
3) The state increased its required contributions to the pension system by eliminating the SEBAC IV and V adjustments that significantly lowered the state’s payment causing the unfunded liability to increase each year.
4) In 2015, the Office of Policy and Management engaged the Center for Retirement Research (CRR) at Boston College to assess both SERS and the Teachers’ Retirement system (TRS).
The CRR report, released In November 2015, sought to identify the factors that contributed to today’s underfunded pension liabilities and explored the impact that future market performance would have on funding ratios and required contributions. The report clearly identified the possibility that market volatility near the end of the current fixed amortization period, coupled with the current level percent of payroll amortization method, could lead to unaffordable multi‐billion dollar swings in required employer contributions. The report also identified inadequate contributions, low investment returns and poor actuarial experience as major causes driving the growth in unfunded actuarial accrued liabilities (UAAL) for SERS, not exorbitant benefits.
Of the three factors, investment returns are the most difficult to control. While actuarial experience is generally difficult to control, one aspect is very much within policymakers’ control: ad-hoc early retirement incentive plans (ERIPs). Retirement incentive programs directly impact retirement patterns and can cause dramatic deviations from existing actuarial assumptions. While ERIPs may save money in the short term, the graph below illustrates the long term costs to the pension system. The third factor, making the full pension contributions, is controllable. As mentioned previously, the state eliminated the SEBAC IV and V adjustments which resulted in the state contributing less than the actual amount required.
31

The main driver of contributions to SERS is the unfunded liability. The CRR report compared the breakdown of the SERS normal cost and amortization payments of the accrued liability to the national average for similar plans.
Actuarial Costs as a Percent-of-Payroll
The report identified that maintaining the current pension methods may be too costly for the state, especially if the state continues to fall short of the 8% assumed investment rate as it has the past 15 years. If the actual investment earnings continue at the 5.5% level experienced since the turn of the century, the actuarially determined employer contribution could exceed $6 billion at the end of the amortization period.
1.3
-0.5 -0.5
1.1
4.1
0.1
1.4
12.5
-$4
$0
$4
$8
$12
$16
Bill
ion
s
Sources of Change to UAAL, 1985 - 2014
Contributions < ARC, 3.2
ARC < UAAL growth, 2.3
2.2%6.6%
8.0%7.0%
35.4%
9.0%
0%
10%
20%
30%
40%
50%
Connecticut SERS National average
Employer UAAL payment
Employer normal cost
Employee contribution
Value of Benefits
Source: Final Report on Connecticut's State Employees Retirement System and Teachers' Retirement System, by CRR
Source: Final Report on Connecticut's State Employees Retirement System and Teachers' Retirement System, by CRR
32

Following the Boston College report, in early 2016 the Governor directed that a workgroup be convened to explore the best approach to improving the funding ratio of its retirement plans while also reducing budget uncertainty. The workgroup included representatives from OPM, Office of the State Comptroller, Office of the State Treasurer, and organized labor. Following the conclusion of this group’s efforts, OPM’s Office of Labor Relations has engaged in active discussions with the State Employees Bargaining Agent Coalition regarding the following potential strategies for SERS:
Continuing to pre‐fund all liabilities on an actuarial basis.
Reducing the assumed rate of return.
Transitioning from level percent of payroll to a level dollar amortization for unfunded liabilities.
Transitioning the actuarial cost method from Projected Unit Credit to Entry Age Normal.
Maintaining the original 40 year amortization schedule for the current unfunded liability attributable to Tier I employees and amortizing the remaining unfunded liability over a new period.
Transitioning to a layered amortization of future gains and losses consistent with the model funding approach developed by the Conference of Consulting Actuaries.
$0
$1,000
$2,000
$3,000
$4,000
$5,000
$6,000
$7,000
20
14
20
15
20
16
20
17
20
18
20
19
20
20
20
21
20
22
20
23
20
24
20
25
20
26
20
27
20
28
20
29
20
30
20
31
20
32
20
33
20
34
20
35
20
36
20
37
20
38
20
39
20
40
20
41
20
42
20
43
20
44
20
45
8% Annual Return
5.5% Annual Return
From 2014 to 2032, the accumulated difference between a 5.5% annual return and 8% is nearly $11 billion.
At 5.5% annual return, state payments to SERS
.
Source: Final Report on Connecticut's State Employees Retirement System and Teachers' Retirement System, by CRR
Projected Annual Payments for State Employees Retirement System May Top $6.6 Billion by 2032 (In Millions)
33

PENSION OBLIGATIONS - TRS
CONNECTICUT TEACHERS’ RETIREMENT SYSTEM AS OF 6/30
TEACHERS’ RETIREMENT SYSTEM CONTRIBUTIONS
$2.4 $2.6$3.0 $3.2
$2.2
$3.3
$5.2
$6.9$6.5
$9.1
$11.1$10.8
$13.1
67%68%
69%70%
81%
76%
65%
60%
70%
61%
55%
59%
56%
$1.5
$3.5
$5.5
$7.5
$9.5
$11.5
$13.5
50%
55%
60%
65%
70%
75%
80%
85%
1992 1994 1996 1998 2000 2002 2004 2006 2008 2010 2012 2014 2016
Billio
ns
Funded R
atio
Unfunded Actuarial Accrued Liabilities
Unfunded Pensions
Funded Ratio
$559 $582
$757 $788
$949 $984 $976 $1,012
$1,290 $1,332 $1,375
$170 $176
$90 $210
$59 $65
$81$121
$145 $134 $133 $120
$140 $118$118
$185 $185
$396 $412
$519 $539 $618 $647
$838 $909
$1,094 $1,118 $1,108 $1,132
$1,431 $1,451 $1,493
$20
$120
$220
$320
$420
$520
$620
$720
$820
$920
$1,020
$1,120
$1,220
$1,320
$1,420
$1,520
$1,620
'04 '05 '06 '07 '08 '09 '10 '11 '12 '13 '14 '15 '16 '17
Fcst.
'18
Fcst.
'19
Fcst.
'20
Fcst.
Millions
Fiscal Year
Debt Service
Surplus Funds
The state’s obligations at the end of FY 2016 total $13.1 billion.
The 2016 decrease in the funded ratio is attributable to the $2.4 billion increase in the unfunded liability.
Approximately $2.2 billion of the increase is due to changes in assumptions adopted by the board as a result of the experience study for the 5 year period ending 6/30/2015.
The most significant change was lowering the assumed rate of return from 8.5% to 8%.
FYs 2006 through 2009 contributions were supplemented by the use of surplus funds.
FY 2010 and beyond include debt service on the $2.3 billion pension obligation bonds issued on April 30, 2008 on behalf of the Teachers’ Retirement System.
FY 2018 and beyond reflect the impact of lowering the assumed rate of investment return to 8% from 8.5%.
34

OTHER POST-EMPLOYMENT BENEFITS (OPEB)
The most recent OPEB valuation (as of June 30, 2015) shows a reduction in the unfunded actuarial
accrued liability (UAAL) from the previous valuation to $18.9 billion. The reduction is due primarily
to lower per capita health costs and updating the future trend related to such costs.
Under the 2009 SEBAC agreement, all new health care-eligible employees hired after July 1, 2009, and those with fewer than five years of service as of July 1, 2010, began contributing three percent of their salary toward retiree health for the first ten years of employment. The 2011 SEBAC agreement extended the employee cost-sharing requirement to all employees, not just new hires. The agreement also imposed premium sharing for individuals who elect early retirement, ranging from two percent to forty percent, based on the number of years of service and the number of years retiring early. Finally, the 2011 agreement required the state to begin matching employee contributions to the OPEB/Retiree Health Care Trust Fund beginning July 1, 2017.
As a result of state and employee contributions to the fund mandated by the 2009 and 2011 SEBAC
agreements, the OPEB trust fund contained $434.4 million in net assets as of September 30, 2016.
Other Post-Employment Benefits Summary of Contributions
Fiscal Year
Employee Contributions
State Contributions
Total Contributions
2008 - $10.0 $10.0
2009 - - $0.0
2010 $1.4 - $1.4
2011 $21.6 $14.5 $36.1
2012 $25.0 - $25.0
2013 $27.5 - $27.5
2014 $45.5 - $45.5
2015 $93.3 - $93.3
2016 $125.2 - $125.2
2017 est. $119.7 - $119.7
2018 est. $120.0 $120.0 $240.0
2019 est. $120.0 $120.0 $240.0
Total $699.2 $264.5 $963.7
Excludes investment earnings
* In Millions
$21.7
$26.6
$31.2
$17.9 $16.2
$19.5 $18.9
$0.0
$5.0
$10.0
$15.0
$20.0
$25.0
$30.0
$35.0
2006 Valuation 2008 Valuation 2011 Valuationwithout the
reforms
2011 Valuationwith reforms
2012 Update 2013 Valuation 2015 Valuation
Bill
ion
s
OPEB Unfunded Actuarial Accrued Liability
35

STATE EMPLOYEES PENSION & HEALTH
ALL FUNDS – As of 6/30 (In Millions)
Pension contributions during the current biennium (FYs 2018 and 2019) are expected to be 9% higher than the prior biennium (FYs 2016 and 2017). The rate of increase continues to slow dramatically from the 16.8% increase experienced in the prior biennium (FYs 2016 -2017 over FYs 2014 - 2015).
Health insurance costs for active employees during the current biennium (FYs 2018 and 2018) are expected to be 11.5% higher than the prior biennium (FYs 2016 and 2017). This increase is mainly driven by the increase in pharmacy trends.
Health insurance costs for retirees during the current biennium (FYs 2018 and 2019) are estimated to be 21.5% higher than the prior biennium. The increase is mainly due to the increase in pharmacy trends and the expected increase in the number of retirees.
$470 $519$623 $664 $712 $700 $721
$826 $926$1,058
$1,269$1,372
$1,514 $1,569 $1,652 $1,713 $1,776
$430$486
$527$572
$619 $652 $636$647
$687
$738
$798$839
$867$893
$948$1,015
$1,076
$318$374
$390$415
$450 $435 $528$491
$549
$587
$549
$599
$646$726
$797
$870
$922
$1,218
$1,379
$1,540$1,651
$1,781 $1,787$1,885
$1,964
$2,162
$2,383
$2,616
$2,809
$3,027
$3,188
$3,397
$3,598
$3,774
$0
$500
$1,000
$1,500
$2,000
$2,500
$3,000
$3,500
$4,000
FY 04 FY 05 FY 06 FY 07 FY 08 FY 09 FY 10 FY 11 FY 12 FY 13 FY 14 FY 15 FY 16 FY 17Fcst.
FY 18Fcst.
FY 19Fcst.
FY 20Fcst.
SERS Active Health Retiree Health
Note: Retiree Health includes offsets for the Medicare Part D Employer Subsidy in FYs 2007 through 2012. SERS includes payment deferrals in FYs 2009 through 2011.
36

CONNECTICUT’S BOND RATING CURRENT GENERAL OBLIGATION BOND RATING
Moody's S&P Fitch Kroll
Rating Aa3 AA- AA- AA-
Outlook Negative Stable Stable Stable
• Prior to 1975, Connecticut’s General Obligation (GO) bonds had the highest rating possible: Aaa by Moody’s and AAA by Standard & Poor’s (S&P).
• The most recent revision in Connecticut’s bond rating was a change from AA to AA- stable by S&P, Fitch and Kroll in May and July of 2016.
NUMBER OF STATES RATED
Rating Moody's S&P Fitch Kroll
Better than CT 32 31 30 2
Equal to CT 3 4 3 1
Lower than CT 2 2 2 1
Total* 37 37 35 4 * 38 states issue GO bonds. All 38 states are rated by Standard and Poor’s and Moody’s. Fitch has no ratings for Arkansas and New Mexico, and Kroll’s only state-level ratings are for Connecticut, New Jersey, New York, Texas and Wisconsin.
NEIGHBORING STATES’ RATINGS
State Moody's S&P Fitch Kroll
Vermont Aaa AA+ AAA
Massachusetts Aa1 AA+ AA+
New York Aa1 AA+ AA+ AA+
New Hampshire Aa1 AA AA+
Maine Aa2 AA AA
Rhode Island Aa2 AA AA
Connecticut Aa3 AA- AA- AA-
New Jersey A2 A A A
IMPORTANCE OF BOND RATINGS
The rating process informs investors about risk
The rating process shows how we compare relative to other investments
Connecticut relies on capital markets to finance capital improvements
Low ratings will result in higher borrowing costs
37

CONNECTICUT’S CREDIT RATING
State Credit Strengths
Historical application of operating surpluses to the Budget Reserve Fund
Strong governance with the ability to make mid-year adjustments
Wealthiest state in the nation with per capita income well above national levels State Credit Challenges
Vulnerability to financial market fluctuations due to effect on capital gains for high wealth residents and employment in the financial services sector
Modest rainy day fund balance due to the state’s slow recovery from the recession
Debt ratios are among the highest in the nation
Pension systems have low funding ratios What could make the state rating improve
Achievement and maintenance of high GAAP-basis combined available reserve levels
Established trend of structural budget balance
Evidence of a stronger economic performance
Reduced debt ratios
Significantly improving the funding of pension and post-retirement liabilities What could make the state rating deteriorate
Lack of improvement in available reserve levels
Failure to improve the state pension funded ratios and lower its overall fixed costs
Reversion to significant one-time budget solutions including the use of deficit financings to resolve budget gaps
Reduction in cash flow-reduced liquidity
Substantial revenue weakness driven by delayed economic recovery
Source: Various Credit Rating Reports
38

REDUCING THE SIZE OF STATE GOVERNMENT
Since FY 2011, the number of budgeted state agencies has been reduced by 28%, from 81 to
58, through consolidations and mergers.
The state workforce has undergone substantial attrition without resorting to any costly
retirement incentive plans. Based on payroll data, full-time Executive Branch employment
(not including the constituent units of higher education) has fallen since December 2010 from
approximately 29,600 employees to approximately 26,800 – a reduction of about 9.5%.
Excluding higher education, the Executive Branch now employs more than 5,000 fewer
employees than during calendar year 2008 and is at its lowest level since the early 1980s.
Relative to state population, non-higher education Executive Branch staffing is likely at its
lowest point in more than six decades.
26,500
27,500
28,500
29,500
30,500
31,500
32,500
Jun
-08
No
v-0
8
Ap
r-0
9
Sep
-09
Feb
-10
Jul-
10
Dec
-10
May
-11
Oct
-11
Mar
-12
Au
g-1
2
Jan
-13
Jun
-13
No
v-1
3
Ap
r-1
4
Sep
-14
Feb
-15
Jul-
15
Dec
-15
May
-16
Oct
-16
Employees on Full-time PayrollExecutive Branch (excluding Higher Ed. Units)
Appropriated Funds
39

6.0
6.5
7.0
7.5
8.0
8.5
9.0
9.5
10.0
10.5
19,000
21,000
23,000
25,000
27,000
29,000
31,000
33,000
35,000
Jun-1960 Jul-1974 Aug-1988 Sep-2002 Oct-2016
Emp
loyees p
er 1,0
00
Resid
ents
Emp
loye
esExecutive Branch Employees
(excluding Higher Education)
Employees
Employees per 1,000 Residents
40

Full Time Full Time Payroll Expiration
Bargaining Unit Employees (All Funds) Date(1)
State Police (NP-1) 1,044 84,115,416 6/30/2018
Service/Maintenance (NP-2) 3,704 192,147,425 6/30/2016
Administrative Clerical (NP-3) 3,199 178,238,723 6/30/2016
Correctional Officers (NP-4) 4,413 246,519,653 6/30/2016
Protective Services (NP-5) 812 52,729,576 6/30/2016
Health NonProfessional (NP-6) 2,775 160,710,777 6/30/2016
Health Professional (P-1) 2,923 250,273,822 6/30/2016
Social and Human Services(P-2) 3,815 281,418,577 6/30/2016
Education A (P-3A) 230 24,583,747 6/30/2016
Education B (P-3B) 537 42,171,570 6/30/2016
Engineer, Scien, Tech (P-4) 2,463 220,154,693 6/30/2016
Admin and Residual (P-5) 2,816 239,605,965 6/30/2016
St Vocation Federation Teacher 1,125 91,305,248 6/30/2016
Amercan Fed of School Admin 55 7,192,045 6/30/2016
Comm College Faculty - AFT 168 12,986,291 6/30/2016
State University Faculty 1,428 127,729,069 6/30/2016
State University Non-Fac Prof 792 66,370,354 6/30/2016
Comm College Faculty CCCC 641 50,574,928 6/30/2016
UConn - Faculty 1,807 155,224,603 6/30/2016
UConn - Non-Faculty 1,707 102,624,841 6/30/2016
UCHC - Faculty 320 55,675,932 6/30/2016
UConn - Law School Faculty 40 5,597,394 6/30/2016
Judicial - Judges 191 31,998,673 6/30/2016
Judicial - Professional 1,195 109,527,191 6/30/2016
Judicial - Non-Professional 1,220 76,138,622 6/30/2016
Judicial - Law Clerks 60 3,469,333 6/30/2016
UCHC Univ Hlth Professionals 1,654 93,592,410 6/30/2016
Comm College Admin - CCCC 705 52,602,327 6/30/2016
Conn Assoc Prosecutors 240 28,304,919 6/30/2016
Comm College Admin - AFSCME 86 6,691,649 6/30/2016
Criminal Justice Residual 121 6,989,050 6/30/2016
Higher Ed - Professional Emp 23 1,787,241 6/30/2016
Bd State Acad Awards Prof 66 4,843,509 6/30/2016
Judicial - Judicial Marshals 564 29,302,506 6/30/2016
Correctional Supervisor (NP-8) 454 36,365,173 6/30/2016
StatePoliceLts&Captains (NP-9) 41 5,187,408 6/30/2016
DPDS Public Defenders 190 21,539,054 6/30/2016
DPDS Chief Public Defenders 22 3,453,911 6/30/2016
Criminal Justice Inspectors 72 6,532,998 6/30/2016
Comm College AFT Couns/Lib 14 1,269,342 6/30/2016
Judicial - Supvr Jud Marshals 62 4,554,587 6/30/2016
Total Covered by Collective Bargaining 43,794 3,172,100,549$
Not Covered by Collective Bargaining
Auditors of Public Accounts 107 9,972,290
Other Employees 5,138 499,836,729
Total Not Covered by Collective Bargaining 5,245 509,809,019$
(1) Many contracts with a 6/30/2016 expiration date have been extended with respect to wages until such time as a new agreement is reached and
approved in accordance with Sec. 5-278, CGS.
FULL TIME WORKFORCEAs of September 2016
Note: As of 9/21/2016. Payroll amounts include regluar wages for full-time employees excluding overtime, shift differentials, premiums, etc. Those not
covered by collective bargaining include employees of the Legislative Branch, elected and appointed officials and managerial and confidential
employees.
41

$4,084
$4,594 $4,842
$5,048
$2,532 $2,347 $2,391 $2,447 $2,694 $2,827 $2,975
$2,993 $3,483 $3,604 $3,517
$3,763 $3,949
$4,087
0
100,000
200,000
300,000
400,000
500,000
600,000
700,000
800,000
900,000
1,000,000
$0
$500
$1,000
$1,500
$2,000
$2,500
$3,000
$3,500
$4,000
$4,500
$5,000
$5,500
$6,000
$6,500
$7,000
$7,500
'10 '11 '12 '13 '14 '15 '16 '17Est.
'18Fcst.
'19Fcst.
'20Fcst.
Cas
elo
ad
Exp
end
itu
res
(in
mill
ion
s)
Fiscal Year
General Fund Federal Share under Net Budgeting Caseload
$5,525$5,831
$5,995
$6,776$7,062
$5,964
$6,457
MEDICAID EXPENDITURE TRENDS
Note: Medicaid expenditures have been adjusted to include expenditures under the former State Administered
General Assistance (SAGA) medical assistance program, as well as behavioral health services under the General
Assistance Managed Care account in DMHAS which now qualify for Medicaid reimbursement.
Beginning with the budget adopted in 2013, the Medicaid account in the Department of Social Services
was “net appropriated.” A total of $2,768.7 million was removed from both budgeted revenues and
appropriations to accomplish this transition in FY 2014.
Medicaid growth has been affected by caseload growth, increases in utilization and limited rate
increases.
The Medicaid expansion for low-income adults, which was approved by the federal government in June
2010, has resulted in significant increases in caseload and program costs. Expenditures for this program,
now known as HUSKY D, increased from $228.7 million in FY 2010 to $769.0 million in FY 2013. The state
further expanded Medicaid coverage for low-income adults by increasing income eligibility to 138% of
the federal poverty level beginning January 1, 2014, resulting in significant additional growth. As a result
of this expansion, the HUSKY D caseload has grown from 46,156 in June 2010 to 99,103 in December
2013 to 206,664 in October 2016. Over the last three fiscal years, HUSKY D expenditures have increased
from $916.6 million in FY 2014 to $1,364.5 million in FY 2016. Under the Affordable Care Act, these costs
are 100% reimbursed by the federal government beginning January 1, 2014 through 2016, after which
the federal reimbursement will be phased down to 90% in 2020:
Calendar Year 2014 – 2016 2017 2018 2019 2020+
Federal Reimbursement 100% 95% 94% 93% 90%
Additional state costs as a result of the reduction in federal reimbursement are estimated at $32.7
million in FY 2017, $76.8 million in FY 2018, $97.4 million and $133.5 million in FY 2020.
42

Future growth will also be impacted by increased alternatives to nursing home care under the Money Follows the Person demonstration as the state invests in the rebalancing of long-term services and supports.
The Department of Social Services is employing
diverse strategies to achieve improved health
outcomes and cost efficiencies in the Medicaid
program. Strategies include:
o use of an administrative services organization (ASO) platform to promote efficient, cost-effective and consumer/provider responsive Medicaid medical, behavioral health, dental and non-emergency medical transportation services;
o use of data analytics to improve care;
o activities in support of improving access to preventative primary care;
o efforts to support integration of medical, behavioral health, and long-term services and supports;
o initiatives designed to “re-balance” spending on long-term services and supports; and
o efforts to promote the use of health information technology.
In contrast to almost all other Medicaid programs across the nation, Connecticut Medicaid uses a managed, fee-for-service program rather than a managed care arrangement. It is one of the very few Medicaid programs with relatively steady expenditures on a per member, per month (PMPM) basis.
* Expenditures are net of drug rebates and include DMHAS' behavioral health costs claimable under Medicaid.
5.8%4.3%
5.1%
-0.7%
9.5% 9.4%
7.5%
1.8%
13.6%
5.7%
12.4%
-5.9%
6.9%
2.9%
-0.3%
3.2%
U.S. Medicaid Spending DSS Expenditures (Gross) *
Medicaid Growth Trends
FY 12 to FY 13 Change FY 13 to FY 14 Change FY 14 to FY 15 Change FY 15 to FY 16 Change
DSS Enrollment (Average)
DSS PMPM (Average)
* Expenditures are net of drug rebates and include DMHAS' behavioral health costs claimable under Medicaid.
43

FEDERAL BUDGET AND POLICY ISSUES
A number of significant federal budget and policy issues must be dealt with over the next year,
creating uncertainty for state policymakers as well as for the budgeting process.
A federal budget has not yet been adopted for federal fiscal year 2017, which began October 1, 2016, leaving government operations funded via a continuing resolution through December 9, 2016.
In the absence of a longer term budget agreement, a government shutdown in December is a possibility. Extensive work must be completed to keep the government open past December 9; appropriators have only a few weeks to negotiate detailed spending and policy bills before the current continuing resolution expires. If a budget agreement is not reached before December 9, another continuing resolution must be adopted to prevent program and funding interruptions.
The transition of administrations creates uncertainty as to longer-term policy and budgetary priorities, and could impact the timing and content of required appropriations measures.
EFFORTS TO PRESERVE OR MAXIMIZE FEDERAL REVENUE
The administration continues to make federal revenue maximization efforts a priority. Numerous Medicaid state plan amendments and waivers have been submitted or are in the process of being submitted to the federal government, and initiatives not requiring federal approval are being operationalized by impacted state agencies. In the current fiscal year and through the biennium, significant new federal revenue could be realized from these initiatives beyond normal increases in federal Medicaid reimbursement associated with growth in caseload and utilization. An interagency workgroup meets monthly to discuss revenue opportunities and implementation issues.
Some of the major revenue maximization initiatives being explored or under development include:
Continued efforts to implement May 2016 guidance from the federal Centers for Medicare and Medicaid Services (CMS) concerning justice-involved individuals;
Redesign of Birth to Three rates in order to comply with federal directives, given the ever-increasing Medicaid population (currently 66%) in the program;
Exploring the possibility to bill for certain services at Connecticut Valley Hospital previously subject to the federal Institution for Mental Disease (IMD) exclusion;
Exploring potential federal reimbursement for services currently being provided and funded by the Court Support Services Division (CSSD) of the Judicial Department;
Completing implementation of the Medicaid autism mandate through changes in the School Based Child Health program that will assure Medicaid reimbursement for autism services being provided by school districts; and
Identifying resources in the human services agencies that could qualify for a new enhanced Medicaid match (75%) on eligibility staffing costs or for Medicaid administrative claiming.
While much effort goes into maximizing revenue, equal or greater effort goes into preserving existing sources of federal reimbursement. The Centers for Medicare and Medicaid Services has strengthened its compliance activities, resulting in significantly greater scrutiny of all state claims. Department of Social Services staff and impacted state agencies have experienced significantly increased time and effort explaining and justifying revenue items in order to sustain claims worth hundreds of millions of dollars that had once been considered routine.
44

GRANT FY 2015 FY 2016 FY 2017
State Owned PILOT $ 83.6 $ 71.4 $ 66.7
College & Hospital PILOT 125.4 122.9 115.0
Mashantucket Pequot & Mohegan Grant 61.8 61.8 58.1
Town Aid Road Grant 60.0 60.0 60.0
LoCIP 30.0 30.0 30.0
Regional Performance Incentive Grants 9.0 9.3 -
STEAP 20.0 20.0 20.0
Grants for Municipal Aid Projects 56.4 60.0 60.0
MRSA* - - 175.0
Municipal Aid Adjustment 3.6 - -
Miscellaneous General Government Grants 41.2 31.5 29.6
Subtotal - General Government $ 491.0 $ 466.9 $ 614.3
Public School Transportation $ 24.9 $ 23.3 $ -
Non-Public School Transportation 3.6 3.4 -
Adult Education 20.0 20.0 19.3
Education Cost Sharing* 2,035.1 2,061.7 2,037.6
Magnet Schools 310.7 328.0 312.6
Special Education - Student Based 139.8 139.8 135.6
Local School Construction 600.0 700.0 650.0
Miscellaneous Education Grants 175.3 175.8 187.3
Subtotal - Education $ 3,309.4 $ 3,452.0 $ 3,342.4
Teachers' Retirement Contributions, Retiree
Health Service Cost & Debt Service $ 1,136.9 $ 1,128.5 $ 1,151.7
Subtotal - Teachers' Retirement $ 1,136.9 $ 1,128.5 $ 1,151.7
Less: General Fund Lapse Savings - Municipal
Opportunities and Regional Efficiencies $ - $ - $ (20.0)
Total - Aid to Municipalities $ 4,937.3 $ 5,047.4 $ 5,088.4
Notes:
STATE AID TO OR ON BEHALF OF LOCAL
GOVERNMENTS(in Millions)
* The Education Cost Sharing Grant is being supplemented by $10 million in FY 2016
and FY 2017 from the Municipal Revenue Sharing Account (MRSA). ECS does not
include the portion of the appropriation that is attributable to charter schools.
45

EDUCATION COST SHARING GRANT (in millions)
The Education Cost sharing Grant (ECS) is the state's major education grant, designed to equalize the ability of towns to finance local education costs.
Charter school grants were appropriated under the ECS grant in the following amounts: $66 million in FY 2013, $75 million in FY 2014, $87 million in FY 2015, and $99 million in FY 2016. Charter school funding is not included in the graph above.
The Education Cost Sharing Grant is supplemented by $10 million in FY 2016 and FY 2017 from the Municipal Revenue Sharing Account (MRSA).
$1
,88
9
$1
,93
0
$1
,99
3
$2
,03
5
$2
,05
2
$2
,02
8
$10 $10
$0
$250
$500
$750
$1,000
$1,250
$1,500
$1,750
$2,000
'12 '13 '14 '15 '16 '17 Est.
ECS Grant MRSA Funding
46

MUNICIPAL REVENUE SHARING Municipal Revenue Sharing Account (MRSA) – FY 2016 Public Act 15-244 reconceived the Municipal Revenue Sharing Grant by diverting a portion of sales tax revenue to a dedicated account to fund four new grant programs for municipalities, beginning in FY 2017. In FY 2016, $10 million was used to supplement the education cost sharing grant (ECS).
Municipal Revenue Sharing Fund (MRSF) – FY 2017 Public Act 16-2, May Special Session, eliminates the sales tax revenue diversion to MRSA for FY 2017 and instead appropriates $185 million to a newly-established Municipal Revenue Sharing Fund (MRSF) to pay for specified municipal grant programs for FY 2017. Under the act, the Office of Policy and Management must use MRSF to fund (1) municipal revenue sharing grants, (2) regional services grants to councils of governments, (3) supplemental payments in lieu of taxes (PILOTs), and (4) supplemental ECS grants.
Use Amount Fiscal Year Date (if applicable)
Transfer $10 million for ECS grants $10 million FY 2017 Not later than April 15, 2017
Municipal revenue sharing grant $127,851,808 FY 2017 August 1, 2016
Regional services grants to regional councils of government
$3 million FY 2017 Quarterly
Additional payment in lieu of taxes $44,101,081 FY 2017 September 30
Municipal Revenue Sharing Account – FY 2018 and Beyond Commencing in FY 2018, the municipal revenue sharing program reverts to non-appropriated status, and is funded through an intercept of a portion of the sales and use tax. The use of Municipal Revenue Sharing Account funds is specified by provisions of Public Acts 16-2 and 16-3, May Special Session.
Use Amount Fiscal Year Date (if applicable)
Municipal revenue sharing grants $109,267,688 FYs 2018 and 2019 October 31
Motor vehicle property tax grants Unspecified FY 2018 and thereafter
August 1, 2017 and thereafter
Select payment in lieu of taxes $46,101,081 FY 2018 and thereafter
Regional services grants to regional councils of governments
$7 million FY 2018 and thereafter
Remaining moneys in the account to be expended annually for the purpose of municipal revenue sharing grants
FY 2020 and thereafter
October 1, 2019 and thereafter
Beginning in FY 2018, OPM must reduce municipal revenue sharing grants to municipalities whose
spending exceeds a spending cap specified pursuant to statute. The cap is the greater of the inflation
rate or 2.5 percent or more of the town’s authorized general budget expenditures in the prior fiscal
year. Grant funds are reduced by 50 cents for every dollar the municipality spends over the cap.
47

CONTINGENT LIABILITIES A governmental contingent liability is an obligation to make payments following the occurrence of a
particular “triggering” event. Such liabilities are not routinely factored into budget projections due to
their potential and uncertain nature. The state is currently faced with a number of significant
contingent liabilities that may, in the event of triggering actions, need to be addressed over the next
biennium. This adds complexity to the budgeting process as state policy makers will be challenged to
respond to uncertain outcomes with unclear fiscal ramifications. These contingent liabilities include
the following:
Costs to exit from the Juan F. consent decree. The Department of Children and Families (DCF) has operated under federal oversight since
1991. This is the result of a class action lawsuit (Juan F. vs. O'Neill, brought in 1989) that
charged the state with failing to appropriately serve children in foster care or who are at-risk
of being victims of abuse or neglect. The lawsuit was resolved by a negotiated agreement, the
Juan F. consent decree, that mandated the resolution of over one hundred issues in the areas
of (1) investigations of child abuse or neglect, and pre-placement services, (2) foster care and
other out-of-home placements and services, (3) medical care, (4) mental health care, (5)
adoption, (6) DCF staffing, and (7) agency management and systems.
The original consent decree has been modified by the court on several occasions. Since 2004,
DCF's performance has been evaluated by how well it has met twenty-two defined outcome
measures. To end federal monitoring, this "Exit Plan" called for the department to meet
benchmarks for each measure for at least two consecutive quarters (six months).
On September 29, 2016, an agreement to modify the Exit Plan was approved by the U.S.
District Court. In part, the court deems twelve of the twenty-two outcome measures as having
been met by DCF, with four others “pre-certified” as being met subject to ongoing sustained
performance. The six outcomes remaining to be monitored are related to commencement
and completion of investigations, case planning, meeting children’s needs, in-home visitation,
and caseload standards. Federal oversight of DCF will conclude upon the achievement of
newly defined, realistic benchmarks for these remaining outcomes.
Fiscal implications of the Revised Exit Plan include: (1) Requiring that DCF’s annual budget not
be less than its FY 2017 appropriation until federal oversight is ended; (2) limiting the average
caseload of all caseload carrying social workers to 75% of agreed upon maximum standards,
and (3) calling for a $6 million service expansion in key areas. Additionally, the Juan F. court
monitor will be granted the authority and responsibility to identify and report any specific
shortages in personnel or services that he determines may impede full implementation of the
agreement.
It is anticipated that the Attorney General will submit the agreement to the General Assembly
for approval at the start of the next legislative session. The agreement will be deemed
approved within 30 days of submittal if not acted upon within that time. If approved, the
agreement will be entered as an order of the court.
48

Costs to comply with the Sheff decision. In 1996, the Connecticut Supreme Court ruled that Hartford minority students’ constitutional
rights had been violated because they attended racially segregated schools. The court did not
specify a goal, remedy, or timetable to resolve the issue, stating that it was the responsibility
of the legislative and executive branches, which were tasked to craft a solution to desegregate
Hartford schools. There have been several agreements throughout the years for the voluntary
desegregation of Hartford students through the use of magnet schools, the Open Choice
program, and other programs designed to offer Hartford students an integrated setting.
The "Phase I Stipulation" was reached in 2003 and relied on voluntary desegregation efforts
and additional state funding for more magnet schools, the Open Choice program and the
Interdistrict Cooperative grant program to meet the goal of having at least 30% of Hartford
resident minority students in a reduced isolation setting by June 2007.
The "Phase II Stipulation" was reached in early 2008 and covered a five year period ending
June 30, 2013 and a goal of ultimately reaching 41% of Hartford resident minority students in
a reduced isolation setting. The state fell short of that goal and the agreement was extended
for one year in order to reach the 41% goal, which was achieved for the 2013-14 school year.
The latest agreement, the “Phase III Stipulation,” reached in December 2013 is a one year
agreement covering the 2014-15 school year with a goal of reaching 44% of Hartford resident
minority students in a reduced isolation setting based on October 1, 2014 enrollment data.
The annual goal drops to 43.5% if the Sheff plaintiffs do not approve the lighthouse school
proposal contemplated by the Phase III Stipulation through a community-based process with
Hartford Public Schools. This new agreement is estimated to provide nearly 1,800 additional
Hartford-resident minority students with a seat in a reduced isolation setting.
In February 2015, an agreement was reached to extend the Phase III Stipulation by one year
to end June 30, 2016 with a goal to reach 47.5% of Hartford resident minority students in a
reduced isolation setting. The agreement also called for the parties to begin mediation to
facilitate negotiations for a "Phase IV Stipulation."
In June 2016, an agreement was reached to extend the Phase III Stipulation a second time for
an additional year to end June 30, 2017. It essentially maintains the status quo and maintains
the progress of the previous agreement with a goal of 47.5% of Hartford resident minority
students in a reduced isolation setting. It allows for additional grades in established magnet
schools, provides an additional 300 seats in Open Choice and allows for any unexpended
funding in the Sheff account to be used to partly offset the reductions in magnet school
funding for FY 2017. This extension also called for the parties to again enter into mediation
to facilitate negotiations for the "Phase IV Stipulation."
As of September 2016, negotiations with a mediator were underway for a "Phase IV
Stipulation."
Costs attendant to resolving the CCJEF case. ln Connecticut Coalition for Justice in Education Funding et al. v. Rell, et al., brought in Hartford
Superior Court, the plaintiffs are a non-profit coalition comprised of parents, teachers, school
administrators and educational advocates, as well as several parents on behalf of their minor
children who reside in selected rural, suburban and urban municipalities in the State. Plaintiffs
49

claim the students' State constitutional rights to a free public education under Article VIII,
Section 1, equality of rights under Article 1, Section 1 and equal protection of the laws under
Article I, Section 20 are being violated by the alleged inequitable and inadequate financing of
their schools by the State. The action sought a declaratory judgment from the Court, an
injunction against the operation of the current system, an order that a new system be
devised, the appointment of a special master to oversee such activities, continuing Court
jurisdiction and attorney fees and costs. On September 17, 2007 the Superior Court issued a
ruling granting the State's motion to strike three counts of the plaintiffs' complaint. After the
Court's ruling, one count of the plaintiffs' complaint remained, alleging that the plaintiffs have
been denied substantially equal education opportunity in violation of the State constitution.
The plaintiffs sought and obtained permission to appeal immediately to the Connecticut
Supreme Court. On March 30, 2010 a plurality of the Supreme Court reversed the trial court,
ruled that the State constitution guarantees public school students a right to suitable
educational opportunities and remanded the case for a determination of whether such
opportunities are being provided. Trial began on January 12, 2016, and ended on June 3,
2016.
On September 7, 2016, the court issued a decision in part for the plaintiffs, and in part for the
defendants. The court determined that the overall amount spent by the State on education
was more than the amount constitutionally required, and that the court should not dictate
the amount of education spending. It ruled, however, that the State must propose a plan to
distribute its education funding in the future according to a more rational and consistent
system. It also required the State to propose plans to change certain policies relating to
elementary school completion, high school graduation, teachers' compensation and
evaluations, and special education. The court did not order any increase in spending on any
aspect of education. On September 15, 2016, the State applied to the Chief Justice for
certification to appeal the trial court's judgment. On September 20, 2016, the Chief Justice
granted the application and also granted the plaintiff's request to review issues decided
adversely to the plaintiffs. In addition, the Supreme Court stayed the trial court's order. The
State filed its appeal with the Supreme Court on September 23, 2016.
Potential litigation regarding timely eligibility determinations for Supplemental Nutrition Assistance Program (SNAP) benefits.
Briggs v. Bremby is a class-action lawsuit brought against the Department of Social Services
(DSS) in March 2012. The plaintiffs are applicants for Supplemental Nutrition Assistance
Program (SNAP) benefits, who allege that DSS failed to process their applications in a timely
manner in accordance with federal statutes and regulations. At the time the lawsuit was filed,
DSS ranked last in the country in timely processing, as measured by United States Department
of Agriculture (USDA) Food and Nutrition Service (FNS) metrics. In December 2012, the court
denied DSS’ motion to dismiss and granted the plaintiffs’ request for a preliminary injunction.
In May 2013, the court certified the class and issued a preliminary injunction that required
DSS to comply with federal timely processing requirements using state-generated data (as
opposed to federal data used by FNS). The injunction required 100% compliance with federal
timeliness requirements and allowed a 3% margin of error, for an effective 97% compliance
rate to be met by May 2014. Additionally, expedited and regular processing timeliness rates
were to be reported separately each month. In order to comply with the preliminary
50

injunction, DSS was required to develop new state-generated reports. In April 2014, DSS
appealed the preliminary injunction to the Second Circuit. In July 2015, the Second Circuit
affirmed the decision of the district court.
Although DSS has been near the top of national rankings in timely processing since mid-2014
as measured by FNS, limitations in the state data reports caused those reports to reflect a
lower timeliness rate. Relying on the state data reports, the plaintiffs moved for summary
judgment in September 2015. DSS opposed the motion and proceeded through discovery,
depositions, and various court filings which culminated with a hearing in May 2016. During
that hearing, the parties agreed to pursue settlement negotiations with the assistance of a
Magistrate Judge. Should negotiations progress to the point of an actual settlement,
additional costs could be incurred by DSS. Costs could include: attorney fees for the past four
years of litigation, ongoing monitoring costs, the potential need for computer system
modifications to ensure accurate reporting, and the potential need to add eligibility staff and
supporting positions in the event that DSS is unable to meet the terms of the agreement with
existing staff. In the event a settlement approved by the court is not reached, the court has
indicated an intent to enter a permanent injunction requiring the State to maintain a level of
timely processing set by the court. If such an injunction is ordered, the costs associated with
compliance with or appeal of such an injunction are uncertain.
Hospital litigation. In FY 2012, the State began levying a tax on the net patient revenue of acute care hospitals in
the state (excluding John Dempsey Hospital and Connecticut Children’s Medical Center). On
November 30, 2015, the Connecticut Hospital Association (CHA) and many of its member
hospitals filed petitions for a declaratory ruling with the Department of Social Services (DSS)
and Department of Revenue Services (DRS) challenging the application of the tax on the net
patient revenue of the hospitals. On September 22, 2016, DSS and DRS issued a declaratory
ruling specifically addressing the five issues raised in the CHA filing and rejecting the
petitioners’ claims that the tax is invalid. On November 1, 2016, CHA filed an appeal in
superior court challenging the declaratory rulings. The hospitals have filed corresponding
claims with DRS for a refund of hospital taxes paid to date, going back to FY 2012 when the
hospital tax went into effect. Such claims are currently pending with DRS. Revenue collected
under this tax to date is substantial.
Many of the acute care hospitals are also contesting inpatient and outpatient Medicaid rates
for rate years dating back to 2008 and have requested administrative hearings to resolve their
claims. The issues raised by the hospitals are nuanced and complex. In these appeals, the
hospitals seek increases which, if successful, could potentially result in substantial additional
Medicaid expenditures. Hearings are scheduled to begin in January 2017.
In addition, on November 1, 2016, CHA filed a petition with the Centers for Medicare and
Medicaid Services asserting that the state’s reimbursement and tax methodologies violate
federal law.
51

UNEMPLOYMENT COMPENSATION FUND
The Unemployment Compensation Fund (“trust fund”) is established pursuant to Connecticut General Statutes Section 31-261 for the purpose of paying benefits to unemployed workers. The trust fund is funded through payroll tax contributions paid by employers, and is not a budgeted fund of the state. High unemployment rates experienced in the state during the “Great Recession” strained this fund and required the state to borrow money from the federal government in order to continue paying unemployment benefits. The loan was fully repaid on March 24, 2016.
As of September 2016, the Connecticut seasonally adjusted unemployment rate was estimated at 5.4%.
The maximum weekly benefit rate is $616 for new claims effective October 2, 2016. Connecticut also pays $15 per dependent child per week up to a maximum of $75 per week.
As a result of a structural imbalance between tax revenues and benefit payouts that were influenced by the economic downturn, Connecticut’s trust fund became insolvent in mid-October of 2009.
In 2010, increases in job losses resulted in benefit payouts of approximately $1.3 billion from the trust fund, while only $700 million in taxes were collected. UI benefit payouts continued to exceed revenues in 2011 and 2012. In 2013, revenues kept pace with benefit payouts and slightly outpaced benefit payouts in 2014 and 2015. This trend is expected to continue in 2016.
To continue making unemployment benefit payments during the period of insolvency, Connecticut, like other states, obtained a loan from the federal government. Although the American Recovery and Reinvestment Act provided interest-free borrowing through calendar year 2010, states with loans outstanding at the beginning of 2011 were subject to interest on these loans.
As a mechanism to facilitate loan repayment, the federal government increased federal unemployment taxes on employers by increasing the existing Federal Unemployment Tax Act (FUTA) tax in 0.3% increments annually, beginning with calendar year 2011. In addition, states with loans outstanding for five years are subject to an additional increase (Benefit Cost Rate add-on, or BCR). In 2015 the BCR for Connecticut was 0.6%. As a result, for calendar year 2015, Connecticut employers had a FUTA tax rate of 2.1%, in addition to the standard 0.6% tax rate. The increases were applied to the state’s loan principal that has since been repaid.
For calendar year 2016, the federal tax rate for Connecticut’s employers is reduced to the normal rate of 0.6% – a significant drop from the total FUTA tax rate of 2.7% for calendar year 2015. As a result, the per-employee cost is reduced to an average of $42, compared to the $189 paid while the loan was outstanding.
52


SECTION 7
ANALYSIS OF POSSIBLE USES OF SURPLUS FUNDS


ANALYSIS OF POSSIBLE USES OF SURPLUS FUNDS
Under current law (CGS 4-30a), unappropriated surpluses are committed to the Budget Reserve Fund. Replenishment of the Budget Reserve Fund to the current ten percent maximum authorized by CGS 4-30a would require approximately $1.8 billion. Other possible uses of surplus funds could include:
Reducing bonded indebtedness;
Reducing the unfunded liability in the State Employees Retirement Fund;
Reducing the unfunded liability in the Teachers Retirement Fund;
Reducing the unfunded liability for Other Post Employment Benefits; or
Providing funds for Higher Education Matching Grants as per sections 10a-77a, 10a-99a, 10a-109c, 10a-109i and 10a-143a of the General Statutes.
53

GENERAL FUND OPERATING SURPLUS / (DEFICIT)(In Millions)
Fiscal Year Revenue Expenditure Adjustment Surplus/(Deficit)
1984-85 4,010.9$ 3,636.7$ (8.7)$ 365.5$
1985-86 4,317.9 4,011.8 (56.0) 250.1
1986-87 4,741.9 4,356.2 (20.5) 365.2
1987-88 4,860.3 4,966.6 (9.3) (115.6)
1988-89 5,573.6 5,594.4 (7.2) (28.0)
1989-90 6,112.0 6,372.6 1.1 (259.5)
1990-91 5,817.9 6,625.2 (1.2) (808.5)
1991-92 7,389.4 7,276.6 (2.6) 110.2
1992-93 7,569.0 7,456.6 1.1 113.5
1993-94 7,914.2 8,008.1 113.6 19.7
1994-95 8,479.7 8,400.9 1.7 80.5
1995-96 9,111.1 8,861.6 0.5 250.0
1996-97 9,582.1 9,311.0 (8.5) 262.6
1997-98 10,142.2 9,830.3 1.0 312.9
1998-99 10,616.4 10,545.9 1.3 71.8
1999-2000 11,213.6 10,911.1 (2.1) 300.4
2000-01 11,985.5 11,930.6 (24.2) 30.7
2001-02 10,845.4 11,643.2 (19.3) (817.1)
2002-03 12,023.3 12,128.3 8.4 (96.6)
2003-04 13,123.8 12,823.4 1.8 302.2
2004-05 14,062.9 13,680.8 (18.2) 363.9
2005-06 14,998.7 14,533.2 (19.0) 446.5
2006-07 15,742.6 15,461.0 (12.4) 269.2
2007-08 16,418.8 16,300.5 (18.9) 99.4 (1)
2008-09 15,700.8 16,640.2 (8.3) (947.6) (2)
2009-10 17,688.5 (3) 17,240.7 2.1 449.9 (4)
2010-11 18,157.4 (5) 17,924.7 4.2 236.9 (6)
2011-12 18,561.6 18,711.1 5.8 (143.6) (7)
2012-13 19,405.0 19,007.7 0.7 398.0 (8)
2013-14 17,200.4 (11) 16,953.6 1.7 248.5 (9)
2014-15 17,282.0 17,398.7 3.5 (113.2) (10)
2015-16 17,780.8 17,952.9 1.6 (170.4) (12)
2016-17 (est.) 17,840.8 17,908.5 - (67.7) (13)
(1) PA 07-1 reserved $16.0 million of FY 2008 revenue for use in FY 2009. In addition, PA 08-1 & 08-2 of the August Special Session
reserved a total of $83.4 million of the FY 2008 surplus for use in FY 2009.
(2) Covered by issuing Economic Recovery Notes, per PA 09-2, JSS
(3) Includes $1,278.5 million of Budget Reserve Fund monies-without these monies, the deficit would have been $829.1 million.
(4) Per PA 10-179, $140.0 million is reserved for use in FY 2011 and the remaining $309.4 million will reduce the amount to be
securitized in FY 2011.
(5) Includes $449.4 million from the FY 2010 surplus.
(6) $222.4 million of the surplus was transferred to the Budget Reserve Fund in PA 12-104 and the remainder via
Comptroller reclassification.
(7) Covered by a transfer from the Budget Reserve Fund.
(8) Per section 58 of PA 13-184, $220.8 million is reserved for use in FY 2014 and FY 2015.
(9) Includes $190.8 million of FY 2013 surplus reserved for use in FY 2014.
(10) Includes $30.0 million of FY 2013 surplus reserved for use in FY 2015.
(11) Beginning in FY 2014 the state commenced net budgeting of Medicaid. This reduced appropriated revenues and
expenditures beginning in FY 2014.
(12) Per preliminary figures from the State Comptroller's office.
(13) Per OPM letter to the State Comptroller dated November 20, 2016.
54