FIS Research - High Performance Community Banking
11
www.fisglobal.com Financial Profiles of High-performing Community Banks Research Brief July 2012
-
Upload
paul-mcadam -
Category
Business
-
view
575 -
download
0
Transcript of FIS Research - High Performance Community Banking
www.fisglobal.com
Financial Profiles of High-performing Community Banks Research Brief July 2012

Financial Profiles of High-performing Community Banks
2
© 2012 FIS and/or its subsidiaries. All Rights Reserved.
Introduction Historically, economies of scale have provided larger financial institutions (i.e., more than $1 billion in assets) with the ability to generate lower efficiency ratios and, often, higher returns on assets (ROAs) than community banks. The Great Recession represented an anomalous period during which both large and small financial institutions’ ROAs plummeted, though the Goliath banks (i.e., top 10 in assets) still held enough of an advantage to keep them profitable – albeit barely – while all banks below the top-10 collectively lost money. Despite the disadvantages of their smaller size, some community banks – defined in our analysis as banks with less than $1 billion in assets – outperform larger banks as well as their community bank peers during both good and bad times. This research brief focuses on the financial metrics of these high-performing community banks to determine the characteristics that differentiate the elite performers from the rest of the pack. In addition, we wanted to find out how these characteristics changed among the time periods prior to the recession, during the recession and post-recession to determine what lessons can be learned from high achievers that can be applied to other community banks. What we found was that there is not just one “secret ingredient” to success, but instead, a whole host of actions that high-performing banks take, especially in tough times, to thrive. We found that the highest-performing community banks excelled in several financial metrics, including:
Return on assets
Efficiency ratio
Yield on loans
Interest expense
Net interest margin
Net loan charge offs
Loan loss provision expense
Non-interest income
Operating expense ratio
Financial Profiles of High-performing Community Banks
3
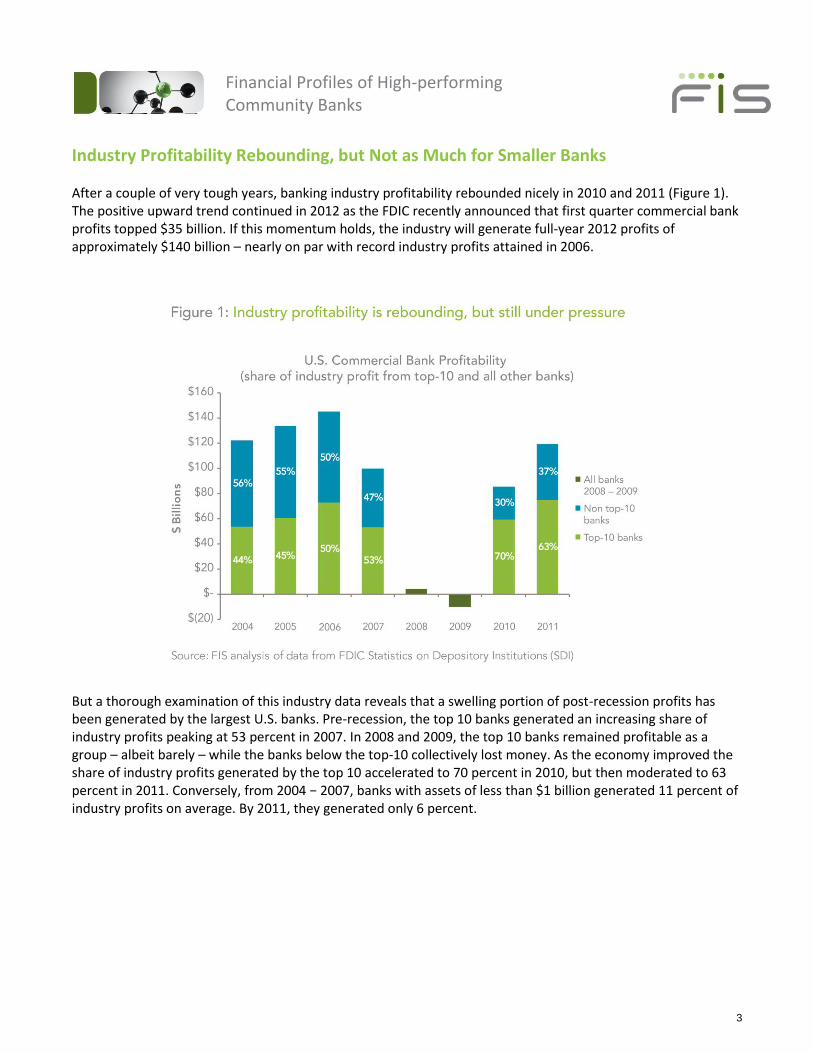
Industry Profitability Rebounding, but Not as Much for Smaller Banks After a couple of very tough years, banking industry profitability rebounded nicely in 2010 and 2011 (Figure 1). The positive upward trend continued in 2012 as the FDIC recently announced that first quarter commercial bank profits topped $35 billion. If this momentum holds, the industry will generate full-year 2012 profits of approximately $140 billion – nearly on par with record industry profits attained in 2006.
But a thorough examination of this industry data reveals that a swelling portion of post-recession profits has been generated by the largest U.S. banks. Pre-recession, the top 10 banks generated an increasing share of industry profits peaking at 53 percent in 2007. In 2008 and 2009, the top 10 banks remained profitable as a group – albeit barely – while the banks below the top-10 collectively lost money. As the economy improved the share of industry profits generated by the top 10 accelerated to 70 percent in 2010, but then moderated to 63 percent in 2011. Conversely, from 2004 − 2007, banks with assets of less than $1 billion generated 11 percent of industry profits on average. By 2011, they generated only 6 percent.
Financial Profiles of High-performing Community Banks
4
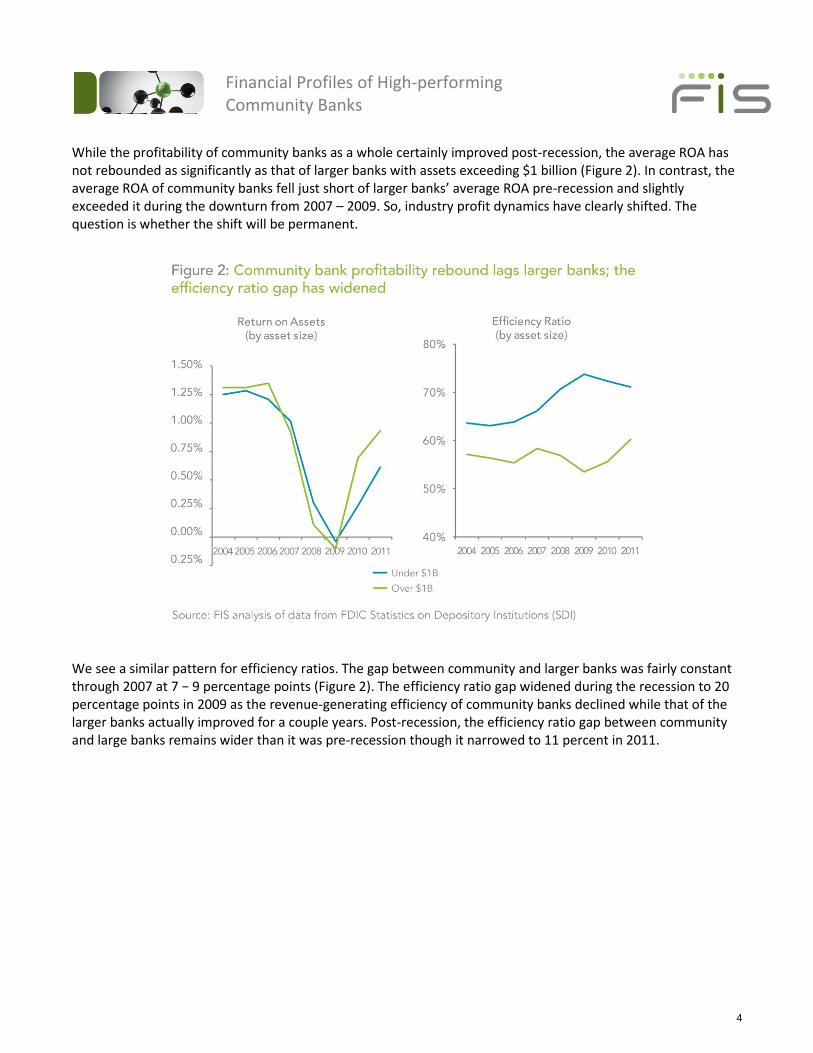
While the profitability of community banks as a whole certainly improved post-recession, the average ROA has not rebounded as significantly as that of larger banks with assets exceeding $1 billion (Figure 2). In contrast, the average ROA of community banks fell just short of larger banks’ average ROA pre-recession and slightly exceeded it during the downturn from 2007 – 2009. So, industry profit dynamics have clearly shifted. The question is whether the shift will be permanent.
We see a similar pattern for efficiency ratios. The gap between community and larger banks was fairly constant through 2007 at 7 − 9 percentage points (Figure 2). The efficiency ratio gap widened during the recession to 20 percentage points in 2009 as the revenue-generating efficiency of community banks declined while that of the larger banks actually improved for a couple years. Post-recession, the efficiency ratio gap between community and large banks remains wider than it was pre-recession though it narrowed to 11 percent in 2011.
Financial Profiles of High-performing Community Banks
5
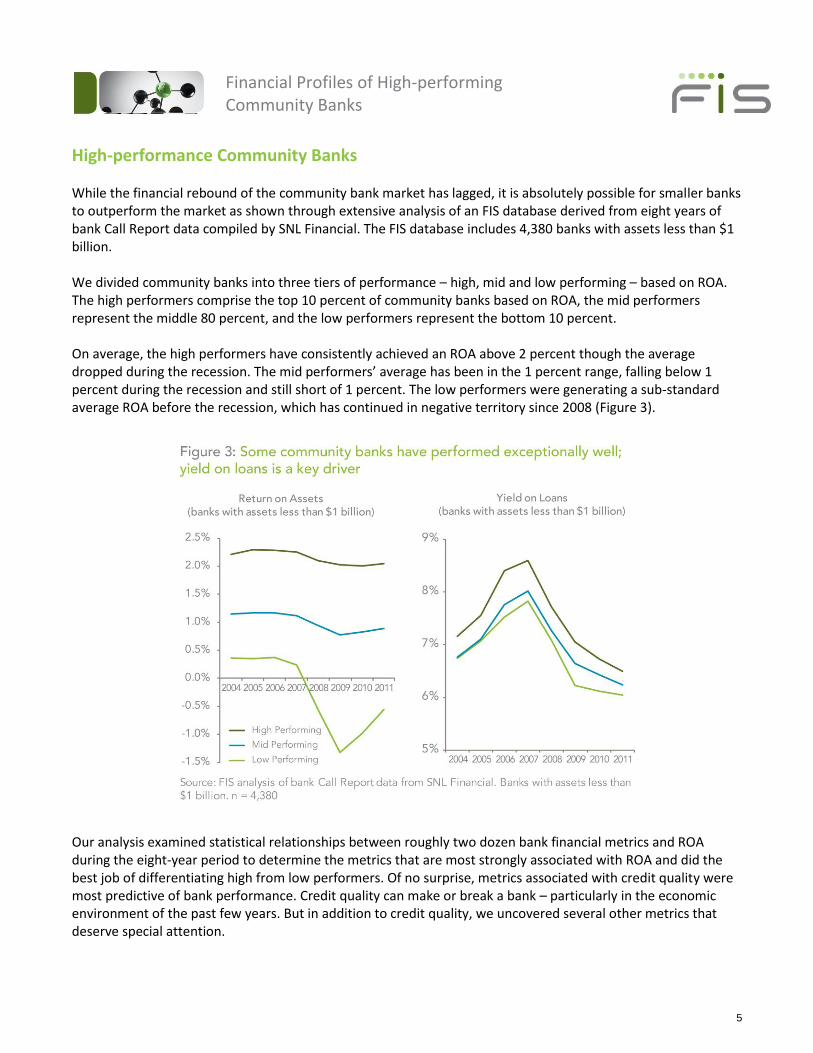
High-performance Community Banks While the financial rebound of the community bank market has lagged, it is absolutely possible for smaller banks to outperform the market as shown through extensive analysis of an FIS database derived from eight years of bank Call Report data compiled by SNL Financial. The FIS database includes 4,380 banks with assets less than $1 billion. We divided community banks into three tiers of performance – high, mid and low performing – based on ROA. The high performers comprise the top 10 percent of community banks based on ROA, the mid performers represent the middle 80 percent, and the low performers represent the bottom 10 percent. On average, the high performers have consistently achieved an ROA above 2 percent though the average dropped during the recession. The mid performers’ average has been in the 1 percent range, falling below 1 percent during the recession and still short of 1 percent. The low performers were generating a sub-standard average ROA before the recession, which has continued in negative territory since 2008 (Figure 3).
Our analysis examined statistical relationships between roughly two dozen bank financial metrics and ROA during the eight-year period to determine the metrics that are most strongly associated with ROA and did the best job of differentiating high from low performers. Of no surprise, metrics associated with credit quality were most predictive of bank performance. Credit quality can make or break a bank – particularly in the economic environment of the past few years. But in addition to credit quality, we uncovered several other metrics that deserve special attention.
Financial Profiles of High-performing Community Banks
6
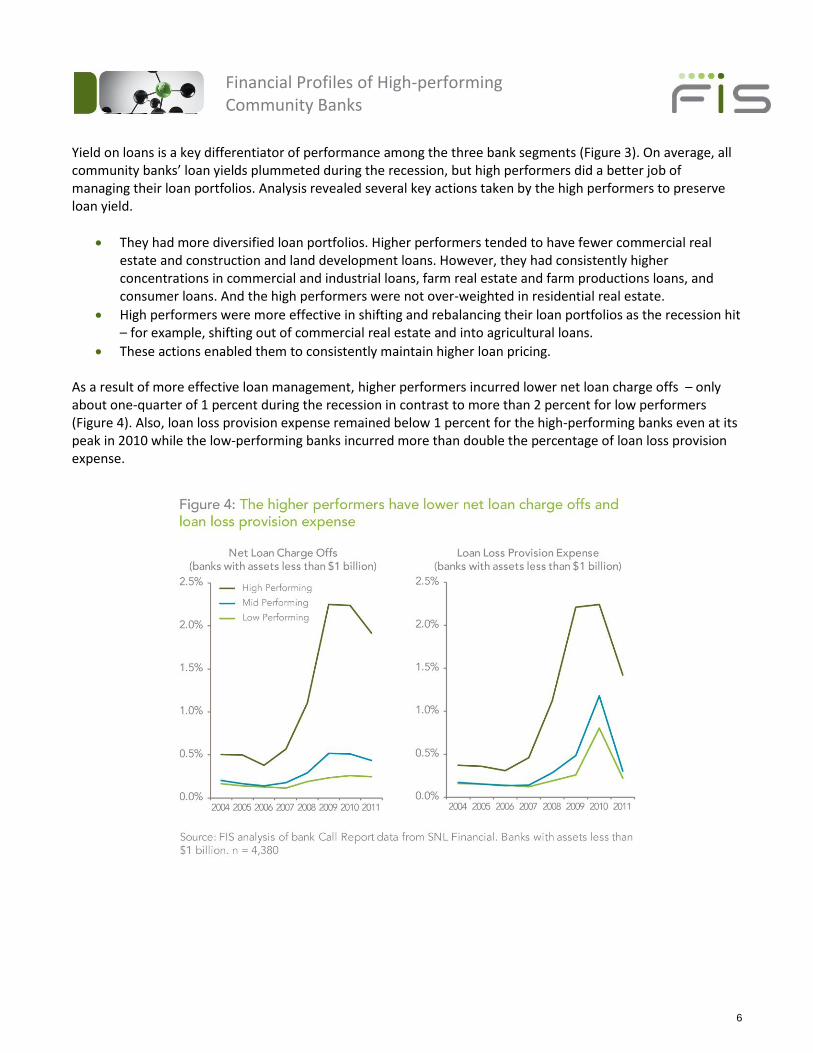
Yield on loans is a key differentiator of performance among the three bank segments (Figure 3). On average, all community banks’ loan yields plummeted during the recession, but high performers did a better job of managing their loan portfolios. Analysis revealed several key actions taken by the high performers to preserve loan yield.
They had more diversified loan portfolios. Higher performers tended to have fewer commercial real estate and construction and land development loans. However, they had consistently higher concentrations in commercial and industrial loans, farm real estate and farm productions loans, and consumer loans. And the high performers were not over-weighted in residential real estate.
High performers were more effective in shifting and rebalancing their loan portfolios as the recession hit – for example, shifting out of commercial real estate and into agricultural loans.
These actions enabled them to consistently maintain higher loan pricing. As a result of more effective loan management, higher performers incurred lower net loan charge offs – only about one-quarter of 1 percent during the recession in contrast to more than 2 percent for low performers (Figure 4). Also, loan loss provision expense remained below 1 percent for the high-performing banks even at its peak in 2010 while the low-performing banks incurred more than double the percentage of loan loss provision expense.
Financial Profiles of High-performing Community Banks
7
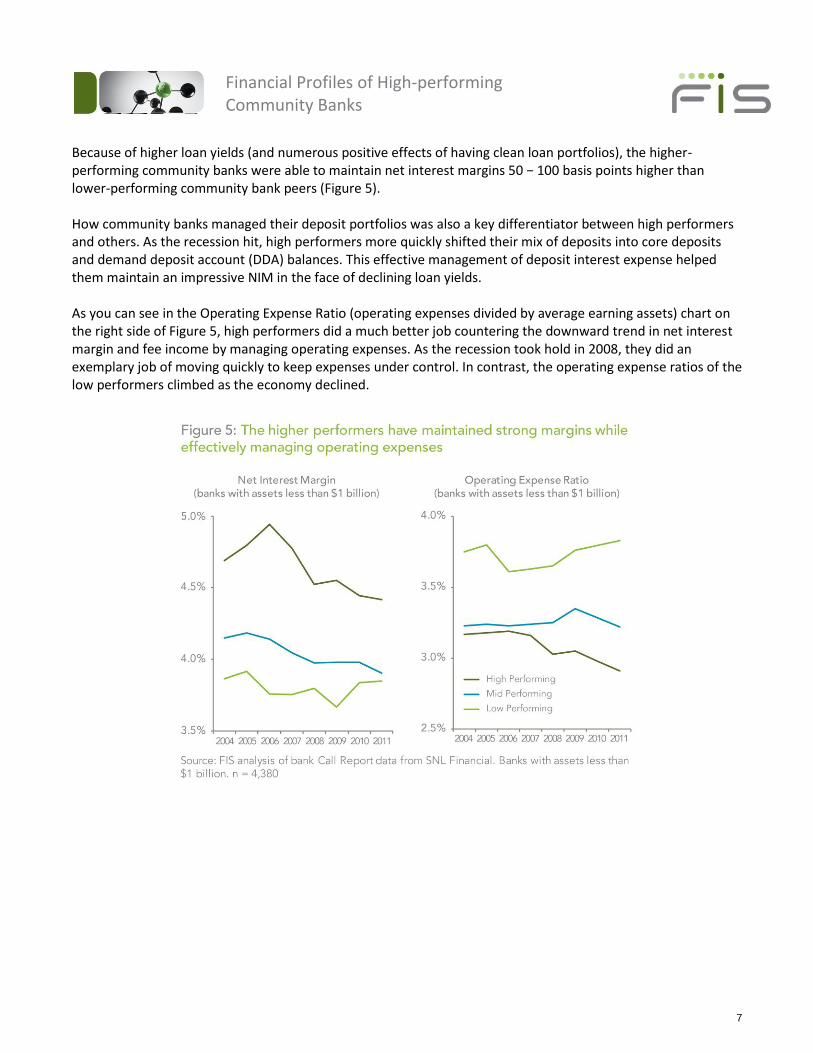
Because of higher loan yields (and numerous positive effects of having clean loan portfolios), the higher-performing community banks were able to maintain net interest margins 50 − 100 basis points higher than lower-performing community bank peers (Figure 5). How community banks managed their deposit portfolios was also a key differentiator between high performers and others. As the recession hit, high performers more quickly shifted their mix of deposits into core deposits and demand deposit account (DDA) balances. This effective management of deposit interest expense helped them maintain an impressive NIM in the face of declining loan yields. As you can see in the Operating Expense Ratio (operating expenses divided by average earning assets) chart on the right side of Figure 5, high performers did a much better job countering the downward trend in net interest margin and fee income by managing operating expenses. As the recession took hold in 2008, they did an exemplary job of moving quickly to keep expenses under control. In contrast, the operating expense ratios of the low performers climbed as the economy declined.
Financial Profiles of High-performing Community Banks
8
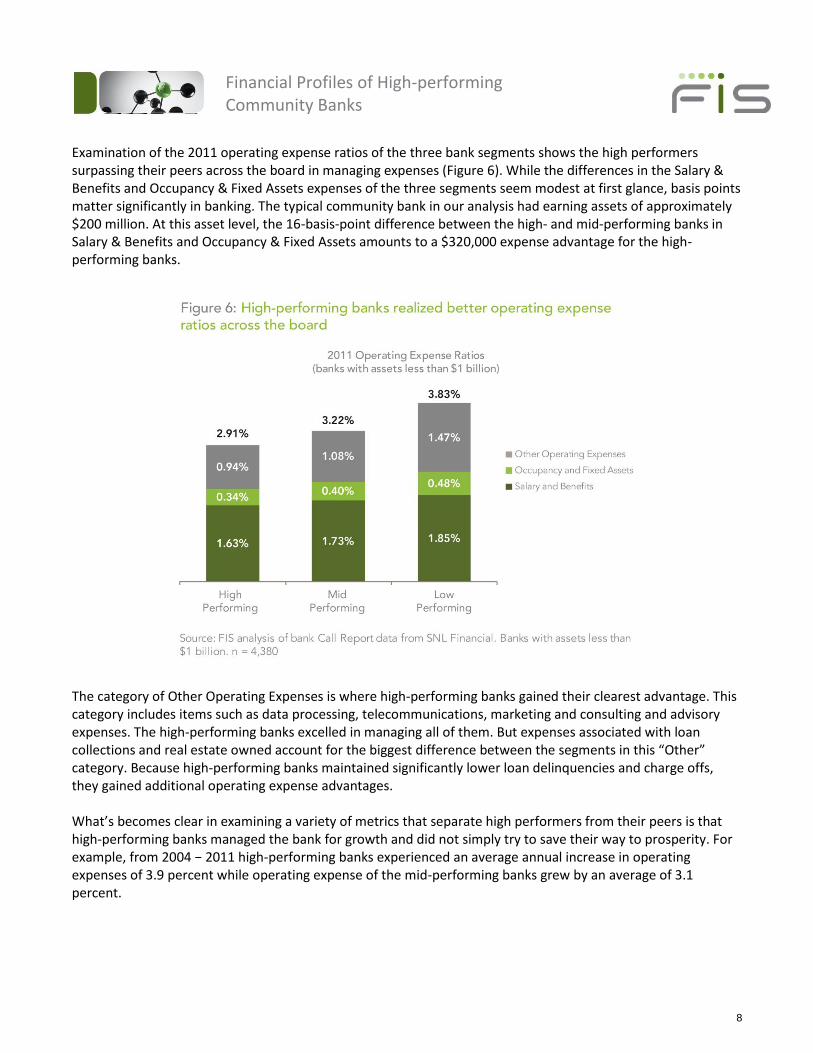
Examination of the 2011 operating expense ratios of the three bank segments shows the high performers surpassing their peers across the board in managing expenses (Figure 6). While the differences in the Salary & Benefits and Occupancy & Fixed Assets expenses of the three segments seem modest at first glance, basis points matter significantly in banking. The typical community bank in our analysis had earning assets of approximately $200 million. At this asset level, the 16-basis-point difference between the high- and mid-performing banks in Salary & Benefits and Occupancy & Fixed Assets amounts to a $320,000 expense advantage for the high-performing banks.
The category of Other Operating Expenses is where high-performing banks gained their clearest advantage. This category includes items such as data processing, telecommunications, marketing and consulting and advisory expenses. The high-performing banks excelled in managing all of them. But expenses associated with loan collections and real estate owned account for the biggest difference between the segments in this “Other” category. Because high-performing banks maintained significantly lower loan delinquencies and charge offs, they gained additional operating expense advantages. What’s becomes clear in examining a variety of metrics that separate high performers from their peers is that high-performing banks managed the bank for growth and did not simply try to save their way to prosperity. For example, from 2004 − 2011 high-performing banks experienced an average annual increase in operating expenses of 3.9 percent while operating expense of the mid-performing banks grew by an average of 3.1 percent.
Financial Profiles of High-performing Community Banks
9
A Culture of Performance How did high-performing community banks consistently accomplish these impressive results? Clearly these companies didn’t perform this well by accident because they performed well across all of the key financial metrics we analyzed. We can assume they have strong leadership and performance-based cultures. But the opportunity we’ve had in recent months to speak with executives from high-performing community banks within the FIS client base provides additional insights into key drivers of high performance. Such banks are very good at:
Focusing the entire organization on a highly visible and easy-to-understand strategy
Driving accountability throughout the organization
Simultaneously managing multiple challenges
Formulating timely reactions to changes in customers and competition
Introducing innovation in response to market demand
Managing operations that are flexible and able to respond to change quickly
Maintaining high levels of quality control with less variability in processes. They leveraged these skill sets to overcome persistent challenges facing community banking organizations during the past several years. We can all learn from these institutions.
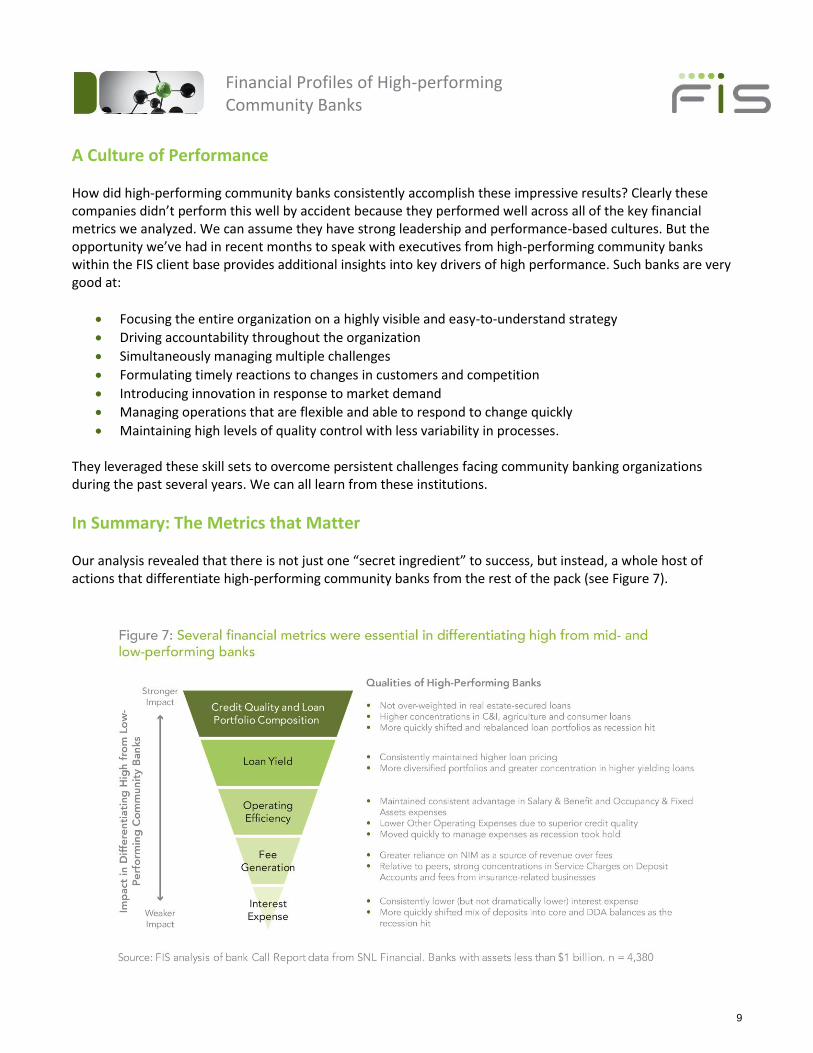
In Summary: The Metrics that Matter Our analysis revealed that there is not just one “secret ingredient” to success, but instead, a whole host of actions that differentiate high-performing community banks from the rest of the pack (see Figure 7).

Financial Profiles of High-performing Community Banks
10
Metrics associated with credit quality, loan portfolio composition and loan yield were the most predictive of a community bank’s overall profitability (as measured by ROA). While certainly not a surprise given the pressures on the U.S. economy and real estate markets, high-performing banks were not over-weighted in real estate-secured loans during the past eight years and, instead, tended to have higher concentrations in commercial and industrial, agriculture and consumer loans. And critically, the overall greater diversity of their loan portfolios helped them to maintain higher loan pricing. Our analysis repeatedly revealed that high-performing banks were also more nimble and flexible than the competition. As it relates to loans, they moved quickly to shift and rebalance their loan portfolios out of riskier loans as recession hit. We saw repeated evidence that this capability of forming timely reactions to changes in market conditions extended to other parts of their operations as well. Metrics associated with operating efficiency were also predictive of community bank performance. High-performing community banks were able to strike a balance between revenue/profit generation and expense management. The high performers did not operate to save their way to prosperity, yet demonstrated consistent advantages in Salary & Benefit and Occupancy & Fixed Assets expenses and separated themselves from the pack tremendously through lower Other Operating Expenses due to their superior credit quality. Fee income generation has been a significant industry challenge, and this was very evident in our analysis. Nearly all of the community banks in our analysis experienced either declining fee income, or at a minimum declining fee income growth rates. In the early years of our analysis (2004 – 2006), the data revealed that a bank’s strength in fee income generation was highly predictive of profitability. But this predictive power dropped off significantly as the recession and new regulations took hold and community banks with a greater reliance on revenue from net interest margin over fees tended to perform better. However, fee income generation was and will always remain essential. Relative to their peers, the high-performing community banks had higher concentrations of fee income in not only service charges on deposit accounts but also fees from insurance-related businesses. Interest expense is the final category of metric where we saw some, albeit lower, predictive power. The high-performing community banks consistently demonstrated slightly lower interest expense than their peers. Thus yield on loans, rather than interest expense, was the key factor that enabled the high performers to generate superior net interest margins. But in terms of interest expense, the real differences emerged as we dug deeper into the mix of deposit funding. High-performing banks not only had a higher mix of core and transactional deposits and a lower mix of time, jumbo and brokered deposits, they also moved more quickly and shifted their mix of deposits into core and DDA balances noticeably as the recession hit. This research brief was written to focus on the financial metrics of high-performing banks pre- and post-recession to determine the levers that differentiate the elite performers and to uncover lessons that can be applied to other community banks. Please feel free to contact me if you have any questions regarding this analysis or how it applies to your institution.
Financial Profiles of High-performing Community Banks
11
About the Research Financial Profiles of High-performing Community Banks is based on analysis of FIS database derived from eight years of bank Call Report data compiled by SNL Financial. The FIS database includes records for 4,380 banks with assets less than $1 billion. We divided community banks into three tiers of performance – high, mid and low performing – based on return on assets. The high performers comprise approximately the top 10 percent of community banks based on their ROA, the mid performers represent about the middle 80 percent and the low performers represent about the bottom 10 percent. Divisions were made based on the distances of individual banks’ ROAs from the average ROA. The study’s primary objective was to determine the characteristics of and commonalties among high-performing community banks and if and how those characteristics changed among the time periods prior to the recession, during the recession and post-recession.
About FIS
FIS delivers banking and payments technologies to more than 14,000 financial institutions and businesses in over 100 countries worldwide. FIS provides financial institution core processing, and card issuer and transaction processing services, including the NYCE® Payments Network. FIS maintains processing and technology relationships with 40 of the top 50 global banks, including nine of the top 10. FIS is a member of Standard & Poor's (S&P) 500® Index and is currently ranked No. 1 in the annual FinTech 100 rankings. Headquartered in Jacksonville, Fla., FIS employs more than 32,000 on a global basis. FIS is listed on the New York Stock Exchange under the “FIS” ticker symbol. For more information about FIS see www.fisglobal.com. Financial Profiles of High-performing Community Banks was authored by Paul McAdam, SVP of Research and Thought Leadership at FIS. Please contact the author if you have questions about the research or how the results apply to your financial institution. Paul McAdam Ph: 708.449.7743 [email protected]