
Firstsource Solutions Limited€¦ · · 2014-04-11The lenders include overseas branches of Axis...
17
Firstsource Solutions Limited Q1 FY2012 Earnings Update
Transcript of Firstsource Solutions Limited€¦ · · 2014-04-11The lenders include overseas branches of Axis...
Firstsource Solutions LimitedQ1 FY2012 Earnings UpdateQ g p

Disclaimer
Certain statements in this presentation concerning our future growth prospects are forward-looking
statements, which involve a number of risks, and uncertainties that could cause actual results to differ
materially from those in such forward-looking statements. The risks and uncertainties relating to thesey g g
statements include, but are not limited to risks and uncertainties regarding fluctuations in earnings, our
ability to manage growth, intense competition in BPO services including those factors which may affect our
cost advantage, wage increases, our ability to attract and retain highly skilled professional, time and cost
overruns on client contracts, client concentration, our ability to manage ramp-ups and growth, our ability to
manage our international operations, reduced demand in our key focus verticals, disruptions in telecom
infrastructure and technology, our ability to successfully complete and integrate potential
acquisitions, liability for damages on our service contracts, performance of our subsidiaries, withdrawal ofq , y g , p ,
government fiscal incentives, political instability, legal restrictions on raising capital and acquiring companies
outside India, unauthorized use of our intellectual property and general economic conditions affecting our
industry. Firstsource may, from time to time, make additional written and oral forward-looking
statements, including our reports to shareholders. The company does not undertake to update any forward-
looking statements that may be made from time to time by or on behalf of the company.
Firstsource © 2011 | Confidential | August 3, 2011 | 2
Agenda
Q1 FY2012 Highlights
Financial Performance – Q1 FY12
Business OutlookBusiness Outlook
Firstsource © 2011 | Confidential | August 3, 2011 | 3

Q1 FY2012 Highlights (1/5)Q1 FY2012 Performance Analysis
Operating Revenue
– Q1 Revenues at Rs 5,231 million
– Y-o-Y growth of 6.6% in INR terms and 7.3% in constant currency terms
– Q-o-Q decline of 4.3% in INR terms and 4.8% in constant currency terms; largely on account of
More pronounced BFSI collections volume fall than usual seasonal weakness
Impact on account of T&M client ramp down and softness in business volumes
Operating EBITp g
– Q1 FY12 operating EBIT margins at 4.0%, lower by 620 bps compared to Q4FY11; largely onaccount of
Lower than expected revenue momentum
– Expect momentum to pick up in H2 on the back of strong pipeline
Cost of growth in Asia Business Unit
Capacity consolidation initiative has resulted in parallel capacity and higher costs in the interim
Firstsource © 2011 | Confidential | August 3, 2011 | 4
– Capacity consolidation to be financially beneficial H2 onwards
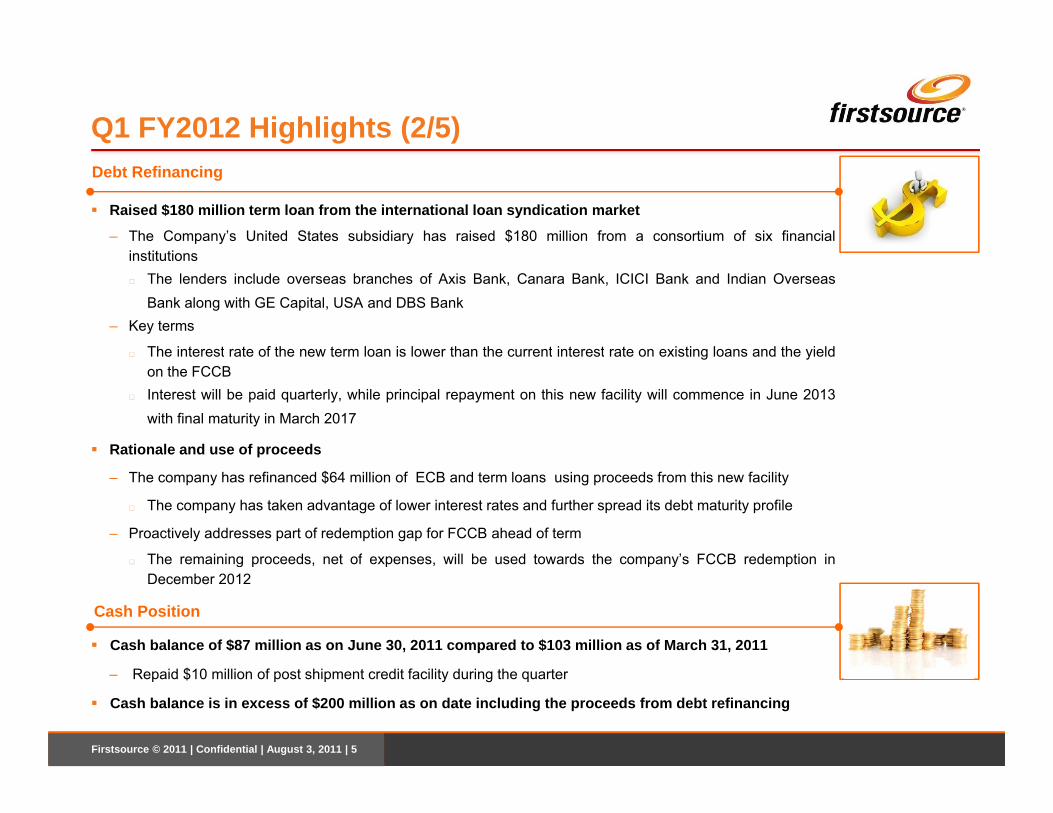
Q1 FY2012 Highlights (2/5)Debt Refinancing
Raised $180 million term loan from the international loan syndication market
– The Company’s United States subsidiary has raised $180 million from a consortium of six financiali tit tiinstitutions
The lenders include overseas branches of Axis Bank, Canara Bank, ICICI Bank and Indian OverseasBank along with GE Capital, USA and DBS Bank
– Key terms
The interest rate of the new term loan is lower than the current interest rate on existing loans and the yieldThe interest rate of the new term loan is lower than the current interest rate on existing loans and the yieldon the FCCBInterest will be paid quarterly, while principal repayment on this new facility will commence in June 2013with final maturity in March 2017
Rationale and use of proceeds
– The company has refinanced $64 million of ECB and term loans using proceeds from this new facility
The company has taken advantage of lower interest rates and further spread its debt maturity profile
– Proactively addresses part of redemption gap for FCCB ahead of term
The remaining proceeds net of expenses will be used towards the company’s FCCB redemption inThe remaining proceeds, net of expenses, will be used towards the company s FCCB redemption inDecember 2012
Cash Position
Cash balance of $87 million as on June 30, 2011 compared to $103 million as of March 31, 2011
Firstsource © 2011 | Confidential | August 3, 2011 | 5
– Repaid $10 million of post shipment credit facility during the quarter
Cash balance is in excess of $200 million as on date including the proceeds from debt refinancing
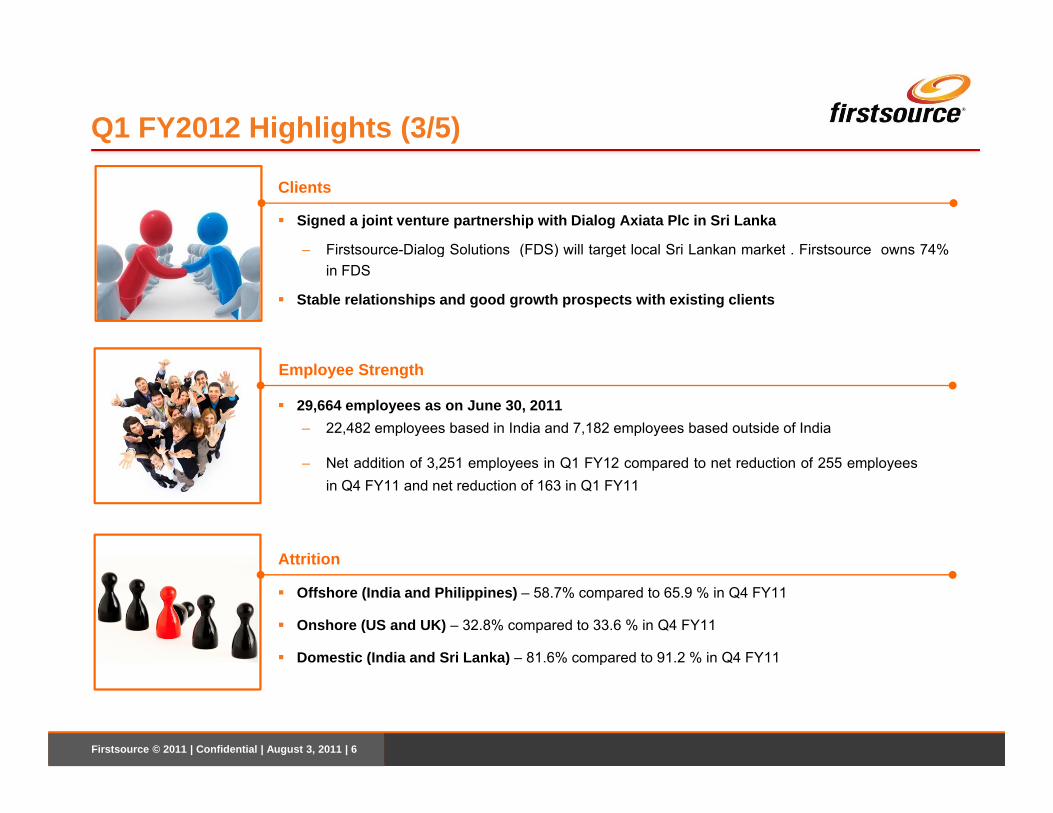
Q1 FY2012 Highlights (3/5)
Clients
Signed a joint venture partnership with Dialog Axiata Plc in Sri Lanka
– Firstsource-Dialog Solutions (FDS) will target local Sri Lankan market . Firstsource owns 74%Firstsource Dialog Solutions (FDS) will target local Sri Lankan market . Firstsource owns 74%in FDS
Stable relationships and good growth prospects with existing clients
Employee Strength
29,664 employees as on June 30, 2011– 22,482 employees based in India and 7,182 employees based outside of India
N t dditi f 3 251 l i Q1 FY12 d t t d ti f 255 l– Net addition of 3,251 employees in Q1 FY12 compared to net reduction of 255 employeesin Q4 FY11 and net reduction of 163 in Q1 FY11
AttritionAttrition
Offshore (India and Philippines) – 58.7% compared to 65.9 % in Q4 FY11
Onshore (US and UK) – 32.8% compared to 33.6 % in Q4 FY11
Domestic (India and Sri Lanka) – 81.6% compared to 91.2 % in Q4 FY11
Firstsource © 2011 | Confidential | August 3, 2011 | 6
( ) p Q
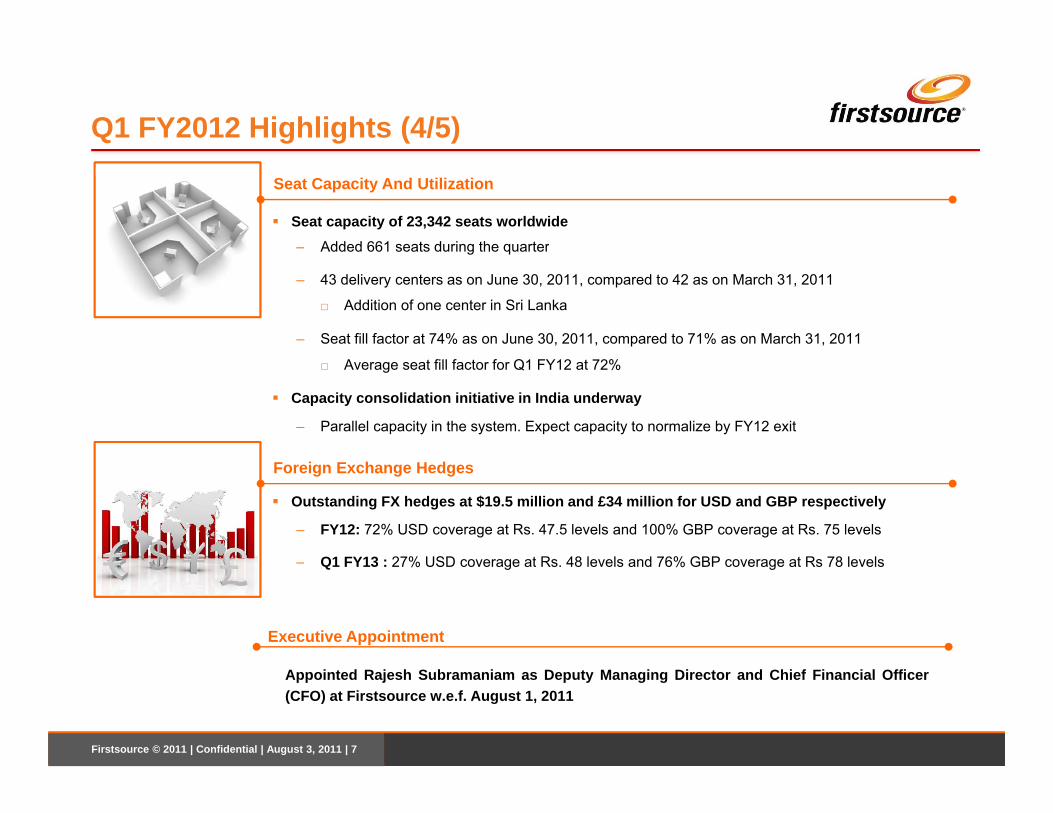
Q1 FY2012 Highlights (4/5)
Seat Capacity And Utilization
Seat capacity of 23,342 seats worldwide– Added 661 seats during the quarterg q
– 43 delivery centers as on June 30, 2011, compared to 42 as on March 31, 2011
□ Addition of one center in Sri Lanka
– Seat fill factor at 74% as on June 30, 2011, compared to 71% as on March 31, 2011
□ Average seat fill factor for Q1 FY12 at 72%
Capacity consolidation initiative in India underway
– Parallel capacity in the system. Expect capacity to normalize by FY12 exit
Foreign Exchange Hedges
Outstanding FX hedges at $19.5 million and £34 million for USD and GBP respectively
– FY12: 72% USD coverage at Rs. 47.5 levels and 100% GBP coverage at Rs. 75 levels
Q1 FY13 : 27% USD coverage at Rs 48 levels and 76% GBP coverage at Rs 78 levels– Q1 FY13 : 27% USD coverage at Rs. 48 levels and 76% GBP coverage at Rs 78 levels
Executive Appointment
Firstsource © 2011 | Confidential | August 3, 2011 | 7
Appointed Rajesh Subramaniam as Deputy Managing Director and Chief Financial Officer(CFO) at Firstsource w.e.f. August 1, 2011

Q1 FY2012 Highlights (5/5)By Geography By Verticals
12% 12% 13%24% 30%
2% 1% 1%
62% 54% 54%
27% 33% 33%
38% 35% 35%
37% 34% 34%
24% 31% 30%
By Delivery Location Client Concentration
Q1 FY11 Q4 FY11 Q1 FY12
North America UK India, APAC
Q1 FY11 Q4 FY11 Q1 FY12
Healthcare Telecom and Media BFSI Others
By Delivery Location Client Concentration
28% 24% 24%
11% 11% 12%31%
38% 39%
62% 65% 64%
Q1 FY11 Q4 FY11 Q1 FY12
11% 13% 13%
Q1 FY11 Q4 FY11 Q1 FY12
Firstsource © 2011 | Confidential | August 3, 2011 | 8
Q1 FY11 Q4 FY11 Q1 FY12
Onshore Offshore Domestic
Q1 FY11 Q4 FY11 Q1 FY12
Top Client Top 5 Clients

Agenda
Q1 FY2012 Highlights
Financial Performance – Q1 FY12
Business OutlookBusiness Outlook
Firstsource © 2011 | Confidential | August 3, 2011 | 9

Financial Performance – Q1 FY2012(IN INR Million) Q1 FY
2011Q4 FY
2011Q1 FY
2012
Income from services 4,759 5,403 5,189
Other operating Income 148 61 42
Revenue From Operations
4.3% Q-o-Q
4,9075,464 5,231
3000
4000
5000
6000
Mn
Revenue from operations 4,907 5,464 5,231
Personnel and Operating Expense 4,226 4,673 4,802
Operating EBITDA 681 792 429
Operating EBITDA % 13.9% 14.5% 8.2%
O ti EBITDA
0
1000
2000
3000
Q1 FY2011 Q4 FY2011 Q1 FY2012
Rs.
6.6% Y-o-Y
Depreciation / amortization 213 233 220
Operating EBIT 468 558 209
Operating EBIT % 9.5% 10.2% 4.0%
Other Income / (expense) 24 5 15
I I / ( ) ( ) (43) (34)
Operating EBITDA
681 792
429
13.9% 14.5% 10%
15%
20%
25%
300400500600700800
TDA
Mar
gin
Rs.
Mn 45.8% Q-o-Q
37.0% Y-o-YInterest Income / (expense), net (57) (43) (34)
Amortized (cost ) on fair value of FCCB (30) (35) (35)
Exchange gain / (loss) on Foreign currency loan 3 5 (1)
PBT 407 490 154 Operating EBIT
8.2%
0%
5%
0100200
Q1 FY2011 Q4 FY2011 Q1 FY2012
EBIT 37.0% Y o Y
PBT (% of total income) 8.2% 9.0% 2.9%
Taxes and Minority Interest 86 107 47
PAT 321 383 106
PAT (% of total income) 6.5% 7.0% 2.0%
468558
2099.5% 10.2%
4 0%4%
8%
12%
16%
100
200
300
400
500
600
EBIT
DA
Mar
gin
Rs.
Mn 62.5% Q-o-Q
55.3% Y-o-Y
Firstsource © 2011 | Confidential | August 3, 2011 | 10
Reported Basic EPS (INR) 0.75 0.89 0.25
Reported Diluted EPS (INR) 0.68 0.80 0.25
4.0%0%0
100
Q1 FY2011 Q4 FY2011 Q1 FY2012
E

Agenda
Q1 FY2012 Highlights
Financial Performance – Q1 FY12
Business OutlookBusiness Outlook
Firstsource © 2011 | Confidential | August 3, 2011 | 11

Healthcare
President, Healthcare/
Headed By Key Segments
PayerTom Watters
Geography
Delivery
Revenue
Employees
35%Income from
services (Q1 FY12)
Capacity and Utilization
3,221seats
As on June 30, 2011
CEO, North America
Provider Market
Employees
3,205 As on June 30, 2011
73% Seat fill factor
Q1 FY12 Highlights Industry Trends Business Outlook
Congressional lawmakers continue theirfocus on the entitlementprograms, Medicare and Medicaid
U.S. unemployment rose to 9.2% for the
Q1 FY12 Highlights Industry Trends
Continued execution of Provider Sales strategy, with traction gaining on core products and servicesPayer sales segment remains strong with
Insurers continue strong focus on achievingcompliance with Medical Loss Ratio (MLR)mandates and building capacity forsignificant enrollment increases
Business Outlook
p ysecond consecutive month
Provider sector continues to focus onreturning to pre-recession profitability withincreased M&A activity expected
Payer segment remains concentrated on
new logos being signed, as well as a deeper penetration into existing client base being realizedTechnology enhancements being implemented in support of Centers of
Hospitals looking beyond traditional backoffice structures to address reimbursementpressure and increases in uninsuredpopulation
Expect stable growth with consistentPayer segment remains concentrated onadministrative cost reductions andimplementation of Health InformationExchanges (HIE)
Excellence initiatives Expect stable growth with consistentfinancial performance
Firstsource © 2011 | Confidential | August 3, 2011 | 12
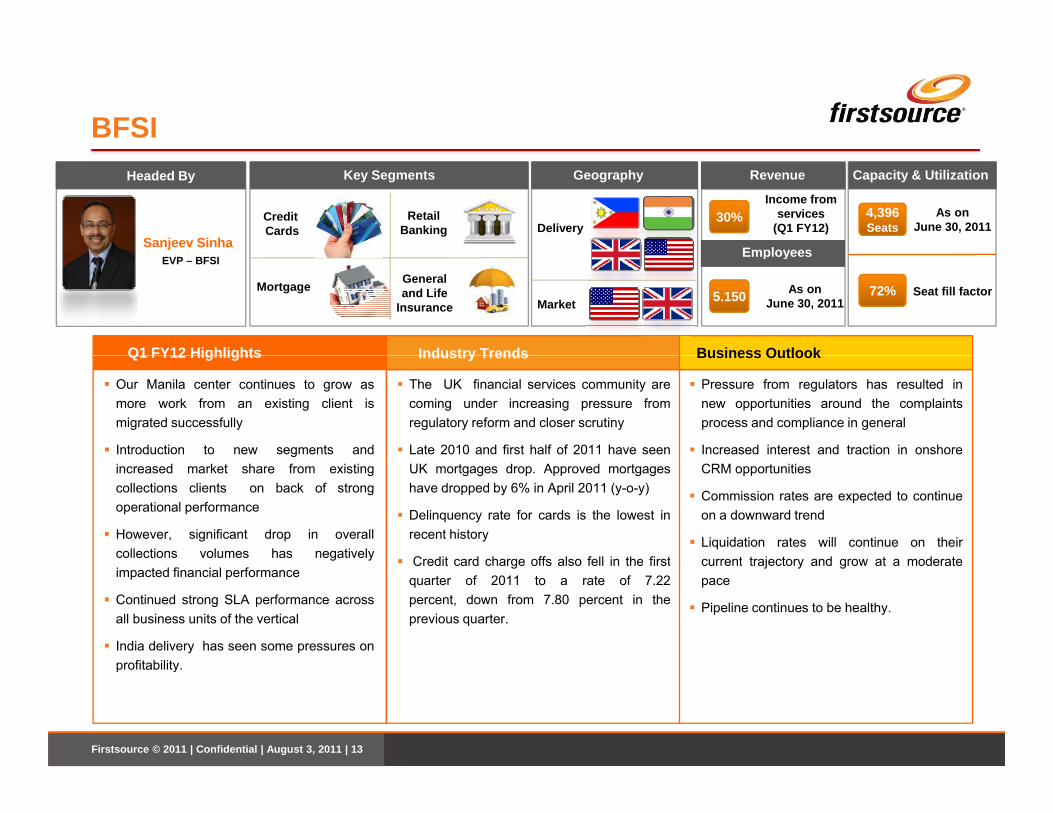
BFSIHeaded By Key Segments
Credit Cards
Sanjeev Sinha
Geography
Delivery
Revenue
Employees
30%Income from
services (Q1 FY12)
Capacity & Utilization
4,396Seats
As on June 30, 2011
RetailBanking
EVP – BFSI
MortgageMarket
Employees
5.150 As on June 30, 2011
72% Seat fill factor
Q1 FY12 Highlights Industry Trends Business Outlook
Generaland Life
Insurance
The UK financial services community arecoming under increasing pressure fromregulatory reform and closer scrutiny
Late 2010 and first half of 2011 have seen
Q1 FY12 Highlights Industry Trends
Our Manila center continues to grow asmore work from an existing client ismigrated successfully
Introduction to new segments and
Business Outlook
Pressure from regulators has resulted innew opportunities around the complaintsprocess and compliance in general
Increased interest and traction in onshoreUK mortgages drop. Approved mortgageshave dropped by 6% in April 2011 (y-o-y)
Delinquency rate for cards is the lowest inrecent history
Credit card charge offs also fell in the first
increased market share from existingcollections clients on back of strongoperational performance
However, significant drop in overallcollections volumes has negatively
CRM opportunities
Commission rates are expected to continueon a downward trend
Liquidation rates will continue on theircurrent trajectory and grow at a moderateCredit card charge offs also fell in the first
quarter of 2011 to a rate of 7.22percent, down from 7.80 percent in theprevious quarter.
g yimpacted financial performance
Continued strong SLA performance acrossall business units of the vertical
India delivery has seen some pressures onprofitability
current trajectory and grow at a moderatepace
Pipeline continues to be healthy.
Firstsource © 2011 | Confidential | August 3, 2011 | 13
profitability.

Telecommunications and Media
EVP –
Headed By Key Segments
Cable & Satellite
TelevisionSantanu Nandiz
Geography
Delivery
Revenue
Employees
23%Income from
services (Q1 FY12)
Capacity & Utilization
5,156Seats
As on June 30, 2011
Broadband /Narrowband
EVP Telecommunications
and MediaWireless &
Mobile
Market
Employees
6,120 As on June 30, 2011
66% Seat fill factor
Q1 FY12 Highlights Industry Trends Business Outlook
FixedLine
• Overall UK ISP market is experiencingslower growth
• Decision cycles among the clients arelonger than expected
Q1 FY12 Highlights Industry Trends
Overall softness in volume combined withramp down in an existing wireless clientimpacted the top line
Won additional business from two clients
• Our volumes in the ISP segment will remainsoft in the near future
• Sharpening competitive advantage throughdifferentiated offering is the focus area
Business Outlook
• Industry is driven by technology ledinnovation like connected homes, touchlesspayment technology, etc.
• Consolidation among the top Telecomplayers in the industry across the
Successful in redeploying the existingemployees from the ramped down clientinto new wins
Capacity consolidation initiative hasresulted in parallel capacity and higher
• Excess capacity and cost of growth of newwins may impact bottom line in the short run
• Emerging opportunity in the premiumtechnical support area
players in the industry across thegeographies
• Web chat emerging as a major channel forboth sales and service
resulted in parallel capacity and highercosts in the interim
Strong pipeline development across allmarkets.
Strengthened the sales team in the UK and
• Strong growth prospects with existing clientsin web chat service line
• The new wins and some of the pipelinebusiness expected to yield revenues fromH2
Firstsource © 2011 | Confidential | August 3, 2011 | 14
the US
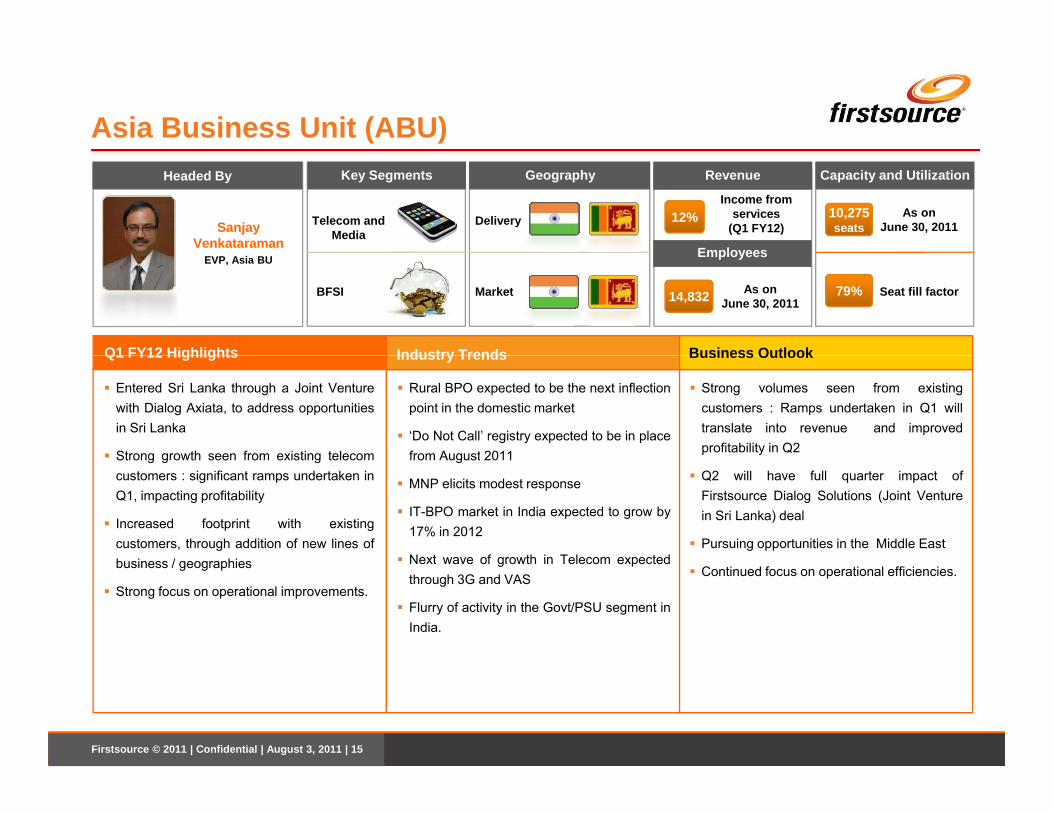
Asia Business Unit (ABU)Headed By Key Segments
Telecom andMediaSanjay
Venkataraman
Geography
Delivery
Revenue
Employees
12%Income from
services (Q1 FY12)
Capacity and Utilization
10,275seats
As on June 30, 2011
EVP, Asia BU
BFSI Market
Employees
14,832 As on June 30, 2011
79% Seat fill factor
Q1 FY12 Highlights Industry Trends Business Outlook
Rural BPO expected to be the next inflectionpoint in the domestic market
‘Do Not Call’ registry expected to be in placefrom August 2011
Q1 FY12 Highlights Industry Trends
Entered Sri Lanka through a Joint Venturewith Dialog Axiata, to address opportunitiesin Sri Lanka
Strong growth seen from existing telecom
Strong volumes seen from existingcustomers : Ramps undertaken in Q1 willtranslate into revenue and improvedprofitability in Q2
Business Outlook
from August 2011
MNP elicits modest response
IT-BPO market in India expected to grow by17% in 2012
Next wave of growth in Telecom expected
Strong growth seen from existing telecomcustomers : significant ramps undertaken inQ1, impacting profitability
Increased footprint with existingcustomers, through addition of new lines ofb i / hi
Q2 will have full quarter impact ofFirstsource Dialog Solutions (Joint Venturein Sri Lanka) deal
Pursuing opportunities in the Middle EastNext wave of growth in Telecom expectedthrough 3G and VAS
Flurry of activity in the Govt/PSU segment inIndia.
business / geographies
Strong focus on operational improvements.Continued focus on operational efficiencies.
Firstsource © 2011 | Confidential | August 3, 2011 | 15

Business OutlookRevenue momentum to improve in H2
Gradual improvement in margins expected from Q1
- Expected changes over next few quarters includeExpected changes over next few quarters include
□ Completion of large scale ramps in ABU
□ Conversion of strong pipeline and commencement of revenues from new wins and ramps in T&M
□ Completion of capacity consolidation initiativesp p y
□ Even stronger focus on operational efficiencies and cost rationalization
- However, we do encounter few industry specific uncertainties and headwinds
□ Declining volumes in BFSI Collections segment
□ Prolonged decision making cycles
- Overall, with revenues expected to grow over the next few quarters, margins will improve from Q1 level
Moving into Q2 FY11
- Expect flattish revenues and margin improvement
Firstsource © 2011 | Confidential | August 3, 2011 | 16

THANK YOUFirstsource (NSE: FSL, BSE: 532809, Reuters: FISO.BO, Bloomberg: FSOL@IN) is aglobal provider of customised BPO (business process outsourcing) services to theBanking and Financial Services, Telecom and Media and Healthcare sectors. Itsclients include FTSE 100, Fortune 500 and Nifty 50 companies. Firstsource has a“rightshore” delivery model with operations in India, US, UK, Philippines and Sri Lanka.(www.firstsource.com)