FIRST QUARTERLY REPORT 30 September...
30
FIRST QUARTERLY REPORT 30 September 2016
Transcript of FIRST QUARTERLY REPORT 30 September...

FIRST QUARTERLY REPORT30 September 2016

1First Quarterly Report
Kohinoor Mills LimitedCompany Information ......................................................................................... 02Directors’ Report ................................................................................................ 04Unconsolidated Condensed Interim Balance Sheet ............................................ 06 Unconsolidated Condensed Interim Profit and Loss Account .............................. 08Unconsolidated Condensed Interim Statement of Comprehensive Income ......... 09Unconsolidated Condensed Interim Cash Flow Statement .................................. 10Unconsolidated Condensed Interim Statement of Changes in Equity .................. 11Selected Notes to the Unconsolidated Condensed Interim Financial Information ..... 12
Kohinoor Mills Limited and its subsidiaryConsolidated Condensed Interim Balance Sheet ................................................ 18 Consolidated Condensed Interim Profit and Loss Account ................................. 20Consolidated Condensed Interim Statement of Comprehensive Income ............. 21Consolidated Condensed Interim Cash Flow Statement ..................................... 22Consolidated Condensed Interim Statement of Changes in Equity ...................... 23Selected Notes to the Consolidated Condensed Interim Financial Information ... 24
CONTENTS

2 Kohinoor Mills Limited
ComPAny InformAtIon
BOard Of dirECTOrSmr. rashid Ahmed Chairmanmr. Aamir fayyaz Sheikh Chief Executivemr. Asad fayyaz Sheikh Directormr. Ali fayyaz Sheikh Directormr. riaz Ahmed Directormr. Aamir Amin Director (nIt nominee)mr. Shahbaz munir Director
audiT COMMiTTEEmr. riaz Ahmed Chairmanmr. rashid Ahmed membermr. Shahbaz munir membermr. Ali fayyaz Sheikh member
HuMaN rESOurCE & rEMuNEraTiON COMMiTTEEmr. rashid Ahmed Chairmanmr. Asad fayyaz Sheikh membermr. Shahbaz munir member
CHiEf fiNaNCiaL OffiCEr Mr. Kamran Shahid
HEad Of iNTErNaL audiTmr. Jamal Asif
LEgaL adviSOrS• raja mohammad Akram & Co., Advocate & Legal Consultants, Lahore.• malik muhammad Ashraf Kumma Advocate
COMpaNy SECrETarymr. muhammad rizwan Khan
audiTOrSm/s. riaz Ahmad & Co.,Chartered Accountants
BaNKErSAllied Bank LimitedAl Baraka Bank (Pakistan) LimitedAskari Bank LimitedBank Alfalah Limitedfaysal Bank LimitedHabib Bank LimitedHabib metropolitan Bank Limitednational Bank of PakistannIB Bank Limited Silk Bank Limited Standard Chartered Bank (Pakistan) Ltdthe Bank of PunjabUnited Bank Limited
rEgiSTErEd OffiCE & MiLLS 8th K.m. manga raiwind road,District Kasur, PakistanUAn: (92-42 ) 111-941-941Cell Lines: (92-333) 4998801-6Land Lines: (92-42) 36369340fax (92-42) 36369340 Ext: 444Email: [email protected] : www.kohinoormills.com
SHarES rEgiSTrarHameed majeed Associates (Pvt.) Ltd, Hm House, 7 Bank Square, Lahore.Land Lines: (92-42) 37235081 & 82 fax: (92-42) 37358817
OTHEr COrpOraTE iNfOrMaTiONKohinoor mills Limited is registered in Pakistan under Companies ordinance, 1984. the registration number of the Company is 0017194
Kohinoor mills Limited is listed on Pakistan Stock Exchange Limited as a Public Limited Company and its shares are traded under textile composite sector. Shares trading symbol is KmL
the national tax number of the Company is 0658184-6
Financial statements are available on website of the Company i.e., www.kohinoormills.com

3First Quarterly Report
financial Statementsfor the quarter ended 30 September 2016

4 Kohinoor Mills Limited
dirECTOrS’ rEpOrT
the Directors of the Company are pleased to present the interim financial statements for the quarter ended 30 September 2016. these interim financial statements are presented in accordance with the requirements of the Companies ordinance, 1984.
Operating & financial results
During the quarter ended 30 September 2016, your company earned a gross profit of rs. 383 million on sales of rs. 2,567 million compared to gross profit of rs. 378 million on sales of rs. 2,162 million for the corresponding period of previous financial year. During the period under review, your company recorded a net profit of rs. 75 million (EPS: rs. 1.48 per share), compared to net profit of rs. 64 million (EPS: rs. 1.25 per share) in the corresponding period.
net profit for the period includes net notional interest expense of rs.28.1 million as per IAS: 39, due to restructuring of financial liabilities of the company in an earlier period and conversion of some of the facilities to SBP Erf scheme to benefit from lower mark-up rates, compared to expense of rs. 57.7 million recognized in the corresponding period. Had there been no such notional adjustment, net profit for the period under review would have been been rs. 103.1 million (EPS: rs. 2.03 per share) and net profit of rs. 121.7 million (EPS: rs. 2.38 per share) for the corresponding period.
Due to rising raw material prices, increasing competition from regional players and challenging demand situation in overseas markets, the profit margin remained under pressure, which was, however, off set through improved production capacity utilization, resulting in largely maintained performance of the company during the period under review compared to corresponding financial period.
Weaving division
owing to increased overseas competition and rising raw material prices, the performance in this division was not as per expectation during the period under review. management is making efforts to enhance export performance and profitability in this division for the remaining part of the year.
dyeing division
this division improved its performance and exceeded the set targets of the corresponding period, attaining new levels of capacity utilization. Being the flagship division of the Company, its better performance in remaining part of the year is expected to result in improved overall results for the Company.
genertek division
Although overall energy costs did not escalate during the period under review, however, recent rise in coal and Hfo prices remain a cause of concern, going forward..
Q Mart Corporation (pvt) Ltd (a wholly owned subsidiary of your company)
the company, in line with its decision to focus on its core fabric business, decided to pull out of retail business during an earlier financial year and accordingly shut-down all its Q-mart retails stores. the management is currently in the process of disposing of the fixed assets of this company.

5First Quarterly Report
future prospects
Despite challenging macro-economic scenario emanating from uncertain security and political environment, increasing competition from regional players, sluggish overseas demand and continuous fall recorded in textile exports from Pakistan over past several years, the management has kept its resolve for performance improvement through better marketing by winning customer confidence and improved capacity utilization and better supply chain management to keep costs low. the current order book position of the company is healthy and the management is optimistic that it can improve on the company’s performance.
acknowledgment
the board places on record its profound gratitude for its valued shareholders, banks, financial institutions and customers, whose cooperation, continued support and patronage have enabled the company to strive for constant improvement. During the period under review, relations between the management and employees remained cordial and we wish to place on record our appreciation for the dedication, perseverance and diligence of the employees of the company.
For and on behalf of the Board
Kasur: aaMir fayyaZ SHEiKH24 october 2016 Chief Executive

6 Kohinoor Mills Limited
un-audited audited 30 September 30 June Note 2016 2016 rupees rupeesEQuiTy aNd LiaBiLiTiES SHarE CapiTaL aNd rESErvES authorized share capital 80,000,000 (30 June 2016: 80,000,000) ordinary shares of rupees 10 each 800,000,000 800,000,000 30,000,000 (30 June 2016: 30,000,000) preference shares of rupees 10 each 300,000,000 300,000,000
1,100,000,000 1,100,000,000 Issued, subscribed and paid-up share capital 50,911,011 (30 June 2016: 50,911,011) ordinary shares of rupees 10 each 509,110,110 509,110,110 reserves 438,586,093 358,240,114 total equity 947,696,203 867,350,224 Surplus on revaluation of operating fixed assets - net of deferred income tax 1,075,883,608 1,081,449,031 LIABILItIES non-current liabilities Long term financing - secured 5 802,215,683 735,286,694 Deferred liabilities 206,211,414 194,599,666 1,008,427,097 929,886,360 Current liabilities trade and other payables 859,445,969 853,749,084 Accrued mark-up 199,029,971 194,483,901 Sponsor’s loan 6 272,000,000 272,000,000 Short term borrowings - secured 2,046,565,001 1,917,369,966 Current portion of long term financing 5 80,921,813 163,323,416 Provision for taxation 25,321,891 73,303,245 3,483,284,645 3,474,229,612
total liabilities 4,491,711,742 4,404,115,972
Contingencies and commitments 7 totAL EQUIty AnD LIABILItIES 6,515,291,553 6,352,915,227 the annexed notes form an integral part of this unconsolidated condensed interim financial information.
uNCONSOLidaTEd CONdENSEd iNTEriM BaLaNCE SHEETAS At 30 SEPtEmBEr 2016
AAmIr fAyyAZ SHEIKH Chief Executive
7First Quarterly Report
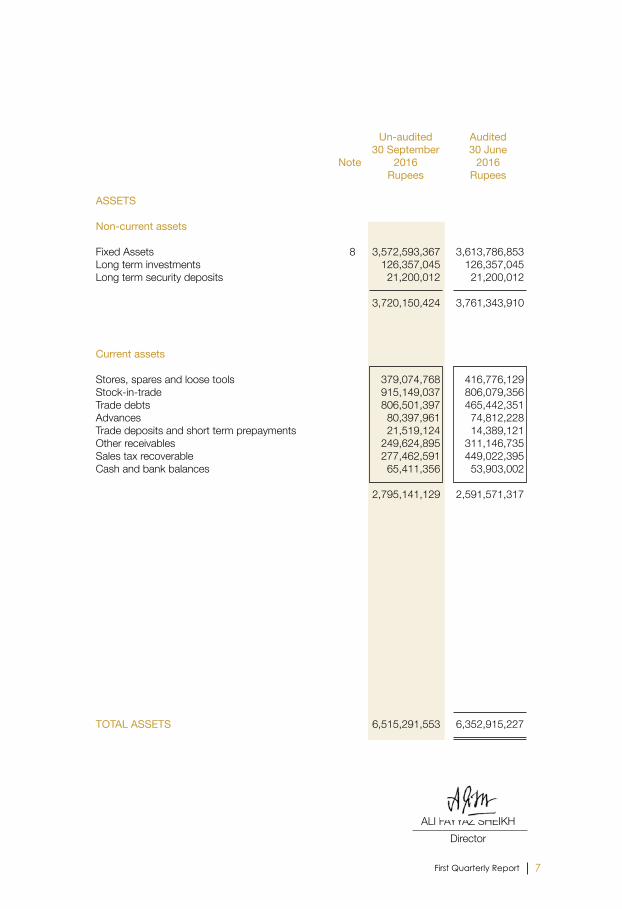
un-audited audited 30 September 30 June Note 2016 2016 rupees rupees aSSETS Non-current assets fixed Assets 8 3,572,593,367 3,613,786,853 Long term investments 126,357,045 126,357,045 Long term security deposits 21,200,012 21,200,012
3,720,150,424 3,761,343,910
Current assets Stores, spares and loose tools 379,074,768 416,776,129 Stock-in-trade 915,149,037 806,079,356 trade debts 806,501,397 465,442,351 Advances 80,397,961 74,812,228 trade deposits and short term prepayments 21,519,124 14,389,121 other receivables 249,624,895 311,146,735 Sales tax recoverable 277,462,591 449,022,395 Cash and bank balances 65,411,356 53,903,002
2,795,141,129 2,591,571,317 TOTaL aSSETS 6,515,291,553 6,352,915,227
ALI fAyyAZ SHEIKH Director

8 Kohinoor Mills Limited
uNCONSOLidaTEd CONdENSEd iNTEriM prOfiT aNd LOSS aCCOuNT (Un-audited) for tHE QUArtEr EnDED 30 SEPtEmBEr 2016
30 September 30 September Note 2016 2015 rupees rupees SALES 2,566,753,261 2,161,638,035 CoSt of SALES 9 (2,183,521,161) (1,784,097,750) GroSS ProfIt 383,232,100 377,540,285 DIStrIBUtIon CoSt (123,749,409) (121,439,114)ADmInIStrAtIVE EXPEnSES (68,131,779) (58,825,503)otHEr EXPEnSES (17,768,087) (10,310,300)
(209,649,275) (190,574,917)
173,582,825 186,965,368 otHEr InComE 6,011,085 8,409,356
ProfIt from oPErAtIonS 179,593,910 195,374,724 fInAnCE CoSt (79,146,428) (110,277,646) ProfIt BEforE tAXAtIon 100,447,482 85,097,078 tAXAtIon (25,321,891) (21,428,764)
ProfIt AftEr tAXAtIon 75,125,591 63,668,314
EArnInGS PEr SHArE - BASIC AnD DILUtED 1.48 1.25 the annexed notes form an integral part of this unconsolidated condensed interim financial information.
AAmIr fAyyAZ SHEIKH ALI fAyyAZ SHEIKH Chief Executive Director

9First Quarterly Report
uNCONSOLidaTEd CONdENSEd iNTEriM STaTEMENT Of COMprEHENSivE iNCOME (Un-audited) for tHE QUArtEr EnDED 30 SEPtEmBEr 2016
30 September 30 September 2016 2015 rupees rupees
prOfiT afTEr TaXaTiON 75,125,591 63,668,314 other comprehensive income - - TOTaL COMprEHENSivE iNCOME fOr THE pEriOd 75,125,591 63,668,314 the annexed notes form an integral part of this unconsolidated condensed interim financial information.
AAmIr fAyyAZ SHEIKH ALI fAyyAZ SHEIKH Chief Executive Director

10 Kohinoor Mills Limited
uNCONSOLidaTEd CONdENSEd iNTEriM CaSH fLOW STaTEMENT (Un-audited)for tHE QUArtEr EnDED 30 SEPtEmBEr 2016 30 September 30 September 2016 2015 rupees rupeesCaSH fLOWS frOM OpEraTiNg aCTiviTiES Profit before taxation 100,447,482 85,097,078 adjustments for non-cash charges and other items: Depreciation on operating fixed assets 50,987,547 54,022,724 Loss on sale of operating fixed assets 304,029 - Impairment loss on investment in subsidiary company 1,200,720 1,705,362 Adjustment due to impact of IAS - 39 28,111,971 57,691,392 finance cost 51,034,457 52,586,254 CaSH fLOWS frOM OpEraTiNg aCTiviTiES BEfOrE adJuSTMENT Of WOrKiNg CapiTaL CHaNgES 232,086,206 251,102,810 (increase) / decrease in current assets Stores, spares and loose tools 37,701,361 10,170,881 Stock-in-trade (109,069,681) (62,075,826)trade debts (341,059,046) (50,242,684)Advances (5,585,733) (1,645,416)trade deposits and short term prepayments (7,130,003) (7,647,995)other receivables 1,158,108 (25,915,573)Sales tax recoverable 171,559,804 47,094,376 increase / (decrease) in current liabilities trade and other payables 5,696,885 (3,630,483) EffECT ON CaSH fLOWS duE TO WOrKiNg CapiTaL CHaNgES (246,728,305) (93,892,720) CaSH (uSEd iN) / gENEraTEd frOM OpEraTiONS (14,642,099) 157,210,090 Income tax paid (14,485,267) (13,858,382)net decrease in long term security deposits - (246,810)finance cost paid (34,876,640) (40,973,903) (49,361,907) (55,079,095) NET CaSH (uSEd iN)/gENEraTEd frOM OpEraTiNg aCTiviTiES (64,004,006) 102,130,995 CaSH fLOWS frOM iNvESTiNg aCTiviTiES Capital expenditure on property, plant and equipment (11,828,397) (14,499,747)Proceeds from sale of operating fixed assets 1,730,307 - NET CaSH uSEd iN iNvESTiNg aCTiviTiES (10,098,090) (14,499,747) CaSH fLOWS frOM fiNaNCiNg aCTiviTiES Long term financing - net (43,584,585) (65,313,406)Short term borrowings - net 129,195,035 (19,971,313) NET CaSH gENEraTEd frOM / (uSEd iN) fiNaNCiNg aCTiviTiES 85,610,450 (85,284,719) NET iNCrEaSE iN CaSH aNd CaSH EQuivaLENTS 11,508,354 2,346,529 CaSH aNd CaSH EQuivaLENTS aT THE BEgiNNiNg Of THE pEriOd 53,903,002 112,292,072 CaSH aNd CaSH EQuivaLENTS aT THE ENd Of THE pEriOd 65,411,356 114,638,601
the annexed notes form an integral part of this unconsolidated condensed interim financial information.
AAmIr fAyyAZ SHEIKH ALI fAyyAZ SHEIKH Chief Executive Director

11First Quarterly Report
uN
CO
NSO
Lida
TEd
CO
NdE
NSE
d iN
TEri
M S
TaTE
MEN
T O
f C
HaN
gES
iN E
Qu
iTy
(Un-
audi
ted)
for
tHE
QUA
rtEr
EnD
ED 3
0 SE
PtEm
BEr
2016
Bala
nce
as a
t 01
July
201
5 - (
audi
ted)
5
09,1
10,1
10
213
,406
,310
1
18,7
92,1
95
332
,198
,505
1,0
58,0
27,6
40
(1,0
93,4
83,5
18)
(35,
455,
878)
7
5,14
4,63
1
371
,887
,258
8
80,9
97,3
68
tran
sfer
red
from
sur
plus
on
reva
luat
ion
of o
pera
ting
fix
ed a
sset
s in
resp
ect o
f inc
rem
enta
l dep
recia
tion
- n
et o
f def
erre
d in
com
e ta
x -
-
-
-
-
5
,483
,429
5
,483
,429
-
5
,483
,429
5
,483
,429
Ad
just
men
t due
to c
hang
e in
repa
ymen
t ter
m o
f
spon
sor’s
loan
-
-
-
-
-
-
-
(5
,600
,535
) (5
,600
,535
) (5
,600
,535
)
Pr
ofit f
or th
e pe
riod
-
-
-
-
-
63,
668,
314
6
3,66
8,31
4
-
63,
668,
314
6
3,66
8,31
4 o
ther
com
preh
ensiv
e in
com
e fo
r the
per
iod
-
-
-
-
-
-
-
-
-
-
tota
l com
preh
ensiv
e in
com
e fo
r the
per
iod
-
-
-
-
-
63,
668,
314
6
3,66
8,31
4
-
63,
668,
314
6
3,66
8,31
4
Ba
lanc
e as
at 3
0 Se
ptem
ber 2
015
- (u
n-au
dite
d)
509
,110
,110
2
13,4
06,3
10
118
,792
,195
3
32,1
98,5
05 1
,058
,027
,640
(1
,024
,331
,775
) 3
3,69
5,86
5
69,
544,
096
4
35,4
38,4
66
944
,548
,576
tr
ansf
erre
d fro
m s
urpl
us o
n re
valu
atio
n of
ope
ratin
g
fixed
ass
ets
in re
spec
t of i
ncre
men
tal d
epre
ciatio
n
- net
of d
efer
red
inco
me
tax
-
-
-
-
-
16,
450,
285
1
6,45
0,28
5
-
16,
450,
285
1
6,45
0,28
5
Ad
just
men
t due
to c
hang
e in
repa
ymen
t ter
m o
f
spon
sor’s
loan
-
- -
- -
-
-
(69,
544,
096)
(6
9,54
4,09
6)
(69,
544,
096)
Profi
t for
the
perio
d -
-
-
-
-
5
5,16
4,06
2
55,
164,
062
-
5
5,16
4,06
2
55,
164,
062
oth
er c
ompr
ehen
sive
loss
for t
he p
erio
d -
-
(7
9,26
8,60
3)
(79,
268,
603)
-
-
-
-
(7
9,26
8,60
3)
(79,
268,
603)
tota
l com
preh
ensiv
e lo
ss fo
r the
per
iod
-
-
(79,
268,
603)
(7
9,26
8,60
3)
-
55,
164,
062
5
5,16
4,06
2
-
(24,
104,
541)
(2
4,10
4,54
1)
Ba
lanc
e as
at 3
0 Ju
ne 2
016
- (au
dite
d)
509
,110
,110
2
13,4
06,3
10
39,
523,
592
25
2,92
9,90
2 1
,058
,027
,640
(9
52,7
17,4
28)
105
,310
,212
-
3
58,2
40,1
14
867
,350
,224
tr
ansf
erre
d fro
m s
urpl
us o
n re
valu
atio
n of
ope
ratin
g
fixed
ass
ets
in re
spec
t of i
ncre
men
tal d
epre
ciatio
n
- net
of d
efer
red
inco
me
tax
-
-
-
-
-
5,2
20,3
88
5,2
20,3
88
-
5,2
20,3
88
5,2
20,3
88
Adju
stm
ent d
ue to
cha
nge
in re
paym
ent t
erm
s of
spon
sor’s
loan
-
-
-
-
-
-
-
-
-
-
Pr
ofit f
or th
e pe
riod
-
-
-
-
-
75,
125,
591
7
5,12
5,59
1
-
75,
125,
591
7
5,12
5,59
1 o
ther
com
preh
ensiv
e in
com
e fo
r the
per
iod
-
-
-
-
-
-
-
-
-
- to
tal c
ompr
ehen
sive
inco
me
for t
he p
erio
d -
-
-
-
-
7
5,12
5,59
1
75,
125,
591
-
7
5,12
5,59
1
75,
125,
591
Bala
nce
as a
t 30
Sept
embe
r 201
6 - (
un-
audi
ted)
5
09,1
10,1
10
213
,406
,310
3
9,52
3,59
2
252,
929,
902
1,0
58,0
27,6
40
(872
,371
,449
) 1
85,6
56,1
91
-
438
,586
,093
9
47,6
96,2
03
the
anne
xed
note
s fo
rm a
n in
tegr
al pa
rt of
this
unco
nsol
idat
ed c
onde
nsed
inte
rim fi
nanc
ial in
form
atio
n.
SHar
E C
apiT
aLfa
ir va
lue
rese
rve
Shar
epr
emiu
mre
serv
eSu
b-to
tal
gen
eral
rese
rve
accu
mul
ated
loss
Tota
lre
serv
es
Equi
ty
porti
on o
f sp
onso
r’s
loan
TOTa
LEQ
uiT
ySu
b-to
tal
Cap
iTaL
rES
ErvE
SrE
vEN
uE
rESE
rvES
rESE
rvES
----
----
----
----
----
----
----
----
----
----
----
----
----
---(r
upee
s)--
----
----
----
----
----
----
----
----
----
----
----
----
----
---
AAm
Ir f
AyyA
Z SH
EIKH
AL
I fAy
yAZ
SHEI
KH
Chief
Exe
cutiv
e
Dire
ctor

12 Kohinoor Mills Limited
SELECTEd NOTES TO THE uNCONSOLidaTEd CONdENSEd iNTEriM fiNaNCiaL iNfOrMaTiON (Un-audited)for tHE QUArtEr EnDED 30 SEPtEmBEr 2016
1. THE COMpaNy aNd iTS OpEraTiONS Kohinoor mills Limited (“the Company”) is a public limited company incorporated on 21
December 1987 in Pakistan under the Companies ordinance, 1984 and its shares are quoted on Pakistan Stock Exchange Limited. the registered office of the Company is situated at 8-K.m., manga raiwind road, District Kasur. the Company is principally engaged in the business of textile manufacturing covering weaving, bleaching, dyeing, buying, selling and otherwise dealing in yarn, cloth and other goods and fabrics made from raw cotton and synthetic fiber and to generate, and supply electricity.
2. BaSiS Of prEparaTiON this unconsolidated condensed interim financial information is un-audited and is being
submitted to shareholders as required by section 245 of the Companies ordinance, 1984. this unconsolidated condensed interim financial information of the Company for the quarter ended 30 September 2016 has been prepared in accordance with the requirements of International Accounting Standard (IAS) 34 “Interim financial reporting” and provisions of and directives issued under the Companies ordinance, 1984. In case where requirements differ, the provisions of or directives issued under the Companies ordinance, 1984 have been followed. this unconsolidated condensed interim financial information should be read in conjunction with the audited annual published financial statements for the year ended 30 June 2016.
3. aCCOuNTiNg pOLiCiES the accounting policies and methods of computations adopted for the preparation of this
unconsolidated condensed interim financial information are the same as applied in the preparation of the preceding audited annual published financial statements of the Company for the year ended 30 June 2016.
4. CriTiCaL aCCOuNTiNg ESTiMaTES aNd JudgMENTS the preparation of this unconsolidated condensed interim financial information in conformity
with the approved accounting standards requires the use of certain critical accounting estimates. It also requires the management to exercise its judgment in the process of applying the Company’s accounting policies. Estimates and judgments are continually evaluated and are based on historical experience and other factors, including expectations of future events that are believed to be reasonable under the circumstances.
During preparation of this unconsolidated condensed interim financial information, the
significant judgments made by the management in applying the Company’s accounting policies and the key sources of estimation and uncertainty were the same as those that applied in the preceding audited annual published financial statements of the Company for the year ended 30 June 2016.

13First Quarterly Report
un-audited audited 30 September 30 June 2016 2016 rupees rupees5. LONg TErM fiNaNCiNg -SECurEd opening balance 898,610,110 1,811,907,803 Add : Adjustment due to impact of IAS - 39 28,111,971 241,522,253 Less: repaid / adjusted during the period / year 43,584,585 1,154,819,946 883,137,496 898,610,110 Less: Current portion shown under current liabilities 80,921,813 163,323,416
802,215,683 735,286,694
6. SpONSOr’S LOaN Interest free loan 272,000,000 272,000,000 Equity portion of sponsor loan: Gain on recognition of sponsor’s loan at fair value - (113,316,111) Adjustment due to impact of IAS-39 - 38,171,480 Adjustment due to change in repayment terms - 75,144,631 - - Less: transferred to current liabilities 272,000,000 272,000,000 - - 7. CONTiNgENCiES aNd COMMiTMENTS 7.1 Contingencies there is no significant change in the status of contingencies as reported in the preceding audited
annual published financial statements of the Company for the year ended 30 June 2016. 7.2 Commitments (i) Aggregate commitments for capital expenditures and revenue expenditures are
amounting to rupees 59.141 million and rupees 10.138 million (30 June 2016: rupees 19.554 million and rupees 26.033 million) respectively.
(ii) Post dated cheques issued to suppliers are amounting to rupees 196.353 million (30 June 2016: rupees 168.214 million).
8. fiXEd aSSETS property, plant and equipment operating fixed assets (note 8.1) 3,541,265,567 3,585,296,846 Capital work-in-progress (note 8.2) 31,327,800 28,490,007
3,572,593,367 3,613,786,853 intangible asset - computer software (Note 8.3) - -
3,572,593,367 3,613,786,853

14 Kohinoor Mills Limited
un-audited audited 30 September 30 June 2016 2016 rupees rupees8.1 Operatingfixedassets opening net book value 3,585,296,846 3,663,368,205 Add: Cost of additions during the period / year (note 8.1.1) 8,990,603 187,015,996
3,594,287,449 3,850,384,201 Less: Book value of deletions during the period / year (note 8.1.2) 2,034,336 46,930,477 Depreciation charged during the period / year 50,987,546 218,156,878 Closing net book value 3,541,265,567 3,585,296,846 8.1.1 Cost of additions factory Building 3,552,167 31,740,020 Plant and machinery 498,874 126,099,656 Electric installations 308,990 2,757,538 furniture, fixtures and equipments 7,808 1,454,139 Computers 157,174 4,474,877 motor Vehicles 4,465,590 20,489,766 8,990,603 187,015,996 8.1.2 Book value of deletions Plant and machinery 2,034,336 21,989,041 furniture, fixtures and equipment - 36,815 Computers - 19,289 motor Vehicles - 24,885,332
2,034,336 46,930,477 8.2 Capital work-in-progress Plant and machinery 27,082,337 20,345,577 Advances for Capital expenditures 4,245,463 8,144,430
31,327,800 28,490,007
8.3 Intangible asset - computer software has been fully amortized but still in the use of the Company.

15First Quarterly Report
un-audited un-audited 30 September 30 September 2016 2015 rupees rupees9. COST Of SaLES raw material consumed 1,677,288,449 1,221,380,736 Chemicals consumed 202,769,835 182,190,247 Salaries, wages and other benefits 106,010,941 92,764,499 Employee’s provident fund contributions 3,546,246 3,239,230 Cloth conversion and processing charges 20,462,632 15,648,556 fuel, oil and power 180,373,672 178,320,932 Stores, spares and loose tools 42,092,863 33,200,740 Packing material 17,386,519 14,727,930 repair and maintenance 7,279,041 8,984,067 Insurance 1,990,264 1,862,889 other manufacturing expenses 13,703,616 19,836,705 Depreciation on operating fixed assets 47,253,051 51,588,953
2,320,157,129 1,823,745,484 Work-in-process inventory opening stock 136,625,320 143,336,567 Closing stock (253,330,135) (225,891,090)
(116,704,815) (82,554,523)
Cost of goods manufactured 2,203,452,314 1,741,190,961 Cost of yarn and cloth purchased for resale 1,227,947 5,586,603
2,204,680,261 1,746,777,564 finished goods inventory opening stock 472,334,811 446,680,689 Closing stock (493,493,911) (409,360,503)
(21,159,100) 37,320,186
2,183,521,161 1,784,097,750
10. TraNSaCTiONS WiTH rELaTEd parTiES related parties comprise of subsidiary company, other related parties, key management
personnel and provident fund trust. the Company in the normal course of business carries out transactions with related parties. Detail of transactions with related parties are as follows:
un-audited un-audited 30 September 30 September 2016 2015 rupees rupees
remuneration paid to Chief Executive, Directors and Executives 16,281,690 23,250,158 Contribution to employees’ provident fund trust 4,966,904 4,554,462

16 Kohinoor Mills Limited
11. aNaLySiS By SEgMENT (un-audited) 11.1 Operating Segment Quarter ended 30 September 2016 Weaving dyeing power Total- generation Company rupees rupees rupees rupees
total Sale 971,882,998 1,940,820,261 176,207,954 3,088,911,213 Intersegment Sale (327,680,971) (18,269,027) (176,207,954) (522,157,952)
External Sale 644,202,027 1,922,551,234 - 2,566,753,261 Profit / (loss) before taxation and unallocated income / expense 18,245,562 175,177,386 (2,072,036) 191,350,912 other income and expense-net (11,757,002) Profit from operations 179,593,910 finance Cost (79,146,428) taxation (25,321,891) Profit after taxation 75,125,591 Quarter ended 30 September 2015 total Sale 933,990,587 1,681,269,277 195,038,756 2,810,298,620 Intersegment Sale (441,848,815) (11,773,015) (195,038,756) (648,660,586)
External Sale 492,141,772 1,669,496,262 - 2,161,638,034 Profit / (loss) before taxation and unallocated income / expense 20,848,689 179,968,028 (3,541,049) 197,275,668 other income and expense-net (1,900,944) Profit from operations 195,374,724 finance Cost (110,277,646) taxation (21,428,764)
Profit after taxation 63,668,314 11.2 there is no material change in segment assets from amount disclosed in preceding audited
annual published financial statements.
12. fiNaNCiaL riSK MaNagEMENT the Company’s financial risk management objectives and policies are consistent with those
disclosed in the preceding audited annual published financial statements of the Company for the year ended 30 June 2016.
13. auTHOriZEd fOr iSSuE this unconsolidated condensed interim financial information was authorized for issue on
24 October 2016 by the Board of Directors of the Company. 14. COrrESpONdiNg figurES Corresponding figures have been rearranged / regrouped, wherever necessary, for the
purpose of comparison. However, no significant rearrangements / regroupings have been made in these financial statements.
AAmIr fAyyAZ SHEIKH ALI fAyyAZ SHEIKH Chief Executive Director

17First Quarterly Report
ConsolidatedFinancial StatementsFor the quarter ended 30 September 2016

18 Kohinoor Mills Limited and its Subsidiary
Un-audited Audited 30 September 30 June Note 2016 2016 Rupees RupeesEQUITY AND LIABILITIES SHARE CAPITAL AND RESERVES Authorized share capital 80,000,000 (30 June 2016: 80,000,000) ordinary shares of Rupees 10 each 800,000,000 800,000,000 30,000,000 (30 June 2016: 30,000,000) preference shares of Rupees 10 each 300,000,000 300,000,000 1,100,000,000 1,100,000,000 Issued, subscribed and paid-up share capital 50,911,011 (30 June 2016: 50,911,011) ordinary shares of Rupees 10 each 509,110,110 509,110,110 Reserves 440,386,579 359,848,146
Total equity 949,496,689 868,958,256 Surplus on revaluation of operating fixed assets - net of deferred income tax 1,104,782,953 1,110,540,847 LIABILITIES Non-current liabilities Long term financing - secured 5 802,215,683 735,286,694 Deferred liabilities 206,211,414 194,599,666 1,008,427,097 929,886,360 Current liabilities Trade and other payables 860,532,063 854,276,002 Loan from director 11,000,000 11,000,000 Sponsor’s loan 6 272,000,000 272,000,000 Accrued markup 199,029,971 194,483,901 Short term borrowings - secured 2,046,565,001 1,917,369,966 Current portion of long term financing 5 80,921,813 163,323,416 Provision for taxation 25,321,891 73,303,245 3,495,370,739 3,485,756,530 Total liabilities 4,503,797,836 4,415,642,890 Contingencies and commitments 7
TOTAL EQUITY AND LIABILITIES 6,558,077,478 6,395,141,993
The annexed notes form an integral part of this consolidated condensed interim financial information.
CONSOLIDATED CONDENSED INTERIM BALANCE SHEETAS AT 30 SePTembeR 2016
AAmIR FAYYAZ SHeIKH Chief executive

19First Quarterly Report
Un-audited Audited 30 September 30 June Note 2016 2016 Rupees Rupees ASSETS Non-current assets Fixed Assets 8 3,686,704,799 3,728,919,899 Long term investments 53,808,735 52,200,708 Long term security deposits 21,200,012 21,200,012
3,761,713,546 3,802,320,619
Current assets Stores, spares and loose tools 379,074,768 416,776,129 Stock-in-trade 915,149,037 806,079,356 Trade debts 806,501,397 465,442,351 Advances 80,397,961 74,812,228 Trade deposits and short term prepayments 21,550,660 14,447,911 Other receivables 250,736,102 312,257,942 Sales tax recoverable 277,462,591 449,022,395 Cash and bank balances 65,491,416 53,983,062
2,796,363,932 2,592,821,374 TOTAL ASSETS 6,558,077,478 6,395,141,993
ALI FAYYAZ SHeIKH Director

20 Kohinoor Mills Limited and its Subsidiary
CONSOLIDATED CONDENSED INTERIM PROFIT AND LOSS ACCOUNT (Un-audited) FOR THe quARTeR eNDeD 30 SePTembeR 2016
30 September 30 September 2016 2015 Rupees Rupees SALeS 2,566,753,261 2,161,638,035 COST OF SALeS (2,183,521,161) (1,784,097,750) GROSS PROFIT 383,232,100 377,540,285 DISTRIbuTION COST (123,749,409) (121,439,114)ADmINISTRATIVe eXPeNSeS (69,332,499) (60,530,865)OTHeR OPeRATING eXPeNSeS (16,567,367) (8,604,938)
(209,649,275) (190,574,917)
173,582,825 186,965,368 OTHeR INCOme 6,011,085 8,409,356
PROFIT FROm OPeRATIONS 179,593,910 195,374,724 FINANCe COST (79,146,428) (110,277,646) PROFIT beFORe TAXATION 100,447,482 85,097,078 TAXATION (25,321,891) (21,428,764) PROFIT AFTeR TAXATION 75,125,591 63,668,314
EARNING PER SHARE - BASIC AND DILUTED 1.48 1.25
The annexed notes form an integral part of this consolidated condensed interim financial information.
AAmIR FAYYAZ SHeIKH ALI FAYYAZ SHeIKH Chief executive Director

21First Quarterly Report
CONSOLIDATED CONDENSED INTERIM STATEMENT OF COMPREHENSIVE INCOME (Un-audited) FOR THe quARTeR eNDeD 30 SePTembeR 2016
30 September 30 September 2016 2015 Rupees Rupees
PROFIT AFTER TAXATION 75,125,591 63,668,314 Other comprehensive income - - TOTAL COMPREHENSIVE INCOME FOR THE PERIOD 75,125,591 63,668,314 The annexed notes form an integral part of this consolidated condensed interim financial information.
AAmIR FAYYAZ SHeIKH ALI FAYYAZ SHeIKH Chief executive Director

22 Kohinoor Mills Limited and its Subsidiary
CONSOLIDATED CONDENSED INTERIM CASH FLOW STATEMENT (Un-audited)FOR THe quARTeR eNDeD 30 SePTembeR 2016 30 September 30 September 2016 2015 Rupees RupeesCASH FLOWS FROM OPERATING ACTIVITIES Profit before taxation 100,447,482 85,097,078 Adjustments for non-cash charges and other items: Depreciation on operating fixed assets 52,009,147 55,098,093 Gain on sale of operating fixed assets 304,029 - Adjustment due to impact of IAS - 39 28,111,971 57,691,392 Finance cost 51,034,457 52,586,254 CASH FLOWS FROM OPERATING ACTIVITIES BEFORE ADJUSTMENT OF WORKING CAPITAL CHANGES 231,907,086 250,472,817 (Increase) / decrease in current assets Stores, spares and loose tools 37,701,361 10,170,881 Stock-in-trade (109,069,681) (62,075,826)Trade debts (341,059,046) (50,242,684)Advances (5,585,733) (1,645,416)Trade deposits and short term prepayments (7,102,747) (7,647,995)Other receivables 2,358,828 (25,285,580)Sales tax recoverable 171,559,804 47,094,376 Increase / (decrease) in current liabilities Trade and other payables 4,648,029 (3,630,483) EFFECT ON CASH FLOWS DUE TO WORKING CAPITAL CHANGES (246,549,185) (93,262,727) CASH (USED IN) / GENERATED FROM OPERATIONS (14,642,099) 157,210,090 Income tax paid (14,485,267) (13,858,382)Net decrease in long term security deposits - (246,810)Finance cost paid (34,876,640) (40,973,903) (49,361,907) (55,079,095)NET CASH (USED IN) /GENERATED FROM OPERATING ACTIVITIES (64,004,006) 102,130,995 CASH FLOWS FROM INVESTING ACTIVITIES Capital expenditure on property, plant and equipment (11,828,397) (14,499,747)Proceeds from sale of operating fixed assets 1,730,307 - NET CASH USED IN INVESTING ACTIVITIES (10,098,090) (14,499,747) CASH FLOWS FROM FINANCING ACTIVITIES Long term financing - net (43,584,585) (65,313,406)Short term borrowings - net 129,195,035 (19,971,313) NET CASH GENERATED FROM / (USED IN) FINANCING ACTIVITIES 85,610,450 (85,284,719) NET INCREASE IN CASH AND CASH EQUIVALENTS 11,508,354 2,346,529 CASH AND CASH EQUIVALENTS AT THE BEGINNING OF THE PERIOD 53,983,062 112,377,211 CASH AND CASH EQUIVALENTS AT THE END OF THE PERIOD 65,491,416 114,723,740
The annexed notes form an integral part of this consolidated condensed interim financial information.
AAmIR FAYYAZ SHeIKH ALI FAYYAZ SHeIKH Chief executive Director

23First Quarterly Report
CO
NSO
LIDA
TED
CO
NDE
NSE
D IN
TERI
M S
TATE
MEN
T O
F C
HAN
GES
IN E
QU
ITY
(Un-
audi
ted)
FOR
THe
quA
RTeR
eND
eD 3
0 Se
PTem
beR
2016
Bala
nce
as a
t 01
July
201
5 - (
audi
ted)
5
09,1
10,1
10
213
,406
,310
1
18,7
92,1
95
332,
198,
505
1,0
58,0
27,6
40
(1,0
93,4
83,5
18)
(35,
455,
878)
7
5,14
4,63
1
371,
887,
258
88
0,99
7,36
8
Tr
ansf
erre
d fro
m s
urpl
us o
n re
valu
atio
n of
ope
ratin
g
fixed
ass
ets
in re
spec
t of i
ncre
men
tal d
epre
ciatio
n
- net
of d
efer
red
inco
me
tax
-
-
-
-
-
5,4
83,4
29
5,4
83,4
29
-
5,4
83,4
29
5,4
83,4
29
Adju
stm
ent d
ue to
cha
nge
in re
paym
ent t
erm
of s
pons
or’s
loan
-
-
-
-
-
-
-
(5
,600
,535
) (5
,600
,535
) (5
,600
,535
)
Pr
ofit f
or th
e pe
riod
-
-
-
-
-
63,
668,
314
6
3,66
8,31
4
-
63,
668,
314
6
3,66
8,31
4 O
ther
com
preh
ensiv
e in
com
e fo
r the
per
iod
-
-
-
-
-
-
-
-
-
-
Tota
l com
preh
ensiv
e in
com
e fo
r the
per
iod
-
-
-
-
-
6
3,66
8,31
4
63,
668,
314
-
6
3,66
8,31
4
63,
668,
314
Bala
nce
as a
t 30
Sept
embe
r 201
5 - (
Un-
audi
ted)
5
09,1
10,1
10
213
,406
,310
1
18,7
92,1
95
332,
198,
505
1,0
58,0
27,6
40
(1,0
24,3
31,7
75)
33,
695,
865
6
9,54
4,09
6
435,
438,
466
94
4,54
8,57
6
Tr
ansf
erre
d fro
m s
urpl
us o
n re
valu
atio
n of
ope
ratin
g
fixed
ass
ets
in re
spec
t of i
ncre
men
tal d
epre
ciatio
n
- net
of d
efer
red
inco
me
tax
-
-
-
-
-
17,
248,
874
1
7,24
8,87
4
-
17,
248,
874
1
7,24
8,87
4
Ad
just
men
t due
to c
hang
e in
repa
ymen
t ter
m
of
spo
nsor
’s lo
an
-
-
-
-
-
-
-
(69,
544,
096)
(6
9,54
4,09
6)
(69,
544,
096)
Profi
t for
the
perio
d -
-
-
-
-
5
5,97
3,50
5
55,
973,
505
-
5
5,97
3,50
5
55,
973,
505
Oth
er c
ompr
ehen
sive
loss
for t
he p
erio
d -
-
(7
9,26
8,60
3)
(79,
268,
603)
-
-
-
-
(7
9,26
8,60
3)
(79,
268,
603)
Tota
l com
preh
ensiv
e lo
ss fo
r the
per
iod
-
-
(79,
268,
603)
(7
9,26
8,60
3)
-
55,
973,
505
5
5,97
3,50
5
-
(23,
295,
098)
(2
3,29
5,09
8)
Ba
lanc
e as
at 3
0 Ju
ne 2
016
- (au
dite
d)
509
,110
,110
2
13,4
06,3
10
39,
523,
592
252
,929
,902
1,0
58,0
27,6
40
(951
,109
,396
) 1
06,9
18,2
44
-
359,
848,
146
86
8,95
8,25
6
Tr
ansf
erre
d fro
m s
urpl
us o
n re
valu
atio
n of
ope
ratin
g
fixed
ass
ets
in re
spec
t of i
ncre
men
tal d
epre
ciatio
n
- net
of d
efer
red
inco
me
tax
-
-
-
-
-
5,4
12,8
42
5,4
12,8
42
-
5,4
12,8
42
5,4
12,8
42
Adju
stm
ent d
ue to
cha
nge
in re
paym
ent t
erm
s
of s
pons
or’s
loan
-
-
-
-
-
-
-
-
-
-
Pr
ofit f
or th
e pe
riod
-
-
-
-
-
75,
125,
591
7
5,12
5,59
1
-
75,
125,
591
7
5,12
5,59
1 O
ther
com
preh
ensiv
e in
com
e fo
r the
per
iod
-
-
-
-
-
-
-
-
-
-
Tota
l com
preh
ensiv
e in
com
e fo
r the
per
iod
-
-
-
-
-
75,
125,
591
7
5,12
5,59
1
-
75,
125,
591
7
5,12
5,59
1
Bala
nce
as a
t 30
Sept
embe
r 201
6 - (
Un-
audi
ted)
5
09,1
10,1
10
213
,406
,310
3
9,52
3,59
2 2
52,9
29,9
02 1
,058
,027
,640
(8
70,5
70,9
63)
187
,456
,677
-
44
0,38
6,57
9
949,
496,
689
The
anne
xed
note
s fo
rm a
n in
tegr
al pa
rt of
this
cons
olid
ated
con
dens
ed in
terim
fina
ncial
info
rmat
ion.
SHAR
E C
APIT
ALFa
ir va
lue
rese
rve
Shar
epr
emiu
mre
serv
eSu
b-to
tal
Gen
eral
rese
rve
Accu
mul
ated
loss
Tota
lre
serv
es
Equi
ty
porti
on o
f sp
onso
r’s
loan
TOTA
LEQ
UIT
YSu
b-to
tal
CAP
ITAL
RES
ERVE
SRE
VEN
UE
RESE
RVES
RESE
RVES
----
----
----
----
----
----
----
----
----
----
----
----
----
---(R
upee
s)--
----
----
----
----
----
----
----
----
----
----
----
----
----
---
AAm
IR F
AYYA
Z SH
eIKH
AL
I FAY
YAZ
SHeI
KH
Chief
exe
cutiv
e
Dire
ctor

24 Kohinoor Mills Limited and its Subsidiary
SELECTED NOTES TO THE CONSOLIDATED CONDENSED INTERIM FINANCIAL INFORMATION (Un-audited)FOR THe quARTeR eNDeD 30 SePTembeR 2016
1. THE GROUP AND ITS OPERATIONS 1.1 Holding company Kohinoor mills Limited (“the Company”) is a public limited company incorporated on 21
December 1987 in Pakistan under the Companies Ordinance, 1984 and its shares are quoted on Pakistan Stock Exchange Limited. The registered office of the Company is situated at 8-K.M., Manga Raiwind Road, District Kasur. The Company is principally engaged in the business of textile manufacturing covering weaving, bleaching, dyeing, buying, selling and otherwise dealing in yarn, cloth and other goods and fabrics made from raw cotton and synthetic fiber and to generate, and supply electricity.
1.2 Subsidiary company q mart Corporation (Private) Limited (“the Subsidiary Company”), a wholly owned subsidiary of
Kohinoor mills Limited was incorporated in Pakistan on 18 July 2005 as a private limited company under the Companies Ordinance, 1984. The registered office of the Subsidiary Company is situated at 8-K.M., Manga Raiwind Road, District Kasur. The principal activity of the Subsidiary Company was to carry on business as a retailer in all types of general merchandise.
During the year ended 30 June 2013, the Holding Company, in line with its decision to focus
on its core fabric business, has decided to pull out of retail business and has accordingly shut-down all Q-Mart retail stores. The Subsidiary Company has disposed of all assets except for freehold land and building on freehold land. A large number of receivables and payables have been settled. As the Subsidiary Company has ceased trading and disposed of majority of its assets, hence, the Subsidiary Company is not considered a going concern. All assets and liabilities of the Subsidiary Company reported in these consolidated financial statements are based on estimated realizable / settlement values.
2. BASIS OF PREPARATION This consolidated condensed interim financial information is un-audited and is being
submitted to shareholders as required by section 245 of the Companies Ordinance, 1984. This consolidated condensed interim financial information of the Group for the quarter ended 30 September 2016 has been prepared in accordance with the requirements of the International Accounting Standard (IAS) 34 ‘Interim Financial Reporting’ and provisions of and directives issued under the Companies Ordinance, 1984. In case where requirements differ, the provisions of or directives issued under the Companies Ordinance, 1984 have been followed. This consolidated condensed interim financial information should be read in conjunction with the audited annual published financial statements of the Group for the year ended 30 June 2016.
3. ACCOUNTING POLICIES The accounting policies and methods of computations adopted for the preparation of
this consolidated condensed interim financial information are the same as applied in the preparation of the preceding audited annual published financial statements of the Group for the year ended 30 June 2016.
4. CRITICAL ACCOUNTING ESTIMATES AND JUDGMENTS The preparation of this consolidated condensed interim financial information in conformity
with the approved accounting standards requires the use of certain critical accounting estimates. It also requires the management to exercise its judgment in the process of applying the Group’s accounting policies. estimates and judgments are continually evaluated and are based on historical experience and other factors, including expectations of future events that are believed to be reasonable under the circumstances.

25First Quarterly Report
During preparation of this consolidated condensed interim financial information, the significant judgments made by the management in applying the Group’s accounting policies and the key sources of estimation and uncertainty were the same as those that applied in the preceding audited annual published financial statements of the Group for the year ended 30 June 2016.
Un-audited Audited 30 September 30 June 2016 2016 Rupees Rupees5. LONG TERM FINANCING -SECURED Opening balance 898,610,110 1,811,907,803 Add : Adjustment due to impact of IAS - 39 28,111,971 241,522,253 Less: Repaid / adjusted during the period / year 43,584,585 1,154,819,946
883,137,496 898,610,110 Less: Current portion shown under current liabilities 80,921,813 163,323,416
802,215,683 735,286,694
6. SPONSOR’S LOAN Interest free loan 272,000,000 272,000,000 equity portion of sponsor loan: Gain on recognition of sponsor’s loan at fair value - (113,316,111) Adjustment due to impact of IAS-39 - 38,171,480 Adjustment due to change in repayment terms - 75,144,631 - - Less: Transferred to current liabilities 272,000,000 272,000,000 - - 7. CONTINGENCIES AND COMMITMENTS
7.1 Contingencies
Holding Company There is no significant change in the status of contingencies as reported in the preceding audited
annual published financial statements of the Company for the year ended 30 June 2016.
7.2 Commitments
(i) Aggregate commitments for capital expenditures and revenue expenditures are amounting to Rupees 59.141 million and Rupees 10.138 million (30 June 2016: Rupees 19.554 million and Rupees 26.033 million) respectively.
(ii) Post dated cheques issued to suppliers are amounting to Rupees 196.353 million (30 June 2016: Rupees 168.214 million).
8. FIXED ASSETS Property, plant and equipment Operating fixed assets (Note 8.1) 3,655,376,999 3,700,429,892 Capital work-in-progress (Note 8.2) 31,327,800 28,490,007 3,686,704,799 3,728,919,899 Intangible assets - computer software (Note 8.3) - - 3,686,704,799 3,728,919,899

26 Kohinoor Mills Limited and its Subsidiary
Un-audited Audited 30 September 30 June 2016 2016 Rupees Rupees8.1 Operating fixed assets Opening net book value 3,700,429,892 3,782,802,726 Add: Cost of additions during the period / year (Note 8.1.1) 8,990,603 187,015,996 3,709,420,495 3,969,818,722 Less: book value of deletions during the period / year (Note 8.1.2) 2,034,348 46,930,477 Depreciation charged during the period / year 52,009,148 222,458,353 Closing net book value 3,655,376,999 3,700,429,892 8.1.1 Cost of additions Factory building 3,552,167 31,740,020 Plant and machinery 498,874 126,099,656 electric installations 308,990 2,757,538 Furniture, fixtures and equipment 7,808 1,454,139 Computers 157,174 4,474,877 motor vehicles 4,465,590 20,489,766
8,990,603 187,015,996 8.1.2 Book value of deletions Plant and machinery 2,034,348 21,989,041 Furniture, fixtures and equipment - 36,815 Computers - 19,289 Motor vehicles - 24,885,332 2,034,348 46,930,477 8.2 Capital work-in-progress Plant and machinery 27,082,337 20,345,577 Advances for Capital expenditures 4,245,463 8,144,430
31,327,800 28,490,007
8.3 Intangible asset - computer software has been fully amortized but still in the use of the Company.

27First Quarterly Report
9. TRANSACTIONS WITH RELATED PARTIES Related parties comprises associated undertakings, other related parties, key management
personnel and provident fund trust. The group in the normal course of business carries out transactions with related parties.Detail of transaction with related parties are as follow:
Un-audited Un-audited 30 September 30 September 2016 2015 Rupees Rupees
Other related parties
Remuneration paid to Chief executive, Directors and executives 16,281,690 23,250,158 Contribution to employees’ provident fund trust 4,966,904 4,554,462
10. ANALYSIS BY SEGMENT (Un-audited) 10.1 Operating Segment Quarter ended 30 September 2016 Weaving Dyeing Power Retail Total- Generation Group Rupees Rupees Rupees Rupees Rupees Total Sale 971,882,998 1,940,820,261 176,207,954 - 3,088,911,213 Intersegment Sale (327,680,971) (18,269,027) (176,207,954) - (522,157,952)
External Sale 644,202,027 1,922,551,234 - - 2,566,753,261 Profit / (loss) from operation before taxation and unallocated income / expenses 18,245,562 175,177,386 (2,072,036) (1,200,720) 190,150,192 Other income and expense-Net (10,556,282)
Profit from operations 179,593,910 Finance Cost (79,146,428) Taxation (25,321,891)
Profit after taxation 75,125,591 Quarter ended 30 September 2015 Total Sale 933,990,587 1,681,269,277 195,038,756 - 2,810,298,620 Intersegment Sale (441,848,815) (11,773,015) (195,038,756) - (648,660,586)
External Sale 492,141,772 1,669,496,262 - - 2,161,638,034 Profit / (loss) from operation before taxation and unallocated income / expenses 20,848,689 179,968,028 (3,541,049) (1,705,362) 195,570,306 Other income and expense-Net (195,582)
Profit from operations 195,374,724 Finance Cost (110,277,646) Taxation (21,428,764) Profit after taxation 63,668,314
10.2 There is no material change in segment assets from amount disclosed in preceding audited
annual published financial statements.

28 Kohinoor Mills Limited and its Subsidiary
11. FINANCIAL RISK MANAGEMENT The Group’s financial risk management objectives and policies are consistent with those
disclosed in the preceding audited annual published financial statements of the Group for the year ended 30 June 2016.
12. AUTHORIZED FOR ISSUE This consolidated condensed interim financial information was authorized for issue on
24 October 2016 by the board of Directors of the Group. 13. CORRESPONDING FIGURES Corresponding figures have been rearranged / regrouped, wherever necessary, for the
purpose of comparison. However, no significant rearrangements / regroupings have been made in these consolidated financial statements.
AAmIR FAYYAZ SHeIKH ALI FAYYAZ SHeIKH Chief executive Director

8-Kilometer, Manga Raiwind Road,District Kasur, Pakistan