First quarter results 2019
30
First quarter results 2019
Transcript of First quarter results 2019

First quarter results 2019

Disclaimer
This presentation contains forward-looking statements that reflect management’s current views with
respect to certain future events and potential financial performance. Although Nordea believes that the
expectations reflected in such forward-looking statements are reasonable, no assurance can be given
that such expectations will prove to have been correct. Accordingly, results could differ materially from
those set out in the forward-looking statements as a result of various factors.
Important factors that may cause such a difference for Nordea include, but are not limited to: (i) the
macroeconomic development, (ii) change in the competitive climate, (iii) change in the regulatory
environment and other government actions and (iv) change in interest rate and foreign exchange rate
levels.
This presentation does not imply that Nordea has undertaken to revise these forward-looking statements,
beyond what is required by applicable law or applicable stock exchange regulations if and when
circumstances arise that will lead to changes compared to the date when these statements were
provided.
2
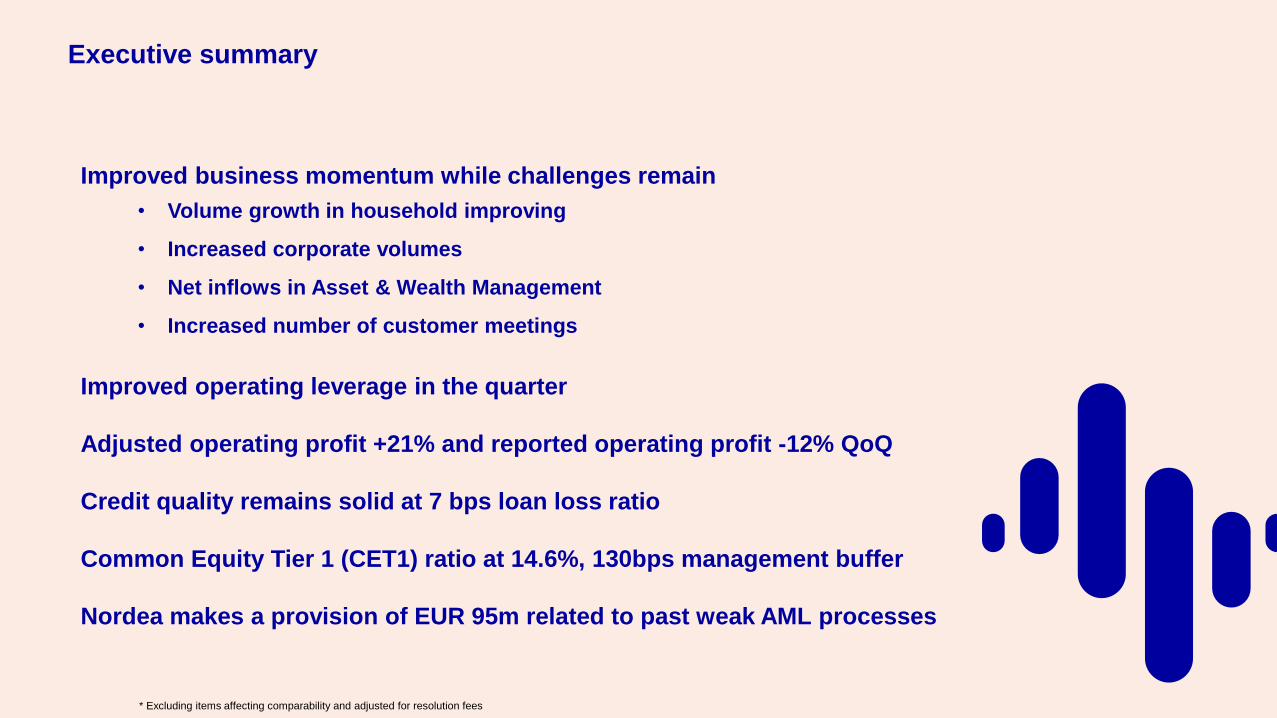
Improved business momentum while challenges remain
• Volume growth in household improving
• Increased corporate volumes
• Net inflows in Asset & Wealth Management
• Increased number of customer meetings
Improved operating leverage in the quarter
Adjusted operating profit +21% and reported operating profit -12% QoQ
Credit quality remains solid at 7 bps loan loss ratio
Common Equity Tier 1 (CET1) ratio at 14.6%, 130bps management buffer
Nordea makes a provision of EUR 95m related to past weak AML processes
Executive summary
* Excluding items affecting comparability and adjusted for resolution fees

Revenues
4
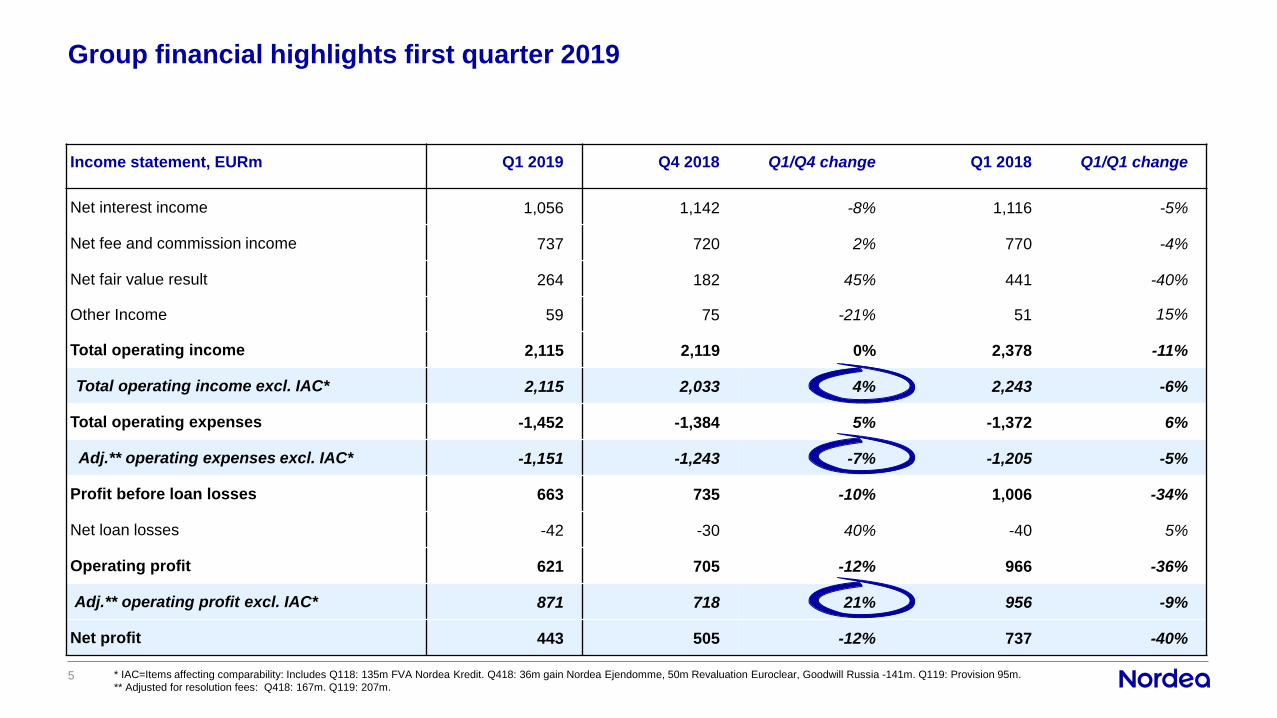
Group financial highlights first quarter 2019
5 * IAC=Items affecting comparability: Includes Q118: 135m FVA Nordea Kredit. Q418: 36m gain Nordea Ejendomme, 50m Revaluation Euroclear, Goodwill Russia -141m. Q119: Provision 95m.
** Adjusted for resolution fees: Q418: 167m. Q119: 207m.
Income statement, EURm Q1 2019 Q4 2018 Q1/Q4 change Q1 2018 Q1/Q1 change
Net interest income 1,056 1,142 -8% 1,116 -5%
Net fee and commission income 737 720 2% 770 -4%
Net fair value result 264 182 45% 441 -40%
Other Income 59 75 -21% 51 15%
Total operating income 2,115 2,119 0% 2,378 -11%
Total operating income excl. IAC* 2,115 2,033 4% 2,243 -6%
Total operating expenses -1,452 -1,384 5% -1,372 6%
Adj.** operating expenses excl. IAC* -1,151 -1,243 -7% -1,205 -5%
Profit before loan losses 663 735 -10% 1,006 -34%
Net loan losses -42 -30 40% -40 5%
Operating profit 621 705 -12% 966 -36%
Adj.** operating profit excl. IAC* 871 718 21% 956 -9%
Net profit 443 505 -12% 737 -40%
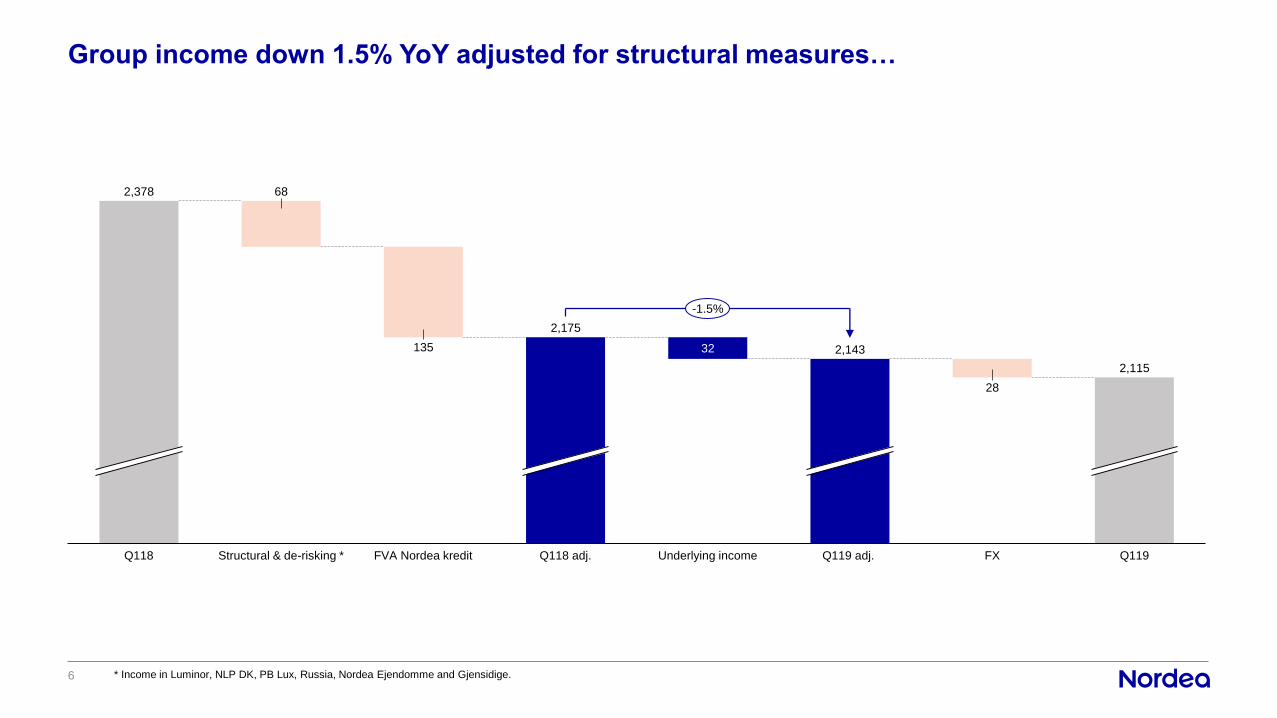
Group income down 1.5% YoY adjusted for structural measures…
6
68
135 32
28
2,378
FX Q119Q118 adj.FVA Nordea kreditStructural & de-risking *
2,143
Q119 adj.
2,175
2,115
Q118 Underlying income
-1.5%
* Income in Luminor, NLP DK, PB Lux, Russia, Nordea Ejendomme and Gjensidige.
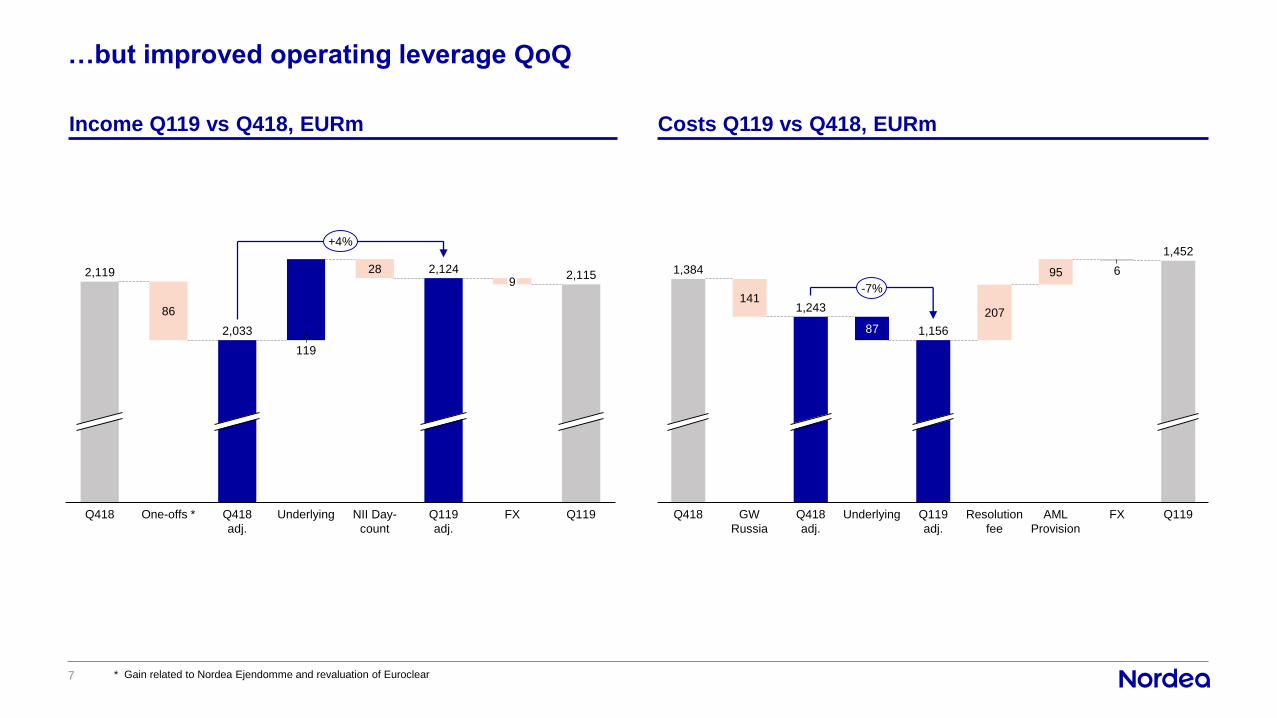
…but improved operating leverage QoQ
7
Income Q119 vs Q418, EURm Costs Q119 vs Q418, EURm
* Gain related to Nordea Ejendomme and revaluation of Euroclear
141
87
207
95 6
1,243
1,384
GW
Russia
Q418 AML
Provision
Resolution
fee
Q119
adj.
UnderlyingQ418
adj.
1,156
1,452
Q119FX
-7%
86
119
28
Q119UnderlyingQ418 One-offs * Q418
adj.
2,119
2,033
2,115
Q119
adj.
FX
9
NII Day-
count
2,124
+4%

8 •
Net interest income
Quarterly bridge, EURm
Yearly bridge, EURm
10
4
3515
2811
9
Lending
& deposit
margins
Day count Q119Q418 DGF*
1,142
1,101
Volumes FX GjensidigeQ119
adj.
Treasury
& Other
1,056
-4%
• Continued pressure on lending margins
• Partly offset by volume growth and
deposit margins
• Higher Deposit Guarantee Fees and
fewer interest days
74
24
9
9
19
9
1,116
Gjensidige
1,056
Q118 DGF* FX Q119Volumes
1,057
Q119
adj.
Lending
& deposit
margins
Treasury
& Other
-5%
* Deposit Guarantee Fee
Comments

Improved lending volumes
9
Lending volumes (Jan 18 = Index 100)
101.8
Jul 18May 18Jan 18
100.0
Nov 18
100.0
Mar 18 Sep 18 Jan 19
103.7
Mar 19
* Adjusted for Gjensidige
Household*
Corporate
• Higher corporate lending volumes
• Steady improvement in household
volumes
• Improvement in new market shares in
Sweden and Denmark
• Finnish new market shares lagging
• Norway growing with market
Comments
10 •
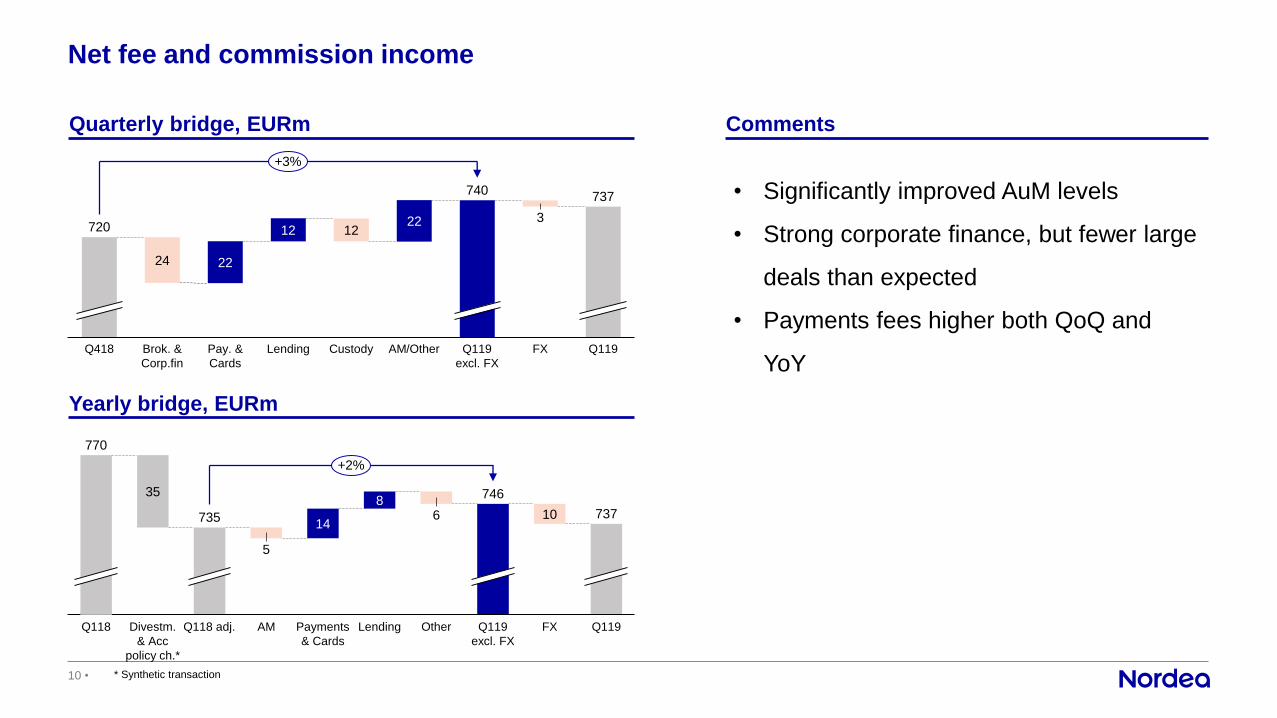
Net fee and commission income
Quarterly bridge, EURm
Yearly bridge, EURm
35
5
14
86 10
Payments
& Cards
770
AM Q119
excl. FX
OtherLendingDivestm.
& Acc
policy ch.*
735
746
737
Q118 Q118 adj. FX Q119
+2%
• Significantly improved AuM levels
• Strong corporate finance, but fewer large
deals than expected
• Payments fees higher both QoQ and
YoY
* Synthetic transaction
Comments
24 22
12 1222 3
740
Pay. &
Cards
Lending Custody Q119
excl. FX
Brok. &
Corp.fin
FX Q119Q418 AM/Other
720
737
+3%

Assets under Management
11
Flow, EURbn Comments
AuM development, EURbn
12 1111
1
13
320
Q218Q118
-3%
295 296
312
-1%
Q318
282
-2%
1%
Q119
283
300
Q418
307
-5%
300
NLP DK
Adj. annualised net flow / AuMPBI
AuM
• Positive inflow in the quarter
• Strong financial markets and good
investment performance in Q1
increased AuM
• AuM up 7% QoQ to above EUR 300bnQ418Q318Q117
0.5
Q217 Q317
0.3
Q417
-0.5
Q118
-0.6
Q218 Q119
2.3
1.30.6
1.91.4
-1.0
0.8
-3.8
-1.3
-5.3
-1.3
-2.8
1.0
1.9
Reported
Excl. PB Lux, PB / PeB moves, SRF and NLP DK
12 •
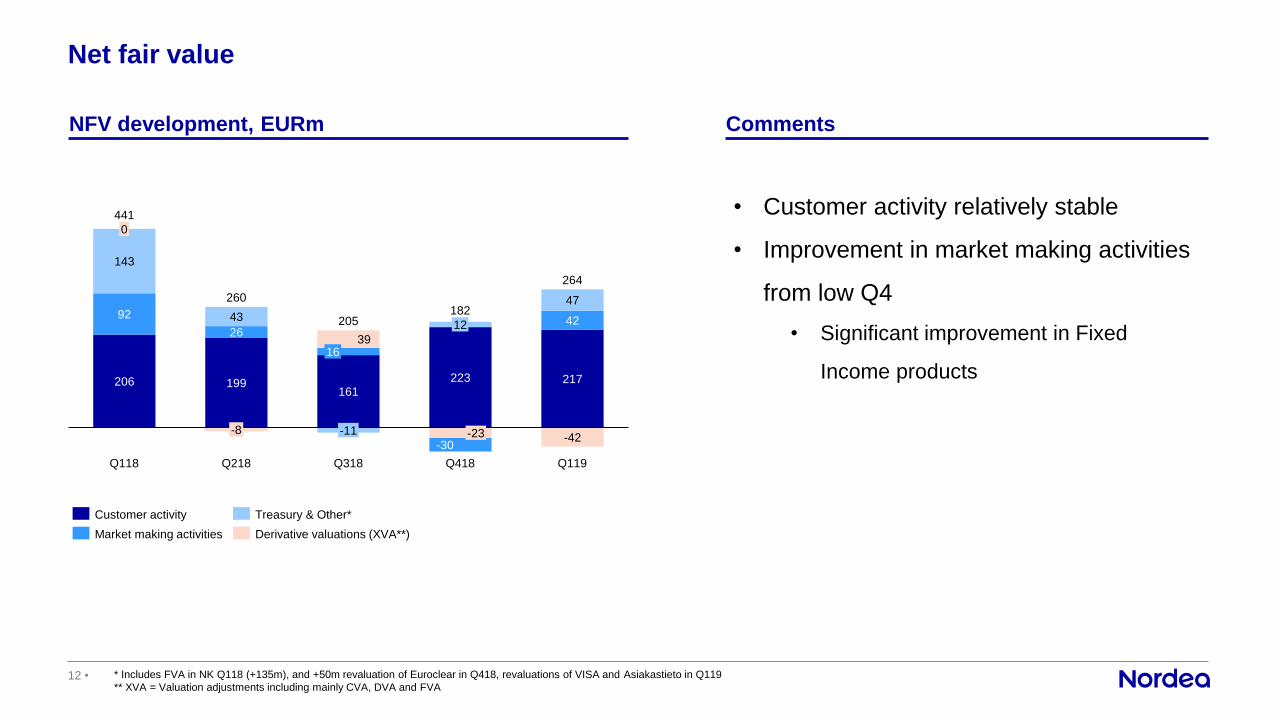
Net fair value
NFV development, EURm
206 199161
223 217
92
2642
143
43
39
47
-30-42
16
182
-8
0
Q118 Q218 Q318
-11
12
Q418 Q119
264
441
260
205
-23
Customer activity
Market making activities Derivative valuations (XVA**)
Treasury & Other*
• Customer activity relatively stable
• Improvement in market making activities
from low Q4
• Significant improvement in Fixed
Income products
Comments
* Includes FVA in NK Q118 (+135m), and +50m revaluation of Euroclear in Q418, revaluations of VISA and Asiakastieto in Q119
** XVA = Valuation adjustments including mainly CVA, DVA and FVA
Business areas
13

14 •
Personal Banking 1(2)
Total income, EURm
Cost/Income ratio, %
• Good underlying trend in customer-driven activity
• Larger share of new mortgage sales
• Positive lending volume development, driven by Norway
• Negative impact from margin pressure
• Focus to gain market share in mortgages, savings and to
improve customer satisfaction
* Adjusted for impact of Fair value model adjustment to Danish mortgages: 77m in Q118 and 27m in Q119
** Operating profit impacted in Q119 by credit loss provision on unsecured consumer lending in Nordea Finance
Comments
Operating profit, EURm
Q318
737
Q418Q118 Q118 adj.* Q218 Q119 adj.*
706
Q119
814
718738
726
753-1%
Key ratios
8 8
Q318
66
Q118 adj.*
62
Q218 Q418
62
Q118
61 61
Q119 adj.* Q119
64
62
56
59
Q418 Q119 adj.*
268249241
259234
202
Q119**
212
Q118 adj.*
175
Q118 Q218 Q318
289-13%
Resolution FeeResolution Fee

15 •
Personal Banking 2(2)
Lending volume, EURbn
Share of online meetings
Customer satisfaction (Customer Engagement Index)
Savings advisory sessions, ‘000
147.2
Q318Q118
5.2
Q218 Q418
147.0
Q119
145.6 146.2 146.5
152.2+5%
Leading indicators
Q118 Q218 Q318 Q418 Q119 Trend
69 71 70 69 67
72 70 72 72 71
72 71 73 74 72
58 62 65 63 66Effect from Gjensidige
1
19
36
0
5
10
15
20
25
30
35
40
Feb
19
Feb
18
Mar
18
Jul
18
Aug
18
Dec
18
Jan
19
Mar
19
Jun
18
Jan
18
Apr
18
May
18
Oct
18
Nov
18
18-
Sep
19
Face-to-face meetings
Nora2018 Mar 2018 Jun 2018 Sep 2018 Dec 2019 Mar Trend
15 16 16 17 18
25 27 27 26 29
37 36 32 37 40
35 34 29 32 33

16 •
Commercial and Business Banking 1(2)
Total income, EURm
Cost/Income ratio, %
• Underlying income momentum carries into 2019
• High customer activity in the Swedish market
• Continued margin pressure in Denmark
• Continuous focus on improving customer intensity
* Adjusted for impact of Fair value model adjustment to Danish mortgages: +58m in Q118 and -44m in Q119
Comments
Operating profit, EURm
Q119 adj.*
510
Q118 Q118 adj.* Q218 Q318
569
511
483487
537527
Q418 Q119
+3%
Key ratios
9
9
5552
59
Q118 adj.*
59
Q318Q118
55
Q218 Q119Q119 adj.*Q418
66
64 4449
Q119Q118
194 182
Q118 adj.* Q318 Q418Q218
138
Q119 adj.*
252 256238
178
224 231
-3%Resolution FeeResolution Fee
17 •
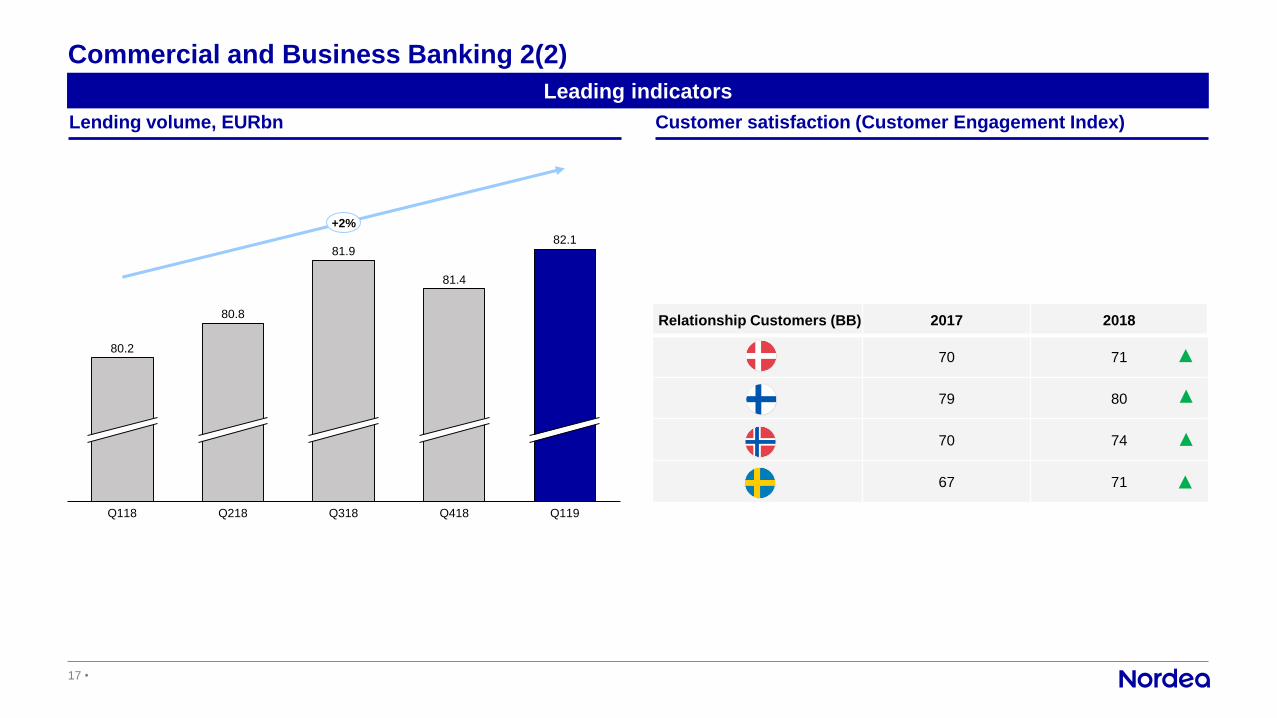
Commercial and Business Banking 2(2)
Lending volume, EURbn Customer satisfaction (Customer Engagement Index)
Q318Q118 Q218 Q418 Q119
80.2
80.8
81.9
81.4
82.1
+2%
Leading indicators
Relationship Customers (BB) 2017 2018
70 71
79 80
70 74
67 71
18 •
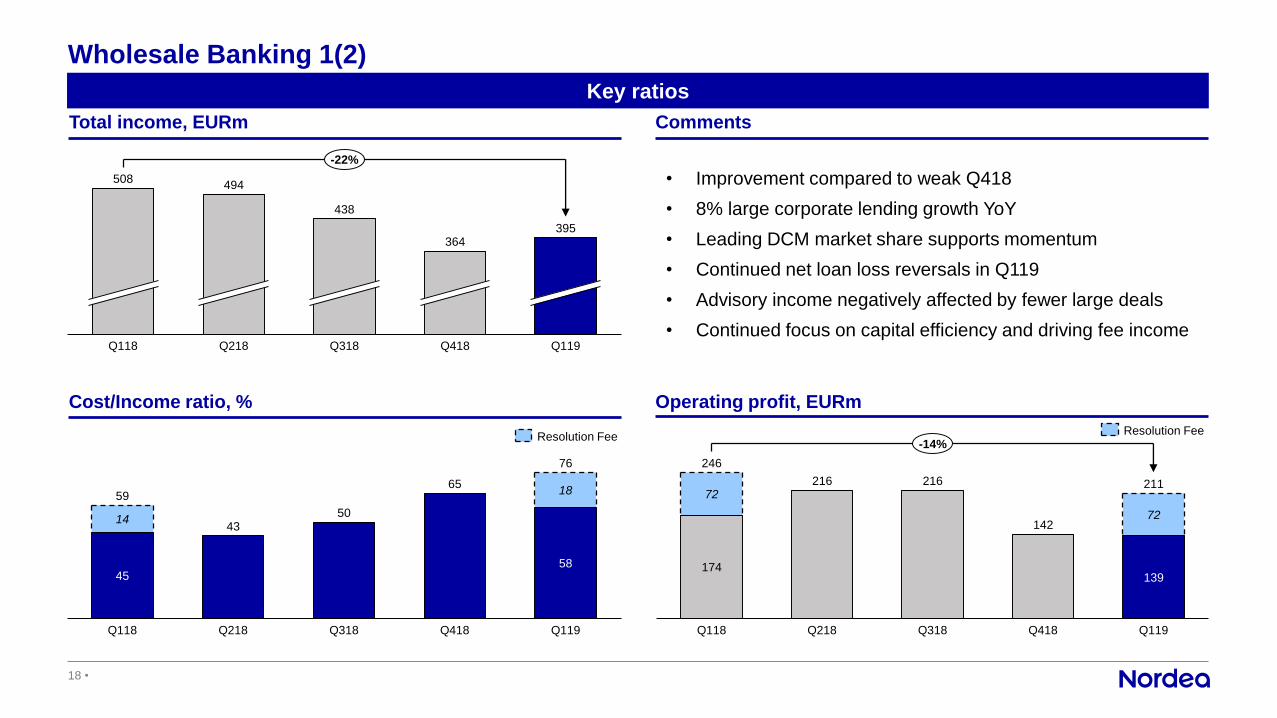
Wholesale Banking 1(2)
Total income, EURm
Cost/Income ratio, %
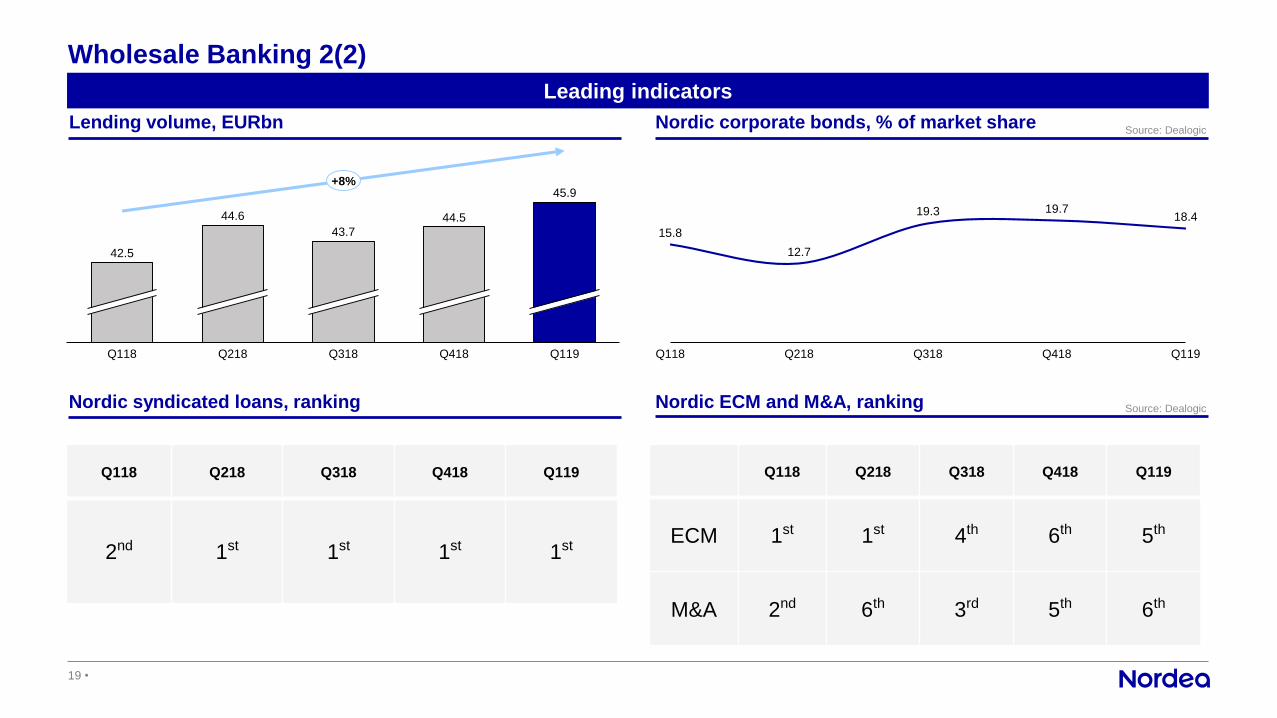
• Improvement compared to weak Q418
• 8% large corporate lending growth YoY
• Leading DCM market share supports momentum
• Continued net loan loss reversals in Q119
• Advisory income negatively affected by fewer large deals
• Continued focus on capital efficiency and driving fee income
Comments
Operating profit, EURm
Q118
508
Q218 Q318 Q418
364
Q119
494
438
395
-22%
Key ratios
45
4350
65
58
14
18
Q318Q118 Q218 Q418 Q119
59
76
174
216 216
142
139
72
72
Q418Q118 Q218 Q318 Q119
246
211
-14%Resolution Fee
Resolution Fee
19 •
Wholesale Banking 2(2)
Lending volume, EURbn
Nordic syndicated loans, ranking
Nordic corporate bonds, % of market share
Nordic ECM and M&A, ranking
Q118
44.5
Q218 Q318 Q418 Q119
42.5
44.6
43.7
45.9+8%
Leading indicators
Q218Q118 Q318 Q119Q418
19.3 19.7
15.8
12.7
18.4
Source: Dealogic
Q118 Q218 Q318 Q418 Q119
2nd 1st 1st 1st 1st
Q118 Q218 Q318 Q418 Q119
ECM 1st 1st 4th 6th 5th
M&A 2nd 6th 3rd 5th 6th
Source: Dealogic

20 •
Asset & Wealth Management 1(2)
Total income, EURm
Cost/Income ratio, %
• AuM back above EUR 300bn with net flows of EUR 1bn
• 88% of composites outperforming YtD.
• European covered bonds inflow of EUR 3bn in the last year
• Improved inflows in Sweden and Norway across Private
Banking, Life and Retail funds
• Whilst Private Banking/Retail flows in Denmark still subdued
• New centralised SME savings team in Denmark and focus on
High-Net-Worth segment
Comments
Operating profit, EURm
Q119Q118 Q218 Q318 Q418
447
405
426
400 404
-10%
Key ratios
Q418
48
42
Q118 Q218
46
45
Q119
1
47
45
Q318
0.4
46243
Q318
2
215
4
Q118 Q218
245
Q418 Q119
219
246
218
207
-11%Resolution FeeResolution Fee

21 •
Asset & Wealth Management 2(2)
Assets under Management, EURbn
Total net flows, EURbn
Customer satisfaction (Customer Engagement Index)
Investment advisory sessions, Face-to-face
312
300
320
307
Q118 Q218 Q318 Q418 Q119
283
-6%
Leading indicators
Jun
18
Apr
18
4,285
Feb
18
Feb
19
Jan
18
Mar
18
May
18
Jul
18
Aug
18
Sep
18
Oct
18
Nov
18
Dec
18
Jan
19
5,552
Mar
19
Investment performance
Q1
2018
Q2
2018
Q3
2018
Q4
2018
Q1
2019
46 35 46 42 88Q318Q118 Q119Q218 Q418
-5.3
0.5
-0.6
-3.8
-1.3 -1.3
-2.8
-0.5
1.01.9
Reported
Excl. PB Lux, PB / PeB moves, SRF and NLP DK
(% above benchmark, YtD)
Q118 Q218 Q318 Q418
77 76 77 76
76 73 78 76
77 73 77 77
75 77 81 83

22

23 •
Costs
Quarterly bridge, EURm*
Yearly bridge, EURm*
167
44 11 21
207
95
FX Resolu-
tion fee
Provision Q119Q118
adj.
StructuralResolu-
tion fee
Q119
adj.
1,172
1,372
Q118
1,452
Underlying
1,161
+0.9%
87207
95 6
D&AD&A
Staff
Other
Q418 Underlying
Staff
Other
Q119
adj.
Resolution fee
1,243
Provision FX Q119
1,156
1,452-7%
• Underlying cost down by 7%
• Staff costs down by 3% QoQ
• Depreciations 44% lower QoQ at EUR 140m
• On track to meet our cost targets in 2019 and 2021
• Costs impacted by provisions and full year resolution
fee
* In constant currencies and excluding items affecting comparability and adjusted for resolution fees
Comments
Outlook
• 2021 cost expected 3% below 2018*
• 2019 cost expected to be lower than 2018*

Further reduction in cash cost*
Yearly, EURm** Comments
* Costs in P&L (excluding D&A and resolution fees) plus activated costs on balance sheet
** In constant currencies24
189132
171
Q119
1,1861,054
Q117
1,134
Q118
1,374
1,2661,225
-3%
Capitalisations
Underlying cost
Outlook
• Cash cost to be down by up to 10% 2021 vs 2018
• Cash cost to be lower in 2019 vs 2018
• Cash cost down by 3% YoY driven by lower
underlying costs
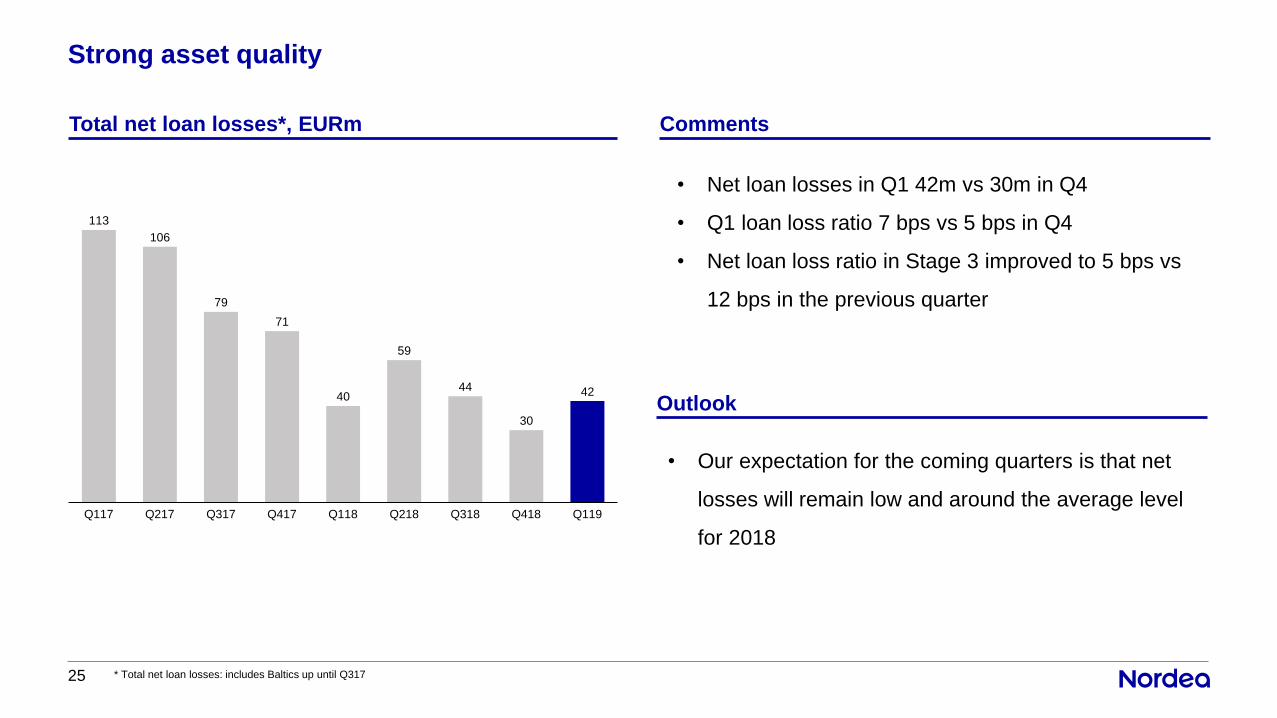
Strong asset quality
Total net loan losses*, EURm Comments
113
106
79
71
40
59
44
30
42
Q117 Q318Q217 Q317 Q417 Q218 Q418Q118 Q119
* Total net loan losses: includes Baltics up until Q31725
• Net loan losses in Q1 42m vs 30m in Q4
• Q1 loan loss ratio 7 bps vs 5 bps in Q4
• Net loan loss ratio in Stage 3 improved to 5 bps vs
12 bps in the previous quarter
Outlook
• Our expectation for the coming quarters is that net
losses will remain low and around the average level
for 2018

Common Equity Tier 1 ratio development
Q119 vs Q418 Comments
EUR
21.7 bn
0.3
15.5
Q418
Capital
Commitment*
14.6
Volumes
13.9
13.3
EUR
21.7bn
0.4
Gjensidige
acquisition
Q119
0.2
Q119
Capital
Commitment*
Q418 Other
130 bps
160 bps
26 * Nordea’s capital commitment EUR 21.7bn in nominal terms
• CET1 capital ratio 14.6% at end of the first quarter
• Management buffer of 130 bps
• REA increased by EUR 7.1bn to EUR 163bn
• mainly driven by the acquisition of Gjensidige,
lending growth and IFRS 16
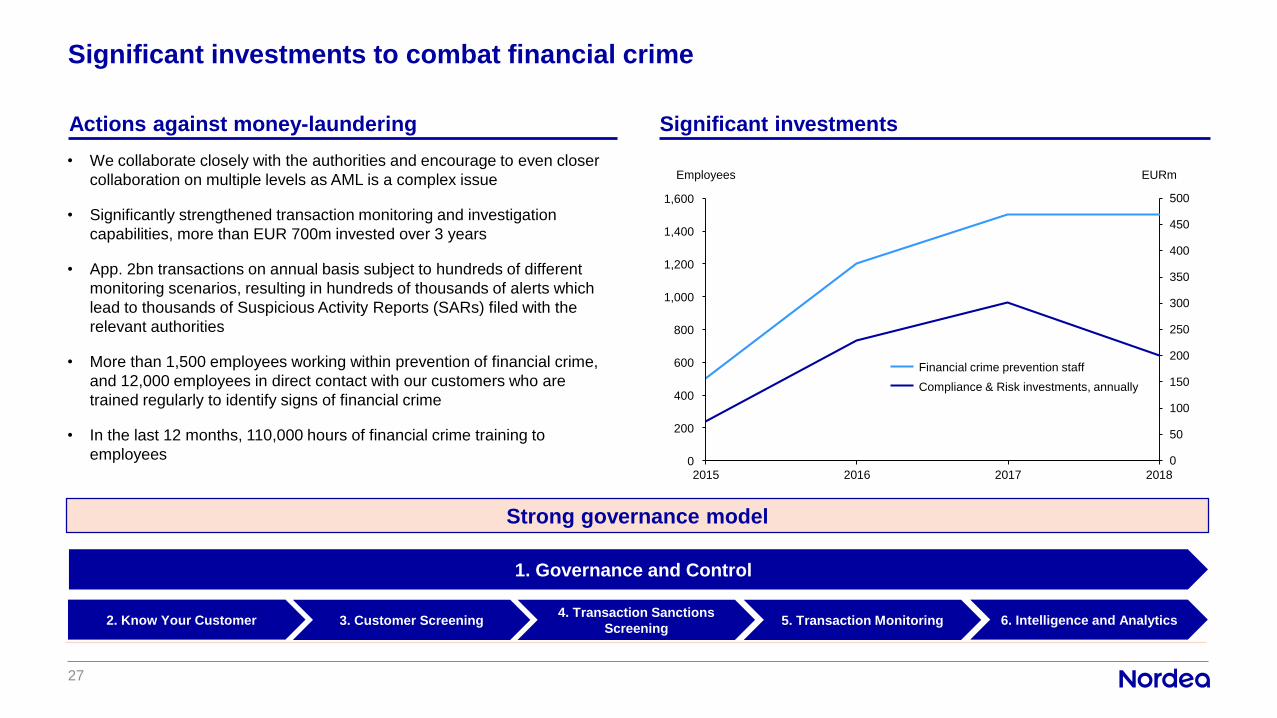
Strong governance model
Significant investments to combat financial crime
27
• We collaborate closely with the authorities and encourage to even closer
collaboration on multiple levels as AML is a complex issue
• Significantly strengthened transaction monitoring and investigation
capabilities, more than EUR 700m invested over 3 years
• App. 2bn transactions on annual basis subject to hundreds of different
monitoring scenarios, resulting in hundreds of thousands of alerts which
lead to thousands of Suspicious Activity Reports (SARs) filed with the
relevant authorities
• More than 1,500 employees working within prevention of financial crime,
and 12,000 employees in direct contact with our customers who are
trained regularly to identify signs of financial crime
• In the last 12 months, 110,000 hours of financial crime training to
employees
3. Customer Screening 6. Intelligence and Analytics4. Transaction Sanctions
Screening2. Know Your Customer 5. Transaction Monitoring
1. Governance and Control
0
50
100
150
200
250
300
350
400
450
500
2015 2016 2017 2018
1,400
400
0
200
600
1,000
800
1,200
1,600
EURmEmployees
Actions against money-laundering Significant investments
Financial crime prevention staff
Compliance & Risk investments, annually
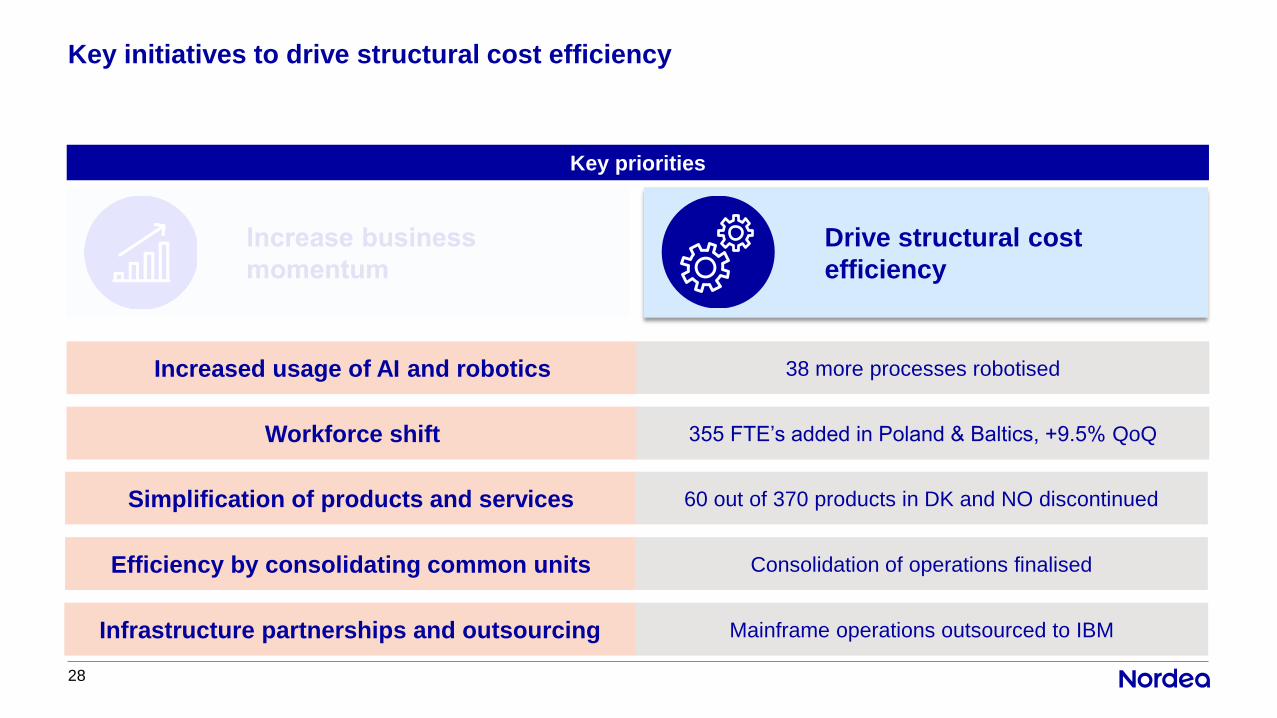
Key initiatives to drive structural cost efficiency
Key PrioritiesKey priorities
28
Efficiency by consolidating common units
Increased usage of AI and robotics
Workforce shift
Simplification of products and services
Infrastructure partnerships and outsourcing
Consolidation of operations finalised
38 more processes robotised
355 FTE’s added in Poland & Baltics, +9.5% QoQ
60 out of 370 products in DK and NO discontinued
Mainframe operations outsourced to IBM
Drive structural cost
efficiency
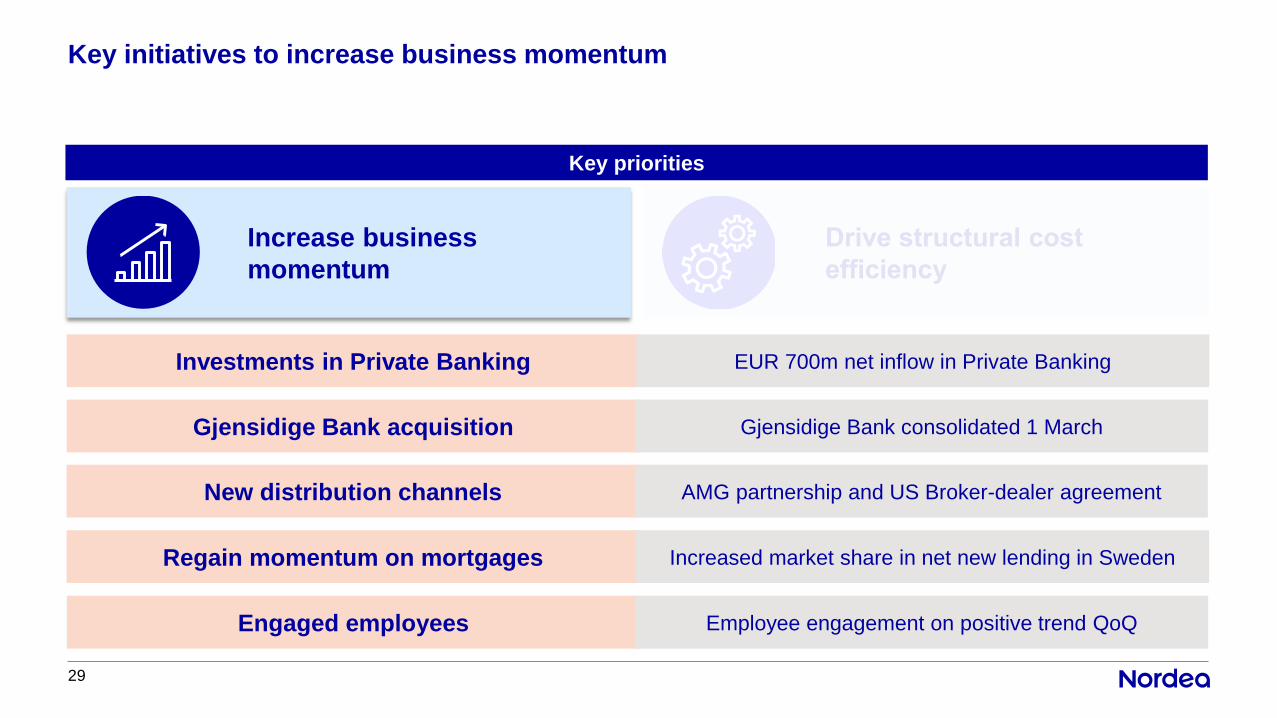
Key initiatives to increase business momentum
Key PrioritiesKey priorities
29
Regain momentum on mortgages
Investments in Private Banking
Gjensidige Bank acquisition
New distribution channels
Engaged employees
Increased market share in net new lending in Sweden
EUR 700m net inflow in Private Banking
Gjensidige Bank consolidated 1 March
AMG partnership and US Broker-dealer agreement
Employee engagement on positive trend QoQ
Increase business
momentum