First quarter operations review - riotinto.com · driven by operational improvements. Gove...
29
First quarter operations review Page 1 of 29 Rio Tinto releases first quarter production results 18 April 2018 Rio Tinto chief executive J-S Jacques said “We delivered a solid operational performance across most commodities in the first quarter of 2018. Our world-class Pilbara iron ore assets continue to demonstrate flexibility and the benefits of increased productivity, and production at our bauxite and copper assets was also higher. We announced $5 billion of divestments in the quarter, highlighting our ongoing drive to strengthen the portfolio and raise return on assets. By continuing to advance our mine-to-market productivity programme, whilst maintaining our focus on the disciplined allocation of cash, we will continue to deliver superior returns to our shareholders.” Q1 2018 vs Q1 2017 vs Q4 2017 Pilbara iron ore shipments (100% basis) Mt 80.3 +5% -11% Pilbara iron ore production (100% basis) Mt 83.1 +8% -5% Bauxite kt 12,653 +12% -8% Aluminium kt 846 -5% -5% Mined copper kt 139.3 +65% -6% Hard coking coal kt 1,102 -30% -53% Titanium dioxide slag kt 294 -12% -14% IOC iron ore pellets and concentrate Mt 2.4 -8% -13% Key points Pilbara iron ore shipments of 80.3 million tonnes (100 per cent basis) in the first quarter were five per cent higher than the first quarter of 2017, benefitting from productivity improvements and fewer weather disruptions. Bauxite production of 12.7 million tonnes was 12 per cent higher than the corresponding quarter of 2017, due to continued operational improvements. Third party shipments increased by 19 per cent to 8.2 million tonnes due to firm demand and higher port availability. Aluminium production of 0.8 million tonnes was five per cent lower than the first quarter of 2017 due primarily to disruptions at the Becancour smelter in Canada. Mined copper production of 139.3 thousand tonnes was 65 per cent higher than the first quarter of 2017, as output recovered at Escondida following a labour union strike in the first half of last year. Titanium dioxide slag production was 12 per cent lower than the first quarter of 2017 due to operational and labour disruptions at Richards Bay Minerals. Guidance has accordingly been revised to 1.1 to 1.3 million tonnes (previously 1.2 to 1.4 million tonnes). Hard coking coal production of 1.1 million tonnes was 30 per cent lower than the first quarter of 2017 due primarily to the longwall changeover and maintenance works at Kestrel. The major growth projects remain on track. The Silvergrass iron ore mine continues to ramp up, Amrun is on schedule for first bauxite shipment in the first half of 2019 and construction of the first drawbell at Oyu Tolgoi Underground is expected in mid-2020. Total divestments announced in 2018 total $5 billion, subject to completion conditions, including: o Binding offers for the Aluminium Dunkerque smelter in France for $500 million and the ISAL aluminium smelter in Iceland for $345 million. The sales are expected to complete in the second quarter of 2018. o Binding offers for the group’s remaining coal assets, including the Hail Creek and Kestrel mines in Queensland and the Winchester South and Valeria development projects, for total consideration of $4.15 billion. The sales are expected to complete principally in the second half of 2018. All figures in this report are unaudited. All currency figures in this report are US dollars, and comments refer to Rio Tinto’s share of production, unless otherwise stated. To allow production numbers to be compared on a like-for-like basis, production from asset divestments completed in 2017 is excluded from Rio Tinto share of production data but assets sold in 2018 remain in comparisons.
Transcript of First quarter operations review - riotinto.com · driven by operational improvements. Gove...

First quarter operations review
Page 1 of 29
Rio Tinto releases first quarter production results
18 April 2018
Rio Tinto chief executive J-S Jacques said “We delivered a solid operational performance across most
commodities in the first quarter of 2018. Our world-class Pilbara iron ore assets continue to demonstrate
flexibility and the benefits of increased productivity, and production at our bauxite and copper assets was
also higher. We announced $5 billion of divestments in the quarter, highlighting our ongoing drive to
strengthen the portfolio and raise return on assets. By continuing to advance our mine-to-market
productivity programme, whilst maintaining our focus on the disciplined allocation of cash, we will continue
to deliver superior returns to our shareholders.”
Q1 2018 vs Q1 2017 vs Q4 2017
Pilbara iron ore shipments (100% basis) Mt 80.3 +5% -11%
Pilbara iron ore production (100% basis) Mt 83.1 +8% -5%
Bauxite kt 12,653 +12% -8%
Aluminium kt 846 -5% -5%
Mined copper kt 139.3 +65% -6%
Hard coking coal kt 1,102 -30% -53%
Titanium dioxide slag kt 294 -12% -14%
IOC iron ore pellets and concentrate Mt 2.4 -8% -13%
Key points
Pilbara iron ore shipments of 80.3 million tonnes (100 per cent basis) in the first quarter were five per
cent higher than the first quarter of 2017, benefitting from productivity improvements and fewer weather
disruptions.
Bauxite production of 12.7 million tonnes was 12 per cent higher than the corresponding quarter of
2017, due to continued operational improvements. Third party shipments increased by 19 per cent to
8.2 million tonnes due to firm demand and higher port availability.
Aluminium production of 0.8 million tonnes was five per cent lower than the first quarter of 2017 due
primarily to disruptions at the Becancour smelter in Canada.
Mined copper production of 139.3 thousand tonnes was 65 per cent higher than the first quarter of
2017, as output recovered at Escondida following a labour union strike in the first half of last year.
Titanium dioxide slag production was 12 per cent lower than the first quarter of 2017 due to operational
and labour disruptions at Richards Bay Minerals. Guidance has accordingly been revised to 1.1 to 1.3
million tonnes (previously 1.2 to 1.4 million tonnes).
Hard coking coal production of 1.1 million tonnes was 30 per cent lower than the first quarter of 2017
due primarily to the longwall changeover and maintenance works at Kestrel.
The major growth projects remain on track. The Silvergrass iron ore mine continues to ramp up, Amrun
is on schedule for first bauxite shipment in the first half of 2019 and construction of the first drawbell at
Oyu Tolgoi Underground is expected in mid-2020.
Total divestments announced in 2018 total $5 billion, subject to completion conditions, including:
o Binding offers for the Aluminium Dunkerque smelter in France for $500 million and the ISAL
aluminium smelter in Iceland for $345 million. The sales are expected to complete in the
second quarter of 2018.
o Binding offers for the group’s remaining coal assets, including the Hail Creek and Kestrel
mines in Queensland and the Winchester South and Valeria development projects, for total
consideration of $4.15 billion. The sales are expected to complete principally in the second
half of 2018.
All figures in this report are unaudited. All currency figures in this report are US dollars, and comments refer to Rio Tinto’s share of
production, unless otherwise stated. To allow production numbers to be compared on a like-for-like basis, production from asset
divestments completed in 2017 is excluded from Rio Tinto share of production data but assets sold in 2018 remain in comparisons.

Page 2 of 29
IRON ORE
Rio Tinto share of production (million tonnes)
Q1 2018 vs Q1 2017 vs Q4 2017
Pilbara Blend Lump 20.7 +8% -2%
Pilbara Blend Fines 29.8 +10% -4%
Robe Valley Lump 1.6 +9% -4%
Robe Valley Fines 3.1 +31% +5%
Yandicoogina Fines (HIY) 13.9 +2% -13%
Total Pilbara production 69.1
Total Pilbara production (100% basis) 83.1
Pilbara operations
Pilbara operations produced 83.1 million tonnes (Rio Tinto share 69.1 million tonnes) in the first quarter of
2018, eight per cent higher than the same quarter of 2017. Sales of 80.3 million tonnes (Rio Tinto share
66.6 million tonnes) were five per cent higher than the same period of last year.
Production benefitted from fewer weather disruptions than the first quarter of 2017, along with the ramp up
of Silvergrass and the ongoing implementation of productivity improvements across the integrated system.
Rail productivity continues to improve, with 85.0 million tonnes railed in the first quarter. Sales were 2.8
million tonnes below production due to disruptions at the ports resulting from Tropical Cyclone Marcus in
March.
Approximately 18 per cent of sales in the quarter were priced by reference to the prior quarter’s average
index lagged by one month. The remainder was sold either on current quarter average, current month
average or on the spot market.
Approximately 34 per cent of sales in the quarter were made free on board (FOB), with the remainder sold
including freight.
Pilbara projects
The automation of the Pilbara train system (AutoHaulTM) continues to advance, with approximately 65 per
cent of trains at the end of the quarter in autonomous mode with a driver on board for supervision and
more than three million kilometres now completed in this mode of operation. The project continues to
progress with the Regulator approval process and is on schedule to be completed by the end of 2018.
The Koodaideri feasibility study is on track for completion in 2018.
2018 guidance Rio Tinto’s Pilbara shipments in 2018 are still expected to be between 330 and 340 million tonnes (100 per cent basis). This is subject to market conditions and any weather constraints.
Page 3 of 29
ALUMINIUM
Rio Tinto share of production (‘000 tonnes)
Q1 2018 vs Q1 2017 vs Q4 2017
Rio Tinto Aluminium
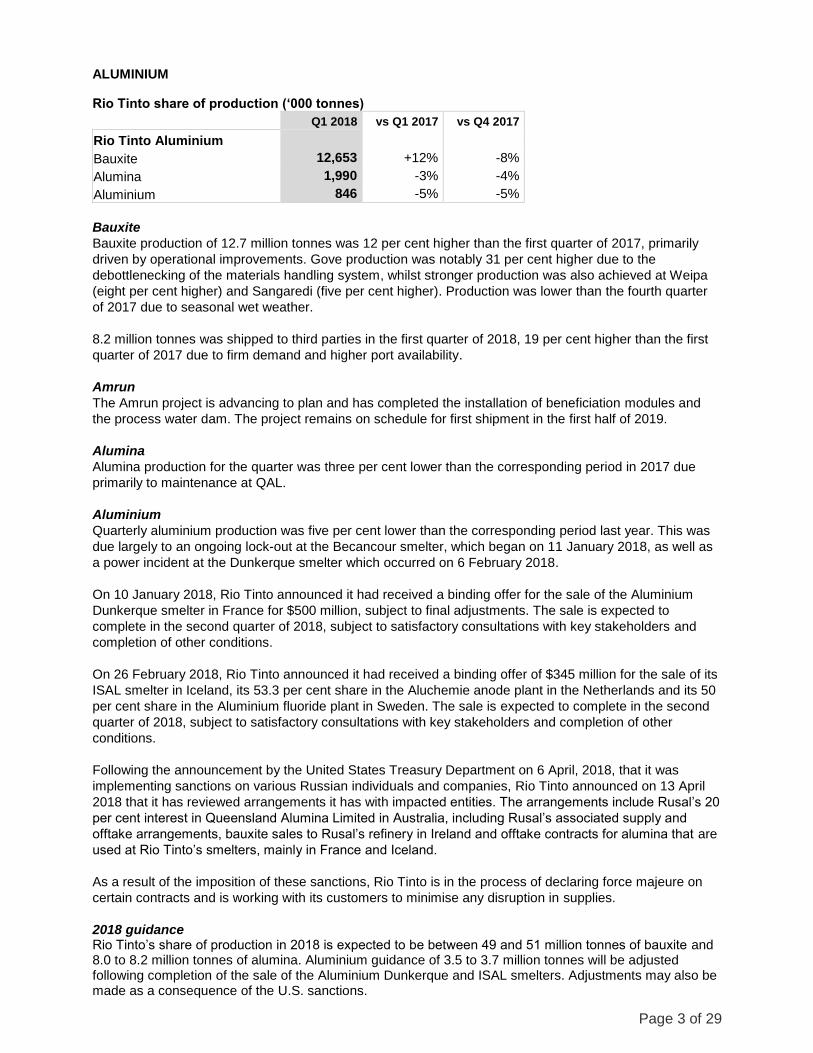
Bauxite 12,653 +12% -8%
Alumina 1,990 -3% -4%
Aluminium 846 -5% -5%
Bauxite
Bauxite production of 12.7 million tonnes was 12 per cent higher than the first quarter of 2017, primarily
driven by operational improvements. Gove production was notably 31 per cent higher due to the
debottlenecking of the materials handling system, whilst stronger production was also achieved at Weipa
(eight per cent higher) and Sangaredi (five per cent higher). Production was lower than the fourth quarter
of 2017 due to seasonal wet weather.
8.2 million tonnes was shipped to third parties in the first quarter of 2018, 19 per cent higher than the first
quarter of 2017 due to firm demand and higher port availability.
Amrun
The Amrun project is advancing to plan and has completed the installation of beneficiation modules and
the process water dam. The project remains on schedule for first shipment in the first half of 2019.
Alumina
Alumina production for the quarter was three per cent lower than the corresponding period in 2017 due
primarily to maintenance at QAL.
Aluminium
Quarterly aluminium production was five per cent lower than the corresponding period last year. This was
due largely to an ongoing lock-out at the Becancour smelter, which began on 11 January 2018, as well as
a power incident at the Dunkerque smelter which occurred on 6 February 2018.
On 10 January 2018, Rio Tinto announced it had received a binding offer for the sale of the Aluminium
Dunkerque smelter in France for $500 million, subject to final adjustments. The sale is expected to
complete in the second quarter of 2018, subject to satisfactory consultations with key stakeholders and
completion of other conditions.
On 26 February 2018, Rio Tinto announced it had received a binding offer of $345 million for the sale of its
ISAL smelter in Iceland, its 53.3 per cent share in the Aluchemie anode plant in the Netherlands and its 50
per cent share in the Aluminium fluoride plant in Sweden. The sale is expected to complete in the second
quarter of 2018, subject to satisfactory consultations with key stakeholders and completion of other
conditions.
Following the announcement by the United States Treasury Department on 6 April, 2018, that it was
implementing sanctions on various Russian individuals and companies, Rio Tinto announced on 13 April
2018 that it has reviewed arrangements it has with impacted entities. The arrangements include Rusal’s 20
per cent interest in Queensland Alumina Limited in Australia, including Rusal’s associated supply and
offtake arrangements, bauxite sales to Rusal’s refinery in Ireland and offtake contracts for alumina that are
used at Rio Tinto’s smelters, mainly in France and Iceland.
As a result of the imposition of these sanctions, Rio Tinto is in the process of declaring force majeure on
certain contracts and is working with its customers to minimise any disruption in supplies.
2018 guidance Rio Tinto’s share of production in 2018 is expected to be between 49 and 51 million tonnes of bauxite and 8.0 to 8.2 million tonnes of alumina. Aluminium guidance of 3.5 to 3.7 million tonnes will be adjusted following completion of the sale of the Aluminium Dunkerque and ISAL smelters. Adjustments may also be made as a consequence of the U.S. sanctions.

Page 4 of 29
COPPER & DIAMONDS
Rio Tinto share of production (‘000 tonnes)
Q1 2018 vs Q1 2017 vs Q4 2017
Mined copper
Rio Tinto Kennecott 35.4 -20% +2%
Escondida 90.9 +235% -2%
Grasberg 0.0 N/A N/A
Oyu Tolgoi 13.0 +2% -14%
Refined copper
Rio Tinto Kennecott 35.3 +19% +60%
Escondida 20.8 +155% -9%
Diamonds (‘000 carats)
Argyle 3,551 +18% -42%
Diavik 1,065 -6% +0%
Rio Tinto Kennecott
Mined copper production in the first quarter of 2018 was 20 per cent lower than the first quarter of 2017
due primarily to temporarily lower head grades, although refined copper production was 19 per cent higher
due to the draw down in concentrate inventories that were built up during the smelter shutdown following
the fatality in October 2017.
Rio Tinto Kennecott tolls third party concentrate to optimise smelter utilisation, with 41 thousand tonnes of
concentrate received in the first quarter of 2018. Tolled copper concentrate is excluded from reported
production figures.
The pushback of the south wall progressed during the quarter. It will extend the life of mine and remains on
track for completion in 2020.
Escondida
Mined copper production at Escondida in the first quarter of 2018 was significantly higher than the first
quarter of 2017, due to the labour union strike that impacted production in the first half of last year. This
second consecutive quarter of strong production reflects the operational capacity following commissioning
and ramp up of the Los Colorados concentrator in the second half of 2017.
Oyu Tolgoi
Mined copper production from the open pit in the first quarter of 2018 was two per cent higher than the
corresponding period of 2017, but 14 per cent lower than the previous quarter due to a planned plant
shutdown in January 2018.
Due to protests by coal transporters that obstructed the main access road at the Ganquimaodu Border
Zone, Oyu Tolgoi declared force majeure in connection with customer contracts for concentrate between
17 January 2018 and 1 March 2018. Safe and normal operations, including underground development,
were maintained during the force majeure period, and there was no production impact.
Oyu Tolgoi Underground Project
New contractors continue to mobilise with the total project workforce at over 6,700 at the end of March, of
which 89 per cent were Mongolian. Lateral development is tracking on plan, and sinking of shafts two and
five is complete. Eight accommodation buildings in the Oyut II camp are now complete and occupancy of
these buildings has begun. Construction of the first drawbell is still expected in mid-2020.
Grasberg
Through a joint venture agreement with Freeport-McMoRan Inc. (“Freeport”), Rio Tinto is entitled to a 40
per cent share of production above an agreed threshold until the end of 2021 and 40 per cent of all
production thereafter. Rio Tinto’s full participation has been delayed due to the application of force majeure

Page 5 of 29
provisions in the joint venture agreement. The first full year in which Rio Tinto will participate to the full
extent of 40 per cent of production is now expected to be 2023.
In February 2018, PF Freeport Indonesia (“PT-FI”) received an extension of its export permit to February
2019. PT-FI continues to engage with the Indonesian Government in relation to the basis upon which
operations at Grasberg will continue beyond 2021 with regard to the rights conferred by its Contract of
Work.
Rio Tinto is reporting its metal share for the first quarter as zero.
Diamonds
At Argyle, first quarter carat production was 18 per cent higher than the first quarter of 2017 due to
relatively fewer weather disruptions and the additional processing of higher grade alluvial tailings.
At Diavik, carats recovered in the first quarter of 2018 were six per cent lower than the corresponding
period in 2017 due to lower recovered grades. Development of the A21 project is ahead of schedule with
first ore uncovered in March and the mine is expected to be at full production capacity during the fourth
quarter of 2018.
2018 guidance
Rio Tinto’s expected share of mined copper production for 2018 is unchanged at between 510 and 610
thousand tonnes. Refined copper production is expected to be between 225 to 265 thousand tonnes.
Diamond production guidance for 2018 is between 17 and 20 million carats.
Page 6 of 29
ENERGY & MINERALS
Rio Tinto share of production
Q1 2018 vs Q1 2017 vs Q4 2017
Coal
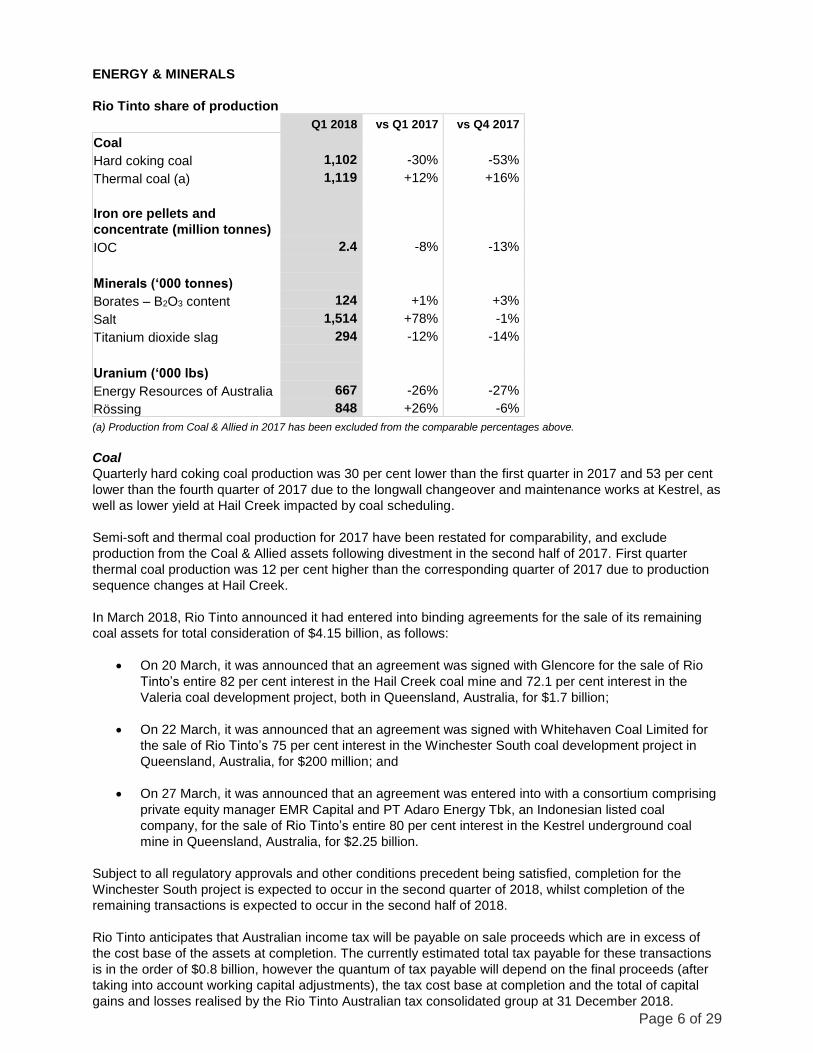
Hard coking coal 1,102 -30% -53%
Thermal coal (a) 1,119 +12% +16%
Iron ore pellets and
concentrate (million tonnes)
IOC 2.4 -8% -13%
Minerals (‘000 tonnes)
Borates – B2O3 content 124 +1% +3%
Salt 1,514 +78% -1%
Titanium dioxide slag 294 -12% -14%
Uranium (‘000 lbs)
Energy Resources of Australia 667 -26% -27%
Rössing 848 +26% -6%
(a) Production from Coal & Allied in 2017 has been excluded from the comparable percentages above.
Coal
Quarterly hard coking coal production was 30 per cent lower than the first quarter in 2017 and 53 per cent
lower than the fourth quarter of 2017 due to the longwall changeover and maintenance works at Kestrel, as
well as lower yield at Hail Creek impacted by coal scheduling.
Semi-soft and thermal coal production for 2017 have been restated for comparability, and exclude
production from the Coal & Allied assets following divestment in the second half of 2017. First quarter
thermal coal production was 12 per cent higher than the corresponding quarter of 2017 due to production
sequence changes at Hail Creek.
In March 2018, Rio Tinto announced it had entered into binding agreements for the sale of its remaining
coal assets for total consideration of $4.15 billion, as follows:
On 20 March, it was announced that an agreement was signed with Glencore for the sale of Rio
Tinto’s entire 82 per cent interest in the Hail Creek coal mine and 72.1 per cent interest in the
Valeria coal development project, both in Queensland, Australia, for $1.7 billion;
On 22 March, it was announced that an agreement was signed with Whitehaven Coal Limited for
the sale of Rio Tinto’s 75 per cent interest in the Winchester South coal development project in
Queensland, Australia, for $200 million; and
On 27 March, it was announced that an agreement was entered into with a consortium comprising
private equity manager EMR Capital and PT Adaro Energy Tbk, an Indonesian listed coal
company, for the sale of Rio Tinto’s entire 80 per cent interest in the Kestrel underground coal
mine in Queensland, Australia, for $2.25 billion.
Subject to all regulatory approvals and other conditions precedent being satisfied, completion for the
Winchester South project is expected to occur in the second quarter of 2018, whilst completion of the
remaining transactions is expected to occur in the second half of 2018.
Rio Tinto anticipates that Australian income tax will be payable on sale proceeds which are in excess of
the cost base of the assets at completion. The currently estimated total tax payable for these transactions
is in the order of $0.8 billion, however the quantum of tax payable will depend on the final proceeds (after
taking into account working capital adjustments), the tax cost base at completion and the total of capital
gains and losses realised by the Rio Tinto Australian tax consolidated group at 31 December 2018.

Page 7 of 29
Iron Ore Company of Canada (IOC)
IOC pellet production of 2.7 million tonnes (Rio Tinto share 1.6 million tonnes) was seven per cent higher
than the first quarter of 2017, with strong pellet demand continuing to be strong and product mix being
optimised to meet customer demand. Concentrate production for sale of 1.4 million tonnes (Rio Tinto share
0.8 million tonnes) was 28 per cent lower than the same period in 2017, mainly attributable to increased
ore hardness and an unplanned shutdown of the Parallel Ore Delivery System. As a result, total sales in
the first quarter of 4.0 million tonnes (Rio Tinto share 2.3 million tonnes), were 11 per cent lower than the
corresponding period of 2017.
Collective bargaining negotiations at IOC’s Labrador City operation were suspended on 27 March 2018
without an agreement being reached. The local union workforce voted to strike and operations were
suspended from that date. Progress has been made to reach a new labour agreement, and a vote is
imminent. The priority remains to reach a mutually beneficial agreement with employees and a safe return
to operations.
Borates
Borates production was one per cent higher than the first quarter of 2017, with production aligned to
market demand.
Iron and Titanium (RTIT)
Titanium dioxide slag production for the quarter was 12 per cent lower compared to the first quarter of
2017, due to a roaster failure at RBM resulting in a force majeure declaration, as well as the unplanned
shutdown of a furnace at Rio Tinto Fer et Titane (RTFT).
Slag production at RBM for the second quarter of 2018 will be impacted by a labour dispute between
contractors and their employees, which halted both mine and smelter operations. As a result, RBM has
declared a separate force majeure on deliveries to its titanium dioxide feedstock customers, which will be
lifted once the operation returns to normal operating capacity. Operations at RBM were restarted on 11
April 2018, and the mine is expected to return to previous operating capacity later this year.
One of nine furnaces at RTFT remains idle, along with one of four furnaces at RBM. The focus remains on
maximising the productivity of the furnaces currently in operation, and a decision to re-start idle furnaces
will be based on maximising value over volume.
Salt
Salt production in the first quarter of 2018 was significantly higher than the first quarter of 2017 as a result
of fewer weather events experienced compared to last year.
Uranium
Energy Resources of Australia continues to process existing low grade stockpiles. 2018 first quarter
production was 26 per cent lower than the same period of 2017 due to mill maintenance and declining
grades as laterite stocks are largely exhausted.
Production at Rössing in the first quarter of 2018 was 26 per cent higher than the corresponding quarter of
2017 due to higher grades.
2018 guidance
Coal production guidance remains at 7.5 to 8.5 million tonnes of hard coking coal and 3.8 to 4.5 million
tonnes of thermal coal. This assumes continued ownership of the coal assets until the end of 2018, and will
be adjusted subject to the timing of completion of the asset disposals.
At IOC, the revised guidance for 2018 production is 10.3 to 11.3 million tonnes of iron ore pellets and
concentrates (previously 11.5 to 12.5 million tonnes). This adjustment assumes a vote in favour of the new
collective bargaining agreement and represents the loss of about one month’s production.

Page 8 of 29
Guidance for Rio Tinto’s expected share of titanium dioxide slag production in 2018 has been revised to
1.1 to 1.3 million tonnes (previously 1.2 to 1.4 million tonnes) following the operational and labour
disruptions at RBM.
Guidance for Rio Tinto’s expected share of boric oxide equivalent production in 2018 is unchanged at 0.5
million tonnes and guidance for uranium production in 2018 is unchanged at 6.2 to 7.2 million pounds.

Page 9 of 29
EXPLORATION AND EVALUATION
Pre-tax and pre-divestment expenditure on exploration and evaluation charged to the profit and loss
account in the first quarter of 2018 was $101 million, compared with $78 million in the first quarter of 2017.
Approximately 47 per cent of this expenditure was incurred by central exploration, 37 per cent by Copper &
Diamonds, seven per cent by Energy & Minerals and the remainder by Iron Ore and Aluminium.
There were no significant divestments of central exploration properties in the first quarter of 2018.
Exploration highlights
Rio Tinto has a strong portfolio of projects with activity in 16 countries across some eight commodities. The
bulk of the exploration expenditure in this quarter was focused on copper targets in Australia, Chile,
Kazakhstan, Mongolia, Papua New Guinea, Peru, Serbia, United States and Zambia. Mine-lease
exploration continued at a number of Rio Tinto managed businesses including Pilbara Iron, Richards Bay
Minerals, Oyu Tolgoi and Weipa.
A summary of activity for the quarter is as follows:
Product Group Evaluation
projects
Advanced
projects
Greenfield
programmes
Aluminium Cape York, Australia Amargosa, Brazil Australia, Laos
Copper &
Diamonds
Copper/molybdenum:
Resolution, US
Copper: La Granja, Peru
Copper/gold: Oyu Tolgoi,
Mongolia
Nickel: Tamarack, US
Diamonds: Fort a la
Corne, Canada
Copper: Australia,
Botswana, Chile, China,
Kazakhstan, Mongolia,
Namibia, Papua New
Guinea, Peru, Serbia, US,
Zambia
Nickel: Australia, Canada
Diamonds: Canada
Energy &
Minerals
Lithium borates: Jadar,
Serbia
Heavy mineral sands:
Mutamba, Mozambique
and Zulti South, South
Africa
Uranium: Roughrider,
Canada
Potash: KP405, Canada Uranium: Canada
Heavy mineral sands:
Tanzania
Iron Ore Pilbara, Australia Pilbara, Australia

Page 10 of 29
Forward-looking statements
This announcement may include "forward-looking statements" within the meaning of the US Private Securities Litigation Reform Act of 1995. All statements other than statements of historical facts included in this announcement, including, without limitation, those regarding Rio Tinto’s production forecast or guidance, financial position, business strategy, plans and objectives of management for future operations (including development plans and objectives relating to Rio Tinto’s products and reserve and resource positions), are forward-looking statements. The words “intend”, “aim”, “project”, “anticipate”, “estimate”, “plan”, “believes”, “expects”, “may”, “should”, “will”, “target”, “set to”, “assumes” or similar expressions, commonly identify such forward looking statements. Such forward-looking statements involve known and unknown risks, uncertainties and other factors which may cause the actual production, performance or results of Rio Tinto to be materially different from any future production, performance or results expressed or implied by such forward-looking statements. Such forward-looking statements could be influenced by such risk factors as identified in Rio Tinto's most recent Annual Report and Accounts in Australia and the United Kingdom and the most recent Annual Report on Form 20-F filed with the United States Securities and Exchange Commission (the "SEC") or Form 6-Ks furnished to, or filed with, the SEC. Forward-looking statements should, therefore, be construed in light of such risk factors and undue reliance should not be placed on forward-looking statements. These forward-looking statements speak only as of the date of this announcement. Rio Tinto expressly disclaims any obligation or undertaking (except as required by applicable law, the UK Listing Rules, the Disclosure and Transparency Rules of the Financial Conduct Authority and the Listing Rules of the Australian Securities Exchange) to release publicly any updates or revisions to any forward-looking statement contained herein to reflect any change in Rio Tinto’s expectations with regard thereto or any change in events, conditions or circumstances on which any such statement is based. Nothing in this announcement should be interpreted to mean that future earnings per share of Rio Tinto plc or Rio Tinto Limited will necessarily match or exceed its historical published earnings per share.

Page 11 of 29
Contacts
www.riotinto.com
Follow @riotinto on Twitter
Media Relations, United Kingdom
Illtud Harri
T +44 20 7781 1152
M +44 7920 503 600
David Outhwaite
T +44 20 7781 1623
M +44 7787 597 493
Investor Relations, EMEA/Americas
John Smelt
T +44 20 7781 1654
M +44 7879 642 675
David Ovington
T +44 20 7781 2051
M +44 7920 010 978
Nick Parkinson
T +44 20 7781 1552
M +44 7810 657 556
Media Relations, Australia
Jonathan Rose
T +61 3 9283 3088
M +61 447 028 913
Investor Relations, Australia/Asia
Natalie Worley
T +61 3 9283 3063
M +61 409 210 462
Rachel Storrs
T +61 3 9283 3628
M +61 417 401 018
Rio Tinto plc
6 St James’s Square
London SW1Y 4AD
United Kingdom
T +44 20 7781 2000
Registered in England
No. 719885
Rio Tinto Limited
Level 7, 360 Collins Street
Melbourne 3000
Australia
T +61 3 9283 3333
Registered in Australia
ABN 96 004 458 404
Page 12 of 29
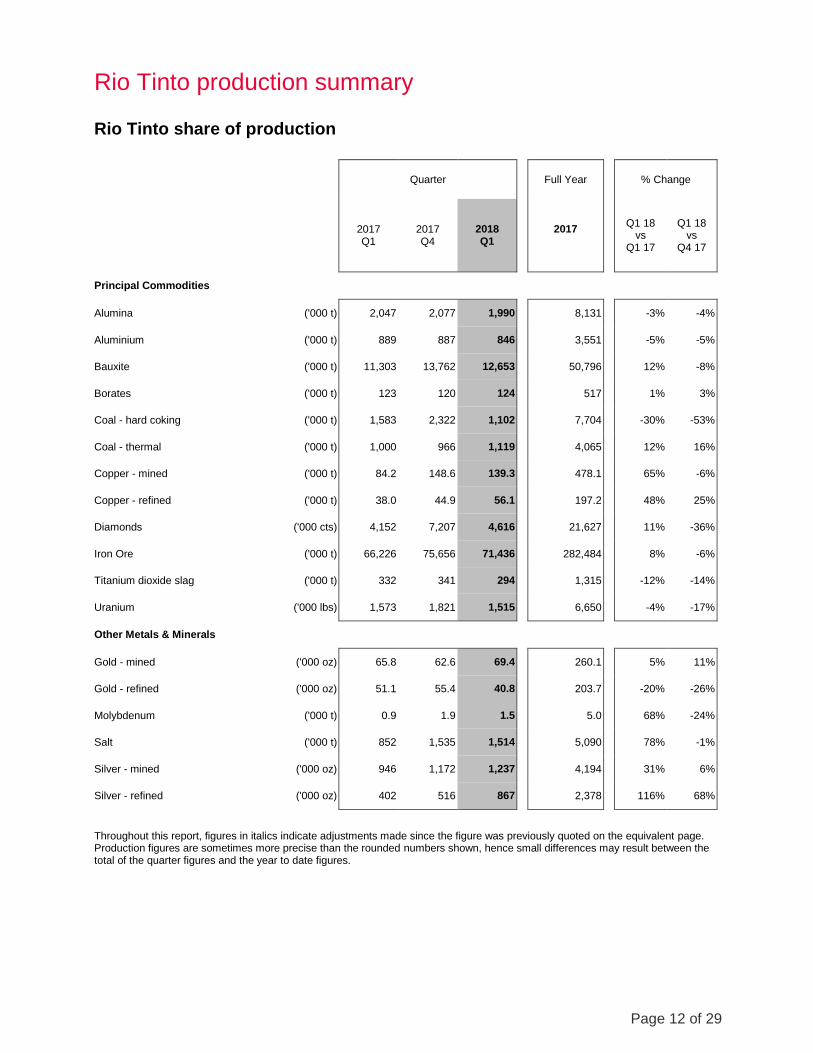
Rio Tinto production summary
Rio Tinto share of production
Quarter Full Year % Change
2017 Q1
2017 Q4
2018 Q1
2017
Q1 18 vs
Q1 17
Q1 18 vs
Q4 17
Principal Commodities
Alumina ('000 t) 2,047 2,077 1,990 8,131 -3% -4%
Aluminium ('000 t) 889 887 846 3,551 -5% -5%
Bauxite ('000 t) 11,303 13,762 12,653 50,796 12% -8%
Borates ('000 t) 123 120 124 517 1% 3%
Coal - hard coking ('000 t) 1,583 2,322 1,102 7,704 -30% -53%
Coal - thermal ('000 t) 1,000 966 1,119 4,065 12% 16%
Copper - mined ('000 t) 84.2 148.6 139.3 478.1 65% -6%
Copper - refined ('000 t) 38.0 44.9 56.1 197.2 48% 25%
Diamonds ('000 cts) 4,152 7,207 4,616 21,627 11% -36%
Iron Ore ('000 t) 66,226 75,656 71,436 282,484 8% -6%
Titanium dioxide slag ('000 t) 332 341 294 1,315 -12% -14%
Uranium ('000 lbs) 1,573 1,821 1,515 6,650 -4% -17%
Other Metals & Minerals
Gold - mined ('000 oz) 65.8 62.6 69.4 260.1 5% 11%
Gold - refined ('000 oz) 51.1 55.4 40.8 203.7 -20% -26%
Molybdenum ('000 t) 0.9 1.9 1.5 5.0 68% -24%
Salt ('000 t) 852 1,535 1,514 5,090 78% -1%
Silver - mined ('000 oz) 946 1,172 1,237 4,194 31% 6%
Silver - refined ('000 oz) 402 516 867 2,378 116% 68%
Throughout this report, figures in italics indicate adjustments made since the figure was previously quoted on the equivalent page. Production figures are sometimes more precise than the rounded numbers shown, hence small differences may result between the total of the quarter figures and the year to date figures.

Page 13 of 29
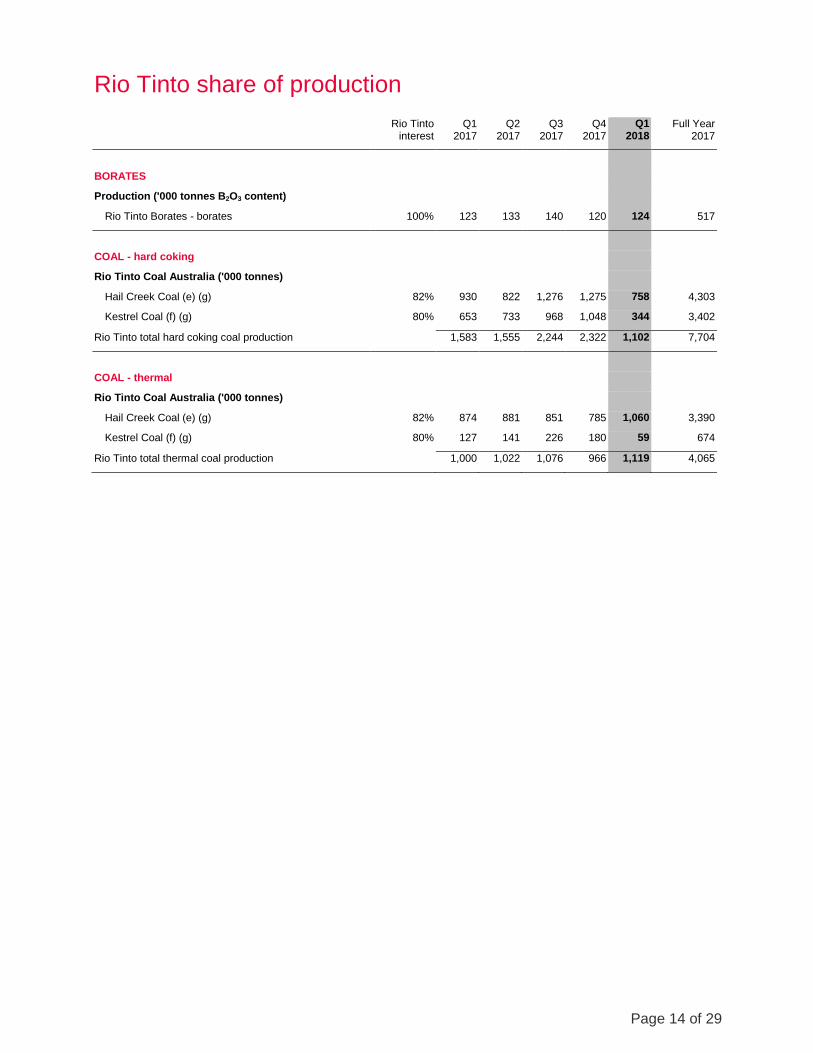
Rio Tinto share of production
Rio Tinto interest
Q1 2017
Q2 2017
Q3 2017
Q4 2017
Q1 2018
Full Year 2017
ALUMINA
Production ('000 tonnes)
Jonquière (Vaudreuil) 100% 367 365 351 365 362 1,448
Jonquière (Vaudreuil) specialty Alumina plant 100% 31 32 30 29 31 122
Queensland Alumina 80% 739 756 720 773 717 2,988
São Luis (Alumar) 10% 89 93 94 93 87 370
Yarwun 100% 819 778 790 816 793 3,203
Rio Tinto total alumina production 2,047 2,024 1,984 2,077 1,990 8,131
ALUMINIUM
Production ('000 tonnes)
Australia - Bell Bay 100% 45 47 48 47 47 187
Australia - Boyne Island 59% 80 73 74 74 72 302
Australia - Tomago 52% 75 76 77 77 75 304
Canada - six wholly owned 100% 394 397 401 405 398 1,596
Canada - Alouette (Sept-Îles) 40% 60 60 60 60 58 239
Canada - Bécancour 25% 28 26 28 27 10 110
France - Dunkerque (a) 100% 70 71 71 72 51 284
Iceland - ISAL (Reykjavik) (b) 100% 52 53 53 54 52 212
New Zealand - Tiwai Point 79% 66 67 67 67 66 267
Oman - Sohar 20% 19 19 7 5 17 51
Rio Tinto total aluminium production 889 888 887 887 846 3,551
BAUXITE
Production ('000 tonnes) (c)
Gove 100% 2,388 2,780 2,809 3,224 3,124 11,201
Porto Trombetas 12% 357 489 492 426 353 1,764
Sangaredi (d) 1,665 1,791 1,670 1,809 1,745 6,934
Weipa 100% 6,893 7,805 7,895 8,304 7,431 30,898
Rio Tinto total bauxite production 11,303 12,865 12,867 13,762 12,653 50,796
Page 14 of 29
Rio Tinto share of production
Rio Tinto interest
Q1 2017
Q2 2017
Q3 2017
Q4 2017
Q1 2018
Full Year 2017
BORATES
Production ('000 tonnes B2O3 content)
Rio Tinto Borates - borates 100% 123 133 140 120 124 517
COAL - hard coking
Rio Tinto Coal Australia ('000 tonnes)
Hail Creek Coal (e) (g) 82% 930 822 1,276 1,275 758 4,303
Kestrel Coal (f) (g) 80% 653 733 968 1,048 344 3,402
Rio Tinto total hard coking coal production 1,583 1,555 2,244 2,322 1,102 7,704
COAL - thermal
Rio Tinto Coal Australia ('000 tonnes)
Hail Creek Coal (e) (g) 82% 874 881 851 785 1,060 3,390
Kestrel Coal (f) (g) 80% 127 141 226 180 59 674
Rio Tinto total thermal coal production 1,000 1,022 1,076 966 1,119 4,065

Page 15 of 29
Rio Tinto share of production
Rio Tinto interest
Q1 2017
Q2 2017
Q3 2017
Q4 2017
Q1 2018
Full Year 2017
COPPER
Mine production ('000 tonnes) (c)
Bingham Canyon 100% 44.3 44.0 25.8 34.8 35.4 148.9
Escondida 30% 27.2 68.3 82.5 92.9 90.9 270.8
Grasberg - Joint Venture (h) 40% 0.0 0.0 0.0 5.7 0.0 5.7
Oyu Tolgoi (i) 34% 12.8 12.5 12.4 15.2 13.0 52.8
Rio Tinto total mine production
84.2 124.7 120.6 148.6 139.3 478.1
Refined production ('000 tonnes)
Escondida 30% 8.2 18.8 21.6 22.8 20.8 71.4
Rio Tinto Kennecott 100% 29.8 20.3 53.6 22.1 35.3 125.8
Rio Tinto total refined production 38.0 39.1 75.2 44.9 56.1 197.2
DIAMONDS
Production ('000 carats)
Argyle 100% 3,016 3,216 4,757 6,146 3,551 17,135
Diavik 60% 1,136 1,119 1,177 1,060 1,065 4,492
Rio Tinto total diamond production 4,152 4,335 5,933 7,207 4,616 21,627
GOLD
Mine production ('000 ounces) (c)
Bingham Canyon 100% 54.1 54.3 33.6 35.9 37.4 177.9
Escondida 30% 3.4 10.2 15.2 15.1 18.0 43.9
Grasberg - Joint Venture (h) 40% 0.0 0.0 0.0 0.0 0.0 0.0
Oyu Tolgoi (i) 34% 8.3 8.0 10.4 11.7 14.0 38.3
Rio Tinto total mine production
65.8 72.5 59.1 62.6 69.4 260.1
Refined production ('000 ounces)
Rio Tinto Kennecott 100% 51.1 43.0 54.1 55.4 40.8 203.7
Page 16 of 29
Rio Tinto share of production
Rio Tinto interest
Q1 2017
Q2 2017
Q3 2017
Q4 2017
Q1 2018
Full Year 2017
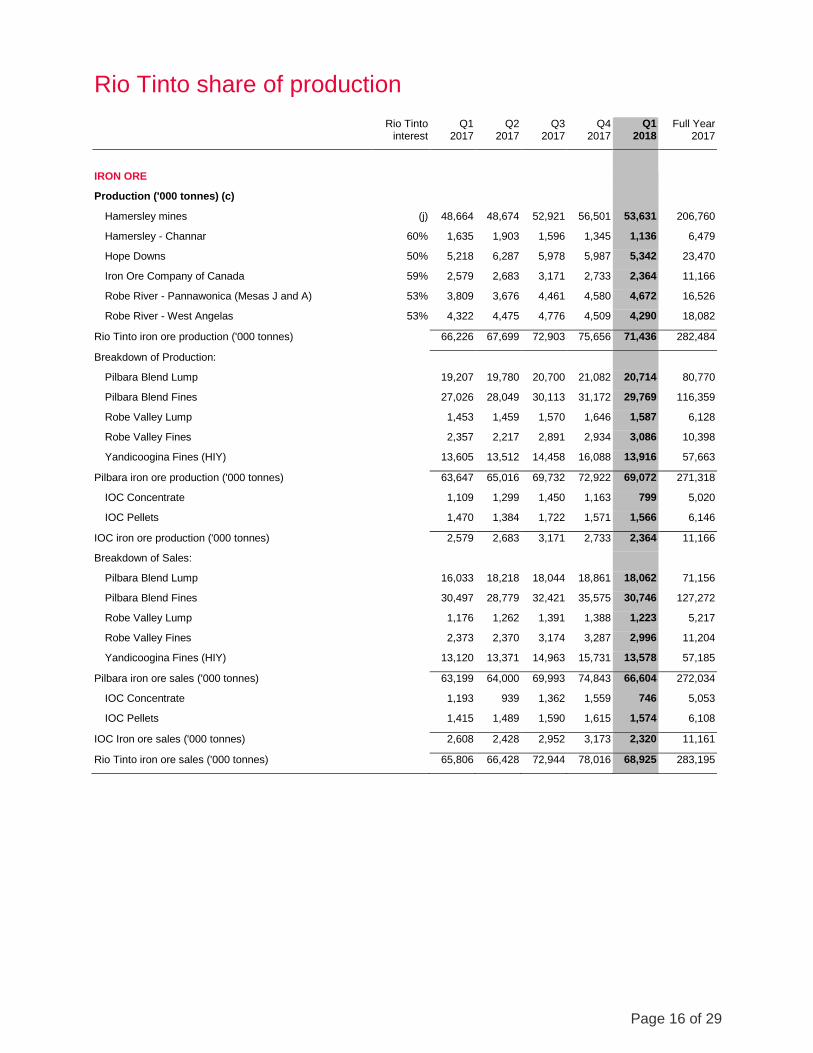
IRON ORE
Production ('000 tonnes) (c)
Hamersley mines (j) 48,664 48,674 52,921 56,501 53,631 206,760
Hamersley - Channar 60% 1,635 1,903 1,596 1,345 1,136 6,479
Hope Downs 50% 5,218 6,287 5,978 5,987 5,342 23,470
Iron Ore Company of Canada 59% 2,579 2,683 3,171 2,733 2,364 11,166
Robe River - Pannawonica (Mesas J and A) 53% 3,809 3,676 4,461 4,580 4,672 16,526
Robe River - West Angelas 53% 4,322 4,475 4,776 4,509 4,290 18,082
Rio Tinto iron ore production ('000 tonnes)
66,226 67,699 72,903 75,656 71,436 282,484
Breakdown of Production:
Pilbara Blend Lump
19,207 19,780 20,700 21,082 20,714 80,770
Pilbara Blend Fines
27,026 28,049 30,113 31,172 29,769 116,359
Robe Valley Lump
1,453 1,459 1,570 1,646 1,587 6,128
Robe Valley Fines
2,357 2,217 2,891 2,934 3,086 10,398
Yandicoogina Fines (HIY)
13,605 13,512 14,458 16,088 13,916 57,663
Pilbara iron ore production ('000 tonnes)
63,647 65,016 69,732 72,922 69,072 271,318
IOC Concentrate
1,109 1,299 1,450 1,163 799 5,020
IOC Pellets
1,470 1,384 1,722 1,571 1,566 6,146
IOC iron ore production ('000 tonnes)
2,579 2,683 3,171 2,733 2,364 11,166
Breakdown of Sales:
Pilbara Blend Lump
16,033 18,218 18,044 18,861 18,062 71,156
Pilbara Blend Fines
30,497 28,779 32,421 35,575 30,746 127,272
Robe Valley Lump
1,176 1,262 1,391 1,388 1,223 5,217
Robe Valley Fines
2,373 2,370 3,174 3,287 2,996 11,204
Yandicoogina Fines (HIY)
13,120 13,371 14,963 15,731 13,578 57,185
Pilbara iron ore sales ('000 tonnes)
63,199 64,000 69,993 74,843 66,604 272,034
IOC Concentrate
1,193 939 1,362 1,559 746 5,053
IOC Pellets
1,415 1,489 1,590 1,615 1,574 6,108
IOC Iron ore sales ('000 tonnes)
2,608 2,428 2,952 3,173 2,320 11,161
Rio Tinto iron ore sales ('000 tonnes) 65,806 66,428 72,944 78,016 68,925 283,195

Page 17 of 29
Rio Tinto share of production
Rio Tinto interest
Q1 2017
Q2 2017
Q3 2017
Q4 2017
Q1 2018
Full Year 2017
MOLYBDENUM
Mine production ('000 tonnes) (c)
Bingham Canyon 100% 0.9 0.8 1.4 1.9 1.5 5.0
SALT
Production ('000 tonnes)
Dampier Salt 68% 852 1,476 1,227 1,535 1,514 5,090
SILVER
Mine production ('000 ounces) (c)
Bingham Canyon 100% 711 669 357 418 461 2,156
Escondida 30% 163 370 521 658 702 1,712
Grasberg - Joint Venture (h) 40% 0 0 0 0 0 0
Oyu Tolgoi (i) 34% 72 79 80 96 74 326
Rio Tinto total mine production
946 1,118 959 1,172 1,237 4,194
Refined production ('000 ounces)
Rio Tinto Kennecott 100% 402 729 731 516 867 2,378
TITANIUM DIOXIDE SLAG
Production ('000 tonnes)
Rio Tinto Iron & Titanium (k) 100% 332 316 327 341 294 1,315
URANIUM
Production ('000 lbs U3O8) (l)
Energy Resources of Australia 68% 900 678 962 919 667 3,458
Rössing 69% 673 860 757 902 848 3,192
Rio Tinto total uranium production 1,573 1,538 1,718 1,821 1,515 6,650

Page 18 of 29
Production data notes:
Production figures are sometimes more precise than the rounded numbers shown, hence small differences may result between the total of the quarter figures and the year to date figures.
(a) On 10 January 2018, Rio Tinto announced a binding offer to sell its 100% interest in the Dunkerque smelter. (b) On 26 February 2018, Rio Tinto announced a binding offer to sell its 100% interest in the ISAL smelter. (c) Mine production figures for metals refer to the total quantity of metal produced in concentrates, leach liquor or doré bullion irrespective of whether these products are then refined onsite, except for the data for bauxite and iron ore which represent production of marketable quantities of ore plus concentrates and pellets. (d) Rio Tinto has a 22.95% shareholding in the Sangaredi mine but benefits from 45.0% of production.
(e) On 20 March 2018, Rio Tinto announced a binding offer to sell its 82% interest in the Hail Creek mine. (f) On 27 March 2018, Rio Tinto announced a binding offer to sell its 80% interest in the Kestrel mine. (g) Kestrel and Hail Creek produce hard coking coal and thermal coal through their mining operations. Both mines may blend coal types at ports. (h) Through a joint venture agreement with Freeport-McMoRan (FCX), Rio Tinto is entitled to 40% of additional material mined as a consequence of expansions and developments of the Grasberg facilities since 1998. (i) Rio Tinto owns a 33.52% indirect interest in Oyu Tolgoi through its 50.79% interest in Turquoise Hill Resources Ltd. (j) Includes 100% of production from Paraburdoo, Mt Tom Price, Marandoo, Yandicoogina, Brockman, Nammuldi, Silvergrass and the Eastern Range mines. Whilst Rio Tinto owns 54% of the Eastern Range mine, under the terms of the joint venture agreement, Hamersley Iron manages the operation and is obliged to purchase all mine production from the joint venture and therefore all of the production is included in Rio Tinto's share of production. (k) Quantities comprise 100% of Rio Tinto Fer et Titane and Rio Tinto's 74% interest in Richards Bay Minerals (RBM). (l) ERA and Rössing production reported are drummed U3O8.
The Rio Tinto percentage shown above is at 31 March 2018.
Rio Tinto's interest in the Coal and Allied mines were sold in 2017. No data for these operations are included in the Share of production table.

Page 19 of 29
Rio Tinto operational data
Rio Tinto interest
Q1 2017
Q2 2017
Q3 2017
Q4 2017
Q1 2018
Full Year 2017
ALUMINA
Smelter Grade Alumina - Aluminium Group
Alumina production ('000 tonnes)
Australia
Queensland Alumina Refinery - Queensland 80.0% 924 946 900 966 896 3,735
Yarwun refinery - Queensland 100.0% 819 778 790 816 793 3,203
Brazil
São Luis (Alumar) refinery 10.0% 895 931 937 934 871 3,697
Canada
Jonquière (Vaudreuil) refinery - Quebec (a) 100.0% 367 365 351 365 362 1,448
(a) Jonquière’s (Vaudreuil’s) production shows smelter grade alumina only and excludes hydrate produced and used for specialty alumina.
Specialty Alumina - Aluminium Group
Specialty alumina production ('000 tonnes)
Canada
Jonquière (Vaudreuil) plant – Quebec 100.0% 31 32 30 29 31 122
Rio Tinto percentage interest shown above is at 31 March 2018. The data represent full production and sales on a 100% basis unless otherwise stated.

Page 20 of 29
Rio Tinto operational data
Rio Tinto interest
Q1 2017
Q2 2017
Q3 2017
Q4 2017
Q1 2018
Full Year 2017
ALUMINIUM
Primary Aluminium
Primary aluminium production ('000 tonnes)
Australia
Bell Bay smelter - Tasmania 100.0% 45 47 48 47 47 187
Boyne Island smelter - Queensland 59.4% 135 124 125 124 122 508
Tomago smelter - New South Wales 51.6% 145 147 149 149 145 590
Canada
Alma smelter - Quebec 100.0% 114 112 115 116 115 457
Alouette (Sept-Îles) smelter - Quebec 40.0% 149 149 150 150 144 598
Arvida smelter - Quebec 100.0% 41 43 43 44 43 171
Arvida AP60 smelter - Quebec 100.0% 15 15 14 14 13 57
Bécancour smelter - Quebec 25.1% 112 106 113 108 39 438
Grande-Baie smelter - Quebec 100.0% 57 57 58 58 57 229
Kitimat smelter - British Columbia 100.0% 107 109 108 110 108 433
Laterrière smelter - Quebec 100.0% 61 61 63 64 63 249
France
Dunkerque smelter (a) 100.0% 70 71 71 72 51 284
Iceland
ISAL (Reykjavik) smelter (b) 100.0% 52 53 53 54 52 212
New Zealand
Tiwai Point smelter 79.4% 84 84 84 85 83 337
Oman
Sohar smelter 20.0% 96 95 35 27 87 253
(a) On 10 January 2018, Rio Tinto announced a binding offer to sell its 100% interest in the Dunkerque smelter. (b) On 26 February 2018, Rio Tinto announced a binding offer to sell its 100% interest in the ISAL smelter.
Rio Tinto percentage interest shown above is at 31 March 2018. The data represent full production and sales on a 100% basis unless otherwise stated.

Page 21 of 29
Rio Tinto operational data
Rio Tinto interest
Q1 2017
Q2 2017
Q3 2017
Q4 2017
Q1 2018
Full Year 2017
BAUXITE
Bauxite production ('000 tonnes)
Australia
Gove mine - Northern Territory 100.0% 2,388 2,780 2,809 3,224 3,124 11,201
Weipa mine - Queensland 100.0% 6,893 7,805 7,895 8,304 7,431 30,898
Brazil
Porto Trombetas (MRN) mine 12.0% 2,974 4,071 4,103 3,550 2,939 14,698
Guinea
Sangaredi mine (a) 23.0% 3,699 3,979 3,711 4,020 3,878 15,409
Rio Tinto share of bauxite shipments
Share of total bauxite shipments ('000 tonnes) 11,605 12,164 12,913 13,557 12,551 50,240
Share of third party bauxite shipments ('000 tonnes) 6,927 7,962 8,250 9,164 8,248 32,303
(a) Rio Tinto has a 22.95% shareholding in the Sangaredi mine but benefits from 45.0% of production.
Rio Tinto percentage interest shown above is at 31 March 2018. The data represent full production and sales on a 100% basis unless otherwise stated.

Page 22 of 29
Rio Tinto operational data
Rio Tinto interest
Q1 2017
Q2 2017
Q3 2017
Q4 2017
Q1 2018
Full Year 2017
BORATES
Rio Tinto Borates - borates 100.0%
US
Borates ('000 tonnes) (a)
123 133 140 120 124 517
(a) Production is expressed as B2O3 content.
COAL
Rio Tinto Coal Australia
Hail Creek Coal mine (a) 82.0%
Queensland
Hard coking coal ('000 tonnes)
1,134 1,002 1,556 1,555 924 5,247
Thermal coal ('000 tonnes)
1,065 1,074 1,037 958 1,293 4,134
Hunter Valley Operations (b) 0.0%
New South Wales
Semi-soft coking coal ('000 tonnes)
800 284 445 - - 1,529
Thermal coal ('000 tonnes)
2,851 3,539 2,112 - - 8,502
Kestrel Coal mine (c) 80.0%
Queensland
Hard coking coal ('000 tonnes)
816 916 1,210 1,309 430 4,252
Thermal coal ('000 tonnes)
159 177 282 226 74 843
Mount Thorley Operations (b) 0.0%
New South Wales
Semi-soft coking coal ('000 tonnes)
337 389 149 - - 876
Thermal coal ('000 tonnes)
562 746 703 - - 2,011
Rio Tinto percentage interest shown above is at 31 March 2018. The data represent full production and sales on a 100% basis unless otherwise stated.

Page 23 of 29
Rio Tinto operational data
Rio Tinto interest
Q1 2017
Q2 2017
Q3 2017
Q4 2017
Q1 2018
Full Year 2017
COAL (continued)
Warkworth mine (b) 0.0%
New South Wales
Semi-soft coking coal ('000 tonnes)
268 202 44 - - 514
Thermal coal ('000 tonnes)
1,520 1,696 1,305 - - 4,521
Total hard coking coal production ('000 tonnes) 1,950 1,918 2,766 2,864 1,354 9,499
Total semi-soft coking coal production ('000 tonnes) 1,405 875 639 - - 2,919
Total thermal coal production ('000 tonnes) 6,156 7,232 5,439 1,183 1,367 20,010
Total coal production ('000 tonnes)
9,512 10,026 8,844 4,047 2,721 32,429
Total coal sales ('000 tonnes)
8,792 9,871 9,298 4,092 3,050 32,053
Rio Tinto Coal Australia share (d)
Share of hard coking coal sales ('000 tonnes) 1,524 1,717 2,511 2,429 1,368 8,181
Share of semi-soft coal sales ('000 tonnes) (e) 765 759 485 - - 2,010
Share of thermal coal sales ('000 tonnes) (e) 3,946 4,539 3,804 896 1,119 13,186
(a) On 20 March 2018, Rio Tinto announced a binding offer to sell its 82% interest in the Hail Creek mine. (b) On 1 September 2017, Rio Tinto completed the sale of Coal & Allied, a wholly owned subsidiary of Rio Tinto Coal Australia (RTCA) and production from these assets is included to this date. This included Coal & Allied’s 67.6% interest in the Hunter Valley Operations mine, 80% interest in the Mount Thorley mine and 55.6% interest in the Warkworth mine. In an earlier restructuring of the Coal & Allied group completed on 3 February 2016, Rio Tinto had obtained 100% of Coal & Allied and retained a 67.6% interest in the newly created Hunter Valley Operations joint venture. Prior to restructuring, Rio Tinto’s interest in the Hunter Valley Operations, Mount Thorley and Warkworth mines was 80%, 64% and 44.46% respectively. (c) On 27 March 2018, Rio Tinto announced a binding offer to sell its 80% interest in the Kestrel mine. (d) Kestrel and Hail Creek produce hard coking coal and thermal coal through their mining operations. Both mines may blend coal types at ports. (e) Sales relate only to coal mined by the operations and exclude traded coal.
Rio Tinto percentage interest shown above is at 31 March 2018. The data represent full production and sales on a 100% basis unless otherwise stated.

Page 24 of 29
Rio Tinto operational data
Rio Tinto interest
Q1 2017
Q2 2017
Q3 2017
Q4 2017
Q1 2018
Full Year 2017
COPPER & GOLD
Escondida 30.0%
Chile
Sulphide ore to concentrator ('000 tonnes) 8,054 18,777 24,080 30,260 32,203 81,171
Average copper grade (%)
1.01 1.07 1.06 0.98 0.96 1.03
Mill production (metals in concentrates):
Contained copper ('000 tonnes)
67.7 167.0 204.1 245.7 252.6 684.5
Contained gold ('000 ounces)
11 34 51 50 60 146
Contained silver ('000 ounces)
543 1,234 1,737 2,193 2,339 5,707
Recoverable copper in ore stacked for leaching ('000 tonnes) (a) 22.8 60.7 70.8 63.9 50.4 218.2
Refined production from leach plants:
Copper cathode production ('000 tonnes)
27.2 62.8 71.9 76.1 69.4 238.0
(a) The calculation of copper in material mined for leaching is based on ore stacked at the leach pad.
Freeport-McMoRan
Grasberg mine (a) 0.0% (b)
Papua, Indonesia
Ore treated ('000 tonnes)
7,849 11,242 15,791 16,381 17,923 51,262
Average mill head grades:
Copper (%)
1.15 1.03 0.91 1.03 1.13 1.01
Gold (g/t)
1.17 1.16 0.98 1.28 1.69 1.15
Silver (g/t)
5.26 4.09 3.96 4.36 3.05 4.32
Production of metals in concentrates:
Copper in concentrates ('000 tonnes)
81.0 103.9 130.1 153.2 184.2 468.2
Gold in concentrates ('000 ounces)
248 358 417 579 835 1,602
Silver in concentrates ('000 ounces)
667 900 1,016 1,293 1,070 3,877
Sales of payable metals in concentrates: (c)
Copper in concentrates ('000 tonnes)
61.7 124.6 109.6 154.3 180.8 450.3
Gold in concentrates ('000 ounces)
183 429 343 584 814 1,540
Silver in concentrates ('000 ounces)
404 851 666 1,044 857 2,964
(a) Through a joint venture agreement with Freeport-McMoRan (FCX), Rio Tinto is entitled to 40% of additional material mined as a consequence of expansions and developments of the Grasberg facilities since 1998. The Q1 2018 results show the forecast from FCX's most recent five-year plan, because FCX is not releasing its actual 100% operating data for Q1 2018 until the release of its 2018 first-quarter results on 24 April 2018. (b) Rio Tinto share of Grasberg production is 40% of the expansion. (c) Net of smelter deductions.
Rio Tinto percentage interest shown above is at 31 March 2018. The data represent full production and sales on a 100% basis unless otherwise stated.
Page 25 of 29
Rio Tinto operational data
Rio Tinto interest
Q1 2017
Q2 2017
Q3 2017
Q4 2017
Q1 2018
Full Year 2017
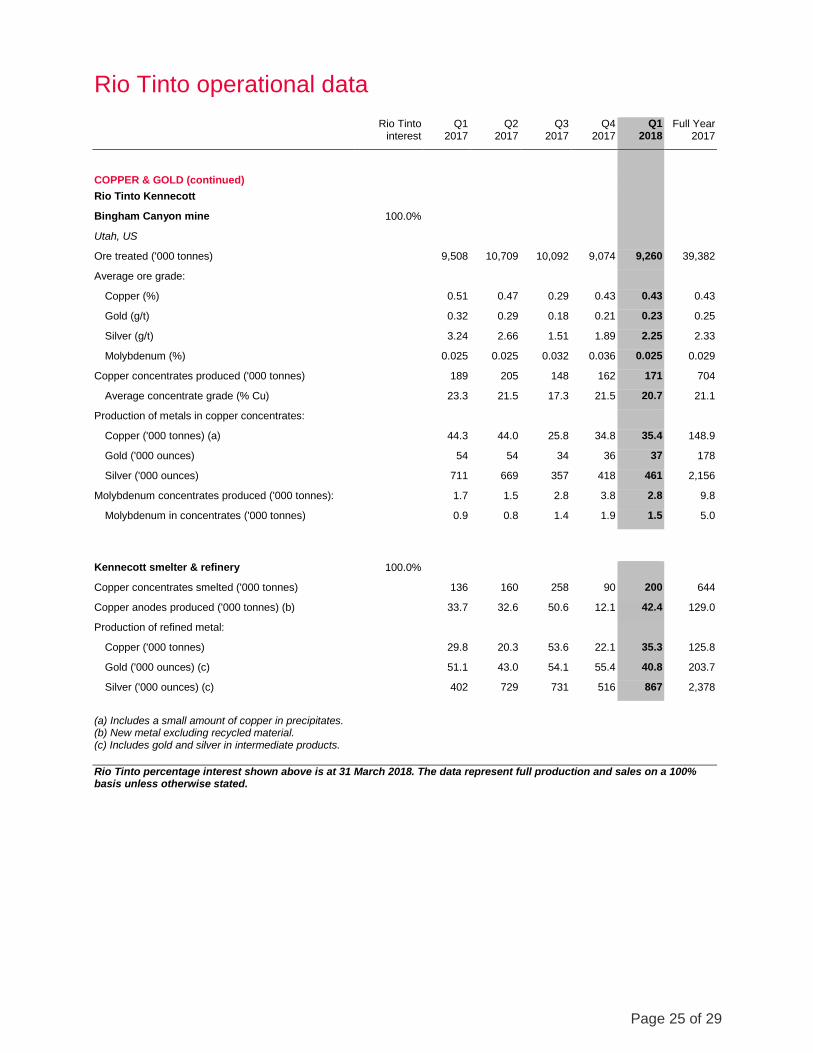
COPPER & GOLD (continued)
Rio Tinto Kennecott
Bingham Canyon mine 100.0%
Utah, US
Ore treated ('000 tonnes)
9,508 10,709 10,092 9,074 9,260 39,382
Average ore grade:
Copper (%)
0.51 0.47 0.29 0.43 0.43 0.43
Gold (g/t)
0.32 0.29 0.18 0.21 0.23 0.25
Silver (g/t)
3.24 2.66 1.51 1.89 2.25 2.33
Molybdenum (%)
0.025 0.025 0.032 0.036 0.025 0.029
Copper concentrates produced ('000 tonnes) 189 205 148 162 171 704
Average concentrate grade (% Cu)
23.3 21.5 17.3 21.5 20.7 21.1
Production of metals in copper concentrates:
Copper ('000 tonnes) (a)
44.3 44.0 25.8 34.8 35.4 148.9
Gold ('000 ounces)
54 54 34 36 37 178
Silver ('000 ounces)
711 669 357 418 461 2,156
Molybdenum concentrates produced ('000 tonnes): 1.7 1.5 2.8 3.8 2.8 9.8
Molybdenum in concentrates ('000 tonnes)
0.9 0.8 1.4 1.9 1.5 5.0
Kennecott smelter & refinery 100.0%
Copper concentrates smelted ('000 tonnes) 136 160 258 90 200 644
Copper anodes produced ('000 tonnes) (b) 33.7 32.6 50.6 12.1 42.4 129.0
Production of refined metal:
Copper ('000 tonnes)
29.8 20.3 53.6 22.1 35.3 125.8
Gold ('000 ounces) (c)
51.1 43.0 54.1 55.4 40.8 203.7
Silver ('000 ounces) (c)
402 729 731 516 867 2,378
(a) Includes a small amount of copper in precipitates. (b) New metal excluding recycled material. (c) Includes gold and silver in intermediate products.
Rio Tinto percentage interest shown above is at 31 March 2018. The data represent full production and sales on a 100% basis unless otherwise stated.
Page 26 of 29
Rio Tinto operational data
Rio Tinto interest
Q1 2017
Q2 2017
Q3 2017
Q4 2017
Q1 2018
Full Year 2017
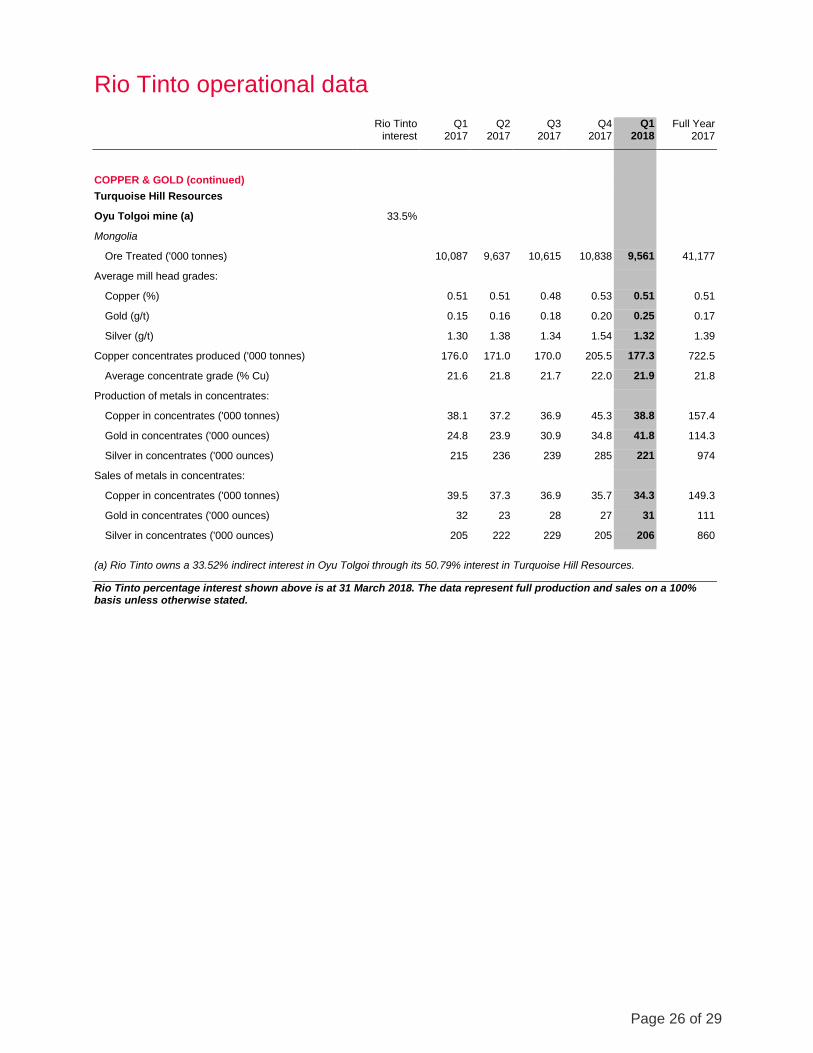
COPPER & GOLD (continued)
Turquoise Hill Resources
Oyu Tolgoi mine (a) 33.5%
Mongolia
Ore Treated ('000 tonnes)
10,087 9,637 10,615 10,838 9,561 41,177
Average mill head grades:
Copper (%)
0.51 0.51 0.48 0.53 0.51 0.51
Gold (g/t)
0.15 0.16 0.18 0.20 0.25 0.17
Silver (g/t)
1.30 1.38 1.34 1.54 1.32 1.39
Copper concentrates produced ('000 tonnes) 176.0 171.0 170.0 205.5 177.3 722.5
Average concentrate grade (% Cu)
21.6 21.8 21.7 22.0 21.9 21.8
Production of metals in concentrates:
Copper in concentrates ('000 tonnes)
38.1 37.2 36.9 45.3 38.8 157.4
Gold in concentrates ('000 ounces)
24.8 23.9 30.9 34.8 41.8 114.3
Silver in concentrates ('000 ounces)
215 236 239 285 221 974
Sales of metals in concentrates:
Copper in concentrates ('000 tonnes)
39.5 37.3 36.9 35.7 34.3 149.3
Gold in concentrates ('000 ounces)
32 23 28 27 31 111
Silver in concentrates ('000 ounces)
205 222 229 205 206 860
(a) Rio Tinto owns a 33.52% indirect interest in Oyu Tolgoi through its 50.79% interest in Turquoise Hill Resources.
Rio Tinto percentage interest shown above is at 31 March 2018. The data represent full production and sales on a 100% basis unless otherwise stated.

Page 27 of 29
Rio Tinto operational data
Rio Tinto interest
Q1 2017
Q2 2017
Q3 2017
Q4 2017
Q1 2018
Full Year 2017
DIAMONDS
Argyle Diamonds 100.0%
Western Australia
AK1 ore processed ('000 tonnes)
1,144 1,112 1,255 1,446 1,260 4,957
AK1 diamonds produced ('000 carats)
3,016 3,216 4,757 6,146 3,551 17,135
Diavik Diamonds 60.0%
Northwest Territories, Canada
Ore processed ('000 tonnes)
531 556 578 525 556 2,190
Diamonds recovered ('000 carats)
1,894 1,865 1,961 1,767 1,774 7,486
Rio Tinto percentage interest shown above is at 31 March 2018. The data represent full production and sales on a 100% basis unless otherwise stated.

Page 28 of 29
Rio Tinto operational data
Rio Tinto
interest Q1
2017 Q2
2017 Q3
2017 Q4
2017 Q1
2018 Full Year
2017
IRON ORE
Rio Tinto Iron Ore
Western Australia
Pilbara Operations
Saleable iron ore production ('000 tonnes)
Hamersley mines (a) 48,664 48,674 52,921 56,501 53,631 206,760
Hamersley - Channar 60.0% 2,725 3,172 2,661 2,241 1,893 10,798
Hope Downs 50.0% 10,435 12,575 11,956 11,975 10,685 46,941
Robe River - Pannawonica (Mesas J and A) 53.0% 7,188 6,936 8,416 8,642 8,816 31,182
Robe River - West Angelas 53.0% 8,154 8,444 9,011 8,507 8,094 34,116
Total production ('000 tonnes) 77,165 79,801 84,965 87,866 83,120 329,797
Breakdown of total production:
Pilbara Blend Lump
23,618 24,671 25,342 25,496 24,831 99,127
Pilbara Blend Fines
32,755 34,682 36,748 37,641 35,556 141,826
Robe Valley Lump
2,741 2,753 2,962 3,106 2,993 11,563
Robe Valley Fines
4,446 4,183 5,454 5,535 5,823 19,619
Yandicoogina Fines (HIY)
13,605 13,512 14,458 16,088 13,916 57,663
Breakdown of total sales:
Pilbara Blend Lump
20,161 21,561 21,959 22,377 21,457 86,059
Pilbara Blend Fines
36,679 35,871 40,305 43,039 37,320 155,895
Robe Valley Lump
2,218 2,382 2,624 2,619 2,307 9,843
Robe Valley Fines
4,476 4,472 5,989 6,202 5,652 21,140
Yandicoogina Fines (HIY)
13,120 13,371 14,963 15,731 13,578 57,185
Total sales ('000 tonnes) (b) 76,655 77,658 85,840 89,968 80,314 330,122
(a) Includes 100% of production from Paraburdoo, Mt Tom Price, Marandoo, Yandicoogina, Brockman, Nammuldi, Silvergrass and the Eastern Range mines. Whilst Rio Tinto owns 54% of the Eastern Range mine, under the terms of the joint venture agreement, Hamersley Iron manages the operation and is obliged to purchase all mine production from the joint venture and therefore all of the production is included in Rio Tinto's share of production. (b) Sales represent iron ore exported from Western Australian ports.
Iron Ore Company of Canada 58.7%
Newfoundland & Labrador and Quebec in Canada
Saleable iron ore production:
Concentrates ('000 tonnes)
1,889 2,212 2,469 1,980 1,360 8,549
Pellets ('000 tonnes)
2,504 2,356 2,932 2,675 2,667 10,467
IOC Total production ('000 tonnes)
4,392 4,569 5,401 4,655 4,027 19,016
Sales:
Concentrates ('000 tonnes)
2,031 1,599 2,319 2,655 1,271 8,605
Pellets ('000 tonnes)
2,409 2,536 2,707 2,750 2,681 10,402
IOC Total Sales ('000 tonnes)
4,441 4,135 5,027 5,404 3,951 19,006
Global Iron Ore Totals
Iron Ore Production ('000 tonnes)
81,558 84,370 90,365 92,521 87,146 348,814
Iron Ore Sales ('000 tonnes)
81,096 81,792 90,867 95,373 84,265 349,128
Rio Tinto percentage interest shown above is at 31 March 2018. The data represent full production and sales on a 100% basis unless otherwise stated.

Page 29 of 29
Rio Tinto operational data
Rio Tinto interest
Q1 2017
Q2 2017
Q3 2017
Q4 2017
Q1 2018
Full Year 2017
SALT
Dampier Salt 68.4%
Western Australia
Salt production ('000 tonnes) 1,246 2,159 1,795 2,246 2,215 7,446
TITANIUM DIOXIDE SLAG
Rio Tinto Iron & Titanium 100.0%
Canada and South Africa
(Rio Tinto share) (a)
Titanium dioxide slag ('000 tonnes)
332 316 327 341 294 1,315
(a) Quantities comprise 100% of Rio Tinto Fer et Titane and Rio Tinto's 74% interest in Richards Bay Minerals' production. Ilmenite mined in Madagascar is being processed in Canada.
URANIUM
Energy Resources of Australia Ltd
Ranger mine (a) 68.4%
Northern Territory, Australia
U3O8 Production ('000 lbs)
1,316 991 1,407 1,343 975 5,056
(a) ERA production data are drummed U3O8.
Rössing Uranium Ltd (a) 68.6%
Namibia
U3O8 Production ('000 lbs)
981 1,254 1,103 1,314 1,236 4,652
(a) Rössing production data are drummed U3O8.
Rio Tinto percentage interest shown above is at 31 March 2018. The data represent full production and sales on a 100% basis unless otherwise stated.


![Multimodal chromatography: debottlenecking the downstream ... · Multimodal chromatography: debottlenecking the downstream processing of monoclonal antibodies Review step [17] in](https://static.fdocuments.us/doc/165x107/5b92e15f09d3f232708cb3b1/multimodal-chromatography-debottlenecking-the-downstream-multimodal-chromatography.jpg)