First Quarter of Fiscal 2020 Supplementary Material · First Quarter of Fiscal 2020 Supplementary...
26
First Quarter of Fiscal 2020 Supplementary Material POLA ORBIS HOLDINGS INC. Director Finance, Legal & Administration, PR, IR and CSR Akira Fujii This report contains projections of performance and other projections based on information currently available and certain assumptions judged to be reasonable. Actual performance may differ materially from these projections resulting from changes in the economic environment and other risks and uncertainties.
Transcript of First Quarter of Fiscal 2020 Supplementary Material · First Quarter of Fiscal 2020 Supplementary...

First Quarter of Fiscal 2020
Supplementary Material
POLA ORBIS HOLDINGS INC.
Director
Finance, Legal & Administration,
PR, IR and CSR
Akira Fujii
This report contains projections of performance and other projections based on information currently available
and certain assumptions judged to be reasonable. Actual performance may differ materially from these projections
resulting from changes in the economic environment and other risks and uncertainties.

1. Highlights of Consolidated Performance
2. Segment Analysis
3. Forecasts for Fiscal 2020
4. Initiatives Going Forward & Appendices
1

Q1 Key Topics
Consolidated revenue and income decreased due to significantly lower revenue and income from POLA
POLA, Jurlique and THREE struggled due to the impact of Novel Coronavirus POLA overseas revenue increased, with sales in China recovering from March ORBIS operating income remained mostly unchanged year on year, with
increased profitability despite a drop in revenue Brands under development struggled due to a decrease in department store
traffic; launched duty-free sales for the new brands
Cosmetics Market
Our Group*Source: Ministry of Economy, Trade and Industry, Ministry of Internal Affairs and Communications,
Japan Tourism Agency, Japan Department Stores Association, and Intage SLI
The overall size of the Japanese cosmetics market, including exports, fell dramatically due to the impact of Novel Coronavirus
Inbound demand dropped significantly due to a decrease in foreign visitors to Japan The net domestic market is deteriorating, due to a continuing reactionary downturn following the
consumption tax hike, and changes in consumer mindset such as refraining from outside activities Further deterioration is expected following the Declaration of a State of Emergency by the Japanese
Government on April 7, and the future outlook is unclear
Ratio of Inbound Sales
to Consolidated Net Sales
FY2018 (Full year) Approx. 7%
FY2019 (Full year) Approx. 6%
FY2020 Q1 Approx. 3%
2
Our Initiatives to Prevent the Spread of Novel Coronavirus
For customers and stakeholders Refraining from overseas travel, business travel,
outside activities
Using online meetings for internal or external
meetings, events, and training, etc.
Promoting telecommuting and operational efficiency
For employees
Masks and alcohol disinfectant provided
and encouraged at storefronts
Partial suspension and refraining from
providing trial use of cosmetics
Contribution of donations to China
Provide services and carry out operations
with the health and safety of stakeholders and employees as our first priority

Consol. net sales Sales declined year on year mainly due to decreased revenue from
POLA (- ¥ 6,964 mil.), attributable to the spread of Novel Coronavirus
Cost of sales The cost of sales ratio deteriorated due to declines in sales ratios of POLA
and high price range products
Cost of sales ratio FY2019 Q1: 15.3% ⇒ FY2020 Q1: 16.4%
SG&A expenses Labor expenses: up ¥197 mil. YoY
Sales commissions: down ¥ 2,387 mil. YoY⇒ Resulted from a sales decline at POLA.
Sales related expenses : down ¥1,872 mil. YoY⇒ Curbed expenses; sales ratio at the same levels as the previous year.
Administrative expenses, etc. : up ¥609 mil. YoY⇒ Increased due to POLA’s overseas expansion.
Operating income Operating margin FY2019 Q1: 12.9% ⇒ FY2020 Q1: 4.6%
Key Factors
FY2019 FY2020 YoY Change
(mil. yen) Q1 Results Q1 Results Amount %
Consolidated net sales 52,440 43,316 (9,124) (17.4%)
Cost of sales 8,011 7,106 (905) (11.3%)
Gross profit 44,429 36,210 (8,219) (18.5%)
SG&A expenses 37,655 34,204 (3,451) (9.2%)
Operating income 6,773 2,006 (4,767) (70.4%)
3
Consolidated P&L Changes Analysis
Net Sales to Operating Income

Non-operating expenses: Foreign exchange losses ¥1,034 mil.
Loss on valuation of investment securities ¥500 mil.
Income taxes etc.: Income taxes decreased due to a decline in profit before income taxes
FY2019 FY2020 YoY Change
(mil. yen) Q1 Results Q1 Results Amount %
Operating income 6,773 2,006 (4,767) (70.4%)
Non-operating income 182 88 (93) (51.4%)
Non-operating expenses 430 2,248 1,817 422.0%
Ordinary income 6,525 (154) (6,679) -
Extraordinary income 0 0 0 418.6%
Extraordinary losses 8 744 735 -
Profit before income
taxes6,516 (898) (7,414) -
Income taxes etc. 2,362 352 (2,009) (85.1%)
Profit attributable to
non-controlling interests(2) (4) (1) -
Profit attributable to
owners of parent4,157 (1,246) (5,403) -
4
Consolidated P&L Changes Analysis
Operating Income to Profit Attributable to Owners of Parent
Key Factors

-6,000
-4,000
-2,000
0
2,000
4,000
6,000
A decline in gross profit, resulting from decreased revenue,
pushed down profit attributable to owners of parent by ¥5,403 mil. YoY
POLA revenue decreased
4,157
488
609
1,911
5
Decrease due to POLA revenue decline
(Commission rate largely unchanged)
-1,246
7,730
197
1,872
2,387735
2,010
Decrease
in gross
profit
Labor
expenses
Admin.
expenses,
etc.
Non-
operating
income
and loss
Extraordinary
income
and loss
Income
taxes,
etc.
Sales
commissions
Sales-
related
expenses
FY2019 Q1
Profit
attributable
to owners
of parent
FY2020 Q1
Profit
attributable
to owners
of parent
Deteriorated
cost of
sales ratio
Positive impact Negative impact(mil. yen)
Factors Impacting Profit Attributable to Owners of Parent
1. Highlights of Consolidated Performance
2. Segment Analysis
3. Forecasts for Fiscal 2020
4. Initiatives Going Forward & Appendices
6

Beauty care Revenue decreased year on year due to a significant revenue decline in
POLA and ORBIS
Operating income decreased mainly due to a decline in gross profit.
Real estate Occupancy rate has been maintained at a high level
Others Revenue and operating income fell below those of the same period of last year
due to a decrease in construction orders
Segment Results Summary
FY2019 FY2020 YoY Change
(mil yen) Q1 Results Q1 Results Amount %
Consolidated net sales 52,440 43,316 (9,124) (17.4%)
Beauty care 51,165 42,082 (9,082) (17.8%)
Real estate 658 636 (21) (3.2%)
Others 617 597 (20) (3.3%)
Operating income 6,773 2,006 (4,767) (70.4%)
Beauty care 6,449 1,700 (4,749) (73.6%)
Real estate 304 289 (14) (4.9%)
Others 35 4 (30) (85.9%)
Reconciliations (15) 11 26 -
7
Segment Results

FY2019 FY2020 YoY Change
(mil. yen) Q1 Results Q1 Results Amount %
Beauty care net sales 51,165 42,082 (9,082) (17.8%)
POLA 32,021 25,057 (6,964) (21.7%)
ORBIS 12,317 11,304 (1,012) (8.2%)
Jurlique 1,866 1,297 (569) (30.5%)
H2O PLUS 354 284 (69) (19.7%)
Brands under
development4,604 4,137 (466) (10.1%)
Beauty care
operating income6,449 1,700 (4,749) (73.6%)
POLA 5,594 1,592 (4,002) (71.5%)
ORBIS 1,719 1,707 (12) (0.7%)
Jurlique (757) (1,117) (359) -
H2O PLUS (223) (170) 52 -
Brands under
development116 (311) (427) -
8
Beauty Care Business Results by Brands
Note: Consolidated operating income and loss for each brand are shown for reference purposes only (figures are unaudited)

9
Sales to inbound customers and buyers decreased due to Novel
Coronavirus
In Japan, revenue decreased significantly from the impact of
consumers refraining from outside activities and shorter department
store opening hours
Overseas revenue increased, China recovered in March
Inbound traffic (tourists) accounted for 5% of revenue (down 5ppt YoY)
Q1 Results (mil. yen) YoY Change
Net sales 25,057 (21.7%)
Operating income 1,592 (71.5%)
Key indicators
Sales ratio Consignment sales 74.3%
Overseas 12.9%
Dept. store, B2B(1) , EC 12.8%
Sales growth* Consignment sales down 24.6%
Overseas up 34.5%
Dept. store, B2B(1) , EC down 35.0%
Consignment
sales channel# of sales offices**
3,910
(down 46)
# of PB(2)** 657(down 18)
Purchase per
customer*
down 8.8%
# of customers* down 14.8%
Number of stores overseas** 86 (up 2)
Q1 Result Topics B.A LIGHT SELECTOR launch (March)
Well received from the start
36,164
32,021
25,057
0
10,000
20,000
30,000
40,000
2018 1Q 2019 1Q 2020 1Q
7,693
5,594
1,592
0
2,000
4,000
6,000
8,000
10,000
2018 1Q 2019 1Q 2020 1Q
Brand Analysis (1)
(1) B2B: Hotel amenity business (2) PB: POLA THE BEAUTY stores
*YoY , ** vs Dec. 2019
Quarterly net sales (mil. yen)
Quarterly operating income (mil. yen)

10
Q1 Results (mil. yen) YoY Change
Net sales 11,304 (8.2%)
Operating income 1,707 (0.7%)
Key indicators
Sales ratio Online 51.5%
Other mail-order 20.4%
Stores and overseas 28.1%
Sales growth* Online down 6.7%
Other mail-order down 11.5%
Stores and overseas down 8.5%
Mail-order purchase per customer* down 0.7%
Number of mail-order customers* down 7.4%
ORBIS U series ratio of sales (1) 26%
TopicsQ1 Result Revenue decreased with fewer customers due to narrowing down
customer targets
Skincare ratio and product unit price both increased year on year
and profitability increased, with income remaining mostly
unchanged year on year
ORBIS CLEANSING CREAM launch
(February)
Third flagship product after ORBIS U
and DEFENCERA
(1) Total of ORBIS U, U white, and U encore
12,475 12,317 11,304
0
5,000
10,000
15,000
20,000
2018 1Q 2019 1Q 2020 1Q
2,466
1,719 1,707
0
1,000
2,000
3,000
4,000
2018 1Q 2019 1Q 2020 1Q
Brand Analysis (2)
Quarterly net sales (mil. yen)
Quarterly operating income (mil. yen)
* YoY basis

11
Jurlique
Renewal of mainstay series
(January)
Topics
Jurlique placed the China business under direct ownership, and
strengthened its branding. Revenue declined with store closings
due to the spread of Novel Coronavirus
H2O PLUS launched a subscription model
Aimed to improve customer repeat ratio
Q1 Result
Q1 Results (mil. yen) YoY Change(1)
Jurlique Net sales 1,297 (30.5%)
OP income (1,117) (359)
H2O PLUS Net sales 284 (19.7%)
OP income (170) 52
Key indicators
Jurlique
Sales ratio Australia 26.6%
Hong Kong 16.9%
Duty free 3.9%
China 21.4%
Sales growth(2) Australia down 31.2%
Hong Kong down 20.2%
Duty free down 82.7%
China up 23.6%
Nutri-Define
Collection
3,117
2,220
1,582
0
1,500
3,000
4,500
2018 1Q 2019 1Q 2020 1Q
-933 -981
-1,288-1,800
-1,500
-1,200
-900-600
-300
0
300
600900
2018 1Q 2019 1Q 2020 1Q
Brand Analysis (3) Overseas Brands
Quarterly net sales (mil. yen)
Quarterly operating income (mil. yen)
(1) For operating income, the YoY difference is shown as an amount (mil. yen)
(2) AUD basis, YoY

12
Q1 Results (mil. yen) YoY Change
Net sales 4,137 (10.1%)
Operating income (311) (427)
ACRO Net sales 2,510 (10.0%)
ACRO OP income(1) (547) (300)
(THREE Net sales) 2,131 (18.4%)
(THREE OP income) (61) (283)
主な指標
THREE # of stores in Japan (vs. Dec. 2019) 120(down 1)
# of stores overseas (vs. Dec. 2019)
(in 8 countries & regions)
61
(unchanged)
Overseas sales ratio 28%
Topics
THREE struggled with reduced department store traffic and
refraining from providing trial use of cosmetics due to Novel
Coronavirus
The three new brands expanded customer contact points
(department stores, semi self-service)
DECENCIA acquisition of new customers progressing well
Q1 Result
First ever duty-free shops launched for
Amplitude, ITRIM and
FIVEISM×THREE (March)
(1) The operating income YoY change is shown as the amount (mil. yen)
Amplitude at Kansai International Airport Terminal 2
KIX DUTY FREE
4,0654,604
4,137
0
2,000
4,000
6,000
2018 1Q 2019 1Q 2020 1Q
443
116
-311-400-300-200-100
0100200300400500600
2018 1Q 2019 1Q 2020 1Q
Brand Analysis (4) Brands Under Development
■ Brand Portfolio of Brands Under Development
Note: Apart from the portfolio above, Brands Under Development includes the OEM business.
Quarterly net sales (mil. yen)
Quarterly operating income (mil. yen)
Company
Brand
ACRO INC. DECENCIA INC.

Impact of Novel Coronavirus on Performanceand Future Policies
13
■ By channel
Inbound and
buyers
Inbound visitors drastically declined under
travel restrictions. Significant decline has
continued since January
Sudden downturn in February through March due to refraining from providing cosmetic trials at department stores and more consumers refraining from going outside
Japan
Overseas
Closed stores mainly in China from late
January. Affected by shortened business
hours, but saw some recovery in March
Impact of Novel Coronavirus in Q1
■ By brand
POLA
ORBIS
Jurlique
THREE
Cause of gap from original forecast
Operating income
Approx.
¥(9.0) bil.
Net sales
Rebuild marketing strategies by capturing change
Strengthen relations with customers which is our forte
Shift to e-commerce and accelerate digital marketing
As China market is recovering, continue strategic
investment
As for Japan, streamline and significantly reduce fixed
costs
Aim for new domain not limited to cosmetics business
(materialize in next medium-term management plan)
1Change in values and conduct of consumers
2Spread of workstyle reform at companies
Change in consumer conduct due to
refraining from going outside
Change in lifestyles and values
Diversified communication
Rapid spread of telecommuting
Need for fundamental review of work and
streamlining
New concepts that break through existing
methods
Policies on the Impact of Novel Coronavirus
Capitalize on this change in environment
Current conditions are severe, but we need to prepare
for the post-coronavirus market and work on building a
foundation for sustainable growth
Aimed to streamline expenses, butdid not realize fundamental reduction of fixed costs, resulting in large impact from decline in gross profit
Approx.
¥(4.0) bil.
Approx. ¥(6.5) bil.
Approx. ¥(0.7) bil.
Approx. ¥(0.8) bil.
Approx. ¥(1.0) bil.
1. Highlights of Consolidated Performance
2. Segment Analysis
3. Forecasts for Fiscal 2020
4. Initiatives Going Forward & Appendices
14

Forecasts for Fiscal 2020 (Revised)
15
FY2020
Q1 Results
YoY Change FY2020 Vs Feb. 14 YoY Change
(mil. yen) Amount % Full-year Plan Plan Amount %
Consol. net sales 43,316 (9,124) (17.4%) 190,000 (27,000) (29,920) (13.6%)
Beauty care 42,082 (9,082) (17.8%) 185,400 (27,000) (29,486) (13.7%)
Real estate 636 (21) (3.2%) 2,300 0 (319) (12.2%)
Others 597 (20) (3.3%) 2,300 0 (115) (4.8%)
OP income 2,006 (4,767) (70.4%) 19,000 (12,200) (12,137) (39.0%)
Beauty care 1,700 (4,749) (73.6%) 18,550 (12,200) (11,643) (38.6%)
Real estate 289 (14) (4.9%) 800 0 (221) (21.7%)
Others 4 (30) (85.9%) 150 0 19 14.9%
Reconciliations 11 26 - (500) 0 (292) -
Ordinary income (154) (6,679) - 16,500 (14,200) (14,130) (46.1%)
Net income
attributable to
owners of parent(1,246) (5,403) - 8,400 (11,600) (11,294) (57.3%)
Assumed exchange rates : 1.00 AUD = 78 JPY(PY 75.82) 1.00 USD = 107 JPY (PY 109.05) 1.00 CNY = 15.5 JPY(PY 15.78 )
Capital
investment
Depreciation
¥10,091 mil.
¥7,377 mil.
¥12,000 - ¥13,000 mil.
¥7,000 - 8,000 mil.
FY2019 FY2020(Plan) *Dividend forecast unchanged
Shareholder
returns
Annual ¥116 (include Commemorative ¥36)
Consol. payout ratio 130.3%Annual ¥80 (Interim ¥35, Year-end ¥45)
Consol. payout ratio 210.7%

Forecasts for Fiscal 2020 Details of Revision
The impact of Novel Coronavirus on results is greater than was anticipated at the start of the fiscal year
This is primarily due to a significant downturn within Japan
Certain assumptions have been applied to reflect the downward impact on original plans
16
【Assumptions】
Net sales
①Channel
②Brand
③Period
④Expenses
Operating
income
Inbound & buyer, duty-free shops, mainland China and Hong Kong shops, Australia shops, Japan shops
POLA, Jurlique, THREE, ORBIS
Impact will gradually ease after bottoming out in Q2 to Q3 FY2020
Continue the streamlining of fixed costs (e.g. SG&A expenses streamlined in the first half) throughout the
year, instead of taking it as a one-off initiative
*The sections in red have been updated since the FY2019 results announcement
Details of
revision
indicates YoY
differences,
vs. FY2019
(These are currently available estimates. We will continue to investigate and update.)
-27,000226,500
(+6,580、+3%)
34,300
(+3,163、+10%)
Assumptions before impact of Novel
Coronavirus
190,000(-29,920, -13.6%)
19,000(-12,137, -39.0%)
217,000
(-2,920, -1.3%)
31,200
(+62、+0.2%)
-9,500
As for operating income, thoroughly control costs with strong resolve to achieve 10% in operating margin
Incorporate into net sales, the impact of current store shutdowns and refraining from outdoor activities on
domestic consumption and decrease in inbound demand due to global travel restrictions
(unit: mil. yen)
Original plan
(as of Feb. 14)Revised forecast
-12,200-3,100
1. Highlights of Consolidated Performance
2. Segment Analysis
3. Forecasts for Fiscal 2020
4. Initiatives Going Forward & Appendices
17
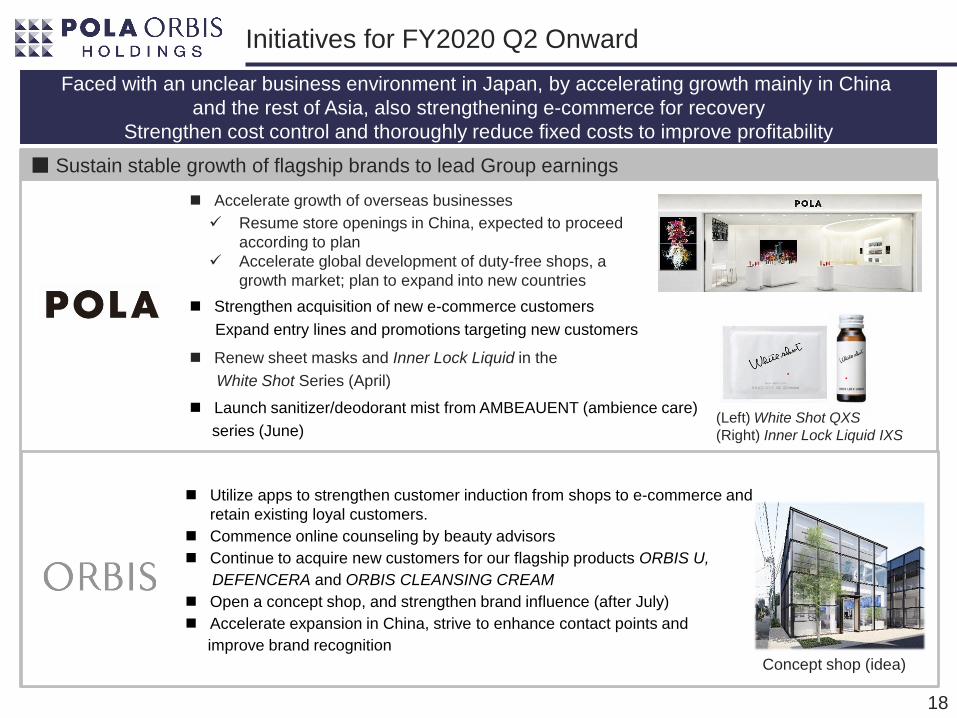
Utilize apps to strengthen customer induction from shops to e-commerce and
retain existing loyal customers.
Commence online counseling by beauty advisors
Continue to acquire new customers for our flagship products ORBIS U,
DEFENCERA and ORBIS CLEANSING CREAM
Open a concept shop, and strengthen brand influence (after July)
Accelerate expansion in China, strive to enhance contact points and
improve brand recognition
Initiatives for FY2020 Q2 Onward
18
■ Sustain stable growth of flagship brands to lead Group earnings
Renew sheet masks and Inner Lock Liquid in the
White Shot Series (April)
(Left) White Shot QXS
(Right) Inner Lock Liquid IXS
Accelerate growth of overseas businesses
Resume store openings in China, expected to proceed
according to plan
Accelerate global development of duty-free shops, a
growth market; plan to expand into new countries
Strengthen acquisition of new e-commerce customers
Expand entry lines and promotions targeting new customers
Concept shop (idea)
Faced with an unclear business environment in Japan, by accelerating growth mainly in China
and the rest of Asia, also strengthening e-commerce for recovery
Strengthen cost control and thoroughly reduce fixed costs to improve profitability
Launch sanitizer/deodorant mist from AMBEAUENT (ambience care)
series (June)

Initiatives for FY2020 Q2 Onward
19
■ Expand brands under development, create new brands, pursue M&A activity
■ Bring overseas operations solidly into the black overall
As e-commerce is performing well, shift investment to domestic and cross-border e-commerce
THREE launch SUMMER BASE MAKE (June)
THREE expand product lineup as a holistic beauty brand
Launch of limited edition of INNER RHYTHM CARE (June)
THREE SUMMER BASE MAKE
Strong growth in new customer acquisition; increase rate of conversion
to repeat purchaser and build a stable customer base
saeru Whitening Kit
With recovery in China under direct ownership, focus on online marketing leveraging key opinion leaders (KOL)
Continue to downsize main office functions and strengthen control of SG&A
expenses
Focus on acquiring new e-commerce customers, improve customer repeat
ratios and enhance life-time value (LTV)
Establish a presence as a high quality Clean J Beauty skincare brandH2O PLUS
HYDRATION OASIS
Amplitude Summer Makeup Collection

(Appendix) About POLA ORBIS Group
20
Beauty care is the core business of the Group, and
9 different cosmetics brands are operated under the Group umbrella
Meeting diversified needs of customers
High customer repeat ratio
Strong relationships with customers
Our strengths
Multi-brand strategy
Focus on skincare products
Flagship brands, POLA and ORBIS own and operate
through their own unique sales channels
FY2019
Consol. Net Sales
¥219.9 bil.
Beauty care business 98%
Real estate business 1%
Other businesses 1%
(building maintenance business)
Pric
e R
an
ge
¥1,000
Mass-market
¥5,000
Middle-tier
¥10,000
Prestige
¥20,000
High Prestige
Flagship
Brands
Brands under
development
Overseas
Brands
POLA CHEMICAL INDUSTRIES
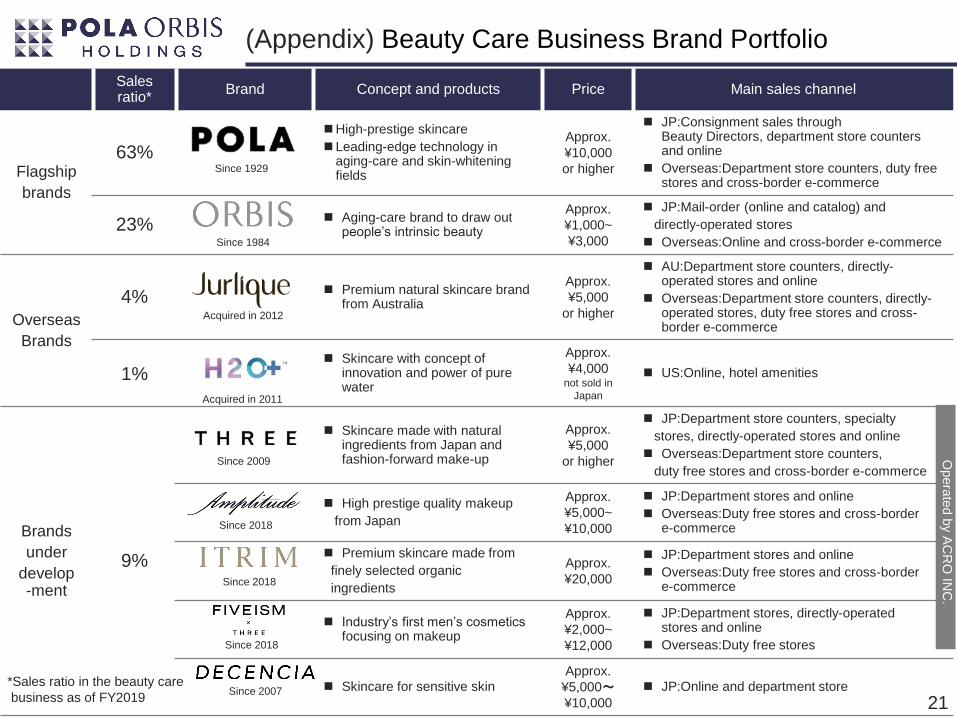
(Appendix) Beauty Care Business Brand Portfolio
21
Salesratio*
Brand Concept and products Price Main sales channel
Flagship
brands
63%
High-prestige skincare
Leading-edge technology in aging-care and skin-whitening fields
Approx.
¥10,000
or higher
JP:Consignment sales through Beauty Directors, department store counters and online
Overseas:Department store counters, duty free stores and cross-border e-commerce
23% Aging-care brand to draw out
people’s intrinsic beauty
Approx.
¥1,000~
¥3,000
JP:Mail-order (online and catalog) and
directly-operated stores
Overseas:Online and cross-border e-commerce
Overseas
Brands
4% Premium natural skincare brand
from Australia
Approx.
¥5,000
or higher
AU:Department store counters, directly-operated stores and online
Overseas:Department store counters, directly-operated stores, duty free stores and cross-border e-commerce
1% Skincare with concept of
innovation and power of pure water
Approx.
¥4,000not sold in
Japan
US:Online, hotel amenities
Brands
under
develop-ment
9%
Skincare made with natural ingredients from Japan and fashion-forward make-up
Approx.
¥5,000
or higher
JP:Department store counters, specialty
stores, directly-operated stores and online
Overseas:Department store counters,
duty free stores and cross-border e-commerce
High prestige quality makeup
from Japan
Approx.
¥5,000~
¥10,000
JP:Department stores and online
Overseas:Duty free stores and cross-bordere-commerce
Premium skincare made from
finely selected organic
ingredients
Approx.
¥20,000
JP:Department stores and online
Overseas:Duty free stores and cross-bordere-commerce
Industry’s first men’s cosmetics focusing on makeup
Approx.
¥2,000~
¥12,000
JP:Department stores, directly-operatedstores and online
Overseas:Duty free stores
Skincare for sensitive skinApprox.
¥5,000~¥10,000
JP:Online and department store
Since 1929
Since 1984
Acquired in 2012
Acquired in 2011
Since 2009
Since 2007*Sales ratio in the beauty care
business as of FY2019
Opera
ted b
y AC
RO
INC
.
Since 2018
Since 2018
Since 2018

22
(Appendix) Improvement in Capital Efficiency and
Shareholder Returns
Improvement of Shareholder Return
Initiatives to Improve Capital Efficiency
EPS(Earnings per share)
BPS(Book value per share)
Target for 2020
ROE 12%(Return on equity) =
Improve shareholder return
through dividends
Optimize balance sheet
Investment for future growth
Operating income CAGR10%
Achieve net income growth
which is higher than operating
income growth by decreasing
overseas losses
Dividends forecast for FY2020:
- Dividend per share : ¥80
(Interim ¥35, Year-end ¥45)
- Consol. payout ratio : 210.7%
Basic Policy :
With a policy of consolidated payout ratio of 60% or higher,
enhance shareholder return by realizing stable profit growth
Purchases of treasury stock shall be considered based on our
investment strategies, as well as market prices and liquidity of
the Company’s shares
ROE movement(%)
41.4%
41.5%
99.6%
58.8%
67.7%
57.1%
130.3%
0%
20%
40%
60%
80%
100%
120%
140%
160%
0
40
80
120
160
2012 2013 2014 2015 2016 2017 2018 2019 2020
配当金 特別配当金 連結配当性向
41.5%
99.6%
58.8%
67.7%
57.1%
130.3%
88.5%
0%
20%
40%
60%
80%
100%
120%
140%
160%
0
40
80
120
160
2013 2014 2015 2016 2017 2018 2019 2020
Dividends Special Dividends Payout ratio
(plan)(yen)
210.9%
4.3 5.9
7.8 9.0
14.2
4.3
10.4
0.0
4.0
8.0
12.0
16.0
2013 2014 2015 2016 2017 2018 2019
210.7%

(Appendix) Long-term Vision
23
Domestic and overseas:
Accelerate growth through M&As
Overseas:
Expand flagship brands overseas
Domestic:
Achieve stable growth in Japan
(CAGR of around 2%)
Consolidated
net sales
2013
STAGE2
STAGE3
2016 2020
~~
Become a highly profitable
global enterprise
Goals for FY2020:
•Consol. net sales: ¥250.0 bil. or higher
•Overseas sales ratio: 20%
•Operating margin: 13-15%STAGE1Further strengthen domestic
earnings structure and
accelerate overseas expansion
FY2016 Results:
•Consol. net sales: ¥218.4 bil.
•Overseas sales ratio: 8.7%
•Operating margin: 12.3%
Generate stable domestic
profits and create a successful
business model overseas
FY2013 Results:
•Consol. net sales: ¥191.3 bil.•Overseas sales ratio: 12.2%•Operating margin: 8.4%
2010
2017 – 2020 Mid-term
Management Plan
160.0
250.0
(bil. yen)

(Appendix) 2017 – 2020 Medium-term Management Plan
24
Japan Overseas
The final stage of the long-term vision for 2020.
Aim to improve profitability in Japan, promote a solid shift toward overall profitability
from overseas operations and build a brand structure for next-generation growth.
Consol. net sales: CAGR 3 to 4%
(¥250.0 bil. in FY2020)
Operating income: CAGR 10% or higher
Operating margin: 15% or higher in FY2020
Target for ROE: 12% in FY2020
Consolidated payout ratio: 60% or higher
from FY2017
Consolidated net sales
Operating income
Capital efficiency
Shareholder returns
Strategy 1. Sustain stable growth of flagshipbrands to lead Group earnings
Strategy 2. Bring overseas operations solidly into the black overall
Strategy 4. Strengthen operations (reinforce R&D, human resources andgovernance)
Strategy 5. Enhance capital efficiency and enrich shareholder returns
Strategy 3. Expand brands under development, create new brands,pursue M&A activity

(Appendix) Beauty Care Business Results
for FY2017 – FY2019 by Brands
25
FY2017 FY2018 FY2019 2018 vs 2019 YoY Change
(mil. yen) Results Results Results Amount %
Consolidated net sales 244,335 248,574 219,920 (28,654) (11.5%)
Beauty care
net sales227,133 231,207 214,886 (16,321) (7.1%)
POLA 144,012 150,183 135,502 (14,681) (9.8%)
ORBIS 53,066 51,051 50,726 (324) (0.6%)
Jurlique 12,772 10,386 7,765 (2,620) (25.2%)
H2O PLUS 2,303 2,041 1,470 (571) (28.0%)
Brands under development 14,978 17,544 19,421 1,877 10.7%
Consol. operating income 38,881 39,496 31,137 (8,358) (21.2%)
Beauty care
operating income38,121 38,294 30,193 (8,100) (21.2%)
POLA 28,584 32,574 25,529 (7,045) (21.6%)
ORBIS 9,080 9,340 9,252 (87) (0.9%)
Jurlique (505) (3,763) (2,968) 794 -
H2O PLUS (317) (552) (825) (272) -
Brands under development 1,278 695 (794) (1,489) -
Note : Consolidated operating income and loss for each brand are shown for reference purpose only (figures are unaudited)