First Quarter March 31, 2015 - Russel Metals 1st... · The Company's Audit Committee is appointed...
37
First Quarter March 31, 2015
Transcript of First Quarter March 31, 2015 - Russel Metals 1st... · The Company's Audit Committee is appointed...

First QuarterMarch 31, 2015

Management's Discussion and Analysis .................................................................... 2 Consolidated Financial Statements ......................................................................... 16

Russel Metals Inc. 1
MANAGEMENT'S RESPONSIBILITY FOR FINANCIAL REPORTING The accompanying condensed consolidated financial statements, Management's Discussion and Analysis of Financial Condition have been prepared by management and approved by the Audit Committee and the Board of Directors of the Company. These condensed consolidated financial statements were prepared in accordance with International Financial Reporting Standards, as issued by the International Accounting Standards Board, and, where appropriate, reflect management's best estimates and judgements. Management is responsible for the accuracy, integrity and objectivity of the condensed consolidated financial statements and Management's Discussion and Analysis of Financial Condition within reasonable limits of materiality. To assist management in the discharge of these responsibilities, the Company has developed, documented and maintained a system of internal controls in order to provide reasonable assurance that its assets are safeguarded; that only valid and authorized transactions are executed; and that accurate, timely and comprehensive financial information is prepared in accordance with International Financial Reporting Standards. In addition, the Company has developed and maintained a system of disclosure controls in order to provide reasonable assurance that the financial information is relevant, reliable and accurate. The Company's Audit Committee is appointed annually by the Board of Directors. The Audit Committee, which is composed entirely of outside directors, meets with management to satisfy itself that management is properly discharging its financial reporting responsibilities and to review the condensed consolidated financial statements and the Management's Discussion and Analysis of Financial Condition. The Audit Committee reports its findings to the Board of Directors for consideration in approving the condensed consolidated financial statements and the Management's Discussion and Analysis of Financial Condition for presentation to the shareholders. May 5, 2015 B. R. Hedges M. E. Britton President and Executive Vice President and Chief Executive Officer Chief Financial Officer
2 Q1 - March 31, 2015
RUSSEL METALS INC. MANAGEMENT'S DISCUSSION AND ANALYSIS OF FINANCIAL CONDITION AND RESULTS OF OPERATIONS FOR THE THREE MONTHS ENDED MARCH 31, 2015 This Management's Discussion and Analysis of Financial Condition and Results of Operations (MD&A) of Russel Metals Inc. and its subsidiaries provides information to assist readers of, and should be read in conjunction with, the condensed consolidated financial statements for the three months ended March 31, 2015, including the notes thereto, and the MD&A and the audited consolidated financial statements for the year ended December 31, 2014, including the notes thereto. In the opinion of management, such condensed consolidated financial statements contain all adjustments necessary for a fair presentation of the results for such periods. The results of operations for the periods shown are not necessarily indicative of what our results will be for the full year. All dollar references in our financial statements and in this report are in Canadian dollars unless otherwise stated. Additional information related to Russel Metals Inc., including our Annual Information Form, may be obtained from SEDAR at www.sedar.com or on our website at www.russelmetals.com. Unless otherwise stated, the discussion and analysis contained in this MD&A are as of May 5, 2015. FORWARD-LOOKING STATEMENTS Certain statements contained in this MD&A constitute forward-looking statements or information within the meaning of applicable securities laws, including statements as to our future capital expenditures, our outlook, the availability of future financing and our ability to pay dividends. Forward-looking statements relate to future events or our future performance. All statements, other than statements of historical fact, are forward-looking statements. Forward-looking statements are often, but not always, identified by the use of words such as "seek", "anticipate", "plan", "continue", "estimate", "expect", "may", "will", "project", "predict", "potential", "targeting", "intend", "could", "might", "should", "believe" and similar expressions. Forward-looking statements are necessarily based on estimates and assumptions that, while considered reasonable by us, inherently involve known and unknown risks, uncertainties and other factors that may cause actual results or events to differ materially from those anticipated in such forward-looking statements, including the factors described below. We are subject to a number of risks and uncertainties which could have a material adverse effect on our future profitability and financial position, including the risks and uncertainties listed below, which are important factors in our business and the metals distribution industry. Such risks and uncertainties include, but are not limited to: the current economic climate; volatility in metal prices; volatility in oil and natural gas prices; cyclicality of the metals industry and the industries that purchase our products; lack of credit availability that may limit the ability of our customers to obtain credit or expand their businesses; significant competition that could reduce our market share; the interruption in sources of metals supply; the integration of future acquisitions, including successfully adapting to a public company control environment and retaining key acquisition management personnel; failure to renegotiate any of our collective agreements and work stoppages; disruption in our customer or suppliers' operations due to labour disruptions or the existence of events or circumstances that cause a force majeure; environmental liabilities; environmental concerns or changes in government regulations in general, and those related to oil sands production, shale fracking or oil distribution in particular; changes in government regulations relating to workplace safety and worker health; product claims from customers, currency exchange risk, particularly between the Canadian and U.S. dollar; the failure of our key computer-based systems, including our enterprise resource and planning systems; the failure to implement new technologies; cyber security breach; the loss of key individuals; the inability to access affordable financing, capital or insurance; interest rate risk; dilution; and change of control.

Russel Metals Inc. 3
While we believe that the expectations reflected in our forward-looking statements are reasonable, no assurance can be given that these expectations will prove to be correct, and our forward-looking statements included in this MD&A should not be unduly relied upon. These statements speak only as of the date of this MD&A and, except as required by law, we do not assume any obligation to update our forward-looking statements. Our actual results could differ materially from those anticipated in our forward-looking statements including as a result of the risk factors described above and under the heading "Risk" later in this MD&A, and in our filings with securities regulatory authorities which are available on SEDAR at www.sedar.com. Specific reference is made to our most recent Annual Information Form for a further discussion of some of the factors underlying our forward-looking statements. NON-GAAP MEASURES This MD&A includes a number of measures that are not prescribed by generally accepted accounting principles (GAAP) and as such may not be comparable to similar measures presented by other companies. Our financial statements are prepared in accordance with International Financial Reporting Standards. We believe these measures are commonly employed to measure performance in our industry and are used by analysts, investors, lenders and other interested parties to evaluate financial performance and our ability to incur and service debt to support our business activities. The measures we use are specifically defined where they are first used in this report. While we believe that non-GAAP measures are helpful supplemental information, they should not be considered in isolation as an alternative to net income, cash flows generated by operating, investing or financing activities, or other financial statement data presented in accordance with GAAP. OVERVIEW We are a large North American metals distribution company. We conduct business primarily in three metals distribution segments: metals service centers, energy products, and steel distributors. Our basic earnings per share were $0.30 for the quarter ended March 31, 2015 compared to $0.47 for the first quarter of 2014. Our earnings were adversely impacted by the drop in oil prices which resulted in a decrease in revenues in our energy products segment. Operating profits at our metals service centers were adversely impacted by declining steel prices which put pressure on our gross margins.

4 Q1 - March 31, 2015
RESULTS OF OPERATIONS The following table provides operating profits before interest, finance expense or income and income taxes. The corporate expenses included are not allocated to specific operating segments. Gross margins (revenue minus cost of sales) as a percentage of revenues for the operating segments are also shown below. The table shows the segments as they are reported to management and are consistent with the segment reporting in our condensed consolidated financial statements. Quarters Ended March 31 change as a % (in millions, except percentages) 2015 2014 of 2014
Segment Revenues Metals service centers $ 400.4 $ 391.5 2% Energy products 384.9 445.1 (14%) Steel distributors 118.5 87.3 36% Other 0.1 0.1
$ 903.9 $ 924.0 (2%)
Segment Operating Profits Metals service centers $ 15.3 $ 21.2 (28%) Energy products 20.7 32.7 (37%) Steel distributors 6.3 6.3 -% Corporate expenses (4.3) (5.2) 17% Other (1.4) (1.5)
Operating profits $ 36.6 $ 53.5 (32%)
Segment Gross Margin as a % of RevenuesMetals service centers 20.0% 21.7% Energy products 16.4% 17.0% Steel distributors 12.0% 13.2% Total operations 17.4% 18.6%
Segment Operating Profit as a % of Revenues Metals service centers 3.8% 5.4% Energy products 5.4% 7.3% Steel distributors 5.3% 7.2% Total operations 4.0% 5.8%
QUARTERLY FINANCIAL HIGHLIGHTS
Mar 31 Dec 31 Sep 30 Jun 30 Mar 31 Dec 31 Sep 30 Jun 30 (for the quarters ended) 2015 2014 2014 2014 2014 2013 2013 2013
Revenues ($ millions) $ 904 $ 1,013 $ 1,039 $ 893 $ 924 $ 811 $ 797 $ 758 Operating profits ($ millions) 37 54 63 56 54 33 37 40 Net earnings ($ millions) 19 31 33 31 29 23 19 20 Basic earnings per share ($) 0.30 0.50 0.54 0.50 0.47 0.37 0.31 0.33

Russel Metals Inc. 5
METALS SERVICE CENTERS a) Description of operations We provide processing and distribution services to a broad base of approximately 38,000 end users through a network of 52 Canadian locations and 13 U.S. locations. Our metals service centers carry a broad line of products in a wide range of sizes, shapes and specifications, including carbon hot rolled and cold finished steel, pipe and tubular products, stainless steel and aluminum. We purchase these products primarily from steel producers in North America and process and package them in accordance with end user specifications. We service all major geographic regions of Canada and the Southeastern and Midwestern regions in the United States. Within Canada, our service centers operate under the names Russel Metals, Métaux Russel, A.J. Forsyth, Acier Leroux, Acier Loubier, Alberta Industrial Metals, B&T Steel, Leroux Steel, Mégantic Métal, Russel Metals Specialty Products, Métaux Russel Produits Spécialisés, McCabe Steel, Siemens Laserworks and York-Ennis. Our U.S. service centers operate under the names Russel Metals Williams Bahcall, JMS Russel Metals, Norton Metals and Baldwin International. b) Factors affecting results The following is a general discussion of the significant factors affecting our metals service centers results. More specific information on how these factors impacted the first quarter of 2015 and 2014 is found in the section that follows. Steel prices fluctuate significantly throughout the steel cycle. Steel prices are influenced by overall international demand, trade sanctions, iron ore prices, scrap steel prices and product availability. Volatile metal prices cause fluctuations in our operating results. Steel prices softened in the second half of 2014 and the pace of decline accelerated during the first quarter of 2015. Supply side management, practiced by steel producers in North America, and international supply and demand, which impact steel imports, affects product availability. Trade sanctions are initiated either by steel mills or by government agencies in North America. Our operating results are affected by the inherent risk of the cyclicality of the metals industry and the industries that purchase our products. Demand for our product is significantly affected by economic cycles. Revenues and operating profits fluctuate with the level of general business activity in the markets served. We are most impacted by the manufacturing, resource including oil and gas, and construction segments of the North American economy. Canadian service centers, which represent the majority of our metals service center operations, have operations in all regions of Canada and are affected by general regional economic conditions. Our large market share and diverse customer base of approximately 19,000 Canadian customers mean that our results tend to mirror the performance of the regional economies of Canada. Our U.S. operations, which also have approximately 19,000 customers, are impacted by the local economic conditions in the regions that they serve. Our Canadian operations can be affected by the U.S. dollar exchange rate since some products are sourced outside of Canada and are priced in U.S. dollars. Movement in the Canadian dollar has a short-term impact on inventory prices. The decline in the Canadian dollar in 2015 versus 2014 increased revenues, expenses and profits for our U.S. operations translated to Canadian dollars. Operating results of our U.S. operations reported for the three months ended March 31, 2015 were converted at $1.2411 per US$1 compared to $1.1035 per US$1 for the same period of 2014. The exchange rate at March 31, 2015 used to translate the balance sheet was $1.2683 per US$1 versus $1.1601 per US$1 at December 31, 2014.

6 Q1 - March 31, 2015
c) Metals service centers segment results -- Three Months Ended March 31, 2015 compared to March 31, 2014 Revenues for the three months ended March 31, 2015 increased 2% to $400 million compared to the same period in 2014. Tons shipped in the metals service centers segment in the first quarter of 2015 were approximately 3% lower than the first quarter of 2014 and 2% lower than the fourth quarter of 2014. The decrease in tons shipped was primarily due to lower volumes caused by slow economic activity in Alberta and British Columbia and lower volumes in Atlantic Canada due to extreme weather conditions. U.S. dollar revenues at our U.S. metals service centers were consistent year over year; however, the appreciation of the U.S. dollar resulted in increased revenues. Shipments at our U.S. operations were stronger than the Canadian operations which is consistent with Metals Service Center Institute industry data. Based on industry statistics, our decrease in tons shipped was less than the industry as we continued to capture market share. Gross margin as a percentage of revenues was lower than the same quarter last year at 20.0%. Margins are lower as price declines have caused increased competition and narrower margins as industry participants competed for fewer tons. Gross margins as a percentage of revenue for the first quarter of 2015 improved from 19.2% for the fourth quarter of 2014. We anticipate that high inventories of imported products in the industry will continue to exert pressure on steel prices. Operating expenses for the first quarter of 2015 increased $1 million or 2% from the first quarter of 2014. Operating expenses for the quarter were consistent with 2014 after adjusting for the stronger U.S. dollar in 2015. Metals service centers operating profits for the three months ended March 31, 2015 of $15 million were 28% lower than the $21 million for the same period in 2014 and reflect declining steel prices and excess inventories in our markets. ENERGY PRODUCTS a) Description of operations We distribute oil country tubular goods (OCTG), line pipe, tubes, valves and fittings, primarily to the energy industry in Western Canada and the United States. A significant portion of our business units are clustered in Alberta and Saskatchewan, Canada, and in Colorado and Texas in the U.S. A large portion of our inventories are located in third party yards ready for distribution to customers throughout North America. In addition, we operate from 55 Canadian and 22 U.S. facilities mainly to support our valve and fitting operations. The majority of these facilities are oil field stores which form the Apex Distribution network. We purchase our products from the pipe division of North American steel mills, independent manufacturers of pipe, valves and fittings, international steel mills and other distributors. Our energy products segment operates under the names Apex Distribution, Apex Monarch, Apex Remington, Comco Pipe and Supply Company, Fedmet Tubulars, Triumph Tubular & Supply, Pioneer Pipe and Spartan Energy Tubulars. b) Factors affecting results The following is a general discussion of the factors affecting our energy products segment operations. More specific information on how these factors impacted the first quarter of 2015 and 2014 is found in the section that follows. The price of natural gas and oil can impact rig count and drilling activities, particularly in Western Canada. Rig activity affects demand for our products. Oil and gas prices started to fall at the end of the third quarter of 2014 and continued to fall into 2015 leading to lower rig counts. This severe drop in the price of oil has caused our energy product customers to announce reductions in their projects for 2015 which has resulted and will continue to result in reduced demand in 2015. Prices for pipe products are influenced by overall demand, trade sanctions and product availability. Trade sanctions are initiated either by steel mills or by government agencies in North America. Both the Canadian and U.S. governments have imposed duties on certain Chinese pipe, which remain in effect and reduce imports of these products. The U.S. government has initiated reviews of pipe from a number of other countries and in July 2014 announced additional duties which did not reduce the inflow of imported price products mainly due to the strong U.S. dollar. Prices of valves and fittings are not as sensitive to steel price fluctuations because they are highly engineered value-added products.
Russel Metals Inc. 7
Drilling related to oil and natural gas in Western Canada historically peaks during the period from October to March. c) Energy products segment results -- Three Months Ended
March 31, 2015 compared to March 31, 2014 Revenues in our energy products segment decreased 14% to $385 million for the first quarter of 2015 compared to the same period of 2014 due to lower activity throughout the sector. Revenues from our Canadian operations servicing oil and gas drilling activity decreased 11% compared to the first quarter of 2014 due to the slowdown in activity. The drop in Canadian energy activity was not as dramatic as in the U.S. since many Canadian customers elected to finish the winter drilling season. Volumes post spring break up at our Canadian operations are expected to be down considerably more year over year than was experienced in the first quarter. Revenues from our U.S. operations in this segment were down a combined 20% as the U.S. energy market reacted more quickly to the oil price decline. Gross margin as a percentage of revenues for the three months ended March 31, 2015 was 16.4% compared to 17.0% in the same period in 2014. The decline was caused by competitive pressure as demand declined. Gross margin as a percentage of revenues was consistent with the second half of 2014. Operating expenses were lower than the same quarter last year but as a percentage of revenues they were 11% versus 10% for the first quarter of 2014. This segment generated an operating profit of $21 million for the three months ended March 31, 2015 compared to $33 million for the same period in 2014, mainly related to decreased volumes. STEEL DISTRIBUTORS a) Description of operations Our steel distributors act as master distributors selling steel in large volumes to other steel service centers and equipment manufacturers mainly on an "as is" basis. Our U.S. operation has a cut-to-length facility in Houston, Texas where it processes coil for its customers. Our steel distributors source their steel both domestically and off shore. The main steel products sourced by this segment are structural beam, plate, coils, pipe and tubing; however, product volumes vary based on the economy and trade actions in North America. Our steel distributors operate under the names Wirth Steel and Sunbelt Group. Arrow Steel, a division of Sunbelt Group, processes coils. b) Factors affecting results The following is a general discussion of the significant factors affecting our steel distributors. More specific information on how these factors impacted the first quarter of 2015 and 2014 is found in the section that follows. Steel prices are influenced by overall demand, trade sanctions and product availability both domestically and worldwide. Trade sanctions are initiated either by steel mills or government agencies in North America. Non-trade related sanctions may also be initiated by governments on countries where our suppliers are located. Trade actions currently exist on plate and pipe from specified countries. Steel imports are affected both by mill capacity by product line in North America, as well as international supply and demand. In addition, these factors significantly affect product availability in North America. Demand for steel that is sourced off shore fluctuates significantly and is mainly driven by price and product availability in North America. Our steel distributors have a significant number of customers who buy product from them on a periodic basis which can result in large fluctuations in revenues reported from period to period. Our Canadian operations source product outside of Canada that is priced in U.S. dollars and may be impacted by movement in the Canadian dollar.

8 Q1 - March 31, 2015
c) Steel distributors segment results -- Three Months Ended
March 31, 2015 compared to March 31, 2014 Steel distributors revenues increased 36% to $119 million for the three months ended March 31, 2015 compared to the same period in 2014 due to higher volumes and a stronger U.S. dollar. Steel distributors volumes were consistent with the period April to December 2014; however, demand for import product has declined due to excess inventory in the distribution channel. In addition, demand in the Houston area was weaker due to the decline in the energy sector. These factors are expected to result in lower volumes for the remainder of 2015. Gross margin as a percentage of revenues was 12.0% for the three months ended March 31, 2015 compared to 13.2% for the three months ended March 31, 2014 which was closer to historical margins after a strong 2014. Operating expenses for the first quarter of 2015 were $8 million compared to $5 million for the same period in 2014 as a result of higher U.S. property taxes due to higher inventories, higher foreign exchange on U.S. based operations and increased activity. Operating profits for the three months ended March 31, 2015 and March 31, 2014 were $6 million. CORPORATE EXPENSES -- Three Months Ended March 31, 2015 compared to March 31, 2014 Corporate expenses were $4 million for the three months ended March 31, 2015 compared to $5 million in the first quarter of 2014. Lower performance-based and share-based compensation as a result of share price declines contributed to the reduction in corporate expenses. CONSOLIDATED RESULTS -- Three Months Ended March 31, 2015 compared to March 31, 2014 Operating profits were $37 million for the first quarter of 2015 compared to $54 million for the first quarter of 2014 as a result of the decline in both oil prices and steel prices. INTEREST EXPENSE AND INCOME Net interest expense was consistent with the same period in 2014. OTHER FINANCE EXPENSE AND INCOME Other finance expense was $0.6 million in the first quarter of 2015 compared to $2 million for the first quarter of 2014. Other finance expense relates to the change in fair value of the contingent consideration associated with the Apex Distribution and Apex Monarch acquisitions. The fair value adjustment in the first quarter of 2015 related to imputed interest on the expected future contingent consideration payments of $1 million was partially offset by lower expected future payments for Apex Monarch of $0.4 million. INCOME TAXES We recorded a provision for income taxes of $8 million for the first quarter of 2015 compared to $14 million for the first quarter of 2014. Our effective income tax rate for the three months ended March 31, 2015 was 30.2% compared to 32.0% for the three months ended March 31, 2014. NET EARNINGS Net earnings for the first quarter of 2015 were $19 million compared to $29 million in the first quarter of 2014. Basic earnings per share for the first quarter of 2015 were $0.30 per share compared to $0.47 per share for the first quarter of 2014. SHARES OUTSTANDING AND DIVIDENDS The weighted average number of common shares outstanding for the first quarter of 2015 was 61,678,145 compared to 60,966,768 for the first quarter of 2014. The number of common shares outstanding increased as a result of the exercise of options. Common shares outstanding at March 31, 2015 and May 5, 2015 were 61,701,628.

Russel Metals Inc. 9
We paid common share dividends of $23 million or $0.38 per share in the first quarter of 2015 compared to $21 million or $0.35 per share in the same period in 2014. We have $174 million of 7.75% Convertible Unsecured Subordinated Debentures outstanding which mature on September 30, 2016. Each debenture is convertible into common shares at the option of the holder at any time on or prior to the business day immediately preceding (i) the maturity date, or (ii) the date specified for redemption of the Convertible Debentures, at a conversion price of $25.75 per share being a conversion rate of 38.8350 common shares per $1,000 principal amount of Convertible Debentures. We have $300 million 6.0% Senior Notes due April 19, 2022. The indenture for our Senior Notes has restrictions related to the payment of quarterly dividends in excess of $0.35 per share. We currently have a basket of approximately $253 million available for restricted payments, which is adjusted for 50% of our net earnings or losses on a quarterly basis. This basket would be available to support future dividend payments above $0.35. Under our $325 million syndicated bank facility, the payment of dividends is subject to excess borrowing base availability of not less than four times the declared dividend. We do not believe this requirement will restrict our ability to pay dividends as our borrowing base, which is based on percentages of accounts receivable and inventories, has traditionally been in excess of our borrowings plus four times the current dividend. In addition, we believe we would be able to finance our short-term cash requirements with alternate financing structures and pay the dividend. EBITDA The following table shows the reconciliation of net earnings to EBITDA:
Quarters Ended March 31 (millions) 2015 2014
Net earnings $ 18.5 $ 29.0 Provision for income taxes 8.0 13.7 Interest and finance expense, net 10.1 10.8
Earnings before interest, finance and income taxes (EBIT) 36.6 53.5 Depreciation and amortization 8.7 8.6
Earnings before interest, finance, income taxes, depreciation and amortization (EBITDA) $ 45.3 $ 62.1
We believe that EBITDA, a non-GAAP measure, may be useful in assessing our operating performance and as an indicator of our ability to service or incur indebtedness, make capital expenditures and finance working capital requirements. The items excluded in determining EBITDA are significant in assessing our operating results and liquidity. Therefore, EBITDA should not be considered in isolation or as an alternative to cash from operating activities or other combined income or cash flow data prepared in accordance with GAAP. CAPITAL EXPENDITURES Capital expenditures were $8 million for the first quarter of 2015 compared to $5 million in the first quarter of 2014. Depreciation expense was $7 million for the first quarter of 2015 and 2014. We expect capital expenditures to exceed depreciation in the short term due to the relocation and expansion of service center locations. LIQUIDITY At March 31, 2015, we had net bank indebtedness, defined as cash less bank indebtedness, of $16 million compared to net cash of $29 million at December 31, 2014. We generated $29 million from operations in the first quarter of 2015 and utilized $34 million for working capital primarily due to increased inventory and payment of 2014 variable compensation and income taxes. We utilized $8 million for capital expenditures and $23 million for dividends to shareholders.

10 Q1 - March 31, 2015
To support revenue levels we experience significant swings in working capital which impact cash flow. Decreased revenues in the first quarter have resulted in a reduction in working capital requirements specifically in accounts receivable. Inventory and accounts receivable represent a large percentage of our total assets employed and vary throughout each cycle. Accounts receivable and inventory comprise our largest liquidity risks. Our customers are impacted by the economic climate and thus it is possible to experience additional bad debts and increased days outstanding for accounts receivable, which may affect the timing of collections. Total assets were $2 billion at March 31, 2015 and December 31, 2014. At March 31, 2015 current assets excluding cash represented 75% of our total assets excluding cash versus 76% at December 31, 2014. Increases in inventory utilized cash of $13 million in the three months ended March 31, 2015. This inventory increase was primarily a result of increased activity at steel distributors. Inventory in all segments is expected to decline over the next couple of quarters. Inventories represented 49% of our total assets at March 31, 2015 and compared to 46% at December 31, 2014.
Mar. 31 Dec. 31 Sept. 30 June 30 Mar. 31 Inventory by Segment (millions) 2015 2014 2014 2014 2014
Metals service centers $ 322 $ 329 $ 301 $ 265 $ 275 Energy products 445 437 418 455 412 Steel distributors 200 165 153 142 86
Total $ 967 $ 931 $ 872 $ 862 $ 773
Mar. 31 Dec. 31 Sept. 30 June 30 Mar. 31 Inventory Turns (quarters ended) 2015 2014 2014 2014 2014
Metals service centers 4.0 4.0 4.4 5.0 4.5 Energy products 2.9 3.7 4.0 2.6 3.6 Steel distributors 2.1 2.6 2.7 2.6 3.5 Total 3.1 3.6 3.9 3.3 3.9
At March 31, 2015, our metals service centers had lower inventory tons compared to December 31, 2014. Higher inventory pricing in the Canadian operations was due to the weakness in the Canadian dollar as steel is predominately priced in U.S. dollars. Our energy products operations had higher inventory at the end of the first quarter of 2015 due to weaker levels of activity in the Canadian oil patch and the effect of a strong U.S. dollar on conversion of the results of our U.S. energy operations to Canadian dollars. Our steel distributors segment had higher inventory levels compared to December 31, 2014 as material ordered during 2014 was received and due to the impact of the strong U.S. dollar. Accounts receivable generated cash of $80 million in the first quarter of 2015. Accounts receivable represented 25% of our total assets at March 31, 2015 compared to 28% of our total assets at December 31, 2014. During the first quarter of 2015 we made income tax payments of $25 million, compared to $3 million for the three months ended March 31, 2014, representing final payments on 2014 stronger earnings. The balances disclosed in our consolidated cash flow statements are adjusted to remove the non-cash component related to foreign exchange rate fluctuations impacting inventory, accounts receivable, accounts payable and income tax balances of our U.S. operations.

Russel Metals Inc. 11
FREE CASH FLOW
Quarters Ended March 31 (millions) 2015 2014
Cash from operating activities before non-cash working capital $ 28.9 $ 42.8 Purchase of property, plant and equipment (8.2) (4.9)
$ 20.7 $ 37.9
We believe that free cash flow may be useful in assessing our ability to pay dividends, reduce outstanding debt and fund working capital growth. Free cash flow is a non-GAAP measure regularly used by investors and analysts to evaluate companies.
CASH, DEBT AND CREDIT FACILITIES March 31 December 31 (millions) 2015 2014
Long-term debt 6.0% $300 million Senior Notes due April 19, 2022 $ 295 $ 295 7.75% $174 million Convertible Debentures due September 30, 2016 167 165 Finance leases obligations, maturing 2014 to 2017 1 1
463 461 Current portion (1) (1)
$ 462 $ 460
Our Convertible Debentures have been split between debt and equity. The debt portion is accreted as a charge through interest expense over the life of the debentures. The amount allocated to equity represented the valuation of the holders' option to convert the Convertible Debentures into common shares. If the Convertible Debentures were to be converted to equity at redemption or maturity it would result in 6,770,757 common shares being issued.
Cash and Bank Credit Facilities Russel Metals U.S. Subsidiary As at March 31, 2015 (millions) Facility Facility Total
Bank loans $ (39) $ (6) $ (45) Cash net of outstanding cheques 26 3 29
Net cash (13) (3) (16) Letters of credit (39) (1) (40)
$ (52) $ (4) $ (56)
Facilities Borrowings and letters of credit $ 275 $ 51 $ 326 Letters of credit 50 - 50
Facilities availability $ 325 $ 51 $ 376
Available line based on borrowing base $ 325 $ 51 $ 376
We have a credit facility with a syndicate of Canadian and U.S. banks totaling $325 million which expires June 24, 2017. The syndicated facility consists of availability of $275 million under Tranche I to be utilized for borrowings and letters of credit, and $50 million under Tranche II to be utilized only for letters of credit. Letters of credit are issued under Tranche II first and additional needs are issued under Tranche I. The borrowings and letters of credit are available on a revolving basis, up to an amount equal to the sum of specified percentages of our eligible accounts receivable and inventories, to a maximum of $325 million.

12 Q1 - March 31, 2015
As of March 31, 2015, we were entitled to borrow and issue letters of credit totaling $325 million under this facility. At March 31, 2015, we had $39 million in borrowings compared to $32 million at December 31, 2014. We had $39 million in letters of credit at March 31, 2015 compared to $43 million at December 31, 2014. One of our U.S. subsidiaries has an additional bank facility primarily for letters of credit. The maximum borrowings under this facility, including letters of credit, are US$40 million. At March 31, 2015 our U.S. subsidiary had US$5 million in borrowings under this facility and US$1 million of letters of credit compared to no borrowings and letters of credit of US$23 million at December 31, 2014. At March 31, 2015, we were in compliance with all of our financial covenants. With our cash, cash equivalents and our bank facilities we have access to approximately $320 million of cash based on our March 31, 2015 balances. The use of our bank facilities has been predominantly to fund working capital requirements, acquisitions and trade letters of credit for inventory purchases. These lines may be used to support increased working capital needs when volumes and steel prices increase. CONTRACTUAL OBLIGATIONS As at March 31, 2015, we were contractually obligated to make payments as per the following table:
Payments due in
Contractual Obligations 2016 2018 2020 and (millions) 2015 and 2017 and 2019 thereafter Total
Accounts payable $ 415 $ - $ - $ - $ 415 Debt - 174 - 300 474 Long-term debt interest 16 50 36 46 148 Operating leases 18 42 23 31 114
Total $ 449 $ 266 $ 59 $ 377 $ 1,151
As part of the purchase consideration for Apex Distribution and Apex Monarch we agreed to pay additional cash consideration during the five years ending 2017 and 2018, respectively, based on earnings before interest and taxes and return on net assets. During the quarter ended March 31, 2015 we paid $18 million in satisfaction of these obligations. The obligation was increased by $0.6 million in the first quarter of 2015 related to the change in fair value due to imputed interest of $1 million and a decrease in the expected payments of $0.4 million. The fair value of the contingent consideration was $28 million at March 31, 2015. The amount is reviewed quarterly and adjusted through income for increases or decreases in the liability. We have obligations related to multiple defined benefit pension plans in Canada, as disclosed in Note 16 of our 2014 consolidated financial statements. During the first quarter of 2015, we contributed $2 million to these plans. We expect to contribute approximately $5 million to these plans during the remainder of the year. The defined benefit obligations reported in the consolidated financial statements use different assumptions than the going concern actuarial valuations prepared for funding. In addition, the actuarial valuations provide a solvency valuation, which is a valuation assuming the plan is wound up at the valuation date. Our reported funding obligations would increase by $6 million on a solvency basis and thus additional funding could be required based on solvency if the plans were wound up. We estimate the impact of a 0.25% change in the discount rate on the solvency obligation would be approximately $5 million. We have disclosed our obligations related to environmental litigation, regulatory actions and remediation in our Annual Information Form under the heading "Environmental Regulation". These obligations relate to previously divested or discontinued operations and do not relate to the metals distribution business. OFF-BALANCE SHEET ARRANGEMENTS Our off-balance sheet arrangements consist of the letters of credit disclosed in the bank credit facilities table and operating lease obligations disclosed in the contractual obligations table.

Russel Metals Inc. 13
ACCOUNTING ESTIMATES The preparation of our consolidated financial statements requires management to make estimates and judgements that affect the reported amounts. On an ongoing basis, we evaluate our estimates, including those related to bad debts, inventory net realizable value and obsolescence, useful lives of fixed assets, asset impairment, fair values, income taxes, pensions and benefits obligations, guarantees, decommissioning liabilities, contingencies, contingent consideration, litigation and assigned values on net assets acquired. We base our estimates on historical experience and on various other assumptions that are believed to be reasonable under the circumstances, the results of which form the basis for making judgements about the carrying values of assets and liabilities that are not readily apparent from other sources. Actual results may differ from these estimates. Our most significant assets are accounts receivable and inventories. Accounts Receivable An allowance for doubtful accounts is maintained for estimated losses resulting from the inability of our customers to make required payments. Assessments are based on aging of receivables, legal issues (bankruptcy status), past collection experience, current financials, credit agency reports and the experience of our credit personnel. Accounts receivable which we determine to be uncollectible are reserved in the period in which the determination is made. If the financial condition of our customers was to deteriorate, resulting in an impairment of their ability to make payments, additional allowances may be required. Our reserve for bad debts at March 31, 2015 was approximately $1 million higher than our reserve at December 31, 2014. Bad debt expense for the first quarter of 2015 as a percentage of revenue was less than 1% and approximates that of 2014. Inventories We review our inventories to ensure that the cost of inventories is not in excess of its estimated net realizable value and for obsolete and slow moving product. Inventory reserves or write-downs are recorded when cost exceeds the estimated selling price less cost to sell and when product is determined to be slow moving or obsolete. The inventory reserve level at March 31, 2015 was approximately $2 million higher than the level at December 31, 2014. Other areas involving significant estimates and judgements include:
Income Taxes We believe that we have adequately provided for income taxes based on all of the information that is currently available. The calculation of income taxes in many cases requires significant judgement in interpreting tax rules and regulations, which are constantly changing. Our tax filings are also subject to audits, which could materially change the amount of current and future income tax assets and liabilities. Any change would be recorded as a charge or reduction in income tax expense. Business Combinations For each acquisition we review the fair value of assets acquired. Where we deem it appropriate, we hire outside business valuators to assist in the assessment of the fair value of property, plant, equipment, intangibles and contingent consideration of acquired businesses. The assessment of fair values for contingent consideration is completed quarterly and requires significant judgement. Contingent Liabilities Provisions for claims and potential claims are determined on a case by case basis. We recognize contingent loss provisions when it is determined that a loss is probable and when we are able to reasonably estimate the loss. This determination takes significant judgement and actual cash outflows might be materially different from estimates. In addition, we may receive claims in the future that could have a material impact on our financial results. The Company and certain of its subsidiaries have been named defendants in a number of legal actions. Although the outcome of these legal actions cannot be determined, management intends to defend all such legal actions and has recorded provisions, as required, based on its best estimate of the potential losses. In the opinion of management, the resolution of these legal actions is not expected to have a material adverse effect on our financial position, cash flows or operations.

14 Q1 - March 31, 2015
The Company and the manufacturer of certain energy products have received notice of a customer claim relating to product that was distributed by us between 2010 and 2012. The customer alleges that the product was defective and that the manufacturer did not meet the specifications for the goods distributed by us. We are currently evaluating the claim but have not been provided with information to make a reliable estimate of any potential liability and consequently no provision has been recorded. We intend to vigorously defend against this claim and to assert our rights against the manufacturer. Employee Benefit Plans Our actuaries perform a valuation, at least every three years, for each defined benefit plan to determine the actuarial present value of the benefits. The valuation uses management's assumptions for the interest rate, rate of compensation increase, rate of increase in government benefits and expected average remaining years of service of employees. While we believe that these assumptions are reasonable, differences in actual results or changes in assumptions could materially affect employee benefit obligations and future net benefit plan cost. We account for differences between actual and assumed results by recognizing differences in benefit obligations and plan performance immediately in other comprehensive income. We had approximately $111 million in plan assets at March 31, 2015, which is an increase of approximately $5 million from December 31, 2014. The discount rate used on the employee benefit plan obligation for the quarter ended March 31, 2015 was 3.5% which is 0.5% lower than the interest rate at December 31, 2014 resulting in an increase in our accrued benefit obligation of $11 million. CONTROLS AND PROCEDURES Disclosure controls and procedures are designed to provide reasonable assurance that all relevant information is gathered and reported to senior management on a timely basis so that appropriate decisions can be made regarding public disclosure. The purpose of internal controls over financial reporting as defined by the Canadian Securities Administrators is to provide reasonable assurance that: (i) financial statements prepared for external purposes are in accordance with the Company's generally
accepted accounting principles, (ii) transactions are recorded as necessary to permit the preparation of financial statements, and records are
maintained in reasonable detail, (iii) receipts and expenditures of the Company are made only in accordance with authorizations of the
Company's management and directors, and (iv) unauthorized acquisitions, uses or dispositions of the Company's assets that could have a material effect on
the financial statements will be prevented or detected in order to prevent material error in financial statements.
The President and Chief Executive Officer and the Executive Vice President and Chief Financial Officer have caused management and other employees to design and document our disclosure controls and procedures and our internal controls over financial reporting. The design of internal controls was completed using the framework and criteria established in "Internal Control - Integrated Framework" (the "2013 Framework") issued by the Committee of Sponsoring Organizations of the Treadway Commission. No changes were made in our disclosure controls and procedures of our internal controls over financial reporting during the first quarter of 2015 that have materially affected, or reasonably likely to materially affect, our internal control over financial reporting. VISION AND STRATEGY The metals distribution business is a segment of a mature, cyclical industry. The use of service centers by both manufacturers and end users has grown over the last decade.

Russel Metals Inc. 15
We strive to deal with the cyclical nature of the business by operating with the lowest possible net assets throughout the course of a cycle. This intensive asset management reduces borrowings and therefore interest expense in declining periods in the economic cycle. This in turn creates higher, more stable returns on net assets over a cycle. Our conservative management approach creates relatively stronger trough earnings but could cause potential peak earnings to be somewhat muted. Management believes that this strategy will result in higher profits throughout a cycle and we will have average earnings over the full range of the cycle in the top deciles of the industry. Growth from selective acquisitions is also part of our strategy. We focus on investment opportunities in metals businesses that have strong market niches or provide mass to our existing operations. New acquisitions could be either major stand-alone operations or ones that complement our existing operations. We made acquisitions in both 2013 and 2014. We continue to review opportunities for acquisitions. We believe that the steel-based pricing cycle will continue to be short and volatile, and a management structure and philosophy that allows the fastest reaction to changes that affect the industry will be the most successful. We will continue to invest in our business systems to enable faster reaction times to changing business conditions. In addition, management believes the high level of service and flexibility provided by service centers will enable this distribution channel to capture an increasing percentage of the total metal revenues to end users, allowing for increased growth within the sector. RISK The timing and extent of future price changes from steel producers and their impact on us cannot be predicted with any certainty due to the inherent cyclical nature of the steel industry and modest capacity utilization rates for North American steel producers. Our acquisitions between 2013 and 2014 increased our exposure to the Western Canadian and U.S. oil and gas sector. Management believes the acquisition in the oil field operations of Apex Distribution provides a more stable stream of revenues and earnings for the energy products segment. Our Annual Information Form includes a summary of risks related to our business. OUTLOOK Energy prices had a serious negative impact on rig counts and oilfield activity causing our energy customers to reduce capital spending. In addition, excess inventories in the industry, mainly related to imports, have put continued downward pressure on steel prices. We expect that these difficult business conditions will continue throughout the second quarter of 2015.

16 Q1 - March 31, 2015
CONDENSED CONSOLIDATED STATEMENTS OF EARNINGS (UNAUDITED)
Quarters ended March 31 (in millions of Canadian dollars, except per share data) 2015 2014
Revenues $ 903.9 $ 924.0 Cost of materials (Note 3) 746.5 751.7 Employee expenses (Note 12) 71.9 71.5 Other operating expenses (Note 12) 48.9 47.3
Earnings before interest, finance expense and provision for income taxes 36.6 53.5 Interest expense (Note 13) 9.5 9.0 Other finance expense (Note 13) 0.6 1.8
Earnings before provision for income taxes 26.5 42.7 Provision for income taxes 8.0 13.7
Net earnings for the period $ 18.5 $ 29.0
Basic earnings per common share (Note 11) $ 0.30 $ 0.47
Diluted earnings per common share (Note 11) $ 0.30 $ 0.46
CONDENSED CONSOLIDATED STATEMENTS OF COMPREHENSIVE INCOME (UNAUDITED)
Quarters ended March 31 (in millions of Canadian dollars) 2015 2014
Net earnings for the period $ 18.5 $ 29.0
Other comprehensive income Items that may be reclassified to earnings Unrealized foreign exchange gains on translation of foreign operations 40.7 14.5 Items that may not be reclassified to earnings Actuarial losses on pension and similar obligations, net of taxes of $1.7 million (2014: $1.5 million) (4.7) (4.1)
Other comprehensive income 36.0 10.4
Total comprehensive income $ 54.5 $ 39.4
The accompanying notes are an integral part of these consolidated financial statements.

Russel Metals Inc. 17
CONDENSED CONSOLIDATED STATEMENTS OF FINANCIAL POSITION (UNAUDITED)
March 31 December 31 (in millions of Canadian dollars) 2015 2014
ASSETS Current Cash and cash equivalents $ 15.9 $ 53.4 Accounts receivable 499.9 569.3 Inventories (Note 3) 966.6 930.8 Prepaid expenses 10.6 11.6 Income taxes receivable 6.3 2.8
1,499.3 1,567.9 Property, Plant and Equipment (Note 4) 255.5 249.8 Deferred Income Tax Assets 6.7 4.9 Financial and Other Assets 6.1 5.9 Goodwill and Intangibles (Note 5) 214.2 214.3
$ 1,981.8 $ 2,042.8
LIABILITIES AND SHAREHOLDERS' EQUITY Current Bank indebtedness (Note 6) $ 32.1 $ 24.2 Accounts payable and accrued liabilities 415.0 500.4 Income taxes payable - 14.1 Current portion long-term debt (Note 7) 0.5 0.5
447.6 539.2
Long-Term Debt (Note 7) 461.8 460.5 Pensions and Benefits (Note 8) 31.9 26.1 Deferred Income Tax Liabilities 17.0 17.0 Provisions and Other Non-Current Liabilities (Note 15) 26.7 35.0
985.0 1,077.8
Shareholders' Equity (Note 9) Common shares 531.7 531.2 Retained earnings 334.4 344.0 Contributed surplus 14.3 14.1 Accumulated other comprehensive income 87.8 47.1 Equity component of convertible debentures 28.6 28.6
Total Shareholders' Equity 996.8 965.0
Total Liabilities and Shareholders' Equity $ 1,981.8 $ 2,042.8
The accompanying notes are an integral part of these consolidated financial statements.
ON BEHALF OF THE BOARD,
A. Laberge J. A. Hanna Director Director

18 Q1 - March 31, 2015
CONDENSED CONSOLIDATED STATEMENTS OF CASH FLOW (UNAUDITED)
Quarters ended March 31 (in millions of Canadian dollars) 2015 2014
Operating activities Net earnings for the period $ 18.5 $ 29.0 Depreciation and amortization 8.7 8.6 Deferred income taxes (0.1) 0.8 Loss on sale of property, plant and equipment 0.1 1.0 Share-based compensation 0.3 0.4 Difference between pension expense and amount funded (0.6) - Debt accretion, amortization and other 1.4 1.2 Change in fair value of contingent consideration 0.6 1.8
Cash from operating activities before non-cash working capital 28.9 42.8
Changes in non-cash working capital items Accounts receivable 79.6 (89.9) Inventories (12.7) 1.2 Accounts payable and accrued liabilities (84.7) 47.9 Income tax receivable/payable (17.3) 9.6 Other 1.0 (3.2)
Change in non-cash working capital (34.1) (34.4)
Cash (used in) from operating activities (5.2) 8.4
Financing activities Increase in bank indebtedness 7.7 - Issue of common shares 0.4 1.7 Dividends on common shares (23.4) (21.3) Repayment of long-term debt (0.1) (0.3)
Cash used in financing activities (15.4) (19.9)
Investing activities Purchase of property, plant and equipment (8.2) (4.9) Proceeds on sale of property, plant and equipment 0.4 0.2 Payment of contingent consideration (17.5) (4.1)
Cash used in investing activities (25.3) (8.8)
Effect of exchange rates on cash and cash equivalents 8.4 (9.6)
Decrease in cash and cash equivalents (37.5) (29.9) Cash and cash equivalents, beginning of the period 53.4 116.2
Cash and cash equivalents, end of the period $ 15.9 $ 86.3
Supplemental cash flow information: Income taxes paid $ 25.4 $ 3.3 Interest paid (net) $ 8.7 $ 8.1
The accompanying notes are an integral part of these consolidated financial statements.

Russel Metals Inc. 19
CONDENSED CONSOLIDATED STATEMENTS OF CHANGES IN EQUITY (UNAUDITED)
Accumulated Equity Other Component Common Retained Contributed Comprehensive of Convertible(in millions of Canadian dollars) Shares Earnings Surplus Income Debentures Total
Balance, January 1, 2015 $ 531.2 $ 344.0 $ 14.1 $ 47.1 $ 28.6 $ 965.0 Payment of dividends - (23.4) - - - (23.4)Net earnings for the period - 18.5 - - - 18.5 Other comprehensive income for the period - - - 36.0 - 36.0 Recognition of share-based compensation - - 0.3 - - 0.3 Share options exercised 0.5 - (0.1) - - 0.4 Transfer of net actuarial losses on defined benefit plans - (4.7) - 4.7 - -
Balance, March 31, 2015 $ 531.7 $ 334.4 $ 14.3 $ 87.8 $ 28.6 $ 996.8
Accumulated Equity Other Component Non- Common Retained Contributed Comprehensive of Convertible Controlling(in millions of Canadian dollars) Shares Earnings Surplus Income Debentures Interest Total
Balance, January 1, 2014 $ 509.5 $ 314.6 $ 16.2 $ 12.0 $ 28.7 $ 1.4 $ 882.4 Payment of dividends - (21.3) - - - - (21.3)Net earnings for the period - 29.0 - - - - 29.0 Other comprehensive income for the period - - - 10.4 - - 10.4 Recognition of share-based compensation - - 0.4 - - - 0.4 Share options exercised 2.1 - (0.4) - - - 1.7 Transfer of net actuarial losses on defined benefit plans - (4.1) - 4.1 - - - Change in non-controlling interest - - - - - (0.1) (0.1)
Balance, March 31, 2014 $ 511.6 $ 318.2 $ 16.2 $ 26.5 $ 28.7 $ 1.3 $ 902.5
The accompanying notes are an integral part of these consolidated financial statements.
20 Q1 - March 31, 2015
NOTES TO THE CONDENSED CONSOLIDATED FINANCIAL STATEMENTS (UNAUDITED)
NOTE 1 GENERAL BUSINESS DESCRIPTION
Russel Metals Inc. (the "Company"), a Canadian corporation with common shares listed on the Toronto Stock Exchange ("TSX"), is a metals distribution company operating in various locations within North America. The Company's registered office is located at 6600 Financial Drive, Mississauga, Ontario, L5N 7J6. These condensed consolidated financial statements were authorized for issue by the Board of Directors on May 5, 2015. NOTE 2 BASIS OF PRESENTATION
These condensed consolidated financial statements, including comparatives, have been prepared using the same accounting policies and methods as those used in the Company's consolidated financial statements for the year ended December 31, 2014. These condensed consolidated financial statements are in compliance with International Accounting Standard 34, Interim Financial Reporting ("IAS 34"). Accordingly, certain information and footnote disclosure normally included in annual financial statements prepared in accordance with International Financial Reporting Standards ("IFRS"), as issued by the International Accounting Standards Board ("IASB"), have been omitted or condensed. The preparation of financial statements in accordance with IAS 34 requires the use of certain critical accounting estimates. It also requires management to exercise judgement in applying the Company's accounting policies. The areas involving a higher degree of judgement or complexity or areas where assumptions and estimates are significant to the financial statements have been set out in the Company's consolidated financial statements for the year ended December 31, 2014. These condensed consolidated financial statements should be read in conjunction with the Company's consolidated financial statements for the year ended December 31, 2014. These condensed consolidated financial statements have been prepared on a going concern basis under the historical cost convention, as modified by the revaluation of financial assets and financial liabilities (including derivative instruments) at fair value through the condensed consolidated statement of earnings. Historical cost is generally based on the fair value of the consideration given in exchange for assets at the time of the transaction. These condensed consolidated financial statements are presented in Canadian dollars, which is the Company's functional currency. NOTE 3 INVENTORIES
Inventories of $0.7 billion (2014: $0.7 billion) were expensed in cost of materials for the first quarter of 2015. The Company recorded an inventory impairment charge of $1.6 million during the quarter ended March 31, 2015 (2014: $1.8 million). The Company did not have any reversals of previous inventory impairment charges taken during the quarters ended March 31, 2015 and 2014. NOTE 4 PROPERTY, PLANT AND EQUIPMENT
Land and Machinery Leasehold Cost (millions) Buildings and Equipment Improvements Total
Balance, December 31, 2014 $ 237.6 $ 323.6 $ 25.9 $ 587.1 Additions 3.1 4.9 0.2 8.2 Disposals - (3.3) - (3.3) Foreign exchange 3.8 6.2 0.2 10.2
Balance, March 31, 2015 $ 244.5 $ 331.4 $ 26.3 $ 602.2

Russel Metals Inc. 21
Accumulated depreciation and amortization Land and Machinery Leasehold (millions) Buildings and Equipment Improvements Total
Balance, December 31, 2014 $ 96.2 $ 220.3 $ 20.8 $ 337.3 Depreciation and amortization 1.9 5.0 0.1 7.0 Disposals - (2.8) - (2.8) Foreign exchange 1.5 3.5 0.2 5.2
Balance, March 31, 2015 $ 99.6 $ 226.0 $ 21.1 $ 346.7
Net Book Value (millions)
December 31, 2014 $ 249.8 March 31, 2015 $ 255.5
All items of property, plant and equipment are recorded and held at cost. Land, included in land and buildings, was $45.6 million (December 31, 2014: $45.3 million). For the quarter ended March 31, 2015, depreciation of $2.0 million was included in cost of materials (2014: $2.0 million) and depreciation of $5.0 million (2014: $4.8 million) was included in other operating expenses. NOTE 5 GOODWILL AND INTANGIBLES
March 31 December 31 (millions) 2015 2014
Goodwill $ 129.6 $ 128.5 Trademarks 5.0 5.0 Intangibles 79.6 80.8
$ 214.2 $ 214.3
The entire trademarks balance relates to the energy products segment. a) Goodwill Metals Service Energy Goodwill (millions) Centers Products Total
Balance, December 31, 2014 $ 39.0 $ 89.5 $ 128.5Foreign exchange 1.1 - 1.1
Balance, March 31, 2015 $ 40.1 $ 89.5 $ 129.6

22 Q1 - March 31, 2015
b) Intangibles The continuity of intangibles, which are comprised of customer relationships and non-competition agreements acquired through business combinations, within the metals service centers and energy products segments, is as follows: Metals Service Energy Cost (millions) Centers Products Total
Balance, December 31, 2014 $ 19.0 $ 79.5 $ 98.5Foreign exchange 0.5 - 0.5
Balance, March 31, 2015 $ 19.5 $ 79.5 $ 99.0
Metals Service Energy Accumulated amortization (millions) Centers Products Total
Balance, December 31, 2014 $ (7.1) $ (10.6) $ (17.7)Amortization (0.3) (1.4) (1.7)
Balance, March 31, 2015 $ (7.4) $ (12.0) $ (19.4)
Carrying amount
December 31, 2014 $ 80.8 March 31, 2015 $ 79.6
The carrying amount of intangible assets as at March 31, 2015 relates to customer relationships and non-competition agreements arising from acquisitions. The remaining amortization period for customer relationships is 8 to 15 years and for non-competition agreements is one year. NOTE 6 REVOLVING CREDIT FACILITIES
The Company has a credit agreement with a syndicate of banks which provides a credit facility of $275.0 million available for borrowings and letters of credit and an additional $50.0 million for letters of credit. The syndicated facility with a term to June 24, 2017 consists of availability of $275.0 million under Tranche I to be utilized for borrowings and letters of credit and $50.0 million under Tranche II to be utilized only for letters of credit. Letters of credit are issued under Tranche II first and additional needs are issued under Tranche I. The borrowings and letters of credit are available on a revolving basis, up to an amount equal to the sum of specified percentages of the Company's eligible accounts receivable and inventories, to a maximum of $325.0 million. The obligations of the Company under this agreement are secured by a pledge of trade accounts receivable and inventories of a significant portion of the Company's operations. At March 31, 2015, the Company had borrowings of $39.0 million (2014: $32.0 million) and letters of credit of $39.4 million (2014: $42.6 million) under this facility. One of the Company's U.S. subsidiaries has a credit facility of US$40 million. At March 31, 2015, this subsidiary had borrowings of US$4.5 million (2014: $nil) and letters of credit of US$0.5 million (2014: US$22.6 million) under this facility. The Company was in compliance with the financial covenants at March 31, 2015.

Russel Metals Inc. 23
NOTE 7 LONG-TERM DEBT
March 31 December 31 (millions) 2015 2014
6.0% $300 million Senior Notes due April 19, 2022 $ 294.6 $ 294.5 7.75% $174 million Convertible Debentures due September 30, 2016 166.7 165.4 Finance lease obligations 1.0 1.1 Less: current portion (0.5) (0.5)
$ 461.8 $ 460.5
a) On April 19, 2012, the Company issued through a private placement, $300 million 6.0% Senior Notes (the "Notes") due April 19, 2022, for total net proceeds of $293 million. Interest is due on April 19 and October 19 of each year. Prior to April 19, 2017, the Company may redeem the Notes in whole or in part at an amount which is the greater of (i) the present value of future interest and principal payments based on Canada Bond Yield or (ii) 101% of the principal amount plus accrued and unpaid interest. After April 19, 2017, the Company may redeem the Notes in whole or in part at any time at 103% of the principal amount declining rateably to 100% of the principal amount on or after April 19, 2020. The Notes contain certain restrictions on the payment of common share dividends in excess of $0.35 per share per quarter. The Notes also contain certain covenants that limit the Company's ability to incur additional indebtedness. The Company was in compliance with these covenants at March 31, 2015. Fees associated with the issue of the debt are included in the carrying amount of debt and are amortized using the effective interest method. b) In October 2009, the Company issued $175 million of 7.75% Convertible Unsecured Subordinated Debentures (the "Convertible Debentures") for net proceeds of $167.1 million. The Convertible Debentures mature on September 30, 2016, and interest is payable semi-annually on March 31 and September 30 in each year. Each debenture is convertible into common shares of the Company at the option of the holder at any time on or prior to the business day immediately preceding (i) maturity date; or (ii) the date specified for redemption of the Convertible Debentures, at a conversion price of $25.75 being a conversion rate of 38.8350 common shares per $1,000 principal amount of Convertible Debentures. NOTE 8 PENSIONS AND BENEFITS
As at March 31, 2015, the Company determined its accrued benefit obligations related to the employee future benefit plans using a discount rate of 3.50% (2014: 4.00%) and also determined the fair value of the defined benefit pension plan assets as at the statement of financial position date. The net change in the accrued benefit obligations less the fair value of the defined benefit plan assets resulted in an actuarial loss on employee future benefit plans of $6.4 million for the three month period ended March 31, 2015 (2014: loss of $5.6 million), which was recorded net of tax through other comprehensive income. The benefit obligations and plan assets for the Company's pension and other post retirement benefit obligations are as follows: March 31 December 31 (millions) 2015 2014
Present value of defined benefit pension obligations $ 137.7 $ 127.0 Present value of plan assets 110.5 105.5
27.2 21.5 Other post retirement benefit obligations 4.7 4.6
Defined benefit obligations, net $ 31.9 $ 26.1

24 Q1 - March 31, 2015
The following table provides the defined benefit obligation for partially funded plans and unfunded plans. Pension Plans Other Benefit Plans March 31 December 31 March 31 December 31 (millions) 2015 2014 2015 2014
Defined benefit obligation Partially funded plans $ 27.2 $ 21.5 $ - $ - Unfunded plans - - 4.7 4.6
Defined benefit obligation $ 27.2 $ 21.5 $ 4.7 $ 4.6
NOTE 9 SHAREHOLDERS' EQUITY
a) At March 31, 2015 and 2014, the authorized share capital of the Company consisted of: (i) an unlimited number of common shares without nominal or par value;
(ii) an unlimited number of Class I preferred shares without nominal or par value, issuable in series; and
(iii) an unlimited number of Class II preferred shares without nominal or par value, issuable in series.
The Directors have the authority to issue the Class I and Class II preferred shares in series and fix the designation, rights, privileges and conditions to be attached to each series, except that the Class I shares shall be entitled to preference over the Class II shares with respect to the payment of dividends and the distribution of assets in the event of liquidation, dissolution or winding-up of the Company. b) The number of common shares issued and outstanding was as follows:
Number Amount of Shares (millions)
Balance, December 31, 2014 61,674,228 $ 531.2 Share options exercised 27,400 0.5
Balance, March 31, 2015 61,701,628 $ 531.7
The continuity of contributed surplus is as follows:
(millions)
Balance, December 31, 2014 $ 14.1 Share-based compensation expense 0.3 Exercise of options (0.1)
Balance, March 31, 2015 $ 14.3
Dividends paid and declared were as follows:
Quarters ended March 31 2015 2014
Dividends paid (millions) $ 23.4 $ 21.3 Dividends per share $ 0.38 $ 0.35 Quarterly dividend per share declared on May 5, 2015 (May 6, 2014) $ 0.38 $ 0.35

Russel Metals Inc. 25
NOTE 10 SHARE-BASED COMPENSATION
Share Options The Company has a shareholder approved share option plan, the purpose of which is to provide the employees of the Company and its subsidiaries with the opportunity to participate in the growth and development of the Company. The following is a continuity of options outstanding: Weighted Average Number of Options Exercise Price
March 31 December 31 March 31 December 31 2015 2014 2015 2014
Balance, beginning of period 2,019,307 2,606,430 $ 27.70 $ 26.77 Granted 303,371 149,172 25.36 30.00 Exercised (27,400) (707,995) 15.85 24.64 Expired or forfeited (4,250) (28,300) 31.16 30.78
Balance, end of the period 2,291,028 2,019,307 $ 27.52 $ 27.70
Exercisable 1,607,304 1,366,999 $ 27.67 $ 27.44
The outstanding options had exercise price ranges as follows:
March 31 December 31 (number of options) 2015 2014
$ 29.00 - $ 33.81 574,272 576,772 $ 25.37 - $ 28.99 1,231,987 1,233,737 $ 15.85 - $ 25.36 484,769 208,798
Options outstanding 2,291,028 2,019,307
The Black-Scholes option-pricing model assumptions used to compute compensation expense are as follows:
March 31 December 31 2015 2014
Dividend yield 5% 5% Expected volatility 21% 32% Expected life 5 yrs 5 yrs Risk free rate of return 2.00% 2.75% Weighted average fair value of options granted $ 2.67 $ 5.43
Expected volatility is based on historical volatility over the last five years. Deferred Share Units (DSU) At March 31, 2015, there were 122,559 DSUs outstanding (2014: 113,057). The liability and fair value of DSUs was $2.9 million at March 31, 2015 (2014: $2.9 million). Dividends declared on common shares accrue to units in the DSU plan in the form of additional DSUs.

26 Q1 - March 31, 2015
Restricted Share Units (RSU) The Company has a RSU Plan for eligible employees as designated by the Board of Directors. Continuity of RSUs outstanding is as follows: March 31 December 31 (number of units) 2015 2014
Balance, beginning of the period 197,269 123,673 Granted 198,933 88,421 Paid out (62,335) (14,825)
Balance, end of the period 333,867 197,269
The RSU liability at March 31, 2015 was $3.4 million (2014: $3.8 million). The fair value of RSUs was $8.0 million at March 31, 2015 (2014: $5.1 million). Dividends declared on common shares accrue to units in the RSU plan in the form of additional RSUs. NOTE 11 EARNINGS PER SHARE
The following table provides the numerator and denominator used to compute basic and diluted earnings per share: Quarters ended March 31 (millions) 2015 2014
Net income used in calculation of basic earnings per share $ 18.5 $ 29.0 Interest and accretion expense, net of income taxes - 2.4
Net income used in calculation of diluted earnings per share $ 18.5 $ 31.4
In determining the diluted weighted average shares outstanding for the quarter ended March 31, 2015, 6,770,757 shares related to convertible debentures were excluded since the effect was anti-dilutive. Interest and accretion related to convertible debentures for the quarter ended March 31, 2015 were excluded from net earnings used in the calculation of diluted earnings per share. Quarters ended March 31 (number of shares) 2015 2014
Weighted average shares outstanding 61,678,145 60,966,768 Dilution impact of share options 45,403 209,967 Dilution impact of Convertible Debentures - 6,790,019
Diluted weighted average shares outstanding 61,723,548 67,966,754
Russel Metals Inc. 27
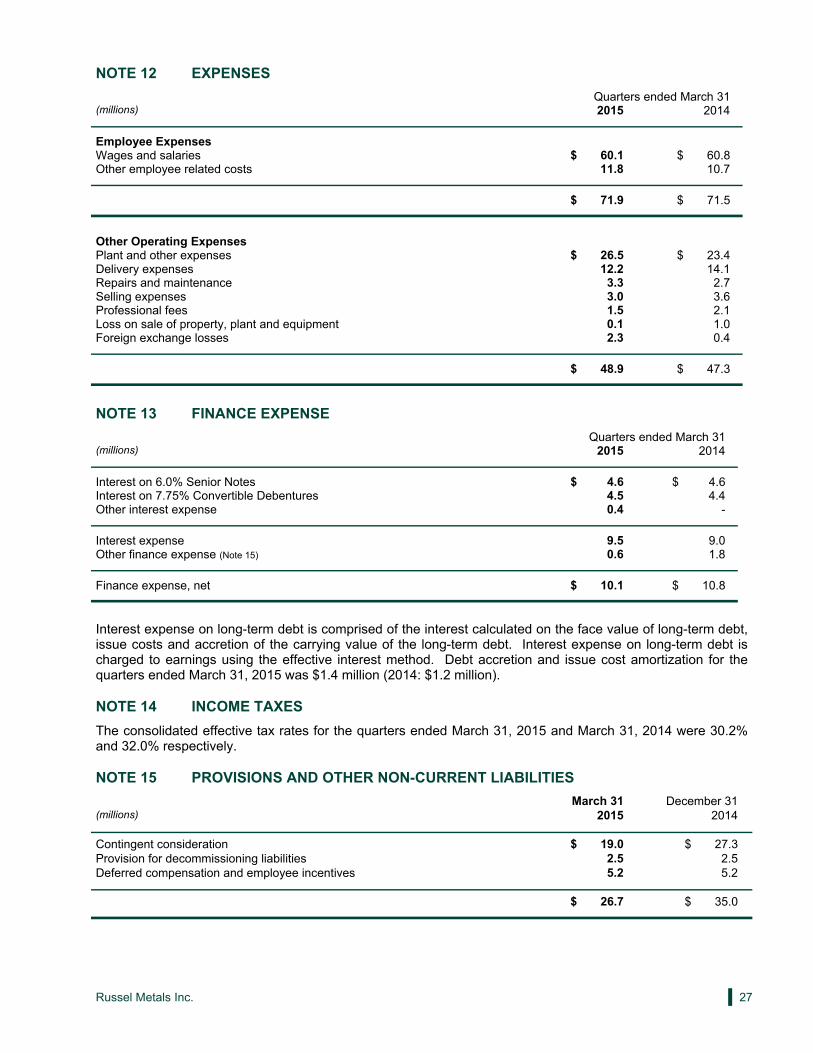
NOTE 12 EXPENSES
Quarters ended March 31 (millions) 2015 2014
Employee Expenses Wages and salaries $ 60.1 $ 60.8 Other employee related costs 11.8 10.7
$ 71.9 $ 71.5
Other Operating Expenses Plant and other expenses $ 26.5 $ 23.4 Delivery expenses 12.2 14.1 Repairs and maintenance 3.3 2.7 Selling expenses 3.0 3.6 Professional fees 1.5 2.1 Loss on sale of property, plant and equipment 0.1 1.0 Foreign exchange losses 2.3 0.4
$ 48.9 $ 47.3
NOTE 13 FINANCE EXPENSE
Quarters ended March 31 (millions) 2015 2014
Interest on 6.0% Senior Notes $ 4.6 $ 4.6 Interest on 7.75% Convertible Debentures 4.5 4.4 Other interest expense 0.4 -
Interest expense 9.5 9.0 Other finance expense (Note 15) 0.6 1.8
Finance expense, net $ 10.1 $ 10.8
Interest expense on long-term debt is comprised of the interest calculated on the face value of long-term debt, issue costs and accretion of the carrying value of the long-term debt. Interest expense on long-term debt is charged to earnings using the effective interest method. Debt accretion and issue cost amortization for the quarters ended March 31, 2015 was $1.4 million (2014: $1.2 million). NOTE 14 INCOME TAXES
The consolidated effective tax rates for the quarters ended March 31, 2015 and March 31, 2014 were 30.2% and 32.0% respectively. NOTE 15 PROVISIONS AND OTHER NON-CURRENT LIABILITIES
March 31 December 31 (millions) 2015 2014
Contingent consideration $ 19.0 $ 27.3 Provision for decommissioning liabilities 2.5 2.5 Deferred compensation and employee incentives 5.2 5.2
$ 26.7 $ 35.0
28 Q1 - March 31, 2015
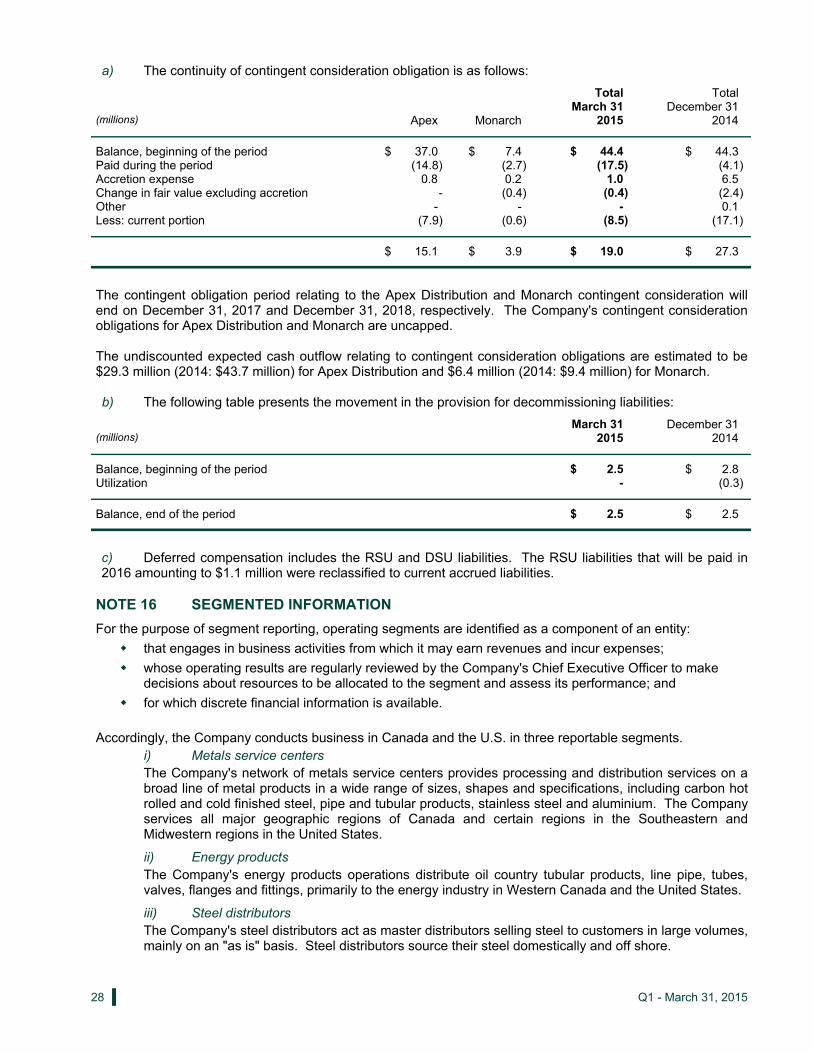
a) The continuity of contingent consideration obligation is as follows:
Total Total March 31 December 31 (millions) Apex Monarch 2015 2014
Balance, beginning of the period $ 37.0 $ 7.4 $ 44.4 $ 44.3 Paid during the period (14.8) (2.7) (17.5) (4.1) Accretion expense 0.8 0.2 1.0 6.5 Change in fair value excluding accretion - (0.4) (0.4) (2.4) Other - - - 0.1 Less: current portion (7.9) (0.6) (8.5) (17.1)
$ 15.1 $ 3.9 $ 19.0 $ 27.3
The contingent obligation period relating to the Apex Distribution and Monarch contingent consideration will end on December 31, 2017 and December 31, 2018, respectively. The Company's contingent consideration obligations for Apex Distribution and Monarch are uncapped. The undiscounted expected cash outflow relating to contingent consideration obligations are estimated to be $29.3 million (2014: $43.7 million) for Apex Distribution and $6.4 million (2014: $9.4 million) for Monarch. b) The following table presents the movement in the provision for decommissioning liabilities:
March 31 December 31 (millions) 2015 2014
Balance, beginning of the period $ 2.5 $ 2.8 Utilization - (0.3)
Balance, end of the period $ 2.5 $ 2.5
c) Deferred compensation includes the RSU and DSU liabilities. The RSU liabilities that will be paid in 2016 amounting to $1.1 million were reclassified to current accrued liabilities.
NOTE 16 SEGMENTED INFORMATION
For the purpose of segment reporting, operating segments are identified as a component of an entity:
that engages in business activities from which it may earn revenues and incur expenses;
whose operating results are regularly reviewed by the Company's Chief Executive Officer to make decisions about resources to be allocated to the segment and assess its performance; and
for which discrete financial information is available.
Accordingly, the Company conducts business in Canada and the U.S. in three reportable segments. i) Metals service centers
The Company's network of metals service centers provides processing and distribution services on a broad line of metal products in a wide range of sizes, shapes and specifications, including carbon hot rolled and cold finished steel, pipe and tubular products, stainless steel and aluminium. The Company services all major geographic regions of Canada and certain regions in the Southeastern and Midwestern regions in the United States.
ii) Energy products The Company's energy products operations distribute oil country tubular products, line pipe, tubes, valves, flanges and fittings, primarily to the energy industry in Western Canada and the United States.
iii) Steel distributors The Company's steel distributors act as master distributors selling steel to customers in large volumes, mainly on an "as is" basis. Steel distributors source their steel domestically and off shore.

Russel Metals Inc. 29
The Company has segmented its operations on the basis of management reporting and geographic segments in which it operates. For the quarter ended March 31, 2015 the inter-segment revenues from steel distributors to metals service centers were $13.8 million (2014: $8.5 million). These revenues, which are at market rates, are eliminated in the following table. a) Results by business segment:
Quarters ended March 31 (millions) 2015 2014
Segment Revenues Metals service centers $ 400.4 $ 391.5 Energy products 384.9 445.1 Steel distributors 118.5 87.3
903.8 923.9 Other 0.1 0.1
$ 903.9 $ 924.0
Segment Operating Profits Metals service centers $ 15.3 $ 21.2 Energy products 20.7 32.7 Steel distributors 6.3 6.3
42.3 60.2 Corporate expenses (4.3) (5.2) Other expense (1.4) (1.5)
Earnings before finance expense and income taxes 36.6 53.5 Finance expense, net (10.1) (10.8) Provision for income taxes (8.0) (13.7)
Net earnings $ 18.5 $ 29.0
Capital Expenditures Metals service centers $ 6.3 $ 3.4 Energy products 1.8 1.3 Steel distributors 0.1 0.2
$ 8.2 $ 4.9
Depreciation Expense Metals service centers $ 5.6 $ 5.3 Energy products 1.3 1.2 Steel distributors 0.1 0.1 Other - 0.2
$ 7.0 $ 6.8

30 Q1 - March 31, 2015
March 31 December 31 (millions) 2015 2014
Current Identifiable Assets Metals service centers $ 530.0 $ 521.2 Energy products 686.6 768.4 Steel distributors 260.7 220.5
1,477.3 1,510.1 Non-Current Identifiable Assets Metals service centers 267.1 261.6 Energy products 195.5 195.9 Steel distributors 6.3 5.8
Total identifiable assets included in segments 1,946.2 1,973.4 Assets not included in segments Cash and cash equivalents 15.9 53.4 Income tax assets 13.0 7.7 Deferred financing charges 0.9 1.0 Other assets 5.2 4.9 Corporate and other operating assets 0.6 2.4
Total assets $ 1,981.8 $ 2,042.8
Liabilities Metals service centers $ 175.6 $ 184.1 Energy products 212.8 276.0 Steel distributors 24.1 25.9
Liabilities by segment 412.5 486.0 Liabilities not included in segments Bank indebtedness 32.1 24.2 Income taxes payable and deferred income tax liabilities 17.0 31.1 Long-term debt 462.3 461.0 Pension and benefits 31.9 26.1 Corporate and other liabilities 29.2 49.4
Total liabilities $ 985.0 $ 1,077.8
b) Results by geographic segment:
Quarters ended March 31 (millions) 2015 2014
Segment Revenues Canada $ 636.3 $ 637.8 United States 267.5 286.1
$ 903.8 $ 923.9
Segment Operating Profits Canada $ 34.9 $ 44.1 United States 7.4 16.1
$ 42.3 $ 60.2
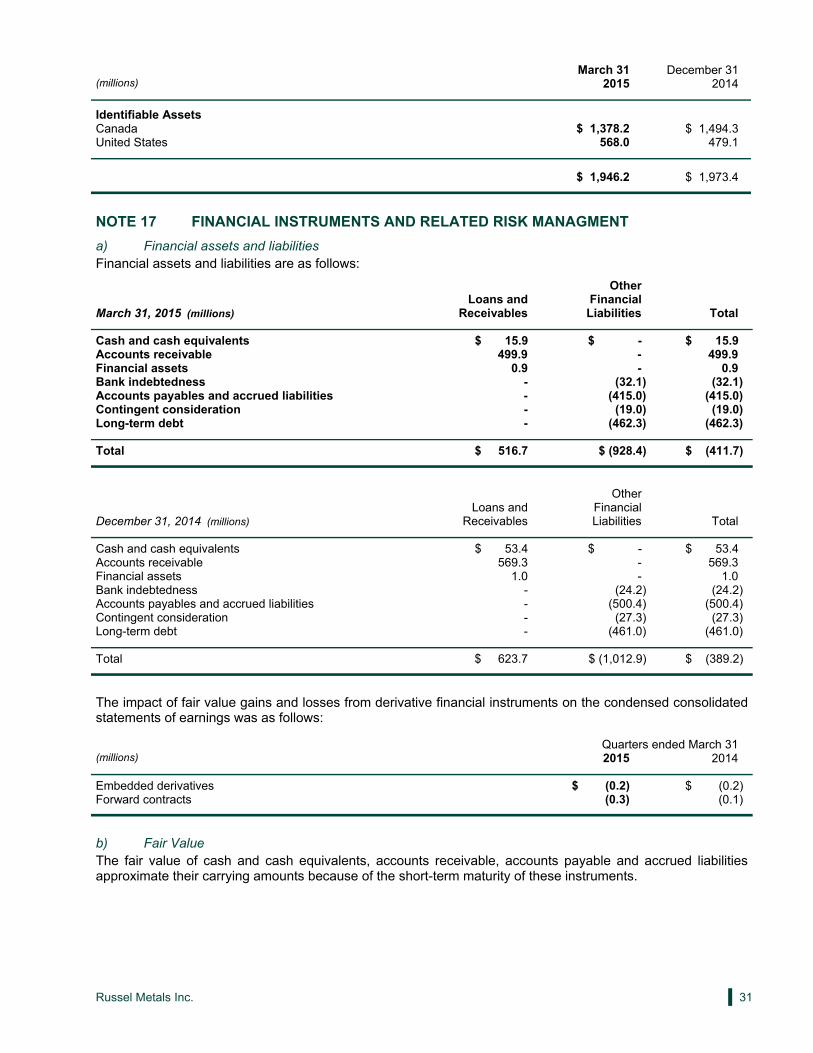
Russel Metals Inc. 31
March 31 December 31 (millions) 2015 2014
Identifiable Assets Canada $ 1,378.2 $ 1,494.3 United States 568.0 479.1
$ 1,946.2 $ 1,973.4
NOTE 17 FINANCIAL INSTRUMENTS AND RELATED RISK MANAGMENT
a) Financial assets and liabilities Financial assets and liabilities are as follows:
Other Loans and Financial March 31, 2015 (millions) Receivables Liabilities Total
Cash and cash equivalents $ 15.9 $ - $ 15.9Accounts receivable 499.9 - 499.9Financial assets 0.9 - 0.9Bank indebtedness - (32.1) (32.1)Accounts payables and accrued liabilities - (415.0) (415.0)Contingent consideration - (19.0) (19.0)Long-term debt - (462.3) (462.3)
Total $ 516.7 $ (928.4) $ (411.7)
Other Loans and Financial December 31, 2014 (millions) Receivables Liabilities Total
Cash and cash equivalents $ 53.4 $ - $ 53.4 Accounts receivable 569.3 - 569.3 Financial assets 1.0 - 1.0 Bank indebtedness - (24.2) (24.2) Accounts payables and accrued liabilities - (500.4) (500.4) Contingent consideration - (27.3) (27.3) Long-term debt - (461.0) (461.0)
Total $ 623.7 $ (1,012.9) $ (389.2)
The impact of fair value gains and losses from derivative financial instruments on the condensed consolidated statements of earnings was as follows: Quarters ended March 31 (millions) 2015 2014
Embedded derivatives $ (0.2) $ (0.2) Forward contracts (0.3) (0.1)
b) Fair Value The fair value of cash and cash equivalents, accounts receivable, accounts payable and accrued liabilities approximate their carrying amounts because of the short-term maturity of these instruments.

32 Q1 - March 31, 2015
The fair value measurements of contingent consideration obligations arising from business combinations were determined by applying the income approach using the probability weighted expected return on assets and a discount rate of 12.9%. The calculation uses unobservable (level 3) inputs including (i) the estimated amount and timing of projected cash flows; (ii) the probability of the achievement of the factors on which the contingency is based; (iii) average net assets; and (iv) the risk-adjusted discount rate used to present value the projected cash flows. Significant changes in any of these inputs in isolation can result in a significantly higher or lower fair value measurement. The fair values of long-term debt are set forth below. Carrying Amounts Amounts recorded in the condensed consolidated statement of financial position are referred to as "carrying amounts". The carrying amounts of primary debt are reflected in "Long-term debt" and "Current portion long-term debt". Fair Value The Company records its debt at amortized cost using the effective interest method. The fair value of long-term debt as at March 31, 2015 and December 31, 2014 was estimated based on the last quoted trade price, where it exists, or based on current rates available to the Company for similar debt with the same period to maturity. The following summary reflects the fair value of the long-term debt:
Primary Debt Instrument
Carrying Fair Value Fair ValueMarch 31, 2015 (millions) Amount Level 1 Level 2
6.0% $300 million Senior Notes due April 19, 2022 $ 294.6 $ - $ 315.87.75% $174 million Convertible Debentures due September 30, 2016 166.7 185.7 -Finance lease obligations 1.0 - 1.0
Total $ 462.3 $ 185.7 $ 316.8
Current portion $ 0.5Long-term portion $ 461.8 Primary Debt Instrument
Carrying Fair Value Fair Value December 31, 2014 (millions) Amount Level 1 Level 2
6.0% $300 million Senior Notes due April 19, 2022 $ 294.5 $ - $ 301.5 7.75% $174 million Convertible Debentures due September 30, 2016 165.4 191.8 - Finance lease obligations 1.1 - 1.1
Total $ 461.0 $ 191.8 $ 302.6
Current portion $ 0.5 Long-term portion $ 460.5 c) Credit risk Credit risk is the risk of financial loss to the Company if the counterparty to a financial instrument fails to meet its contractual obligation. Credit risk arises from cash and cash equivalents and derivative financial instruments, as well as credit exposure to customers including accounts receivable. The Company attempts to minimize credit exposure as follows:
Cash investments are placed with high-quality financial institutions with limited exposure to any one institution. At March 31, 2015, nearly all cash and cash equivalents held were issued by institutions that were R1 High by DBRS;
Counterparties to derivative contracts are members of the syndicated banking facility (Note 6);

Russel Metals Inc. 33
Credit limits minimize exposure to any one customer; and
The customer base is geographically diverse and in different industries. No allowance for credit losses on financial assets was required as of March 31, 2015 and December 31, 2014, other than the allowance for doubtful accounts. As at March 31, 2015, trade accounts receivable greater than 90 days represented less than 5% of trade accounts receivable (2014: 4%). d) Interest rate risk Interest rate risk is the risk that the fair value of the future cash flows of a financial instrument will fluctuate because of changes in market rates of interest. The Company is not exposed to significant interest rate risk. The Company's long-term debt is at fixed rates. The Company's bank borrowings, net of cash and cash equivalents used to finance working capital which is short-term in nature, is at floating interest rates. e) Foreign exchange risk Foreign exchange risk is the risk that the fair value of the future cash flows of a financial instrument will fluctuate because of changes in foreign exchange rates. The Company uses foreign exchange contracts with maturities of less than a year to manage foreign exchange risk on certain future committed cash outflows. As at March 31, 2015, the Company had outstanding forward foreign exchange contracts in the amount of US$20.4 million and €2.8 million, maturing in 2015 (2014: US$32.8 million and €11.4 million). A 1% change in foreign exchange rates would not result in a significant increase or decrease in accounts payable or net earnings. f) Liquidity risk Liquidity risk is the risk that the Company will not meet its financial obligations when due. Liquidity adequacy is assessed in view of seasonal needs, growth requirements, capital expenditures, and the maturity profile of indebtedness. Cash is managed by the centralized treasury function and is invested in money market instruments or bank deposits, with durations ranging up to sixty days. A centralized treasury function ensures that the Company maintains funding flexibility by assessing future cash flow expectations and by maintaining its committed borrowing facilities. As at March 31, 2015, the Company was contractually obligated to make payments under its financial liabilities that come due during the following periods:
Operating Accounts Long-Term Long-Term Lease (millions) Payable Debt Maturities Debt Interest Obligations Total
2015 $ 415.0 $ - $ 15.8 $ 18.6 $ 449.4 2016 - 174.3 31.6 22.2 228.1 2017 - - 18.0 19.8 37.8 2018 - - 18.0 13.6 31.6 2019 - - 18.0 9.8 27.8 2020 and beyond - 300.0 45.8 30.8 376.6
Total $ 415.0 $ 474.3 $ 147.2 $ 114.8 $ 1,151.3
At March 31, 2015, the Company was contractually obligated to repay its letters of credit under its bank facilities at maturity (Note 6). g) Capital management The Company manages capital in order to safeguard its ability to continue as a going concern, provide returns to shareholders through its dividend policy and provide the ability to finance future growth. Capital includes shareholders' equity, long-term debt and bank indebtedness, net of cash and cash equivalents. The Company manages its capital structure and may make adjustments to the amount of dividends paid to shareholders, purchase shares for cancellation pursuant to issuer bids, issue new shares, issue new debt, repurchase existing debt and extend or amend its banking facilities.

34 Q1 - March 31, 2015
NOTE 18 CONTINGENCIES, COMMITMENTS AND GUARANTEES
a) Lawsuits and legal claims The Company recognizes contingent loss provisions for losses that are probable when management is able to reasonably estimate the loss. When the estimated loss lies within a range, the Company records a contingent loss provision based on its best estimate of the probable loss. If no particular amount within that range is a better estimate than any other amount, the minimum amount is recorded. Estimates of losses may be developed significantly before the ultimate loss is known, and are revalued each accounting period as additional information becomes known. In instances where the Company is unable to develop a reasonable loss estimate, no contingent loss provision is recorded at that time. A contingent loss provision is recorded when a reasonable estimate can be made. Estimates are reviewed quarterly and revised when expectations change. An outcome that deviates from the Company’s estimate may result in an additional expense or income in a future accounting period. The Company and certain of its subsidiaries have been named defendants in a number of legal actions. Although the outcome of these legal actions cannot be determined, management intends to defend all such legal actions and has recorded provisions, as required, based on its best estimate of the potential losses. In the opinion of management, the resolution of these legal actions is not expected to have a material adverse effect on the Company's financial position, cash flows or operations. The Company and the manufacturer of certain energy products have received notice of a customer claim relating to product that was distributed by the Company between 2010 and 2012. The customer alleges that the product was defective and that the manufacturer did not meet the specifications for the goods distributed by the Company. The Company is currently evaluating the claim but has not been provided with information to make a reliable estimate of any potential liability and consequently no provision has been recorded. The Company intends to vigorously defend against this claim and to assert its rights against the manufacturer. The Company has also entered into other agreements that provide indemnifications to counterparties in certain transactions including underwriting agreements. These indemnifications generally require the Company to indemnify the counterparties for costs incurred as a result of losses from litigation that may be suffered by counterparties arising from those transactions except in the case of gross negligence by the counterparties. b) Decommissioning liability The Company is incurring site cleanup and restoration costs related to properties not utilized in current operations. Remedial actions are currently underway at two sites. Decommissioning liabilities have been estimated using discounted cash flow valuation techniques for cleanup costs based on management's best estimates of the amount required to settle the liability. The Company has asset retirement obligations relating to the land lease for its Thunder Bay Terminal operation whose lease term expires in 2031. The landlord has the option to retain the equipment or to require the Company to remove it. In addition, the Company has end-of-lease obligations in certain service center operations. c) Business combinations and investments The Company has a contractual obligation to pay additional consideration for its acquisitions of Apex Distribution and Monarch which is based upon the achievement of performance measures during the first five years of ownership.

6600 Financial Drive, Mississauga, Ontario L5N 7J6 Tel: 905-819-7777 Fax: 905-819-7409
Email: [email protected] Website: www.russelmetals.com