FIRST QUARTER 2017...Positioned to resume quarterly resource play growth in 2Q 204 191 191 13* 18*...
26
FIRST QUARTER 2017 Financial and Operational Review May 4, 2017
Transcript of FIRST QUARTER 2017...Positioned to resume quarterly resource play growth in 2Q 204 191 191 13* 18*...

FIRST QUARTER 2017
Financial and Operational Review
May 4, 2017

Forward-Looking Statements and Other Matters
This presentation (and oral statements made regarding the subjects of this presentation) contains forward-looking statements within the meaning of Section 27A of the Securities Act of 1933 and Section 21E of the Securities Exchange Act of 1934. These are statements, other than statements of historical fact, that give current expectations or forecasts of future events, including, without limitation: the Company's future performance, business strategy, asset quality, production guidance, drilling plans, 2017 capital plans, cost and expense estimates, asset sales and acquisitions, future financial position, and other plans and objectives for future operations. Words such as "anticipate," "believe," "could," "estimate," "expect," "forecast," "guidance," "intend," “may,” "plan," "project," "seek," “should,” "target," "will," "would," or similar words may be used to identify forward-looking statements; however, the absence of these words does not mean that the statements are not forward-looking.
While the Company believes its assumptions concerning future events are reasonable, a number of factors could cause results to differ materially from those projected, including, without limitation: conditions in the oil and gas industry, including supply/demand levels and the resulting impact on price; changes in expected reserve or production levels; changes in political or economic conditions in the jurisdictions in which the Company operates, including changes in foreign currency exchange rates, interest rates, inflation rates, and global and domestic market conditions; capital available for exploration and development; risks related to our hedging activities; well production timing; the inability of any party to satisfy closing conditions with respect to our asset acquisitions and disposition; drilling and operating risks; availability of drilling rigs, materials and labor, including the costs associated therewith; difficulty in obtaining necessary approvals and permits; non-performance by third parties of contractual obligations; unforeseenhazards such as weather conditions; acts of war or terrorism, and the governmental or military response thereto; cyber-attacks; changes in safety, health, environmental, tax and other regulations; other geological, operating and economic considerations; and the risk factors, forward-looking statements and challenges and uncertainties described in the Company’s 2016 Annual Report on Form 10-K, Quarterly Reports on Form 10-Q and other public filings and press releases, available at www.MarathonOil.com. Except as required by law, the Company undertakes no obligation to revise or update any forward-looking statements as a result of new information, future events or otherwise.
Reconciliations of the differences between non-GAAP financial measures used in this presentation and their most directly comparable GAAP financial measures are available at www.MarathonOil.com in the 1Q 2017 Investor Packet.
2

Raising 2017 Production GuidanceExit rate momentum positions for a strong 2018
*Adjusted for divestitures of 13 MBOED in FY16Excluding Libya and discontinued operations
U.S. Resource Play Production
Total E&P Available for Sale Volumes
MB
OED
BO
ED &
BO
PD
194
135*
0
100
200
300
400
FY 2016 FY 2017E
GuidanceE&P: 340 - 360
4Q 2016 4Q 2017
U.S. resource plays Remaining E&P Range
20 – 25%growth
• 2017 total E&P annual production growth of 6% at the midpoint, divestiture adjusted
– Raising full-year E&P production guidance 5 MBOED
• Resource plays on track to resume sequential growth in 2Q
• 4Q16 to 4Q17 oil & boe growth of 20 -25% in resource plays
– Raised from previous guidance of 15 - 20%
329*
3

Strong operational results; entered N. Delaware and exited Canadian Oil SandsFirst Quarter Highlights
STACK Yost pilot avg IP30 of 990 BOED, in line with
expectations
Bakken E. Myrmidon wells to sales avg IP30 of 1,875 BOED
Eagle Ford production up 5% sequentially
Well Results
Announced acquisitions of 91,000 net surface acres in
Permian basin for $1.8B
Announced divestiture of Canadian Oil Sands for
$2.5B
Portfolio
OperationsE&P production 338 MBOED
N.A. E&P production 208 MBOED, above top end of
guidance
N.A. E&P production expenses down 20% from
year-ago quarter
4

Positive 1Q Cash Flow From Continuing OperationsCash on hand remains $2.5B; liquidity at $5.8B
2,488 2,490
513 (359)
(42) 64 (180)6
0
500
1,000
1,500
2,000
2,500
3,000
3,500
12/31/16 CashBalance
Operating CashFlow b/f WC
CapitalExpenditures
Dividends Total WorkingCapital
Deposit forAcquisition
Other 3/31/17 CashBalance
$MM
21
1Including accruals2Total working capital includes $(12)MM and $76MM of working capital changes associated with operating activities and investing activities, respectivelySee the 1Q 2017 Investor Packet at www.Marathonoil.com for non-GAAP reconciliations
5

Continued Cost Reductions in N.A. E&P~20% YoY reduction in absolute production expenses
134 128113 111 109
0.00
1.50
3.00
4.50
6.00
7.50
9.00
0
25
50
75
100
125
150
1Q 2016 2Q 2016 3Q 2016 4Q 2016 1Q 2017
$ / B
OE
N.A. E&P Production Expenses
~20% reduction
$MM
6
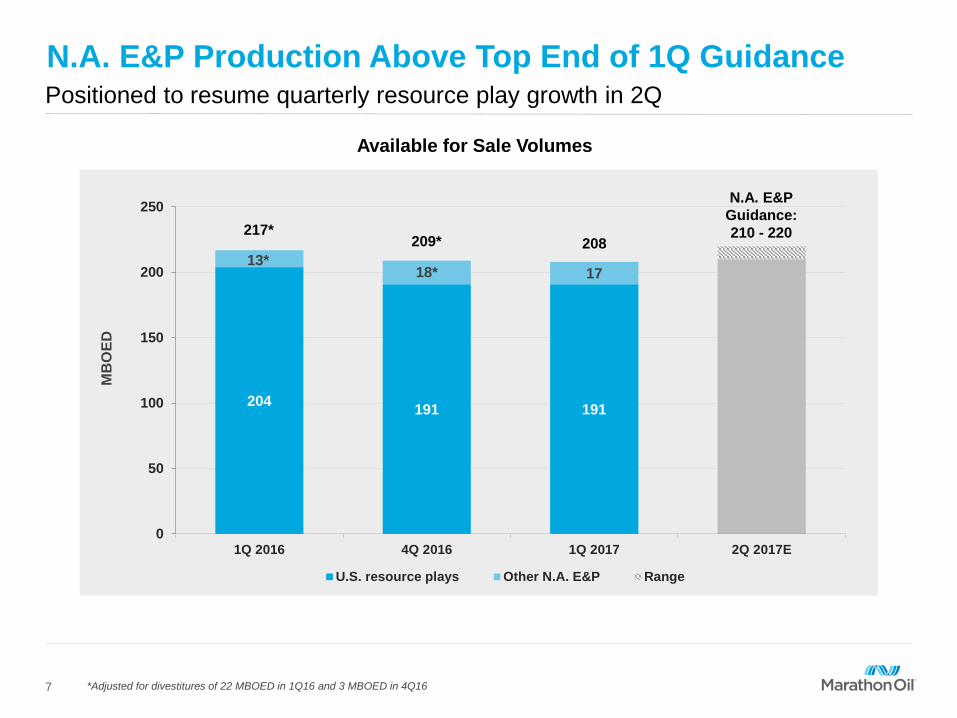
N.A. E&P Production Above Top End of 1Q GuidancePositioned to resume quarterly resource play growth in 2Q
204 191 191
13*18* 17
0
50
100
150
200
250
1Q 2016 4Q 2016 1Q 2017 2Q 2017E
MB
OED
U.S. resource plays Other N.A. E&P Range
Available for Sale Volumes
217*209* 208
N.A. E&PGuidance: 210 - 220
*Adjusted for divestitures of 22 MBOED in 1Q16 and 3 MBOED in 4Q16 7

Northern Delaware Integration On TrackClosed BC Operating May 1st
• 5 BC gross operated wells to sales in 1Q
– Western step-out Red Light Wolfcamp XY well IP 24 of 1,443 BOED (72% oil)
– Abe State 2nd Bone Spring well IP 24 of 1,516 BOED (87% oil)
• Ramping to 3 rigs by mid-year
• Expect 15 to 20 gross operated wells to sales in 2H 2017
• Northern Delaware industry well performance consistently improving year over year
– 180 day cumulative production increased >100% in three years
– Outpacing other basins on rate of change
• Uplifted well results correlated to increased completion sizes
Avg Hz Well Performance (Lea & Eddy Co. NM)
0
30,000
60,000
90,000
120,000
150,000
2013 2014 2015 2016
Cum
ulat
ive
(BO
E)
90d Cum. Prod. 180d Cum. Prod.
Current Focus:
Closing transactions
Standing up a high performance team
Pursuing acreage consolidation
Ramping up activity
Marketing & Infrastructure
8

Northern Delaware Well PerformancePlay extension continues; impressive well results being reported
LEA COUNTY
EDDY COUNTY
CHAVES COUNTY
Industry wellsBC well
Bone SpringWolfcamp
Secondary Targets
Mewbourne: Gobbler 1H2nd Bone Spring
IP24: 1,300 BOED (86% Oil)8,554’ LL
BC Operating: Sterling State 1HWolfcamp X-Y
IP24: 1,161 BOED (73% Oil)4,586’ LL
BC Operating: Red Light 2HWolfcamp X-Y
IP24: 1,443 BOED (72% Oil)7,530’ LL
WPX: C-STATE 16-1HWolfcamp XY
IP30: 1,635 BOED (65% oil)4,800’ LL
Devon: Fighting Okra 71HUpper Wolfcamp
IP30: 3,000 BOED (80% Oil)9,000’ LL
BC Operating: Abe State 3H2nd Bone Spring
IP24: 1,516 BOED (87% Oil)4,620’ LL
BTA: Rojo 1HAvalon
IP24: 1,817 BOED (77% Oil)9,024’ LL
IPs shown are 24 hr and 30 day (includes oil and gas)
BC Operating: Chili Parlor 2H2nd Bone Spring
IP24: 1,039 BOED (83% Oil)4,600’ LL
BC Operating: Cass 16 State 1HLower Wolfcamp
IP24: 880 BOED (37% Oil)3,700’ LL
Matador: Mallon 3 Well Pad3rd Bone Spring
IP24 Avg: 2,618 (91% oil)7,300’ LL
EOG: Leghorn 32 State 201HAvalon
IP30: 3,630 BOED (70% oil)4,500’ LL
9

Oklahoma Progressing Strategic ObjectivesFocused on delineation, leasehold and infill pilots
• Production averaged 44 net MBOED; down 2% from 4Q 2016
• 12 gross operated wells to sales
– Yost infill pilot average IP 30 rates of 990 BOED (57% oil); 4,650’ average LL
• Increasing activity to 11 rigs in 2Q
– 18 to 22 gross operated wells to sales
• Upcoming downspacing pilots:
– Hansens black oil SL infill to sales in 2Q; 7 wells staggered at 91-acre spacing
– Tan volatile oil XL infill to spud in 2Q; 9 wells staggered at 71-acre spacing
• 2 volatile oil XL wells online early 2Q with IP 24 rates exceeding 1,500 BOED (69% oil)
25
50
75
100
0 30 60 90 120
3-st
ream
MB
OE
(Nor
mal
ized
to 5
,000
ftLL
)
Days
EXTERNAL BO SL TC
YOST INFILL (INC PARENT)
Yost Meramec Infill Pilot Cum Production
Yost Infill Pilot Cross Section
OSAGE
Existing Meramec well
New Upper Meramec well
New Lower Meramec well
Yost InfillOil SL Type Curve
10

STACK & SCOOP Infill Spacing PilotsSignificant component of 2017 activity – preparing for full field development
IPs shown are 30 day (includes oil, NGL and gas)
Tan Volatile Oil Infill Pilot – 2Q Spud
OSAGE
Existing Meramec well
New Upper Meramec well
New Lower Meramec well
Hansens Black Oil Infill Pilot – 2Q wells to sales
OSAGE
Existing Meramec well
New Upper Meramec well
New Lower Meramec well
Caddo
Grady
Stephens
Garvin
Blaine Kingfisher
Canadian
MRO Hansens 7-well infill pilotMeramec2Q Sales
Wet GasCondensateOil
Infill pilots
MRO Yost 6-well infill pilotMeramec
Avg: 990 BOED (57% oil)
MRO Tan 9-well infill pilotMeramec
2Q Spud, 3Q Sales
MRO Marie 4-well infill pilotSpringer
1Q/2Q Spud, 3Q Sales
MRO Eve 7-well infill pilotMeramec
3Q Completions
MRO Lightner 8-well infill pilotWoodford4Q Spud
11

Eagle Ford Execution Delivers Strong 1QSequential production increase with fewer wells to sales
Drilling Performance
75
100
125
150
175
1,000
1,500
2,000
2,500
3,000
1Q 2016 2Q 2016 3Q 2016 4Q 2016 1Q 2017
Dril
ling
Cos
t Per
Foo
t ($)
Dril
ling
Feet
Per
Day
Drilling Feet per Day Cost per Foot
• Production averaged 99 net MBOED; up 5% from 4Q 2016
– Oil production up 7% sequentially
• 47 gross operated wells to sales (29 net working interest wells)
– 80% of 1Q wells in high-margin oil window
– $4.0MM avg completed well costs; down ~7% from year-ago quarter
• Set new MRO record for fastest well drilled at 4,000 ft per day; 25% of wells >3,000 ftper day
• Coupling high intensity completions with more efficiency; record stages per crew
• Maintaining 6 rig activity level in 2017; expect 35 - 40 gross operated wells to sales in 2Q
Production Volumes and Wells to Sales
MB
OED
0
30
60
90
120
0
40
80
120
160
1Q 2016 2Q 2016 3Q 2016 4Q 2016 1Q 2017
Co-
Op
Wel
ls to
Sal
es
Production Gross Wells Net WI Wells
12

Live Oak
Bee
KarnesAtascosa
Wilson
Eagle Ford 1Q Activity OverviewExcellent performance from southeast Atascosa County
Culberson Patteson3 well pad
UEF/LEF Co-DevAvg: 1,247 BOED (50% oil)
200’ SS
Franke May A3 well pad
LEFAvg: 1,140 BOED (79% oil)
200’ SS
Gilley (2)3 well pad
UEF/LEF Co-DevAvg: 1,675 BOED (69% oil)
200’ SS
Gilley (1)3 well pad
UEF/LEF Co-DevAvg: 1,178 BOED (72% oil)
200’ SS
Guajillo 12 North4 well pad
LEFAvg: 1,412 BOED (81% oil)
200’ SS (3), 300’ SS (1)
Rancho Grande4 well pad
LEFAvg: 1,340 BOED (64% oil)
250’ SS
Guajillo 16 South4 well pad
LEFAvg: 1,690 BOED (76% oil)
200’ SS (3), 250’ SS (1)
Children Weston4 well pad
UEF/LEF Co-DevAvg: 1,240 BOED (62% oil)
250’ SS
Medina Jonas A3 well pad
LEFAvg: 1,450 BOED (84% oil)
200’ SS
IPs shown are 30 day (includes oil, NGL and gas)13

0
40
80
120
160
200
0 50 100 150 200 250
MB
OE
Days2011 2012 2013 2014 2015 2016 2017
Bakken Returning to Production Growth in 2QResponse to high intensity completions supports increased drilling activity
• Production averaged 48 net MBOED; down 8% from 4Q 2016
• 4 gross operated wells to sales (4 net working interest wells)
– 3 Three Forks and 1 Middle Bakken average IP 30 rates of 1,875 BOED (78% oil)
– All outperforming type curve
• Mobilized 5 rigs to Myrmidon and 2 rigs to Hector since December
• Set new MRO record spud to TD in <10 days
• Expect 10 - 12 gross operated wells to sales in 2Q
MB
OED
Production Volumes and Wells to Sales
0
5
10
15
20
0
20
40
60
80
1Q 2016 2Q 2016 3Q 2016 4Q 2016 1Q 2017
Co-
Op
Wel
ls to
Sal
es
Production Gross Wells Net WI Wells
Average MRO Operated Well Cum Production
14

McKenzie
Dunn
Mountrail
Myrmidon
Hector
Elk Creek
Ajax
Bakken East Myrmidon Well PerformanceLatest Maggie North pad exceeding expectations
E. Myrmidon: Maggie North Pad
Ronald 34-33TFH-2B1,490 BOED
Anton 34-33TFH2,040 BOED
Goldberg USA 24-33TFH1,779 BOED
Gaynor 34-33H2,203 BOED
5 - 10 MMLBS proppantSliding Sleeve38 – 45 stages
Diversion applications
IPs shown are 30 day (includes oil, NGL and gas)
0
20
40
60
80
100
0 10 20 30 40 50 60Days
Anton (TF)Goldberg (TF)Gaynor (MB)Ronald (TF2)Type Curve
MB
OE
1Q 2017 Pad: Maggie North Cum Production
0
50
100
150
200
250
0 30 60 90 120 150 180
Days
Maggie (MB)Rufus (TF)Hannah (TF)Type Curve
3Q 2016 Pad: Maggie South Cum Production
MB
OE
MRO well
Drilling
15

International E&P HighlightsEG continuing to deliver substantial free cash flow
• International E&P production 122 net MBOED, in-line with guidance
– Down sequentially due to planned and unplanned downtime
• Significant free cash flow from EG with $161MM of EBITDAX in 1Q
– Includes $106MM from equity share of onshore plants
• 2Q guidance up on stronger expected performance from EG & UK
• Libya production averaged 8 net MBOED with two liftings
Intl E&P Production Volumes (Excl. Libya)
BO
ED
84109 105
16
20 17
0
25
50
75
100
125
150
1Q 2016 4Q 2016 1Q 2017 2Q 2017E
EG International Other Range
Total EGEBITDAX* $69MM $163MM $161MM
*EBITDAX from equity share of onshore plants was $38MM, $101MM and $106MM in 1Q 2016, 4Q 2016 and 1Q 2017, respectivelySee the 1Q 2017 Investor Packet at www.Marathonoil.com for non-GAAP reconciliations
Intl E&PGuidance: 120 - 130
16

Key Takeaways
Portfolio Management
$2.5B 1Q cash;$5.8B total liquidity
Balance Sheet Strength
$2.5B Canadian oil sands divestiture
$1.8BN. Delaware acquisitions
STACK Yost Pilot In Line With Expectations
990 BOEDaverage 30-day IPs
Bakken E. Myrmidon Outperforming
5% production from prior quarter
1,875 BOEDaverage 30-day IPs
&
Execution Ramp on Plan
20 rigsfrom 12 at YE 2016
Strong Eagle Ford Execution
Full-year E&P production*340 - 360 MBOED20 - 25% 2017 Resource play exit rate production (oil & boe)
Raising Production Guidance
*Excluding Libya17

Appendix

Volumes, Exploration Expenses & Effective Tax Rate2017 (excluding Libya)
1Q 2Q 3Q 4Q Year
North America E&P Net Sales Volumes:
- Liquid Hydrocarbons (MBD) 158
- Natural Gas (MMCFD) 304
- North America E&P Total (MBOED) 208
International E&P Net Sales Volumes:
- Liquid Hydrocarbons (MBD) 50
- Natural Gas (MMCFD) 461
- International E&P Total (MBOED) 126
Total E&P Sales Volumes (MBOED) 334
Total E&P Available for Sale (MBOED) 330
- Disc. operations synthetic crude oil production (MBD)* 45
Total Company Available for Sale (MBOED) 375
Equity Method Investment Net Sales Volumes:
- LNG (metric tonnes/day) 6,147
- Methanol (metric tonnes/day) 1,307
- Condensate and LPG (BOED) 14,546
Exploration Expenses (Pre-tax):
- North America E&P ($ millions) 26
- International E&P ($ millions) 2
Consolidated Effective Tax Rate (excl. Libya) (16)%
*Upgraded bitumen excluding blendstocks19

2017 EstimatesVolumes
Available for Sale 2QE
Available for Sale Year Estimate
Comments
North America E&P Total (MBOED) 210 – 220
- Liquid Hydrocarbons (MBD) 159 – 167
- Natural Gas (MMCFD) 306 – 320
International E&P Total (MBOED)* 120 – 130
- Liquid Hydrocarbons (MBD)* 45 – 48
- Natural Gas (MMCFD)* 453 – 491
Total both E&P Segments (MBOED)* 330 – 350 340 – 360 FY Guidance Updated**
Equity Method Investment LNG (metric tonnes/day) 6,100 – 6,500 6,200 – 6,600
* Excluding Libya** Updated full year E&P guidance to include production from Northern Delaware20

2017 EstimatesExploration expenses & annual production operating costs per BOE
2QE Year Estimate
Exploration Expenses (Pre-tax):
North America E&P ($ millions) 25 – 35
International E&P ($ millions) 2 – 4
North America E&P Cost Data
Production Operating $5.00 – 6.00
DD&A $21.75 – 24.25
Other* $5.00 – 5.50
International E&P Cost Data**
Production Operating $4.50 – 5.50
DD&A $6.50 – 8.00
Other* $1.75 – 2.25
Statutory Tax Rates by Jurisdiction:
U.S. and Corporate Tax Rate 0%
Equatorial Guinea Tax Rate 25%
United Kingdom Tax Rate 40%
Canada Tax Rate 27%
* Other includes shipping and handling, general and administrative, and other operating expenses ** Excludes Libya21

E&P Production Performance1Q volumes down due to planned and unplanned downtime
N.A. E&P Divestiture-Adj. Sales Volumes
MB
OED
217 209 208
0
100
200
300
1Q 2016 4Q 2016 1Q 2017
Avg C&C Realizations ($/BBL)
Excluding Derivatives
$28.21 $45.89 $48.46
Including Derivatives
$29.85 $46.21 $48.80
Adjusted for divestitures of 22 MBOED in 1Q16 and 3 MBOED in 4Q16
MB
OED
Intl E&P Production & Sales Volumes
100 96129 135 122 114
810
8 12
0
25
50
75
100
125
150
175
Avg C&C Realizations($/BBL)
$30.95 $46.14 $50.41
Cumulative underlift of (1,854) MBOE in Libya, (681) MBOE in UK, (217) MBOE in EG, and (9) MBOE in Kurdistan.
SalesAvailable for Sale Libya Available for Sale Libya Sales
1Q 2016 4Q 2016 1Q 2017
22

2017 1Q Production Mix
59%20%
21% 27%
29%
44%
82%
11%7%
57%20%
23%
Crude Oil/Condensate NGLs Natural Gas
Eagle Ford Oklahoma Resource Basins Bakken
Total U.S. Resource Plays
23

North America E&P Crude Oil DerivativesAs of March 31, 2017
Crude Oil (Benchmark to WTI)
2Q 2017 3Q 2017 4Q 2017
Three-Way Collars
Volume (Bbls/day) 53,000 50,000 50,000
Price per Bbl:
Ceiling $58.45 $60.37 $60.37
Floor $50.51 $54.80 $54.80
Sold put $43.70 $47.80 $47.80
Sold call options(a)
Volume (Bbls/day) 35,000 35,000 35,000
Price per Bbl $61.91 $61.91 $61.91
(a) Call Options settle monthly.24

North America E&P Natural Gas DerivativesAs of March 31, 2017
Natural Gas (Benchmark to HH)
2Q 2017 3Q 2017 4Q 2017 2018
Three-Way Collars(a)
Volume (MMBtu/day) 120,000 120,000 120,000 90,000
Price per MMBtu:
Ceiling $3.58 $3.58 $3.71 $3.61
Floor $3.09 $3.09 $3.14 $3.00
Sold put $2.55 $2.55 $2.60 $2.50
Swaps
Volume (MMBtu/day) 20,000 20,000 20,000 -
Price per MMBtu $2.93 $2.93 $2.93 -
(a) Subsequent to 3/31/2017, we entered into 70,000 MMBTU/day of three-way collars for January - December 2018 with a ceiling price of $3.62, a floor price of $3.00, and a sold put price of $2.50 and 40,000 MMBTU/day of three-way collars for January - March 2018 with a ceiling price of $4.47, a floor price of $3.40, and a sold put price of $2.75.25

Capital, Investment & Exploration2017 budget reconciliation $MM
2017 RevisedBudget*
2017 YTDActual
Capital expenditures 2,396 359
M&S Inventory 0 9
Investments in equity method investees & others 0 0
Exploration costs other than well costs 39 8
Capital, Investment & Exploration Budget** 2,435 376
YTD is through 3/31/17*Increased 2017 budget relative to recent Permian development costs**Does not include discontinued operations or Permian acquisition deposit26